Embed Size (px)
Citation preview

Tunnelling and Underground Space Technology 45 (2015) 227–248
Contents lists available at ScienceDirect
Tunnelling and Underground Space Technology
journal homepage: www.elsevier .com/ locate/ tust
The excavation of a circular tunnel in a bedded argillaceous rock(Opalinus Clay): Short-term rock mass response and FDEM numericalanalysis
http://dx.doi.org/10.1016/j.tust.2014.09.0140886-7798/� 2014 Elsevier Ltd. All rights reserved.
⇑ Corresponding author. Tel.: +1 416 978 0125.E-mail address: [email protected] (G. Grasselli).
A. Lisjak a,b, B. Garitte c, G. Grasselli a,⇑, H.R. Müller c, T. Vietor c
a Department of Civil Engineering, University of Toronto, 35 St. George Street, M5S 1A4 Toronto, ON, Canadab Geomechanica Inc., 90 Adelaide St. W., Suite 300, M5H 3V9 Toronto, ON, Canadac National Cooperative for the Disposal of Radioactive Waste (NAGRA), Hardstrasse 73, 5430 Wettingen, Switzerland
a r t i c l e i n f o
Article history:Received 16 January 2014Received in revised form 1 August 2014Accepted 20 September 2014
Keywords:Excavation damaged zoneNumerical modellingFDEMBrittle failureClay shalesMechanical anisotropyInstrumentation
a b s t r a c t
The Opalinus Clay formation is currently being investigated as a potential host rock for the deep geolog-ical disposal of radioactive waste in Switzerland. Recently, a test tunnel was excavated at the Mont Terriunderground rock laboratory (URL) as part of a long-term research project (‘‘Full-scale Emplacement (FE)experiment’’) aimed at studying the thermo-hydro-mechanical (THM) effects induced by the presence ofan underground repository. The objective of this paper is twofold. Firstly, the results of the rock massmonitoring programme carried out during the construction of the 3 m diameter, 50 m long FE tunnelare presented, with particular focus on the short-term deformation response. The deformation measure-ments, including geodetic monitoring of tunnel wall displacements, radial extensometers and longitudi-nal inclinometers, indicate a strong directionality in the excavation response. Secondly, the deformationalbehaviour observed in the field is analyzed using a hybrid finite-discrete element (FDEM) analysis toobtain further insights into the formation of the excavation damaged zone (EDZ). The FDEM simulationusing the Y-Geo code is calibrated based on the average short-term response observed in the field. Defor-mation and strength anisotropy are captured using a transversely isotropic, linear elastic constitutive lawand cohesive elements with orientation-dependent strength parameters. Overall, a good agreement isobtained between convergences measured in the field and numerical results. The simulated EDZ forma-tion process highlights the importance of bedding planes in controlling the failure mechanisms aroundthe underground opening. Specifically, failure initiates due to shearing of bedding planes critically ori-ented with respect to the compressive circumferential stress induced around the tunnel. Slippage-induced rock mass deconfinement then promotes extensional fracturing in the direction perpendicularto the bedding orientation. The simulated fracture pattern is consistent with previous experimental evi-dence from the Mont Terri URL.
� 2014 Elsevier Ltd. All rights reserved.
1. Introduction
The deep geological disposal of nuclear waste in an induratedclay formation, called the Opalinus Clay, is currently beingassessed in Switzerland. Owing to its very low hydraulic conduc-tivity, high radionuclide retention capacity, and self-sealing of frac-tures, the Opalinus Clay is considered a potential host rockformation for the long-term storage of radioactive waste(Blümling et al., 2007). However, the development of an excavationdamaged zone (EDZ) around the underground structures, includingemplacement tunnels and shafts, needs to be considered when
assessing both short- and long-term safety of the repository. Apartfrom directly affecting the stability of the excavation during con-struction, the EDZ is typically associated with a permeabilityincrease of several orders of magnitude due to the formation ofnewly connected porosity related to the fracturing of intact rockand shearing along structural features, such as tectonic faults andbedding planes. Therefore, the formation of the EDZ, and its evolu-tion with time, needs to be evaluated as part of the safety assess-ment for any potential disposal site.
Over the past 15 years, an extensive experimental research pro-gramme has been conducted at the Mont Terri underground rocklaboratory (URL) to characterize the EDZ in Opalinus Clay. A dis-tinctive feature of damage development in this type of argillaceousrock is the fundamental role played by the anisotropic material
228 A. Lisjak et al. / Tunnelling and Underground Space Technology 45 (2015) 227–248
behaviour. In particular, the shape and extent of the EDZ aroundtunnels and boreholes are strongly dependent upon the relativeorientation between excavation axis and bedding planes.
At the same time, field and laboratory investigations have beensupported by the development of several numerical models to helpinterpret the observed failure behaviour. However, modelling thecreation and evolution of the EDZ remains an open research topicsince no single set of consistent modelling approaches has yet beenable to reproduce, in detail, all the observations from the URL(Tsang et al., 2012). Due to the complexity of the observed phe-nomena, a complete description of the processes in the EDZ wouldrequire consideration of hydro-mechanical, thermal, as well aschemical effects.
For this study, the short-term rock mass response of a newly-excavated, Full-scale Emplacement (FE) test tunnel at the MontTerri URL was characterized based on monitoring data collectedduring tunnel construction. Despite several important differencesbetween the Mont Terri URL and the actual candidate repositorysites (e.g., depth, stress state and tectonic imprint), the FE experi-ment offered the opportunity to analyze, for the first time, thebehaviour of Opalinus Clay under geometric (i.e., same tunnelshape and dimensions) and structural-geological (i.e., tunnel ori-ented parallel to the bedding strike) conditions similar to thoseof the planned repository tunnels. Subsequently, a mechanicaltotal stress analysis of the tunnel response was carried out usinga hybrid finite-discrete element (FDEM) code (Munjiza, 2004;Mahabadi et al., 2012; Lisjak et al., 2014). Unlike traditional contin-uum-based models, the adopted Y-Geo FDEM code provided theability to explicitly simulate the spontaneous nucleation and prop-agation of cracks within the rock mass. Therefore, it could be usedto gain original insight into the brittle fracturing process aroundthe underground excavation.
The paper is organized as follows. In Section 2, a brief descrip-tion of the Mont Terri URL is provided, including geological setting,rock material and rock mass characterization, and in-situ stressfield. In Section 3, an overview of the published experimentalobservations regarding the EDZ in Opalinus Clay is given togetherwith a summary of related simulation studies. In Section 4, therecent excavation of the FE tunnel is described together with theresults of the monitoring campaign using geodetic measurementsof tunnel wall displacements, radial extensometers, and longitudi-nal inclinometers. In Section 5, an experimental model of the aver-age tunnel wall deformation is developed and a preliminary linearelastic, finite element analysis accounting for modulus anisotropyis carried out. Section 6 follows with the calibration of the afore-mentioned FDEM model. The calibrated FDEM model is then usedas a tool to provide a mechanical interpretation of the anisotropicrock mass deformation and fracture evolution observed around the
400
600
800
1000
210000
Mont Terri
NWCourgenay
Limestones Sandstones Limestones /Dolomites
Marls /Dolomites
Marls /Limestones
LATE JUR. TERTIARY TRIASSIC EARLY JUR.
Tabular Jura
m a.s.l.
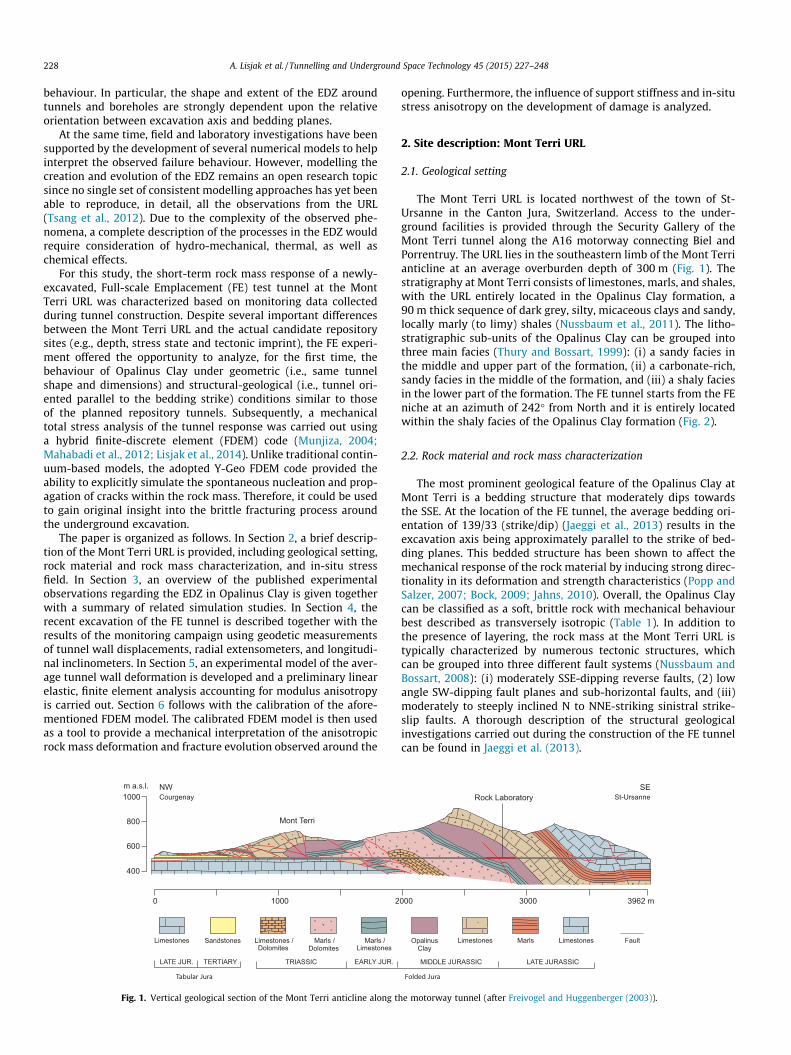
Fig. 1. Vertical geological section of the Mont Terri anticline along t
opening. Furthermore, the influence of support stiffness and in-situstress anisotropy on the development of damage is analyzed.
2. Site description: Mont Terri URL
2.1. Geological setting
The Mont Terri URL is located northwest of the town of St-Ursanne in the Canton Jura, Switzerland. Access to the under-ground facilities is provided through the Security Gallery of theMont Terri tunnel along the A16 motorway connecting Biel andPorrentruy. The URL lies in the southeastern limb of the Mont Terrianticline at an average overburden depth of 300 m (Fig. 1). Thestratigraphy at Mont Terri consists of limestones, marls, and shales,with the URL entirely located in the Opalinus Clay formation, a90 m thick sequence of dark grey, silty, micaceous clays and sandy,locally marly (to limy) shales (Nussbaum et al., 2011). The litho-stratigraphic sub-units of the Opalinus Clay can be grouped intothree main facies (Thury and Bossart, 1999): (i) a sandy facies inthe middle and upper part of the formation, (ii) a carbonate-rich,sandy facies in the middle of the formation, and (iii) a shaly faciesin the lower part of the formation. The FE tunnel starts from the FEniche at an azimuth of 242� from North and it is entirely locatedwithin the shaly facies of the Opalinus Clay formation (Fig. 2).
2.2. Rock material and rock mass characterization
The most prominent geological feature of the Opalinus Clay atMont Terri is a bedding structure that moderately dips towardsthe SSE. At the location of the FE tunnel, the average bedding ori-entation of 139/33 (strike/dip) (Jaeggi et al., 2013) results in theexcavation axis being approximately parallel to the strike of bed-ding planes. This bedded structure has been shown to affect themechanical response of the rock material by inducing strong direc-tionality in its deformation and strength characteristics (Popp andSalzer, 2007; Bock, 2009; Jahns, 2010). Overall, the Opalinus Claycan be classified as a soft, brittle rock with mechanical behaviourbest described as transversely isotropic (Table 1). In addition tothe presence of layering, the rock mass at the Mont Terri URL istypically characterized by numerous tectonic structures, whichcan be grouped into three different fault systems (Nussbaum andBossart, 2008): (i) moderately SSE-dipping reverse faults, (2) lowangle SW-dipping fault planes and sub-horizontal faults, and (iii)moderately to steeply inclined N to NNE-striking sinistral strike-slip faults. A thorough description of the structural geologicalinvestigations carried out during the construction of the FE tunnelcan be found in Jaeggi et al. (2013).
3962 m3000000
Rock LaboratorySE
St-Ursanne
OpalinusClay
Limestones Marls Limestones Fault
MIDDLE JURASSIC LATE JURASSIC
Folded Jura
he motorway tunnel (after Freivogel and Huggenberger (2003)).
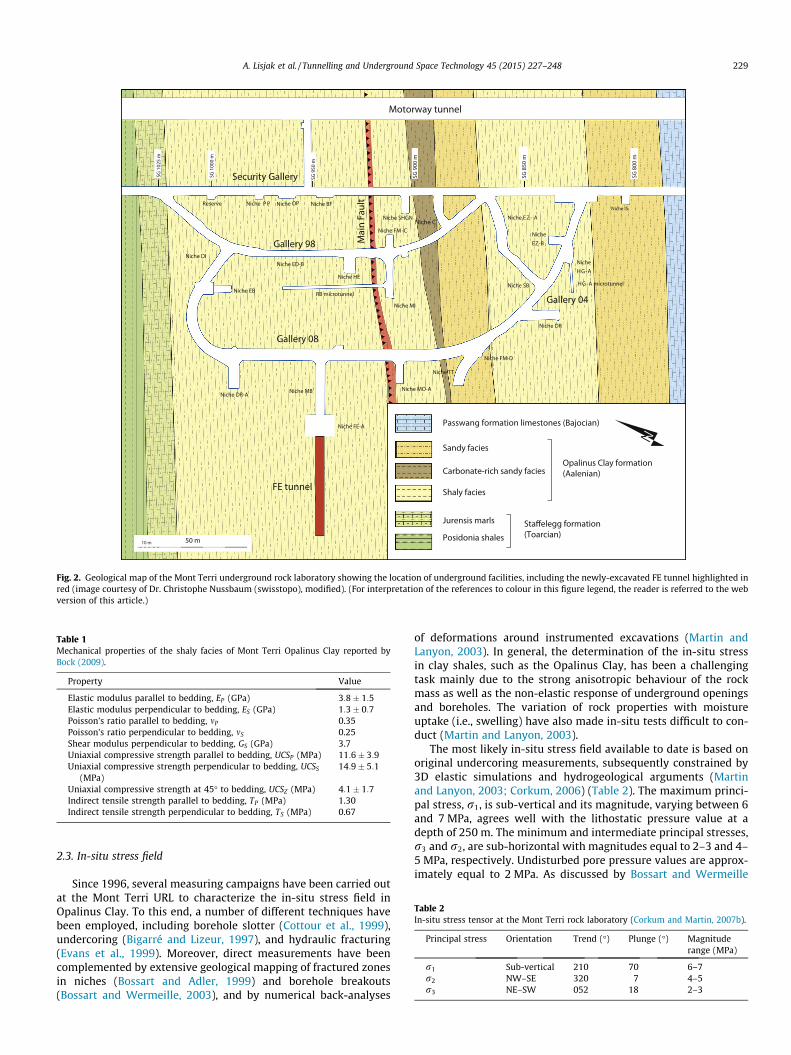
Fig. 2. Geological map of the Mont Terri underground rock laboratory showing the location of underground facilities, including the newly-excavated FE tunnel highlighted inred (image courtesy of Dr. Christophe Nussbaum (swisstopo), modified). (For interpretation of the references to colour in this figure legend, the reader is referred to the webversion of this article.)
Table 1Mechanical properties of the shaly facies of Mont Terri Opalinus Clay reported byBock (2009).
Property Value
Elastic modulus parallel to bedding, EP (GPa) 3:8� 1:5Elastic modulus perpendicular to bedding, ES (GPa) 1:3� 0:7Poisson’s ratio parallel to bedding, mP 0.35Poisson’s ratio perpendicular to bedding, mS 0.25Shear modulus perpendicular to bedding, GS (GPa) 3.7Uniaxial compressive strength parallel to bedding, UCSP (MPa) 11:6� 3:9Uniaxial compressive strength perpendicular to bedding, UCSS
(MPa)14:9� 5:1
Uniaxial compressive strength at 45� to bedding, UCSZ (MPa) 4:1� 1:7Indirect tensile strength parallel to bedding, TP (MPa) 1.30Indirect tensile strength perpendicular to bedding, TS (MPa) 0.67
Table 2In-situ stress tensor at the Mont Terri rock laboratory (Corkum and Martin, 2007b).
Principal stress Orientation Trend (�) Plunge (�) Magnituderange (MPa)
r1 Sub-vertical 210 70 6–7r2 NW–SE 320 7 4–5r3 NE–SW 052 18 2–3
A. Lisjak et al. / Tunnelling and Underground Space Technology 45 (2015) 227–248 229
2.3. In-situ stress field
Since 1996, several measuring campaigns have been carried outat the Mont Terri URL to characterize the in-situ stress field inOpalinus Clay. To this end, a number of different techniques havebeen employed, including borehole slotter (Cottour et al., 1999),undercoring (Bigarré and Lizeur, 1997), and hydraulic fracturing(Evans et al., 1999). Moreover, direct measurements have beencomplemented by extensive geological mapping of fractured zonesin niches (Bossart and Adler, 1999) and borehole breakouts(Bossart and Wermeille, 2003), and by numerical back-analyses
of deformations around instrumented excavations (Martin andLanyon, 2003). In general, the determination of the in-situ stressin clay shales, such as the Opalinus Clay, has been a challengingtask mainly due to the strong anisotropic behaviour of the rockmass as well as the non-elastic response of underground openingsand boreholes. The variation of rock properties with moistureuptake (i.e., swelling) have also made in-situ tests difficult to con-duct (Martin and Lanyon, 2003).
The most likely in-situ stress field available to date is based onoriginal undercoring measurements, subsequently constrained by3D elastic simulations and hydrogeological arguments (Martinand Lanyon, 2003; Corkum, 2006) (Table 2). The maximum princi-pal stress, r1, is sub-vertical and its magnitude, varying between 6and 7 MPa, agrees well with the lithostatic pressure value at adepth of 250 m. The minimum and intermediate principal stresses,r3 and r2, are sub-horizontal with magnitudes equal to 2–3 and 4–5 MPa, respectively. Undisturbed pore pressure values are approx-imately equal to 2 MPa. As discussed by Bossart and Wermeille
230 A. Lisjak et al. / Tunnelling and Underground Space Technology 45 (2015) 227–248
(2003), the magnitude of principal stresses are better constrainedthan the respective directions. The minor and intermediate princi-pal stress directions are those with the highest degree ofuncertainty.
3. The EDZ in the Mont Terri Opalinus Clay
3.1. Experimental evidence of fracture patterns around openings inOpalinus Clay
The experimental characterization of the EDZ in Opalinus Clayhas been the objective of several research projects at the MontTerri URL. The main field observations relative to the short-termresponse of excavations in Opalinus Clay are reviewed in the fol-lowing subsections. Although time-dependent phenomena, includ-ing hydro-mechanical processes (e.g., de-saturation, swelling,consolidation) and visco-plastic effects (e.g., sub-critical crackgrowth, creep), have been shown to play an important role in thelong-term evolution of the EDZ in argillaceous rocks (Bernieret al., 2007; Blümling et al., 2007), the review of these processeswas beyond the scope of this work, as the numerical modellingfocused only on purely mechanical simulations without anytime-dependency.
Similarly to other anisotropic rocks, a distinct variation of rockmass response has been typically observed in Opalinus Clay as afunction of the relative orientation between the excavation axisand the bedding plane direction. Based on the geometrical layoutof the Mont Terri URL (Fig. 2), the cases of excavations paralleland perpendicular to the bedding strike were therefore distin-guished and the fracture patterns classified accordingly. Excava-tions perpendicular to the bedding strike (e.g., Security Gallery,Gallery 98, Gallery 04, and Gallery 08) generally exhibited rela-tively stable conditions. Conversely, excavations driven parallelto the bedding strike (e.g., HG-A microtunnel, MB niche, FE tunnel)were characterized by deformational response strongly affected bythe reduced strength properties of the bedding planes, which oftenresulted in construction and ground control difficulties.
3.1.1. Openings perpendicular to the strike of bedding planesThe first conceptual model of the EDZ in Opalinus Clay was pro-
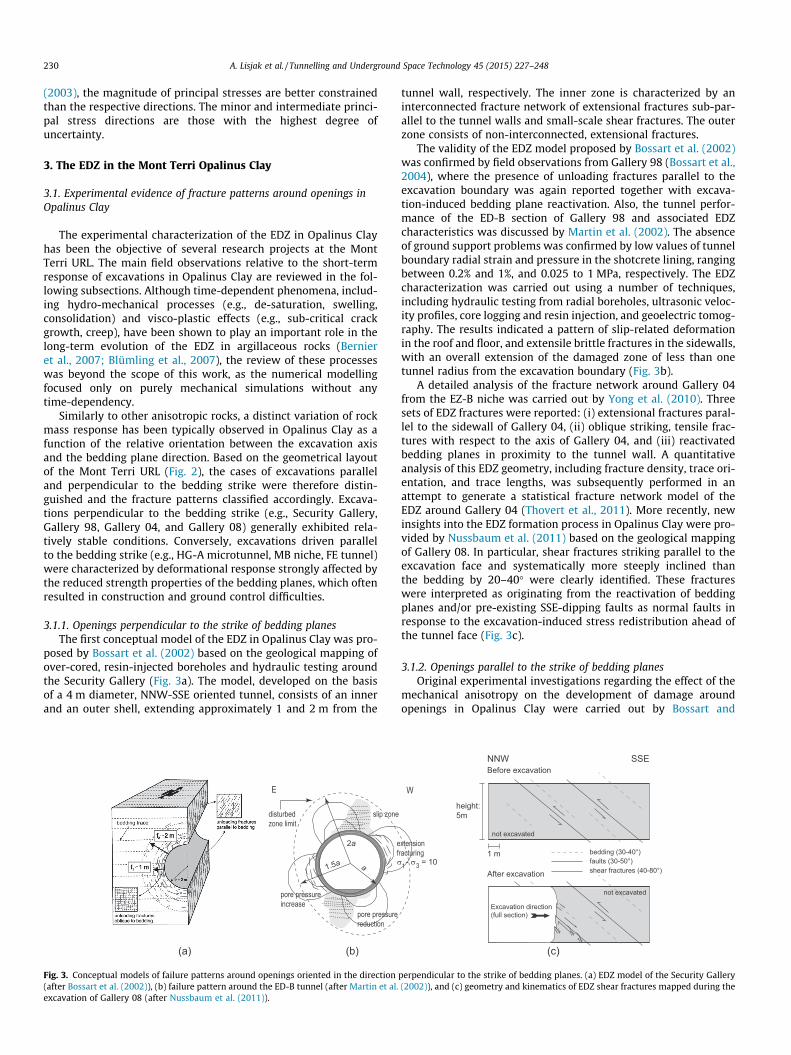
posed by Bossart et al. (2002) based on the geological mapping ofover-cored, resin-injected boreholes and hydraulic testing aroundthe Security Gallery (Fig. 3a). The model, developed on the basisof a 4 m diameter, NNW-SSE oriented tunnel, consists of an innerand an outer shell, extending approximately 1 and 2 m from the
(a) (b)
pore pressurereduction
pore pressureincrease
2a
1.5a a
efσ
slip zonedisturbed zone limit
E
Fig. 3. Conceptual models of failure patterns around openings oriented in the direction(after Bossart et al. (2002)), (b) failure pattern around the ED-B tunnel (after Martin et al.excavation of Gallery 08 (after Nussbaum et al. (2011)).
tunnel wall, respectively. The inner zone is characterized by aninterconnected fracture network of extensional fractures sub-par-allel to the tunnel walls and small-scale shear fractures. The outerzone consists of non-interconnected, extensional fractures.
The validity of the EDZ model proposed by Bossart et al. (2002)was confirmed by field observations from Gallery 98 (Bossart et al.,2004), where the presence of unloading fractures parallel to theexcavation boundary was again reported together with excava-tion-induced bedding plane reactivation. Also, the tunnel perfor-mance of the ED-B section of Gallery 98 and associated EDZcharacteristics was discussed by Martin et al. (2002). The absenceof ground support problems was confirmed by low values of tunnelboundary radial strain and pressure in the shotcrete lining, rangingbetween 0.2% and 1%, and 0.025 to 1 MPa, respectively. The EDZcharacterization was carried out using a number of techniques,including hydraulic testing from radial boreholes, ultrasonic veloc-ity profiles, core logging and resin injection, and geoelectric tomog-raphy. The results indicated a pattern of slip-related deformationin the roof and floor, and extensile brittle fractures in the sidewalls,with an overall extension of the damaged zone of less than onetunnel radius from the excavation boundary (Fig. 3b).
A detailed analysis of the fracture network around Gallery 04from the EZ-B niche was carried out by Yong et al. (2010). Threesets of EDZ fractures were reported: (i) extensional fractures paral-lel to the sidewall of Gallery 04, (ii) oblique striking, tensile frac-tures with respect to the axis of Gallery 04, and (iii) reactivatedbedding planes in proximity to the tunnel wall. A quantitativeanalysis of this EDZ geometry, including fracture density, trace ori-entation, and trace lengths, was subsequently performed in anattempt to generate a statistical fracture network model of theEDZ around Gallery 04 (Thovert et al., 2011). More recently, newinsights into the EDZ formation process in Opalinus Clay were pro-vided by Nussbaum et al. (2011) based on the geological mappingof Gallery 08. In particular, shear fractures striking parallel to theexcavation face and systematically more steeply inclined thanthe bedding by 20–40� were clearly identified. These fractureswere interpreted as originating from the reactivation of beddingplanes and/or pre-existing SSE-dipping faults as normal faults inresponse to the excavation-induced stress redistribution ahead ofthe tunnel face (Fig. 3c).
3.1.2. Openings parallel to the strike of bedding planesOriginal experimental investigations regarding the effect of the
mechanical anisotropy on the development of damage aroundopenings in Opalinus Clay were carried out by Bossart and
(a)
(b)
(c)
xtensionracturing - σ = 101 3
Wheight:5m
1 m
Before excavation
After excavation
NNW SSE
bedding (30-40°)faults (30-50°)shear fractures (40-80°)
Excavation direction(full section)
not excavated
not excavated
perpendicular to the strike of bedding planes. (a) EDZ model of the Security Gallery(2002)), and (c) geometry and kinematics of EDZ shear fractures mapped during the
A. Lisjak et al. / Tunnelling and Underground Space Technology 45 (2015) 227–248 231
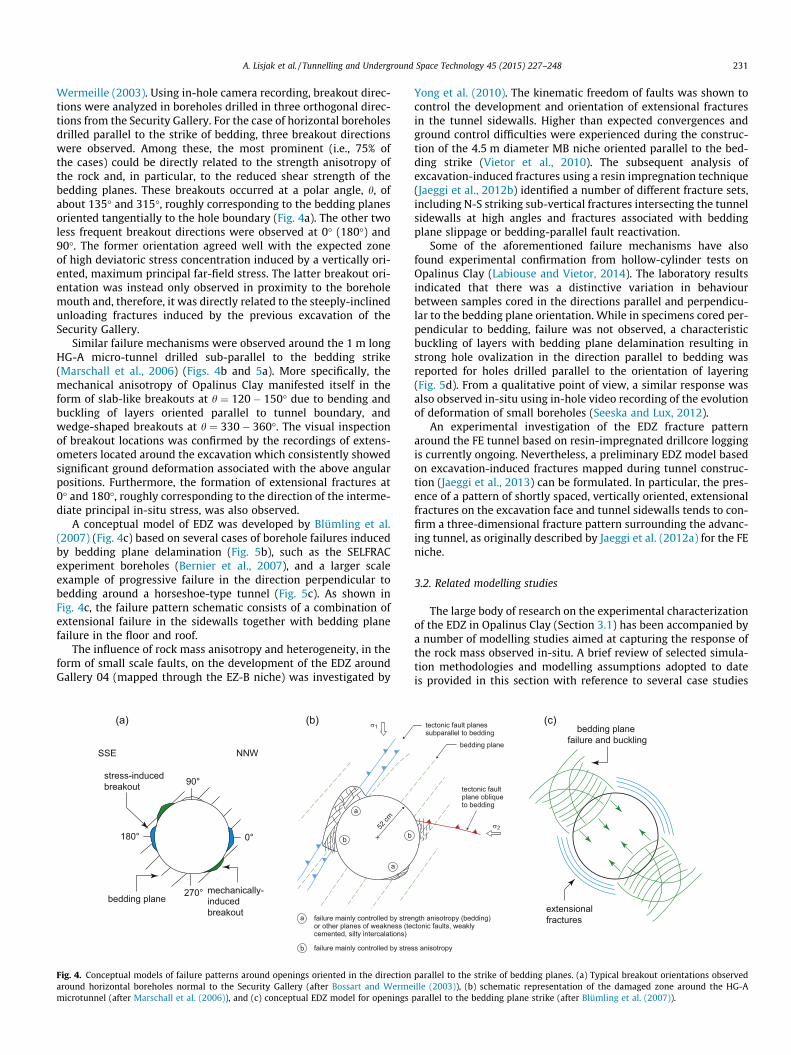
Wermeille (2003). Using in-hole camera recording, breakout direc-tions were analyzed in boreholes drilled in three orthogonal direc-tions from the Security Gallery. For the case of horizontal boreholesdrilled parallel to the strike of bedding, three breakout directionswere observed. Among these, the most prominent (i.e., 75% ofthe cases) could be directly related to the strength anisotropy ofthe rock and, in particular, to the reduced shear strength of thebedding planes. These breakouts occurred at a polar angle, h, ofabout 135� and 315�, roughly corresponding to the bedding planesoriented tangentially to the hole boundary (Fig. 4a). The other twoless frequent breakout directions were observed at 0� (180�) and90�. The former orientation agreed well with the expected zoneof high deviatoric stress concentration induced by a vertically ori-ented, maximum principal far-field stress. The latter breakout ori-entation was instead only observed in proximity to the boreholemouth and, therefore, it was directly related to the steeply-inclinedunloading fractures induced by the previous excavation of theSecurity Gallery.
Similar failure mechanisms were observed around the 1 m longHG-A micro-tunnel drilled sub-parallel to the bedding strike(Marschall et al., 2006) (Figs. 4b and 5a). More specifically, themechanical anisotropy of Opalinus Clay manifested itself in theform of slab-like breakouts at h ¼ 120� 150� due to bending andbuckling of layers oriented parallel to tunnel boundary, andwedge-shaped breakouts at h ¼ 330� 360�. The visual inspectionof breakout locations was confirmed by the recordings of extens-ometers located around the excavation which consistently showedsignificant ground deformation associated with the above angularpositions. Furthermore, the formation of extensional fractures at0� and 180�, roughly corresponding to the direction of the interme-diate principal in-situ stress, was also observed.
A conceptual model of EDZ was developed by Blümling et al.(2007) (Fig. 4c) based on several cases of borehole failures inducedby bedding plane delamination (Fig. 5b), such as the SELFRACexperiment boreholes (Bernier et al., 2007), and a larger scaleexample of progressive failure in the direction perpendicular tobedding around a horseshoe-type tunnel (Fig. 5c). As shown inFig. 4c, the failure pattern schematic consists of a combination ofextensional failure in the sidewalls together with bedding planefailure in the floor and roof.
The influence of rock mass anisotropy and heterogeneity, in theform of small scale faults, on the development of the EDZ aroundGallery 04 (mapped through the EZ-B niche) was investigated by
(a) (b)
failure mainly controlled by strenor other planes of weakness (tecemented, silty intercalations)
failure mainly controlled by stres
52cm
a
b
bb
a
a
1
NNWSSE
bedding planemechanically-inducedbreakout
stress-inducedbreakout
0°
90°
270°
180°
Fig. 4. Conceptual models of failure patterns around openings oriented in the directionaround horizontal boreholes normal to the Security Gallery (after Bossart and Wermemicrotunnel (after Marschall et al. (2006)), and (c) conceptual EDZ model for openings
Yong et al. (2010). The kinematic freedom of faults was shown tocontrol the development and orientation of extensional fracturesin the tunnel sidewalls. Higher than expected convergences andground control difficulties were experienced during the construc-tion of the 4.5 m diameter MB niche oriented parallel to the bed-ding strike (Vietor et al., 2010). The subsequent analysis ofexcavation-induced fractures using a resin impregnation technique(Jaeggi et al., 2012b) identified a number of different fracture sets,including N-S striking sub-vertical fractures intersecting the tunnelsidewalls at high angles and fractures associated with beddingplane slippage or bedding-parallel fault reactivation.
Some of the aforementioned failure mechanisms have alsofound experimental confirmation from hollow-cylinder tests onOpalinus Clay (Labiouse and Vietor, 2014). The laboratory resultsindicated that there was a distinctive variation in behaviourbetween samples cored in the directions parallel and perpendicu-lar to the bedding plane orientation. While in specimens cored per-pendicular to bedding, failure was not observed, a characteristicbuckling of layers with bedding plane delamination resulting instrong hole ovalization in the direction parallel to bedding wasreported for holes drilled parallel to the orientation of layering(Fig. 5d). From a qualitative point of view, a similar response wasalso observed in-situ using in-hole video recording of the evolutionof deformation of small boreholes (Seeska and Lux, 2012).
An experimental investigation of the EDZ fracture patternaround the FE tunnel based on resin-impregnated drillcore loggingis currently ongoing. Nevertheless, a preliminary EDZ model basedon excavation-induced fractures mapped during tunnel construc-tion (Jaeggi et al., 2013) can be formulated. In particular, the pres-ence of a pattern of shortly spaced, vertically oriented, extensionalfractures on the excavation face and tunnel sidewalls tends to con-firm a three-dimensional fracture pattern surrounding the advanc-ing tunnel, as originally described by Jaeggi et al. (2012a) for the FEniche.
3.2. Related modelling studies
The large body of research on the experimental characterizationof the EDZ in Opalinus Clay (Section 3.1) has been accompanied bya number of modelling studies aimed at capturing the response ofthe rock mass observed in-situ. A brief review of selected simula-tion methodologies and modelling assumptions adopted to dateis provided in this section with reference to several case studies
(c)tectonic fault planessubparallel to bedding
bedding plane
tectonic faultplane obliqueto bedding
gth anisotropy (bedding)ctonic faults, weakly
s anisotropy
2
bedding plane failure and buckling
extensional fractures
parallel to the strike of bedding planes. (a) Typical breakout orientations observedille (2003)), (b) schematic representation of the damaged zone around the HG-Aparallel to the bedding plane strike (after Blümling et al. (2007)).
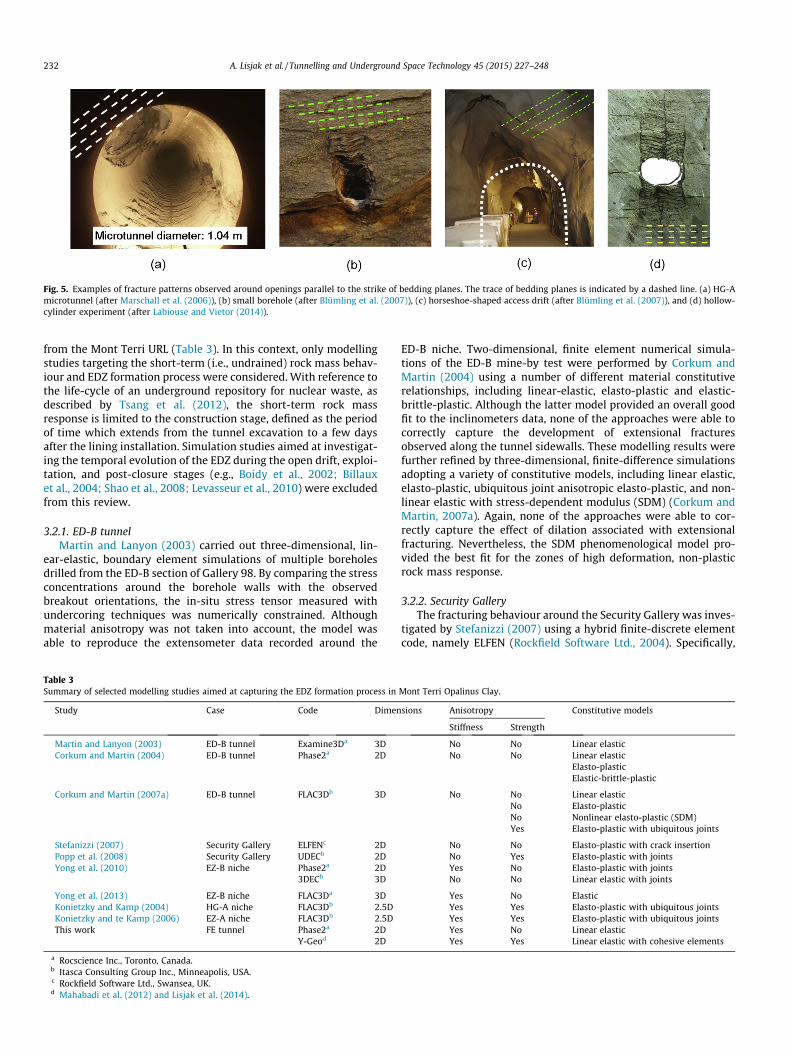
Fig. 5. Examples of fracture patterns observed around openings parallel to the strike of bedding planes. The trace of bedding planes is indicated by a dashed line. (a) HG-Amicrotunnel (after Marschall et al. (2006)), (b) small borehole (after Blümling et al. (2007)), (c) horseshoe-shaped access drift (after Blümling et al. (2007)), and (d) hollow-cylinder experiment (after Labiouse and Vietor (2014)).
232 A. Lisjak et al. / Tunnelling and Underground Space Technology 45 (2015) 227–248
from the Mont Terri URL (Table 3). In this context, only modellingstudies targeting the short-term (i.e., undrained) rock mass behav-iour and EDZ formation process were considered. With reference tothe life-cycle of an underground repository for nuclear waste, asdescribed by Tsang et al. (2012), the short-term rock massresponse is limited to the construction stage, defined as the periodof time which extends from the tunnel excavation to a few daysafter the lining installation. Simulation studies aimed at investigat-ing the temporal evolution of the EDZ during the open drift, exploi-tation, and post-closure stages (e.g., Boidy et al., 2002; Billauxet al., 2004; Shao et al., 2008; Levasseur et al., 2010) were excludedfrom this review.
3.2.1. ED-B tunnelMartin and Lanyon (2003) carried out three-dimensional, lin-
ear-elastic, boundary element simulations of multiple boreholesdrilled from the ED-B section of Gallery 98. By comparing the stressconcentrations around the borehole walls with the observedbreakout orientations, the in-situ stress tensor measured withundercoring techniques was numerically constrained. Althoughmaterial anisotropy was not taken into account, the model wasable to reproduce the extensometer data recorded around the
Table 3Summary of selected modelling studies aimed at capturing the EDZ formation process in
Study Case Code Dimen
Martin and Lanyon (2003) ED-B tunnel Examine3Da 3DCorkum and Martin (2004) ED-B tunnel Phase2a 2D
Corkum and Martin (2007a) ED-B tunnel FLAC3Db 3D
Stefanizzi (2007) Security Gallery ELFENc 2DPopp et al. (2008) Security Gallery UDECb 2DYong et al. (2010) EZ-B niche Phase2a 2D
3DECb 3D
Yong et al. (2013) EZ-B niche FLAC3Da 3DKonietzky and Kamp (2004) HG-A niche FLAC3Db 2.5DKonietzky and te Kamp (2006) EZ-A niche FLAC3Db 2.5DThis work FE tunnel Phase2a 2D
Y-Geod 2D
a Rocscience Inc., Toronto, Canada.b Itasca Consulting Group Inc., Minneapolis, USA.c Rockfield Software Ltd., Swansea, UK.d Mahabadi et al. (2012) and Lisjak et al. (2014).
ED-B niche. Two-dimensional, finite element numerical simula-tions of the ED-B mine-by test were performed by Corkum andMartin (2004) using a number of different material constitutiverelationships, including linear-elastic, elasto-plastic and elastic-brittle-plastic. Although the latter model provided an overall goodfit to the inclinometers data, none of the approaches were able tocorrectly capture the development of extensional fracturesobserved along the tunnel sidewalls. These modelling results werefurther refined by three-dimensional, finite-difference simulationsadopting a variety of constitutive models, including linear elastic,elasto-plastic, ubiquitous joint anisotropic elasto-plastic, and non-linear elastic with stress-dependent modulus (SDM) (Corkum andMartin, 2007a). Again, none of the approaches were able to cor-rectly capture the effect of dilation associated with extensionalfracturing. Nevertheless, the SDM phenomenological model pro-vided the best fit for the zones of high deformation, non-plasticrock mass response.
3.2.2. Security GalleryThe fracturing behaviour around the Security Gallery was inves-
tigated by Stefanizzi (2007) using a hybrid finite-discrete elementcode, namely ELFEN (Rockfield Software Ltd., 2004). Specifically,
Mont Terri Opalinus Clay.
sions Anisotropy Constitutive models
Stiffness Strength
No No Linear elasticNo No Linear elastic
Elasto-plasticElastic-brittle-plastic
No No Linear elasticNo Elasto-plasticNo Nonlinear elasto-plastic (SDM)Yes Elasto-plastic with ubiquitous joints
No No Elasto-plastic with crack insertionNo Yes Elasto-plastic with jointsYes No Elasto-plastic with jointsNo No Linear elastic with joints
Yes No ElasticYes Yes Elasto-plastic with ubiquitous jointsYes Yes Elasto-plastic with ubiquitous jointsYes No Linear elasticYes Yes Linear elastic with cohesive elements
A. Lisjak et al. / Tunnelling and Underground Space Technology 45 (2015) 227–248 233
the study focused on the conceptual modelling of the transitionfrom stress-driven to strain-driven fracturing behaviour around atunnel containing either two parallel discontinuities or layers withelastic mismatch to mimick the effect of bedding planes. Discreteelement simulations using UDEC (Itasca Consulting Group Inc.,2004) were carried out by Popp et al. (2008) in an attempt to repro-duce the failure mechanisms observed around the Security Gallery,such as extensional fracturing in the sidewalls and shear failure inthe roof and floor (Fig. 3b). Yielding of sidewalls was capturedusing an elasto-plastic model, while pre-existing horizontal jointsreproduced the slippage of bedding planes in the roof and floorof the tunnel.
3.2.3. EZ-B nicheThe influence of small-scale faults on the development of the
EDZ in the entrance walls of the EZ-B niche was investigated byYong et al. (2010) by 2D, finite element analysis. The rock matrixwas assumed to behave as a Mohr–Coulomb, elasto-plastic med-ium with elastic deformability governed by a transversely isotropiclaw, while the tectonic faults were captured by continuous jointelements. A three-dimensional, discrete element simulation using3DEC (Itasca Consulting Group Inc., 2003) under isotropic, elasticconditions was then carried out to account for the complex geom-etry of the problem due to the proximity of the HG-A niche, thenon-orthogonal intersection of the EZ-B niche with Gallery 04,and the skewed alignment of the niche axis with respect to theprincipal stress axes. More recently, Yong et al. (2013) integrated3D continuum simulations with geophysical measurements tocharacterize the rock mass response ahead of the EZ-B niche.
3.2.4. Locations where the excavation parallels the bedding strikeTo the authors’ knowledge, the only two modelling studies of
excavations in the direction parallel to the bedding strike are thoseof Konietzky and Kamp (2004) and Konietzky and te Kamp (2006)which simulate the HG-A niche and EZ-A niche, respectively. Inthese models, the effect of material layering was captured by abi-linear, strain-softening ubiquitous joint model implemented ina 2.5D, FLAC3D model (Itasca Consulting Group Inc., 2000).
In this study, a preliminary analysis of the FE tunnel excavationresponse was carried out using a linear elastic, finite elementmodel (Section 6). The anisotropic deformation response of thetunnel was qualitatively reproduced by a transversely isotropicelastic constitutive model. However, the lack of plasticity resultedin the inability to capture the large deformations measured in thefield (Section 4.2). For this reason, a numerical approach thatexplicitly simulates fracture propagation, namely the hybridfinite-discrete element method (FDEM) (Munjiza, 2004), wasadopted. As further described in Section 6, the FDEM simulationof the anisotropic behaviour of Opalinus Clay followed theapproach developed by Lisjak et al. (2014) for the Y-Geo FDEMcode (Mahabadi et al., 2012).
4. Rock mass response during the FE tunnel excavation
4.1. Tunnel construction and monitoring programme
The 50 m long FE tunnel was excavated full-face between April25 and July 10 (2012) from the northeast to southwest directionstarting from the FE niche (Fig. 2). The excavated and final tunneldiameter (including lining) were approximately equal to 3.0 and2.7 m, respectively. The excavation method consisted of a combi-nation of pneumatic hammer and roadheader, with a typicaladvance rate varying between 1.0 and 1.5 m/day, depending onthe adopted support measures (Fig. 6). From tunnel metre (TM) 0to 38 (i.e., access, plug and test sections), the support in the tunnel
consisted of mesh reinforced, low pH shotcrete with a nominalthickness ranging between 160 and 240 mm and applied immedi-ately behind the excavation face. Steel sets with a spacing of 0.5–1.0 m were installed between TM 0 and 9 and TM 38 and 50 (i.e.,access and interjacent sealing sections). Between TM 9 and 38, acombination of 22 mm diameter, 2.5 m long fibreglass solid boltsand 32 mm diameter, 7.5 m long hollow steel anchors wereinstalled in areas experiencing high convergence values, typicallyin the lower part of the right and left sidewalls (see Section 4.2).
To quantitatively characterize the rock mass response, anextensive monitoring programme was carried out before, during,and after the construction of the FE tunnel. The monitoring cam-paign included:
� geodetic monitoring of tunnel wall displacements duringthe tunnel excavation (sections C0 to C9 in Fig. 6);
� five radial extensometers installed from the tunnel wallsduring the tunnel excavation (sections E1 and E2 in Fig. 6);
� inclinometer chains installed two months before the exca-vation phase in two 45 m long boreholes drilled sub-paral-lel to tunnel axis from the FE niche (Borehole BFEA-10 andBFEA-11 in Fig. 7);
� pore water pressure monitoring from six boreholes drilledfrom the FE niche two months before the excavation phaseand forming an umbrella around the roof of FE tunnel(Boreholes BFEA-02 to BFEA-07 in Fig. 7).
Furthermore, detailed geological and structural mapping of thetunnel face was carried out daily immediately after each excava-tion round (Jaeggi et al., 2013). The manual mapping was comple-mented by a digital photogrammetric survey of the excavationsurfaces using ShapeMetriX3D (3G Software and MeasurementsGmbH, 2010).
4.2. Tunnel wall deformation
The displacements of the tunnel walls were measured in threedimensions by geodetic surveying using two total stations withintegrated distance measurements (type Leica TCRA 1102 andLeica 5005). The system utilized a network of known targetsinstalled at the intersection of the MB niche with the Gallery 08(Fig. 2) (Eiholzer, 2012). A total of ten convergence sections wereinstalled during the excavation of the FE tunnel at an average spac-ing of 6 m (Fig. 6). Displacements were continuously monitoredbetween 10 p.m. and 5 a.m. and for approximately 30 min ataround 12 p.m. each day. While the typical radial measuring con-figuration consisted of five observation targets (P1-P5), two addi-tional targets (P6 and P7) were installed in the right sidewallfrom section C5 to C9. In this study, we focused only on sectionsC1 to C5 which correspond to the tunnel sections where shotcreteand anchors were used as support. Furthermore, those sectionswere far enough from the entrance and end of the tunnel (i.e., morethan 3 diameters) to neglect three-dimensional effects due to thepresence of the niche.
As described by Lunardi (2008), the deformation behaviour ofan advancing tunnel is characterized by three main deformationtypologies: (i) pre-convergence of the advance core, (ii) extrusionof the face, and (iii) convergence of the cavity. In general, the inten-sity of each deformation behaviour depends on the relationshipbetween the strength and deformation properties of the rock massand the stress field to which it is subjected. In the case of the FEtunnel, the optical reflectors were put in place at a certain distance,typically 1.0–1.5 m (i.e., 0.3–0.5 D), behind the excavation face.Therefore, neither the convergence occurring between the measur-ing section and excavation face, nor the rock mass pre-convergencewere picked-up during monitoring with the optical reflectors.

Fig. 6. Simplified longitudinal cross section of the FE tunnel showing the installed support measures, the convergence measuring sections (C0–C9), and the location of radialextensometers (E1 and E2). The tunnel nominal diameter, D, is equal to 3.0 m.
-15 -10 -5 0 5 10 15-5
0
5
10
15
20Inclinometers:
BFEA-10BFEA-11
Piezometers:BFEA-02BFEA-03BFEA-04BFEA-05BFEA-06BFEA-07
y(m
)
x (m)0 10 20 30 40 50
15
10
5
0
-5
-10
-15Piezometers:
BFEA-02BFEA-03BFEA-04BFEA-05BFEA-06BFEA-07
Inclinometers:BFEA-10BFEA-11
12345
x(m
)
z (m)
6
Piezometers:BFEA-02BFEA-03BFEA-04BFEA-05BFEA-06BFEA-07
Inclinometers:BFEA-10 and BFEA-11
0 10 20 30 40 50-5
0
5
10
15
20
y(m
)
z (m)(a) (c)(b)
Fig. 7. Inclinometers and piezometers installed around the FE tunnel. Sensor locations in (a) cross-sectional, (b) plan, and (c) vertical view.
Gallery 08
BFEA-10
BFEA-11
FE niche
BFEA-05
BFEA-06
BFEA-07
BFEA-02
BFEA-03
BFEA-04
MB niche
Fig. 8. Three-dimensional view of the instrumented boreholes drilled from the FEniche containing the sensors reported in Fig. 7 (image courtesy of NAGRA).
234 A. Lisjak et al. / Tunnelling and Underground Space Technology 45 (2015) 227–248
Since a great portion of the total tunnel deformation typically takesplace in close proximity to the excavation face (Kavvadas, 2005),the magnitude of the two unmeasured deformation components
had to be estimated to allow a direct comparison between fieldmeasurements and numerical results, as further discussed in Sec-tion 6.
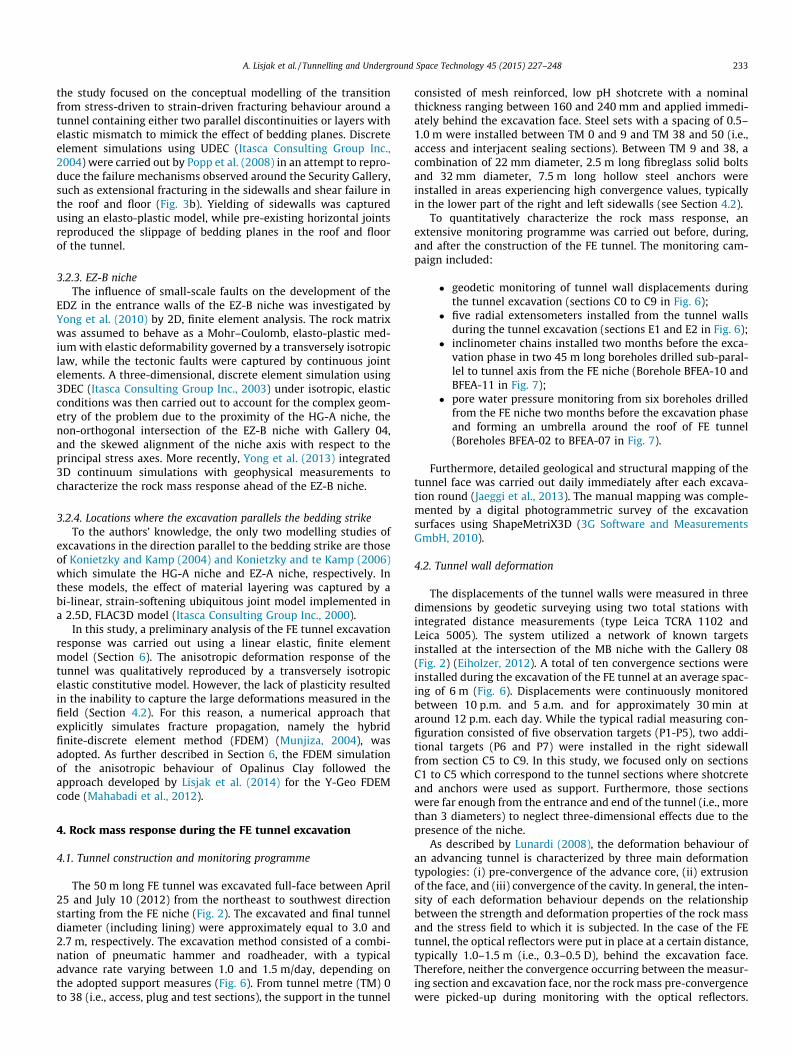
As depicted in Fig. 9, the observed displacement response istypical of a full-face excavated, advancing tunnel: a progressiveclosure of the tunnel walls is measured as a result of the excava-tion-induced, rock mass deconfinement. In proximity to the exca-vation face, the response is characterized by progressivelydecreasing displacement rates in the form of elasto-plastic defor-mations directly induced by the excavation of the tunnel. Short-term deformations tend to stabilize at approximately 9 m (i.e.,3D) behind the excavation face, corresponding to roughly 11 daysfor the given advance rate of 1.0 m/day. This observed behaviouris in good agreement with previous measurements at the MontTerri URL in the ED-B tunnel (Martin et al., 2002; Martin andLanyon, 2003; Corkum and Martin, 2007b). Distant from the exca-vation face, the rock mass undergoes deformation at a muchslower rate due to visco-plastic effects and hydro-mechanical con-solidation of the Opalinus Clay. Such time-dependent deforma-tions, typically observed in argillaceous rocks, have been shownto follow a linear trend on a logarithmic time scale (Egger, 2000).
A. Lisjak et al. / Tunnelling and Underground Space Technology 45 (2015) 227–248 235
4.3. Radial extensometers
Radial measurements of ground movements around the FE tun-nel were obtained by mechanical four-point extensometersinstalled from within the tunnel at TM 14.6 and 43.1 (i.e., sectionsE1 and E2 in Fig. 6, respectively). Specifically, the modular extens-ometers by Solexperts, with an electronic displacement transducerand automatic data acquisition system, were adopted (Solexperts,2012). Similar to the geodetic measurements of tunnel conver-gence, extensometers were installed as soon as possible after thepass of the excavation face. Since the extensometers did not cap-ture the entire deformation evolution within the rock mass frompre-mining conditions to the post-excavation stage, a straightfor-ward comparison of experimental measurements with numericalsimulations was not possible. Nevertheless, extensometer datacould be used to assess the extent of the zone of influence aroundthe tunnel and the influence of anisotropy on the rock deforma-tional response.
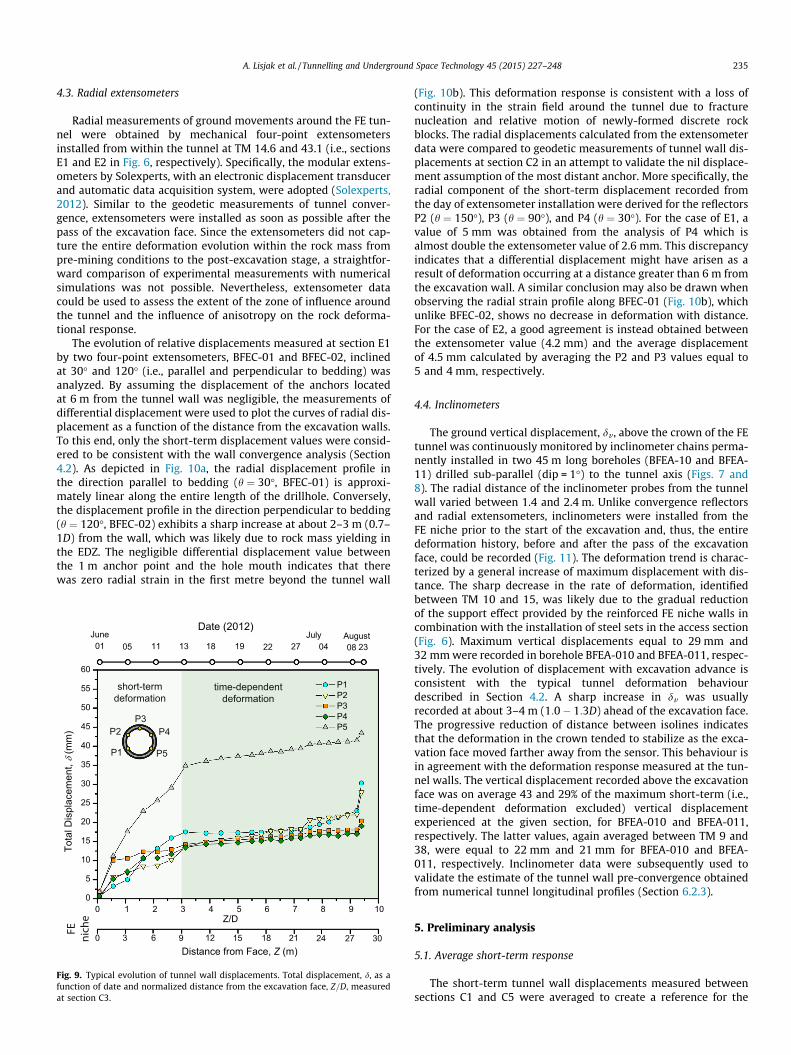
The evolution of relative displacements measured at section E1by two four-point extensometers, BFEC-01 and BFEC-02, inclinedat 30� and 120� (i.e., parallel and perpendicular to bedding) wasanalyzed. By assuming the displacement of the anchors locatedat 6 m from the tunnel wall was negligible, the measurements ofdifferential displacement were used to plot the curves of radial dis-placement as a function of the distance from the excavation walls.To this end, only the short-term displacement values were consid-ered to be consistent with the wall convergence analysis (Section4.2). As depicted in Fig. 10a, the radial displacement profile inthe direction parallel to bedding (h ¼ 30�, BFEC-01) is approxi-mately linear along the entire length of the drillhole. Conversely,the displacement profile in the direction perpendicular to bedding(h ¼ 120�, BFEC-02) exhibits a sharp increase at about 2–3 m (0.7–1D) from the wall, which was likely due to rock mass yielding inthe EDZ. The negligible differential displacement value betweenthe 1 m anchor point and the hole mouth indicates that therewas zero radial strain in the first metre beyond the tunnel wall
0 1 2 3 4 5 6 7 8 9 100
5
10
15
20
25
30
35
40
45
50
55
60
Distance from Face, Z (m)3
04JulyJune
2318131105
Tota
lDis
plac
emen
t,(m
m)
Z/D
P1P2P3P4P5
01 08August
272219
0 96 1512 2118 24 3027
time-dependentdeformation
short-termdeformation
P1
P2P3
P4
P5
Date (2012)
Fig. 9. Typical evolution of tunnel wall displacements. Total displacement, d, as afunction of date and normalized distance from the excavation face, Z=D, measuredat section C3.
(Fig. 10b). This deformation response is consistent with a loss ofcontinuity in the strain field around the tunnel due to fracturenucleation and relative motion of newly-formed discrete rockblocks. The radial displacements calculated from the extensometerdata were compared to geodetic measurements of tunnel wall dis-placements at section C2 in an attempt to validate the nil displace-ment assumption of the most distant anchor. More specifically, theradial component of the short-term displacement recorded fromthe day of extensometer installation were derived for the reflectorsP2 (h ¼ 150�), P3 (h ¼ 90�), and P4 (h ¼ 30�). For the case of E1, avalue of 5 mm was obtained from the analysis of P4 which isalmost double the extensometer value of 2.6 mm. This discrepancyindicates that a differential displacement might have arisen as aresult of deformation occurring at a distance greater than 6 m fromthe excavation wall. A similar conclusion may also be drawn whenobserving the radial strain profile along BFEC-01 (Fig. 10b), whichunlike BFEC-02, shows no decrease in deformation with distance.For the case of E2, a good agreement is instead obtained betweenthe extensometer value (4.2 mm) and the average displacementof 4.5 mm calculated by averaging the P2 and P3 values equal to5 and 4 mm, respectively.
4.4. Inclinometers
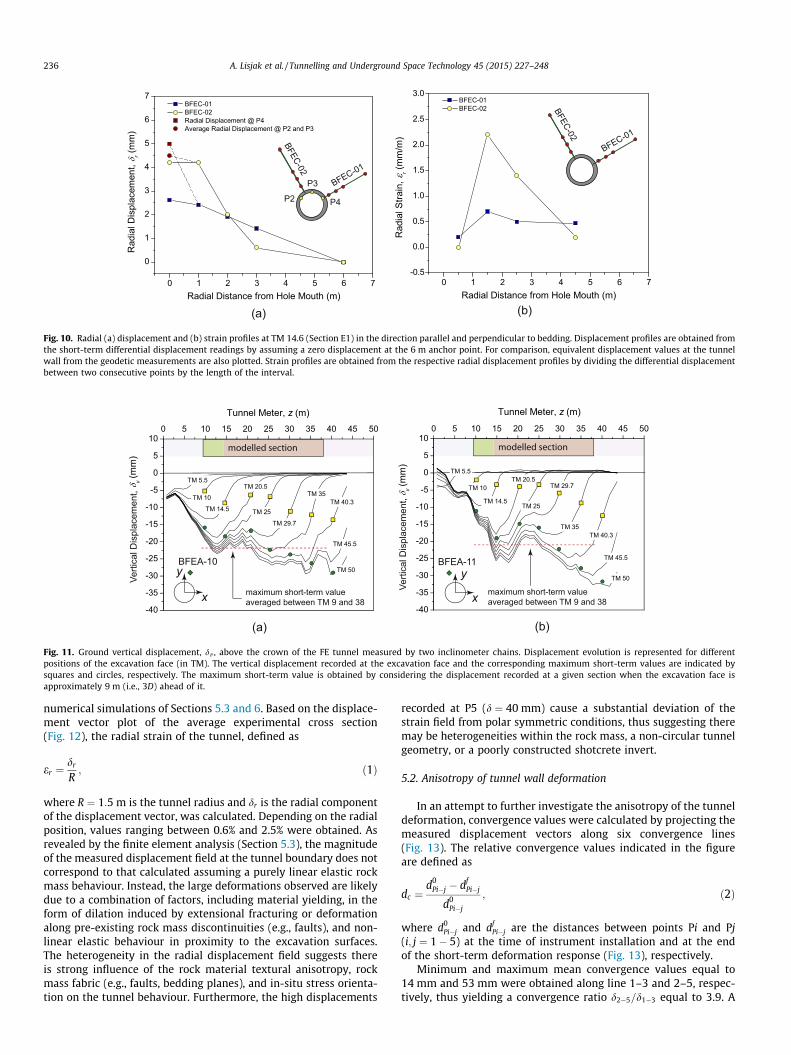
The ground vertical displacement, dv , above the crown of the FEtunnel was continuously monitored by inclinometer chains perma-nently installed in two 45 m long boreholes (BFEA-10 and BFEA-11) drilled sub-parallel (dip = 1�) to the tunnel axis (Figs. 7 and8). The radial distance of the inclinometer probes from the tunnelwall varied between 1.4 and 2.4 m. Unlike convergence reflectorsand radial extensometers, inclinometers were installed from theFE niche prior to the start of the excavation and, thus, the entiredeformation history, before and after the pass of the excavationface, could be recorded (Fig. 11). The deformation trend is charac-terized by a general increase of maximum displacement with dis-tance. The sharp decrease in the rate of deformation, identifiedbetween TM 10 and 15, was likely due to the gradual reductionof the support effect provided by the reinforced FE niche walls incombination with the installation of steel sets in the access section(Fig. 6). Maximum vertical displacements equal to 29 mm and32 mm were recorded in borehole BFEA-010 and BFEA-011, respec-tively. The evolution of displacement with excavation advance isconsistent with the typical tunnel deformation behaviourdescribed in Section 4.2. A sharp increase in dv was usuallyrecorded at about 3–4 m (1:0� 1:3D) ahead of the excavation face.The progressive reduction of distance between isolines indicatesthat the deformation in the crown tended to stabilize as the exca-vation face moved farther away from the sensor. This behaviour isin agreement with the deformation response measured at the tun-nel walls. The vertical displacement recorded above the excavationface was on average 43 and 29% of the maximum short-term (i.e.,time-dependent deformation excluded) vertical displacementexperienced at the given section, for BFEA-010 and BFEA-011,respectively. The latter values, again averaged between TM 9 and38, were equal to 22 mm and 21 mm for BFEA-010 and BFEA-011, respectively. Inclinometer data were subsequently used tovalidate the estimate of the tunnel wall pre-convergence obtainedfrom numerical tunnel longitudinal profiles (Section 6.2.3).
5. Preliminary analysis
5.1. Average short-term response
The short-term tunnel wall displacements measured betweensections C1 and C5 were averaged to create a reference for the
0 1 2 3 4 5 6 7
0
1
2
3
4
5
6
7
Rad
ialD
isp l
acem
ent,
r(m
m)
Radial Distance from Hole Mouth (m)
BFEC-01BFEC-02Radial Displacement @ P4Average Radial Displacement @ P2 and P3
P2
P3
P4
BFEC-01
BFEC-02
0 1 2 3 4 5 6 7-0.5
0.0
0.5
1.0
1.5
2.0
2.5
3.0
Rad
ialS
train
,r(m
m/m
)
Radial Distance from Hole Mouth (m)
BFEC-01BFEC-02
(a) (b)
BFEC-01
BFEC-02
Fig. 10. Radial (a) displacement and (b) strain profiles at TM 14.6 (Section E1) in the direction parallel and perpendicular to bedding. Displacement profiles are obtained fromthe short-term differential displacement readings by assuming a zero displacement at the 6 m anchor point. For comparison, equivalent displacement values at the tunnelwall from the geodetic measurements are also plotted. Strain profiles are obtained from the respective radial displacement profiles by dividing the differential displacementbetween two consecutive points by the length of the interval.
modelled section
-40
-35
-30
-25
-20
-15
-10
-5
0
5
100 5 10 15 20 25 30 35 40 45 50
Tunnel Meter, z (m)
TM 45.5
TM 50
TM 40.3TM 35
TM 29.7
TM 25
TM 20.5
TM 14.5
TM 10
Ver
tical
Def
lec t
ion,
v(m
m)
TM 5.5
-40
-35
-30
-25
-20
-15
-10
-5
0
5
100 5 10 15 20 25 30 35 40 45 50
TM 45.5
TM 50
TM 40.3TM 35
TM 29.7
TM 25
TM 20.5
TM 14.5
TM 10
Tunnel Meter, z (m)V
ertic
alD
efle
ctio
n,v(m
m)
TM 5.5
(a) (b)
x
yBFEA-10
x
yBFEA-11
maximum short-term value averaged between TM 9 and 38
maximum short-term value averaged between TM 9 and 38
modelled section
Verti
cal D
ispl
acem
ent,
Verti
cal D
ispl
acem
ent,
Fig. 11. Ground vertical displacement, dv , above the crown of the FE tunnel measured by two inclinometer chains. Displacement evolution is represented for differentpositions of the excavation face (in TM). The vertical displacement recorded at the excavation face and the corresponding maximum short-term values are indicated bysquares and circles, respectively. The maximum short-term value is obtained by considering the displacement recorded at a given section when the excavation face isapproximately 9 m (i.e., 3D) ahead of it.
236 A. Lisjak et al. / Tunnelling and Underground Space Technology 45 (2015) 227–248
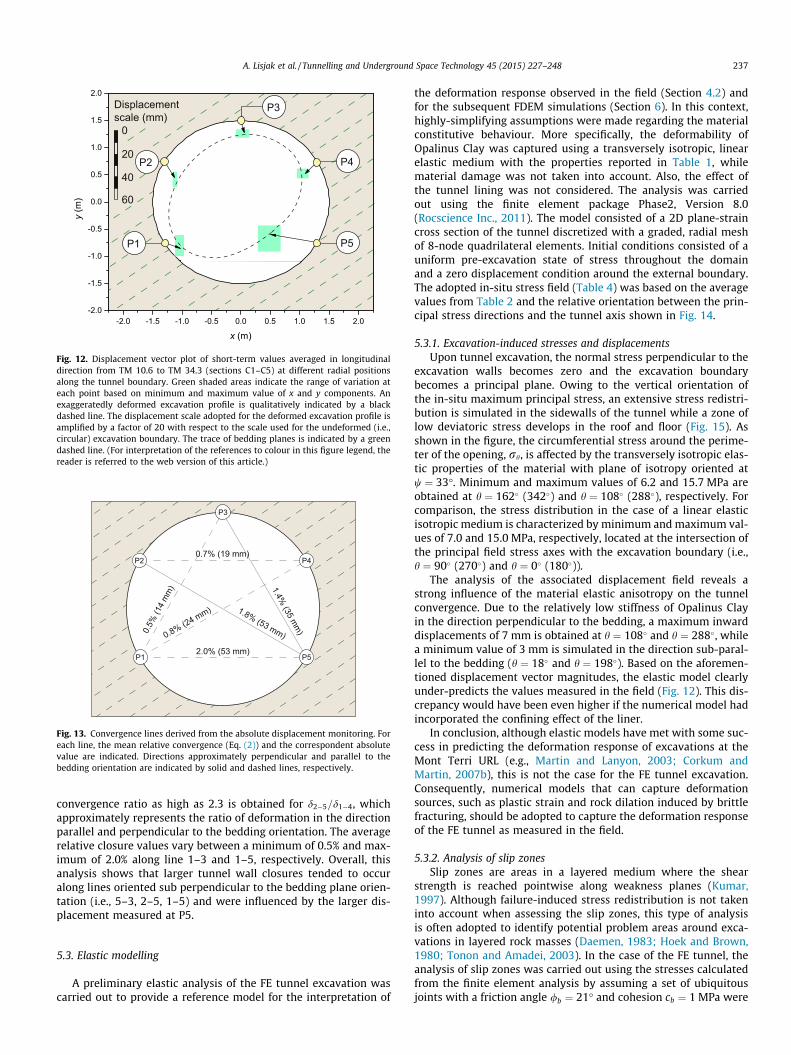
numerical simulations of Sections 5.3 and 6. Based on the displace-ment vector plot of the average experimental cross section(Fig. 12), the radial strain of the tunnel, defined as
er ¼dr
R; ð1Þ
where R ¼ 1:5 m is the tunnel radius and dr is the radial componentof the displacement vector, was calculated. Depending on the radialposition, values ranging between 0.6% and 2.5% were obtained. Asrevealed by the finite element analysis (Section 5.3), the magnitudeof the measured displacement field at the tunnel boundary does notcorrespond to that calculated assuming a purely linear elastic rockmass behaviour. Instead, the large deformations observed are likelydue to a combination of factors, including material yielding, in theform of dilation induced by extensional fracturing or deformationalong pre-existing rock mass discontinuities (e.g., faults), and non-linear elastic behaviour in proximity to the excavation surfaces.The heterogeneity in the radial displacement field suggests thereis strong influence of the rock material textural anisotropy, rockmass fabric (e.g., faults, bedding planes), and in-situ stress orienta-tion on the tunnel behaviour. Furthermore, the high displacements
recorded at P5 (d ¼ 40 mm) cause a substantial deviation of thestrain field from polar symmetric conditions, thus suggesting theremay be heterogeneities within the rock mass, a non-circular tunnelgeometry, or a poorly constructed shotcrete invert.
5.2. Anisotropy of tunnel wall deformation
In an attempt to further investigate the anisotropy of the tunneldeformation, convergence values were calculated by projecting themeasured displacement vectors along six convergence lines(Fig. 13). The relative convergence values indicated in the figureare defined as
dc ¼d0
Pi�j � dfPi�j
d0Pi�j
; ð2Þ
where d0Pi�j and df
Pi�j are the distances between points Pi and Pj(i; j ¼ 1� 5) at the time of instrument installation and at the endof the short-term deformation response (Fig. 13), respectively.
Minimum and maximum mean convergence values equal to14 mm and 53 mm were obtained along line 1–3 and 2–5, respec-tively, thus yielding a convergence ratio d2�5=d1�3 equal to 3.9. A
Displacementscale (mm)
0
60
20
40
-2.0 -1.5 -1.0 -0.5 0.0 0.5 1.0 1.5 2.0-2.0
-1.5
-1.0
-0.5
0.0
0.5
1.0
1.5
2.0
y(m
)
x (m)
P5
P4
P1
P2
P3
Fig. 12. Displacement vector plot of short-term values averaged in longitudinaldirection from TM 10.6 to TM 34.3 (sections C1–C5) at different radial positionsalong the tunnel boundary. Green shaded areas indicate the range of variation ateach point based on minimum and maximum value of x and y components. Anexaggeratedly deformed excavation profile is qualitatively indicated by a blackdashed line. The displacement scale adopted for the deformed excavation profile isamplified by a factor of 20 with respect to the scale used for the undeformed (i.e.,circular) excavation boundary. The trace of bedding planes is indicated by a greendashed line. (For interpretation of the references to colour in this figure legend, thereader is referred to the web version of this article.)
P2
P1
P3
P4
P5
0.8% (24 mm) 1.8% (53 mm)
0.7% (19 mm)
2.0% (53 mm)
1.4% (35 m
m)0.
5% (1
4 m
m)
Fig. 13. Convergence lines derived from the absolute displacement monitoring. Foreach line, the mean relative convergence (Eq. (2)) and the correspondent absolutevalue are indicated. Directions approximately perpendicular and parallel to thebedding orientation are indicated by solid and dashed lines, respectively.
A. Lisjak et al. / Tunnelling and Underground Space Technology 45 (2015) 227–248 237
convergence ratio as high as 2.3 is obtained for d2�5=d1�4, whichapproximately represents the ratio of deformation in the directionparallel and perpendicular to the bedding orientation. The averagerelative closure values vary between a minimum of 0.5% and max-imum of 2.0% along line 1–3 and 1–5, respectively. Overall, thisanalysis shows that larger tunnel wall closures tended to occuralong lines oriented sub perpendicular to the bedding plane orien-tation (i.e., 5–3, 2–5, 1–5) and were influenced by the larger dis-placement measured at P5.
5.3. Elastic modelling
A preliminary elastic analysis of the FE tunnel excavation wascarried out to provide a reference model for the interpretation of
the deformation response observed in the field (Section 4.2) andfor the subsequent FDEM simulations (Section 6). In this context,highly-simplifying assumptions were made regarding the materialconstitutive behaviour. More specifically, the deformability ofOpalinus Clay was captured using a transversely isotropic, linearelastic medium with the properties reported in Table 1, whilematerial damage was not taken into account. Also, the effect ofthe tunnel lining was not considered. The analysis was carriedout using the finite element package Phase2, Version 8.0(Rocscience Inc., 2011). The model consisted of a 2D plane-straincross section of the tunnel discretized with a graded, radial meshof 8-node quadrilateral elements. Initial conditions consisted of auniform pre-excavation state of stress throughout the domainand a zero displacement condition around the external boundary.The adopted in-situ stress field (Table 4) was based on the averagevalues from Table 2 and the relative orientation between the prin-cipal stress directions and the tunnel axis shown in Fig. 14.
5.3.1. Excavation-induced stresses and displacementsUpon tunnel excavation, the normal stress perpendicular to the
excavation walls becomes zero and the excavation boundarybecomes a principal plane. Owing to the vertical orientation ofthe in-situ maximum principal stress, an extensive stress redistri-bution is simulated in the sidewalls of the tunnel while a zone oflow deviatoric stress develops in the roof and floor (Fig. 15). Asshown in the figure, the circumferential stress around the perime-ter of the opening, rh, is affected by the transversely isotropic elas-tic properties of the material with plane of isotropy oriented atw ¼ 33�. Minimum and maximum values of 6.2 and 15.7 MPa areobtained at h ¼ 162� (342�) and h ¼ 108� (288�), respectively. Forcomparison, the stress distribution in the case of a linear elasticisotropic medium is characterized by minimum and maximum val-ues of 7.0 and 15.0 MPa, respectively, located at the intersection ofthe principal field stress axes with the excavation boundary (i.e.,h ¼ 90� (270�) and h ¼ 0� (180�)).
The analysis of the associated displacement field reveals astrong influence of the material elastic anisotropy on the tunnelconvergence. Due to the relatively low stiffness of Opalinus Clayin the direction perpendicular to the bedding, a maximum inwarddisplacements of 7 mm is obtained at h ¼ 108� and h ¼ 288�, whilea minimum value of 3 mm is simulated in the direction sub-paral-lel to the bedding (h ¼ 18� and h ¼ 198�). Based on the aforemen-tioned displacement vector magnitudes, the elastic model clearlyunder-predicts the values measured in the field (Fig. 12). This dis-crepancy would have been even higher if the numerical model hadincorporated the confining effect of the liner.
In conclusion, although elastic models have met with some suc-cess in predicting the deformation response of excavations at theMont Terri URL (e.g., Martin and Lanyon, 2003; Corkum andMartin, 2007b), this is not the case for the FE tunnel excavation.Consequently, numerical models that can capture deformationsources, such as plastic strain and rock dilation induced by brittlefracturing, should be adopted to capture the deformation responseof the FE tunnel as measured in the field.
5.3.2. Analysis of slip zonesSlip zones are areas in a layered medium where the shear
strength is reached pointwise along weakness planes (Kumar,1997). Although failure-induced stress redistribution is not takeninto account when assessing the slip zones, this type of analysisis often adopted to identify potential problem areas around exca-vations in layered rock masses (Daemen, 1983; Hoek and Brown,1980; Tonon and Amadei, 2003). In the case of the FE tunnel, theanalysis of slip zones was carried out using the stresses calculatedfrom the finite element analysis by assuming a set of ubiquitousjoints with a friction angle /b ¼ 21� and cohesion cb ¼ 1 MPa were
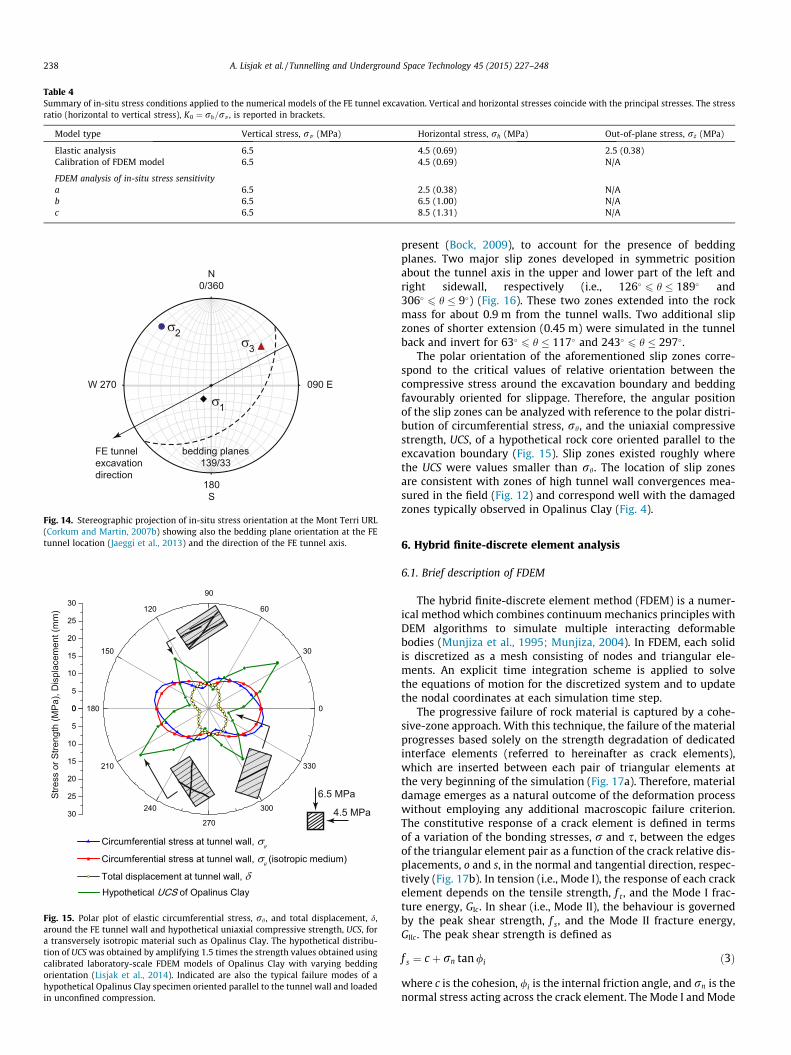
Table 4Summary of in-situ stress conditions applied to the numerical models of the FE tunnel excavation. Vertical and horizontal stresses coincide with the principal stresses. The stressratio (horizontal to vertical stress), K0 ¼ rh=rv , is reported in brackets.
Model type Vertical stress, rv (MPa) Horizontal stress, rh (MPa) Out-of-plane stress, rz (MPa)
Elastic analysis 6.5 4.5 (0.69) 2.5 (0.38)Calibration of FDEM model 6.5 4.5 (0.69) N/A
FDEM analysis of in-situ stress sensitivitya 6.5 2.5 (0.38) N/Ab 6.5 6.5 (1.00) N/Ac 6.5 8.5 (1.31) N/A
N0/360
090 EW 270
180S
bedding planes139/33
σ1
σ3
σ2
FE tunnelexcavationdirection
Fig. 14. Stereographic projection of in-situ stress orientation at the Mont Terri URL(Corkum and Martin, 2007b) showing also the bedding plane orientation at the FEtunnel location (Jaeggi et al., 2013) and the direction of the FE tunnel axis.
6.5 MPa
4.5 MPa
Stre
ss o
r Stre
ngth
(MP
a), D
ispl
acem
ent (
mm
)
Fig. 15. Polar plot of elastic circumferential stress, rh , and total displacement, d,around the FE tunnel wall and hypothetical uniaxial compressive strength, UCS, fora transversely isotropic material such as Opalinus Clay. The hypothetical distribu-tion of UCS was obtained by amplifying 1.5 times the strength values obtained usingcalibrated laboratory-scale FDEM models of Opalinus Clay with varying beddingorientation (Lisjak et al., 2014). Indicated are also the typical failure modes of ahypothetical Opalinus Clay specimen oriented parallel to the tunnel wall and loadedin unconfined compression.
238 A. Lisjak et al. / Tunnelling and Underground Space Technology 45 (2015) 227–248
present (Bock, 2009), to account for the presence of beddingplanes. Two major slip zones developed in symmetric positionabout the tunnel axis in the upper and lower part of the left andright sidewall, respectively (i.e., 126� 6 h � 189� and306� 6 h � 9�) (Fig. 16). These two zones extended into the rockmass for about 0.9 m from the tunnel walls. Two additional slipzones of shorter extension (0.45 m) were simulated in the tunnelback and invert for 63� 6 h � 117� and 243� 6 h � 297�.
The polar orientation of the aforementioned slip zones corre-spond to the critical values of relative orientation between thecompressive stress around the excavation boundary and beddingfavourably oriented for slippage. Therefore, the angular positionof the slip zones can be analyzed with reference to the polar distri-bution of circumferential stress, rh, and the uniaxial compressivestrength, UCS, of a hypothetical rock core oriented parallel to theexcavation boundary (Fig. 15). Slip zones existed roughly wherethe UCS were values smaller than rh. The location of slip zonesare consistent with zones of high tunnel wall convergences mea-sured in the field (Fig. 12) and correspond well with the damagedzones typically observed in Opalinus Clay (Fig. 4).
6. Hybrid finite-discrete element analysis
6.1. Brief description of FDEM
The hybrid finite-discrete element method (FDEM) is a numer-ical method which combines continuum mechanics principles withDEM algorithms to simulate multiple interacting deformablebodies (Munjiza et al., 1995; Munjiza, 2004). In FDEM, each solidis discretized as a mesh consisting of nodes and triangular ele-ments. An explicit time integration scheme is applied to solvethe equations of motion for the discretized system and to updatethe nodal coordinates at each simulation time step.
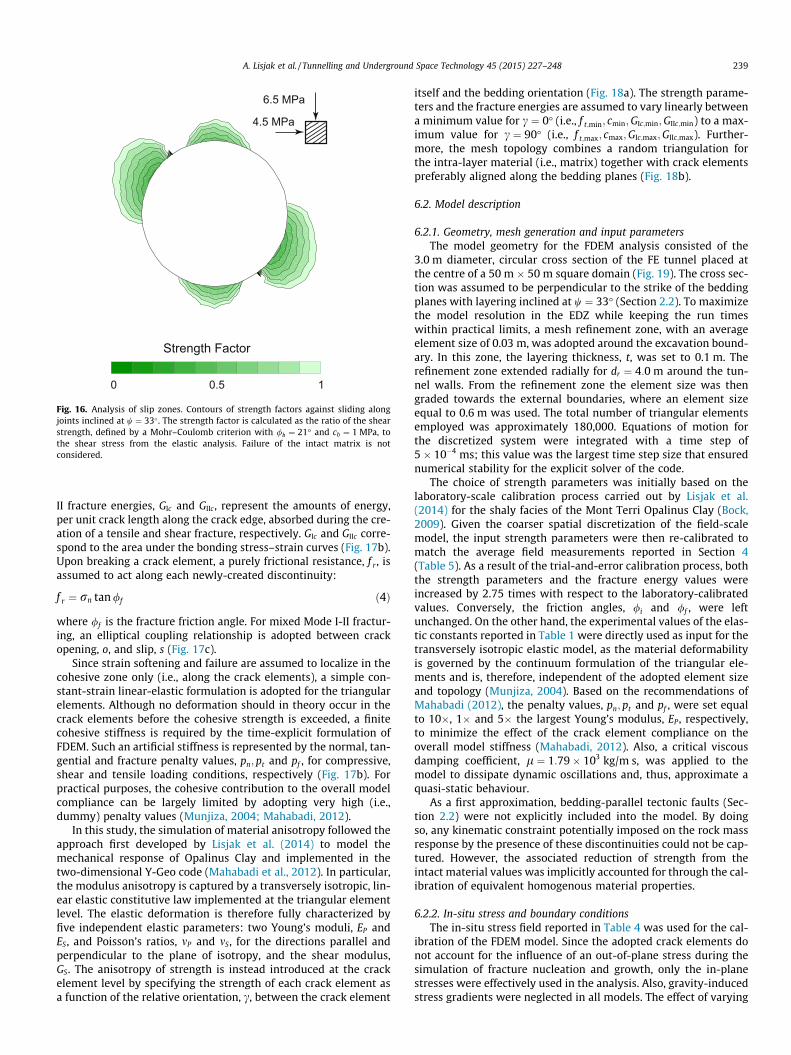
The progressive failure of rock material is captured by a cohe-sive-zone approach. With this technique, the failure of the materialprogresses based solely on the strength degradation of dedicatedinterface elements (referred to hereinafter as crack elements),which are inserted between each pair of triangular elements atthe very beginning of the simulation (Fig. 17a). Therefore, materialdamage emerges as a natural outcome of the deformation processwithout employing any additional macroscopic failure criterion.The constitutive response of a crack element is defined in termsof a variation of the bonding stresses, r and s, between the edgesof the triangular element pair as a function of the crack relative dis-placements, o and s, in the normal and tangential direction, respec-tively (Fig. 17b). In tension (i.e., Mode I), the response of each crackelement depends on the tensile strength, f t , and the Mode I frac-ture energy, GIc. In shear (i.e., Mode II), the behaviour is governedby the peak shear strength, f s, and the Mode II fracture energy,GIIc. The peak shear strength is defined as
f s ¼ c þ rn tan /i ð3Þ
where c is the cohesion, /i is the internal friction angle, and rn is thenormal stress acting across the crack element. The Mode I and Mode
Strength Factor
0 10.5
6.5 MPa
4.5 MPa
Fig. 16. Analysis of slip zones. Contours of strength factors against sliding alongjoints inclined at w ¼ 33� . The strength factor is calculated as the ratio of the shearstrength, defined by a Mohr–Coulomb criterion with /b ¼ 21� and cb ¼ 1 MPa, tothe shear stress from the elastic analysis. Failure of the intact matrix is notconsidered.
A. Lisjak et al. / Tunnelling and Underground Space Technology 45 (2015) 227–248 239
II fracture energies, GIc and GIIc , represent the amounts of energy,per unit crack length along the crack edge, absorbed during the cre-ation of a tensile and shear fracture, respectively. GIc and GIIc corre-spond to the area under the bonding stress–strain curves (Fig. 17b).Upon breaking a crack element, a purely frictional resistance, f r , isassumed to act along each newly-created discontinuity:
f r ¼ rn tan /f ð4Þ
where /f is the fracture friction angle. For mixed Mode I-II fractur-ing, an elliptical coupling relationship is adopted between crackopening, o, and slip, s (Fig. 17c).
Since strain softening and failure are assumed to localize in thecohesive zone only (i.e., along the crack elements), a simple con-stant-strain linear-elastic formulation is adopted for the triangularelements. Although no deformation should in theory occur in thecrack elements before the cohesive strength is exceeded, a finitecohesive stiffness is required by the time-explicit formulation ofFDEM. Such an artificial stiffness is represented by the normal, tan-gential and fracture penalty values, pn; pt and pf , for compressive,shear and tensile loading conditions, respectively (Fig. 17b). Forpractical purposes, the cohesive contribution to the overall modelcompliance can be largely limited by adopting very high (i.e.,dummy) penalty values (Munjiza, 2004; Mahabadi, 2012).
In this study, the simulation of material anisotropy followed theapproach first developed by Lisjak et al. (2014) to model themechanical response of Opalinus Clay and implemented in thetwo-dimensional Y-Geo code (Mahabadi et al., 2012). In particular,the modulus anisotropy is captured by a transversely isotropic, lin-ear elastic constitutive law implemented at the triangular elementlevel. The elastic deformation is therefore fully characterized byfive independent elastic parameters: two Young’s moduli, EP andES, and Poisson’s ratios, mP and mS, for the directions parallel andperpendicular to the plane of isotropy, and the shear modulus,GS. The anisotropy of strength is instead introduced at the crackelement level by specifying the strength of each crack element asa function of the relative orientation, c, between the crack element
itself and the bedding orientation (Fig. 18a). The strength parame-ters and the fracture energies are assumed to vary linearly betweena minimum value for c ¼ 0� (i.e., f t;min; cmin;GIc;min;GIIc;min) to a max-imum value for c ¼ 90� (i.e., f t;max; cmax;GIc;max;GIIc;max). Further-more, the mesh topology combines a random triangulation forthe intra-layer material (i.e., matrix) together with crack elementspreferably aligned along the bedding planes (Fig. 18b).
6.2. Model description
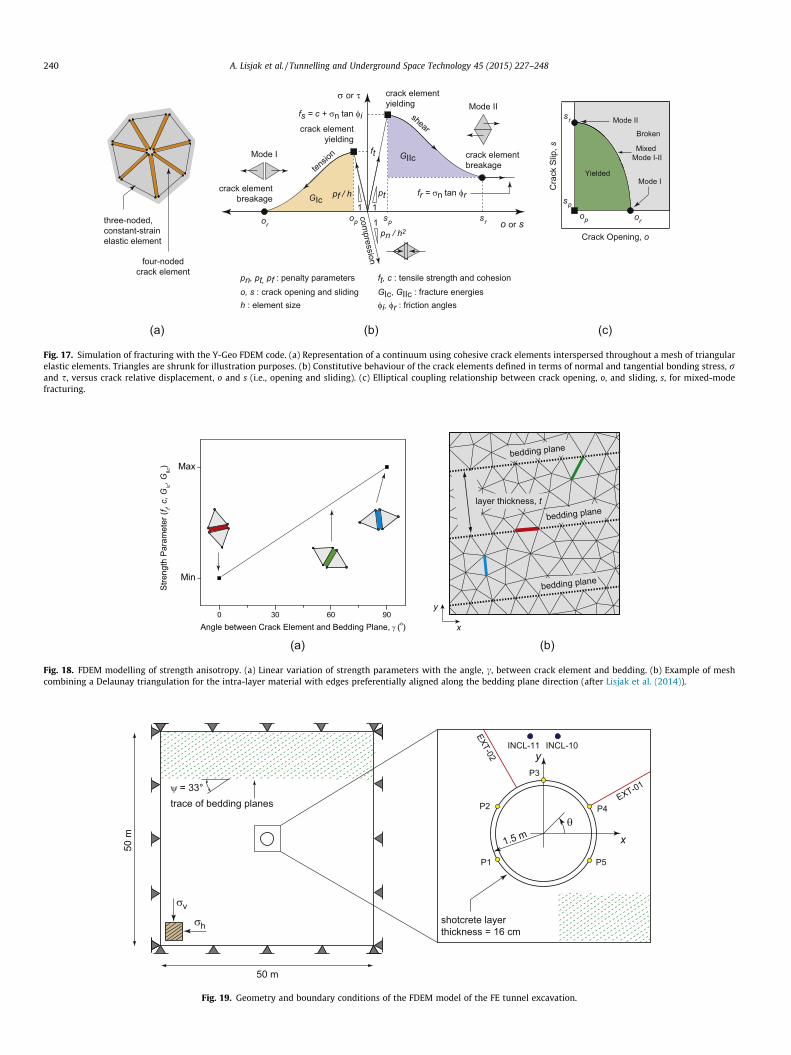
6.2.1. Geometry, mesh generation and input parametersThe model geometry for the FDEM analysis consisted of the
3.0 m diameter, circular cross section of the FE tunnel placed atthe centre of a 50 m � 50 m square domain (Fig. 19). The cross sec-tion was assumed to be perpendicular to the strike of the beddingplanes with layering inclined at w ¼ 33� (Section 2.2). To maximizethe model resolution in the EDZ while keeping the run timeswithin practical limits, a mesh refinement zone, with an averageelement size of 0.03 m, was adopted around the excavation bound-ary. In this zone, the layering thickness, t, was set to 0.1 m. Therefinement zone extended radially for dr ¼ 4:0 m around the tun-nel walls. From the refinement zone the element size was thengraded towards the external boundaries, where an element sizeequal to 0.6 m was used. The total number of triangular elementsemployed was approximately 180,000. Equations of motion forthe discretized system were integrated with a time step of5� 10�4 ms; this value was the largest time step size that ensurednumerical stability for the explicit solver of the code.
The choice of strength parameters was initially based on thelaboratory-scale calibration process carried out by Lisjak et al.(2014) for the shaly facies of the Mont Terri Opalinus Clay (Bock,2009). Given the coarser spatial discretization of the field-scalemodel, the input strength parameters were then re-calibrated tomatch the average field measurements reported in Section 4(Table 5). As a result of the trial-and-error calibration process, boththe strength parameters and the fracture energy values wereincreased by 2.75 times with respect to the laboratory-calibratedvalues. Conversely, the friction angles, /i and /f , were leftunchanged. On the other hand, the experimental values of the elas-tic constants reported in Table 1 were directly used as input for thetransversely isotropic elastic model, as the material deformabilityis governed by the continuum formulation of the triangular ele-ments and is, therefore, independent of the adopted element sizeand topology (Munjiza, 2004). Based on the recommendations ofMahabadi (2012), the penalty values, pn; pt and pf , were set equalto 10�, 1� and 5� the largest Young’s modulus, EP , respectively,to minimize the effect of the crack element compliance on theoverall model stiffness (Mahabadi, 2012). Also, a critical viscousdamping coefficient, l ¼ 1:79� 103 kg/m s, was applied to themodel to dissipate dynamic oscillations and, thus, approximate aquasi-static behaviour.
As a first approximation, bedding-parallel tectonic faults (Sec-tion 2.2) were not explicitly included into the model. By doingso, any kinematic constraint potentially imposed on the rock massresponse by the presence of these discontinuities could not be cap-tured. However, the associated reduction of strength from theintact material values was implicitly accounted for through the cal-ibration of equivalent homogenous material properties.
6.2.2. In-situ stress and boundary conditionsThe in-situ stress field reported in Table 4 was used for the cal-
ibration of the FDEM model. Since the adopted crack elements donot account for the influence of an out-of-plane stress during thesimulation of fracture nucleation and growth, only the in-planestresses were effectively used in the analysis. Also, gravity-inducedstress gradients were neglected in all models. The effect of varying
(a)
three-noded,constant-strainelastic element
four-nodedcrack element
(b)
shear
compression
crack elementbreakage
crack elementbreakage
ft
tensio
n
1
1pn / h2
1
pt
o or s
pn, pt, pf : penalty parameterso, s : crack opening and slidingh : element size
pf / hGIc
GIIc
crack elementyielding
Broken
Yielded
Mode II
Mode I
Mixed Mode I-II
Cra
ck S
lip, s
Crack Opening, o
crack elementyielding
(c)
orop sp sr
Mode I
Mode IIsr
sp
op or
ft, c : tensile strength and cohesionGIc, GIIc : fracture energies φi, φr : friction angles
fs = c + σn tan φi
fr = σn tan φr
σ or τ
Fig. 17. Simulation of fracturing with the Y-Geo FDEM code. (a) Representation of a continuum using cohesive crack elements interspersed throughout a mesh of triangularelastic elements. Triangles are shrunk for illustration purposes. (b) Constitutive behaviour of the crack elements defined in terms of normal and tangential bonding stress, rand s, versus crack relative displacement, o and s (i.e., opening and sliding). (c) Elliptical coupling relationship between crack opening, o, and sliding, s, for mixed-modefracturing.
x
y
(b)(a)
layer thickness, t
bedding plane
bedding plane
bedding plane
Fig. 18. FDEM modelling of strength anisotropy. (a) Linear variation of strength parameters with the angle, c, between crack element and bedding. (b) Example of meshcombining a Delaunay triangulation for the intra-layer material with edges preferentially aligned along the bedding plane direction (after Lisjak et al. (2014)).
trace of bedding planes
θ
x
y
σv
σh
50 m
50 m
shotcrete layerthickness = 16 cm
1.5 m
EXT-01
P5
P4
P3
P1
P2
EXT-02
INCL-10INCL-11
ψ = 33°
Fig. 19. Geometry and boundary conditions of the FDEM model of the FE tunnel excavation.
240 A. Lisjak et al. / Tunnelling and Underground Space Technology 45 (2015) 227–248
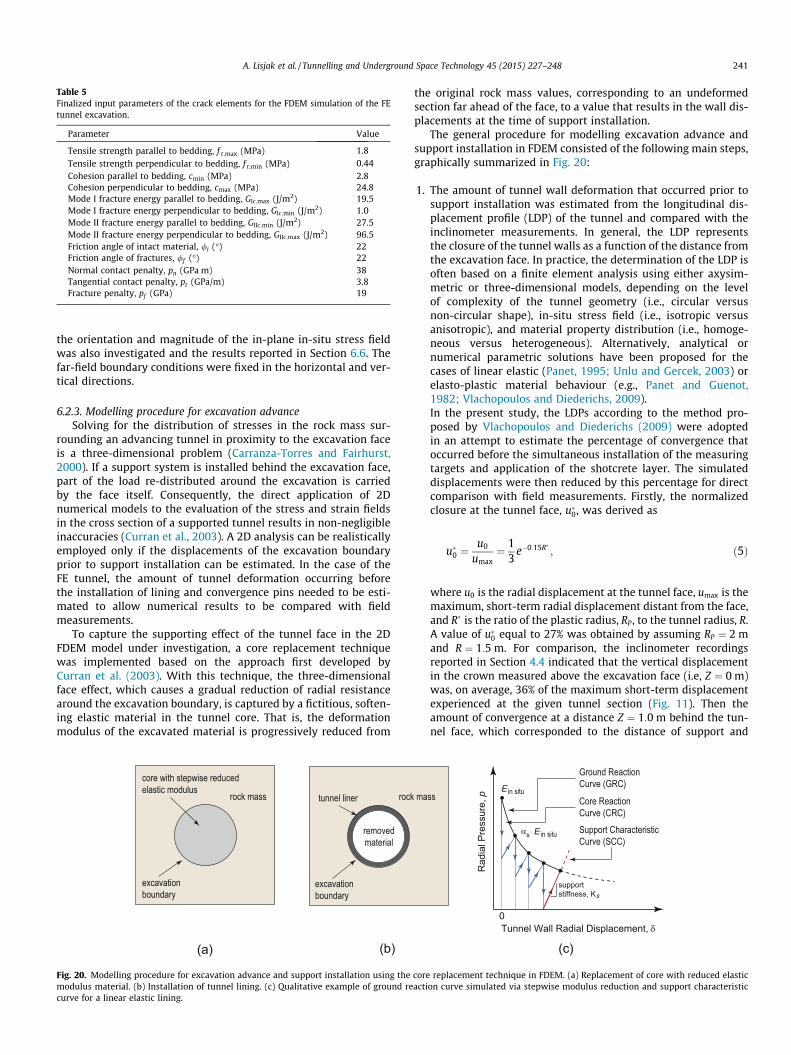
Table 5Finalized input parameters of the crack elements for the FDEM simulation of the FEtunnel excavation.
Parameter Value
Tensile strength parallel to bedding, f t;max (MPa) 1.8Tensile strength perpendicular to bedding, f t;min (MPa) 0.44Cohesion parallel to bedding, cmin (MPa) 2.8Cohesion perpendicular to bedding, cmax (MPa) 24.8Mode I fracture energy parallel to bedding, GIc;max (J/m2) 19.5Mode I fracture energy perpendicular to bedding, GIc;min (J/m2) 1.0Mode II fracture energy parallel to bedding, GIIc;min (J/m2) 27.5Mode II fracture energy perpendicular to bedding, GIIc;max (J/m2) 96.5Friction angle of intact material, /i (�) 22Friction angle of fractures, /f (�) 22Normal contact penalty, pn (GPa m) 38Tangential contact penalty, pt (GPa/m) 3.8Fracture penalty, pf (GPa) 19
A. Lisjak et al. / Tunnelling and Underground Space Technology 45 (2015) 227–248 241
the orientation and magnitude of the in-plane in-situ stress fieldwas also investigated and the results reported in Section 6.6. Thefar-field boundary conditions were fixed in the horizontal and ver-tical directions.
6.2.3. Modelling procedure for excavation advanceSolving for the distribution of stresses in the rock mass sur-
rounding an advancing tunnel in proximity to the excavation faceis a three-dimensional problem (Carranza-Torres and Fairhurst,2000). If a support system is installed behind the excavation face,part of the load re-distributed around the excavation is carriedby the face itself. Consequently, the direct application of 2Dnumerical models to the evaluation of the stress and strain fieldsin the cross section of a supported tunnel results in non-negligibleinaccuracies (Curran et al., 2003). A 2D analysis can be realisticallyemployed only if the displacements of the excavation boundaryprior to support installation can be estimated. In the case of theFE tunnel, the amount of tunnel deformation occurring beforethe installation of lining and convergence pins needed to be esti-mated to allow numerical results to be compared with fieldmeasurements.
To capture the supporting effect of the tunnel face in the 2DFDEM model under investigation, a core replacement techniquewas implemented based on the approach first developed byCurran et al. (2003). With this technique, the three-dimensionalface effect, which causes a gradual reduction of radial resistancearound the excavation boundary, is captured by a fictitious, soften-ing elastic material in the tunnel core. That is, the deformationmodulus of the excavated material is progressively reduced from
rock mass
excavation boundary
core with stepwise reducedelastic modulus
rock
excavation boundary
tunnel liner
removedmaterial
(a) (b)
Fig. 20. Modelling procedure for excavation advance and support installation using themodulus material. (b) Installation of tunnel lining. (c) Qualitative example of ground recurve for a linear elastic lining.
the original rock mass values, corresponding to an undeformedsection far ahead of the face, to a value that results in the wall dis-placements at the time of support installation.
The general procedure for modelling excavation advance andsupport installation in FDEM consisted of the following main steps,graphically summarized in Fig. 20:
1. The amount of tunnel wall deformation that occurred prior tosupport installation was estimated from the longitudinal dis-placement profile (LDP) of the tunnel and compared with theinclinometer measurements. In general, the LDP representsthe closure of the tunnel walls as a function of the distance fromthe excavation face. In practice, the determination of the LDP isoften based on a finite element analysis using either axysim-metric or three-dimensional models, depending on the levelof complexity of the tunnel geometry (i.e., circular versusnon-circular shape), in-situ stress field (i.e., isotropic versusanisotropic), and material property distribution (i.e., homoge-neous versus heterogeneous). Alternatively, analytical ornumerical parametric solutions have been proposed for thecases of linear elastic (Panet, 1995; Unlu and Gercek, 2003) orelasto-plastic material behaviour (e.g., Panet and Guenot,1982; Vlachopoulos and Diederichs, 2009).In the present study, the LDPs according to the method pro-posed by Vlachopoulos and Diederichs (2009) were adoptedin an attempt to estimate the percentage of convergence thatoccurred before the simultaneous installation of the measuringtargets and application of the shotcrete layer. The simulateddisplacements were then reduced by this percentage for directcomparison with field measurements. Firstly, the normalizedclosure at the tunnel face, u�0, was derived as
mass
core repaction c
u�0 ¼u0
umax¼ 1
3e�0:15R� ; ð5Þ
where u0 is the radial displacement at the tunnel face, umax is themaximum, short-term radial displacement distant from the face,and R� is the ratio of the plastic radius, RP , to the tunnel radius, R.A value of u�0 equal to 27% was obtained by assuming RP ¼ 2 mand R ¼ 1:5 m. For comparison, the inclinometer recordingsreported in Section 4.4 indicated that the vertical displacementin the crown measured above the excavation face (i.e, Z ¼ 0 m)was, on average, 36% of the maximum short-term displacementexperienced at the given tunnel section (Fig. 11). Then theamount of convergence at a distance Z ¼ 1:0 m behind the tun-nel face, which corresponded to the distance of support and
Tunnel Wall Radial Displacement, δ
Rad
ial P
ress
ure,
p
Ground Reaction Curve (GRC)
Support Characteristic Curve (SCC)
(c)
supportstiffness, Ks
0
E in situ
αs. E in situ
Core Reaction Curve (CRC)
lacement technique in FDEM. (a) Replacement of core with reduced elasticurve simulated via stepwise modulus reduction and support characteristic
242 A. Lisjak et al. / Tunnelling and Underground Space Technology 45 (2015) 227–248
measuring targets installation (Section 4.2), was estimated to beequal to 55% from
uumax
¼ 1� ð1� u�0Þ e�ð3ZÞ=ð2R�Þ: ð6Þ
This value is in agreement with 3D modelling results for the ED-B tunnel (Corkum and Martin, 2007b), that indicated thatapproximately 50% of convergence occurred prior to the installa-tion of a convergence array.
2. Using the core replacement technique, the modulus reductionnecessary to obtain the amount of tunnel wall displacementcalculated in Step 1 was determined. To this end, a FDEM sim-ulation was run whereby the elastic parameters of the fictitiouscore material were reduced in a stepwise fashion over time by asoftening ratio, as, and the wall displacements recorded. Theresult was the plot of the tunnel wall displacements, d, as afunction of the core softening ratio, as, depicted in Fig. 21.
3. The FDEM simulation was then re-run by allowing the excava-tion boundary to relax up to the point where the prescribedwall displacements, equal to the convergence measured at thetime of support installation, were obtained and subsequentlyadding the support. The tunnel deformation was again moni-tored for comparison with experimental measurements.
6.2.4. Modelling procedure for support installationThe application of shotcrete on the walls of the FE tunnel was
modelled using the constant-strain, triangular elements imple-mented in FDEM (Munjiza, 2004). Since the constitutive responseof the support is at present limited to isotropic, linear elastic con-ditions (i.e., fracturing is not allowed), the mechanical behaviour ofthe shotcrete was fully characterized by the Young’s modulus, Ec ,and Poisson’s ratio, mc. As further discussed in Section 6.5.2, theadoption of a linear elastic model for the shotcrete necessitatedthe use a very low stiffness value (Ec ¼ 10 MPa) in order to capturethe tunnel deformational response. The support installation con-sisted of specifying the liner thickness, tc ¼ 16 cm, and the instal-lation time from the appropriate core softening ratio, as. Sincethe delayed installation of shotcrete was accomplished by varyingthe elastic properties of the liner from those of the rock mass tothose of the shotcrete (Fig. 20b), the deformation in the liner hadto be zeroed to avoid an artificial build-up of stress in responseto an instantaneous increase of material stiffness in a pre-stressed
P1
P2P3
P4
P5
0 5 10 15 20 25 30 35 40
1E-3
0.01
0.1
1
Cor
eS
ofte
ning
Rat
io,
s
Total Displacement, (mm)
P1P2P3P4P5
Fig. 21. Simulated ground response curve for the FE tunnel excavation. Totaldisplacement, d, versus softening ratio of the core material, as , on a logarithmicscale, at five points along the tunnel boundary.
medium. The radial reinforcement of the rock mass using rockbolts was not included in the model.
6.3. Simulated fracturing behaviour
The FDEM model was first calibrated to match the averagedshort-term tunnel wall displacements measured between TM10.6 and 34.3 (Section 5.1). For this purpose, an iterative, trial-and-error calibration procedure was adopted which involved vary-ing the strength parameters of the rock. The support installationtime, represented by the core softening ratio (Section 6.2.3) as wellas the lining stiffness, were also adjusted in order to capture thecorrect ratio of convergence before and after the support installa-tion. The best overall fit to the in-situ observations (see Section6.5) was obtained for the input parameters reported in Table 5,by applying a core softening ratio as ¼ 0:01 (Fig. 21) before activat-ing the 16 cm thick support layer with a reduced Young’s modulusof 10 MPa (and ms ¼ 0:20).
In the calibrated model, failure around the excavation boundaryinitiates at approximately 0� 6 h � 15�;120� 6 h � 195�, and300� 6 h � 360� in the form of shear-dominated (i.e., Mode II) frac-tures along the bedding planes (Fig. 22a). The azimuthal positionand extension of these two damaged zones roughly correspondto the two major slip zones captured by the elastic analysis withubiquitous joints (Fig. 16). As discussed in Section 5.3, failurearound the tunnel is triggered by the excavation-induced stressredistribution in combination with the lower strength of beddingplanes favourably oriented for slip. As the simulation progresses,the slippage of bedding planes causes a local perturbation in thestress field which results in the nucleation of strain-driven, ModeI fractures in the direction perpendicular to the layering(Fig. 22b). Further bedding-parallel sliding is simulated at about70� and 250�, which corresponds to the secondary slip zones inthe back and roof of the ubiquitous joint, elastic model (Fig. 16).Further rock mass deconfinement triggers further delaminationof bedding planes (Fig. 22c) and the formation of wing-shaped frac-tured zones that tend to extend out in the direction parallel to thebedding to a distance of about 3 m from the sidewalls. After install-ing the support, the propagation of damage away from the openingis suppressed in favour of fragmentation in close proximity to theexcavation boundary until new equilibrium conditions are reached(Fig. 22d). A quantitative comparison of the simulated fracture pat-tern and damage mechanisms with in-situ observations is at pres-ent not possible due to the lack of experimental data. Thislimitation will likely be overcome thanks to an ongoing investiga-tion programme aimed at characterizing the shape and extent ofthe EDZ around the FE tunnel. Nevertheless, the simulated fractur-ing behaviour is in good qualitative agreement with previousexperimental observations from the Mont Terri URL described inSection 3.1. A remarkable similarity between breakout locationand types of fractures (i.e., bedding plane delamination and exten-sional fractures) can indeed be noticed between Figs. 4 and 5 andthe simulated fracture pattern reported in Fig. 22d.
6.4. Simulated stress and displacement fields
The redistribution of compressive stress in response to the tun-nel excavation (Fig. 23) is influenced by the in-situ stress anisot-ropy as well as the characteristic fracture pattern (bedding-parallel discontinuities and a heavily fractured zone around thetunnel) The lateral extension of the EDZ due to bedding delamina-tion is suppressed by the re-orientation of r1 in the direction per-pendicular to bedding. In proximity to the tunnel boundary,bedding plane slippage promotes a drastic reduction of confiningstress, r3, with low to moderately negative values responsible forthe observed extensional fracturing.
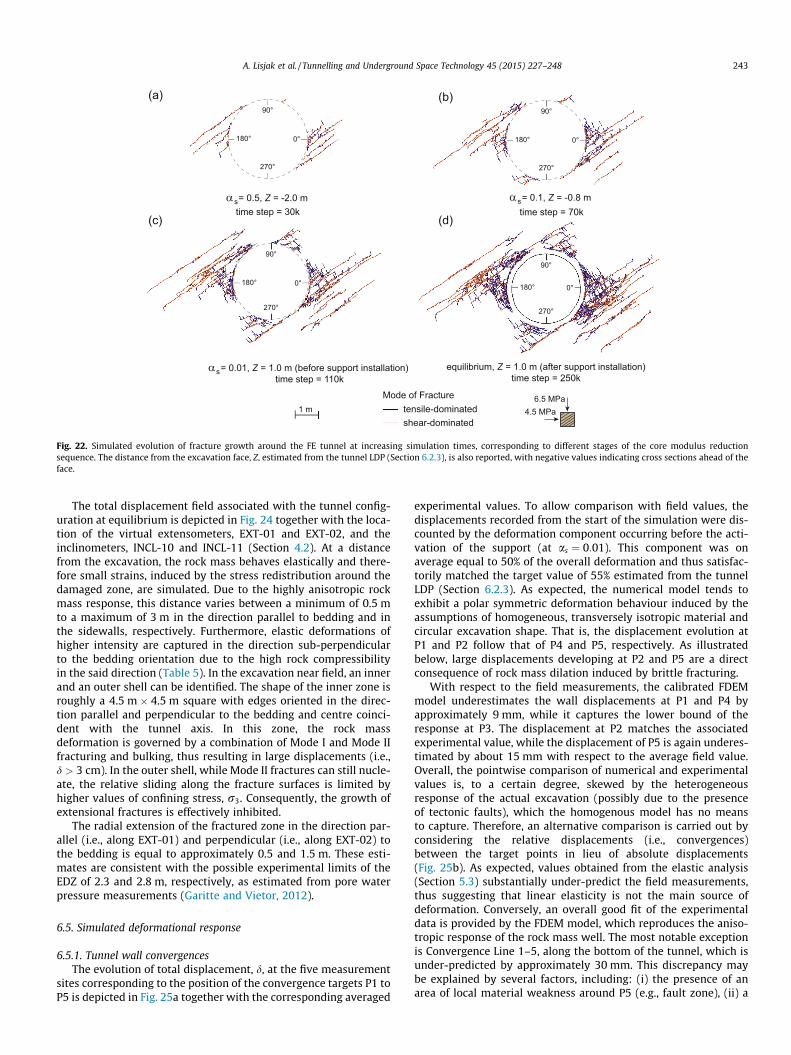
Mode of Fracture1 m
6.5 MPa4.5 MPa
(a) (b)
(d)(c)
s s
α = 0.01, Z = 1.0 m (before support installation) time step = 110k
s equilibrium, Z = 1.0 m (after support installation)time step = 250k
tensile-dominatedshear-dominated
α = 0.5, Z = -2.0 m α = 0.1, Z = -0.8 m
0°
90°
180°
270°
0°
90°
180°
270°
0°
90°
180°
270°
0°
90°
180°
270°
time step = 30k time step = 70k
Fig. 22. Simulated evolution of fracture growth around the FE tunnel at increasing simulation times, corresponding to different stages of the core modulus reductionsequence. The distance from the excavation face, Z, estimated from the tunnel LDP (Section 6.2.3), is also reported, with negative values indicating cross sections ahead of theface.
A. Lisjak et al. / Tunnelling and Underground Space Technology 45 (2015) 227–248 243
The total displacement field associated with the tunnel config-uration at equilibrium is depicted in Fig. 24 together with the loca-tion of the virtual extensometers, EXT-01 and EXT-02, and theinclinometers, INCL-10 and INCL-11 (Section 4.2). At a distancefrom the excavation, the rock mass behaves elastically and there-fore small strains, induced by the stress redistribution around thedamaged zone, are simulated. Due to the highly anisotropic rockmass response, this distance varies between a minimum of 0.5 mto a maximum of 3 m in the direction parallel to bedding and inthe sidewalls, respectively. Furthermore, elastic deformations ofhigher intensity are captured in the direction sub-perpendicularto the bedding orientation due to the high rock compressibilityin the said direction (Table 5). In the excavation near field, an innerand an outer shell can be identified. The shape of the inner zone isroughly a 4.5 m � 4.5 m square with edges oriented in the direc-tion parallel and perpendicular to the bedding and centre coinci-dent with the tunnel axis. In this zone, the rock massdeformation is governed by a combination of Mode I and Mode IIfracturing and bulking, thus resulting in large displacements (i.e.,d > 3 cm). In the outer shell, while Mode II fractures can still nucle-ate, the relative sliding along the fracture surfaces is limited byhigher values of confining stress, r3. Consequently, the growth ofextensional fractures is effectively inhibited.
The radial extension of the fractured zone in the direction par-allel (i.e., along EXT-01) and perpendicular (i.e., along EXT-02) tothe bedding is equal to approximately 0.5 and 1.5 m. These esti-mates are consistent with the possible experimental limits of theEDZ of 2.3 and 2.8 m, respectively, as estimated from pore waterpressure measurements (Garitte and Vietor, 2012).
6.5. Simulated deformational response
6.5.1. Tunnel wall convergencesThe evolution of total displacement, d, at the five measurement
sites corresponding to the position of the convergence targets P1 toP5 is depicted in Fig. 25a together with the corresponding averaged
experimental values. To allow comparison with field values, thedisplacements recorded from the start of the simulation were dis-counted by the deformation component occurring before the acti-vation of the support (at as ¼ 0:01). This component was onaverage equal to 50% of the overall deformation and thus satisfac-torily matched the target value of 55% estimated from the tunnelLDP (Section 6.2.3). As expected, the numerical model tends toexhibit a polar symmetric deformation behaviour induced by theassumptions of homogeneous, transversely isotropic material andcircular excavation shape. That is, the displacement evolution atP1 and P2 follow that of P4 and P5, respectively. As illustratedbelow, large displacements developing at P2 and P5 are a directconsequence of rock mass dilation induced by brittle fracturing.
With respect to the field measurements, the calibrated FDEMmodel underestimates the wall displacements at P1 and P4 byapproximately 9 mm, while it captures the lower bound of theresponse at P3. The displacement at P2 matches the associatedexperimental value, while the displacement of P5 is again underes-timated by about 15 mm with respect to the average field value.Overall, the pointwise comparison of numerical and experimentalvalues is, to a certain degree, skewed by the heterogeneousresponse of the actual excavation (possibly due to the presenceof tectonic faults), which the homogenous model has no meansto capture. Therefore, an alternative comparison is carried out byconsidering the relative displacements (i.e., convergences)between the target points in lieu of absolute displacements(Fig. 25b). As expected, values obtained from the elastic analysis(Section 5.3) substantially under-predict the field measurements,thus suggesting that linear elasticity is not the main source ofdeformation. Conversely, an overall good fit of the experimentaldata is provided by the FDEM model, which reproduces the aniso-tropic response of the rock mass well. The most notable exceptionis Convergence Line 1–5, along the bottom of the tunnel, which isunder-predicted by approximately 30 mm. This discrepancy maybe explained by several factors, including: (i) the presence of anarea of local material weakness around P5 (e.g., fault zone), (ii) a
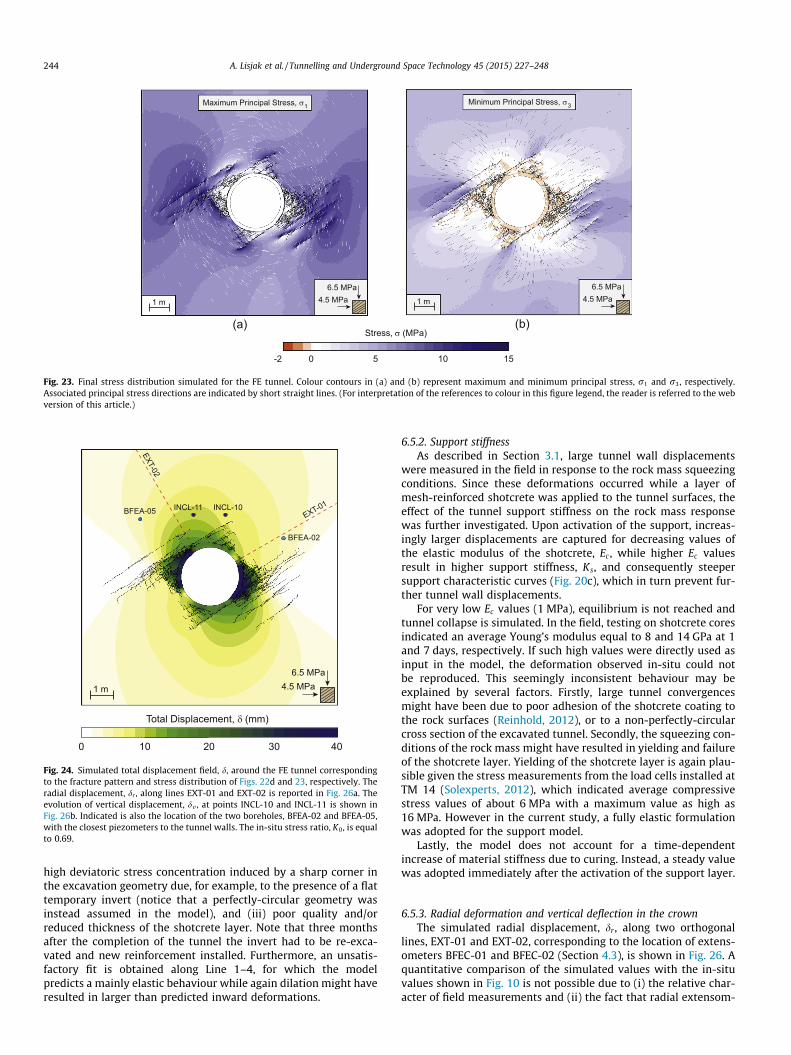
(a) (b)Stress, σ (MPa)
-2 0 155
6.5 MPa4.5 MPa
6.5 MPa4.5 MPa
Maximum Principal Stress, σ1 Minimum Principal Stress, σ3
1 m 1 m
10
Fig. 23. Final stress distribution simulated for the FE tunnel. Colour contours in (a) and (b) represent maximum and minimum principal stress, r1 and r3, respectively.Associated principal stress directions are indicated by short straight lines. (For interpretation of the references to colour in this figure legend, the reader is referred to the webversion of this article.)
Total Displacement, δ (mm)
0 4010 20
1 m
6.5 MPa4.5 MPa
EXT-01
EXT-02
INCL-10INCL-11BFEA-05
BFEA-02
30
Fig. 24. Simulated total displacement field, d, around the FE tunnel correspondingto the fracture pattern and stress distribution of Figs. 22d and 23, respectively. Theradial displacement, dr , along lines EXT-01 and EXT-02 is reported in Fig. 26a. Theevolution of vertical displacement, dv , at points INCL-10 and INCL-11 is shown inFig. 26b. Indicated is also the location of the two boreholes, BFEA-02 and BFEA-05,with the closest piezometers to the tunnel walls. The in-situ stress ratio, K0, is equalto 0.69.
244 A. Lisjak et al. / Tunnelling and Underground Space Technology 45 (2015) 227–248
high deviatoric stress concentration induced by a sharp corner inthe excavation geometry due, for example, to the presence of a flattemporary invert (notice that a perfectly-circular geometry wasinstead assumed in the model), and (iii) poor quality and/orreduced thickness of the shotcrete layer. Note that three monthsafter the completion of the tunnel the invert had to be re-exca-vated and new reinforcement installed. Furthermore, an unsatis-factory fit is obtained along Line 1–4, for which the modelpredicts a mainly elastic behaviour while again dilation might haveresulted in larger than predicted inward deformations.
6.5.2. Support stiffnessAs described in Section 3.1, large tunnel wall displacements
were measured in the field in response to the rock mass squeezingconditions. Since these deformations occurred while a layer ofmesh-reinforced shotcrete was applied to the tunnel surfaces, theeffect of the tunnel support stiffness on the rock mass responsewas further investigated. Upon activation of the support, increas-ingly larger displacements are captured for decreasing values ofthe elastic modulus of the shotcrete, Ec , while higher Ec valuesresult in higher support stiffness, Ks, and consequently steepersupport characteristic curves (Fig. 20c), which in turn prevent fur-ther tunnel wall displacements.
For very low Ec values (1 MPa), equilibrium is not reached andtunnel collapse is simulated. In the field, testing on shotcrete coresindicated an average Young’s modulus equal to 8 and 14 GPa at 1and 7 days, respectively. If such high values were directly used asinput in the model, the deformation observed in-situ could notbe reproduced. This seemingly inconsistent behaviour may beexplained by several factors. Firstly, large tunnel convergencesmight have been due to poor adhesion of the shotcrete coating tothe rock surfaces (Reinhold, 2012), or to a non-perfectly-circularcross section of the excavated tunnel. Secondly, the squeezing con-ditions of the rock mass might have resulted in yielding and failureof the shotcrete layer. Yielding of the shotcrete layer is again plau-sible given the stress measurements from the load cells installed atTM 14 (Solexperts, 2012), which indicated average compressivestress values of about 6 MPa with a maximum value as high as16 MPa. However in the current study, a fully elastic formulationwas adopted for the support model.
Lastly, the model does not account for a time-dependentincrease of material stiffness due to curing. Instead, a steady valuewas adopted immediately after the activation of the support layer.
6.5.3. Radial deformation and vertical deflection in the crownThe simulated radial displacement, dr , along two orthogonal
lines, EXT-01 and EXT-02, corresponding to the location of extens-ometers BFEC-01 and BFEC-02 (Section 4.3), is shown in Fig. 26. Aquantitative comparison of the simulated values with the in-situvalues shown in Fig. 10 is not possible due to (i) the relative char-acter of field measurements and (ii) the fact that radial extensom-
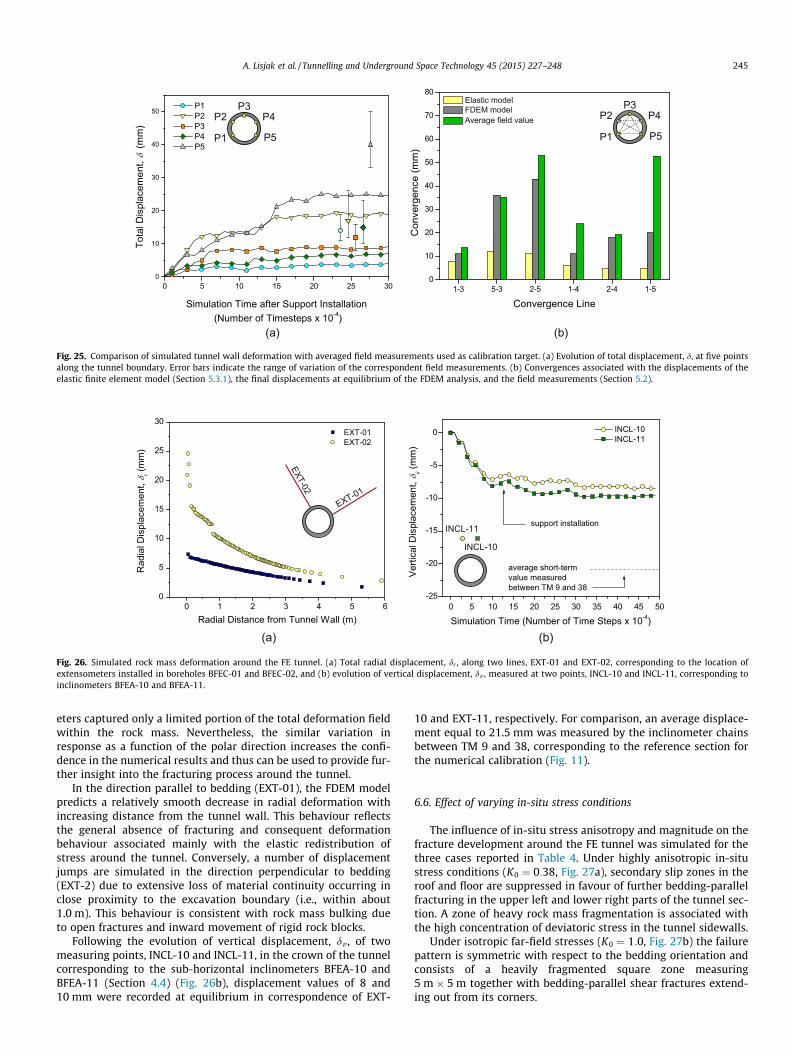
Fig. 25. Comparison of simulated tunnel wall deformation with averaged field measurements used as calibration target. (a) Evolution of total displacement, d, at five pointsalong the tunnel boundary. Error bars indicate the range of variation of the correspondent field measurements. (b) Convergences associated with the displacements of theelastic finite element model (Section 5.3.1), the final displacements at equilibrium of the FDEM analysis, and the field measurements (Section 5.2).
0 5 10 15 20 25 30 35 40 45 50-25
-20
-15
-10
-5
0
Ver
tical
Dis
pla c
e men
t,v
(mm
)
Simulation Time (Number of Time Steps x 10-4)
INCL-10INCL-11
support installation
average short-termvalue measuredbetween TM 9 and 38
EXT-01EXT-02
INCL-10
INCL-11
(a) (b)
0 1 2 3 4 5 60
5
10
15
20
25
30
Rad
ialD
ispl
acem
ent,
r(m
m)
Radial Distance from Tunnel Wall (m)
EXT-01EXT-02
Fig. 26. Simulated rock mass deformation around the FE tunnel. (a) Total radial displacement, dr , along two lines, EXT-01 and EXT-02, corresponding to the location ofextensometers installed in boreholes BFEC-01 and BFEC-02, and (b) evolution of vertical displacement, dv , measured at two points, INCL-10 and INCL-11, corresponding toinclinometers BFEA-10 and BFEA-11.
A. Lisjak et al. / Tunnelling and Underground Space Technology 45 (2015) 227–248 245
eters captured only a limited portion of the total deformation fieldwithin the rock mass. Nevertheless, the similar variation inresponse as a function of the polar direction increases the confi-dence in the numerical results and thus can be used to provide fur-ther insight into the fracturing process around the tunnel.
In the direction parallel to bedding (EXT-01), the FDEM modelpredicts a relatively smooth decrease in radial deformation withincreasing distance from the tunnel wall. This behaviour reflectsthe general absence of fracturing and consequent deformationbehaviour associated mainly with the elastic redistribution ofstress around the tunnel. Conversely, a number of displacementjumps are simulated in the direction perpendicular to bedding(EXT-2) due to extensive loss of material continuity occurring inclose proximity to the excavation boundary (i.e., within about1.0 m). This behaviour is consistent with rock mass bulking dueto open fractures and inward movement of rigid rock blocks.
Following the evolution of vertical displacement, dv , of twomeasuring points, INCL-10 and INCL-11, in the crown of the tunnelcorresponding to the sub-horizontal inclinometers BFEA-10 andBFEA-11 (Section 4.4) (Fig. 26b), displacement values of 8 and10 mm were recorded at equilibrium in correspondence of EXT-
10 and EXT-11, respectively. For comparison, an average displace-ment equal to 21.5 mm was measured by the inclinometer chainsbetween TM 9 and 38, corresponding to the reference section forthe numerical calibration (Fig. 11).
6.6. Effect of varying in-situ stress conditions
The influence of in-situ stress anisotropy and magnitude on thefracture development around the FE tunnel was simulated for thethree cases reported in Table 4. Under highly anisotropic in-situstress conditions (K0 ¼ 0:38, Fig. 27a), secondary slip zones in theroof and floor are suppressed in favour of further bedding-parallelfracturing in the upper left and lower right parts of the tunnel sec-tion. A zone of heavy rock mass fragmentation is associated withthe high concentration of deviatoric stress in the tunnel sidewalls.
Under isotropic far-field stresses (K0 ¼ 1:0, Fig. 27b) the failurepattern is symmetric with respect to the bedding orientation andconsists of a heavily fragmented square zone measuring5 m � 5 m together with bedding-parallel shear fractures extend-ing out from its corners.
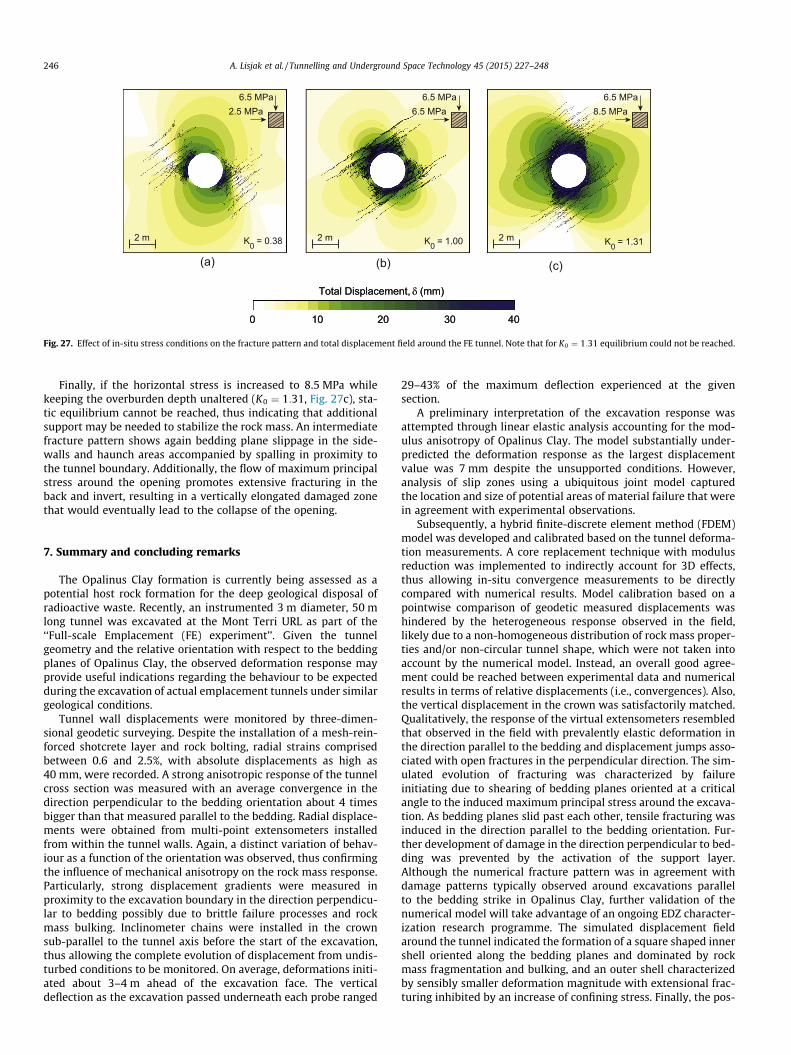
(a) (b) (c)
2 m
6.5 MPa2.5 MPa
6.5 MPa6.5 MPa
6.5 MPa8.5 MPa
2 m 2 mK0 = 0.38 K0 = 1.00 K0 = 1.31
Total Displacement, δ (mm)
0 4010 20 30
Total Displacement, δ (mm)
0 4010 20 30
Fig. 27. Effect of in-situ stress conditions on the fracture pattern and total displacement field around the FE tunnel. Note that for K0 ¼ 1:31 equilibrium could not be reached.
246 A. Lisjak et al. / Tunnelling and Underground Space Technology 45 (2015) 227–248
Finally, if the horizontal stress is increased to 8.5 MPa whilekeeping the overburden depth unaltered (K0 ¼ 1:31, Fig. 27c), sta-tic equilibrium cannot be reached, thus indicating that additionalsupport may be needed to stabilize the rock mass. An intermediatefracture pattern shows again bedding plane slippage in the side-walls and haunch areas accompanied by spalling in proximity tothe tunnel boundary. Additionally, the flow of maximum principalstress around the opening promotes extensive fracturing in theback and invert, resulting in a vertically elongated damaged zonethat would eventually lead to the collapse of the opening.
7. Summary and concluding remarks
The Opalinus Clay formation is currently being assessed as apotential host rock formation for the deep geological disposal ofradioactive waste. Recently, an instrumented 3 m diameter, 50 mlong tunnel was excavated at the Mont Terri URL as part of the‘‘Full-scale Emplacement (FE) experiment’’. Given the tunnelgeometry and the relative orientation with respect to the beddingplanes of Opalinus Clay, the observed deformation response mayprovide useful indications regarding the behaviour to be expectedduring the excavation of actual emplacement tunnels under similargeological conditions.
Tunnel wall displacements were monitored by three-dimen-sional geodetic surveying. Despite the installation of a mesh-rein-forced shotcrete layer and rock bolting, radial strains comprisedbetween 0.6 and 2.5%, with absolute displacements as high as40 mm, were recorded. A strong anisotropic response of the tunnelcross section was measured with an average convergence in thedirection perpendicular to the bedding orientation about 4 timesbigger than that measured parallel to the bedding. Radial displace-ments were obtained from multi-point extensometers installedfrom within the tunnel walls. Again, a distinct variation of behav-iour as a function of the orientation was observed, thus confirmingthe influence of mechanical anisotropy on the rock mass response.Particularly, strong displacement gradients were measured inproximity to the excavation boundary in the direction perpendicu-lar to bedding possibly due to brittle failure processes and rockmass bulking. Inclinometer chains were installed in the crownsub-parallel to the tunnel axis before the start of the excavation,thus allowing the complete evolution of displacement from undis-turbed conditions to be monitored. On average, deformations initi-ated about 3–4 m ahead of the excavation face. The verticaldeflection as the excavation passed underneath each probe ranged
29–43% of the maximum deflection experienced at the givensection.
A preliminary interpretation of the excavation response wasattempted through linear elastic analysis accounting for the mod-ulus anisotropy of Opalinus Clay. The model substantially under-predicted the deformation response as the largest displacementvalue was 7 mm despite the unsupported conditions. However,analysis of slip zones using a ubiquitous joint model capturedthe location and size of potential areas of material failure that werein agreement with experimental observations.
Subsequently, a hybrid finite-discrete element method (FDEM)model was developed and calibrated based on the tunnel deforma-tion measurements. A core replacement technique with modulusreduction was implemented to indirectly account for 3D effects,thus allowing in-situ convergence measurements to be directlycompared with numerical results. Model calibration based on apointwise comparison of geodetic measured displacements washindered by the heterogeneous response observed in the field,likely due to a non-homogeneous distribution of rock mass proper-ties and/or non-circular tunnel shape, which were not taken intoaccount by the numerical model. Instead, an overall good agree-ment could be reached between experimental data and numericalresults in terms of relative displacements (i.e., convergences). Also,the vertical displacement in the crown was satisfactorily matched.Qualitatively, the response of the virtual extensometers resembledthat observed in the field with prevalently elastic deformation inthe direction parallel to the bedding and displacement jumps asso-ciated with open fractures in the perpendicular direction. The sim-ulated evolution of fracturing was characterized by failureinitiating due to shearing of bedding planes oriented at a criticalangle to the induced maximum principal stress around the excava-tion. As bedding planes slid past each other, tensile fracturing wasinduced in the direction parallel to the bedding orientation. Fur-ther development of damage in the direction perpendicular to bed-ding was prevented by the activation of the support layer.Although the numerical fracture pattern was in agreement withdamage patterns typically observed around excavations parallelto the bedding strike in Opalinus Clay, further validation of thenumerical model will take advantage of an ongoing EDZ character-ization research programme. The simulated displacement fieldaround the tunnel indicated the formation of a square shaped innershell oriented along the bedding planes and dominated by rockmass fragmentation and bulking, and an outer shell characterizedby sensibly smaller deformation magnitude with extensional frac-turing inhibited by an increase of confining stress. Finally, the pos-
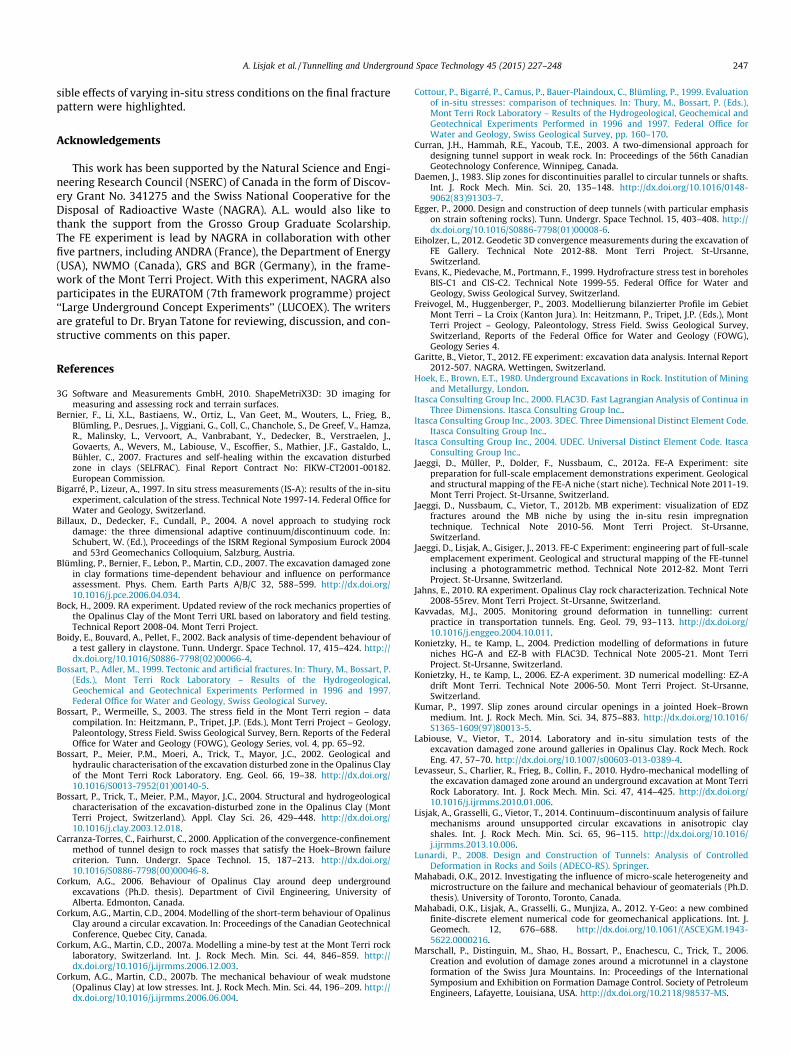
A. Lisjak et al. / Tunnelling and Underground Space Technology 45 (2015) 227–248 247
sible effects of varying in-situ stress conditions on the final fracturepattern were highlighted.
Acknowledgements
This work has been supported by the Natural Science and Engi-neering Research Council (NSERC) of Canada in the form of Discov-ery Grant No. 341275 and the Swiss National Cooperative for theDisposal of Radioactive Waste (NAGRA). A.L. would also like tothank the support from the Grosso Group Graduate Scolarship.The FE experiment is lead by NAGRA in collaboration with otherfive partners, including ANDRA (France), the Department of Energy(USA), NWMO (Canada), GRS and BGR (Germany), in the frame-work of the Mont Terri Project. With this experiment, NAGRA alsoparticipates in the EURATOM (7th framework programme) project‘‘Large Underground Concept Experiments’’ (LUCOEX). The writersare grateful to Dr. Bryan Tatone for reviewing, discussion, and con-structive comments on this paper.
References
3G Software and Measurements GmbH, 2010. ShapeMetriX3D: 3D imaging formeasuring and assessing rock and terrain surfaces.
Bernier, F., Li, X.L., Bastiaens, W., Ortiz, L., Van Geet, M., Wouters, L., Frieg, B.,Blümling, P., Desrues, J., Viggiani, G., Coll, C., Chanchole, S., De Greef, V., Hamza,R., Malinsky, L., Vervoort, A., Vanbrabant, Y., Dedecker, B., Verstraelen, J.,Govaerts, A., Wevers, M., Labiouse, V., Escoffier, S., Mathier, J.F., Gastaldo, L.,Bühler, C., 2007. Fractures and self-healing within the excavation disturbedzone in clays (SELFRAC). Final Report Contract No: FIKW-CT2001-00182.European Commission.
Bigarré, P., Lizeur, A., 1997. In situ stress measurements (IS-A): results of the in-situexperiment, calculation of the stress. Technical Note 1997-14. Federal Office forWater and Geology, Switzerland.
Billaux, D., Dedecker, F., Cundall, P., 2004. A novel approach to studying rockdamage: the three dimensional adaptive continuum/discontinuum code. In:Schubert, W. (Ed.), Proceedings of the ISRM Regional Symposium Eurock 2004and 53rd Geomechanics Colloquium, Salzburg, Austria.
Blümling, P., Bernier, F., Lebon, P., Martin, C.D., 2007. The excavation damaged zonein clay formations time-dependent behaviour and influence on performanceassessment. Phys. Chem. Earth Parts A/B/C 32, 588–599. http://dx.doi.org/10.1016/j.pce.2006.04.034.
Bock, H., 2009. RA experiment. Updated review of the rock mechanics properties ofthe Opalinus Clay of the Mont Terri URL based on laboratory and field testing.Technical Report 2008-04. Mont Terri Project.
Boidy, E., Bouvard, A., Pellet, F., 2002. Back analysis of time-dependent behaviour ofa test gallery in claystone. Tunn. Undergr. Space Technol. 17, 415–424. http://dx.doi.org/10.1016/S0886-7798(02)00066-4.
Bossart, P., Adler, M., 1999. Tectonic and artificial fractures. In: Thury, M., Bossart, P.(Eds.), Mont Terri Rock Laboratory – Results of the Hydrogeological,Geochemical and Geotechnical Experiments Performed in 1996 and 1997.Federal Office for Water and Geology, Swiss Geological Survey.
Bossart, P., Wermeille, S., 2003. The stress field in the Mont Terri region – datacompilation. In: Heitzmann, P., Tripet, J.P. (Eds.), Mont Terri Project – Geology,Paleontology, Stress Field. Swiss Geological Survey, Bern. Reports of the FederalOffice for Water and Geology (FOWG), Geology Series, vol. 4, pp. 65–92.
Bossart, P., Meier, P.M., Moeri, A., Trick, T., Mayor, J.C., 2002. Geological andhydraulic characterisation of the excavation disturbed zone in the Opalinus Clayof the Mont Terri Rock Laboratory. Eng. Geol. 66, 19–38. http://dx.doi.org/10.1016/S0013-7952(01)00140-5.
Bossart, P., Trick, T., Meier, P.M., Mayor, J.C., 2004. Structural and hydrogeologicalcharacterisation of the excavation-disturbed zone in the Opalinus Clay (MontTerri Project, Switzerland). Appl. Clay Sci. 26, 429–448. http://dx.doi.org/10.1016/j.clay.2003.12.018.
Carranza-Torres, C., Fairhurst, C., 2000. Application of the convergence-confinementmethod of tunnel design to rock masses that satisfy the Hoek–Brown failurecriterion. Tunn. Undergr. Space Technol. 15, 187–213. http://dx.doi.org/10.1016/S0886-7798(00)00046-8.
Corkum, A.G., 2006. Behaviour of Opalinus Clay around deep undergroundexcavations (Ph.D. thesis). Department of Civil Engineering, University ofAlberta. Edmonton, Canada.
Corkum, A.G., Martin, C.D., 2004. Modelling of the short-term behaviour of OpalinusClay around a circular excavation. In: Proceedings of the Canadian GeotechnicalConference, Quebec City, Canada.
Corkum, A.G., Martin, C.D., 2007a. Modelling a mine-by test at the Mont Terri rocklaboratory, Switzerland. Int. J. Rock Mech. Min. Sci. 44, 846–859. http://dx.doi.org/10.1016/j.ijrmms.2006.12.003.
Corkum, A.G., Martin, C.D., 2007b. The mechanical behaviour of weak mudstone(Opalinus Clay) at low stresses. Int. J. Rock Mech. Min. Sci. 44, 196–209. http://dx.doi.org/10.1016/j.ijrmms.2006.06.004.
Cottour, P., Bigarré, P., Camus, P., Bauer-Plaindoux, C., Blümling, P., 1999. Evaluationof in-situ stresses: comparison of techniques. In: Thury, M., Bossart, P. (Eds.),Mont Terri Rock Laboratory – Results of the Hydrogeological, Geochemical andGeotechnical Experiments Performed in 1996 and 1997. Federal Office forWater and Geology, Swiss Geological Survey, pp. 160–170.
Curran, J.H., Hammah, R.E., Yacoub, T.E., 2003. A two-dimensional approach fordesigning tunnel support in weak rock. In: Proceedings of the 56th CanadianGeotechnology Conference, Winnipeg, Canada.
Daemen, J., 1983. Slip zones for discontinuities parallel to circular tunnels or shafts.Int. J. Rock Mech. Min. Sci. 20, 135–148. http://dx.doi.org/10.1016/0148-9062(83)91303-7.
Egger, P., 2000. Design and construction of deep tunnels (with particular emphasison strain softening rocks). Tunn. Undergr. Space Technol. 15, 403–408. http://dx.doi.org/10.1016/S0886-7798(01)00008-6.
Eiholzer, L., 2012. Geodetic 3D convergence measurements during the excavation ofFE Gallery. Technical Note 2012-88. Mont Terri Project. St-Ursanne,Switzerland.
Evans, K., Piedevache, M., Portmann, F., 1999. Hydrofracture stress test in boreholesBIS-C1 and CIS-C2. Technical Note 1999-55. Federal Office for Water andGeology, Swiss Geological Survey, Switzerland.
Freivogel, M., Huggenberger, P., 2003. Modellierung bilanzierter Profile im GebietMont Terri – La Croix (Kanton Jura). In: Heitzmann, P., Tripet, J.P. (Eds.), MontTerri Project – Geology, Paleontology, Stress Field. Swiss Geological Survey,Switzerland, Reports of the Federal Office for Water and Geology (FOWG),Geology Series 4.
Garitte, B., Vietor, T., 2012. FE experiment: excavation data analysis. Internal Report2012-507. NAGRA. Wettingen, Switzerland.
Hoek, E., Brown, E.T., 1980. Underground Excavations in Rock. Institution of Miningand Metallurgy, London.
Itasca Consulting Group Inc., 2000. FLAC3D. Fast Lagrangian Analysis of Continua inThree Dimensions. Itasca Consulting Group Inc..
Itasca Consulting Group Inc., 2003. 3DEC. Three Dimensional Distinct Element Code.Itasca Consulting Group Inc..
Itasca Consulting Group Inc., 2004. UDEC. Universal Distinct Element Code. ItascaConsulting Group Inc..
Jaeggi, D., Müller, P., Dolder, F., Nussbaum, C., 2012a. FE-A Experiment: sitepreparation for full-scale emplacement demonstrations experiment. Geologicaland structural mapping of the FE-A niche (start niche). Technical Note 2011-19.Mont Terri Project. St-Ursanne, Switzerland.
Jaeggi, D., Nussbaum, C., Vietor, T., 2012b. MB experiment: visualization of EDZfractures around the MB niche by using the in-situ resin impregnationtechnique. Technical Note 2010-56. Mont Terri Project. St-Ursanne,Switzerland.
Jaeggi, D., Lisjak, A., Gisiger, J., 2013. FE-C Experiment: engineering part of full-scaleemplacement experiment. Geological and structural mapping of the FE-tunnelinclusing a photogrammetric method. Technical Note 2012-82. Mont TerriProject. St-Ursanne, Switzerland.
Jahns, E., 2010. RA experiment. Opalinus Clay rock characterization. Technical Note2008-55rev. Mont Terri Project. St-Ursanne, Switzerland.
Kavvadas, M.J., 2005. Monitoring ground deformation in tunnelling: currentpractice in transportation tunnels. Eng. Geol. 79, 93–113. http://dx.doi.org/10.1016/j.enggeo.2004.10.011.
Konietzky, H., te Kamp, L., 2004. Prediction modelling of deformations in futureniches HG-A and EZ-B with FLAC3D. Technical Note 2005-21. Mont TerriProject. St-Ursanne, Switzerland.
Konietzky, H., te Kamp, L., 2006. EZ-A experiment. 3D numerical modelling: EZ-Adrift Mont Terri. Technical Note 2006-50. Mont Terri Project. St-Ursanne,Switzerland.
Kumar, P., 1997. Slip zones around circular openings in a jointed Hoek–Brownmedium. Int. J. Rock Mech. Min. Sci. 34, 875–883. http://dx.doi.org/10.1016/S1365-1609(97)80013-5.
Labiouse, V., Vietor, T., 2014. Laboratory and in-situ simulation tests of theexcavation damaged zone around galleries in Opalinus Clay. Rock Mech. RockEng. 47, 57–70. http://dx.doi.org/10.1007/s00603-013-0389-4.
Levasseur, S., Charlier, R., Frieg, B., Collin, F., 2010. Hydro-mechanical modelling ofthe excavation damaged zone around an underground excavation at Mont TerriRock Laboratory. Int. J. Rock Mech. Min. Sci. 47, 414–425. http://dx.doi.org/10.1016/j.ijrmms.2010.01.006.
Lisjak, A., Grasselli, G., Vietor, T., 2014. Continuum–discontinuum analysis of failuremechanisms around unsupported circular excavations in anisotropic clayshales. Int. J. Rock Mech. Min. Sci. 65, 96–115. http://dx.doi.org/10.1016/j.ijrmms.2013.10.006.
Lunardi, P., 2008. Design and Construction of Tunnels: Analysis of ControlledDeformation in Rocks and Soils (ADECO-RS). Springer.
Mahabadi, O.K., 2012. Investigating the influence of micro-scale heterogeneity andmicrostructure on the failure and mechanical behaviour of geomaterials (Ph.D.thesis). University of Toronto, Toronto, Canada.
Mahabadi, O.K., Lisjak, A., Grasselli, G., Munjiza, A., 2012. Y-Geo: a new combinedfinite-discrete element numerical code for geomechanical applications. Int. J.Geomech. 12, 676–688. http://dx.doi.org/10.1061/(ASCE)GM.1943-5622.0000216.
Marschall, P., Distinguin, M., Shao, H., Bossart, P., Enachescu, C., Trick, T., 2006.Creation and evolution of damage zones around a microtunnel in a claystoneformation of the Swiss Jura Mountains. In: Proceedings of the InternationalSymposium and Exhibition on Formation Damage Control. Society of PetroleumEngineers, Lafayette, Louisiana, USA. http://dx.doi.org/10.2118/98537-MS.
248 A. Lisjak et al. / Tunnelling and Underground Space Technology 45 (2015) 227–248
Martin, C.D., Lanyon, G.W., 2003. Measurement of in-situ stress in weak rocks atMont Terri Rock Laboratory, Switzerland. Int. J. Rock Mech. Min. Sci. 40, 1077–1088. http://dx.doi.org/10.1016/S1365-1609(03)00113-8.
Martin, C.D., Lanyon, G.W., Blümling, P., Mayor, J.C., 2002. The excavation disturbedzone around a test tunnel in the Opalinus clay. In: Hammah, R., Bawden, W.,Curran, J., Telesnicki, M. (Eds.), Proceedings of the 5th North American RockMechanics Symposium and the 17th Tunnelling Association of CanadaConference: NARMS-TAC 2002. University of Toronto Press, Toronto, Canada,pp. 1581–1588.
Munjiza, A., 2004. The Combined Finite-Discrete Element Method. John Wiley &Sons Ltd., Chichester, West Sussex, England.
Munjiza, A., Owen, D.R.J., Bicanic, N., 1995. A combined finite-discrete elementmethod in transient dynamics of fracturing solids. Eng. Comput. 12, 145–174.http://dx.doi.org/10.1108/02644409510799532.
Nussbaum, C., Bossart, P., 2008. Geology. In: Bossart, P., Thury, M. (Eds.), Mont TerriRock Laboratory – Projects, Programme 1996 to 2007 and Results. SwissGeological Survey, Bern, Switzerland.
Nussbaum, C., Bossart, P., Amann, F., Aubourg, C., 2011. Analysis of tectonicstructures and excavation induced fractures in the Opalinus Clay, Mont Terriunderground rock laboratory (Switzerland). Swiss J. Geosci. 104, 187–210.http://dx.doi.org/10.1007/s00015-011-0070-4.
Panet, M., 1995. Calcul des Tunnels par la Methode de Convergence-Confinement.Presses de l’École Nationale des Ponts et Chaussées, Paris.
Panet, M., Guenot, A., 1982. Analysis of convergence behind the face of a tunnel. In:Proceedings of the International Symposium on Tunnelling. Institution ofMining and Metallurgy, London, pp. 197–204.
Popp, T., Salzer, K., 2007. Anisotropy of seismic and mechanical properties ofOpalinus Clay during triaxial deformation in a multi-anvil apparatus. Phys.Chem. Earth Parts A/B/C 32, 879–888. http://dx.doi.org/10.1016/j.pce.2006.04.022.
Popp, T., Salzer, K., Minkley, W., 2008. Influence of bedding planes to EDZ-evolutionand the coupled HM properties of Opalinus Clay. Phys. Chem. Earth 33, S374–S387. http://dx.doi.org/10.1016/j.pce.2008.10.018.
Reinhold, M., 2012. FE-C experiment: Mechanical lab investigations on low-pHshotcrete samples after completion of the excavation of the Gallery FE.Technical Note 2013-17. Mont Terri Project. St-Ursanne, Switzerland.
Rockfield Software Ltd., 2004. ELFEN 2D/3D Numerical Modelling Package.Rockfield Software Ltd..
Rocscience Inc., 2011. Phase2. 2D Finite Element Program for Stress Analysis andSupport Design Around Excavations in Soil and Rock. Rocscience Inc..
Seeska, R., Lux, K.H., 2012. Borehole deformation measurements and video-observations of boreholes in the Opalinus Clay of the Mont Terri URL. In:
International Post-TIMODAZ Workshop, St-Ursanne, Switzerland. URL: <http://www.argenco.ulg.ac.be/timodaz/>.
Shao, H., Schuster, K., Sönnke, J., Bräuer, V., 2008. EDZ development in induratedclay formations – in situ borehole measurements and coupled HM modelling.Phys. Chem. Earth Parts A/B/C 33 (Supplement 1), S388–S395. http://dx.doi.org/10.1016/j.pce.2008.10.031.
Solexperts, 2012. FE-B Experiment: Installation of geotechnical instruments in theFE Gallery during its construction. Radial borehole extensometers, stress cells,temperature sensors, crack meters. Technical Note 2012-86. Mont Terri Project.St-Ursanne, Switzerland.
Stefanizzi, S., 2007. Numerical modelling of strain-driven fractures around tunnelsin layered rock masses (Ph.D. thesis). Politecnico di Torino, Turin, Italy.
Thovert, J.F., Mourzenko, V., Adler, P., Nussbaum, C., Pinettes, P., 2011. Faults andfractures in the Gallery 04 of the Mont Terri rock laboratory: characterization,simulation and application. Eng. Geol. 117, 39–51. http://dx.doi.org/10.1016/j.enggeo.2010.10.003.
Thury, M., Bossart, P., 1999. Results of the hydrogeological, geochemical andgeotechnical experiments performed in the Opalinus Clay. Geological Report 23.Swiss Geological Survey. Bern, Switzerland.
Tonon, F., Amadei, B., 2003. Stresses in anisotropic rock masses: an engineeringperspective building on geological knowledge. Int. J. Rock Mech. Min. Sci. 40,1099–1120. http://dx.doi.org/10.1016/j.ijrmms.2003.07.009.
Tsang, C.F., Barnichon, J.D., Birkholzer, J., Li, X.L., Liu, H.H., Sillen, X., 2012. Coupledthermo-hydro-mechanical processes in the near field of a high-level radioactivewaste repository in clay formations. Int. J. Rock Mech. Min. Sci. 49, 31–44.http://dx.doi.org/10.1016/j.ijrmms.2011.09.015.
Unlu, T., Gercek, H., 2003. Effect of Poisson’s ratio on the normalized radialdisplacements occurring around the face of a circular tunnel. Tunn. Undergr.Space Technol. 18, 547–553. http://dx.doi.org/10.1016/S0886-7798(03)00086-5.
Vietor, T., Armand, G., Nyonoya, S., Schuster, K., Wieczorek, K., 2010. Excavationinduced damage evolution during a mine-by experiment in Opalinus Clay. In:Proceedings of the 4th Meeting on Clays in Natural & Engineered Barriers forRadioactive Waste Confinement, Nantes, France.
Vlachopoulos, N., Diederichs, M.S., 2009. Improved longitudinal displacementprofiles for convergence-confinement analysis in deep tunnels. Rock Mech.Rock Eng. 42, 131–146. http://dx.doi.org/10.1007/s00603-009-0176-4.
Yong, S., Kaiser, P.K., Loew, S., 2010. Influence of tectonic shears on tunnel-inducedfracturing. Int. J. Rock Mech. Min. Sci. 47, 894–907. http://dx.doi.org/10.1016/j.ijrmms.2010.05.009.
Yong, S., Kaiser, P.K., Loew, S., 2013. Rock mass response ahead of an advancing facein faulted shale. Int. J. Rock Mech. Min. Sci. 60, 301–311. http://dx.doi.org/10.1016/j.ijrmms.2013.01.002.