Embed Size (px)
Citation preview
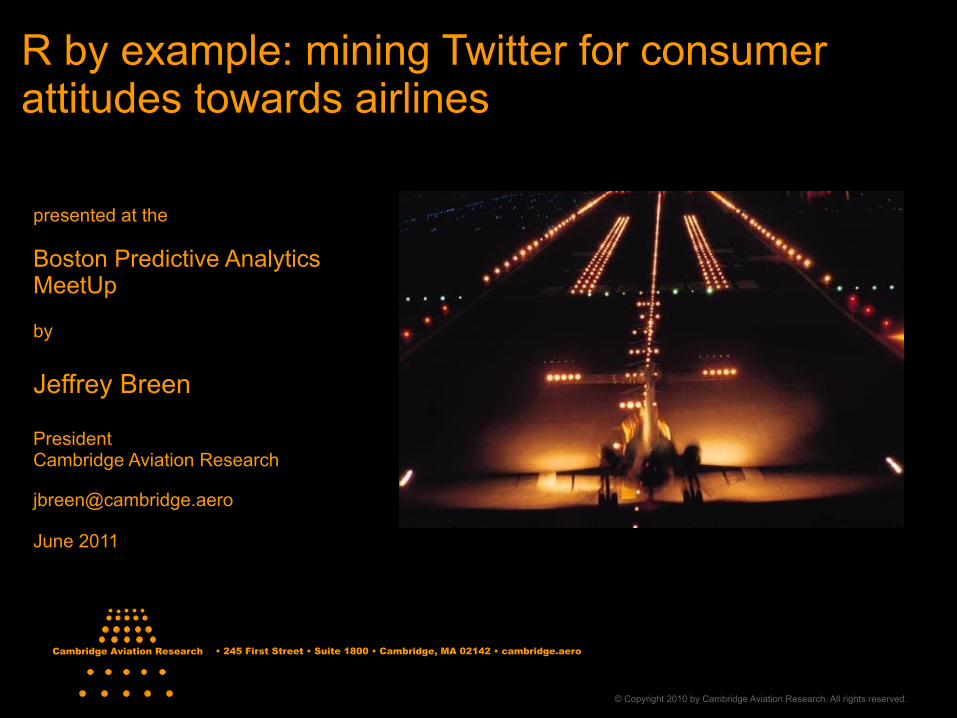
R by example: mining Twitter for consumer attitudes towards airlines
presented at the
Boston Predictive Analytics MeetUp
by
Jeffrey Breen
PresidentCambridge Aviation Research
June 2011
© Copyright 2010 by Cambridge Aviation Research. All rights reserved.
Cambridge Aviation Research • 245 First Street • Suite 1800 • Cambridge, MA 02142 • cambridge.aero
3
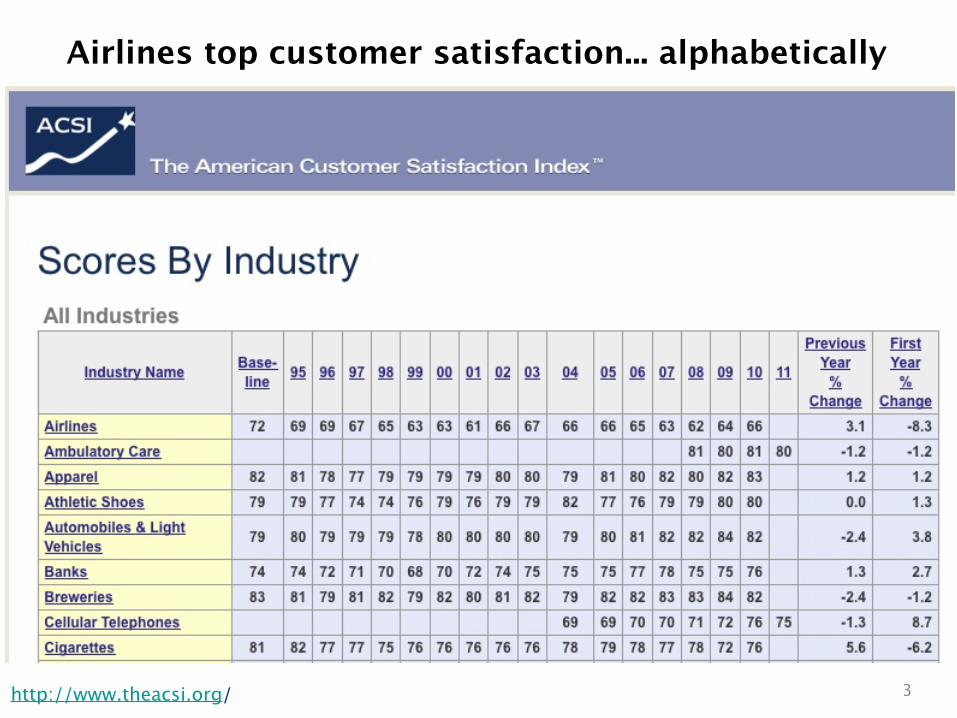
Airlines top customer satisfaction... alphabetically
http://www.theacsi.org/
4
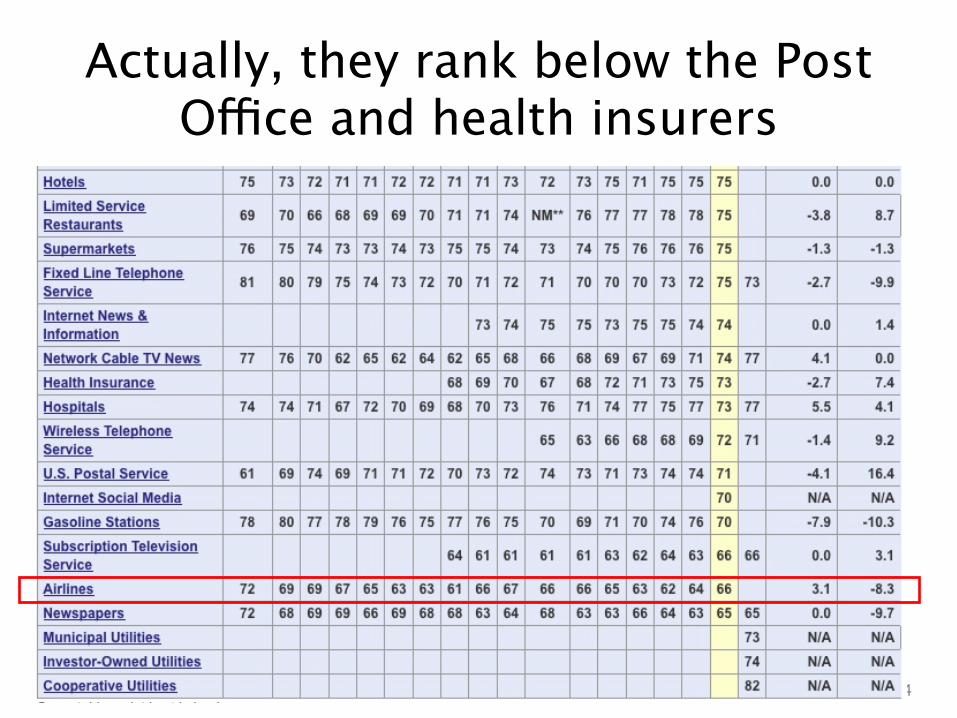
Actually, they rank below the Post Office and health insurers
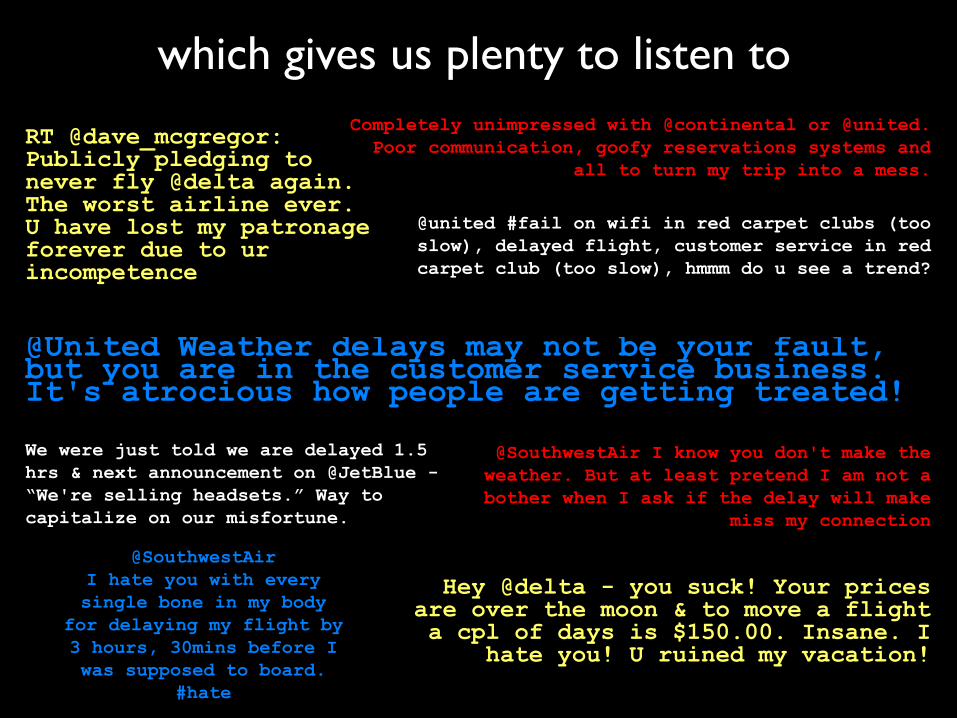
which gives us plenty to listen to
RT @dave_mcgregor: Publicly pledging to never fly @delta again. The worst airline ever. U have lost my patronage forever due to ur incompetence
Hey @delta - you suck! Your prices are over the moon & to move a flight a cpl of days is $150.00. Insane. I
hate you! U ruined my vacation!
@united #fail on wifi in red carpet clubs (too slow), delayed flight, customer service in red carpet club (too slow), hmmm do u see a trend?
@United Weather delays may not be your fault, but you are in the customer service business. It's atrocious how people are getting treated!
Completely unimpressed with @continental or @united. Poor communication, goofy reservations systems and
all to turn my trip into a mess.
We were just told we are delayed 1.5 hrs & next announcement on @JetBlue - “We're selling headsets.” Way to capitalize on our misfortune.
@SouthwestAir I know you don't make the weather. But at least pretend I am not a bother when I ask if the delay will make
miss my connection
@SouthwestAirI hate you with every single bone in my body
for delaying my flight by 3 hours, 30mins before I was supposed to board.
#hate
14
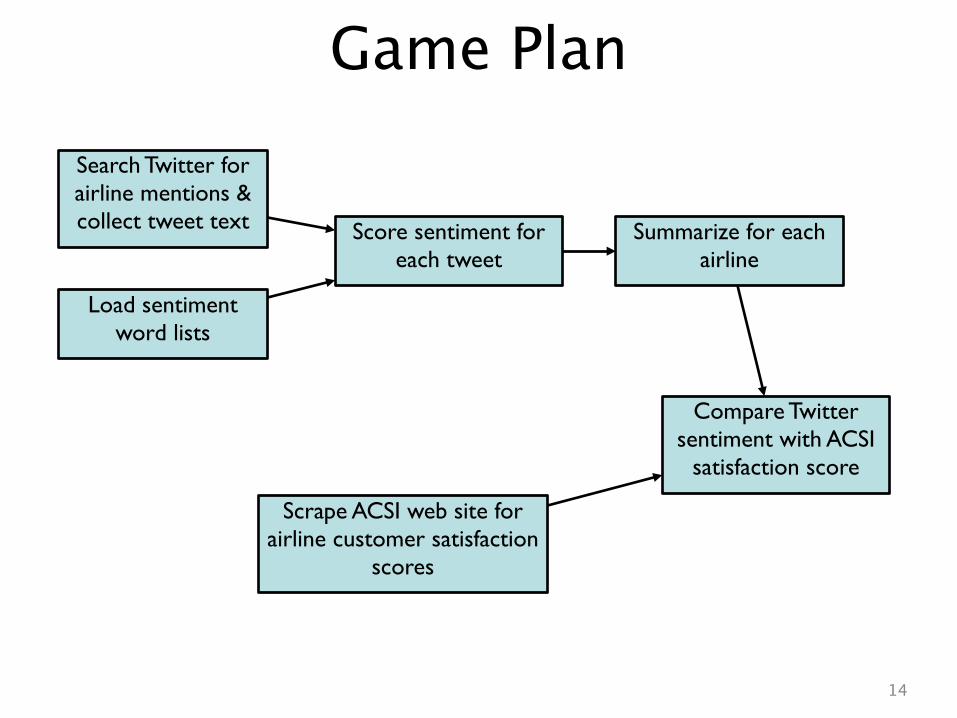
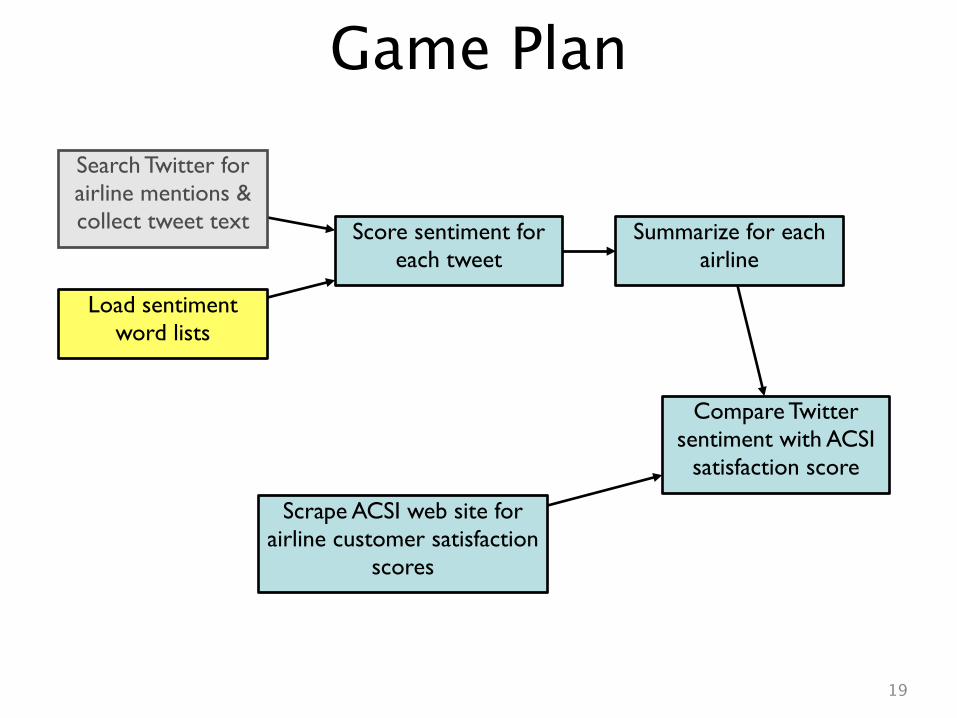
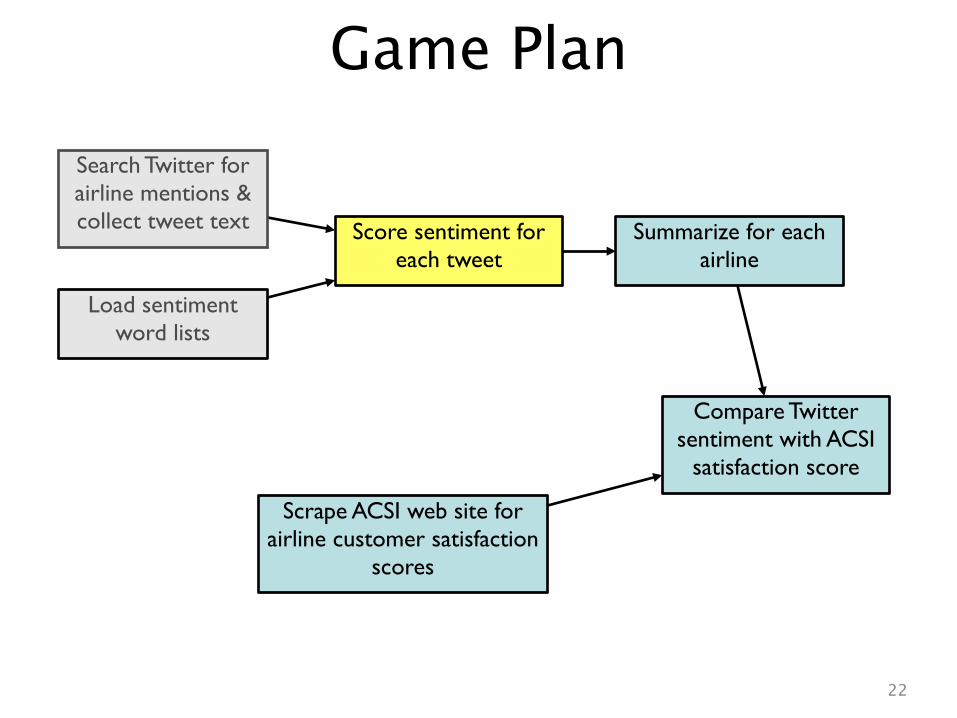
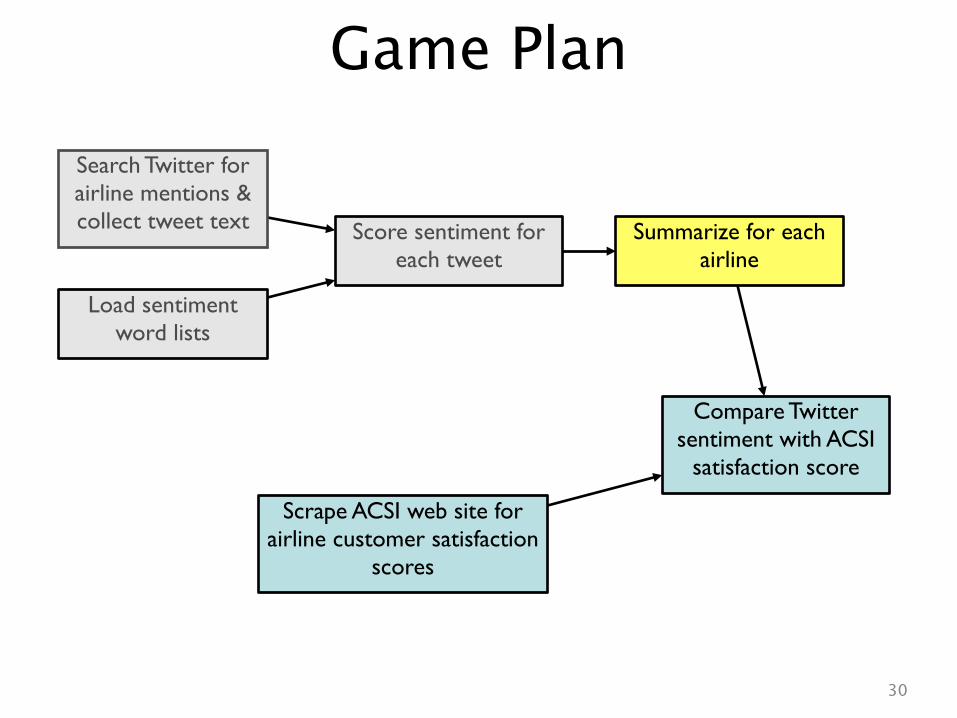
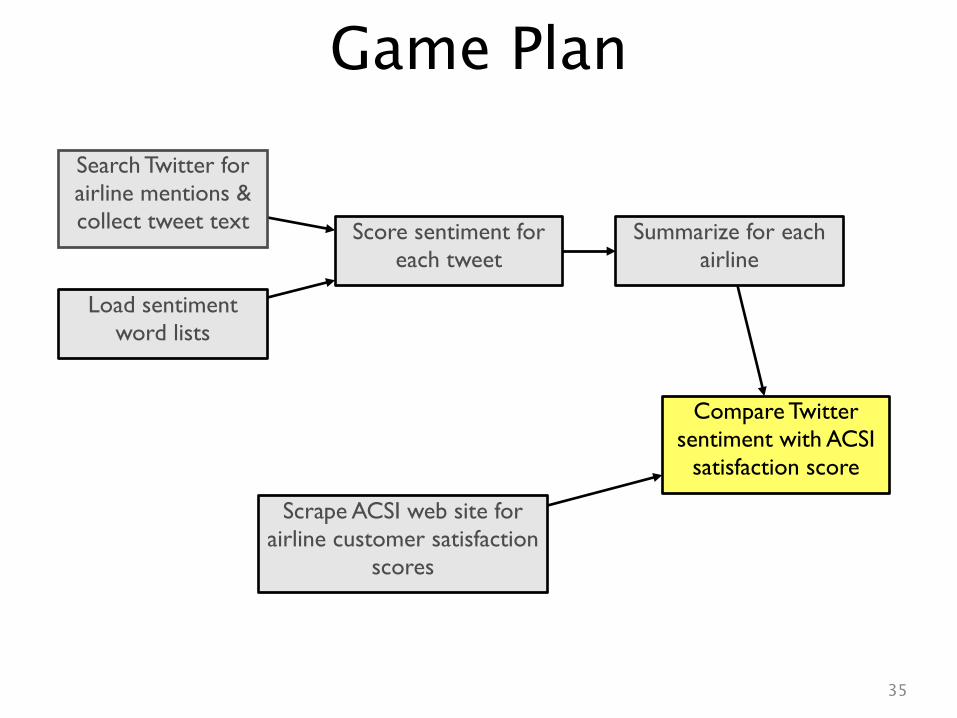
Search Twitter for airline mentions & collect tweet text
Load sentiment word lists
Score sentiment for each tweet
Summarize for each airline
Compare Twitter sentiment with ACSI
satisfaction score
Scrape ACSI web site for airline customer satisfaction
scores
Game Plan
15
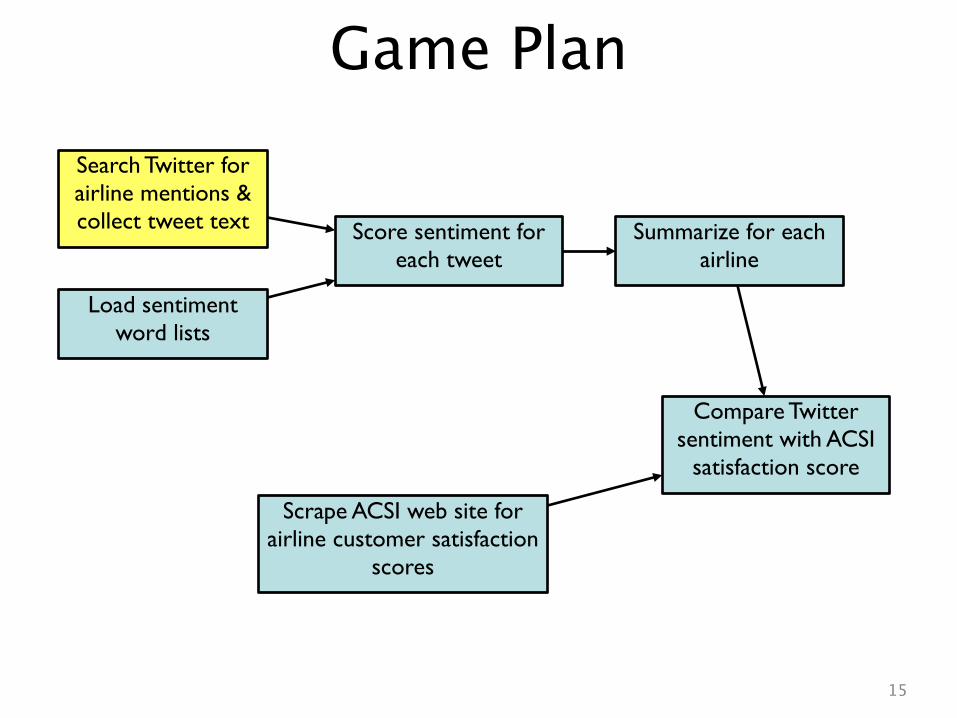
Search Twitter for airline mentions & collect tweet text
Load sentiment word lists
Score sentiment for each tweet
Summarize for each airline
Compare Twitter sentiment with ACSI
satisfaction score
Scrape ACSI web site for airline customer satisfaction
scores
Game Plan
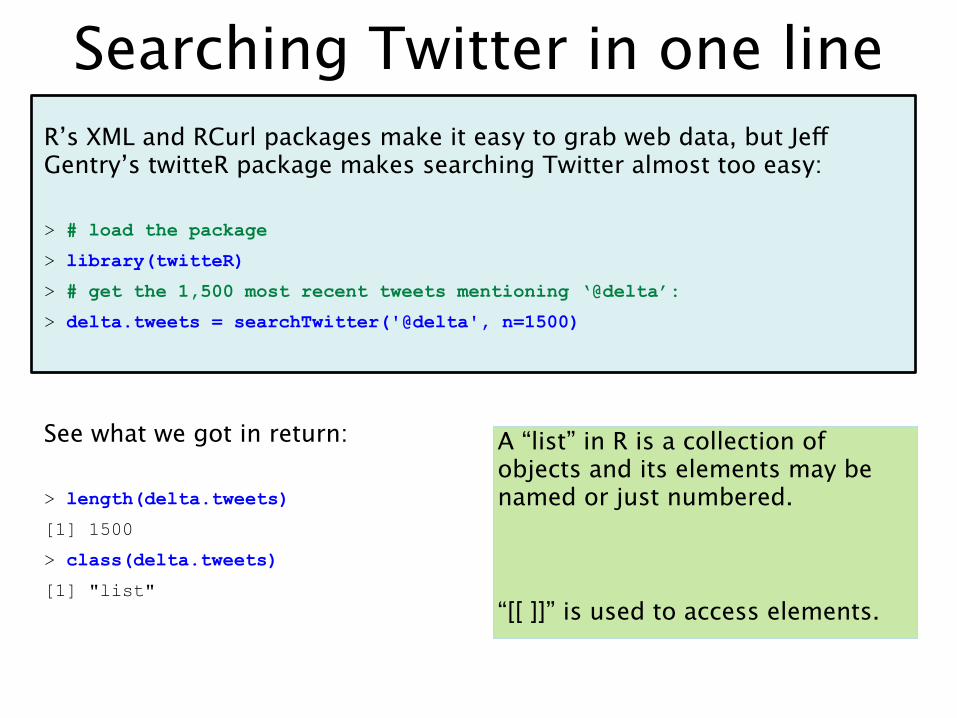
Searching Twitter in one lineR’s XML and RCurl packages make it easy to grab web data, but Jeff Gentry’s twitteR package makes searching Twitter almost too easy:
> # load the package
> library(twitteR)
> # get the 1,500 most recent tweets mentioning ‘@delta’:
> delta.tweets = searchTwitter('@delta', n=1500)
See what we got in return:
> length(delta.tweets)
[1] 1500
> class(delta.tweets)
[1] "list"
A “list” in R is a collection of objects and its elements may be named or just numbered.
“[[ ]]” is used to access elements.
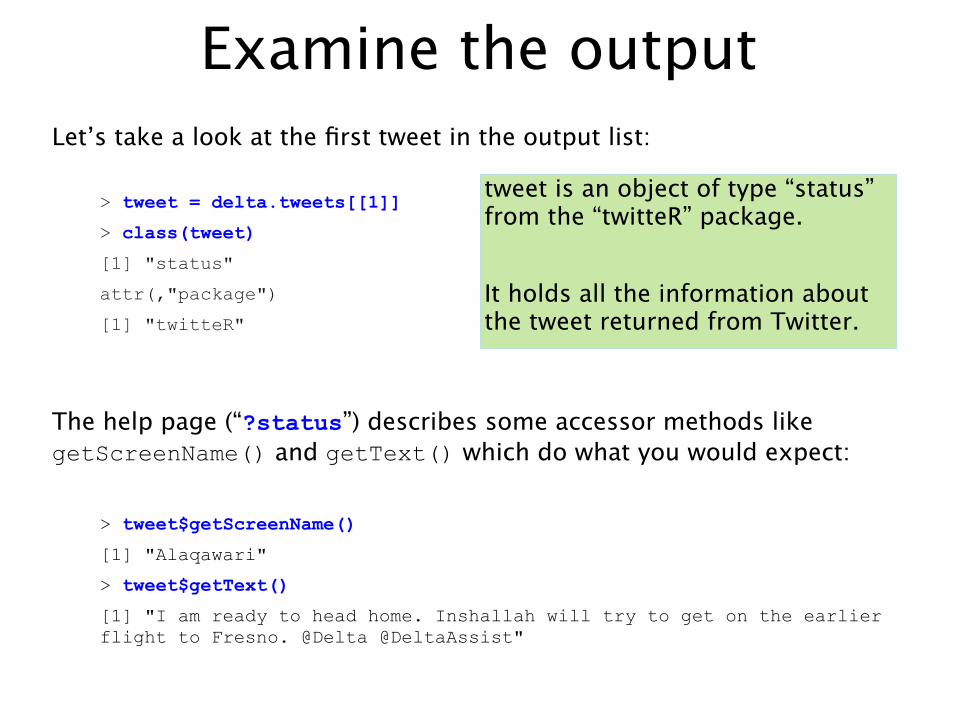
Examine the outputLet’s take a look at the first tweet in the output list:
> tweet = delta.tweets[[1]]
> class(tweet)
[1] "status"
attr(,"package")
[1] "twitteR"
The help page (“?status”) describes some accessor methods like getScreenName() and getText() which do what you would expect:
> tweet$getScreenName()
[1] "Alaqawari"
> tweet$getText()
[1] "I am ready to head home. Inshallah will try to get on the earlier flight to Fresno. @Delta @DeltaAssist"
tweet is an object of type “status” from the “twitteR” package.
It holds all the information about the tweet returned from Twitter.
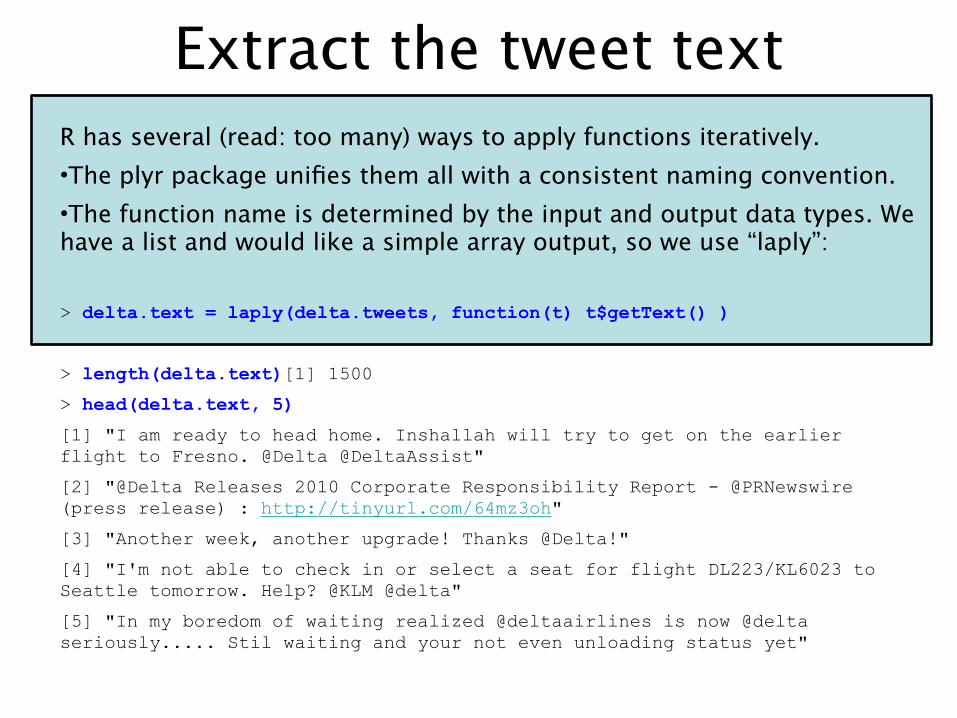
Extract the tweet textR has several (read: too many) ways to apply functions iteratively. •The plyr package unifies them all with a consistent naming convention.•The function name is determined by the input and output data types. We have a list and would like a simple array output, so we use “laply”:
> delta.text = laply(delta.tweets, function(t) t$getText() )
> length(delta.text)[1] 1500
> head(delta.text, 5)
[1] "I am ready to head home. Inshallah will try to get on the earlier flight to Fresno. @Delta @DeltaAssist"
[2] "@Delta Releases 2010 Corporate Responsibility Report - @PRNewswire (press release) : http://tinyurl.com/64mz3oh"
[3] "Another week, another upgrade! Thanks @Delta!"
[4] "I'm not able to check in or select a seat for flight DL223/KL6023 to Seattle tomorrow. Help? @KLM @delta"
[5] "In my boredom of waiting realized @deltaairlines is now @delta seriously..... Stil waiting and your not even unloading status yet"
19
Search Twitter for airline mentions & collect tweet text
Load sentiment word lists
Score sentiment for each tweet
Summarize for each airline
Compare Twitter sentiment with ACSI
satisfaction score
Scrape ACSI web site for airline customer satisfaction
scores
Game Plan
20
Estimating Sentiment
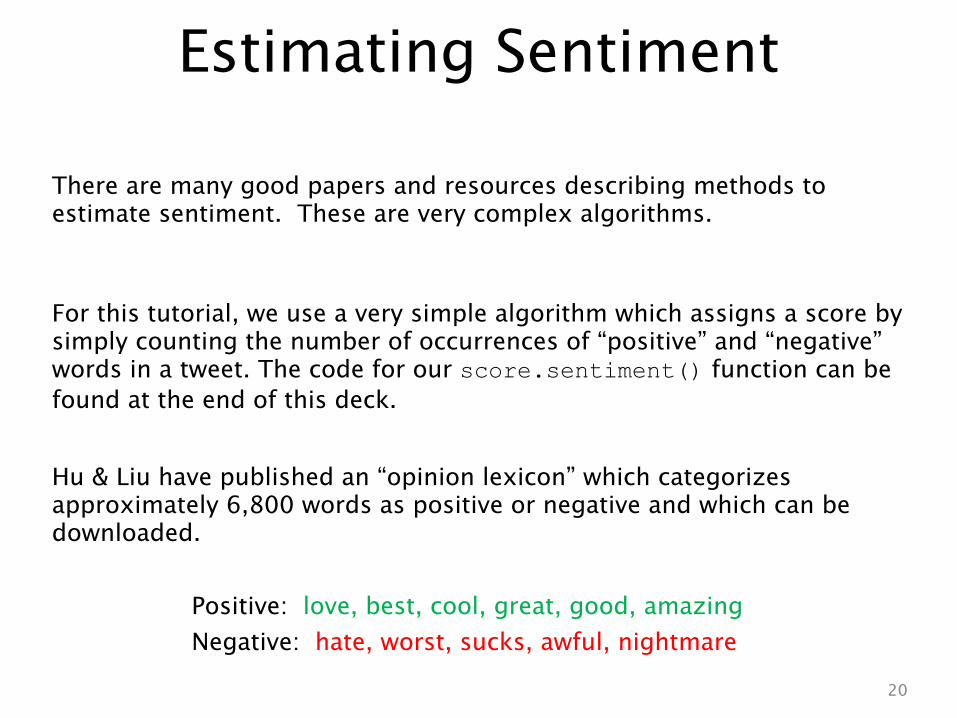
There are many good papers and resources describing methods to estimate sentiment. These are very complex algorithms.
For this tutorial, we use a very simple algorithm which assigns a score by simply counting the number of occurrences of “positive” and “negative” words in a tweet. The code for our score.sentiment() function can be found at the end of this deck.
Hu & Liu have published an “opinion lexicon” which categorizes approximately 6,800 words as positive or negative and which can be downloaded.
Positive: love, best, cool, great, good, amazingNegative: hate, worst, sucks, awful, nightmare
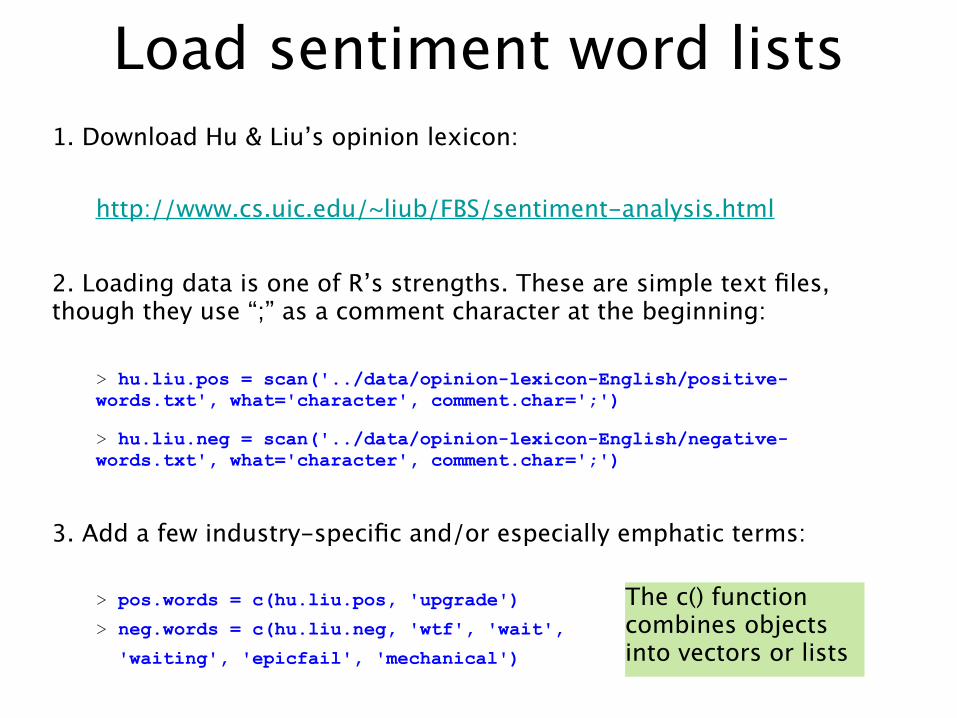
Load sentiment word lists1. Download Hu & Liu’s opinion lexicon:
http://www.cs.uic.edu/~liub/FBS/sentiment-analysis.html
2. Loading data is one of R’s strengths. These are simple text files, though they use “;” as a comment character at the beginning:
> hu.liu.pos = scan('../data/opinion-lexicon-English/positive-words.txt', what='character', comment.char=';')
> hu.liu.neg = scan('../data/opinion-lexicon-English/negative-words.txt', what='character', comment.char=';')
3. Add a few industry-specific and/or especially emphatic terms:
> pos.words = c(hu.liu.pos, 'upgrade')
> neg.words = c(hu.liu.neg, 'wtf', 'wait',
'waiting', 'epicfail', 'mechanical')
The c() function combines objects into vectors or lists
22
Search Twitter for airline mentions & collect tweet text
Load sentiment word lists
Score sentiment for each tweet
Summarize for each airline
Compare Twitter sentiment with ACSI
satisfaction score
Scrape ACSI web site for airline customer satisfaction
scores
Game Plan
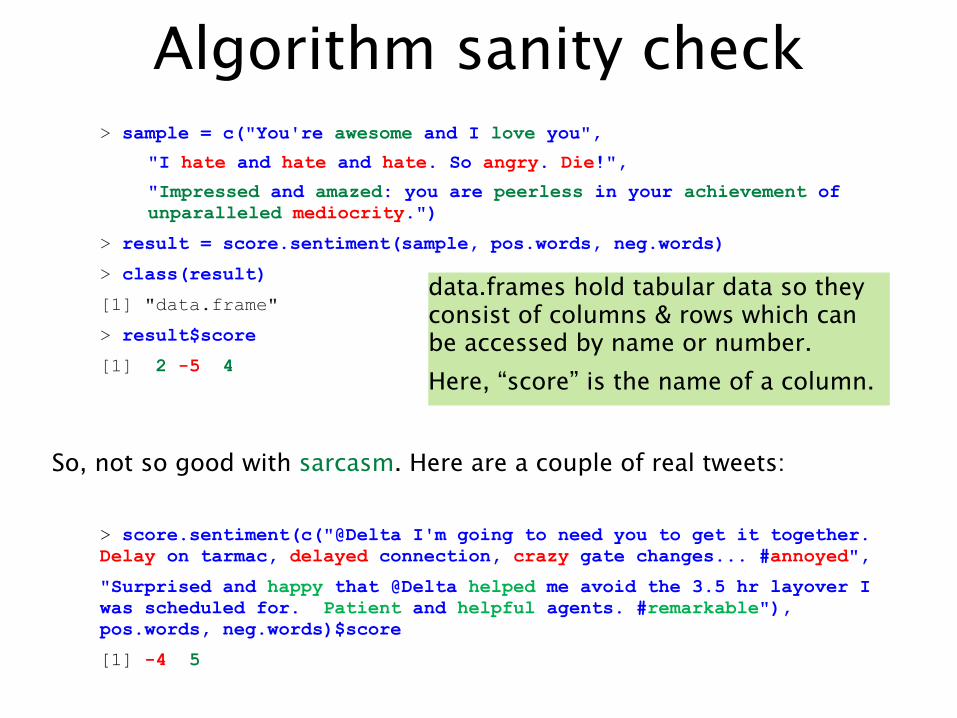
Algorithm sanity check> sample = c("You're awesome and I love you",
"I hate and hate and hate. So angry. Die!",
"Impressed and amazed: you are peerless in your achievement of unparalleled mediocrity.")
> result = score.sentiment(sample, pos.words, neg.words)
> class(result)
[1] "data.frame"
> result$score
[1] 2 -5 4
So, not so good with sarcasm. Here are a couple of real tweets:
> score.sentiment(c("@Delta I'm going to need you to get it together. Delay on tarmac, delayed connection, crazy gate changes... #annoyed",
"Surprised and happy that @Delta helped me avoid the 3.5 hr layover I was scheduled for. Patient and helpful agents. #remarkable"), pos.words, neg.words)$score
[1] -4 5
data.frames hold tabular data so they consist of columns & rows which can be accessed by name or number.Here, “score” is the name of a column.
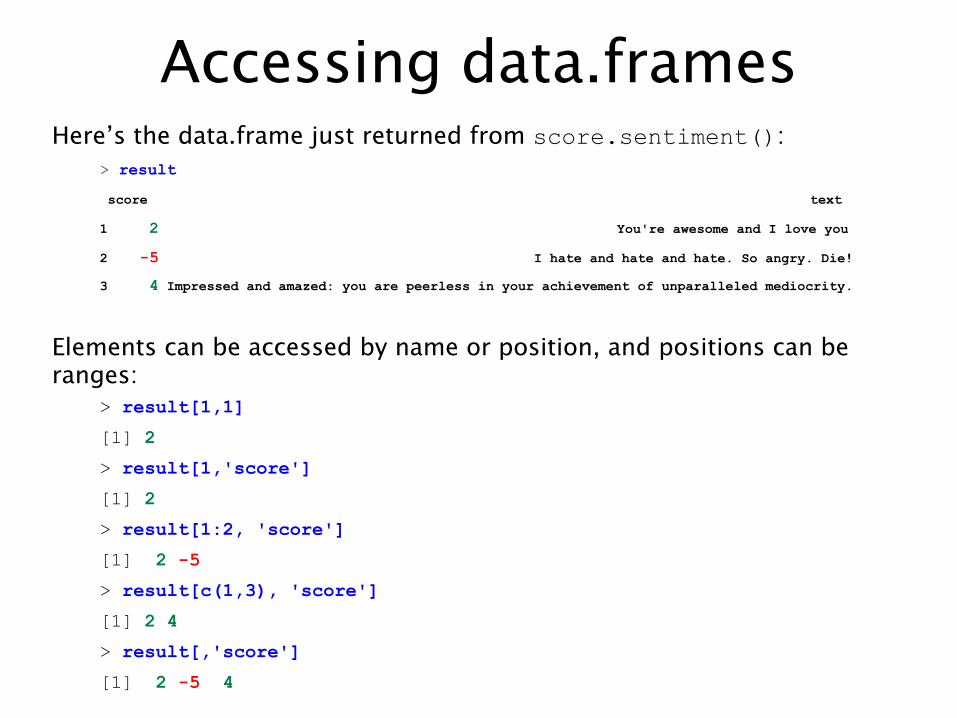
Accessing data.framesHere’s the data.frame just returned from score.sentiment():
> result
score text
1 2 You're awesome and I love you
2 -5 I hate and hate and hate. So angry. Die!
3 4 Impressed and amazed: you are peerless in your achievement of unparalleled mediocrity.
Elements can be accessed by name or position, and positions can be ranges:
> result[1,1]
[1] 2
> result[1,'score']
[1] 2
> result[1:2, 'score']
[1] 2 -5
> result[c(1,3), 'score']
[1] 2 4
> result[,'score']
[1] 2 -5 4
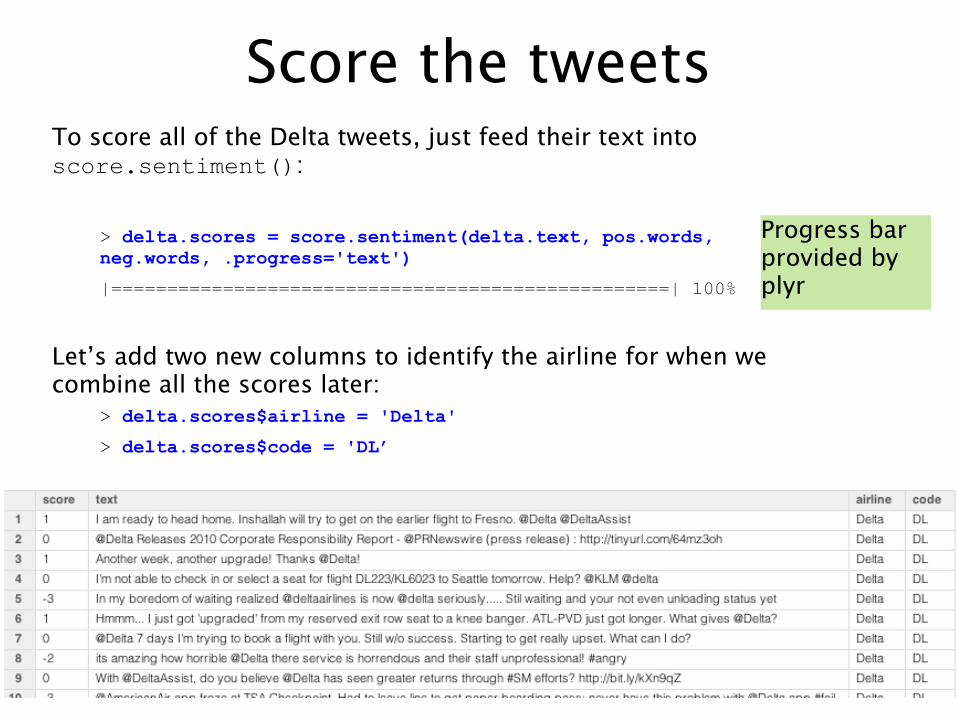
Score the tweetsTo score all of the Delta tweets, just feed their text into score.sentiment():
> delta.scores = score.sentiment(delta.text, pos.words, neg.words, .progress='text')
|==================================================| 100%
Let’s add two new columns to identify the airline for when we combine all the scores later:
> delta.scores$airline = 'Delta'
> delta.scores$code = 'DL’
Progress bar provided by plyr
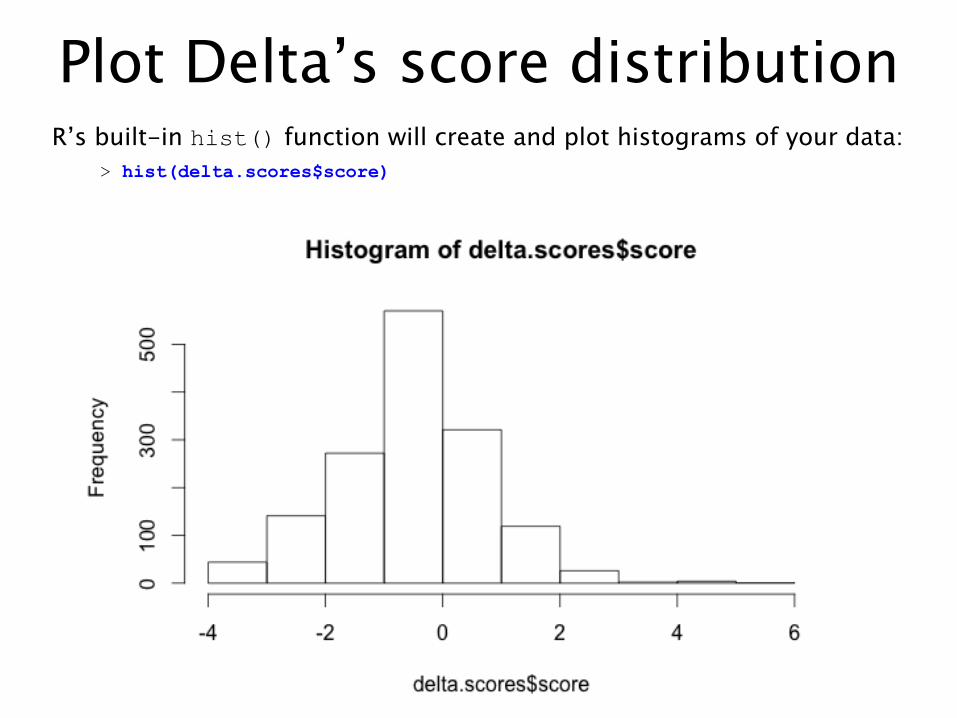
Plot Delta’s score distributionR’s built-in hist() function will create and plot histograms of your data:
> hist(delta.scores$score)
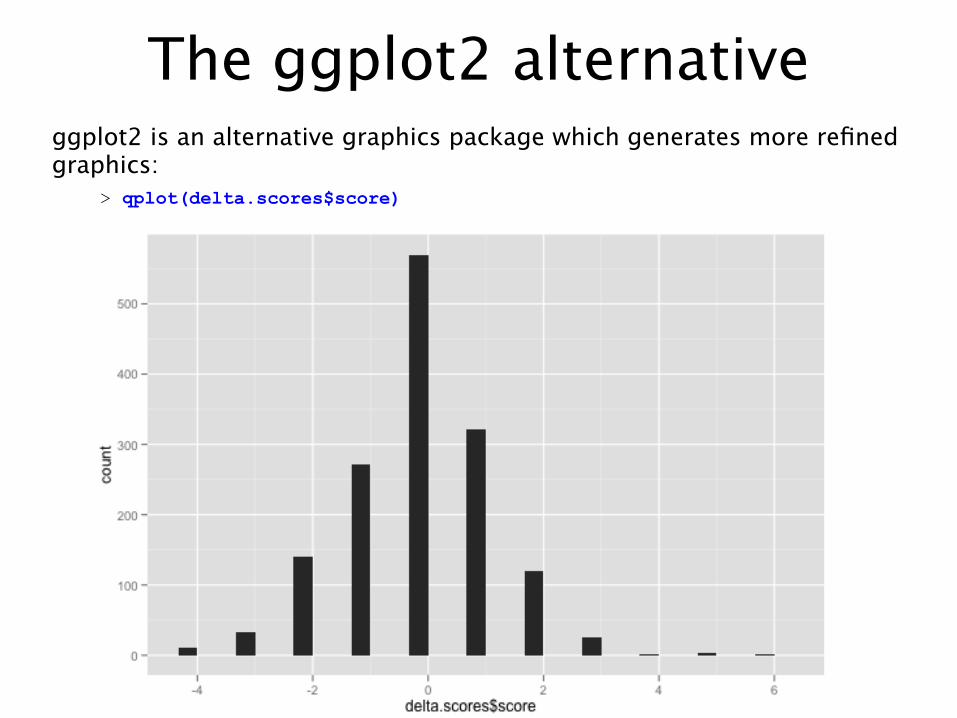
The ggplot2 alternativeggplot2 is an alternative graphics package which generates more refined graphics:
> qplot(delta.scores$score)
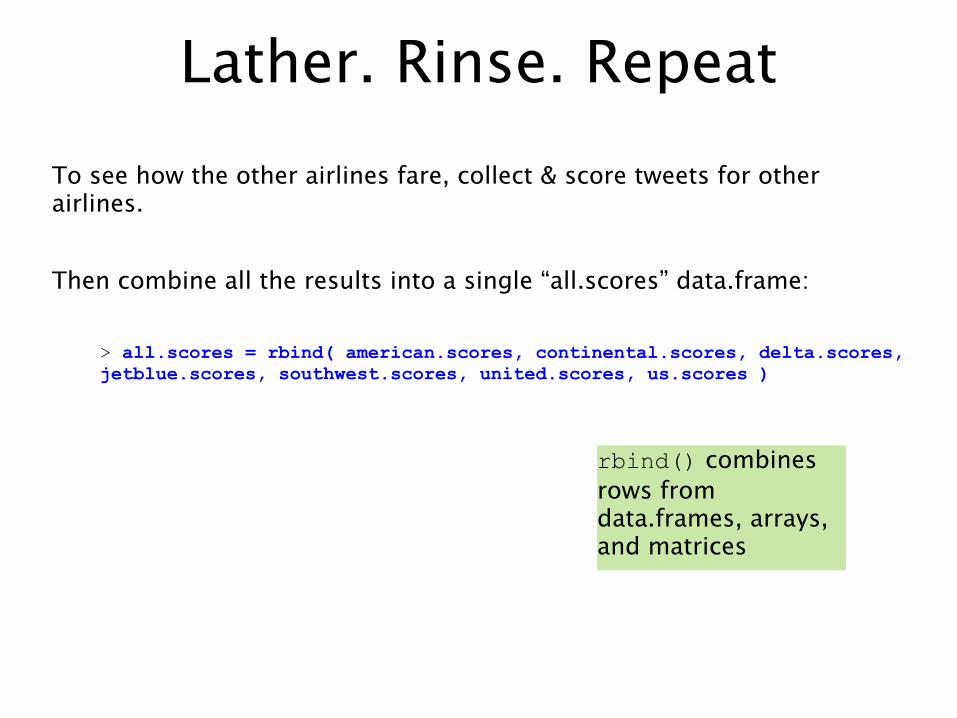
Lather. Rinse. RepeatTo see how the other airlines fare, collect & score tweets for other airlines.
Then combine all the results into a single “all.scores” data.frame:
> all.scores = rbind( american.scores, continental.scores, delta.scores, jetblue.scores, southwest.scores, united.scores, us.scores )
rbind() combines rows from data.frames, arrays, and matrices
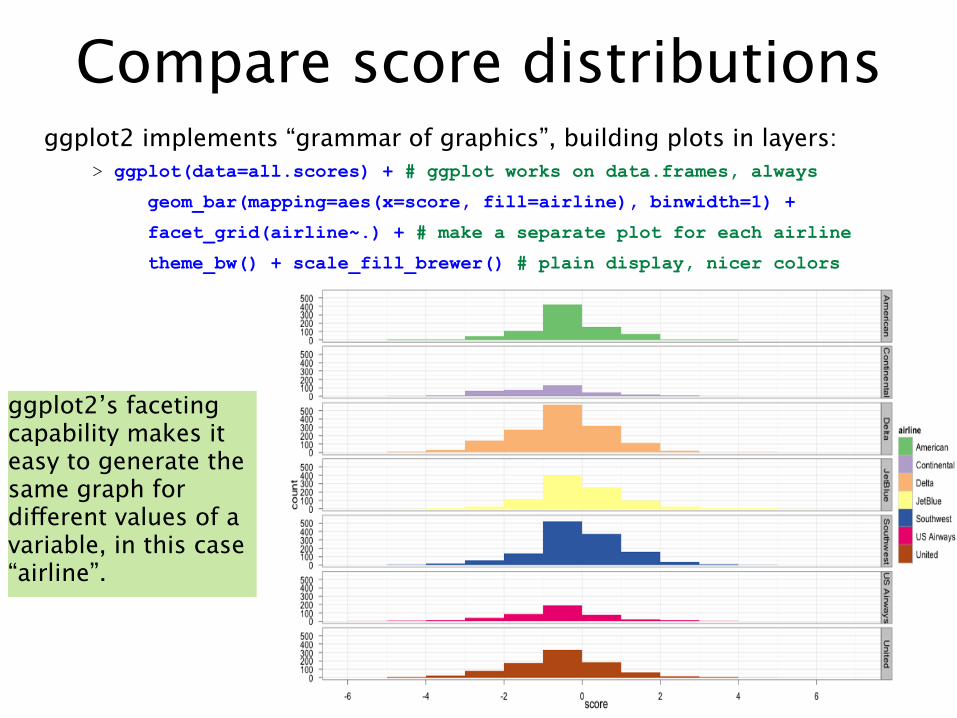
Compare score distributionsggplot2 implements “grammar of graphics”, building plots in layers:
> ggplot(data=all.scores) + # ggplot works on data.frames, always
geom_bar(mapping=aes(x=score, fill=airline), binwidth=1) +
facet_grid(airline~.) + # make a separate plot for each airline
theme_bw() + scale_fill_brewer() # plain display, nicer colors
ggplot2’s faceting capability makes it easy to generate the same graph for different values of a variable, in this case “airline”.
30
Search Twitter for airline mentions & collect tweet text
Load sentiment word lists
Score sentiment for each tweet
Summarize for each airline
Compare Twitter sentiment with ACSI
satisfaction score
Scrape ACSI web site for airline customer satisfaction
scores
Game Plan
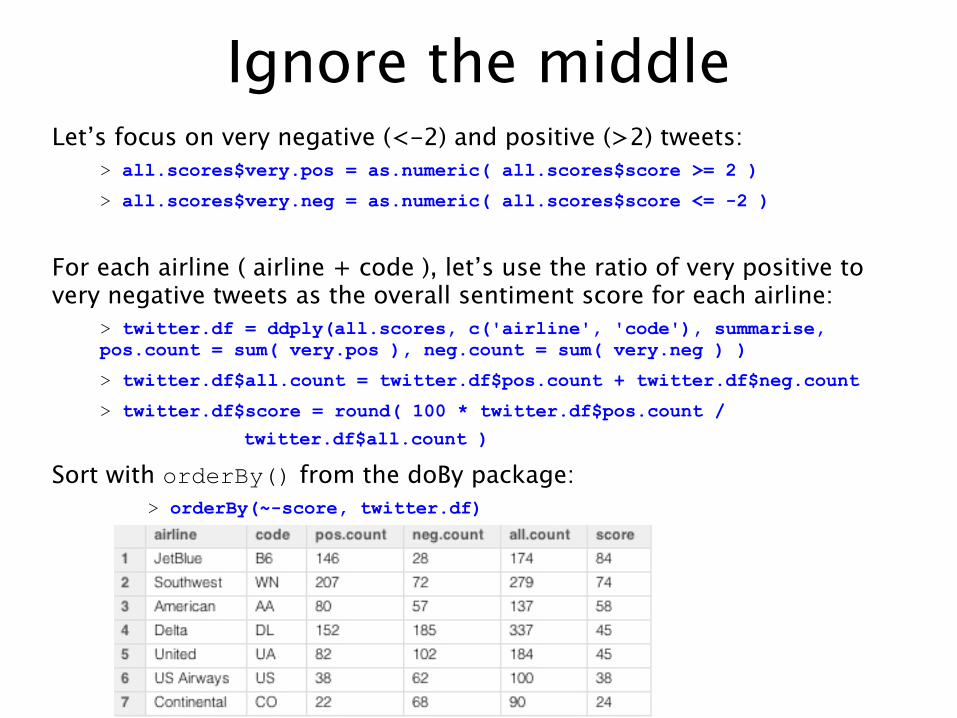
Ignore the middleLet’s focus on very negative (<-2) and positive (>2) tweets:
> all.scores$very.pos = as.numeric( all.scores$score >= 2 )
> all.scores$very.neg = as.numeric( all.scores$score <= -2 )
For each airline ( airline + code ), let’s use the ratio of very positive to very negative tweets as the overall sentiment score for each airline:
> twitter.df = ddply(all.scores, c('airline', 'code'), summarise, pos.count = sum( very.pos ), neg.count = sum( very.neg ) )
> twitter.df$all.count = twitter.df$pos.count + twitter.df$neg.count
> twitter.df$score = round( 100 * twitter.df$pos.count /
twitter.df$all.count )
Sort with orderBy() from the doBy package:> orderBy(~-score, twitter.df)
18
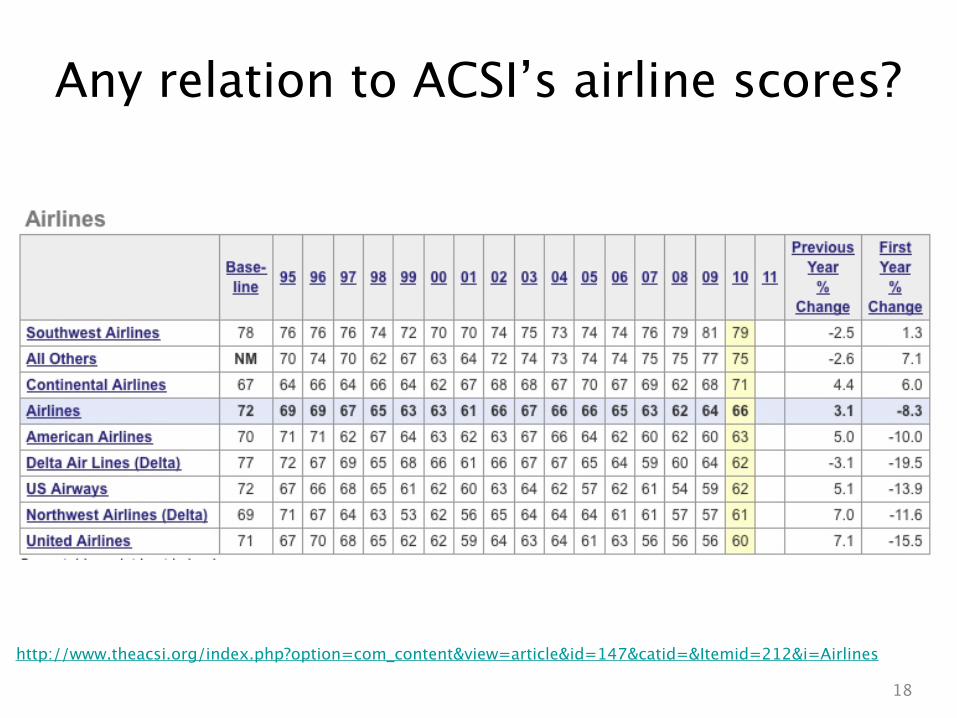
Any relation to ACSI’s airline scores?
http://www.theacsi.org/index.php?option=com_content&view=article&id=147&catid=&Itemid=212&i=Airlines
33
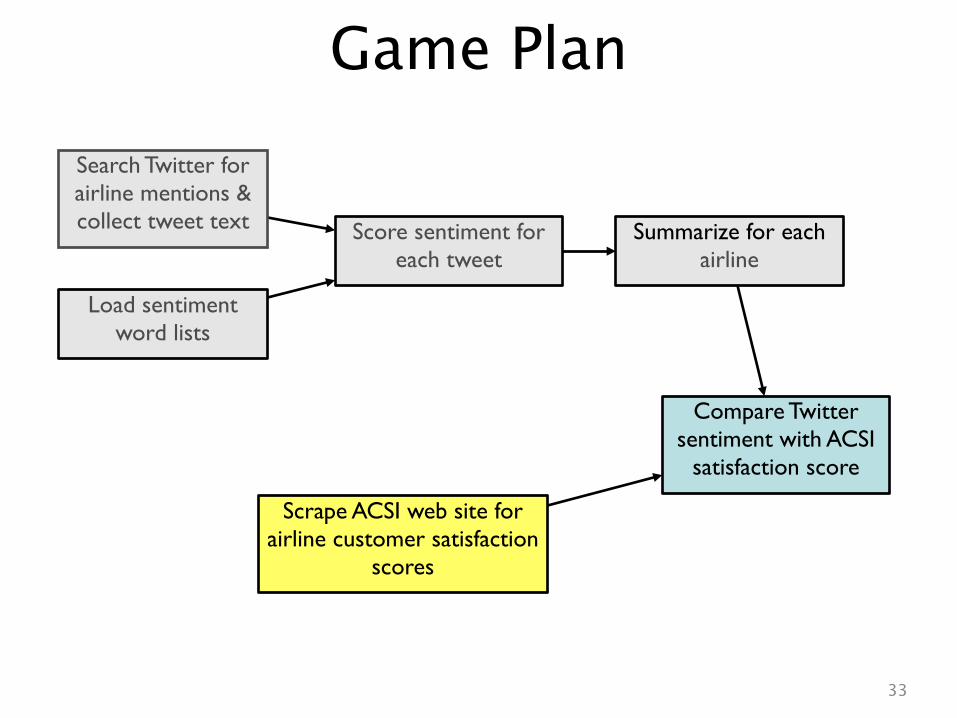
Search Twitter for airline mentions & collect tweet text
Load sentiment word lists
Score sentiment for each tweet
Summarize for each airline
Compare Twitter sentiment with ACSI
satisfaction score
Scrape ACSI web site for airline customer satisfaction
scores
Game Plan
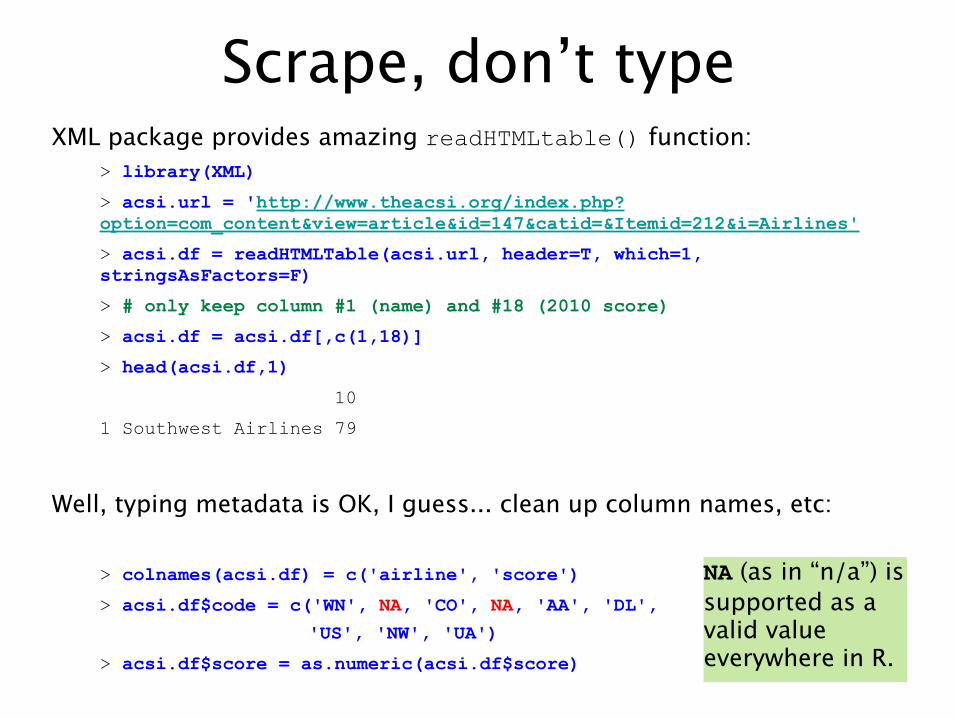
Scrape, don’t typeXML package provides amazing readHTMLtable() function:
> library(XML)
> acsi.url = 'http://www.theacsi.org/index.php?option=com_content&view=article&id=147&catid=&Itemid=212&i=Airlines'
> acsi.df = readHTMLTable(acsi.url, header=T, which=1, stringsAsFactors=F)
> # only keep column #1 (name) and #18 (2010 score)
> acsi.df = acsi.df[,c(1,18)]
> head(acsi.df,1)
10
1 Southwest Airlines 79
Well, typing metadata is OK, I guess... clean up column names, etc:
> colnames(acsi.df) = c('airline', 'score')
> acsi.df$code = c('WN', NA, 'CO', NA, 'AA', 'DL',
'US', 'NW', 'UA')
> acsi.df$score = as.numeric(acsi.df$score)
NA (as in “n/a”) is supported as a valid value everywhere in R.
35
Search Twitter for airline mentions & collect tweet text
Load sentiment word lists
Score sentiment for each tweet
Summarize for each airline
Compare Twitter sentiment with ACSI
satisfaction score
Scrape ACSI web site for airline customer satisfaction
scores
Game Plan
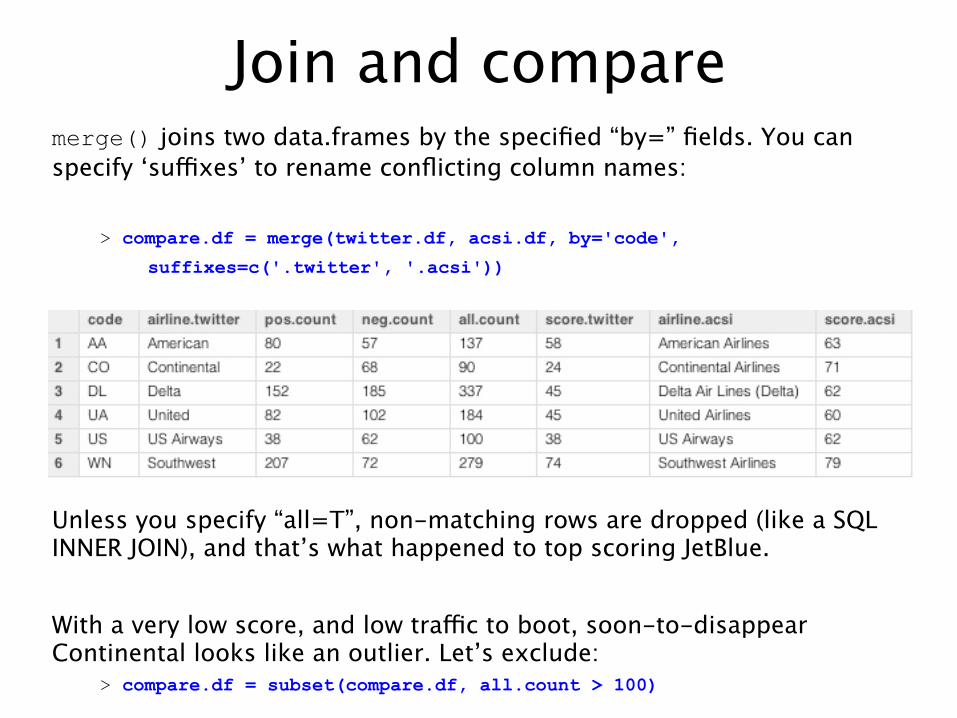
Join and comparemerge() joins two data.frames by the specified “by=” fields. You can specify ‘suffixes’ to rename conflicting column names:
> compare.df = merge(twitter.df, acsi.df, by='code',
suffixes=c('.twitter', '.acsi'))
Unless you specify “all=T”, non-matching rows are dropped (like a SQL INNER JOIN), and that’s what happened to top scoring JetBlue.
With a very low score, and low traffic to boot, soon-to-disappear Continental looks like an outlier. Let’s exclude:
> compare.df = subset(compare.df, all.count > 100)
3721
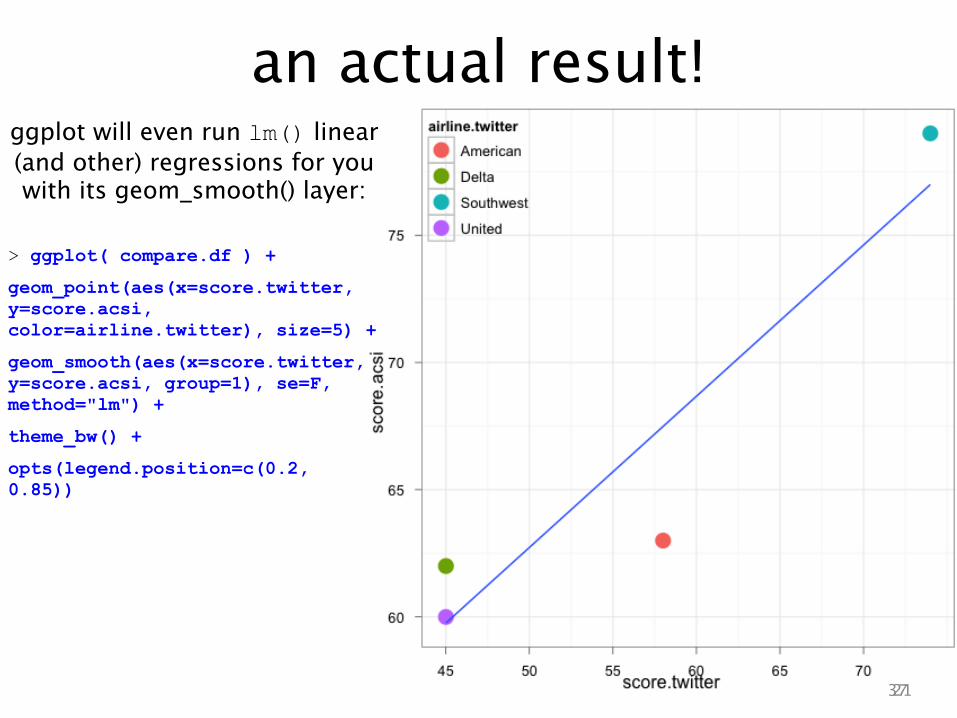
an actual result!ggplot will even run lm() linear (and other) regressions for you with its geom_smooth() layer:
> ggplot( compare.df ) +
geom_point(aes(x=score.twitter, y=score.acsi, color=airline.twitter), size=5) +
geom_smooth(aes(x=score.twitter, y=score.acsi, group=1), se=F, method="lm") +
theme_bw() +
opts(legend.position=c(0.2, 0.85))
39
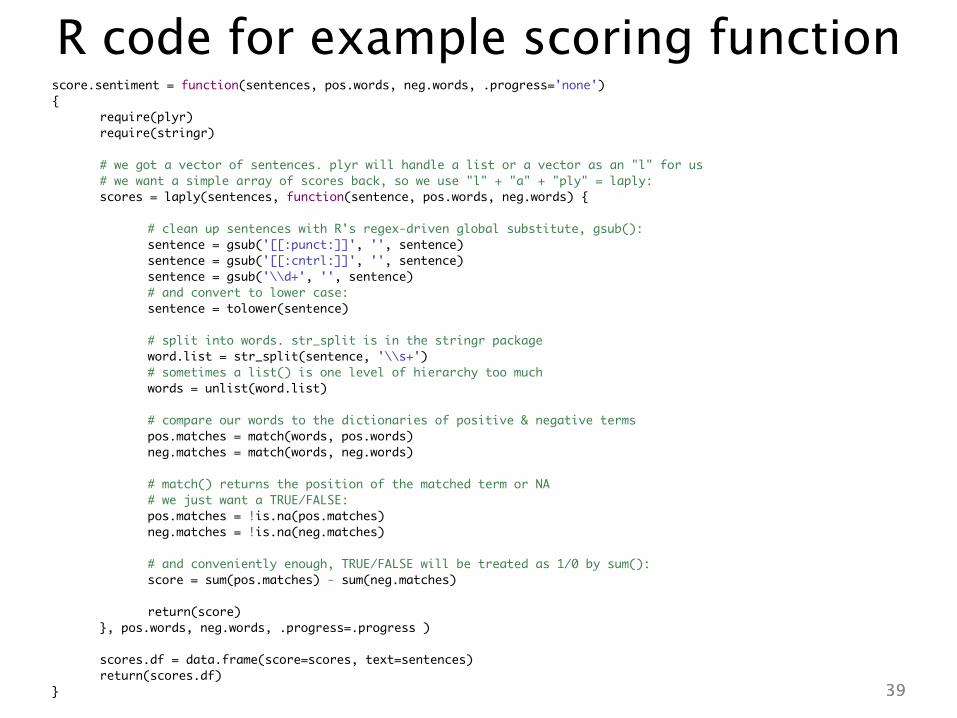
R code for example scoring functionscore.sentiment = function(sentences, pos.words, neg.words, .progress='none'){ require(plyr) require(stringr) # we got a vector of sentences. plyr will handle a list or a vector as an "l" for us # we want a simple array of scores back, so we use "l" + "a" + "ply" = laply: scores = laply(sentences, function(sentence, pos.words, neg.words) { # clean up sentences with R's regex-driven global substitute, gsub(): sentence = gsub('[[:punct:]]', '', sentence) sentence = gsub('[[:cntrl:]]', '', sentence) sentence = gsub('\\d+', '', sentence) # and convert to lower case: sentence = tolower(sentence)
# split into words. str_split is in the stringr package word.list = str_split(sentence, '\\s+') # sometimes a list() is one level of hierarchy too much words = unlist(word.list)
# compare our words to the dictionaries of positive & negative terms pos.matches = match(words, pos.words) neg.matches = match(words, neg.words) # match() returns the position of the matched term or NA # we just want a TRUE/FALSE: pos.matches = !is.na(pos.matches) neg.matches = !is.na(neg.matches)
# and conveniently enough, TRUE/FALSE will be treated as 1/0 by sum(): score = sum(pos.matches) - sum(neg.matches)
return(score) }, pos.words, neg.words, .progress=.progress )
scores.df = data.frame(score=scores, text=sentences) return(scores.df)} 39


![Twitter Mining: The Case of 2014 Indonesian Legislative Electionsaltair.chonnam.ac.kr/~kbkim/papers/[2014 IJSEIA]Twitter... · 2014-12-15 · applied text mining methods to know what](https://img.pdfslide.net/doc/110x75/5f0e7bdc7e708231d43f77c4/twitter-mining-the-case-of-2014-indonesian-legislative-kbkimpapers2014-ijseiatwitter.jpg)