Embed Size (px)
Citation preview
Two-Dimensional Floating Strip Micromegas Detectors
Felix Klitznera, Jona Bortfeldtb,a
a.) Ludwig-Maximilians-Universitat Munchenb.) CERN
RD51 Collaboration MeetingMunchen
20.06.2018
F. Klitzner (LMU) 2d-FSMM Detectors 20/06/2018 1 / 15
Outline
1 IntroductionFloating Strip Micromegas with One-Dimensional Readout
2 Two-Dimensional Floating Strip MicromegasFirst Measurements: Heidelberg Ion Therapy CenterSignal Simulation with ANSYS and Garfield++Three Different Optimized Anode DesignsMeasurement Results: 20 MeV Protons and 150 GeV Muons/Pions
3 Summary
F. Klitzner (LMU) 2d-FSMM Detectors 20/06/2018 2 / 15
Floating Strip Micromegas with 1d Readout
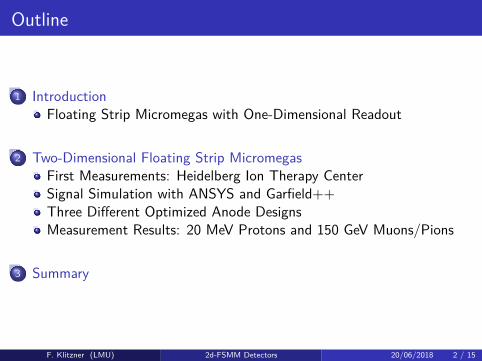
MICROMEsh GASeous detectorsdrift regionÑ collecting ionization chargeamplification regionÑ electron avalanchefast signals O(100 ns)Ñ high-rate capabilitychallenge: dischargesÑ non-destructive but dead timeÑ efficiency drop @ high particlerates or high rate backgroundsolution: ’floating’ copper stripsanode strips individually connectedto HV via high ohmic resistorssignals decoupled capacitively
Ñ discharge confined to few stripsÑ fast recovery after discharge
+500V
-200Vcathode
mesh
copperanode strips
pillars 150μm
6mmNe:CF4
500μm 300μm
0.3kV/cm
33kV/cm
recharge R
copper readout strips
drift region
amplification region(Ar:CO2)
charged particle
signal decoupling: congruent readout stripsÑ excellent spatial resolution (100 µm) andefficiency (ą98%) at 7 MHz/cm2
question: two-dimensional strip readout?
F. Klitzner (LMU) 2d-FSMM Detectors 20/06/2018 3 / 15
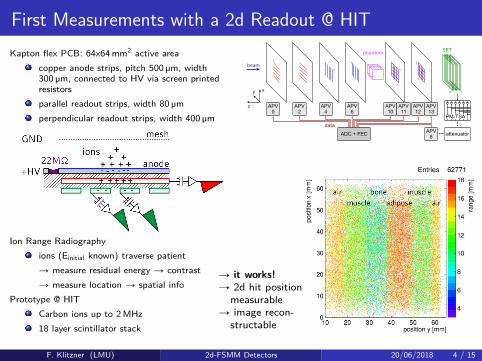
First Measurements with a 2d Readout @ HITKapton flex PCB: 64x64 mm2 active area
copper anode strips, pitch 500 µm, width300 µm, connected to HV via screen printedresistorsparallel readout strips, width 80 µmperpendicular readout strips, width 400 µm
Ion Range Radiographyions (Einitial known) traverse patientÑ measure residual energy Ñ contrastÑ measure location Ñ spatial info
Prototype @ HITCarbon ions up to 2 MHz18 layer scintillator stack
1
1
1
1
1
1
1
1
18 1
PM-TSA
attenuator
APV0
APV2
APV4
APV6
APV10
APV11
APV12
APV13
z
xy
data
beam
phantom
APV8ADC + FEC
SRT
F. Klitzner (LMU) 2d-FSMM Detectors 20/06/2018 4 / 15
Ñ it works!Ñ 2d hit position
measurableÑ image recon-
structable
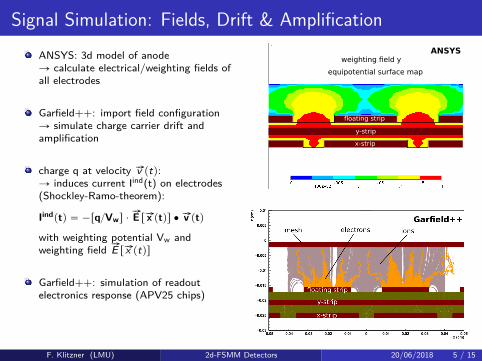
Signal Simulation: Fields, Drift & AmplificationANSYS: 3d model of anodeÑ calculate electrical/weighting fields ofall electrodes
Garfield++: import field configurationÑ simulate charge carrier drift andamplification
charge q at velocity #�v ptq:Ñ induces current Iind(t) on electrodes(Shockley-Ramo-theorem):
Iindptq “ ´rq{Vws ¨#�E r #�x ptqs ‚ #�v ptq
with weighting potential Vw andweighting field #�E r #�x ptqs
Garfield++: simulation of readoutelectronics response (APV25 chips)
weighting field yANSYS
equipotential surface map
x-strip
floating strip
y-strip
F. Klitzner (LMU) 2d-FSMM Detectors 20/06/2018 5 / 15
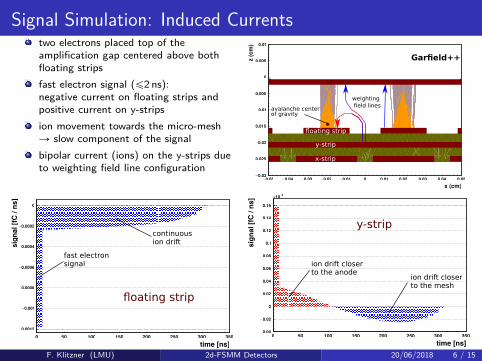
Signal Simulation: Induced Currentstwo electrons placed top of theamplification gap centered above bothfloating stripsfast electron signal (ď2 ns):negative current on floating strips andpositive current on y-stripsion movement towards the micro-meshÑ slow component of the signalbipolar current (ions) on the y-strips dueto weighting field line configuration
time [ns]0 50 100 150 200 250 300 350
sign
al [f
C /
ns]
0.0012−
0.001−
0.0008−
0.0006−
0.0004−
0.0002−
0
fast electronsignal
continuousion drift
floating strip
x (cm)0.05− 0.04− 0.03− 0.02− 0.01− 0 0.01 0.02 0.03 0.04 0.05
z (c
m)
0.03−
0.025−
0.02−
0.015−
0.01−
0.005−
0
0.005
0.01
avalanche centerof gravity
weighting field lines
Garfield++
floating strip
y-strip
x-strip
time [ns]0 50 100 150 200 250 300 350
sign
al [f
C /
ns]
0.04−
0.02−
0
0.02
0.04
0.06
0.08
0.1
0.12
0.14
0.16
3−10×
ion drift closer to the anode
ion drift closer to the mesh
y-strip
F. Klitzner (LMU) 2d-FSMM Detectors 20/06/2018 6 / 15
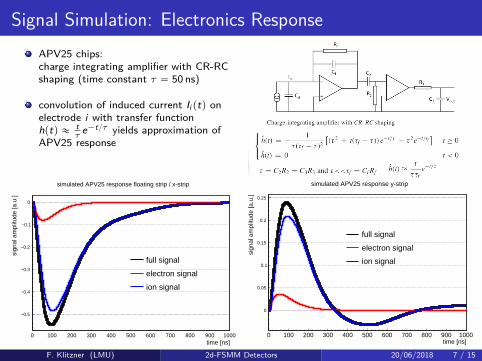
Signal Simulation: Electronics ResponseAPV25 chips:charge integrating amplifier with CR-RCshaping (time constant τ “ 50 ns)
convolution of induced current Ii ptq onelectrode i with transfer functionhptq « t
τe´t{τ yields approximation of
APV25 response
0 100 200 300 400 500 600 700 800 900 1000time [ns]
0.5−
0.4−
0.3−
0.2−
0.1−
0
sign
al a
mpl
itude
[a.u
.]
full signal
electron signal
ion signal
simulated APV25 response floating strip / x-strip
0 100 200 300 400 500 600 700 800 900 1000time [ns]
0
0.05
0.1
0.15
0.2
0.25
sign
al a
mpl
itude
[a.u
.]
full signal
electron signal
ion signal
simulated APV25 response y-strip
F. Klitzner (LMU) 2d-FSMM Detectors 20/06/2018 7 / 15
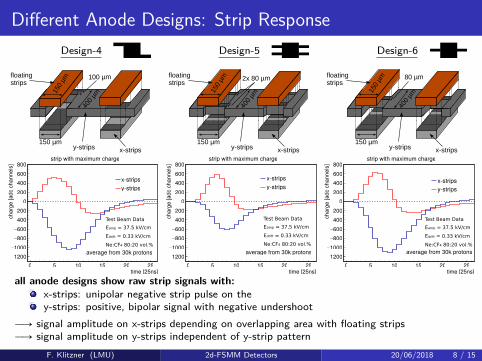
Different Anode Designs: Strip ResponseDesign-4
x-stripsy-strips
floating strips
150 µm
150
µm
100 µm 40
0 µm
0 5 10 15 20 25time [25ns]
1200−
1000−
800−
600−
400−
200−
0200400600800
char
ge [a
dc c
hann
els]
x-stripsy-strips
strip with maximum charge
Test Beam Data
Eamp = 37.5 kV/cm
Edrift = 0.33 kV/cm
Ne:CF4 80:20 vol.%
average from 30k protons
Design-5
x-stripsy-strips
floating strips
150 µm
2x 80 µm
400
µm 15
0 µm
0 5 10 15 20 25time [25ns]
1200−
1000−
800−
600−
400−
200−
0200400600800
char
ge [a
dc c
hann
els]
x-stripsy-strips
strip with maximum charge
Eamp = 37.5 kV/cm
Edrift = 0.33 kV/cm
Ne:CF4 80:20 vol.%
average from 30k protons
Test Beam Data
Eamp = 37.5 kV/cm
Edrift = 0.33 kV/cm
Ne:CF4 80:20 vol.%
Design-6
x-stripsy-strips
floating strips
150 µm
80 µm
400
µm 15
0 µm
0 5 10 15 20 25time [25ns]
1200−
1000−
800−
600−
400−
200−
0200400600800
char
ge [a
dc c
hann
els]
x-stripsy-strips
strip with maximum charge
Eamp = 37.5 kV/cm
Edrift = 0.33 kV/cm
Ne:CF4 80:20 vol.%
average from 30k protons
Test Beam Data
Eamp = 37.5 kV/cm
Edrift = 0.33 kV/cm
Ne:CF4 80:20 vol.%
all anode designs show raw strip signals with:x-strips: unipolar negative strip pulse on they-strips: positive, bipolar signal with negative undershoot
ÝÑ signal amplitude on x-strips depending on overlapping area with floating stripsÝÑ signal amplitude on y-strips independent of y-strip pattern
F. Klitzner (LMU) 2d-FSMM Detectors 20/06/2018 8 / 15
Measurement Results - 20 MeV Protons (1)
20 MeV proton beam
AP
V2 5
floating strip Micromegas,two-dimensional readout,128 strips
scintillator + photomultiplier
ADC + FEC
data
scaler
trigger
discriminator
zy
x
AP
V2 5
thin triple GEM,two-dimensional readout250 strips
36 37 38 39 40 41[kV/cm]ampE
0
0.2
0.4
0.6
0.8
1
strip
pul
se m
axim
um ra
tio y
/x
design-4design-5design-6
Test Beam Data
20 MeV protons
Ne:CF4 80:20 vol.%
Edrift = 0.33 kV/cm
electronics channel
saturation
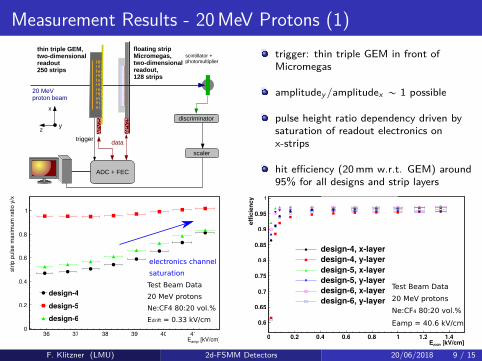
trigger: thin triple GEM in front ofMicromegas
amplitudey /amplitudex „ 1 possible
pulse height ratio dependency driven bysaturation of readout electronics onx-strips
hit efficiency (20 mm w.r.t. GEM) around95% for all designs and strip layers
0 0.2 0.4 0.6 0.8 1 1.2 1.4[kV/cm]driftE
0.6
0.65
0.7
0.75
0.8
0.85
0.9
0.95
1
effic
ienc
y
, micom 0drift
hit efficiency vs. E
design-4, x-layerdesign-4, y-layerdesign-5, x-layerdesign-5, y-layerdesign-6, x-layerdesign-6, y-layer
Test Beam Data
20 MeV protons
Ne:CF4 80:20 vol.%
Eamp = 40.6 kV/cm
F. Klitzner (LMU) 2d-FSMM Detectors 20/06/2018 9 / 15
Measurement Results - 20 MeV Protons (2)
protons
AP
V2
5
AP
V2
5z
y
x APV2
5 APV2
5
θ
x-inclination angle
x
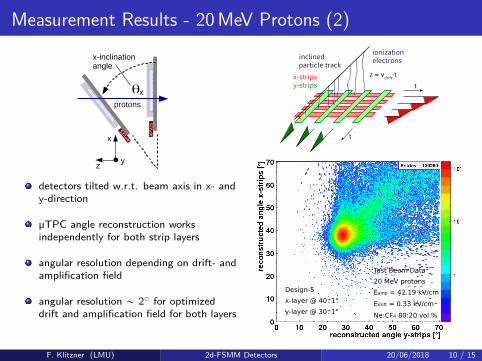
detectors tilted w.r.t. beam axis in x- andy-direction
µTPC angle reconstruction worksindependently for both strip layers
angular resolution depending on drift- andamplification field
angular resolution „ 2˝ for optimizeddrift and amplification field for both layers
t
t
inclinedparticle track
z = vdrift·t
ionizationelectrons
x-stripsy-strips
Test Beam Data
20 MeV protons
Eamp = 42.19 kV/cm
Edrift = 0.33 kV/cm
Ne:CF4 80:20 vol.%
Design-5
x-layer @ 40 1°
y-layer @ 30 1°
+-
+-
F. Klitzner (LMU) 2d-FSMM Detectors 20/06/2018 10 / 15
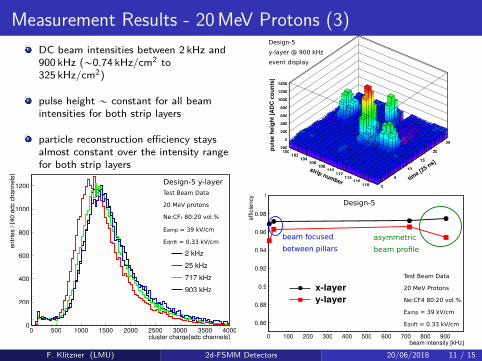
Measurement Results - 20 MeV Protons (3)DC beam intensities between 2 kHz and900 kHz („0.74 kHz/cm2 to325 kHz/cm2)
pulse height „ constant for all beamintensities for both strip layers
particle reconstruction efficiency staysalmost constant over the intensity rangefor both strip layers
0 500 1000 1500 2000 2500 3000 3500 4000cluster charge [adc channels]
0
200
400
600
800
1000
1200
entri
es /
[40
adc
chan
nels
]
2 kHz25 kHz717 kHz903 kHz
Test Beam Data
20 MeV protons
Ne:CF4 80:20 vol.%
Eamp = 39 kV/cm
Edrift = 0.33 kV/cm
Design-5 y-layer
100102
104106
108110
112114
116118
strip number0
5
10
15
20
25
time [25 ns]
200−
0
200
400
600
800
1000
1200
1400
puls
e he
ight
[AD
C c
ount
s]
Design-5
y-layer @ 900 kHz
event display
0 100 200 300 400 500 600 700 800 900beam intensity [kHz]
0.86
0.88
0.9
0.92
0.94
0.96
0.98
1
effic
ienc
y
x-layery-layer
Test Beam Data
20 MeV Protons
Ne:CF4 80:20 vol.%
Eamp = 39 kV/cm
Edrift = 0.33 kV/cm
Design-5
asymmetric
beam profile
beam focused
between pillars
F. Klitzner (LMU) 2d-FSMM Detectors 20/06/2018 11 / 15
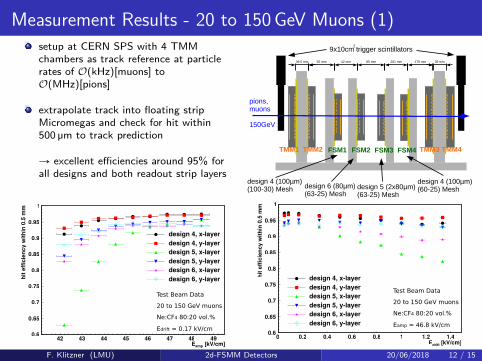
Measurement Results - 20 to 150 GeV Muons (1)setup at CERN SPS with 4 TMMchambers as track reference at particlerates of O(kHz)[muons] toO(MHz)[pions]
extrapolate track into floating stripMicromegas and check for hit within500 µm to track prediction
Ñ excellent efficiencies around 95% forall designs and both readout strip layers
42 43 44 45 46 47 48 49[kV/cm]ampE
0.6
0.65
0.7
0.75
0.8
0.85
0.9
0.95
1
hit e
ffici
ency
with
in 0
.5 m
m
design 4, x-layerdesign 4, y-layerdesign 5, x-layerdesign 5, y-layerdesign 6, x-layerdesign 6, y-layer
Test Beam Data
20 to 150 GeV muons
Ne:CF4 80:20 vol.%
Edrift = 0.17 kV/cm
TMM1 TMM2 TMM3 TMM4FSM3 FSM4FSM2FSM1
design 4 (100µm)(100-30) Mesh
design 4 (100µm) (60-25) Meshdesign 5 (2x80µm)
(63-25) Meshdesign 6 (80µm) (63-25) Mesh
39 mm179 mm201 mm42 mm 85 mm39.5 mm 55 mm
pions,muons 150GeV
9x10cm trigger scintillators2
0 0.2 0.4 0.6 0.8 1 1.2 1.4[kV/cm]driftE
0.6
0.65
0.7
0.75
0.8
0.85
0.9
0.95
1
hit e
ffici
ency
with
in 0
.5 m
m
design 4, x-layerdesign 4, y-layerdesign 5, x-layerdesign 5, y-layerdesign 6, x-layerdesign 6, y-layer
Test Beam Data
20 to 150 GeV muons
Ne:CF4 80:20 vol.%
Eamp = 46.8 kV/cm
F. Klitzner (LMU) 2d-FSMM Detectors 20/06/2018 12 / 15
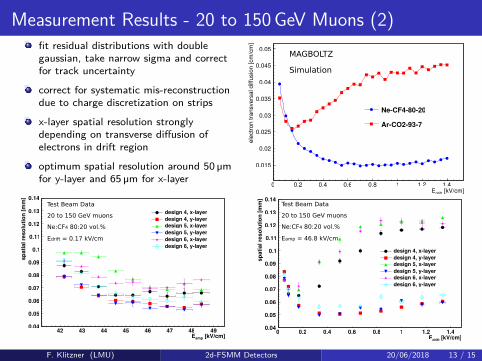
Measurement Results - 20 to 150 GeV Muons (2)fit residual distributions with doublegaussian, take narrow sigma and correctfor track uncertaintycorrect for systematic mis-reconstructiondue to charge discretization on stripsx-layer spatial resolution stronglydepending on transverse diffusion ofelectrons in drift regionoptimum spatial resolution around 50 µmfor y-layer and 65 µm for x-layer
42 43 44 45 46 47 48 49[kV/cm]ampE
0.04
0.05
0.06
0.07
0.08
0.09
0.1
0.11
0.12
0.13
0.14
spat
ial r
esol
utio
n [m
m]
design 4, x-layerdesign 4, y-layerdesign 5, x-layerdesign 5, y-layerdesign 6, x-layerdesign 6, y-layer
Test Beam Data
20 to 150 GeV muons
Ne:CF4 80:20 vol.%
Edrift = 0.17 kV/cm
0 0.2 0.4 0.6 0.8 1 1.2 1.4[kV/cm]driftE
0.015
0.02
0.025
0.03
0.035
0.04
0.045
0.05
elec
tron
trans
vers
al d
iffus
ion
[cm
/cm
]
Ne-CF4-80-20
Ar-CO2-93-7
MAGBOLTZ
Simulation
0 0.2 0.4 0.6 0.8 1 1.2 1.4[kV/cm]driftE
0.04
0.05
0.06
0.07
0.08
0.09
0.1
0.11
0.12
0.13
0.14
spat
ial r
esol
utio
n [m
m]
design 4, x-layerdesign 4, y-layerdesign 5, x-layerdesign 5, y-layerdesign 6, x-layerdesign 6, y-layer
Test Beam Data
20 to 150 GeV muons
Ne:CF4 80:20 vol.%
Eamp = 46.8 kV/cm
F. Klitzner (LMU) 2d-FSMM Detectors 20/06/2018 13 / 15
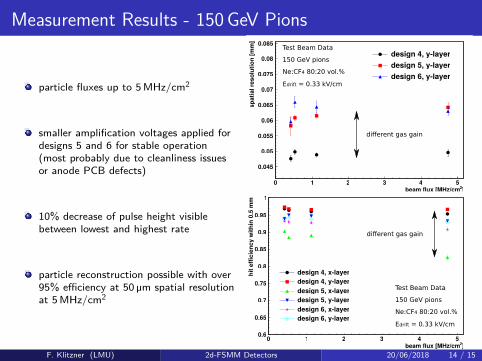
Measurement Results - 150 GeV Pions
particle fluxes up to 5 MHz/cm2
smaller amplification voltages applied fordesigns 5 and 6 for stable operation(most probably due to cleanliness issuesor anode PCB defects)
10% decrease of pulse height visiblebetween lowest and highest rate
particle reconstruction possible with over95% efficiency at 50 µm spatial resolutionat 5 MHz/cm2
0 1 2 3 4 5]2beam flux [MHz/cm
0.045
0.05
0.055
0.06
0.065
0.07
0.075
0.08
0.085
spat
ial r
esol
utio
n [m
m]
design 4, y-layerdesign 5, y-layerdesign 6, y-layer
Test Beam Data
150 GeV pions
Ne:CF4 80:20 vol.%
Edrift = 0.33 kV/cm
different gas gain
0 1 2 3 4 5]2beam flux [MHz/cm
0.6
0.65
0.7
0.75
0.8
0.85
0.9
0.95
1
hit e
ffici
ency
with
in 0
.5 m
m
design 4, x-layerdesign 4, y-layer design 5, x-layer design 5, y-layer design 6, x-layer design 6, y-layer
Test Beam Data
150 GeV pions
Ne:CF4 80:20 vol.%
Edrift = 0.33 kV/cm
different gas gain
F. Klitzner (LMU) 2d-FSMM Detectors 20/06/2018 14 / 15
Summary
different two-dimensional floating strip Micromegas designs have been presented
readout strip layers: different signal polarities, duration and amplitude
simulations explain signal formation and readout electronics responseÑ detector understood
similar pulse height on both readout strip layers can be reached
measurements with 20 MeV protons and 150 GeV muons/pions:Ñ hit efficiencies around 95% for all designs and strip layers
µTPC angle reconstruction possible on both strip layers independently:Ñ angular resolution around 2˝ for optimized drift- and amplification field
excellent spatial resolution:Ñ 65 µm on x-layer and 50 µm on y-layer at up to 5 MHz/cm2 beam flux
THANK YOUF. Klitzner (LMU) 2d-FSMM Detectors 20/06/2018 15 / 15
BACKUP
F. Klitzner (LMU) 2d-FSMM Detectors 20/06/2018 15 / 15
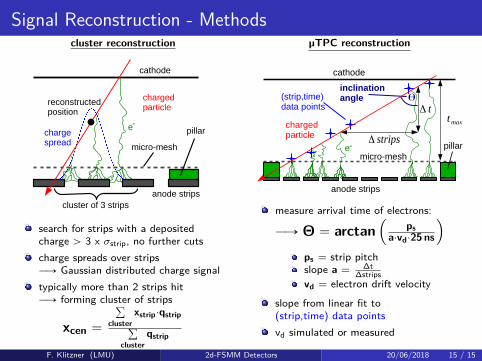
Signal Reconstruction - Methodscluster reconstruction
reconstructed position
cathode
micro-mesh
anode stripscluster of 3 strips
pillare-
charged particle
charge spread
search for strips with a depositedcharge ą 3 x σstrip, no further cutscharge spreads over stripsÝÑ Gaussian distributed charge signaltypically more than 2 strips hitÝÑ forming cluster of strips
xcen “
ř
clusterxstrip¨qstrip
ř
clusterqstrip
µTPC reconstruction
charged particle
cathode
micro-meshpillar
anode strips
e-
inclination angle
Δ strips
Δ ttmax
(strip,time) data points
θ
measure arrival time of electrons:
ÝÑ Θ “ arctan´
psa¨vd¨25 ns
¯
ps = strip pitchslope a = ∆t
∆stripsvd = electron drift velocity
slope from linear fit to(strip,time) data pointsvd simulated or measured
F. Klitzner (LMU) 2d-FSMM Detectors 20/06/2018 15 / 15
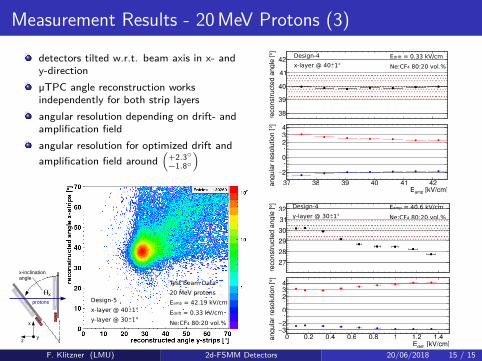
Measurement Results - 20 MeV Protons (3)
detectors tilted w.r.t. beam axis in x- andy-directionµTPC angle reconstruction worksindependently for both strip layersangular resolution depending on drift- andamplification fieldangular resolution for optimized drift andamplification field around
´
`2.3˝
´1.8˝
¯
protons
AP
V2
5
AP
V2
5
zy
x APV2
5 APV2
5
θ
x-inclination angle
x
Test Beam Data
20 MeV protons
Eamp = 42.19 kV/cm
Edrift = 0.33 kV/cm
Ne:CF4 80:20 vol.%
Design-5
x-layer @ 40 1°
y-layer @ 30 1°
+-
+-
]°re
cons
truct
ed a
ngle
[
38
39
40
41
42
[kV/cm]ampE37 38 39 40 41 42
]°an
gula
r res
olut
ion
[
2−1−01234
Design-4
x-layer @ 40 1°+-
Edrift = 0.33 kV/cm
Ne:CF4 80:20 vol.%
]°re
cons
truct
ed a
ngle
[272829303132
[kV/cm]driftE0 0.2 0.4 0.6 0.8 1 1.2 1.4
]°an
gula
r res
olut
ion
[
3−2−1−01234
Design-4
y-layer @ 30 1°+-
Eamp = 40.6 kV/cm
Ne:CF4 80:20 vol.%
F. Klitzner (LMU) 2d-FSMM Detectors 20/06/2018 15 / 15
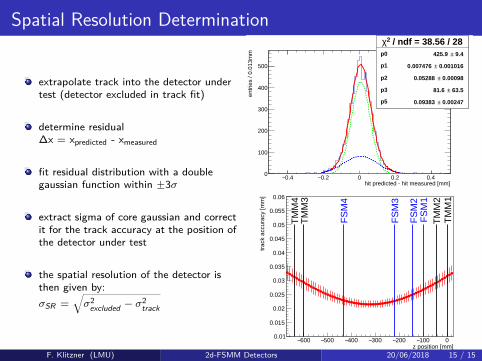
Spatial Resolution Determination
extrapolate track into the detector undertest (detector excluded in track fit)
determine residual∆x = xpredicted - xmeasured
fit residual distribution with a doublegaussian function within ˘3σ
extract sigma of core gaussian and correctit for the track accuracy at the position ofthe detector under test
the spatial resolution of the detector isthen given by:σSR =
b
σ2excluded ´ σ2
track
/ ndf = 38.56 / 282χp0 9.4± 425.9
p1 0.001016± 0.007476
p2 0.00098± 0.05288
p3 63.5± 81.6
p5 0.00247± 0.09383
0.4− 0.2− 0 0.2 0.4hit predicted - hit measured [mm]
0
100
200
300
400
500
entr
ies
/ 0.0
13m
m
/ ndf = 38.56 / 282χp0 9.4± 425.9
p1 0.001016± 0.007476
p2 0.00098± 0.05288
p3 63.5± 81.6
p5 0.00247± 0.09383
600− 500− 400− 300− 200− 100− 0z position [mm]
0.01
0.015
0.02
0.025
0.03
0.035
0.04
0.045
0.05
0.055
0.06
trac
k ac
cura
cy [m
m]
TM
M1
TM
M2
FS
M1
FS
M2
FS
M3
FS
M4
TM
M3
TM
M4
F. Klitzner (LMU) 2d-FSMM Detectors 20/06/2018 15 / 15
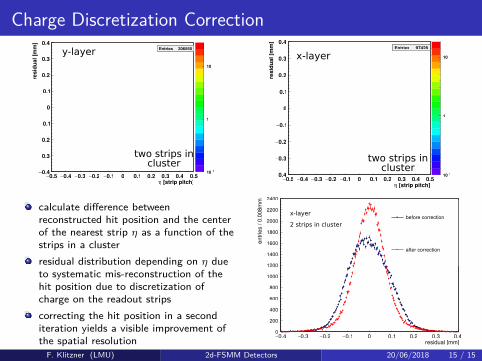
Charge Discretization Correction
0.5− 0.4− 0.3− 0.2− 0.1− 0 0.1 0.2 0.3 0.4 0.5[strip pitch]η
0.4−
0.3−
0.2−
0.1−
0
0.1
0.2
0.3
0.4re
sidu
al [m
m]
Entries 206550
1−10
1
10
Entries 206550y-layer
two strips incluster
calculate difference betweenreconstructed hit position and the centerof the nearest strip η as a function of thestrips in a clusterresidual distribution depending on η dueto systematic mis-reconstruction of thehit position due to discretization ofcharge on the readout stripscorrecting the hit position in a seconditeration yields a visible improvement ofthe spatial resolution
0.5− 0.4− 0.3− 0.2− 0.1− 0 0.1 0.2 0.3 0.4 0.5[strip pitch]η
0.4−
0.3−
0.2−
0.1−
0
0.1
0.2
0.3
0.4
resi
dual
[mm
]
Entries 97428
1−10
1
10
Entries 97428
two strips in cluster
x-layer
0.4− 0.3− 0.2− 0.1− 0 0.1 0.2 0.3 0.4residual [mm]
0
200
400
600
800
1000
1200
1400
1600
1800
2000
2200
2400
entri
es /
0.00
8mm
before correction
after correction
x-layer
2 strips in cluster
F. Klitzner (LMU) 2d-FSMM Detectors 20/06/2018 15 / 15
A Comparison: 2-Dimensional Resistive Strip Micromegas
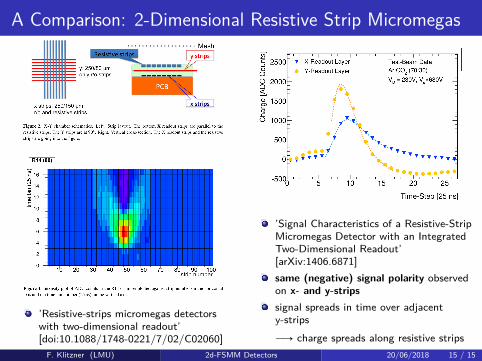
’Resistive-strips micromegas detectorswith two-dimensional readout’[doi:10.1088/1748-0221/7/02/C02060]
’Signal Characteristics of a Resistive-StripMicromegas Detector with an IntegratedTwo-Dimensional Readout’[arXiv:1406.6871]same (negative) signal polarity observedon x- and y-stripssignal spreads in time over adjacenty-stripsÝÑ charge spreads along resistive strips
F. Klitzner (LMU) 2d-FSMM Detectors 20/06/2018 15 / 15
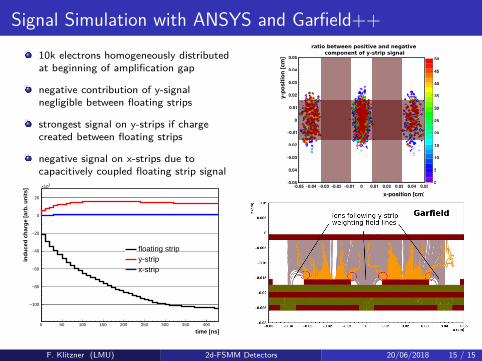
Signal Simulation with ANSYS and Garfield++10k electrons homogeneously distributedat beginning of amplification gap
negative contribution of y-signalnegligible between floating strips
strongest signal on y-strips if chargecreated between floating strips
negative signal on x-strips due tocapacitively coupled floating strip signal
time [ns]0 50 100 150 200 250 300 350 400
ind
uce
d c
har
ge
[arb
. un
its]
100−
80−
60−
40−
20−
0
20
310×
floating stripy-stripx-strip
x-position [cm]0.05− 0.04− 0.03− 0.02− 0.01− 0 0.01 0.02 0.03 0.04 0.05
y-po
sitio
n [c
m]
0.05−
0.04−
0.03−
0.02−
0.01−
0
0.01
0.02
0.03
0.04
0.05
0
5
10
15
20
25
30
35
40
45
50
ratio between positive and negative component of y-strip signal
F. Klitzner (LMU) 2d-FSMM Detectors 20/06/2018 15 / 15
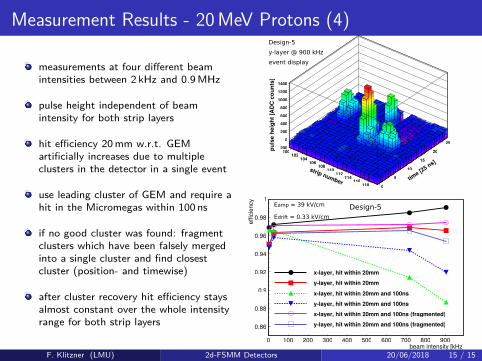
Measurement Results - 20 MeV Protons (4)
measurements at four different beamintensities between 2 kHz and 0.9 MHz
pulse height independent of beamintensity for both strip layers
hit efficiency 20 mm w.r.t. GEMartificially increases due to multipleclusters in the detector in a single event
use leading cluster of GEM and require ahit in the Micromegas within 100 ns
if no good cluster was found: fragmentclusters which have been falsely mergedinto a single cluster and find closestcluster (position- and timewise)
after cluster recovery hit efficiency staysalmost constant over the whole intensityrange for both strip layers
100102
104106
108110
112114
116118
strip number0
5
10
15
20
25
time [25 ns]
200−
0
200
400
600
800
1000
1200
1400
puls
e he
ight
[AD
C c
ount
s]
Design-5
y-layer @ 900 kHz
event display
beam intensity [kHz]0 100 200 300 400 500 600 700 800 900
effic
ienc
y
0.86
0.88
0.9
0.92
0.94
0.96
0.98
1
x-layer, hit within 20mmy-layer, hit within 20mm
x-layer, hit within 20mm and 100nsy-layer, hit within 20mm and 100nsx-layer, hit within 20mm and 100ns (fragmented)y-layer, hit within 20mm and 100ns (fragmented)
Eamp = 39 kV/cm
Edrift = 0.33 kV/cm
Design-5
F. Klitzner (LMU) 2d-FSMM Detectors 20/06/2018 15 / 15
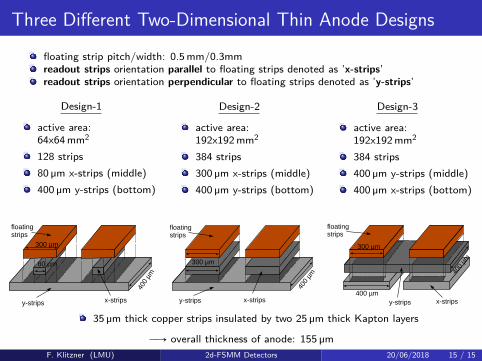
Three Different Two-Dimensional Thin Anode Designs
floating strip pitch/width: 0.5 mm/0.3mmreadout strips orientation parallel to floating strips denoted as ’x-strips’readout strips orientation perpendicular to floating strips denoted as ’y-strips’
Design-1
active area:64x64 mm2
128 strips80 µm x-strips (middle)400 µm y-strips (bottom)
x-stripsy-strips
floating strips
400
µm
300 µm
80 µm
Design-2
active area:192x192 mm2
384 strips300 µm x-strips (middle)400 µm y-strips (bottom)
x-stripsy-strips40
0 µm
300 µm
floating strips
Design-3
active area:192x192 mm2
384 strips400 µm y-strips (middle)400 µm x-strips (bottom)
x-stripsy-strips
floating strips
400 µm
400
µm
300 µm
35 µm thick copper strips insulated by two 25 µm thick Kapton layers
ÝÑ overall thickness of anode: 155 µmF. Klitzner (LMU) 2d-FSMM Detectors 20/06/2018 15 / 15
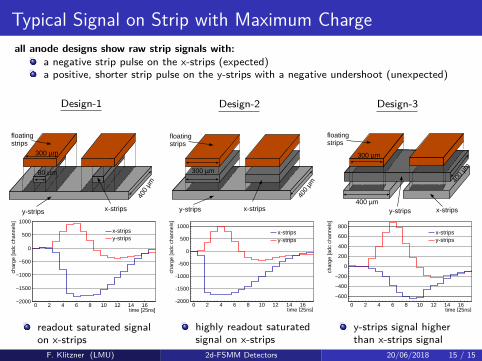
Typical Signal on Strip with Maximum Chargeall anode designs show raw strip signals with:
a negative strip pulse on the x-strips (expected)a positive, shorter strip pulse on the y-strips with a negative undershoot (unexpected)
Design-1
x-stripsy-strips
floating strips
400
µm300 µm
80 µm
time [25ns]0 2 4 6 8 10 12 14 16
char
ge [a
dc c
hann
els]
2000−
1500−
1000−
500−
0
500
1000
x-stripsy-strips
readout saturated signalon x-strips
Design-2
x-stripsy-strips
400
µm
300 µm
floating strips
time [25ns]0 2 4 6 8 10 12 14 16
char
ge [a
dc c
hann
els]
-2000
-1500
-1000
-500
0
500
1000x-stripsy-strips
highly readout saturatedsignal on x-strips
Design-3
x-stripsy-strips
floating strips
400 µm
400
µm
300 µm
time [25ns]0 2 4 6 8 10 12 14 16
char
ge [a
dc c
hann
els]
600−
400−
200−
0
200
400
600
800x-stripsy-strips
y-strips signal higherthan x-strips signal
F. Klitzner (LMU) 2d-FSMM Detectors 20/06/2018 15 / 15
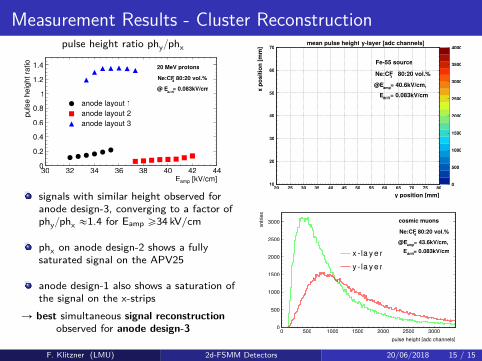
Measurement Results - Cluster Reconstructionpulse height ratio phy{phx
[kV/cm]ampE30 32 34 36 38 40 42 44
puls
e he
ight
ratio
0
0.2
0.4
0.6
0.8
1
1.2
1.4
anode layout 1anode layout 2anode layout 3
20 MeV protons
Ne:CF 80:20 vol.%4
@ E = 0.083kV/cmdrift
signals with similar height observed foranode design-3, converging to a factor ofphy{phx «1.4 for Eamp ě34 kV/cm
phx on anode design-2 shows a fullysaturated signal on the APV25
anode design-1 also shows a saturation ofthe signal on the x-strips
Ñ best simultaneous signal reconstructionobserved for anode design-3
y position [mm]20 25 30 35 40 45 50 55 60 65 70 75 80
x po
sitio
n [m
m]
10
20
30
40
50
60
70
0
500
1000
1500
2000
2500
3000
3500
4000mean pulse height vs position, plane 1
Fe-55 sourcemean]
mean pulse heightmean]
y-layer [adc channels]mean]
Ne:CF 80:20 vol.%mean]
4
@E = 40.6kV/cm,mean]
amp
man] E = 0.083kV/cmmean]
drift
mean]
pulse height [adc channels]0 500 1000 1500 2000 2500 3000
entri
es
0
500
1000
1500
2000
2500
3000
x - la y e ry - la y e r
cosmic muons
Ne:CF 80:20 vol.%4
@E = 43.6kV/cm,amp
E = 0.083kV/cmdrift
F. Klitzner (LMU) 2d-FSMM Detectors 20/06/2018 15 / 15