Embed Size (px)
Citation preview
7
TYPES OF ETHNIC MINORITY REPRESENTATION IN CENTRAL AND EASTERN EUROPE Stoycho P. Stoychev PhD Student, Sofia University [email protected] Abstract The need of representation of ethnic minority groups is well realized in contemporary multiethnic societies. In response, they try to guarantee this representation more or less successfully. This article examines the different patterns of ethnic minority representation in order to outline the more effective ones. This goal is achieved through an empirical analysis of a dataset covering fifteen minority groups in Central and Eastern Europe. Using the Qualitative Comparative Analysis approach, typology of minority representation is constructed. This typology demonstrates that effective representation could exist with or without institutional guarantees. The major factor found to influence it is the ability of each particular minority group to establish and maintain a cohesive political party. Ethnic minority groups that are divided between different political subjects or are poorly organized could not achieve representation on their own. Therefore, they remain unrepresented, unless the state introduces special institutional measures. 1. Introduction The issue of representing minorities in the political institutions of diverse societies is often considered to be a key aspect of
their sustainable democratic development. Therefore, scholars and constitution writers try to find the optimal institutional formula for achieving such representation1. The aim of this study is to contribute to these efforts by creating a typology of the patterns of ethnic minority representation in nine Central and Eastern European countries, covering eleven minority groups for a period of eleven years. The study clarifies the relations between the institutional guarantees of minority representation and this representation itself. It rejects the hypothesis that there is linear dependence between these two phenomena. This is done by proving the existence of non-institutionalized type of effective minority representation, which is explained by the presence of minority mobilization for political action. In this article, I try to conceptualize two dimensions of ethnic minority representation. The first covers the institutional measures taken by the state in order to represent minorities. The second dimension expresses the extent to which these minorities are effectively
1 Arendt Lijphart, Patterns of Democracy. Government Forms and Performance in Thirty-Six Countries (Yale University Press, 1999); Arendt Lijphart, “Constitutional Design for Divided Societies,” Journal of Democracy 15/2 (April, 2004); Donald Horowitz, “Electoral Systems: A Primer for Decision Makers,” Journal of Democracy 14/4 (October, 2003).
8
represented. These two dimensions form the conceptual framework in which the typology of ethnic minority representation is developed. Further, I try to operationalize these two dimensions and to justify the case selection of the study. Furthermore, I construct a dataset that covers the scores of the cases on each indicator for each year. Then, I perform an empirical analysis of the dataset using the Qualitative Comparative Analysis approach. This method allows multiple conjunctional paths to be identified and hence is more suitable for creating a typology than the standard regression models. The analysis extracts from the dataset four types of minority representation divided into eight subtypes. These patterns build up the typology of ethnic minority representation. 2. Conceptualizing the Two Dimensions of Minority Representation In this section I will identify the components of the two dimensions of ethnic minority representation. Further I will try to specify a conceptual framework of this representation. Finally, I make some suggestions about the types of minority representation that could emerge out of this framework. 2.1 Institutional Guarantees of Minority Representation By institutional guarantees, I mean all constitutional and legislative arrangements as well as any sub-legislative acts of competent instances that
are aimed at representation of minority groups in political bodies and institutions on the national level, including the means of achieving such representation. These arrangements could be summarized in several components. I will try to define these components as clearly and generally as possible in order to capture all possible institutional measures for minority representation. The first and maybe most important component of the institutional dimension is the electoral system for the legislative body2 and more specifically the type of electoral system chosen. There is a strong notion in the existing literature in favor of the PR systems3 as the most suitable for ethnically divided societies. PR is seen as an essential and important component of the Consensus Democracy because it produces the effect of “power sharing” which is seen as vital for the democratic regime in divided societies4. Here I will 2 Lijphart, “Constitutional Design for Divided Societies”; Benjamin Reilly, Democracy in Divided Societies. Electoral Engineering of Conflict management (Cambridge University Press, 2001); Donald Horowitz, Ethnic Groups in Conflict (University of California Press, 1985); Horowitz, “Electoral Systems” 3 Arendt Lijphart, “Prospects of Power-sharing in the New South Africa,” in Election ’94 South Africa: The Campaign, Results and Future Prospects, ed. Andrew Reynolds (Cape Town: David Philip, 1994). 221-231; Pippa Norris, Stable democracy and good governance in divided societies: Do power-sharing institutions work?, Paper presented at the ISA 46th annual convention, Honolulu, March 5, 2005; Renske Doorenspleet, “Electoral Systems and Good Governance in Divided Countries,” Ethnopolitics 4/4 2005. 4 Arendt Lijphart, “Democracies: forms, performance and constitutional engineering,” European Journal of Political Research 25/1 1994; Lijphart, Patterns of
9
not concentrate on the effects of the PR system over representation but the effects of all electoral systems over “power sharing”. I am not contesting the idea that PR is more effective at producing representation of minor groups; I simply do not exclude a situation where an ethnic minority group is territorially concentrated and a plurality vote gives this group a better chance to be represented than a PR system with a national threshold 5 . In summary, the first component of the institutional dimension is the electoral system designed to represent minority groups in the legislature rendering the specific structure of the minority group/groups. However, this component is not influenced by the presence or the absence of minority representatives in the parliament i.e. it is focused on the intention of the state to represent minorities, not on their actual representation. The second component of the institutional dimension is whether by constitutional or legislative act the minority group under study is recognized as such i.e. if the majority represented by the state recognizes the existence of a minority group or groups on the territory of the country. This is a predicament for further legislative measures dealing with the issue. At first glimpse, this component looks Democracy; Lijphart, “Constitutional Design for Divided Societies”; Rein Taagepera and Matthew Shugart, Seats and Votes. The Effects and Determinants of Electoral Systems (Yale University Press, 1985). 5 Daniel Bochsler, Electoral engineering and inclusion of ethnic groups. Ethnic minorities in parliaments of Central and Eastern European countries. http://www.unige.ch/ses/spo/staff/corpsinter/bochsler/minorities, accessed on March 19, 2006
fundamental and one could claim that it should be the main one – preceding electoral system – and there will be quite a reason for such an assumption. However, in this study I find more important the state of actual representation regardless of the existence or nonexistence of its normative shell. Hence, I do not exclude situations in which despite the fact that a minority group is not recognized by the state as such, it is represented on the national level. The third component is whether there are seats in parliament reserved for representatives of minority groups or not. Such arrangements though rather controversial could be indicative of the will of the majority to include minorities in political processes. Reserving seats in parliament could be claimed to be discriminative – not all minorities usually receive such seats, and ineffective – usually such seats are too few and thus do not possess any practical significance. However, by guaranteeing seats for minority representatives in the legislature, the state symbolically indicates its willingness to share power. Another component of this dimension is whether by constitution or by law the creation of parties of ethnic minorities or other forms of ethnic associations are banned or not. This component is actually a prerequisite for the previous one. It is hard to expect that if minorities are not allowed to have their own parties, they will enjoy reserved seats in parliament. The fifth component is how easily constitutional texts or laws dealing with
10
minority representation can be amended. I assume here that if a minority group enjoys certain specific rights, these rights should not be easily abolished – the more rigid they are – the better. This guarantees protection of the protective legislation. The last component of the institutional dimension concerns procedural practices in the legislature. It concerns the possibility for minority groups in parliament to include bills in the agenda. If the agenda is accessible for parties of minorities, they have the necessary facility to put up for discussion of minority issues. If the procedure is rigid and high requirements are present in order to include bills in the agenda, such a facility is missing. These six components form the institutional dimension of the two-dimensional typology of ethnic minority representation that this study is aiming to construct. Here there are two extremes. One is whether an adequate electoral system is applied in order to represent minority parties and candidates in legislature. The minority groups have status as such and have the right to form their parties. These parties, once elected, could easily put in the agenda minority issues and all these arrangements are as hard to amend as the form of government for instance. The other extreme is when the state does not recognize ethnic minorities; parties and associations formed upon ethnic issues are banned i.e. minority representation is not only inexistent but legally restricted. Nevertheless here I should make some essential remarks. First, it does not mean
that if the electoral system is favorable for minorities it necessarily was created to be so. This is to say that such an electoral system could be a product of coincidence or considerations other than the will for representing minorities. Second, the recognition by the state and the reserved seats in parliament could be classified as active institutional guarantees of minority representation, while the allowance of the existence of minority parties and the rigidity of minority-friendly legislation are rather passive guarantees. Finally, the rigidity of the plenary agenda does not guarantee representation, but its realization is in terms of participation and, like the electoral system, may not be especially designed for minority representation. Hence, the institutional guarantees of minority representation could be divided into two categories. The first is intentional, which includes active and passive guarantees in combination with a favorable electoral system and/or accessible plenary agenda. The second is accidental which consists of a favorable electoral system and/or accessible plenary agenda without the existence of active or passive guarantees. These categories will be used later, when I construct the typology of minority representation. They are very useful for this study since they indicate the presence or the absence of a conscious policy of the state to represent minority groups. 2.2 Effective Minority Representation This dimension tries to capture the actual representation of minority groups. This is
11
to say to what extent ethnic minorities are represented and to what extent they participate in decision making. The dimension consists of several components that are conceptually connected. The first component is the existence of effective parties of ethnic minorities that succeed in winning seats in the legislature. This is the main component that characterizes effective minority representation. Such parties form the elite of the minority, formulate policies corresponding to relevant minority issues, interact within the political systems with other actors, and hence provide solutions to the relevant issues. In addition to or instead of parties of ethnic minorities there could be ethnically mixed parties that represent interests of a certain minority or minorities. The existence of such parties is the second component of this dimension. The extent to which such parties are dedicated to minority problems remains not so clear and not as stable as the mono-ethnic parties. However they could appear to be extremely useful when, for example, a minority party could not enter parliament due to a high national threshold or other restrictive measures. That is why this component is of high importance although it is hard to capture its characteristics. The third component of this dimension is whether the parties of the majority include representatives of minority groups in elective positions on party lists or raise their candidatures in single member districts. This is again a way to overcome restrictive policies and measures towards minority representation. It is also an indicator of the willingness of the majority
to include minority representatives in the decision making process. These three components form the sub-dimension of parliamentary representation. They indicate the means of representing minorities in the legislature and hence guarantee the minority groups participation in the law-making process. The fourth component is minority office holding or access to higher positions. Minority incumbents of offices could apply policies oriented towards ethnic issues and also have legislative initiative for providing relevant legislation. Moreover, in parliamentary states where the executive power has a collegial structure, ministers have certain unrestricted competences and hence minority incumbents can exercise certain executive power. The last component of this dimension is whether representatives of the minorities have access to civil, military, or police service. This guarantees minority participation in the lower stages of the state’s organization and public life and covers a larger number of representatives. The fourth and the fifth components form the sub-dimension of executive representation, which is in my opinion the most important of all, since it gives minority representatives real power and thus contrasts with all the other discussed measures of representation that can be symbolic and ineffective. However the presence of these two components is not likely without the presence of parliamentary representation; hence these two components could be interpreted as an
12
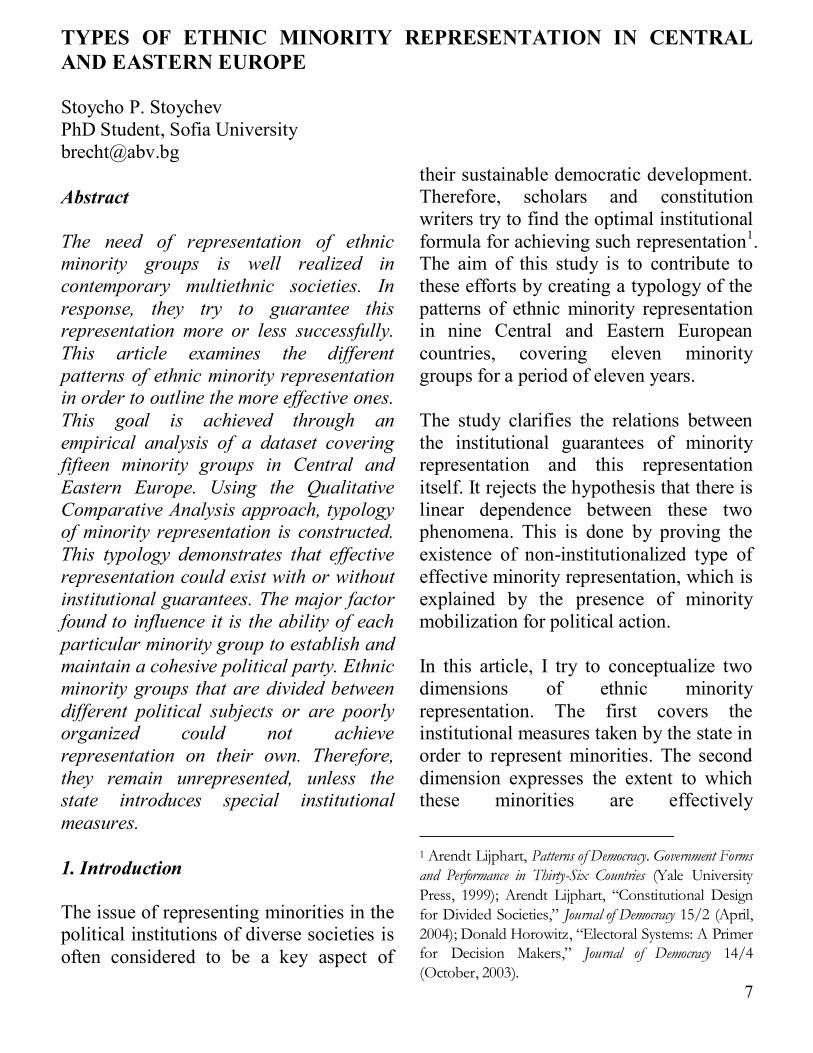
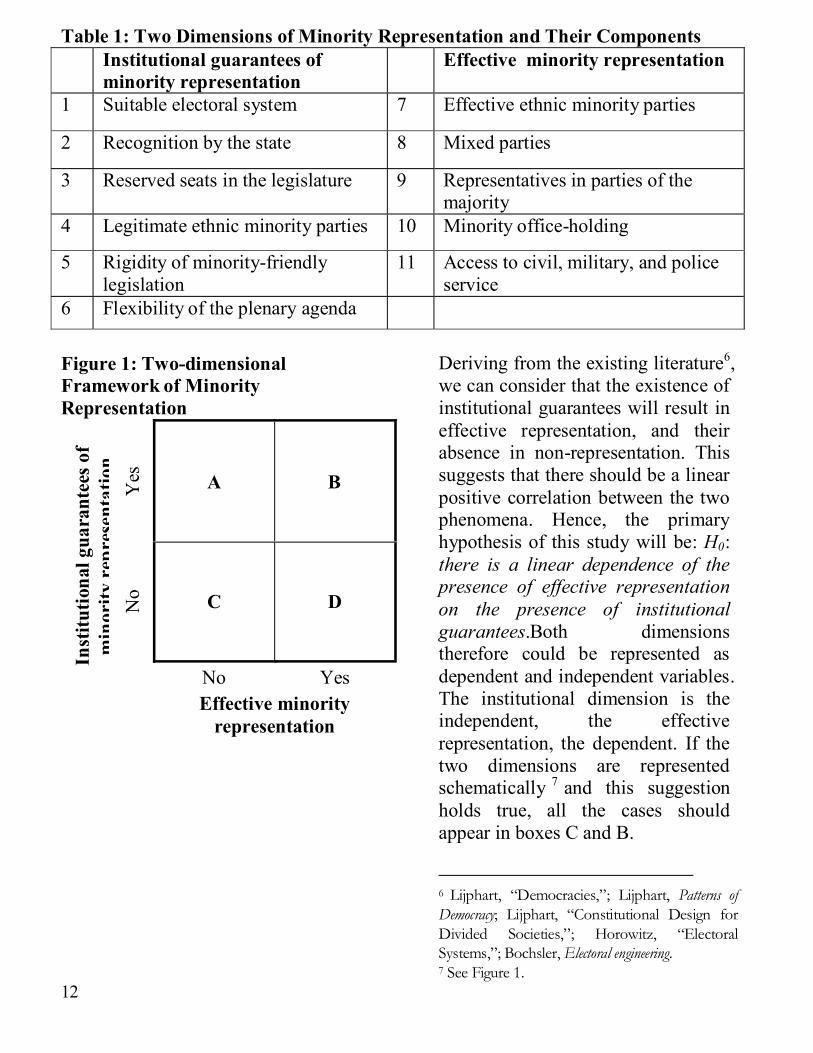
Table 1: Two Dimensions of Minority Representation and Their Components Institutional guarantees of minority representation
Effective minority representation
1 Suitable electoral system 7 Effective ethnic minority parties
2 Recognition by the state 8 Mixed parties
3 Reserved seats in the legislature 9 Representatives in parties of the majority
4 Legitimate ethnic minority parties 10 Minority office-holding
5 Rigidity of minority-friendly legislation
11 Access to civil, military, and police service
6 Flexibility of the plenary agenda
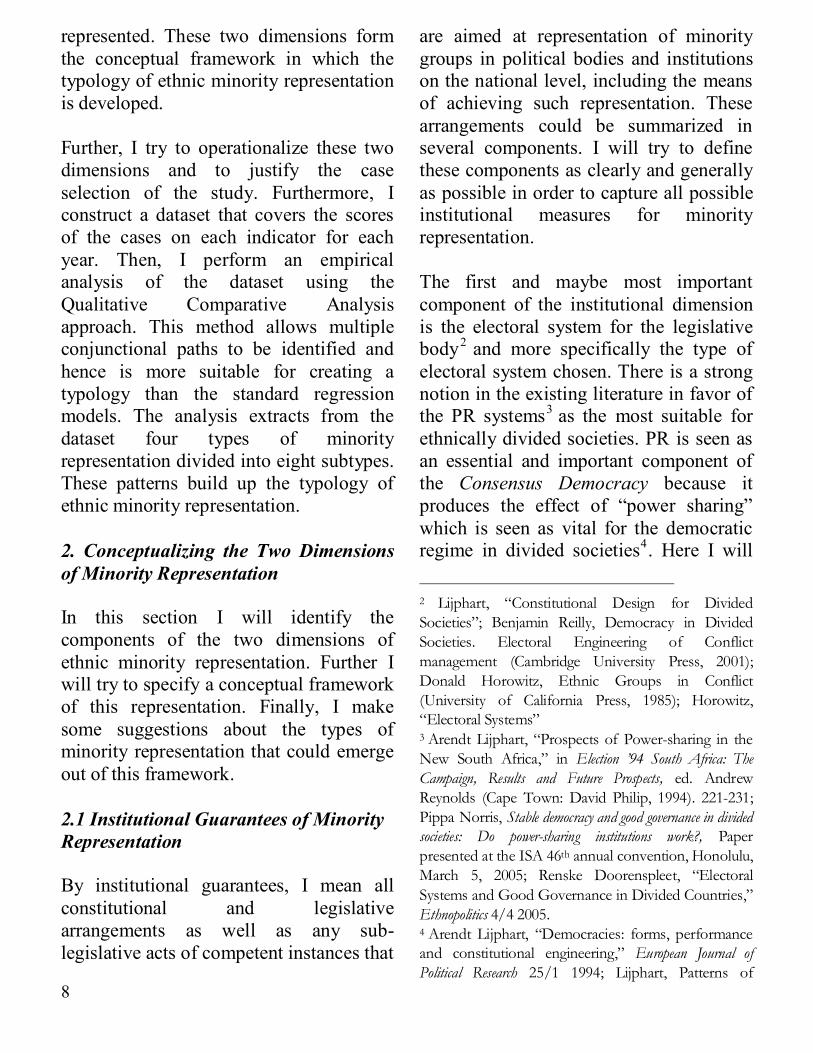
Figure 1: Two-dimensional Framework of Minority Representation
Deriving from the existing literature6, we can consider that the existence of institutional guarantees will result in effective representation, and their absence in non-representation. This suggests that there should be a linear positive correlation between the two phenomena. Hence, the primary hypothesis of this study will be: H0: there is a linear dependence of the presence of effective representation on the presence of institutional guarantees.Both dimensions therefore could be represented as dependent and independent variables. The institutional dimension is the independent, the effective representation, the dependent. If the two dimensions are represented schematically 7 and this suggestion holds true, all the cases should appear in boxes C and B.
6 Lijphart, “Democracies,”; Lijphart, Patterns of Democracy; Lijphart, “Constitutional Design for Divided Societies,”; Horowitz, “Electoral Systems,”; Bochsler, Electoral engineering. 7 See Figure 1.
Yes
A B
No C D
Inst
itutio
nal g
uara
ntee
s of
min
ority
repr
esen
tatio
n
No Yes Effective minority
representation
13
Such location of the cases would mean that there is only one type of minority representation – the institutionally guaranteed. However, if there are cases situated in boxes A an D, this will mean that there is no linear dependence between the two dimensions (H0 does not hold true). Hence, there will be four combinations, which I will call types of minority representation. The first type appears when there are institutional guarantees and an actual high degree of minority representation (box B). This is to say that the intentions and the efforts of the constitution writers and the legislators are fruitful. They have constructed a normative framework in order to represent a minority group or groups and the latter are really represented. This is the type of institutionalized minority representation. The second type appears when there are institutional guarantees of minority representation, but in fact minority groups are not represented (box A). This could be interpreted in two ways: first, the state adopts a specific constitution and/or legislation for minorities, but does not implement it for reasons such as unwillingness or incapability. Second, the normative measures adopted, even if implemented, are improper for achieving the aim of minority representation and result in non-representation. Hence this type is defined as minority representation on-paper. The third basic type (box D) consists of effective political representation of minority groups that is not institutionally
guaranteed. This means that the minority or minorities find a way of representing their group interests through non-normative means or through other means not especially designed for their representation. This type is non-institutionalized minority representation. The fourth basic type exists when we observe the existence of considerable minority group or groups, but there are neither normative guarantees for their political representation nor representation as such. These situations are likely to appear in countries where there is not only a lack of minority-specific rights, but defense of ethnic interests of minorities is legally restricted if not prohibited. Therefore this is the type of suppressed minority representation. So far I have defined the two dimensions of minority representation and their components as well as the four basic types of representation that can occur. In the next section I try to operationalize these dimensions and to select the cases of my study in order to create a dataset. Through an empirical analysis of the dataset, I furthermore will try to justify the four types of minority representation discussed above. 3. Measuring the Eleven Indicators Since the two dimensions of minority representation consist of more than two components which are conceptually significant, I want to see how they combine with each other. For that reason I will not aggregate them and I will use the Qualitative Comparative Approach (QCA), which allows for observation of all
14
combinations between the components. Therefore, the variables in this study will be coded according to the requirements of this method. 3.1 Assigning Scores The eleven indicators in this research have two statuses – presence or absence. Therefore only two numerical scores for each indicator are available: 1 for presence and 0 for absence. However, it is still not easy to determine the status of some indicators. For example, the first indicator is the electoral system. It has two statuses: 1 (minority friendly) and 0 (minority indifferent or restrictive). But what is a friendly and what is an indifferent electoral system? Lijphart 8 defines as minority friendly the PR system. However, under certain circumstances as the territorial structure of the minority group, plurality system could be more favorable for ethnic minority representation 9 . I will use Bochsler’s classification, where he controls for size and territorial dispersion or concentration of each minority group when estimating the effects of the electoral rules applied, in order to determine the value of this indicator. This value will not be influenced by the presence or the absence of minority parties in the legislature. This is to say that it is possible for a minority group to score 1 on the electoral system indicator without having an effective minority party in the legislature and vice versa. 8 Lijphart, “Constitutional Design for Divided Societies”. 9 Bochsler, Electoral engineering.
The second and third indicators are easy to measure. They concern the recognition of the particular minority group and whether there are reserved seats in the parliament for minorities. These two indicators are scored upon the presence or absence of the feature. The fourth indicator will be reversed for convenience of measurement. The question will not be if minority parties are banned or not, but if they are legitimate or not. The fifth indicator will score 1 if the requirements for amending minority representation legislation are at least as stringent as these for minor change in constitution, and will score 0 if less or such legislation is not present. The last indicator concerns the rigidity of the plenary agenda in the legislation. It will score 1 if single members of parliament (MP) could put up bills on the agenda and score 0 if else. The right of each MP to do this is the strongest guarantee that minorities can participate in the formulation of the agenda. The second dimension is measured by five indicators. The first three represent the first stage of representation – entering the legislature. The last two measure the effective amount of power deriving from this representation. The first three indicators score as follows: effective minority parties will score 1 when a political party of the particular minority succeeds to win seats in the legislature; the second indicator scores 1 if the mixed minority party wins seats in the legislature and the third indicator scores 1 if the representative of the particular minority included in the party list of the majority
15
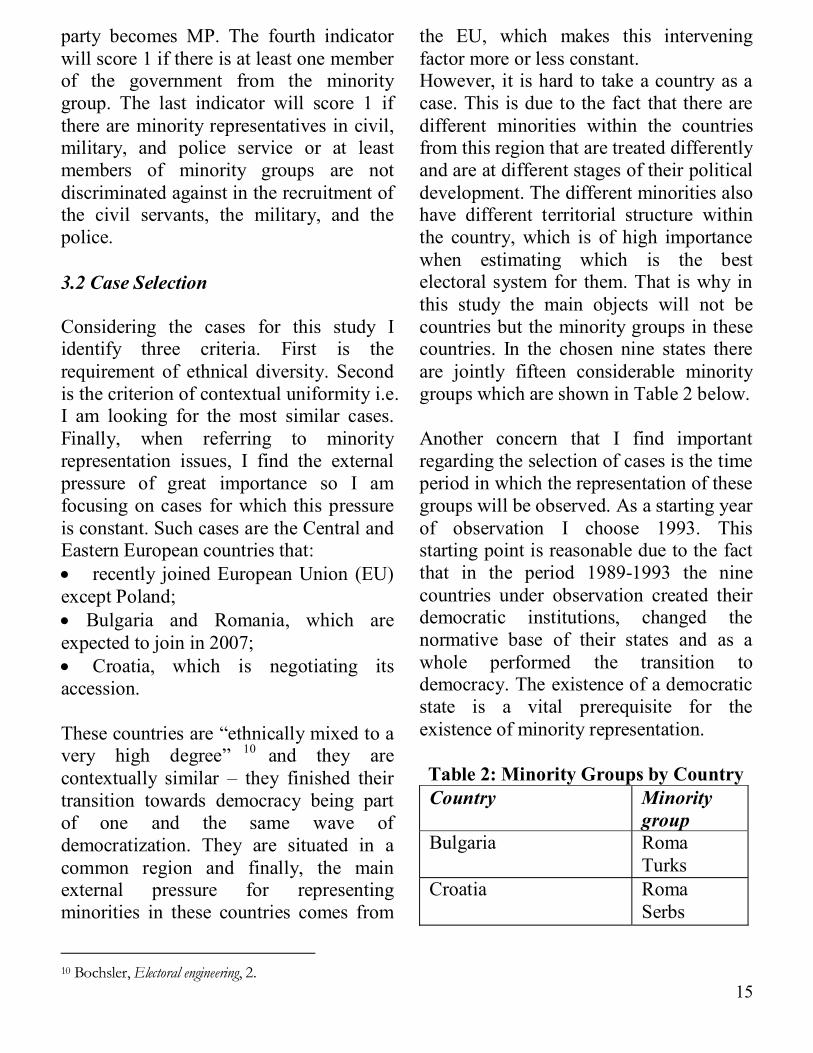
party becomes MP. The fourth indicator will score 1 if there is at least one member of the government from the minority group. The last indicator will score 1 if there are minority representatives in civil, military, and police service or at least members of minority groups are not discriminated against in the recruitment of the civil servants, the military, and the police. 3.2 Case Selection Considering the cases for this study I identify three criteria. First is the requirement of ethnical diversity. Second is the criterion of contextual uniformity i.e. I am looking for the most similar cases. Finally, when referring to minority representation issues, I find the external pressure of great importance so I am focusing on cases for which this pressure is constant. Such cases are the Central and Eastern European countries that: • recently joined European Union (EU) except Poland; • Bulgaria and Romania, which are expected to join in 2007; • Croatia, which is negotiating its accession. These countries are “ethnically mixed to a very high degree” 10 and they are contextually similar – they finished their transition towards democracy being part of one and the same wave of democratization. They are situated in a common region and finally, the main external pressure for representing minorities in these countries comes from
10 Bochsler, Electoral engineering, 2.
the EU, which makes this intervening factor more or less constant. However, it is hard to take a country as a case. This is due to the fact that there are different minorities within the countries from this region that are treated differently and are at different stages of their political development. The different minorities also have different territorial structure within the country, which is of high importance when estimating which is the best electoral system for them. That is why in this study the main objects will not be countries but the minority groups in these countries. In the chosen nine states there are jointly fifteen considerable minority groups which are shown in Table 2 below. Another concern that I find important regarding the selection of cases is the time period in which the representation of these groups will be observed. As a starting year of observation I choose 1993. This starting point is reasonable due to the fact that in the period 1989-1993 the nine countries under observation created their democratic institutions, changed the normative base of their states and as a whole performed the transition to democracy. The existence of a democratic state is a vital prerequisite for the existence of minority representation.
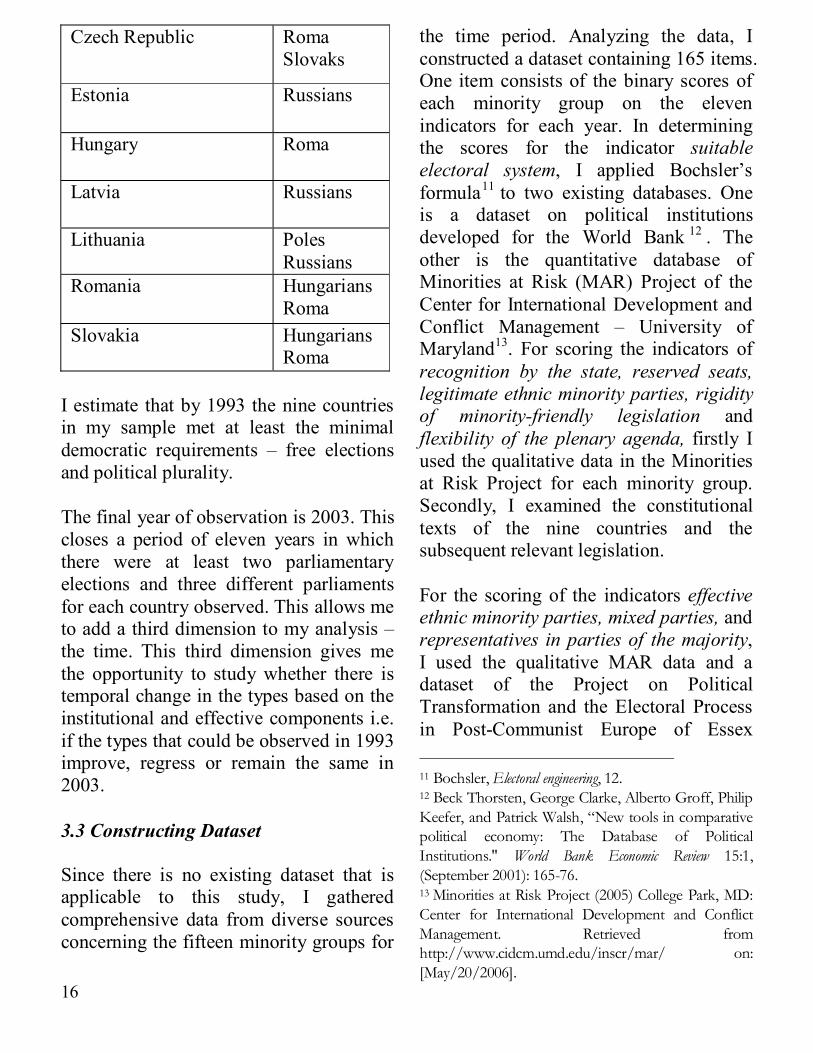
Table 2: Minority Groups by Country Country Minority
group Bulgaria Roma
Turks Croatia Roma
Serbs
16
Czech Republic Roma Slovaks
Estonia Russians
Hungary Roma
Latvia Russians
Lithuania Poles Russians
Romania Hungarians Roma
Slovakia Hungarians Roma
I estimate that by 1993 the nine countries in my sample met at least the minimal democratic requirements – free elections and political plurality. The final year of observation is 2003. This closes a period of eleven years in which there were at least two parliamentary elections and three different parliaments for each country observed. This allows me to add a third dimension to my analysis – the time. This third dimension gives me the opportunity to study whether there is temporal change in the types based on the institutional and effective components i.e. if the types that could be observed in 1993 improve, regress or remain the same in 2003. 3.3 Constructing Dataset Since there is no existing dataset that is applicable to this study, I gathered comprehensive data from diverse sources concerning the fifteen minority groups for
the time period. Analyzing the data, I constructed a dataset containing 165 items. One item consists of the binary scores of each minority group on the eleven indicators for each year. In determining the scores for the indicator suitable electoral system, I applied Bochsler’s formula11 to two existing databases. One is a dataset on political institutions developed for the World Bank 12 . The other is the quantitative database of Minorities at Risk (MAR) Project of the Center for International Development and Conflict Management – University of Maryland13. For scoring the indicators of recognition by the state, reserved seats, legitimate ethnic minority parties, rigidity of minority-friendly legislation and flexibility of the plenary agenda, firstly I used the qualitative data in the Minorities at Risk Project for each minority group. Secondly, I examined the constitutional texts of the nine countries and the subsequent relevant legislation. For the scoring of the indicators effective ethnic minority parties, mixed parties, and representatives in parties of the majority, I used the qualitative MAR data and a dataset of the Project on Political Transformation and the Electoral Process in Post-Communist Europe of Essex 11 Bochsler, Electoral engineering, 12. 12 Beck Thorsten, George Clarke, Alberto Groff, Philip Keefer, and Patrick Walsh, “New tools in comparative political economy: The Database of Political Institutions." World Bank Economic Review 15:1, (September 2001): 165-76. 13 Minorities at Risk Project (2005) College Park, MD: Center for International Development and Conflict Management. Retrieved from http://www.cidcm.umd.edu/inscr/mar/ on: [May/20/2006].
17
University 14 . Finally, for scoring the minority office-holding and the access to civil, military, and police service I used both qualitative and quantitative MAR data. The constructed dataset is the basis for creating the typology of ethnic minority representation that I will try to utilize in the following section. 4. Creating the Typology of Minority Representation Here, I will discuss the method that I will use to analyze the dataset. Furthermore, using this method I will conduct the empirical analysis itself and check if the four types of ethnic minority representation described in Section 2 exist in practice. 4.1 The Method According to my model, there are four types of representation of ethnic minorities on the national level. These types are four different combinations of the statuses of the institutional and the effective dimension – presence or absence. However, both dimensions consist of several components, which are independently important for my model. That is why I am interested in all the existing combinations of components. Hence, I will not aggregate the two dimensions.
14 Project on Political Transformation and the Electoral Process in Post-Communist Europe (2002): University of Essex. Retrieved from http://www.essex.ac.uk/elections/ on: [May/20/2006].
In order to explore all possible combinations between the components, I will use the Qualitative Comparative Analysis (QCA) based on Boolean algebra. The method was first developed by Charles Ragin15. It uses logical, multiple causal paths in explaining the phenomenon of observation. The method allows the actual status of the analyzed cases to be explained by combinations of conditions 16 . Therefore, this method is much more appropriate for construction of types, than the quantitative techniques. The variables in my study are binary. They are scored 1 (present) or 0 (absent). In order not to be mistaken with what is meant as variable in the quantitative analyses and to keep myself in the terms of QCA, these variables will be referred to as conditions. Each type of my typology will be an outcome that occurs due to specific combination of conditions, not of variables. These conditions are coded with letters. Upper case replaces the value 1 (presence), while the lower case replaces the value 0 (absence). For example, the first condition in the dataset – suitable electoral system is coded as “S”. For each case it could have values 1 or 0 which are respectively expressed as “S” or “s”. The first stands for a suitable electoral system for the representation of the minority group; the latter stands for an unsuitable electoral system. The second condition – recognition by the state will appear as “R” if the minority group is recognized by the
15 Charles Ragin, The Comparative Method: Moving Beyond Qualitative and Quantitative (Berkeley: University of California Press, 1987) 16 Bochsler, Electoral engineering, 8.
18
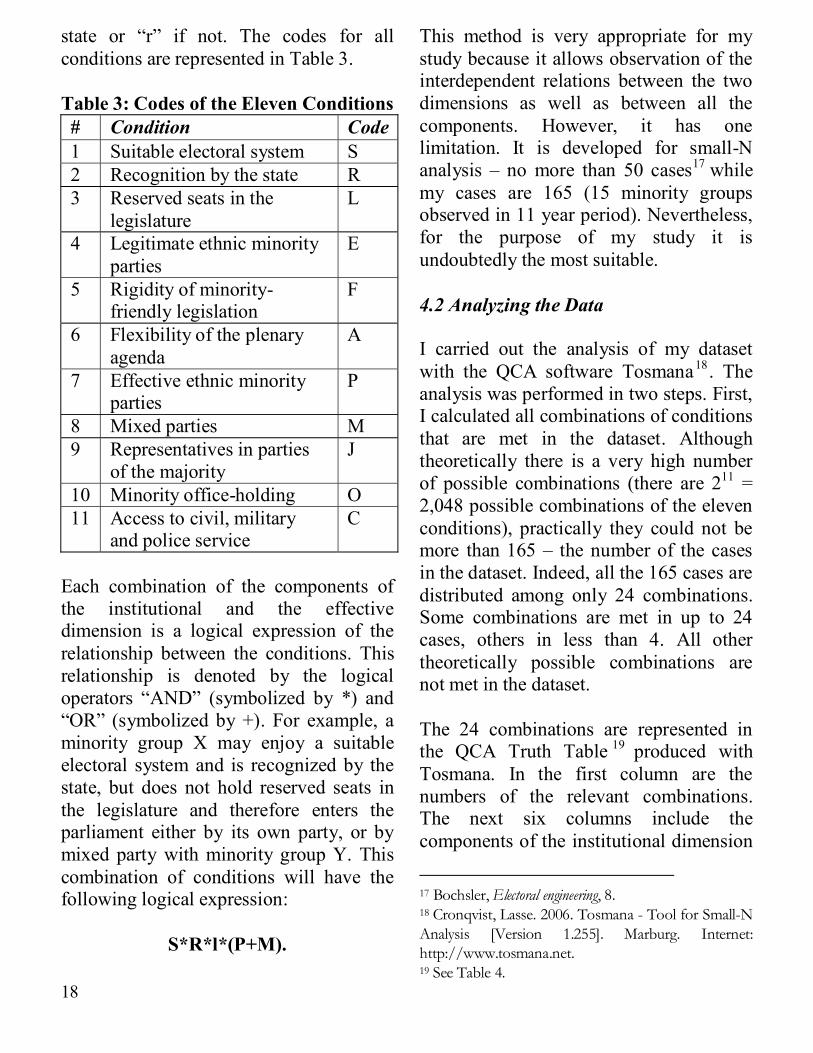
state or “r” if not. The codes for all conditions are represented in Table 3. Table 3: Codes of the Eleven Conditions # Condition Code1 Suitable electoral system S 2 Recognition by the state R 3 Reserved seats in the
legislature L
4 Legitimate ethnic minority parties
E
5 Rigidity of minority-friendly legislation
F
6 Flexibility of the plenary agenda
A
7 Effective ethnic minority parties
P
8 Mixed parties M 9 Representatives in parties
of the majority J
10 Minority office-holding O 11 Access to civil, military
and police service C
Each combination of the components of the institutional and the effective dimension is a logical expression of the relationship between the conditions. This relationship is denoted by the logical operators “AND” (symbolized by *) and “OR” (symbolized by +). For example, a minority group X may enjoy a suitable electoral system and is recognized by the state, but does not hold reserved seats in the legislature and therefore enters the parliament either by its own party, or by mixed party with minority group Y. This combination of conditions will have the following logical expression:
S*R*l*(P+M).
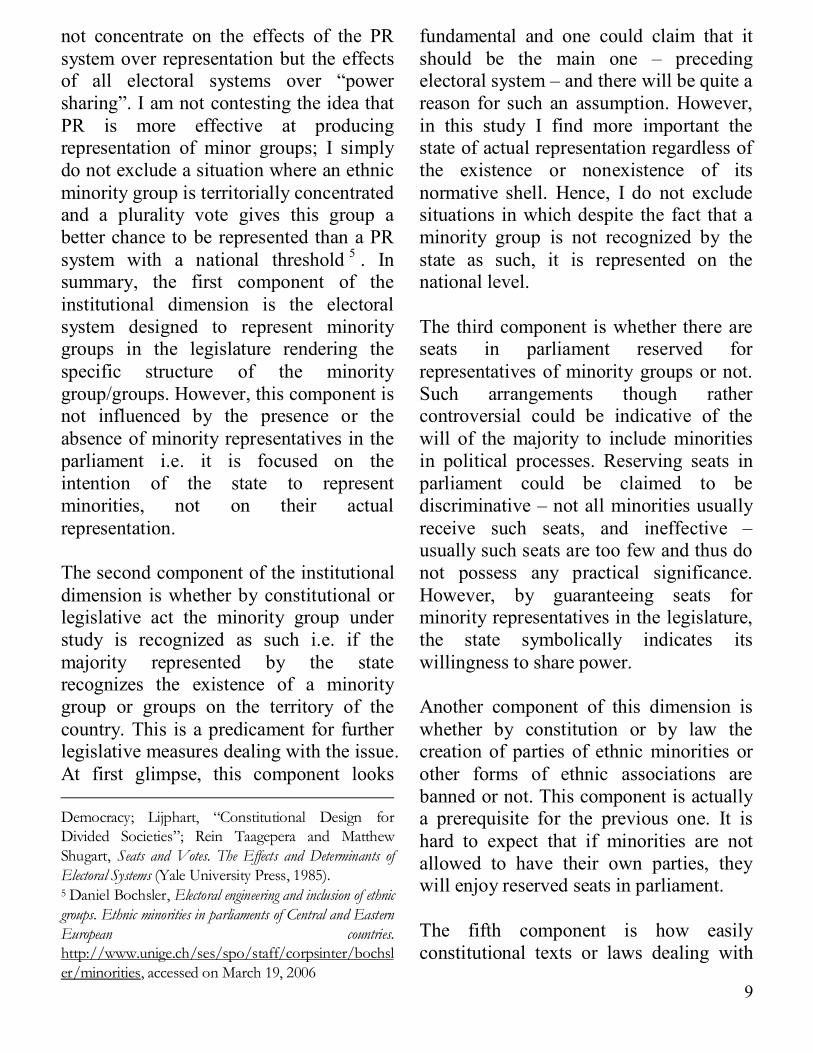
This method is very appropriate for my study because it allows observation of the interdependent relations between the two dimensions as well as between all the components. However, it has one limitation. It is developed for small-N analysis – no more than 50 cases17 while my cases are 165 (15 minority groups observed in 11 year period). Nevertheless, for the purpose of my study it is undoubtedly the most suitable. 4.2 Analyzing the Data I carried out the analysis of my dataset with the QCA software Tosmana18. The analysis was performed in two steps. First, I calculated all combinations of conditions that are met in the dataset. Although theoretically there is a very high number of possible combinations (there are 211 = 2,048 possible combinations of the eleven conditions), practically they could not be more than 165 – the number of the cases in the dataset. Indeed, all the 165 cases are distributed among only 24 combinations. Some combinations are met in up to 24 cases, others in less than 4. All other theoretically possible combinations are not met in the dataset. The 24 combinations are represented in the QCA Truth Table 19 produced with Tosmana. In the first column are the numbers of the relevant combinations. The next six columns include the components of the institutional dimension
17 Bochsler, Electoral engineering, 8. 18 Cronqvist, Lasse. 2006. Tosmana - Tool for Small-N Analysis [Version 1.255]. Marburg. Internet: http://www.tosmana.net. 19 See Table 4.
19
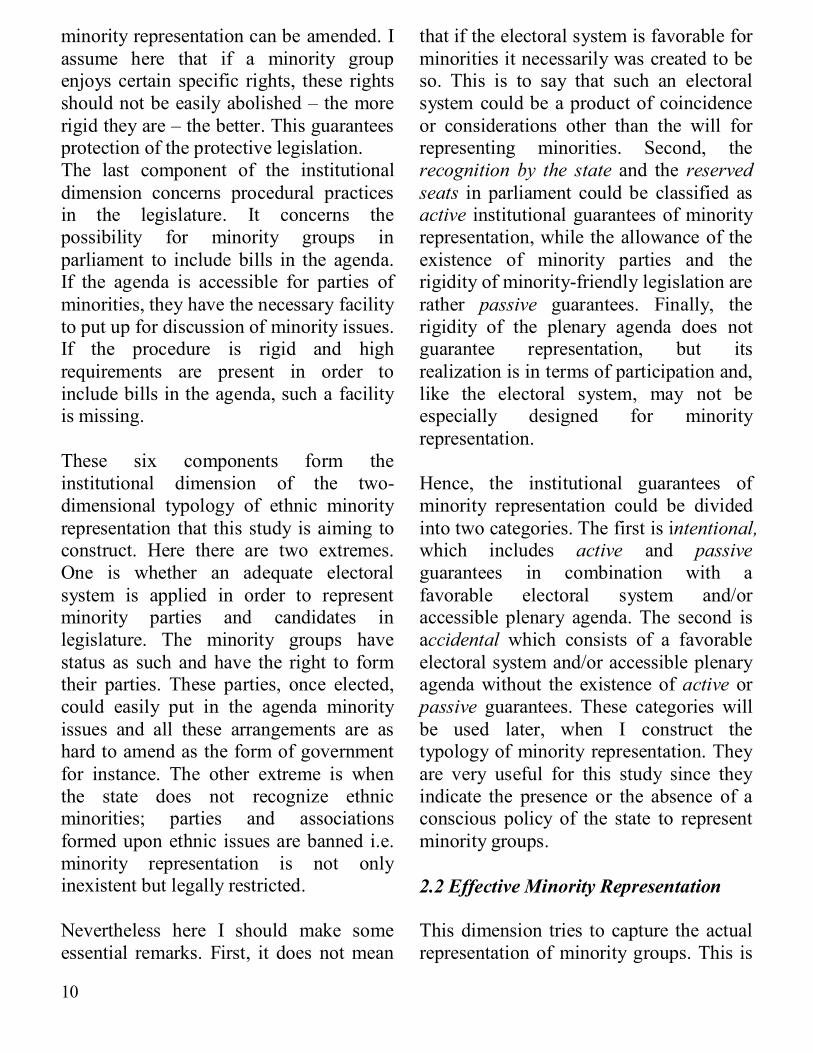
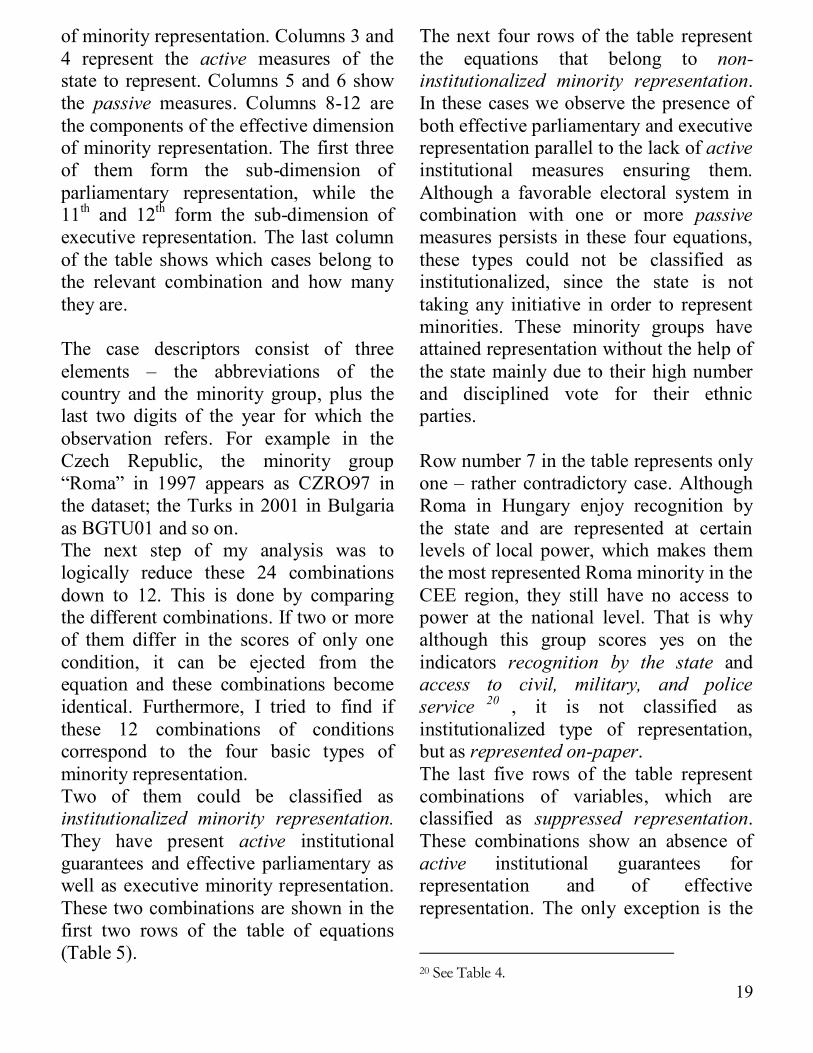
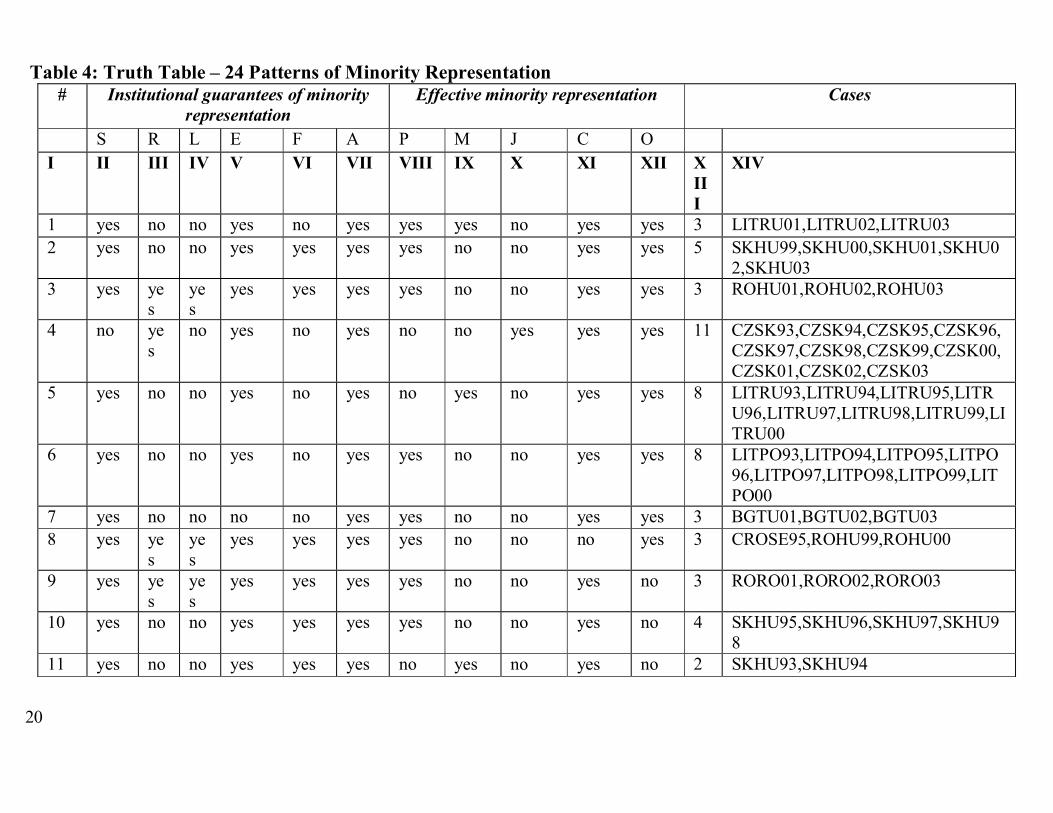
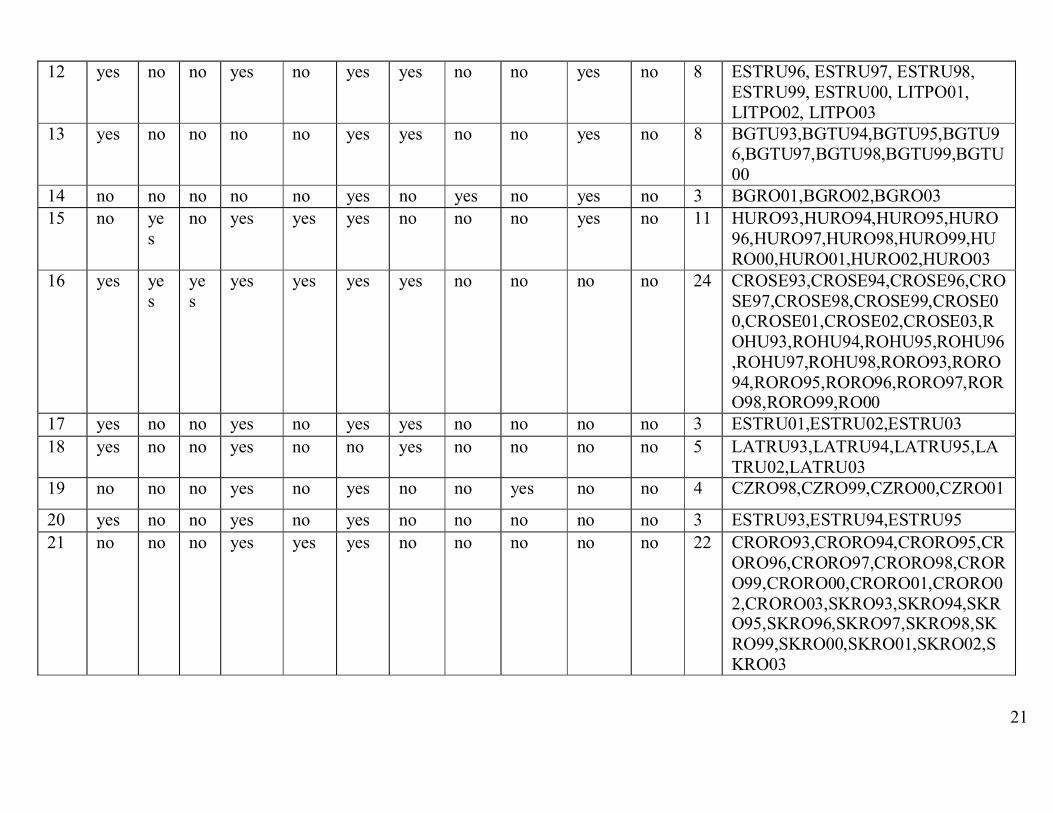
of minority representation. Columns 3 and 4 represent the active measures of the state to represent. Columns 5 and 6 show the passive measures. Columns 8-12 are the components of the effective dimension of minority representation. The first three of them form the sub-dimension of parliamentary representation, while the 11th and 12th form the sub-dimension of executive representation. The last column of the table shows which cases belong to the relevant combination and how many they are. The case descriptors consist of three elements – the abbreviations of the country and the minority group, plus the last two digits of the year for which the observation refers. For example in the Czech Republic, the minority group “Roma” in 1997 appears as CZRO97 in the dataset; the Turks in 2001 in Bulgaria as BGTU01 and so on. The next step of my analysis was to logically reduce these 24 combinations down to 12. This is done by comparing the different combinations. If two or more of them differ in the scores of only one condition, it can be ejected from the equation and these combinations become identical. Furthermore, I tried to find if these 12 combinations of conditions correspond to the four basic types of minority representation. Two of them could be classified as institutionalized minority representation. They have present active institutional guarantees and effective parliamentary as well as executive minority representation. These two combinations are shown in the first two rows of the table of equations (Table 5).
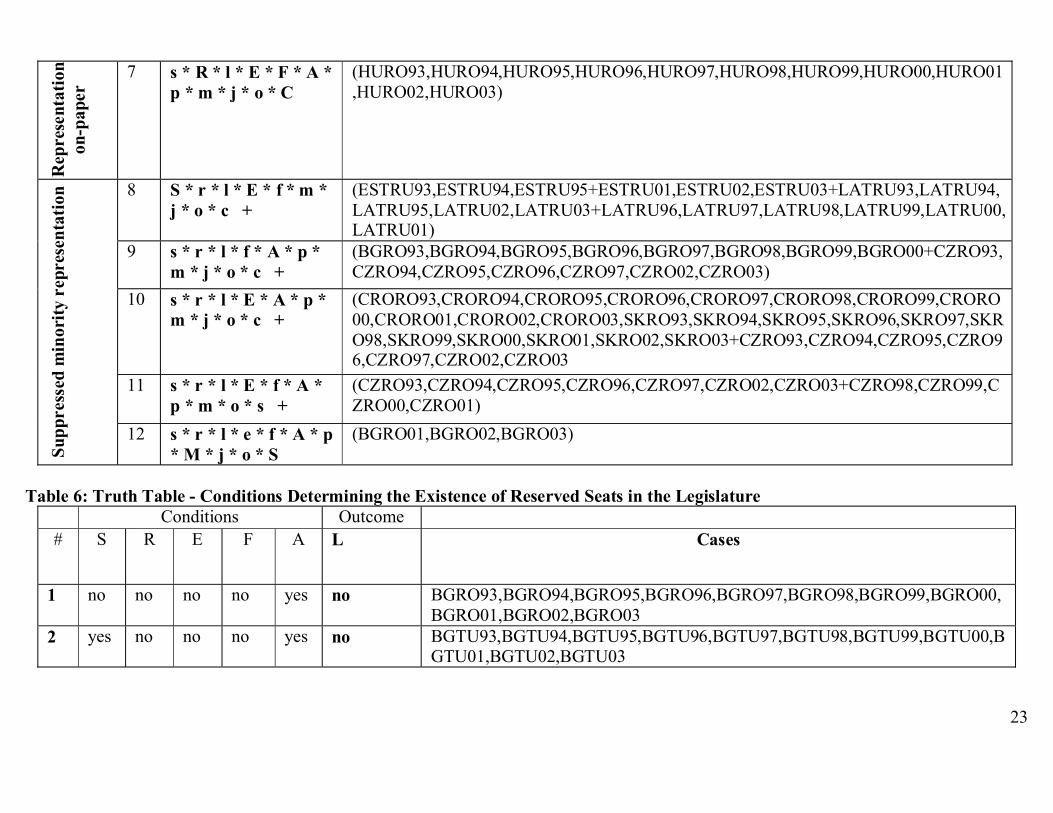
The next four rows of the table represent the equations that belong to non-institutionalized minority representation. In these cases we observe the presence of both effective parliamentary and executive representation parallel to the lack of active institutional measures ensuring them. Although a favorable electoral system in combination with one or more passive measures persists in these four equations, these types could not be classified as institutionalized, since the state is not taking any initiative in order to represent minorities. These minority groups have attained representation without the help of the state mainly due to their high number and disciplined vote for their ethnic parties. Row number 7 in the table represents only one – rather contradictory case. Although Roma in Hungary enjoy recognition by the state and are represented at certain levels of local power, which makes them the most represented Roma minority in the CEE region, they still have no access to power at the national level. That is why although this group scores yes on the indicators recognition by the state and access to civil, military, and police service 20 , it is not classified as institutionalized type of representation, but as represented on-paper. The last five rows of the table represent combinations of variables, which are classified as suppressed representation. These combinations show an absence of active institutional guarantees for representation and of effective representation. The only exception is the
20 See Table 4.
20
Table 4: Truth Table – 24 Patterns of Minority Representation # Institutional guarantees of minority
representation Effective minority representation Cases
S R L E F A P M J C O I II III IV V VI VII VIII IX X XI XII X
III
XIV
1 yes no no yes no yes yes yes no yes yes 3 LITRU01,LITRU02,LITRU03 2 yes no no yes yes yes yes no no yes yes 5 SKHU99,SKHU00,SKHU01,SKHU0
2,SKHU03 3 yes ye
s yes
yes yes yes yes no no yes yes 3 ROHU01,ROHU02,ROHU03
4 no yes
no yes no yes no no yes yes yes 11 CZSK93,CZSK94,CZSK95,CZSK96,CZSK97,CZSK98,CZSK99,CZSK00,CZSK01,CZSK02,CZSK03
5 yes no no yes no yes no yes no yes yes 8 LITRU93,LITRU94,LITRU95,LITRU96,LITRU97,LITRU98,LITRU99,LITRU00
6 yes no no yes no yes yes no no yes yes 8 LITPO93,LITPO94,LITPO95,LITPO96,LITPO97,LITPO98,LITPO99,LITPO00
7 yes no no no no yes yes no no yes yes 3 BGTU01,BGTU02,BGTU03 8 yes ye
s yes
yes yes yes yes no no no yes 3 CROSE95,ROHU99,ROHU00
9 yes yes
yes
yes yes yes yes no no yes no 3 RORO01,RORO02,RORO03
10 yes no no yes yes yes yes no no yes no 4 SKHU95,SKHU96,SKHU97,SKHU98
11 yes no no yes yes yes no yes no yes no 2 SKHU93,SKHU94
21
12 yes no no yes no yes yes no no yes no 8 ESTRU96, ESTRU97, ESTRU98, ESTRU99, ESTRU00, LITPO01, LITPO02, LITPO03
13 yes no no no no yes yes no no yes no 8 BGTU93,BGTU94,BGTU95,BGTU96,BGTU97,BGTU98,BGTU99,BGTU00
14 no no no no no yes no yes no yes no 3 BGRO01,BGRO02,BGRO03 15 no ye
s no yes yes yes no no no yes no 11 HURO93,HURO94,HURO95,HURO
96,HURO97,HURO98,HURO99,HURO00,HURO01,HURO02,HURO03
16 yes yes
yes
yes yes yes yes no no no no 24 CROSE93,CROSE94,CROSE96,CROSE97,CROSE98,CROSE99,CROSE00,CROSE01,CROSE02,CROSE03,ROHU93,ROHU94,ROHU95,ROHU96,ROHU97,ROHU98,RORO93,RORO94,RORO95,RORO96,RORO97,RORO98,RORO99,RO00
17 yes no no yes no yes yes no no no no 3 ESTRU01,ESTRU02,ESTRU03 18 yes no no yes no no yes no no no no 5 LATRU93,LATRU94,LATRU95,LA
TRU02,LATRU03 19 no no no yes no yes no no yes no no 4 CZRO98,CZRO99,CZRO00,CZRO01
20 yes no no yes no yes no no no no no 3 ESTRU93,ESTRU94,ESTRU95 21 no no no yes yes yes no no no no no 22 CRORO93,CRORO94,CRORO95,CR
ORO96,CRORO97,CRORO98,CRORO99,CRORO00,CRORO01,CRORO02,CRORO03,SKRO93,SKRO94,SKRO95,SKRO96,SKRO97,SKRO98,SKRO99,SKRO00,SKRO01,SKRO02,SKRO03
22
22 yes no no yes no no no no no no no 6 LATRU96,LATRU97,LATRU98,LATRU99,LATRU00,LATRU01
23 no no no yes no yes no no no no no 7 CZRO93,CZRO94,CZRO95,CZRO96,CZRO97,CZRO02,CZRO03
24 no no no no no yes no no no no no 8 BGRO93,BGRO94,BGRO95,BGRO96,BGRO97,BGRO98,BGRO99,BGRO00
Table 5: Table of Equations. Classification of the Cases
Type # Equation Cases 1 S * R * L * E * F * A
* P * m * j + (CROSE93,CROSE94,CROSE96,CROSE97,CROSE98,CROSE99,CROSE00,CROSE01,CROSE02,CROSE03,ROHU93,ROHU94,ROHU95,ROHU96,ROHU97,ROHU98,RORO93,RORO94,RORO95,RORO96,RORO97,RORO98,RORO99,RORO00+CROSE95,ROHU99,ROHU00+ROHU01,ROHU02,ROHU03+RORO01,RORO02,RORO03)
Inst
itutio
naliz
ed
min
ority
re
pres
enta
tion
2 s * R * l * E * f * A * p* m* M * O * C
(CZSK93,CZSK94,CZSK95,CZSK96,CZSK97,CZSK98,CZSK99,CZSK00,CZSK01,CZSK02,CZSK03)
3 S * r * l * E * F * A * p * M * j * o* C +
(SKHU93,SKHU94)
4 S * r * l * f * A * P * m * j * C +
(BGTU93,BGTU94,BGTU95,BGTU96,BGTU97,BGTU98,BGTU99,BGTU00+BGTU01,BGTU02,BGTU03+ESTRU96,ESTRU97,ESTRU98,ESTRU99,ESTRU00,LITPO01,LITPO02,LITPO03+LITPO93,LITPO94,LITPO95,LITPO96,LITPO97,LITPO98,LITPO99,LITPO00)
5 S * r * l * E * A * P * m * j * C +
(ESTRU96,ESTRU97,ESTRU98,ESTRU99,ESTRU00,LITPO01,LITPO02,LITPO03+LITPO93,LITPO94,LITPO95,LITPO96,LITPO97,LITPO98,LITPO99,LITPO00+SKHU95,SKHU96,SKHU97,SKHU98+SKHU99,SKHU00,SKHU01,SKHU02,SKHU03)
Non
-inst
itutio
naliz
ed m
inor
ity
repr
esen
tatio
n
6 S * r * l * E * f * A * M * j * O * C
(LITRU93,LITRU94,LITRU95,LITRU96,LITRU97,LITRU98,LITRU99,LITRU00+LITRU01,LITRU02,LITRU03)
23
Rep
rese
ntat
ion
on-p
aper
7 s * R * l * E * F * A * p * m * j * o * C
(HURO93,HURO94,HURO95,HURO96,HURO97,HURO98,HURO99,HURO00,HURO01,HURO02,HURO03)
8 S * r * l * E * f * m * j * o * c +
(ESTRU93,ESTRU94,ESTRU95+ESTRU01,ESTRU02,ESTRU03+LATRU93,LATRU94,LATRU95,LATRU02,LATRU03+LATRU96,LATRU97,LATRU98,LATRU99,LATRU00,LATRU01)
9 s * r * l * f * A * p * m * j * o * c +
(BGRO93,BGRO94,BGRO95,BGRO96,BGRO97,BGRO98,BGRO99,BGRO00+CZRO93,CZRO94,CZRO95,CZRO96,CZRO97,CZRO02,CZRO03)
10 s * r * l * E * A * p * m * j * o * c +
(CRORO93,CRORO94,CRORO95,CRORO96,CRORO97,CRORO98,CRORO99,CRORO00,CRORO01,CRORO02,CRORO03,SKRO93,SKRO94,SKRO95,SKRO96,SKRO97,SKRO98,SKRO99,SKRO00,SKRO01,SKRO02,SKRO03+CZRO93,CZRO94,CZRO95,CZRO96,CZRO97,CZRO02,CZRO03
11 s * r * l * E * f * A * p * m * o * s +
(CZRO93,CZRO94,CZRO95,CZRO96,CZRO97,CZRO02,CZRO03+CZRO98,CZRO99,CZRO00,CZRO01)
Supp
ress
ed m
inor
ity r
epre
sent
atio
n
12 s * r * l * e * f * A * p * M * j * o * S
(BGRO01,BGRO02,BGRO03)
Table 6: Truth Table - Conditions Determining the Existence of Reserved Seats in the Legislature
Conditions Outcome # S R E F A L Cases
1 no no no no yes no BGRO93,BGRO94,BGRO95,BGRO96,BGRO97,BGRO98,BGRO99,BGRO00,BGRO01,BGRO02,BGRO03
2 yes no no no yes no BGTU93,BGTU94,BGTU95,BGTU96,BGTU97,BGTU98,BGTU99,BGTU00,BGTU01,BGTU02,BGTU03
24
3 no no yes yes yes no CRORO93,CRORO94,CRORO95,CRORO96,CRORO97,CRORO98,CRORO99,CRORO00,CRORO01,CRORO02,CRORO03,SKRO93,SKRO94,SKRO95,SKRO96,SKRO97,SKRO98,SKRO99,SKRO00,SKRO01,SKRO02,SKRO03
4 yes yes yes yes yes yes CROSE93,CROSE94,CROSE95,CROSE96,CROSE97,CROSE98,CROSE99,CROSE00,CROSE01,CROSE02,CROSE03,ROHU93,ROHU94,ROHU95,ROHU96,ROHU97,ROHU98,ROHU99,ROHU00,ROHU01,ROHU02,ROHU03,RORO93,RORO94,RORO95,RORO96,RORO97,RORO98,RORO99,RORO00,RORO01,RORO02,RORO03
5 no no yes no yes no CZRO93,CZRO94,CZRO95,CZRO96,CZRO97,CZRO98,CZRO99,CZR O00,CZRO01,CZRO02,CZRO03
6 no yes yes no yes no CZSK93,CZSK94,CZSK95,CZSK96,CZSK97,CZSK98,CZSK99,CZSK00,CZSK01,CZSK02,CZSK03
7 yes no yes no yes no ESTRU93, ESTRU94, ESTRU95, ESTRU96, ESTRU97, ESTRU98, ESTRU99, ESTRU00, ESTRU01, ESTRU02, ESTRU03, LITPO93, LITPO94, ITPO95,LITPO96,LITPO97, LITPO98,LITPO99,LITPO00,LITPO01,LITPO02,LITPO03,LITRU93,LITRU94,LITRU95,LITRU96,LITRU97,LITRU98, LITRU99,LITRU00,LITRU01,LITRU02,LITRU03
8 no yes yes yes yes no HURO93,HURO94,HURO95,HURO96,HURO97,HURO98,HURO99, HURO00,HURO01,HURO02,HURO03
9 yes no yes no no no LATRU93,LATRU94,LATRU95,LATRU96,LATRU97,LATRU98,LATRU 99,LATRU00,LATRU01,LATRU02,LATRU03
10 yes no yes yes yes no SKHU93,SKHU94,SKHU95,SKHU96,SKHU97,SKHU98,SKHU99,SKHU00,SKHU01,SKHU02,SKHU03
25
case of Bulgarian Roma in the period 2001-2003. In the parliamentary elections in 2001, the predominantly ethnic Roma party “Evro Roma” ran in coalition with the Turkish ethnic party “Movement for Rights and Freedom” (Dvizhenie za Prava i Svobodi) and managed to win one seat in the parliament. Lately, Roma candidates have managed to win seats in municipal elections as well. That is why this minority group scores “yes” on mixed parties and access to civil, military, and police service. Despite that fact, Roma in Bulgaria remain the most disadvantaged social group, and this slight improvement of their representation practically did not lead to positive results. That is why this group is classified as not represented. However I encountered a problem. By mechanically reducing the number of combinations, Tosmana has combined logical types that are conceptually incompatible. For instance, in the table of equations, the Russian minority group in Latvia falls into the category of suppressed representation for the whole time period. However in the truth table we can see, that in 1993, 1994, 1995, 2002 and 2002 this minority group had parliamentary representation by its own political party (combination 18). Due to this fact, the need for refinement of the equations emerges. This will be done by grouping the indicators into blocks, and redefining the equations in a way that does not allow such conceptually incompatible types to be combined. Such refinement has another very beneficial effect for my analysis, which will be discussed later.
4.3 Refinement of the Equations and Defining Subtypes of Minority Representation Apart from combining conceptually incompatible patterns of representation, the mechanical reduction of combinations conceals some substantial differences within the four types of minority representation. In Section 2, I distinguished two categories of institutional guarantees – intentional and accidental. Within the intentional category are located the active and the passive institutional guarantees of minority representation. I have also distinguished two sub-dimensions of effective representation – parliamentary and executive. Using this categorization, I will make my typology of minority representation more sensitive. 4.3.1. Subtypes of Institutionalized Minority Representation Starting with the type of institutionalized minority representation we can see that the fist equation represents the cases of Croatian Serbs, Romanian Roma and Romanian Hungarians. Therefore they should form one type. As indicated by the equation, this type consists of a presence of all institutional conditions plus the presence of an ethnic minority party and an absence of mixed parties and of representatives in parties of the majority. The status of the conditions indicating representation in the executive is not shown in the equation. However, in the QCA Truth Table we can see that the Romanian Hungarians in 2001,
26
2002 and in 2003 score “yes” on both executive conditions21. Similarly, Serbs in Croatia (1995) and Hungarians in Romania (1999 and 2000) score “yes” on the condition indicating presence of minority office-holding (combination #8), while Roma in Romania (2001-2003) score “yes” on access to civil, military, and police service (combination #9). The procedure of logical simplification ejected these conditions from the equation and grouped the relevant cases together with those in combination #16. These two variables however are conceptually significant since they indicate whether the minority groups have real power or not. That is why I will reformulate the first equation to include the executive conditions as well. By performing this operation I will divide my first basic type into two subtypes. This will expand the explanatory function of my model. On the basis of the first equation in Table 5, and the four combinations of cases from the truth table - #3, #8, #9 and #16, I extracted the following two equations: • S*R*L*E*F*A*P → Institutionalized parliamentary representation • S*R*L*E*F*A*P*(C+O) → Institutionalized executive representation As indicated by the equations, the first type of my typology is divided into two subtypes: the subtype of institutionalized parliamentary representation and the subtype of institutionalized executive representation. This step brings more clarity to my model by establishing a second plane of explanation based on the different configurations of the elements of
21 See Table 4, combination #3.
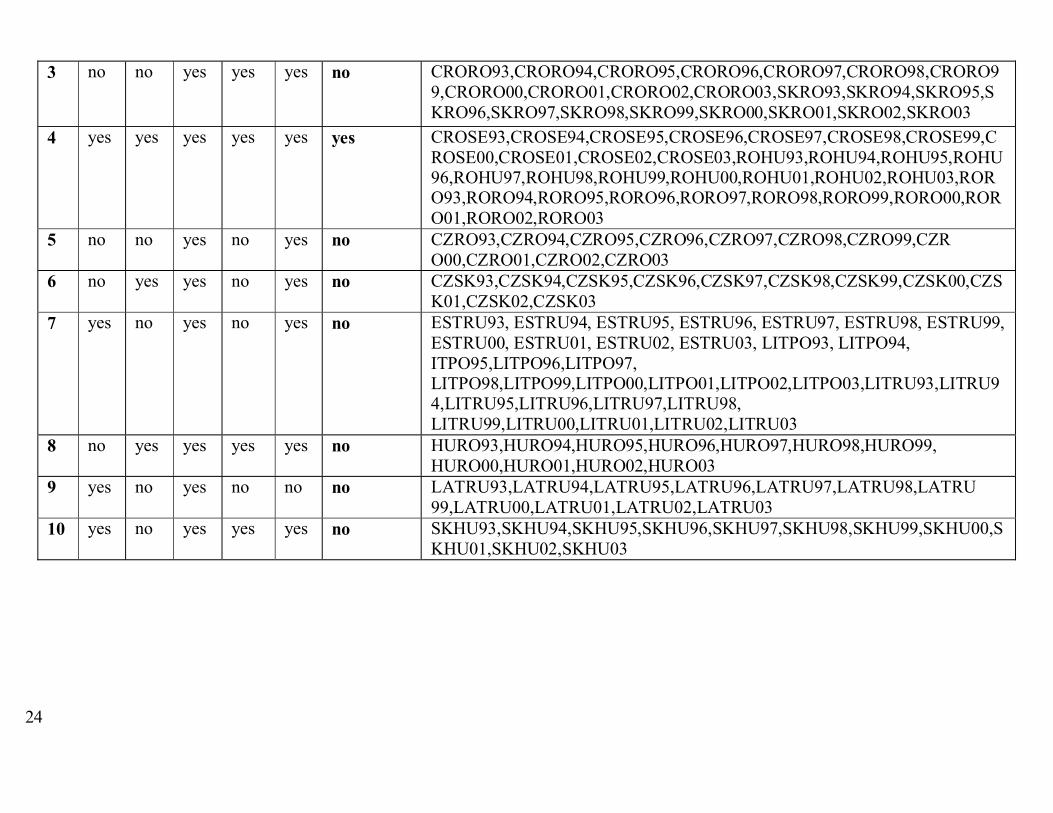
the second dimension of minority representation. These two equations, therefore, represent two conjunctional paths for achieving two types of institutionalized minority representation. The analytical advantages of the refinement of the first equation are two-fold. First, we can see that institutionalized executive representation is an upgrade of parliamentary representation. Hence, the existence of the latter is a necessary prerequisite for the existence of the former. Further, I include the time dimension in my analysis, and discover that first the type of institutionalized parliamentary representation occurs (Table 4, combination #16). Later it could evolve into institutionalized executive representation or remain unchanged. The second analytical advantage of the refinement refers to the institutional dimension of minority representation. As we can see from the equation table, this is the only conjunctional path that requires the presence of all the components of this dimension, and actually combines all the cases that score positively on the reserved seats in the legislature condition (L). This provoked me to check for conditional ties within the first dimension. I ran a test for dependence of the reserved seats component on the other five components of the institutional dimension. As we can see from the truth table (Table 6), reserved seats (outcome) are possible only if all other institutional guarantees are present (conditions).
27
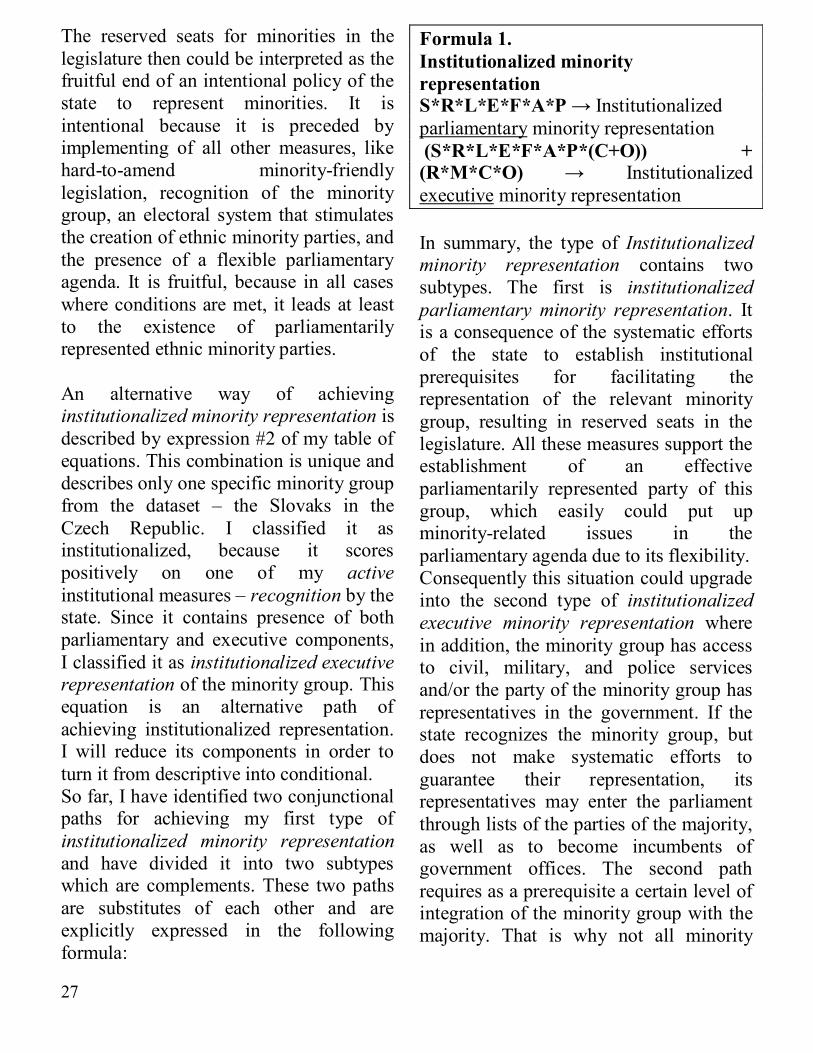
The reserved seats for minorities in the legislature then could be interpreted as the fruitful end of an intentional policy of the state to represent minorities. It is intentional because it is preceded by implementing of all other measures, like hard-to-amend minority-friendly legislation, recognition of the minority group, an electoral system that stimulates the creation of ethnic minority parties, and the presence of a flexible parliamentary agenda. It is fruitful, because in all cases where conditions are met, it leads at least to the existence of parliamentarily represented ethnic minority parties. An alternative way of achieving institutionalized minority representation is described by expression #2 of my table of equations. This combination is unique and describes only one specific minority group from the dataset – the Slovaks in the Czech Republic. I classified it as institutionalized, because it scores positively on one of my active institutional measures – recognition by the state. Since it contains presence of both parliamentary and executive components, I classified it as institutionalized executive representation of the minority group. This equation is an alternative path of achieving institutionalized representation. I will reduce its components in order to turn it from descriptive into conditional. So far, I have identified two conjunctional paths for achieving my first type of institutionalized minority representation and have divided it into two subtypes which are complements. These two paths are substitutes of each other and are explicitly expressed in the following formula:
Formula 1. Institutionalized minority representation S*R*L*E*F*A*P → Institutionalized parliamentary minority representation (S*R*L*E*F*A*P*(C+O)) + (R*M*C*O) → Institutionalized executive minority representation In summary, the type of Institutionalized minority representation contains two subtypes. The first is institutionalized parliamentary minority representation. It is a consequence of the systematic efforts of the state to establish institutional prerequisites for facilitating the representation of the relevant minority group, resulting in reserved seats in the legislature. All these measures support the establishment of an effective parliamentarily represented party of this group, which easily could put up minority-related issues in the parliamentary agenda due to its flexibility. Consequently this situation could upgrade into the second type of institutionalized executive minority representation where in addition, the minority group has access to civil, military, and police services and/or the party of the minority group has representatives in the government. If the state recognizes the minority group, but does not make systematic efforts to guarantee their representation, its representatives may enter the parliament through lists of the parties of the majority, as well as to become incumbents of government offices. The second path requires as a prerequisite a certain level of integration of the minority group with the majority. That is why not all minority
28
groups could use this path as is the case of the Roma, for example. 4.3.2. Subtypes of Non-institutionalized Minority Representation Next in the table of the equations are represented the four expressions that build up my second type of non-institutionalized minority representation. For all four of them, the absence of the active institutional measures is common. However, all cases represented by them have representatives in the legislature either by their own ethnic or mixed parties, or both. Some of them in addition gain access to civil, military and police service, and others go even further by gaining control over ministerial offices. The four equations in Table 5, however, do not demonstrate these specifics. Even more, there are cases which should be classified as represented, but are combined with others that have no representatives either on the parliamentary or executive level. For example the cases from combinations #17 and #18 of the truth table (Table 4), which have positive scores on the effective ethnic minority parties indicator, are logically included in equation #8 in the table of equations, which falls into the type of suppressed representation. As the problem of logically combining conceptually incompatible patterns occurs here as well, I performed a refinement of the equations included in that basic type of minority representation. The common factor for all the cases that fall into this type is that they are represented, but all of them lack active institutional guarantees
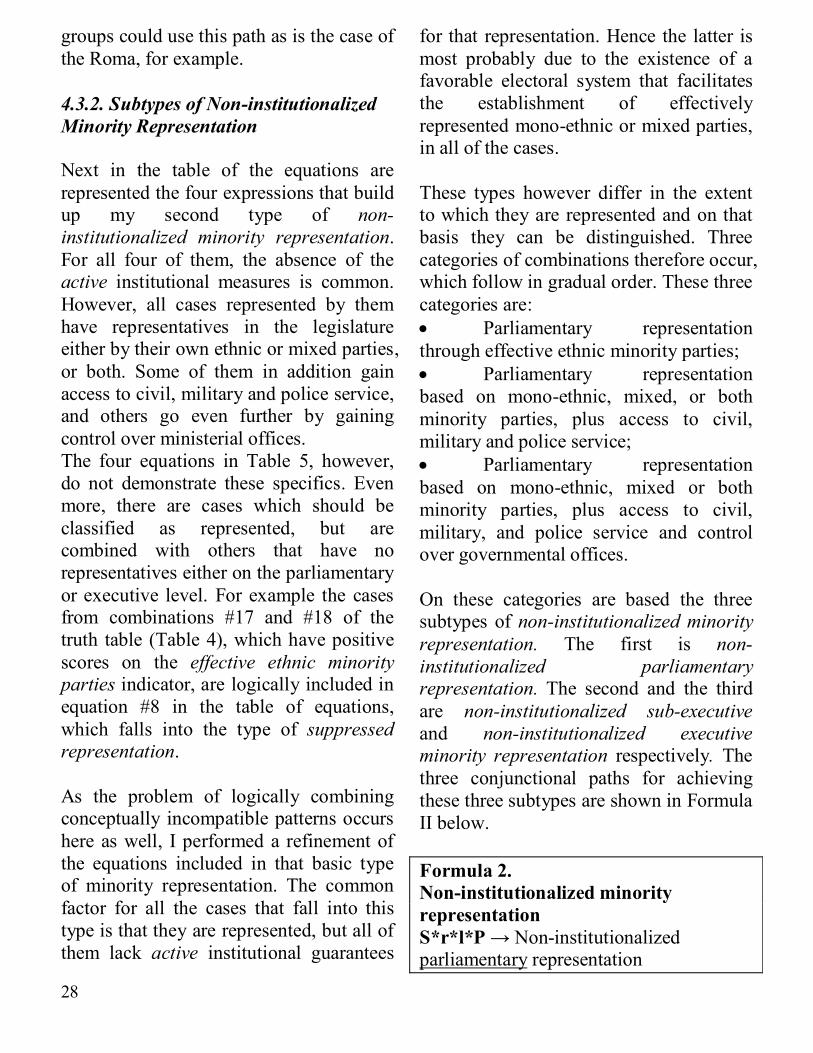
for that representation. Hence the latter is most probably due to the existence of a favorable electoral system that facilitates the establishment of effectively represented mono-ethnic or mixed parties, in all of the cases. These types however differ in the extent to which they are represented and on that basis they can be distinguished. Three categories of combinations therefore occur, which follow in gradual order. These three categories are: • Parliamentary representation through effective ethnic minority parties; • Parliamentary representation based on mono-ethnic, mixed, or both minority parties, plus access to civil, military and police service; • Parliamentary representation based on mono-ethnic, mixed or both minority parties, plus access to civil, military, and police service and control over governmental offices. On these categories are based the three subtypes of non-institutionalized minority representation. The first is non-institutionalized parliamentary representation. The second and the third are non-institutionalized sub-executive and non-institutionalized executive minority representation respectively. The three conjunctional paths for achieving these three subtypes are shown in Formula II below. Formula 2. Non-institutionalized minority representation S*r*l*P → Non-institutionalized parliamentary representation
29
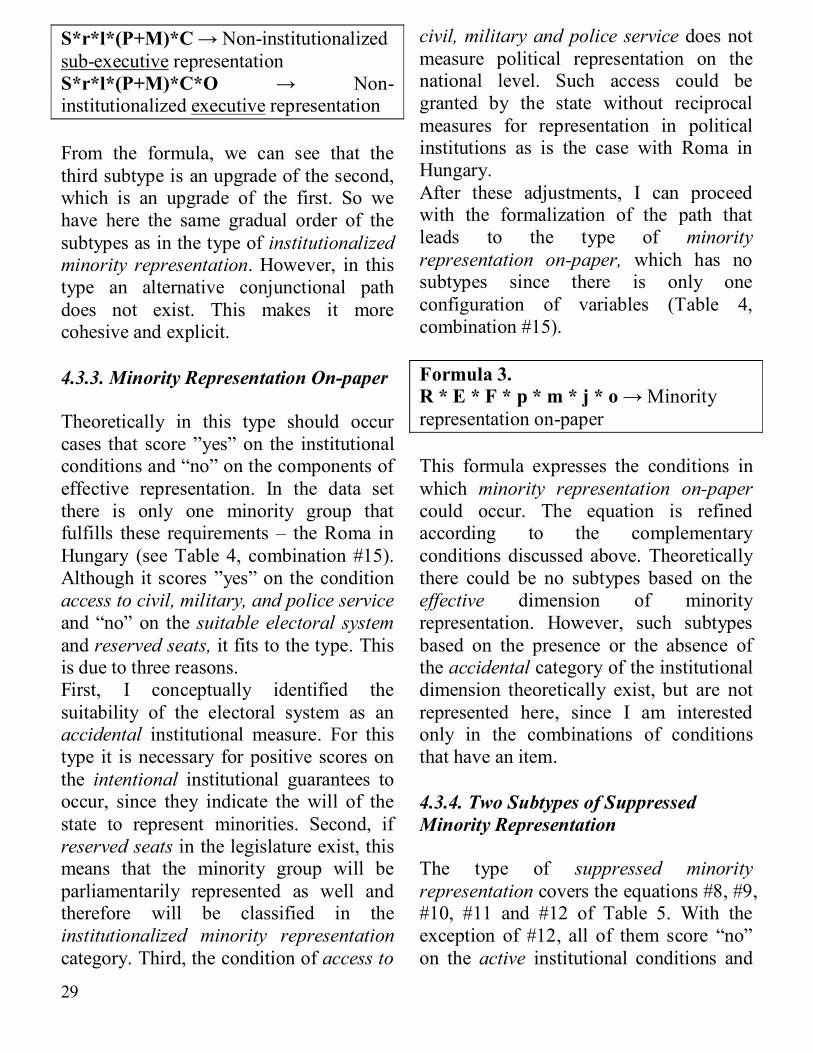
S*r*l*(P+M)*C → Non-institutionalized sub-executive representation S*r*l*(P+M)*C*O → Non-institutionalized executive representation From the formula, we can see that the third subtype is an upgrade of the second, which is an upgrade of the first. So we have here the same gradual order of the subtypes as in the type of institutionalized minority representation. However, in this type an alternative conjunctional path does not exist. This makes it more cohesive and explicit. 4.3.3. Minority Representation On-paper Theoretically in this type should occur cases that score ”yes” on the institutional conditions and “no” on the components of effective representation. In the data set there is only one minority group that fulfills these requirements – the Roma in Hungary (see Table 4, combination #15). Although it scores ”yes” on the condition access to civil, military, and police service and “no” on the suitable electoral system and reserved seats, it fits to the type. This is due to three reasons. First, I conceptually identified the suitability of the electoral system as an accidental institutional measure. For this type it is necessary for positive scores on the intentional institutional guarantees to occur, since they indicate the will of the state to represent minorities. Second, if reserved seats in the legislature exist, this means that the minority group will be parliamentarily represented as well and therefore will be classified in the institutionalized minority representation category. Third, the condition of access to
civil, military and police service does not measure political representation on the national level. Such access could be granted by the state without reciprocal measures for representation in political institutions as is the case with Roma in Hungary. After these adjustments, I can proceed with the formalization of the path that leads to the type of minority representation on-paper, which has no subtypes since there is only one configuration of variables (Table 4, combination #15). Formula 3. R * E * F * p * m * j * o → Minority representation on-paper
This formula expresses the conditions in which minority representation on-paper could occur. The equation is refined according to the complementary conditions discussed above. Theoretically there could be no subtypes based on the effective dimension of minority representation. However, such subtypes based on the presence or the absence of the accidental category of the institutional dimension theoretically exist, but are not represented here, since I am interested only in the combinations of conditions that have an item. 4.3.4. Two Subtypes of Suppressed Minority Representation The type of suppressed minority representation covers the equations #8, #9, #10, #11 and #12 of Table 5. With the exception of #12, all of them score “no” on the active institutional conditions and
30
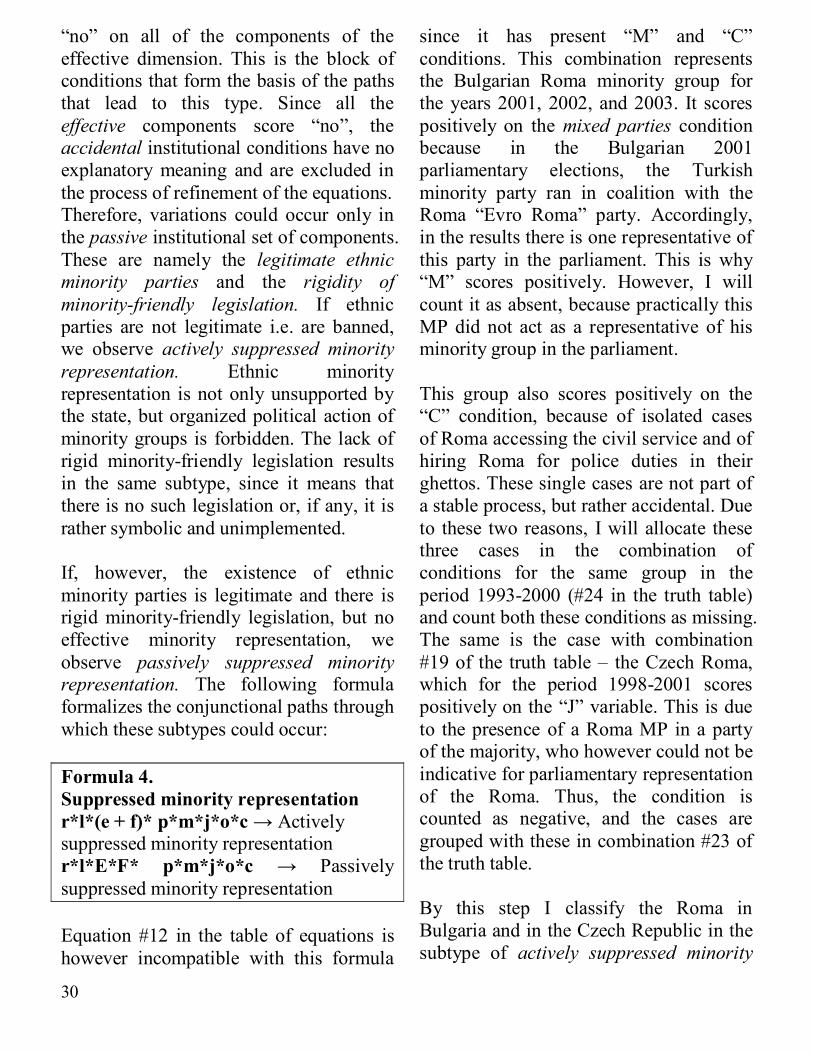
“no” on all of the components of the effective dimension. This is the block of conditions that form the basis of the paths that lead to this type. Since all the effective components score “no”, the accidental institutional conditions have no explanatory meaning and are excluded in the process of refinement of the equations. Therefore, variations could occur only in the passive institutional set of components. These are namely the legitimate ethnic minority parties and the rigidity of minority-friendly legislation. If ethnic parties are not legitimate i.e. are banned, we observe actively suppressed minority representation. Ethnic minority representation is not only unsupported by the state, but organized political action of minority groups is forbidden. The lack of rigid minority-friendly legislation results in the same subtype, since it means that there is no such legislation or, if any, it is rather symbolic and unimplemented. If, however, the existence of ethnic minority parties is legitimate and there is rigid minority-friendly legislation, but no effective minority representation, we observe passively suppressed minority representation. The following formula formalizes the conjunctional paths through which these subtypes could occur: Formula 4. Suppressed minority representation r*l*(e + f)* p*m*j*o*c → Actively suppressed minority representation r*l*E*F* p*m*j*o*c → Passively suppressed minority representation Equation #12 in the table of equations is however incompatible with this formula
since it has present “M” and “C” conditions. This combination represents the Bulgarian Roma minority group for the years 2001, 2002, and 2003. It scores positively on the mixed parties condition because in the Bulgarian 2001 parliamentary elections, the Turkish minority party ran in coalition with the Roma “Evro Roma” party. Accordingly, in the results there is one representative of this party in the parliament. This is why “M” scores positively. However, I will count it as absent, because practically this MP did not act as a representative of his minority group in the parliament. This group also scores positively on the “C” condition, because of isolated cases of Roma accessing the civil service and of hiring Roma for police duties in their ghettos. These single cases are not part of a stable process, but rather accidental. Due to these two reasons, I will allocate these three cases in the combination of conditions for the same group in the period 1993-2000 (#24 in the truth table) and count both these conditions as missing. The same is the case with combination #19 of the truth table – the Czech Roma, which for the period 1998-2001 scores positively on the “J” variable. This is due to the presence of a Roma MP in a party of the majority, who however could not be indicative for parliamentary representation of the Roma. Thus, the condition is counted as negative, and the cases are grouped with these in combination #23 of the truth table. By this step I classify the Roma in Bulgaria and in the Czech Republic in the subtype of actively suppressed minority
31
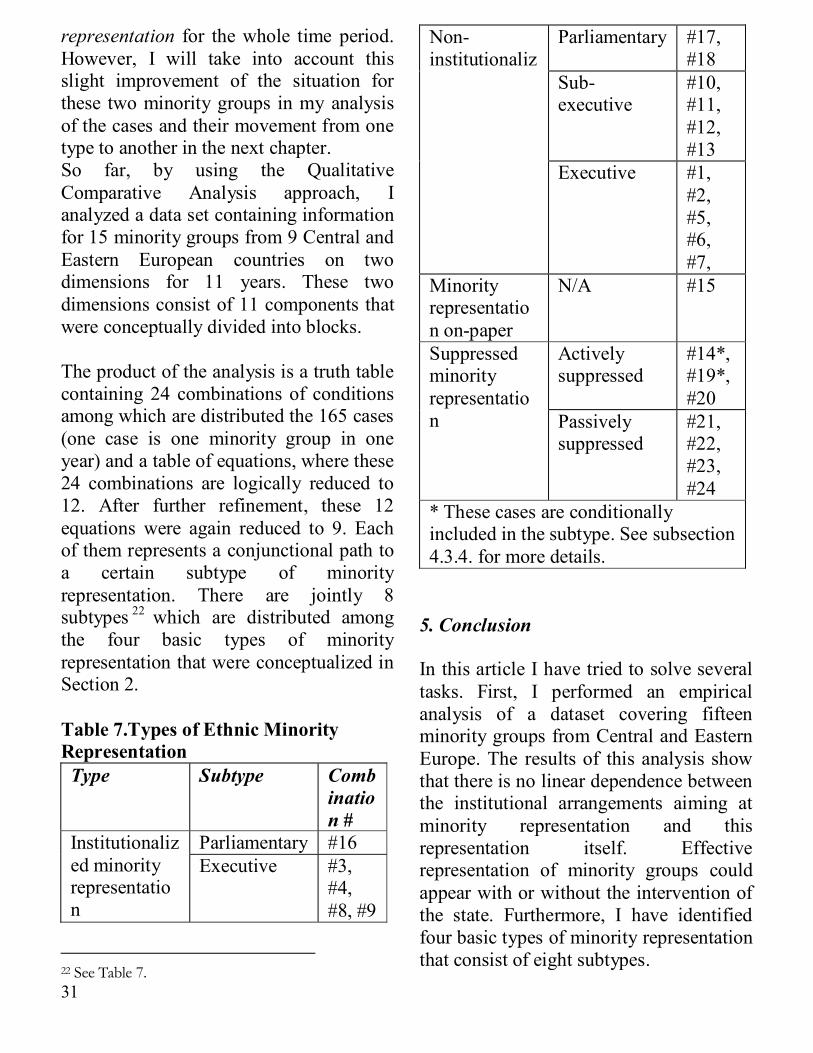
representation for the whole time period. However, I will take into account this slight improvement of the situation for these two minority groups in my analysis of the cases and their movement from one type to another in the next chapter. So far, by using the Qualitative Comparative Analysis approach, I analyzed a data set containing information for 15 minority groups from 9 Central and Eastern European countries on two dimensions for 11 years. These two dimensions consist of 11 components that were conceptually divided into blocks. The product of the analysis is a truth table containing 24 combinations of conditions among which are distributed the 165 cases (one case is one minority group in one year) and a table of equations, where these 24 combinations are logically reduced to 12. After further refinement, these 12 equations were again reduced to 9. Each of them represents a conjunctional path to a certain subtype of minority representation. There are jointly 8 subtypes 22 which are distributed among the four basic types of minority representation that were conceptualized in Section 2. Table 7.Types of Ethnic Minority Representation Type Subtype Comb
ination #
Parliamentary #16 Institutionalized minority representation
Executive #3, #4, #8, #9
22 See Table 7.
Parliamentary #17, #18
Sub-executive
#10, #11, #12, #13
Non-institutionaliz
Executive #1, #2, #5, #6, #7,
Minority representation on-paper
N/A #15
Actively suppressed
#14*, #19*, #20
Suppressed minority representation Passively
suppressed #21, #22, #23, #24
* These cases are conditionally included in the subtype. See subsection 4.3.4. for more details.
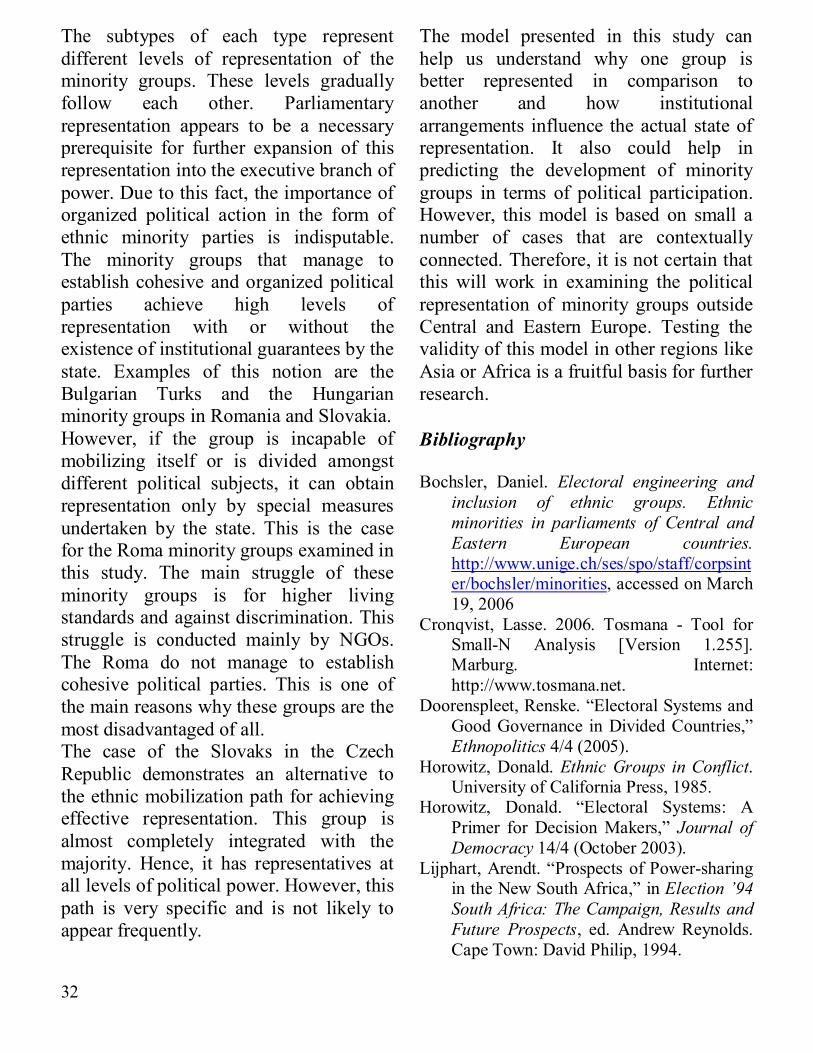
5. Conclusion In this article I have tried to solve several tasks. First, I performed an empirical analysis of a dataset covering fifteen minority groups from Central and Eastern Europe. The results of this analysis show that there is no linear dependence between the institutional arrangements aiming at minority representation and this representation itself. Effective representation of minority groups could appear with or without the intervention of the state. Furthermore, I have identified four basic types of minority representation that consist of eight subtypes.
32
The subtypes of each type represent different levels of representation of the minority groups. These levels gradually follow each other. Parliamentary representation appears to be a necessary prerequisite for further expansion of this representation into the executive branch of power. Due to this fact, the importance of organized political action in the form of ethnic minority parties is indisputable. The minority groups that manage to establish cohesive and organized political parties achieve high levels of representation with or without the existence of institutional guarantees by the state. Examples of this notion are the Bulgarian Turks and the Hungarian minority groups in Romania and Slovakia. However, if the group is incapable of mobilizing itself or is divided amongst different political subjects, it can obtain representation only by special measures undertaken by the state. This is the case for the Roma minority groups examined in this study. The main struggle of these minority groups is for higher living standards and against discrimination. This struggle is conducted mainly by NGOs. The Roma do not manage to establish cohesive political parties. This is one of the main reasons why these groups are the most disadvantaged of all. The case of the Slovaks in the Czech Republic demonstrates an alternative to the ethnic mobilization path for achieving effective representation. This group is almost completely integrated with the majority. Hence, it has representatives at all levels of political power. However, this path is very specific and is not likely to appear frequently.
The model presented in this study can help us understand why one group is better represented in comparison to another and how institutional arrangements influence the actual state of representation. It also could help in predicting the development of minority groups in terms of political participation. However, this model is based on small a number of cases that are contextually connected. Therefore, it is not certain that this will work in examining the political representation of minority groups outside Central and Eastern Europe. Testing the validity of this model in other regions like Asia or Africa is a fruitful basis for further research. Bibliography Bochsler, Daniel. Electoral engineering and
inclusion of ethnic groups. Ethnic minorities in parliaments of Central and Eastern European countries. http://www.unige.ch/ses/spo/staff/corpsinter/bochsler/minorities, accessed on March 19, 2006
Cronqvist, Lasse. 2006. Tosmana - Tool for Small-N Analysis [Version 1.255]. Marburg. Internet: http://www.tosmana.net.
Doorenspleet, Renske. “Electoral Systems and Good Governance in Divided Countries,” Ethnopolitics 4/4 (2005).
Horowitz, Donald. Ethnic Groups in Conflict. University of California Press, 1985.
Horowitz, Donald. “Electoral Systems: A Primer for Decision Makers,” Journal of Democracy 14/4 (October 2003).
Lijphart, Arendt. “Prospects of Power-sharing in the New South Africa,” in Election ’94 South Africa: The Campaign, Results and Future Prospects, ed. Andrew Reynolds. Cape Town: David Philip, 1994.
33
Lijphart, Arendt, “Democracies: forms, performance and constitutional engineering,” European Journal of Political Research 25/1 (1994).
Lijphart, Arendt, Patterns of Democracy. Government Forms and Performance in Thirty-Six Countries. Yale University Press, 1999.
Lijphart, Arendt, “Constitutional Design for Divided Societies,” Journal of Democracy 15/2 (April, 2004).
Minorities at Risk Project (2005) College Park, MD: Center for International Development and Conflict Management. Retrieved from http://www.cidcm.umd.edu/inscr/mar/ on: [May/20/2006]
Norris, Pippa. Stable democracy and good governance in divided societies: Do power-sharing institutions work? Paper presented at the ISA 46th annual convention, Honolulu, March 5, 2005.
Project on Political Transformation and the Electoral Process in Post-Communist Europe (2002): University of Essex. Retrieved from http://www.essex.ac.uk/elections/ on: [May/20/2006]
Ragin, Charles. The Comparative Method: Moving Beyond Qualitative and Quantitative. Berkeley: University of California Press, 1987.
Reilly, Benjamin. Democracy in Divided Societies. Electoral Engineering of Conflict management. Cambridge University Press, 200.
Taagepera, Rein and Matthew Shugart. Seats and Votes. The Effects and Determinants of Electoral Systems. Yale University Press, 1989.
Thorsten Beck, George Clarke, Alberto Groff, Philip Keefer, and Patrick Walsh. "New tools in comparative political economy: The Database of Political Institutions," World Bank Economic Review 15:1 (September 2001): 165-76.
Normative Documents Used Charter of fundamental Rights and Freedoms
of the Czech Republic. Retrieved from http://www.psp.cz/cgi-bin/eng/docs/laws/charter.html on: [May/20/2006]
Constitution of Romania. Retrieved from http://domino.kappa.ro/guvern/constitutia-e.html on: [May/20/2006]
Constitution of the Czech Republic. Retrieved from http://www.psp.cz/cgi-bin/eng/docs/laws/constitution.html(art.%20 on: [May/20/2006]
Constitution of the Republic of Bulgaria. Retrieved from http://parliament.bg/?page=const&lng=en on: [May/20/2006]
Constitution of the Republic of Croatia. Retrieved from http://www.constitution.org/cons/croatia.htm on: [May/20/2006]
Constitution of the Republic of Estonia. Retrieved from http://www.president.ee/en/estonia/constitution.php on: [May/20/2006]
Constitution of the Republic of Hungary. Retrieved from http://www.vescc.com/constitution/hungary-constitution-eng.html on: [May/20/2006]
Constitution of the Republic of Latvia. Retrieved from http://www.satv.tiesa.gov.lv/ENG/satversme.htm on: [May/20/2006]
Constitution of the Republic of Lithuania. Retrieved from http://www3.lrs.lt/home/Konstitucija/Constitution.htm on: [May/20/2006]
Constitution of the Slovak Republic. Retrieved from http://www.oefre.unibe.ch /law/icl/lo00000_.html on: [May/20/2006]
http://www.oefre.unibe.ch/law/icl/lo00000_.html on: [May/20/2006]