Embed Size (px)
Citation preview
UCF Data Analytics and Visualization Boot Camp Powered by Trilogy Education Services
Over the past decade, the explosion of data has transformed nearly every industry known to
man. Whether it’s marketing, healthcare, government, or activism—the ability to translate data
into actionable insights has quickly become a highly in-demand skill by all. UCF Data Analytics
and Visualization Boot Camp is a part-time, 24-week program that will empower students to
gain the knowledge and skills to conduct robust analytics on a host of real-world problems.
The program is designed to fit into your life, whether you’re employed or attending
college full-time, with convenient weekend and evening sessions.
The program is rigorous, fast-paced, and focused on the practical technical skills needed
to solve data problems. Throughout the course, students gain proficiencies on numerous
marketable technologies, including Excel, Python, JavaScript, SQL Databases, Tableau, and
more. Plus, students leave with an impressive professional portfolio and the confidence to
succeed in the data-driven economy.
CURRICULUM OVERVIEW
UCF DATA ANALYTICS AND VISUALIZATION BOOT CAMP
1UCF Data Analytics and Visualization Boot Camp Powered by Trilogy Education Services
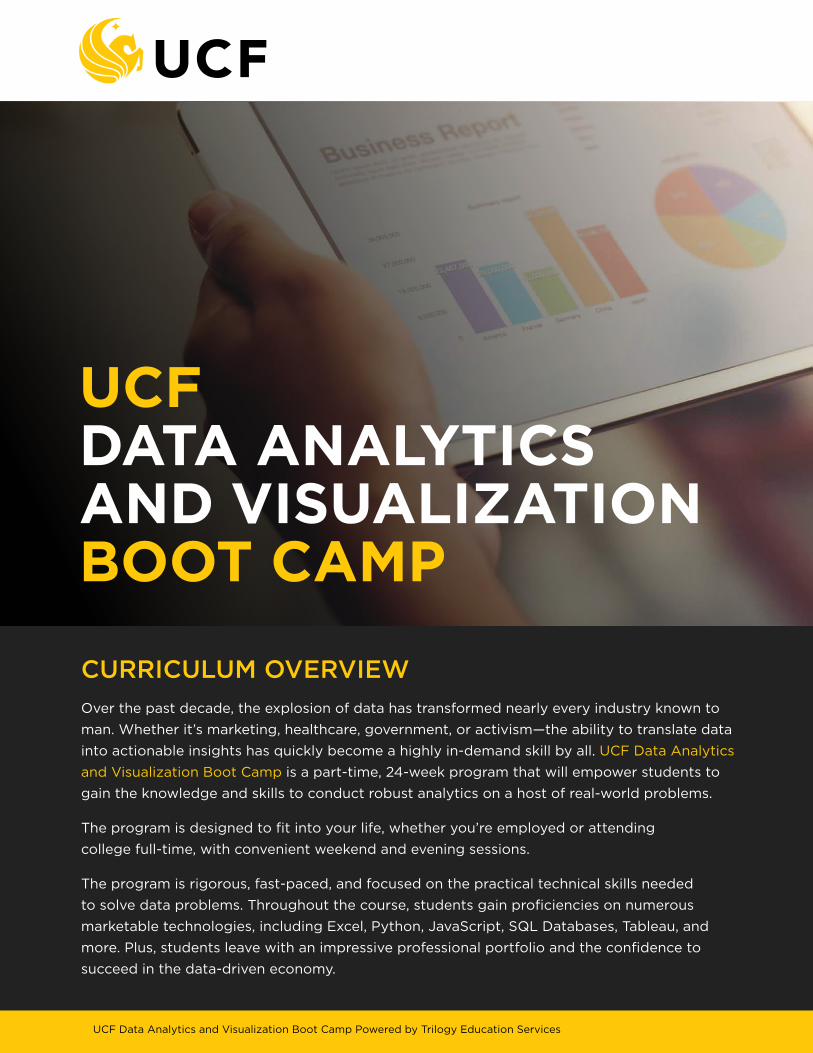
Are you a creative, curious, and ambitious professional looking to join the data revolution?
If so--or if any of the following describes your situation--enrolling in our Data Analytics
and Visualiztion Boot Camp could be a smart career move:
You are currently a professional working with data, but are looking to advance
your career by building technical skills.
You are a manager or professional in a business where data can be used to
boost your company’s bottom line.
You have interests in visualizing social, consumer, or popular trends.
You are looking to enter a new field in healthcare, government, or media and are
looking for a way to jump in.
You are a full-time student, hungry to learn more and expand your skill set.
IS THE PROGRAM RIGHT FOR YOU?
2UCF Data Analytics and Visualization Boot Camp Powered by Trilogy Education Services
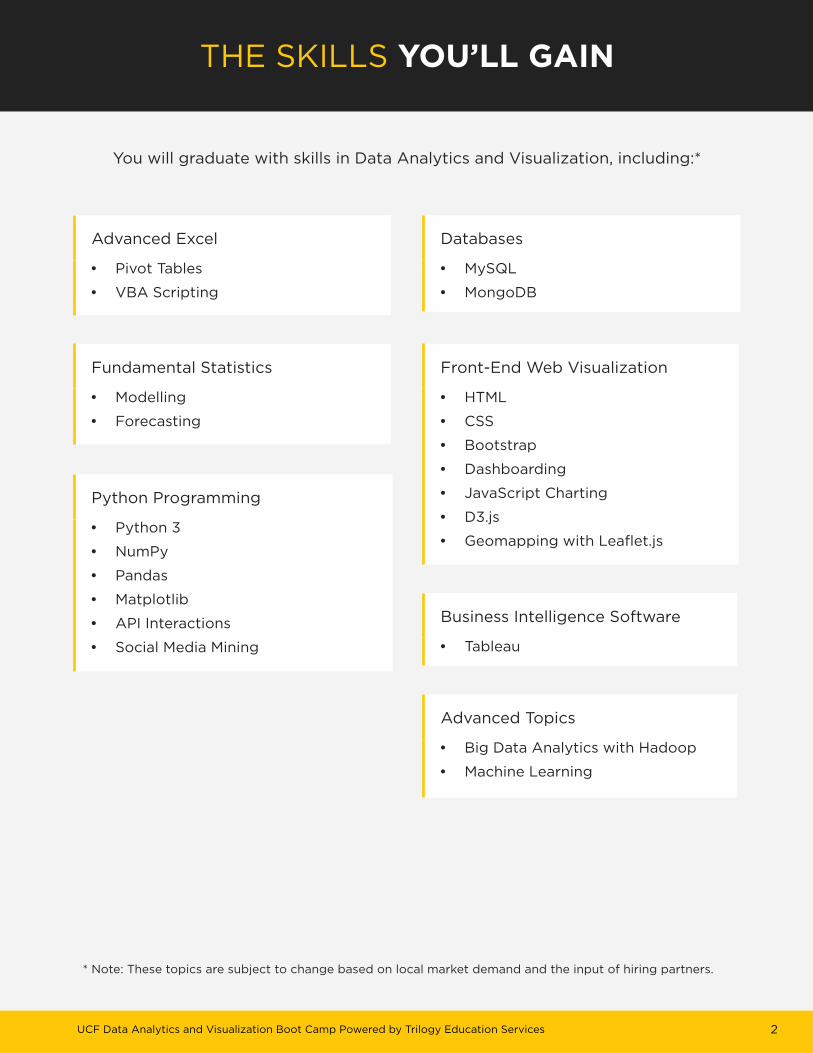
You will graduate with skills in Data Analytics and Visualization, including:*
* Note: These topics are subject to change based on local market demand and the input of hiring partners.
Fundamental Statistics
• Modelling
• Forecasting
Advanced Excel
• Pivot Tables
• VBA Scripting
Front-End Web Visualization
• HTML
• CSS
• Bootstrap
• Dashboarding
• JavaScript Charting
• D3.js
• Geomapping with Leaflet.js
Business Intelligence Software
• Tableau
Advanced Topics
• Big Data Analytics with Hadoop
• Machine Learning
Python Programming
• Python 3
• NumPy
• Pandas
• Matplotlib
• API Interactions
• Social Media Mining
Databases
• MySQL
• MongoDB
THE SKILLS YOU’LL GAIN
3UCF Data Analytics and Visualization Boot Camp Powered by Trilogy Education Services
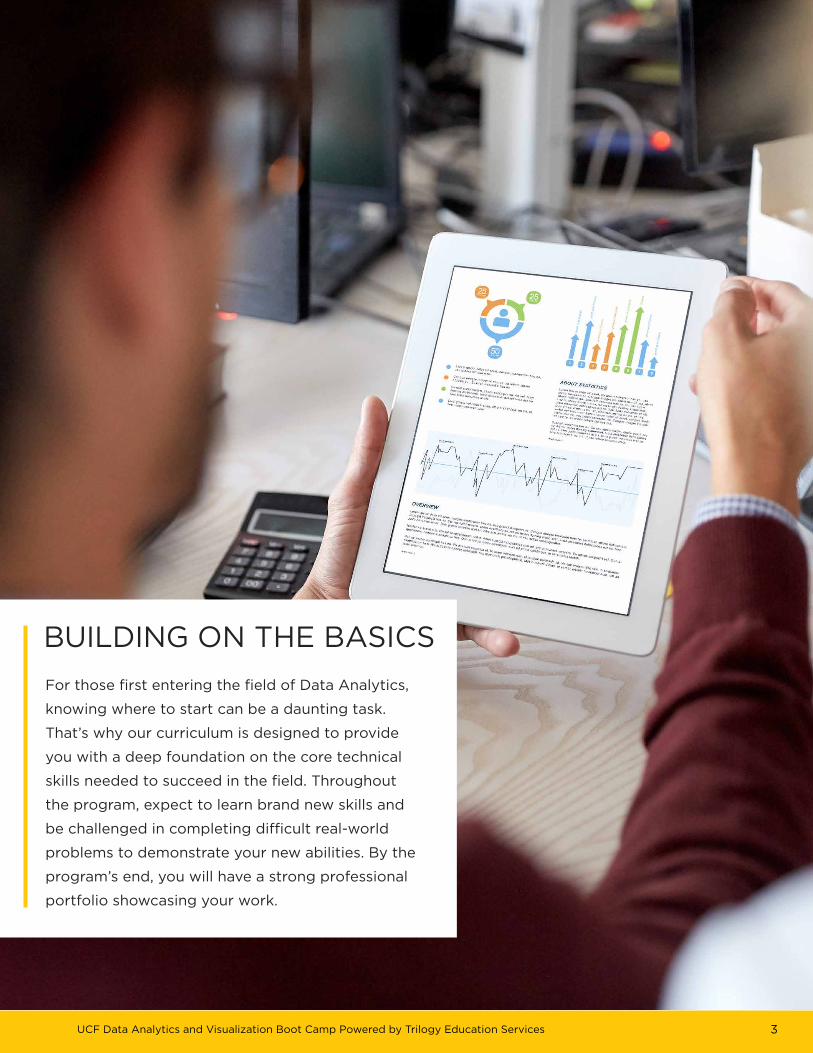
BUILDING ON THE BASICS
For those first entering the field of Data Analytics,
knowing where to start can be a daunting task.
That’s why our curriculum is designed to provide
you with a deep foundation on the core technical
skills needed to succeed in the field. Throughout
the program, expect to learn brand new skills and
be challenged in completing difficult real-world
problems to demonstrate your new abilities. By the
program’s end, you will have a strong professional
portfolio showcasing your work.
4UCF Data Analytics and Visualization Boot Camp Powered by Trilogy Education Services
Data Analyst
Database AdministratorData Engineer
Big Data EngineerData Scientist
Business Intelligence AnalystData Journalist
Research AnalystBusiness Analyst
Software EngineerSQL Developer
Systems Engineer
Our graduates will be qualified for many different roles, including:
REAL PROJECTS, REAL JOBS
5UCF Data Analytics and Visualization Boot Camp Powered by Trilogy Education Services
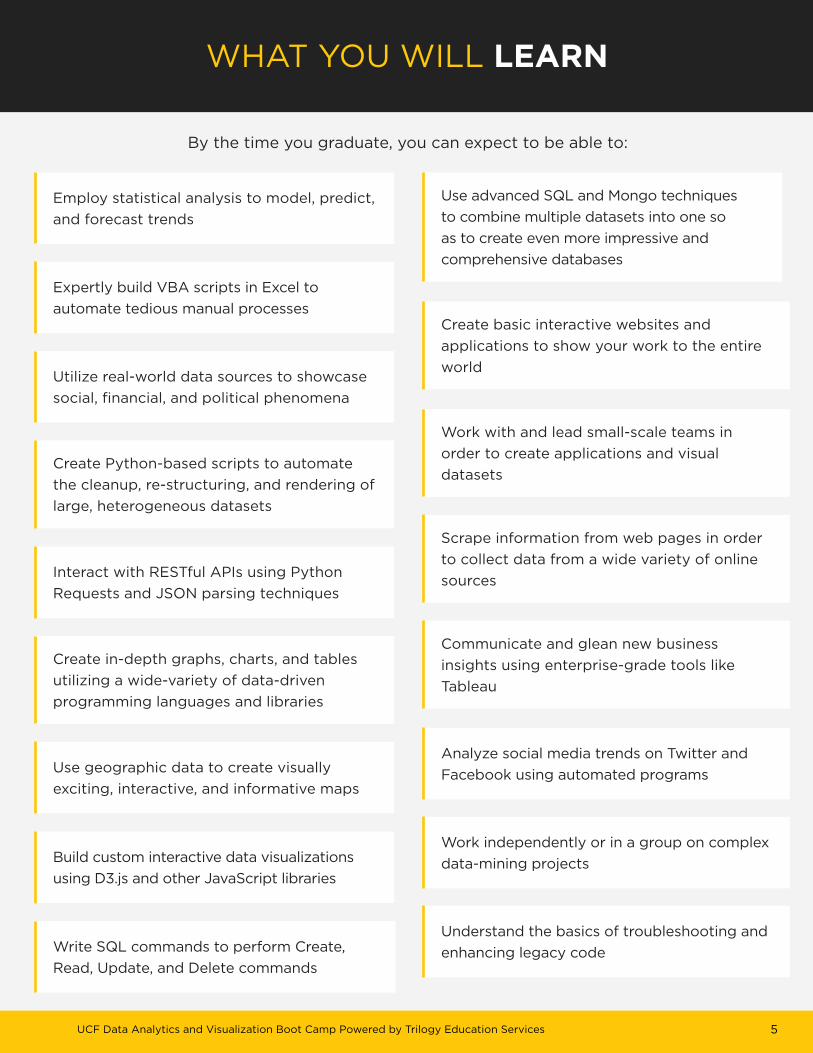
Employ statistical analysis to model, predict,
and forecast trends
Expertly build VBA scripts in Excel to
automate tedious manual processes
Build custom interactive data visualizations
using D3.js and other JavaScript libraries
Use advanced SQL and Mongo techniques
to combine multiple datasets into one so
as to create even more impressive and
comprehensive databases
Utilize real-world data sources to showcase
social, financial, and political phenomena
Create in-depth graphs, charts, and tables
utilizing a wide-variety of data-driven
programming languages and libraries
Create Python-based scripts to automate
the cleanup, re-structuring, and rendering of
large, heterogeneous datasets
Interact with RESTful APIs using Python
Requests and JSON parsing techniques
Use geographic data to create visually
exciting, interactive, and informative maps
Write SQL commands to perform Create,
Read, Update, and Delete commands
Create basic interactive websites and
applications to show your work to the entire
world
Work with and lead small-scale teams in
order to create applications and visual
datasets
Scrape information from web pages in order
to collect data from a wide variety of online
sources
Communicate and glean new business
insights using enterprise-grade tools like
Tableau
Analyze social media trends on Twitter and
Facebook using automated programs
Work independently or in a group on complex
data-mining projects
Understand the basics of troubleshooting and
enhancing legacy code
By the time you graduate, you can expect to be able to:
WHAT YOU WILL LEARN
6UCF Data Analytics and Visualization Boot Camp Powered by Trilogy Education Services
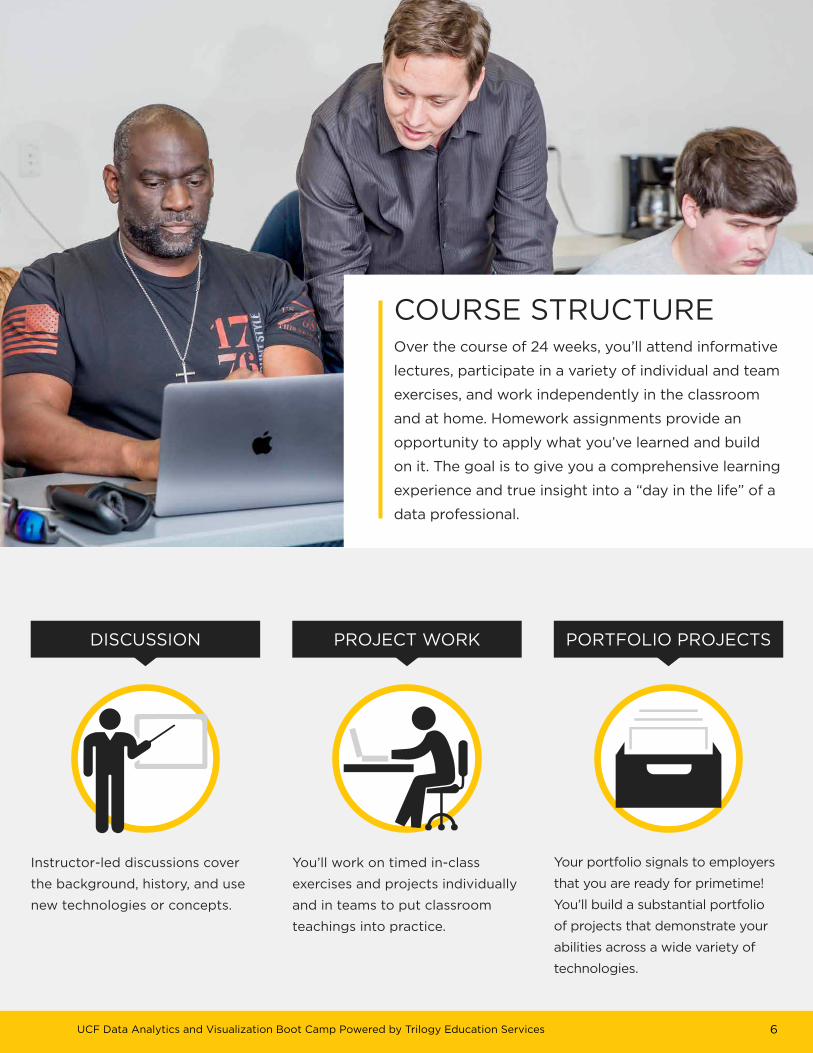
PORTFOLIO PROJECTSPROJECT WORKDISCUSSION
Your portfolio signals to employers
that you are ready for primetime!
You’ll build a substantial portfolio
of projects that demonstrate your
abilities across a wide variety of
technologies.
You’ll work on timed in-class
exercises and projects individually
and in teams to put classroom
teachings into practice.
Instructor-led discussions cover
the background, history, and use
new technologies or concepts.
COURSE STRUCTUREOver the course of 24 weeks, you’ll attend informative
lectures, participate in a variety of individual and team
exercises, and work independently in the classroom
and at home. Homework assignments provide an
opportunity to apply what you’ve learned and build
on it. The goal is to give you a comprehensive learning
experience and true insight into a “day in the life” of a
data professional.
7UCF Data Analytics and Visualization Boot Camp Powered by Trilogy Education Services
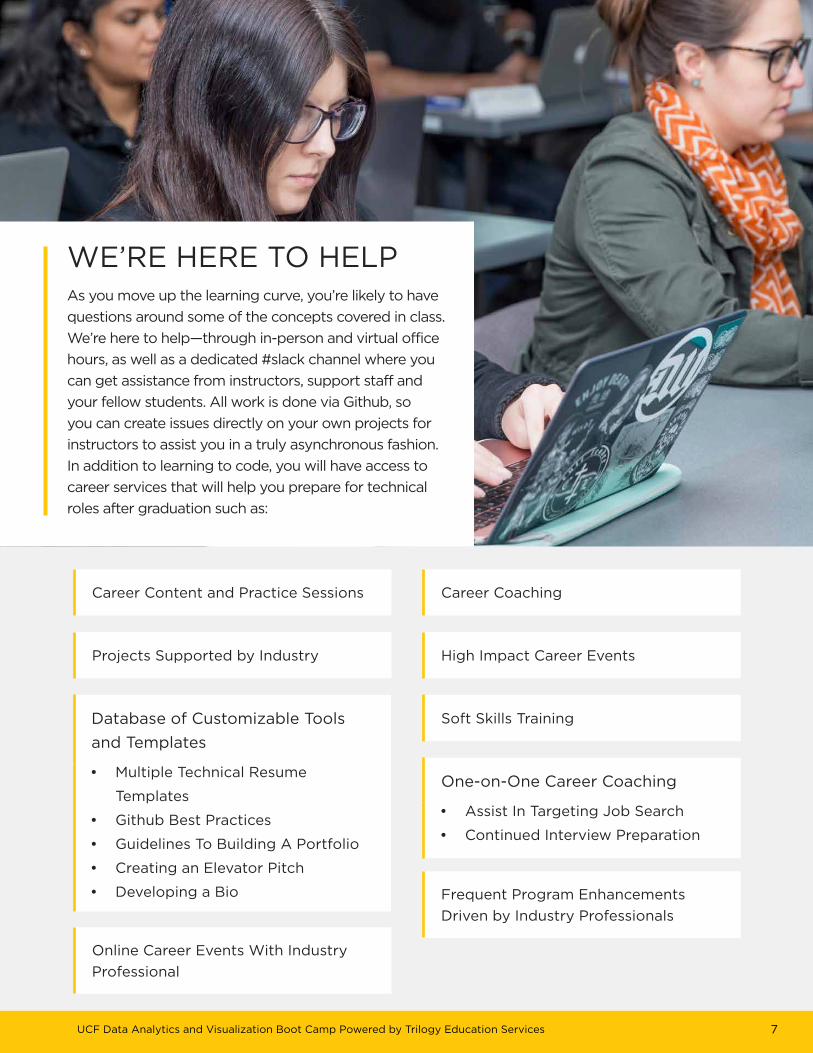
WE’RE HERE TO HELPAs you move up the learning curve, you’re likely to have
questions around some of the concepts covered in class.
We’re here to help—through in-person and virtual office
hours, as well as a dedicated #slack channel where you
can get assistance from instructors, support staff and
your fellow students. All work is done via Github, so
you can create issues directly on your own projects for
instructors to assist you in a truly asynchronous fashion.
In addition to learning to code, you will have access to
career services that will help you prepare for technical
roles after graduation such as:
Career Content and Practice Sessions
Projects Supported by Industry
Online Career Events With Industry
Professional
Career Coaching
High Impact Career Events
Soft Skills Training
Frequent Program Enhancements
Driven by Industry Professionals
Database of Customizable Tools
and Templates
• Multiple Technical Resume
Templates
• Github Best Practices
• Guidelines To Building A Portfolio
• Creating an Elevator Pitch
• Developing a Bio
One-on-One Career Coaching
• Assist In Targeting Job Search
• Continued Interview Preparation
8UCF Data Analytics and Visualization Boot Camp Powered by Trilogy Education Services
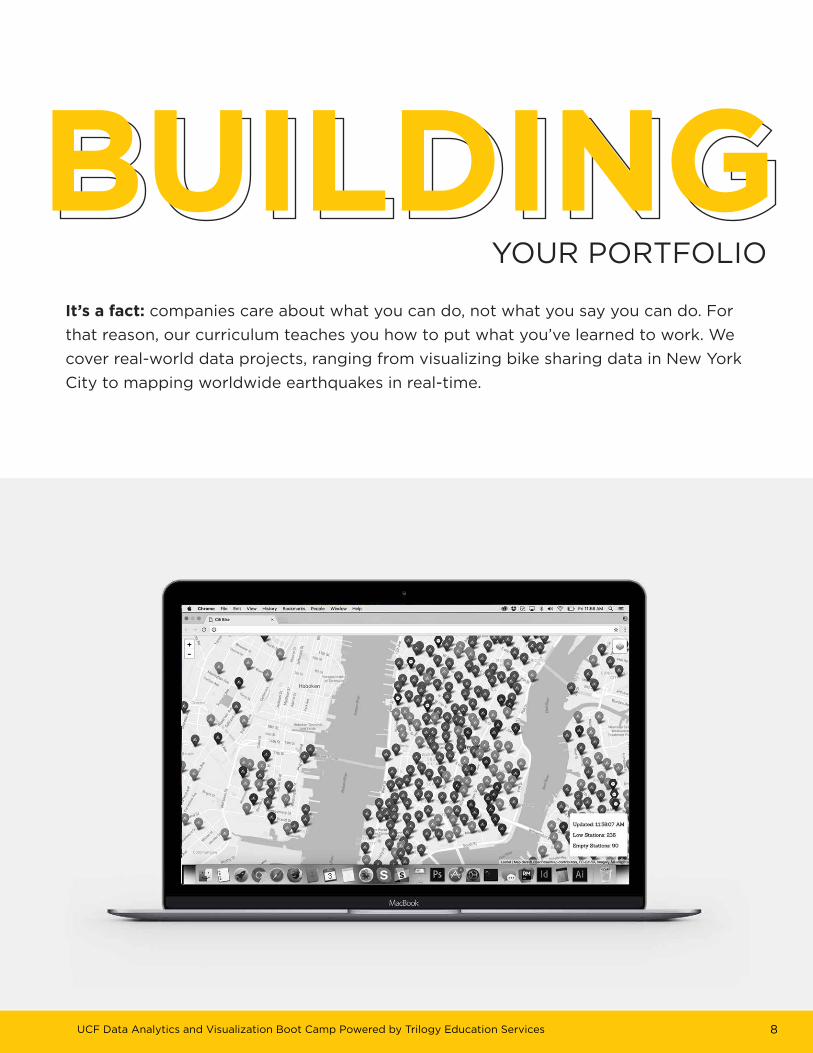
YOUR PORTFOLIO
It’s a fact: companies care about what you can do, not what you say you can do. For
that reason, our curriculum teaches you how to put what you’ve learned to work. We
cover real-world data projects, ranging from visualizing bike sharing data in New York
City to mapping worldwide earthquakes in real-time.
BUILDING
9UCF Data Analytics and Visualization Boot Camp Powered by Trilogy Education Services
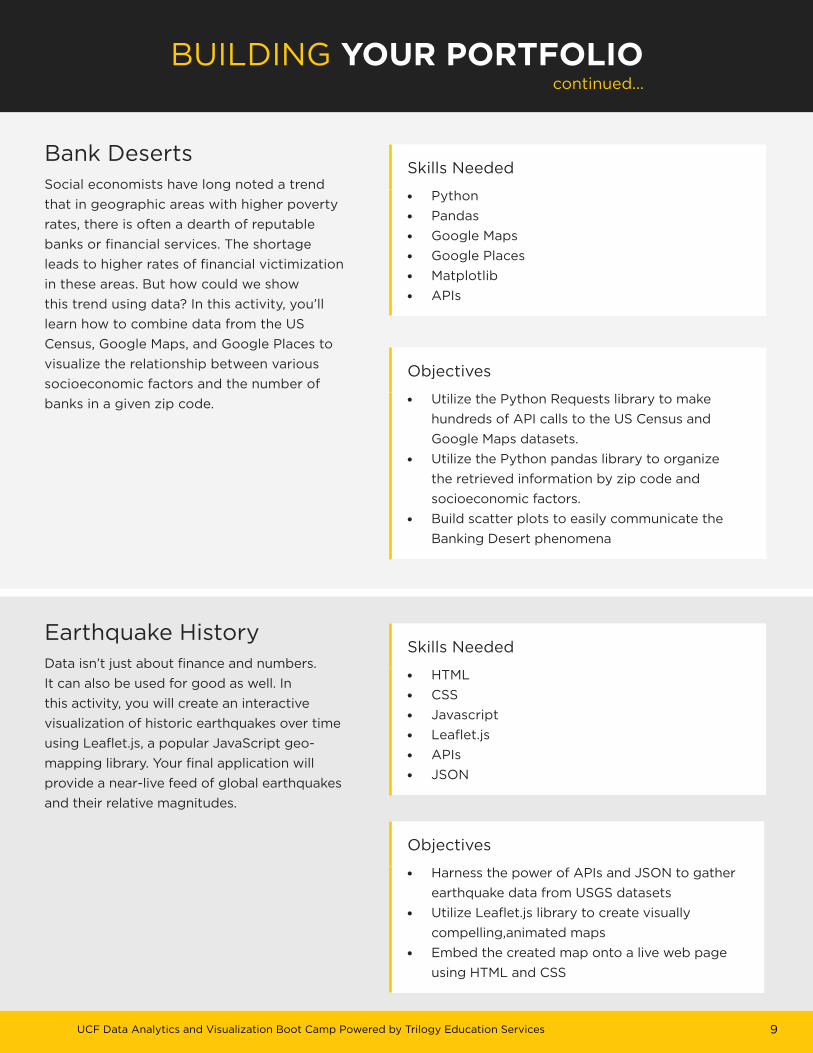
Bank DesertsSocial economists have long noted a trend
that in geographic areas with higher poverty
rates, there is often a dearth of reputable
banks or financial services. The shortage
leads to higher rates of financial victimization
in these areas. But how could we show
this trend using data? In this activity, you’ll
learn how to combine data from the US
Census, Google Maps, and Google Places to
visualize the relationship between various
socioeconomic factors and the number of
banks in a given zip code.
Earthquake History Data isn’t just about finance and numbers.
It can also be used for good as well. In
this activity, you will create an interactive
visualization of historic earthquakes over time
using Leaflet.js, a popular JavaScript geo-
mapping library. Your final application will
provide a near-live feed of global earthquakes
and their relative magnitudes.
Skills Needed
• Python
• Pandas
• Google Maps
• Google Places
• Matplotlib
• APIs
Skills Needed
• HTML
• CSS
• Javascript
• Leaflet.js
• APIs
• JSON
Objectives
• Utilize the Python Requests library to make
hundreds of API calls to the US Census and
Google Maps datasets.
• Utilize the Python pandas library to organize
the retrieved information by zip code and
socioeconomic factors.
• Build scatter plots to easily communicate the
Banking Desert phenomena
Objectives
• Harness the power of APIs and JSON to gather
earthquake data from USGS datasets
• Utilize Leaflet.js library to create visually
compelling,animated maps
• Embed the created map onto a live web page
using HTML and CSS
BUILDING YOUR PORTFOLIOcontinued...
10UCF Data Analytics and Visualization Boot Camp Powered by Trilogy Education Services
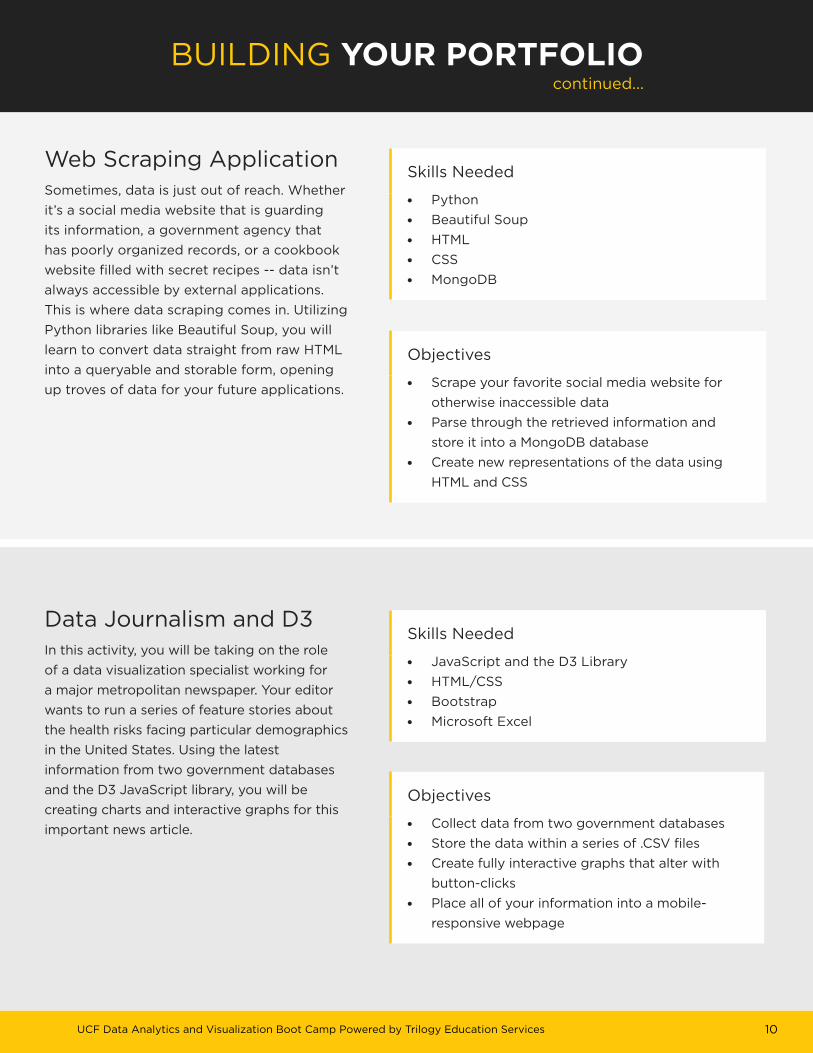
Web Scraping ApplicationSometimes, data is just out of reach. Whether
it’s a social media website that is guarding
its information, a government agency that
has poorly organized records, or a cookbook
website filled with secret recipes -- data isn’t
always accessible by external applications.
This is where data scraping comes in. Utilizing
Python libraries like Beautiful Soup, you will
learn to convert data straight from raw HTML
into a queryable and storable form, opening
up troves of data for your future applications.
Data Journalism and D3 In this activity, you will be taking on the role
of a data visualization specialist working for
a major metropolitan newspaper. Your editor
wants to run a series of feature stories about
the health risks facing particular demographics
in the United States. Using the latest
information from two government databases
and the D3 JavaScript library, you will be
creating charts and interactive graphs for this
important news article.
Skills Needed
• Python
• Beautiful Soup
• HTML
• CSS
• MongoDB
Skills Needed
• JavaScript and the D3 Library
• HTML/CSS
• Bootstrap
• Microsoft Excel
Objectives
• Scrape your favorite social media website for
otherwise inaccessible data
• Parse through the retrieved information and
store it into a MongoDB database
• Create new representations of the data using
HTML and CSS
Objectives
• Collect data from two government databases
• Store the data within a series of .CSV files
• Create fully interactive graphs that alter with
button-clicks
• Place all of your information into a mobile-
responsive webpage
BUILDING YOUR PORTFOLIOcontinued...
11UCF Data Analytics and Visualization Boot Camp Powered by Trilogy Education Services
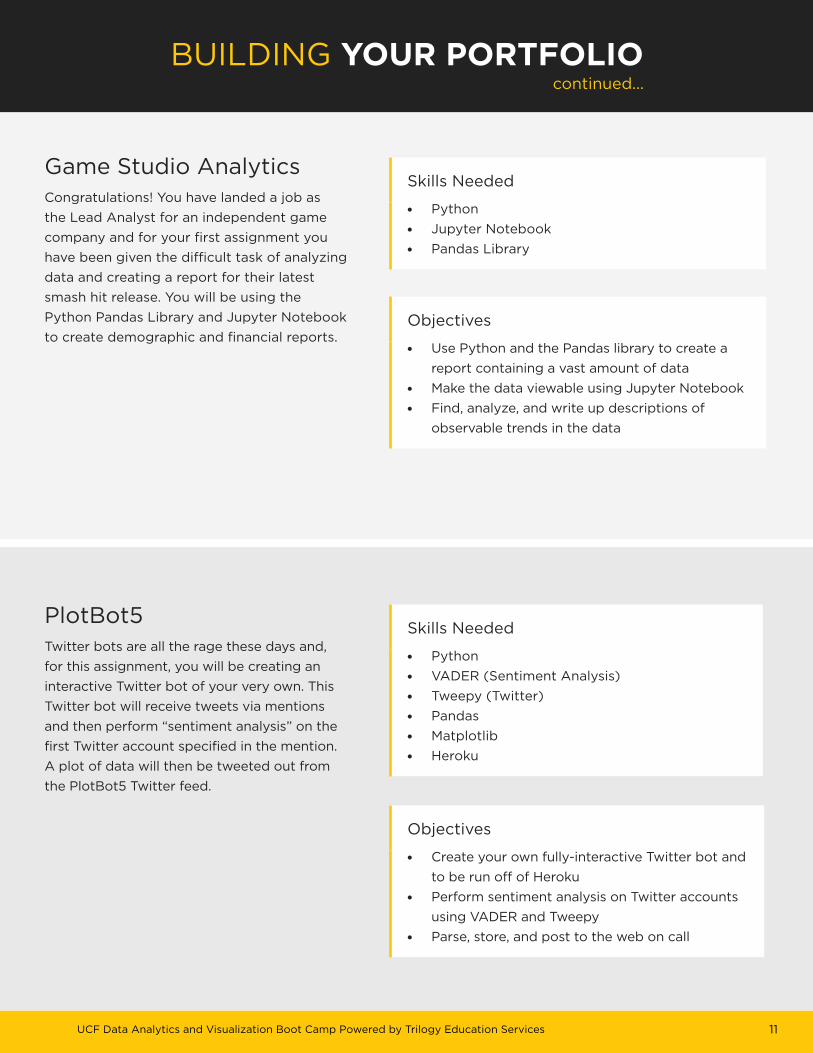
Game Studio AnalyticsCongratulations! You have landed a job as
the Lead Analyst for an independent game
company and for your first assignment you
have been given the difficult task of analyzing
data and creating a report for their latest
smash hit release. You will be using the
Python Pandas Library and Jupyter Notebook
to create demographic and financial reports.
PlotBot5 Twitter bots are all the rage these days and,
for this assignment, you will be creating an
interactive Twitter bot of your very own. This
Twitter bot will receive tweets via mentions
and then perform “sentiment analysis” on the
first Twitter account specified in the mention.
A plot of data will then be tweeted out from
the PlotBot5 Twitter feed.
Skills Needed
• Python
• Jupyter Notebook
• Pandas Library
Skills Needed
• Python
• VADER (Sentiment Analysis)
• Tweepy (Twitter)
• Pandas
• Matplotlib
• Heroku
Objectives
• Use Python and the Pandas library to create a
report containing a vast amount of data
• Make the data viewable using Jupyter Notebook
• Find, analyze, and write up descriptions of
observable trends in the data
Objectives
• Create your own fully-interactive Twitter bot and
to be run off of Heroku
• Perform sentiment analysis on Twitter accounts
using VADER and Tweepy
• Parse, store, and post to the web on call
BUILDING YOUR PORTFOLIOcontinued...
12UCF Data Analytics and Visualization Boot Camp Powered by Trilogy Education Services
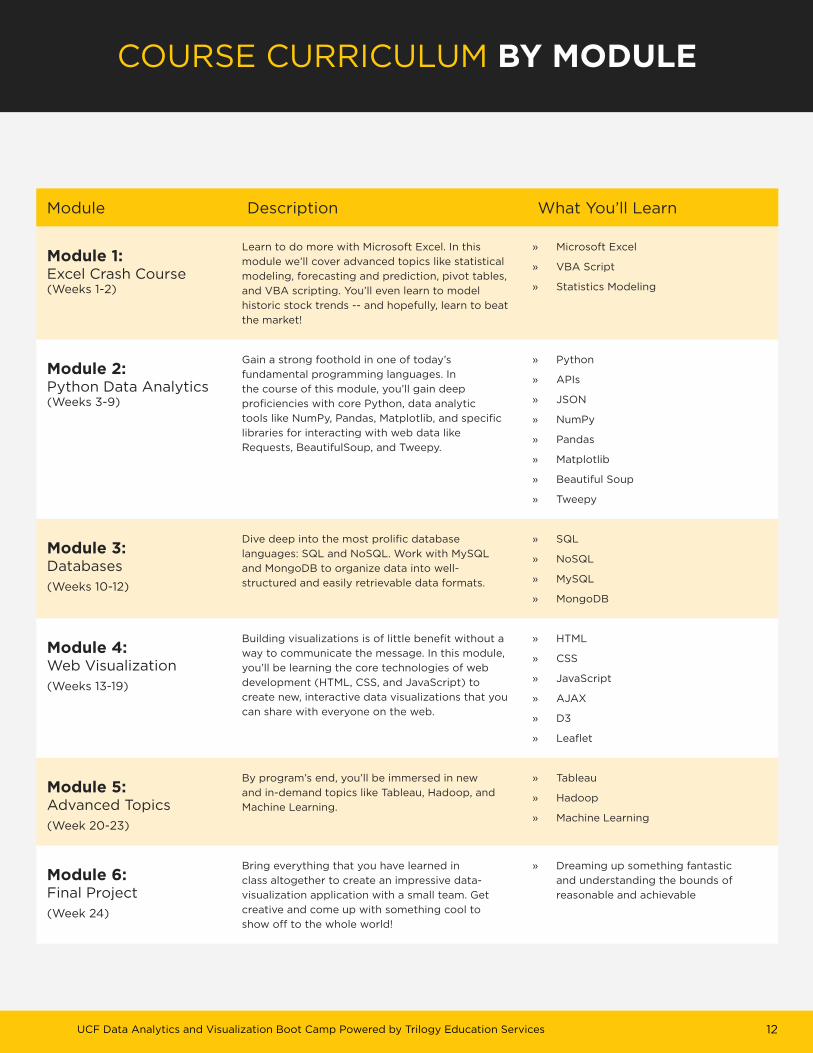
Module Description What You’ll Learn
Module 1: Excel Crash Course (Weeks 1-2)
Learn to do more with Microsoft Excel. In this
module we’ll cover advanced topics like statistical
modeling, forecasting and prediction, pivot tables,
and VBA scripting. You’ll even learn to model
historic stock trends -- and hopefully, learn to beat
the market!
» Microsoft Excel
» VBA Script
» Statistics Modeling
Module 2: Python Data Analytics (Weeks 3-9)
Gain a strong foothold in one of today’s
fundamental programming languages. In
the course of this module, you’ll gain deep
proficiencies with core Python, data analytic
tools like NumPy, Pandas, Matplotlib, and specific
libraries for interacting with web data like
Requests, BeautifulSoup, and Tweepy.
» Python
» APIs
» JSON
» NumPy
» Pandas
» Matplotlib
» Beautiful Soup
» Tweepy
Module 3: Databases
(Weeks 10-12)
Dive deep into the most prolific database
languages: SQL and NoSQL. Work with MySQL
and MongoDB to organize data into well-
structured and easily retrievable data formats.
» SQL
» NoSQL
» MySQL
» MongoDB
Module 4: Web Visualization
(Weeks 13-19)
Building visualizations is of little benefit without a
way to communicate the message. In this module,
you’ll be learning the core technologies of web
development (HTML, CSS, and JavaScript) to
create new, interactive data visualizations that you
can share with everyone on the web.
» HTML
» CSS
» JavaScript
» AJAX
» D3
» Leaflet
Module 5: Advanced Topics
(Week 20-23)
By program’s end, you’ll be immersed in new
and in-demand topics like Tableau, Hadoop, and
Machine Learning.
» Tableau
» Hadoop
» Machine Learning
Module 6: Final Project
(Week 24)
Bring everything that you have learned in
class altogether to create an impressive data-
visualization application with a small team. Get
creative and come up with something cool to
show off to the whole world!
» Dreaming up something fantastic
and understanding the bounds of
reasonable and achievable
COURSE CURRICULUM BY MODULE