Embed Size (px)
Citation preview
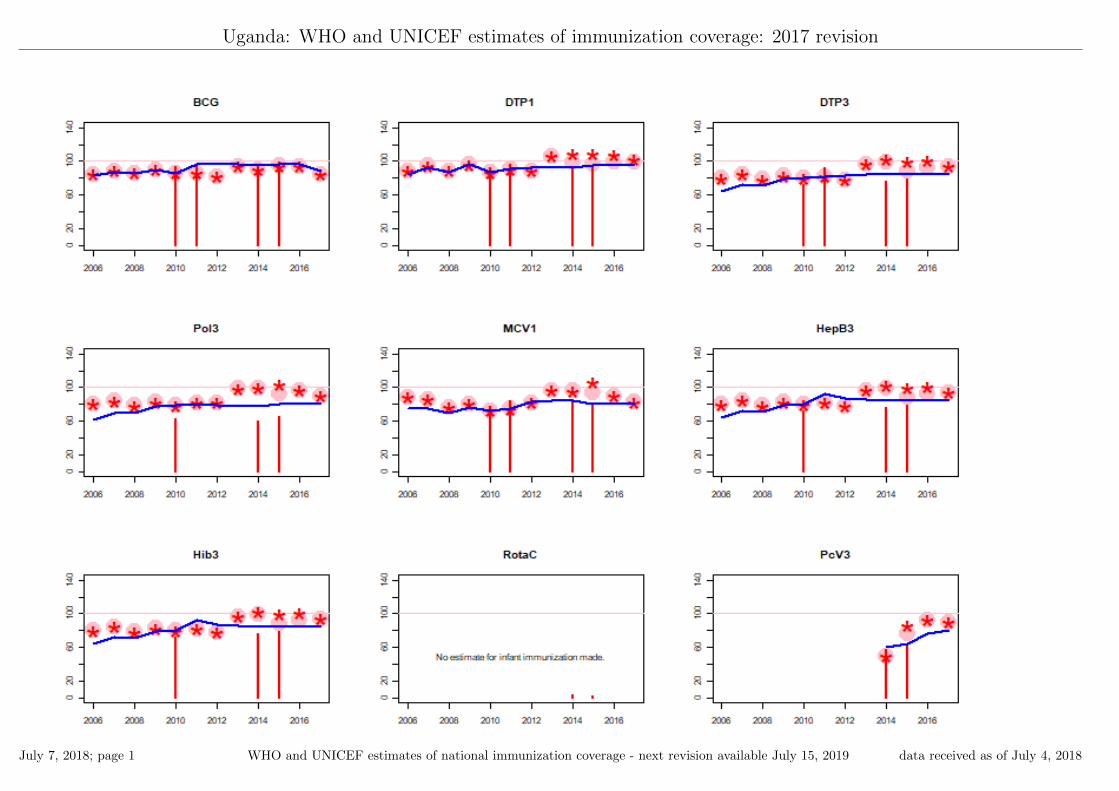
Uganda: WHO and UNICEF estimates of immunization coverage: 2017 revision
July 7, 2018; page 1 WHO and UNICEF estimates of national immunization coverage - next revision available July 15, 2019 data received as of July 4, 2018
Uganda: WHO and UNICEF estimates of immunization coverage: 2017 revision
BACKGROUND NOTE: Each year WHO and UNICEF jointly review reports submitted by MemberStates regarding national immunization coverage, finalized survey reports as well as data from thepublished and grey literature. Based on these data, with due consideration to potential biases and theviews of local experts, WHO and UNICEF attempt to distinguish between situations where theavailable empirical data accurately reflect immunization system performance and those where the dataare likely to be compromised and present a misleading view of immunization coverage while jointlyestimating the most likely coverage levels for each country.
WHO and UNICEF estimates are country-specific; that is to say, each country’s data are reviewedindividually, and data are not borrowed from other countries in the absence of data. Estimates are notbased on ad hoc adjustments to reported data; in some instances empirical data are available from asingle source, usually the nationally reported coverage data. In cases where no data are available for agiven country/vaccine/year combination, data are considered from earlier and later years andinterpolated to estimate coverage for the missing year(s). In cases where data sources are mixed andshow large variation, an attempt is made to identify the most likely estimate with consideration of thepossible biases in available data. For methods see:
*Burton et al. 2009. WHO and UNICEF estimates of national infant immunization coverage: methodsand processes.*Burton et al. 2012. A formal representation of the WHO and UNICEF estimates of nationalimmunization coverage: a computational logic approach.*Brown et al. 2013. An introduction to the grade of confidence used to characterize uncertainty aroundthe WHO and UNICEF estimates of national immunization coverage.
DATA SOURCES.
ADMINISTRATIVE coverage: Reported by national authorities and based on aggregatedadministrative reports from health service providers on the number of vaccinations administeredduring a given period (numerator data) and reported target population data (denominator data).May be biased by inaccurate numerator and/or denominator data.
OFFICIAL coverage: Estimated coverage reported by national authorities that reflects theirassessment of the most likely coverage based on any combination of administrative coverage,survey-based estimates or other data sources or adjustments. Approaches to determineOFFICIAL coverage may differ across countries.
SURVEY coverage: Based on estimated coverage from population-based household surveys amongchildren aged 12-23 months or 24-35 months following a review of survey methods and results.Information is based on the combination of vaccination history from documented evidence orcaregiver recall. Survey results are considered for the appropriate birth cohort based on theperiod of data collection.
ABBREVIATIONS
BCG: percentage of births who received one dose of Bacillus Calmette Guerin vaccine.
DTP1 / DTP3: percentage of surviving infants who received the 1st / 3rd dose, respectively, ofdiphtheria and tetanus toxoid with pertussis containing vaccine.
Pol3: percentage of surviving infants who received the 3rd dose of polio containing vaccine. May beeither oral or inactivated polio vaccine.
IPV1: percentage of surviving infants who received at least one dose of inactivated polio vaccine. Incountries utilizing an immunization schedule recommending either (i) a primary series of threedoses of oral polio vaccine (OPV) plus at least one dose of IPV where OPV is included in routine
immunization and/or campaign or (ii) a sequential schedule of IPV followed by OPV, WHO andUNICEF estimates for IPV1 reflect coverage with at least one routine dose of IPV among infants<1 year of age among countries. For countries utilizing IPV containing vaccine use only, i.e., norecommended dose of OPV, the WHO and UNICEF estimate for IPV1 corresponds to coveragefor the 1st dose of IPV.
Production of IPV coverage estimates, which begins in 2015, results in no change of theestimated coverage levels for the 3rd dose of polio (Pol3). For countries recommending routineimmunization with a primary series of three doses of IPV alone, WHO and UNICEF estimatedPol3 coverage is equivalent to estimated coverage with three doses of IPV. For countries with asequential schedule, estimated Pol3 coverage is based on that for the 3rd dose of polio vaccineregardless of vaccine type.
MCV1: percentage of surviving infants who received the 1st dose of measles containing vaccine. Incountries where the national schedule recommends the 1st dose of MCV at 12 months or laterbased on the epidemiology of disease in the country, coverage estimates reflect the percentage ofchildren who received the 1st dose of MCV as recommended.
MCV2: percentage of children who received the 2nd dose of measles containing vaccine according tothe nationally recommended schedule.
RCV1: percentage of surviving infants who received the 1st dose of rubella containing vaccine. Coverage estimates are based on WHO and UNICEF estimates of coverage for the dose of measlescontaining vaccine that corresponds to the first measles-rubella combination vaccine. Nationallyreported coverage of RCV is not taken into consideration nor are the data represented in theaccompanying graph and data table.
HepBB: percentage of births which received a dose of hepatitis B vaccine within 24 hours of delivery.Estimates of hepatitis B birth dose coverage are produced only for countries with a universalbirth dose policy. Estimates are not produced for countries that recommend a birth dose toinfants born to HepB virus-infected mothers only or where there is insufficient information todetermine whether vaccination is within 24 hours of birth.
HepB3: percentage of surviving infants who received the 3rd dose of hepatitis B containing vaccinefollowing the birth dose.
Hib3: percentage of surviving infants who received the 3rd dose of Haemophilus influenzae type bcontaining vaccine.
RotaC: percentage of surviving infants who received the final recommended dose of rotavirus vaccine,which can be either the 2nd or the 3rd dose depending on the vaccine.
PcV3: percentage of surviving infants who received the 3rd dose of pneumococcal conjugate vaccine.In countries where the national schedule recommends two doses during infancy and a boosterdose at 12 months or later based on the epidemiology of disease in the country, coverageestimates may reflect the percentage of surviving infants who received two doses of PcV prior tothe 1st birthday.
YFV: percentage of surviving infants who received one dose of yellow fever vaccine in countries whereYFV is part of the national immunization schedule for children or is recommended in at riskareas; coverage estimates are annualized for the entire cohort of surviving infants.
Disclaimer: All reasonable precautions have been taken by the World Health Organization andUnited Nations Children’s Fund to verify the information contained in this publication. However,the published material is being distributed without warranty of any kind, either expressed orimplied. The responsibility for the interpretation and use of the material lies with the reader. Inno event shall the World Health Organization or United Nations Children’s Fund be liable fordamages arising from its use.
July 7, 2018; page 2 WHO and UNICEF estimates of national immunization coverage - next revision available July 15, 2019 data received as of July 4, 2018
Uganda - BCG
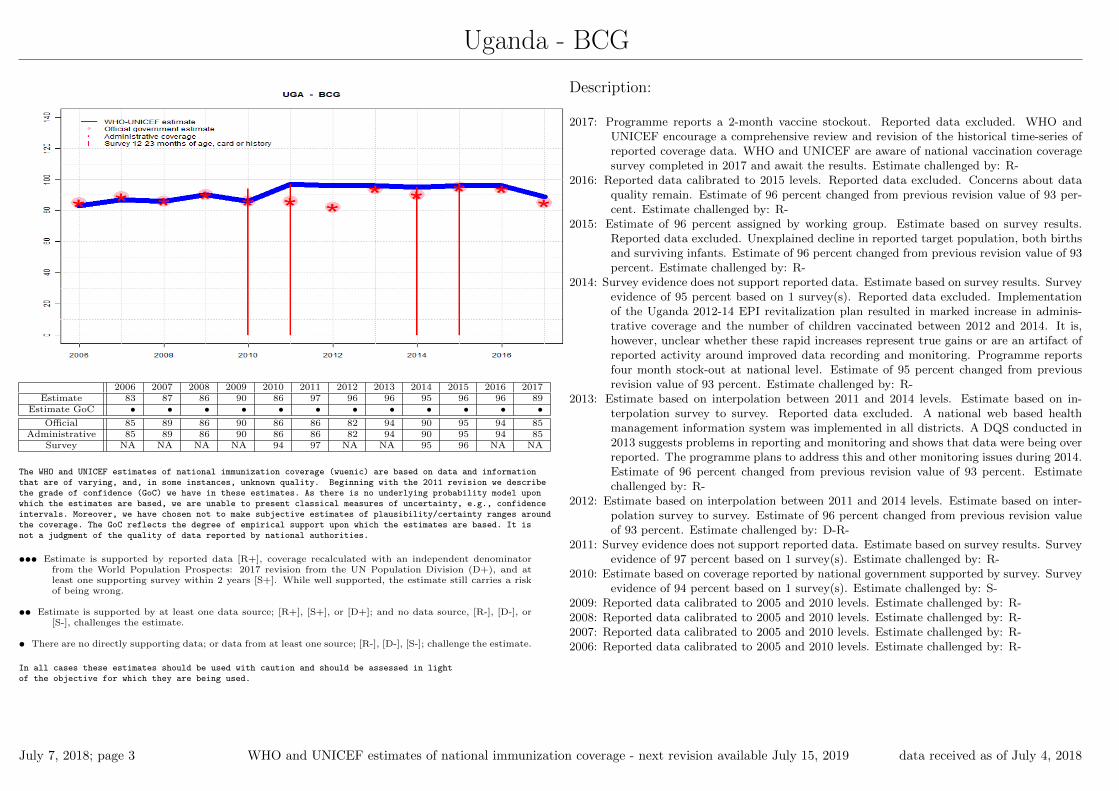
2006 2007 2008 2009 2010 2011 2012 2013 2014 2015 2016 2017Estimate 83 87 86 90 86 97 96 96 95 96 96 89
Estimate GoC • • • • • • • • • • • •Official 85 89 86 90 86 86 82 94 90 95 94 85
Administrative 85 89 86 90 86 86 82 94 90 95 94 85Survey NA NA NA NA 94 97 NA NA 95 96 NA NA
The WHO and UNICEF estimates of national immunization coverage (wuenic) are based on data and informationthat are of varying, and, in some instances, unknown quality. Beginning with the 2011 revision we describethe grade of confidence (GoC) we have in these estimates. As there is no underlying probability model uponwhich the estimates are based, we are unable to present classical measures of uncertainty, e.g., confidenceintervals. Moreover, we have chosen not to make subjective estimates of plausibility/certainty ranges aroundthe coverage. The GoC reflects the degree of empirical support upon which the estimates are based. It isnot a judgment of the quality of data reported by national authorities.
••• Estimate is supported by reported data [R+], coverage recalculated with an independent denominatorfrom the World Population Prospects: 2017 revision from the UN Population Division (D+), and atleast one supporting survey within 2 years [S+]. While well supported, the estimate still carries a riskof being wrong.
•• Estimate is supported by at least one data source; [R+], [S+], or [D+]; and no data source, [R-], [D-], or[S-], challenges the estimate.
• There are no directly supporting data; or data from at least one source; [R-], [D-], [S-]; challenge the estimate.
In all cases these estimates should be used with caution and should be assessed in lightof the objective for which they are being used.
Description:
2017: Programme reports a 2-month vaccine stockout. Reported data excluded. WHO andUNICEF encourage a comprehensive review and revision of the historical time-series ofreported coverage data. WHO and UNICEF are aware of national vaccination coveragesurvey completed in 2017 and await the results. Estimate challenged by: R-
2016: Reported data calibrated to 2015 levels. Reported data excluded. Concerns about dataquality remain. Estimate of 96 percent changed from previous revision value of 93 per-cent. Estimate challenged by: R-
2015: Estimate of 96 percent assigned by working group. Estimate based on survey results.Reported data excluded. Unexplained decline in reported target population, both birthsand surviving infants. Estimate of 96 percent changed from previous revision value of 93percent. Estimate challenged by: R-
2014: Survey evidence does not support reported data. Estimate based on survey results. Surveyevidence of 95 percent based on 1 survey(s). Reported data excluded. Implementationof the Uganda 2012-14 EPI revitalization plan resulted in marked increase in adminis-trative coverage and the number of children vaccinated between 2012 and 2014. It is,however, unclear whether these rapid increases represent true gains or are an artifact ofreported activity around improved data recording and monitoring. Programme reportsfour month stock-out at national level. Estimate of 95 percent changed from previousrevision value of 93 percent. Estimate challenged by: R-
2013: Estimate based on interpolation between 2011 and 2014 levels. Estimate based on in-terpolation survey to survey. Reported data excluded. A national web based healthmanagement information system was implemented in all districts. A DQS conducted in2013 suggests problems in reporting and monitoring and shows that data were being overreported. The programme plans to address this and other monitoring issues during 2014.Estimate of 96 percent changed from previous revision value of 93 percent. Estimatechallenged by: R-
2012: Estimate based on interpolation between 2011 and 2014 levels. Estimate based on inter-polation survey to survey. Estimate of 96 percent changed from previous revision valueof 93 percent. Estimate challenged by: D-R-
2011: Survey evidence does not support reported data. Estimate based on survey results. Surveyevidence of 97 percent based on 1 survey(s). Estimate challenged by: R-
2010: Estimate based on coverage reported by national government supported by survey. Surveyevidence of 94 percent based on 1 survey(s). Estimate challenged by: S-
2009: Reported data calibrated to 2005 and 2010 levels. Estimate challenged by: R-2008: Reported data calibrated to 2005 and 2010 levels. Estimate challenged by: R-2007: Reported data calibrated to 2005 and 2010 levels. Estimate challenged by: R-2006: Reported data calibrated to 2005 and 2010 levels. Estimate challenged by: R-
July 7, 2018; page 3 WHO and UNICEF estimates of national immunization coverage - next revision available July 15, 2019 data received as of July 4, 2018
Uganda - DTP1
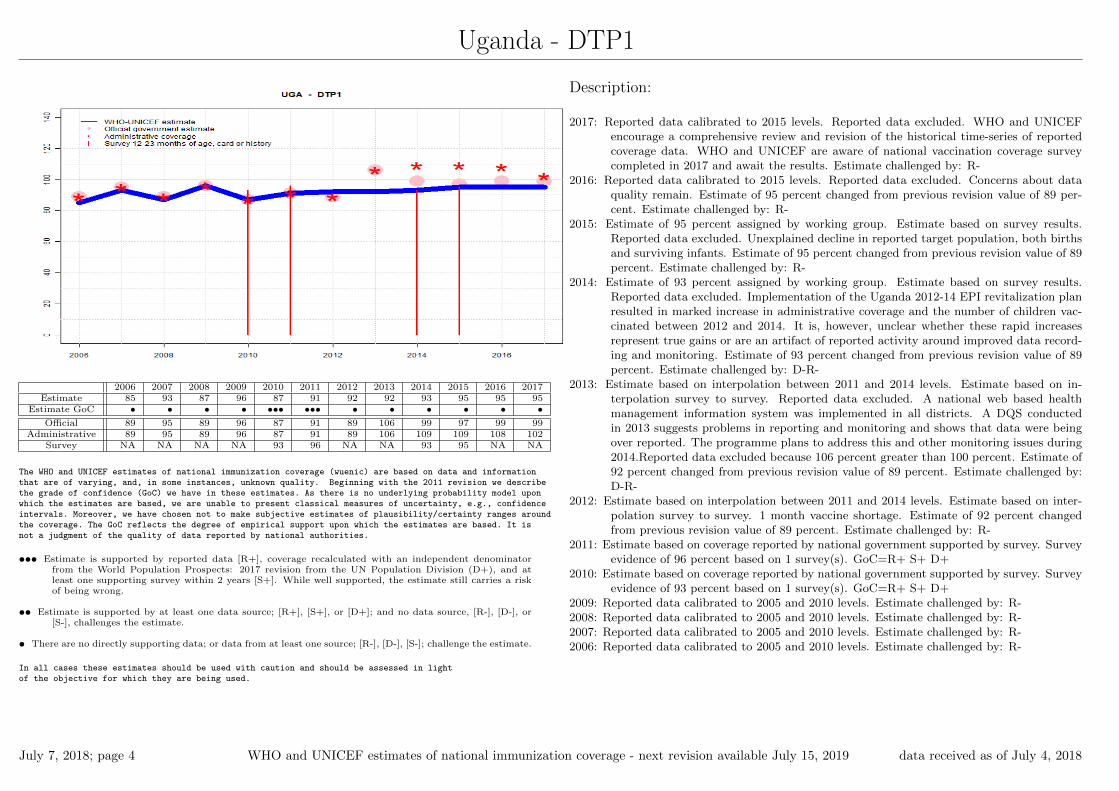
2006 2007 2008 2009 2010 2011 2012 2013 2014 2015 2016 2017Estimate 85 93 87 96 87 91 92 92 93 95 95 95
Estimate GoC • • • • ••• ••• • • • • • •Official 89 95 89 96 87 91 89 106 99 97 99 99
Administrative 89 95 89 96 87 91 89 106 109 109 108 102Survey NA NA NA NA 93 96 NA NA 93 95 NA NA
The WHO and UNICEF estimates of national immunization coverage (wuenic) are based on data and informationthat are of varying, and, in some instances, unknown quality. Beginning with the 2011 revision we describethe grade of confidence (GoC) we have in these estimates. As there is no underlying probability model uponwhich the estimates are based, we are unable to present classical measures of uncertainty, e.g., confidenceintervals. Moreover, we have chosen not to make subjective estimates of plausibility/certainty ranges aroundthe coverage. The GoC reflects the degree of empirical support upon which the estimates are based. It isnot a judgment of the quality of data reported by national authorities.
••• Estimate is supported by reported data [R+], coverage recalculated with an independent denominatorfrom the World Population Prospects: 2017 revision from the UN Population Division (D+), and atleast one supporting survey within 2 years [S+]. While well supported, the estimate still carries a riskof being wrong.
•• Estimate is supported by at least one data source; [R+], [S+], or [D+]; and no data source, [R-], [D-], or[S-], challenges the estimate.
• There are no directly supporting data; or data from at least one source; [R-], [D-], [S-]; challenge the estimate.
In all cases these estimates should be used with caution and should be assessed in lightof the objective for which they are being used.
Description:
2017: Reported data calibrated to 2015 levels. Reported data excluded. WHO and UNICEFencourage a comprehensive review and revision of the historical time-series of reportedcoverage data. WHO and UNICEF are aware of national vaccination coverage surveycompleted in 2017 and await the results. Estimate challenged by: R-
2016: Reported data calibrated to 2015 levels. Reported data excluded. Concerns about dataquality remain. Estimate of 95 percent changed from previous revision value of 89 per-cent. Estimate challenged by: R-
2015: Estimate of 95 percent assigned by working group. Estimate based on survey results.Reported data excluded. Unexplained decline in reported target population, both birthsand surviving infants. Estimate of 95 percent changed from previous revision value of 89percent. Estimate challenged by: R-
2014: Estimate of 93 percent assigned by working group. Estimate based on survey results.Reported data excluded. Implementation of the Uganda 2012-14 EPI revitalization planresulted in marked increase in administrative coverage and the number of children vac-cinated between 2012 and 2014. It is, however, unclear whether these rapid increasesrepresent true gains or are an artifact of reported activity around improved data record-ing and monitoring. Estimate of 93 percent changed from previous revision value of 89percent. Estimate challenged by: D-R-
2013: Estimate based on interpolation between 2011 and 2014 levels. Estimate based on in-terpolation survey to survey. Reported data excluded. A national web based healthmanagement information system was implemented in all districts. A DQS conductedin 2013 suggests problems in reporting and monitoring and shows that data were beingover reported. The programme plans to address this and other monitoring issues during2014.Reported data excluded because 106 percent greater than 100 percent. Estimate of92 percent changed from previous revision value of 89 percent. Estimate challenged by:D-R-
2012: Estimate based on interpolation between 2011 and 2014 levels. Estimate based on inter-polation survey to survey. 1 month vaccine shortage. Estimate of 92 percent changedfrom previous revision value of 89 percent. Estimate challenged by: R-
2011: Estimate based on coverage reported by national government supported by survey. Surveyevidence of 96 percent based on 1 survey(s). GoC=R+ S+ D+
2010: Estimate based on coverage reported by national government supported by survey. Surveyevidence of 93 percent based on 1 survey(s). GoC=R+ S+ D+
2009: Reported data calibrated to 2005 and 2010 levels. Estimate challenged by: R-2008: Reported data calibrated to 2005 and 2010 levels. Estimate challenged by: R-2007: Reported data calibrated to 2005 and 2010 levels. Estimate challenged by: R-2006: Reported data calibrated to 2005 and 2010 levels. Estimate challenged by: R-
July 7, 2018; page 4 WHO and UNICEF estimates of national immunization coverage - next revision available July 15, 2019 data received as of July 4, 2018
Uganda - DTP3
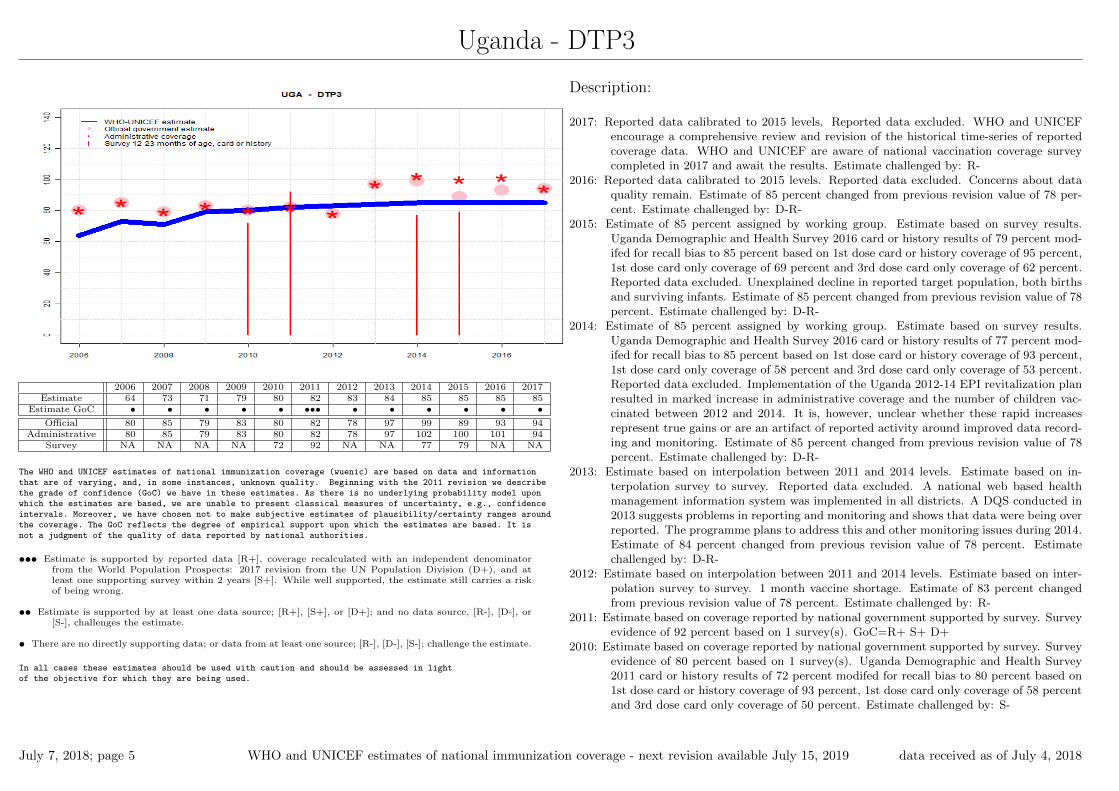
2006 2007 2008 2009 2010 2011 2012 2013 2014 2015 2016 2017Estimate 64 73 71 79 80 82 83 84 85 85 85 85
Estimate GoC • • • • • ••• • • • • • •Official 80 85 79 83 80 82 78 97 99 89 93 94
Administrative 80 85 79 83 80 82 78 97 102 100 101 94Survey NA NA NA NA 72 92 NA NA 77 79 NA NA
The WHO and UNICEF estimates of national immunization coverage (wuenic) are based on data and informationthat are of varying, and, in some instances, unknown quality. Beginning with the 2011 revision we describethe grade of confidence (GoC) we have in these estimates. As there is no underlying probability model uponwhich the estimates are based, we are unable to present classical measures of uncertainty, e.g., confidenceintervals. Moreover, we have chosen not to make subjective estimates of plausibility/certainty ranges aroundthe coverage. The GoC reflects the degree of empirical support upon which the estimates are based. It isnot a judgment of the quality of data reported by national authorities.
••• Estimate is supported by reported data [R+], coverage recalculated with an independent denominatorfrom the World Population Prospects: 2017 revision from the UN Population Division (D+), and atleast one supporting survey within 2 years [S+]. While well supported, the estimate still carries a riskof being wrong.
•• Estimate is supported by at least one data source; [R+], [S+], or [D+]; and no data source, [R-], [D-], or[S-], challenges the estimate.
• There are no directly supporting data; or data from at least one source; [R-], [D-], [S-]; challenge the estimate.
In all cases these estimates should be used with caution and should be assessed in lightof the objective for which they are being used.
Description:
2017: Reported data calibrated to 2015 levels. Reported data excluded. WHO and UNICEFencourage a comprehensive review and revision of the historical time-series of reportedcoverage data. WHO and UNICEF are aware of national vaccination coverage surveycompleted in 2017 and await the results. Estimate challenged by: R-
2016: Reported data calibrated to 2015 levels. Reported data excluded. Concerns about dataquality remain. Estimate of 85 percent changed from previous revision value of 78 per-cent. Estimate challenged by: D-R-
2015: Estimate of 85 percent assigned by working group. Estimate based on survey results.Uganda Demographic and Health Survey 2016 card or history results of 79 percent mod-ifed for recall bias to 85 percent based on 1st dose card or history coverage of 95 percent,1st dose card only coverage of 69 percent and 3rd dose card only coverage of 62 percent.Reported data excluded. Unexplained decline in reported target population, both birthsand surviving infants. Estimate of 85 percent changed from previous revision value of 78percent. Estimate challenged by: D-R-
2014: Estimate of 85 percent assigned by working group. Estimate based on survey results.Uganda Demographic and Health Survey 2016 card or history results of 77 percent mod-ifed for recall bias to 85 percent based on 1st dose card or history coverage of 93 percent,1st dose card only coverage of 58 percent and 3rd dose card only coverage of 53 percent.Reported data excluded. Implementation of the Uganda 2012-14 EPI revitalization planresulted in marked increase in administrative coverage and the number of children vac-cinated between 2012 and 2014. It is, however, unclear whether these rapid increasesrepresent true gains or are an artifact of reported activity around improved data record-ing and monitoring. Estimate of 85 percent changed from previous revision value of 78percent. Estimate challenged by: D-R-
2013: Estimate based on interpolation between 2011 and 2014 levels. Estimate based on in-terpolation survey to survey. Reported data excluded. A national web based healthmanagement information system was implemented in all districts. A DQS conducted in2013 suggests problems in reporting and monitoring and shows that data were being overreported. The programme plans to address this and other monitoring issues during 2014.Estimate of 84 percent changed from previous revision value of 78 percent. Estimatechallenged by: D-R-
2012: Estimate based on interpolation between 2011 and 2014 levels. Estimate based on inter-polation survey to survey. 1 month vaccine shortage. Estimate of 83 percent changedfrom previous revision value of 78 percent. Estimate challenged by: R-
2011: Estimate based on coverage reported by national government supported by survey. Surveyevidence of 92 percent based on 1 survey(s). GoC=R+ S+ D+
2010: Estimate based on coverage reported by national government supported by survey. Surveyevidence of 80 percent based on 1 survey(s). Uganda Demographic and Health Survey2011 card or history results of 72 percent modifed for recall bias to 80 percent based on1st dose card or history coverage of 93 percent, 1st dose card only coverage of 58 percentand 3rd dose card only coverage of 50 percent. Estimate challenged by: S-
July 7, 2018; page 5 WHO and UNICEF estimates of national immunization coverage - next revision available July 15, 2019 data received as of July 4, 2018

Uganda - DTP3
2009: Reported data calibrated to 2005 and 2010 levels. Estimate challenged by: R-S-2008: Reported data calibrated to 2005 and 2010 levels. Estimate challenged by: R-2007: Reported data calibrated to 2005 and 2010 levels. Estimate challenged by: R-2006: Reported data calibrated to 2005 and 2010 levels. Estimate challenged by: R-
July 7, 2018; page 6 WHO and UNICEF estimates of national immunization coverage - next revision available July 15, 2019 data received as of July 4, 2018
Uganda - Pol3
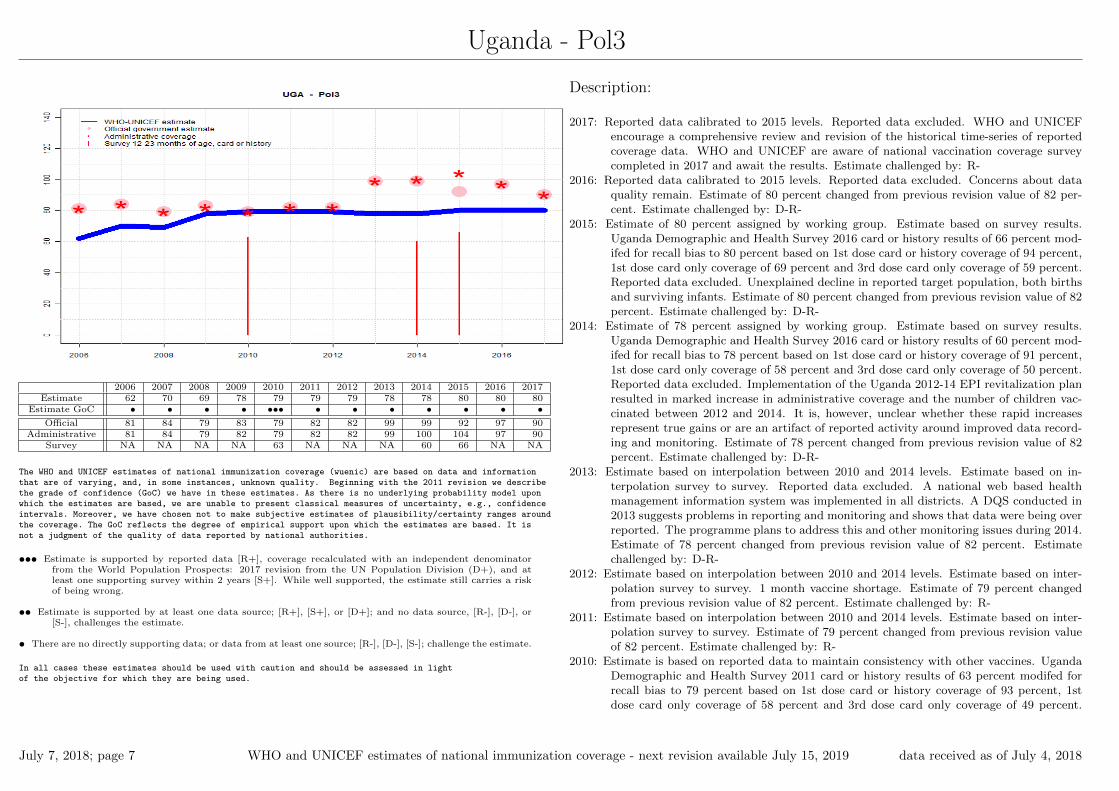
2006 2007 2008 2009 2010 2011 2012 2013 2014 2015 2016 2017Estimate 62 70 69 78 79 79 79 78 78 80 80 80
Estimate GoC • • • • ••• • • • • • • •Official 81 84 79 83 79 82 82 99 99 92 97 90
Administrative 81 84 79 82 79 82 82 99 100 104 97 90Survey NA NA NA NA 63 NA NA NA 60 66 NA NA
The WHO and UNICEF estimates of national immunization coverage (wuenic) are based on data and informationthat are of varying, and, in some instances, unknown quality. Beginning with the 2011 revision we describethe grade of confidence (GoC) we have in these estimates. As there is no underlying probability model uponwhich the estimates are based, we are unable to present classical measures of uncertainty, e.g., confidenceintervals. Moreover, we have chosen not to make subjective estimates of plausibility/certainty ranges aroundthe coverage. The GoC reflects the degree of empirical support upon which the estimates are based. It isnot a judgment of the quality of data reported by national authorities.
••• Estimate is supported by reported data [R+], coverage recalculated with an independent denominatorfrom the World Population Prospects: 2017 revision from the UN Population Division (D+), and atleast one supporting survey within 2 years [S+]. While well supported, the estimate still carries a riskof being wrong.
•• Estimate is supported by at least one data source; [R+], [S+], or [D+]; and no data source, [R-], [D-], or[S-], challenges the estimate.
• There are no directly supporting data; or data from at least one source; [R-], [D-], [S-]; challenge the estimate.
In all cases these estimates should be used with caution and should be assessed in lightof the objective for which they are being used.
Description:
2017: Reported data calibrated to 2015 levels. Reported data excluded. WHO and UNICEFencourage a comprehensive review and revision of the historical time-series of reportedcoverage data. WHO and UNICEF are aware of national vaccination coverage surveycompleted in 2017 and await the results. Estimate challenged by: R-
2016: Reported data calibrated to 2015 levels. Reported data excluded. Concerns about dataquality remain. Estimate of 80 percent changed from previous revision value of 82 per-cent. Estimate challenged by: D-R-
2015: Estimate of 80 percent assigned by working group. Estimate based on survey results.Uganda Demographic and Health Survey 2016 card or history results of 66 percent mod-ifed for recall bias to 80 percent based on 1st dose card or history coverage of 94 percent,1st dose card only coverage of 69 percent and 3rd dose card only coverage of 59 percent.Reported data excluded. Unexplained decline in reported target population, both birthsand surviving infants. Estimate of 80 percent changed from previous revision value of 82percent. Estimate challenged by: D-R-
2014: Estimate of 78 percent assigned by working group. Estimate based on survey results.Uganda Demographic and Health Survey 2016 card or history results of 60 percent mod-ifed for recall bias to 78 percent based on 1st dose card or history coverage of 91 percent,1st dose card only coverage of 58 percent and 3rd dose card only coverage of 50 percent.Reported data excluded. Implementation of the Uganda 2012-14 EPI revitalization planresulted in marked increase in administrative coverage and the number of children vac-cinated between 2012 and 2014. It is, however, unclear whether these rapid increasesrepresent true gains or are an artifact of reported activity around improved data record-ing and monitoring. Estimate of 78 percent changed from previous revision value of 82percent. Estimate challenged by: D-R-
2013: Estimate based on interpolation between 2010 and 2014 levels. Estimate based on in-terpolation survey to survey. Reported data excluded. A national web based healthmanagement information system was implemented in all districts. A DQS conducted in2013 suggests problems in reporting and monitoring and shows that data were being overreported. The programme plans to address this and other monitoring issues during 2014.Estimate of 78 percent changed from previous revision value of 82 percent. Estimatechallenged by: D-R-
2012: Estimate based on interpolation between 2010 and 2014 levels. Estimate based on inter-polation survey to survey. 1 month vaccine shortage. Estimate of 79 percent changedfrom previous revision value of 82 percent. Estimate challenged by: R-
2011: Estimate based on interpolation between 2010 and 2014 levels. Estimate based on inter-polation survey to survey. Estimate of 79 percent changed from previous revision valueof 82 percent. Estimate challenged by: R-
2010: Estimate is based on reported data to maintain consistency with other vaccines. UgandaDemographic and Health Survey 2011 card or history results of 63 percent modifed forrecall bias to 79 percent based on 1st dose card or history coverage of 93 percent, 1stdose card only coverage of 58 percent and 3rd dose card only coverage of 49 percent.
July 7, 2018; page 7 WHO and UNICEF estimates of national immunization coverage - next revision available July 15, 2019 data received as of July 4, 2018

Uganda - Pol3
GoC=R+ S+ D+2009: Reported data calibrated to 2005 and 2010 levels. Estimate challenged by: R-2008: Reported data calibrated to 2005 and 2010 levels. Estimate challenged by: R-2007: Reported data calibrated to 2005 and 2010 levels. Estimate challenged by: R-2006: Reported data calibrated to 2005 and 2010 levels. Estimate challenged by: D-R-
July 7, 2018; page 8 WHO and UNICEF estimates of national immunization coverage - next revision available July 15, 2019 data received as of July 4, 2018
Uganda - IPV1
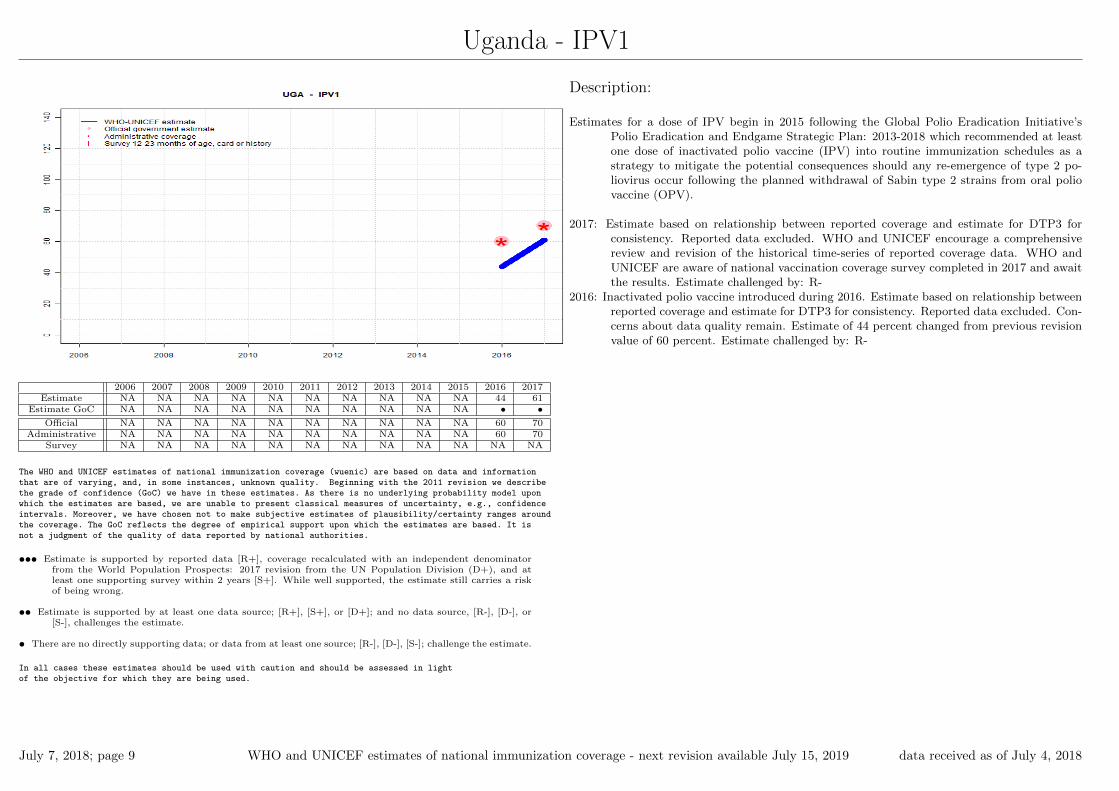
2006 2007 2008 2009 2010 2011 2012 2013 2014 2015 2016 2017Estimate NA NA NA NA NA NA NA NA NA NA 44 61
Estimate GoC NA NA NA NA NA NA NA NA NA NA • •Official NA NA NA NA NA NA NA NA NA NA 60 70
Administrative NA NA NA NA NA NA NA NA NA NA 60 70Survey NA NA NA NA NA NA NA NA NA NA NA NA
The WHO and UNICEF estimates of national immunization coverage (wuenic) are based on data and informationthat are of varying, and, in some instances, unknown quality. Beginning with the 2011 revision we describethe grade of confidence (GoC) we have in these estimates. As there is no underlying probability model uponwhich the estimates are based, we are unable to present classical measures of uncertainty, e.g., confidenceintervals. Moreover, we have chosen not to make subjective estimates of plausibility/certainty ranges aroundthe coverage. The GoC reflects the degree of empirical support upon which the estimates are based. It isnot a judgment of the quality of data reported by national authorities.
••• Estimate is supported by reported data [R+], coverage recalculated with an independent denominatorfrom the World Population Prospects: 2017 revision from the UN Population Division (D+), and atleast one supporting survey within 2 years [S+]. While well supported, the estimate still carries a riskof being wrong.
•• Estimate is supported by at least one data source; [R+], [S+], or [D+]; and no data source, [R-], [D-], or[S-], challenges the estimate.
• There are no directly supporting data; or data from at least one source; [R-], [D-], [S-]; challenge the estimate.
In all cases these estimates should be used with caution and should be assessed in lightof the objective for which they are being used.
Description:
Estimates for a dose of IPV begin in 2015 following the Global Polio Eradication Initiative’sPolio Eradication and Endgame Strategic Plan: 2013-2018 which recommended at leastone dose of inactivated polio vaccine (IPV) into routine immunization schedules as astrategy to mitigate the potential consequences should any re-emergence of type 2 po-liovirus occur following the planned withdrawal of Sabin type 2 strains from oral poliovaccine (OPV).
2017: Estimate based on relationship between reported coverage and estimate for DTP3 forconsistency. Reported data excluded. WHO and UNICEF encourage a comprehensivereview and revision of the historical time-series of reported coverage data. WHO andUNICEF are aware of national vaccination coverage survey completed in 2017 and awaitthe results. Estimate challenged by: R-
2016: Inactivated polio vaccine introduced during 2016. Estimate based on relationship betweenreported coverage and estimate for DTP3 for consistency. Reported data excluded. Con-cerns about data quality remain. Estimate of 44 percent changed from previous revisionvalue of 60 percent. Estimate challenged by: R-
July 7, 2018; page 9 WHO and UNICEF estimates of national immunization coverage - next revision available July 15, 2019 data received as of July 4, 2018
Uganda - MCV1
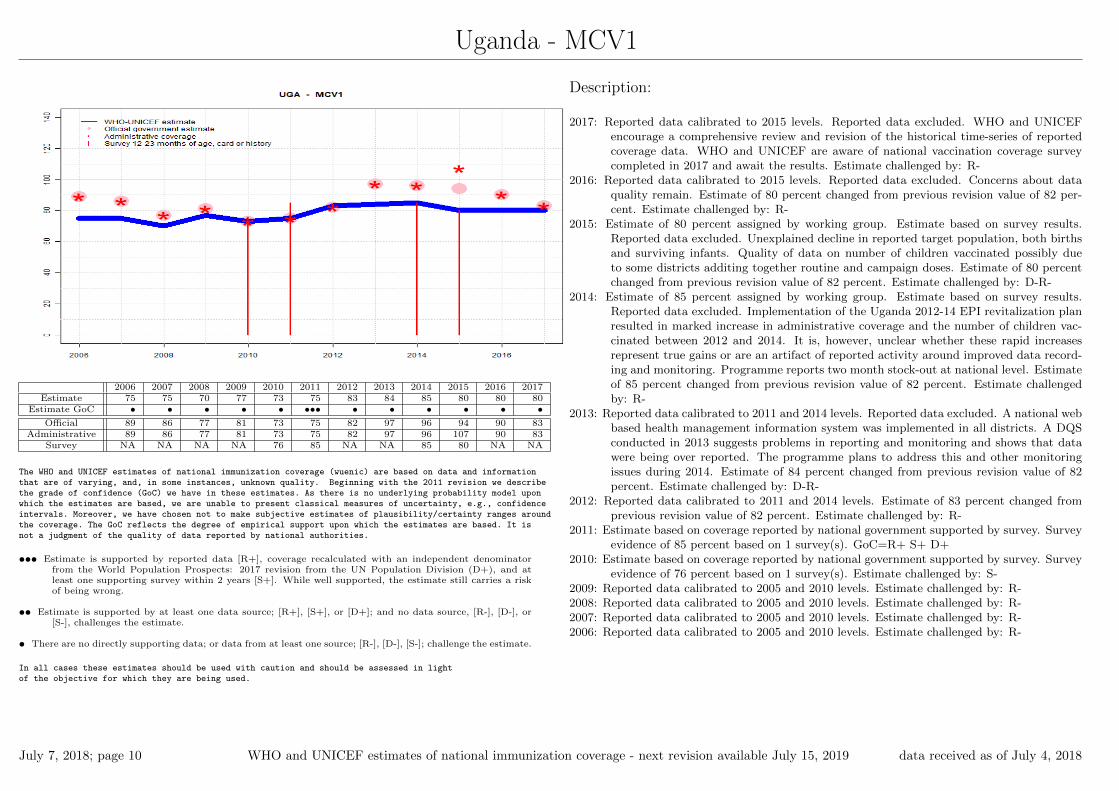
2006 2007 2008 2009 2010 2011 2012 2013 2014 2015 2016 2017Estimate 75 75 70 77 73 75 83 84 85 80 80 80
Estimate GoC • • • • • ••• • • • • • •Official 89 86 77 81 73 75 82 97 96 94 90 83
Administrative 89 86 77 81 73 75 82 97 96 107 90 83Survey NA NA NA NA 76 85 NA NA 85 80 NA NA
The WHO and UNICEF estimates of national immunization coverage (wuenic) are based on data and informationthat are of varying, and, in some instances, unknown quality. Beginning with the 2011 revision we describethe grade of confidence (GoC) we have in these estimates. As there is no underlying probability model uponwhich the estimates are based, we are unable to present classical measures of uncertainty, e.g., confidenceintervals. Moreover, we have chosen not to make subjective estimates of plausibility/certainty ranges aroundthe coverage. The GoC reflects the degree of empirical support upon which the estimates are based. It isnot a judgment of the quality of data reported by national authorities.
••• Estimate is supported by reported data [R+], coverage recalculated with an independent denominatorfrom the World Population Prospects: 2017 revision from the UN Population Division (D+), and atleast one supporting survey within 2 years [S+]. While well supported, the estimate still carries a riskof being wrong.
•• Estimate is supported by at least one data source; [R+], [S+], or [D+]; and no data source, [R-], [D-], or[S-], challenges the estimate.
• There are no directly supporting data; or data from at least one source; [R-], [D-], [S-]; challenge the estimate.
In all cases these estimates should be used with caution and should be assessed in lightof the objective for which they are being used.
Description:
2017: Reported data calibrated to 2015 levels. Reported data excluded. WHO and UNICEFencourage a comprehensive review and revision of the historical time-series of reportedcoverage data. WHO and UNICEF are aware of national vaccination coverage surveycompleted in 2017 and await the results. Estimate challenged by: R-
2016: Reported data calibrated to 2015 levels. Reported data excluded. Concerns about dataquality remain. Estimate of 80 percent changed from previous revision value of 82 per-cent. Estimate challenged by: R-
2015: Estimate of 80 percent assigned by working group. Estimate based on survey results.Reported data excluded. Unexplained decline in reported target population, both birthsand surviving infants. Quality of data on number of children vaccinated possibly dueto some districts additing together routine and campaign doses. Estimate of 80 percentchanged from previous revision value of 82 percent. Estimate challenged by: D-R-
2014: Estimate of 85 percent assigned by working group. Estimate based on survey results.Reported data excluded. Implementation of the Uganda 2012-14 EPI revitalization planresulted in marked increase in administrative coverage and the number of children vac-cinated between 2012 and 2014. It is, however, unclear whether these rapid increasesrepresent true gains or are an artifact of reported activity around improved data record-ing and monitoring. Programme reports two month stock-out at national level. Estimateof 85 percent changed from previous revision value of 82 percent. Estimate challengedby: R-
2013: Reported data calibrated to 2011 and 2014 levels. Reported data excluded. A national webbased health management information system was implemented in all districts. A DQSconducted in 2013 suggests problems in reporting and monitoring and shows that datawere being over reported. The programme plans to address this and other monitoringissues during 2014. Estimate of 84 percent changed from previous revision value of 82percent. Estimate challenged by: D-R-
2012: Reported data calibrated to 2011 and 2014 levels. Estimate of 83 percent changed fromprevious revision value of 82 percent. Estimate challenged by: R-
2011: Estimate based on coverage reported by national government supported by survey. Surveyevidence of 85 percent based on 1 survey(s). GoC=R+ S+ D+
2010: Estimate based on coverage reported by national government supported by survey. Surveyevidence of 76 percent based on 1 survey(s). Estimate challenged by: S-
2009: Reported data calibrated to 2005 and 2010 levels. Estimate challenged by: R-2008: Reported data calibrated to 2005 and 2010 levels. Estimate challenged by: R-2007: Reported data calibrated to 2005 and 2010 levels. Estimate challenged by: R-2006: Reported data calibrated to 2005 and 2010 levels. Estimate challenged by: R-
July 7, 2018; page 10 WHO and UNICEF estimates of national immunization coverage - next revision available July 15, 2019 data received as of July 4, 2018

Uganda - MCV2
2006 2007 2008 2009 2010 2011 2012 2013 2014 2015 2016 2017Estimate NA NA NA NA NA NA NA NA NA NA NA NA
Estimate GoC NA NA NA NA NA NA NA NA NA NA NA NA
Official NA NA NA NA NA NA NA NA NA NA NA NAAdministrative NA NA NA NA NA NA NA NA NA NA NA NA
Survey NA NA NA NA NA NA NA NA NA NA NA NA
The WHO and UNICEF estimates of national immunization coverage (wuenic) are based on data and informationthat are of varying, and, in some instances, unknown quality. Beginning with the 2011 revision we describethe grade of confidence (GoC) we have in these estimates. As there is no underlying probability model uponwhich the estimates are based, we are unable to present classical measures of uncertainty, e.g., confidenceintervals. Moreover, we have chosen not to make subjective estimates of plausibility/certainty ranges aroundthe coverage. The GoC reflects the degree of empirical support upon which the estimates are based. It isnot a judgment of the quality of data reported by national authorities.
••• Estimate is supported by reported data [R+], coverage recalculated with an independent denominatorfrom the World Population Prospects: 2017 revision from the UN Population Division (D+), and atleast one supporting survey within 2 years [S+]. While well supported, the estimate still carries a riskof being wrong.
•• Estimate is supported by at least one data source; [R+], [S+], or [D+]; and no data source, [R-], [D-], or[S-], challenges the estimate.
• There are no directly supporting data; or data from at least one source; [R-], [D-], [S-]; challenge the estimate.
In all cases these estimates should be used with caution and should be assessed in lightof the objective for which they are being used.
July 7, 2018; page 11 WHO and UNICEF estimates of national immunization coverage - next revision available July 15, 2019 data received as of July 4, 2018
Uganda - RCV1
2006 2007 2008 2009 2010 2011 2012 2013 2014 2015 2016 2017Estimate NA NA NA NA NA NA NA NA NA NA NA NA
Estimate GoC NA NA NA NA NA NA NA NA NA NA NA NA
Official NA NA NA NA NA NA NA NA NA NA NA NAAdministrative NA NA NA NA NA NA NA NA NA NA NA NA
Survey NA NA NA NA NA NA NA NA NA NA NA NA
The WHO and UNICEF estimates of national immunization coverage (wuenic) are based on data and informationthat are of varying, and, in some instances, unknown quality. Beginning with the 2011 revision we describethe grade of confidence (GoC) we have in these estimates. As there is no underlying probability model uponwhich the estimates are based, we are unable to present classical measures of uncertainty, e.g., confidenceintervals. Moreover, we have chosen not to make subjective estimates of plausibility/certainty ranges aroundthe coverage. The GoC reflects the degree of empirical support upon which the estimates are based. It isnot a judgment of the quality of data reported by national authorities.
••• Estimate is supported by reported data [R+], coverage recalculated with an independent denominatorfrom the World Population Prospects: 2017 revision from the UN Population Division (D+), and atleast one supporting survey within 2 years [S+]. While well supported, the estimate still carries a riskof being wrong.
•• Estimate is supported by at least one data source; [R+], [S+], or [D+]; and no data source, [R-], [D-], or[S-], challenges the estimate.
• There are no directly supporting data; or data from at least one source; [R-], [D-], [S-]; challenge the estimate.
In all cases these estimates should be used with caution and should be assessed in lightof the objective for which they are being used.
July 7, 2018; page 12 WHO and UNICEF estimates of national immunization coverage - next revision available July 15, 2019 data received as of July 4, 2018
Uganda - HepBB
2006 2007 2008 2009 2010 2011 2012 2013 2014 2015 2016 2017Estimate NA NA NA NA NA NA NA NA NA NA NA NA
Estimate GoC NA NA NA NA NA NA NA NA NA NA NA NA
Official NA NA NA NA NA NA NA NA NA NA NA NAAdministrative NA NA NA NA NA NA NA NA NA NA NA NA
Survey NA NA NA NA NA NA NA NA NA NA NA NA
The WHO and UNICEF estimates of national immunization coverage (wuenic) are based on data and informationthat are of varying, and, in some instances, unknown quality. Beginning with the 2011 revision we describethe grade of confidence (GoC) we have in these estimates. As there is no underlying probability model uponwhich the estimates are based, we are unable to present classical measures of uncertainty, e.g., confidenceintervals. Moreover, we have chosen not to make subjective estimates of plausibility/certainty ranges aroundthe coverage. The GoC reflects the degree of empirical support upon which the estimates are based. It isnot a judgment of the quality of data reported by national authorities.
••• Estimate is supported by reported data [R+], coverage recalculated with an independent denominatorfrom the World Population Prospects: 2017 revision from the UN Population Division (D+), and atleast one supporting survey within 2 years [S+]. While well supported, the estimate still carries a riskof being wrong.
•• Estimate is supported by at least one data source; [R+], [S+], or [D+]; and no data source, [R-], [D-], or[S-], challenges the estimate.
• There are no directly supporting data; or data from at least one source; [R-], [D-], [S-]; challenge the estimate.
In all cases these estimates should be used with caution and should be assessed in lightof the objective for which they are being used.
July 7, 2018; page 13 WHO and UNICEF estimates of national immunization coverage - next revision available July 15, 2019 data received as of July 4, 2018
Uganda - HepB3
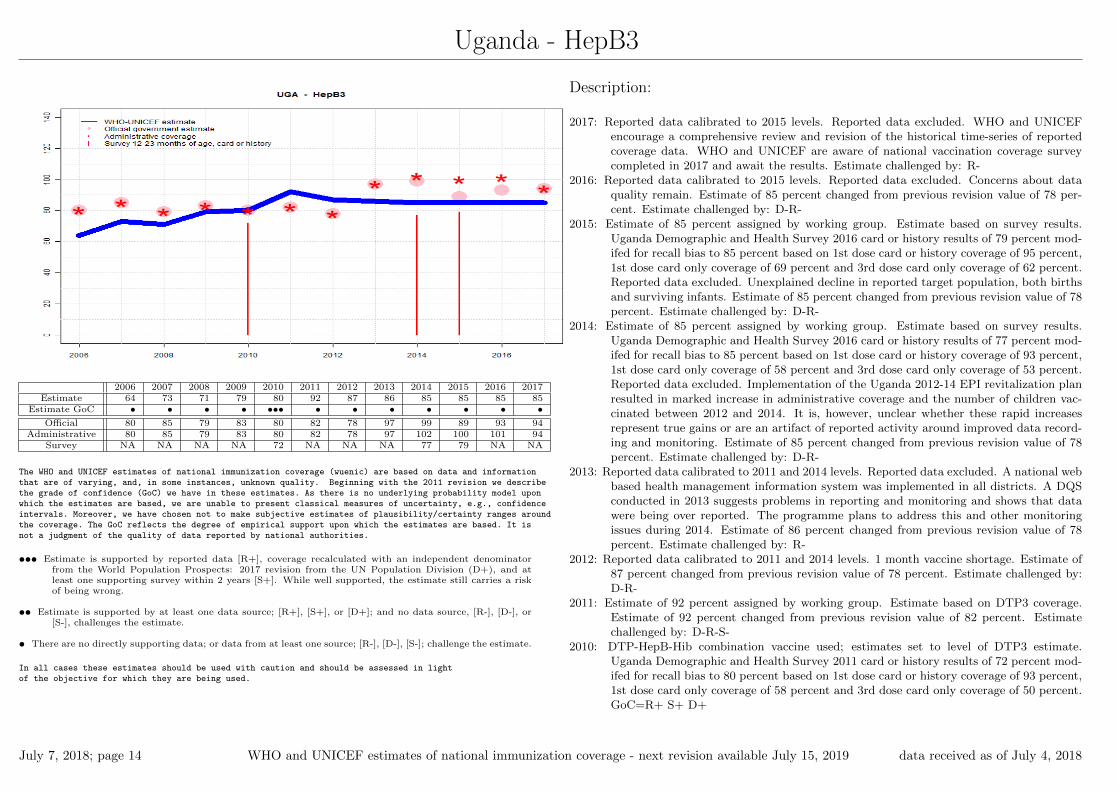
2006 2007 2008 2009 2010 2011 2012 2013 2014 2015 2016 2017Estimate 64 73 71 79 80 92 87 86 85 85 85 85
Estimate GoC • • • • ••• • • • • • • •Official 80 85 79 83 80 82 78 97 99 89 93 94
Administrative 80 85 79 83 80 82 78 97 102 100 101 94Survey NA NA NA NA 72 NA NA NA 77 79 NA NA
The WHO and UNICEF estimates of national immunization coverage (wuenic) are based on data and informationthat are of varying, and, in some instances, unknown quality. Beginning with the 2011 revision we describethe grade of confidence (GoC) we have in these estimates. As there is no underlying probability model uponwhich the estimates are based, we are unable to present classical measures of uncertainty, e.g., confidenceintervals. Moreover, we have chosen not to make subjective estimates of plausibility/certainty ranges aroundthe coverage. The GoC reflects the degree of empirical support upon which the estimates are based. It isnot a judgment of the quality of data reported by national authorities.
••• Estimate is supported by reported data [R+], coverage recalculated with an independent denominatorfrom the World Population Prospects: 2017 revision from the UN Population Division (D+), and atleast one supporting survey within 2 years [S+]. While well supported, the estimate still carries a riskof being wrong.
•• Estimate is supported by at least one data source; [R+], [S+], or [D+]; and no data source, [R-], [D-], or[S-], challenges the estimate.
• There are no directly supporting data; or data from at least one source; [R-], [D-], [S-]; challenge the estimate.
In all cases these estimates should be used with caution and should be assessed in lightof the objective for which they are being used.
Description:
2017: Reported data calibrated to 2015 levels. Reported data excluded. WHO and UNICEFencourage a comprehensive review and revision of the historical time-series of reportedcoverage data. WHO and UNICEF are aware of national vaccination coverage surveycompleted in 2017 and await the results. Estimate challenged by: R-
2016: Reported data calibrated to 2015 levels. Reported data excluded. Concerns about dataquality remain. Estimate of 85 percent changed from previous revision value of 78 per-cent. Estimate challenged by: D-R-
2015: Estimate of 85 percent assigned by working group. Estimate based on survey results.Uganda Demographic and Health Survey 2016 card or history results of 79 percent mod-ifed for recall bias to 85 percent based on 1st dose card or history coverage of 95 percent,1st dose card only coverage of 69 percent and 3rd dose card only coverage of 62 percent.Reported data excluded. Unexplained decline in reported target population, both birthsand surviving infants. Estimate of 85 percent changed from previous revision value of 78percent. Estimate challenged by: D-R-
2014: Estimate of 85 percent assigned by working group. Estimate based on survey results.Uganda Demographic and Health Survey 2016 card or history results of 77 percent mod-ifed for recall bias to 85 percent based on 1st dose card or history coverage of 93 percent,1st dose card only coverage of 58 percent and 3rd dose card only coverage of 53 percent.Reported data excluded. Implementation of the Uganda 2012-14 EPI revitalization planresulted in marked increase in administrative coverage and the number of children vac-cinated between 2012 and 2014. It is, however, unclear whether these rapid increasesrepresent true gains or are an artifact of reported activity around improved data record-ing and monitoring. Estimate of 85 percent changed from previous revision value of 78percent. Estimate challenged by: D-R-
2013: Reported data calibrated to 2011 and 2014 levels. Reported data excluded. A national webbased health management information system was implemented in all districts. A DQSconducted in 2013 suggests problems in reporting and monitoring and shows that datawere being over reported. The programme plans to address this and other monitoringissues during 2014. Estimate of 86 percent changed from previous revision value of 78percent. Estimate challenged by: R-
2012: Reported data calibrated to 2011 and 2014 levels. 1 month vaccine shortage. Estimate of87 percent changed from previous revision value of 78 percent. Estimate challenged by:D-R-
2011: Estimate of 92 percent assigned by working group. Estimate based on DTP3 coverage.Estimate of 92 percent changed from previous revision value of 82 percent. Estimatechallenged by: D-R-S-
2010: DTP-HepB-Hib combination vaccine used; estimates set to level of DTP3 estimate.Uganda Demographic and Health Survey 2011 card or history results of 72 percent mod-ifed for recall bias to 80 percent based on 1st dose card or history coverage of 93 percent,1st dose card only coverage of 58 percent and 3rd dose card only coverage of 50 percent.GoC=R+ S+ D+
July 7, 2018; page 14 WHO and UNICEF estimates of national immunization coverage - next revision available July 15, 2019 data received as of July 4, 2018

Uganda - HepB3
2009: Reported data calibrated to 2005 and 2010 levels. Estimate challenged by: R-2008: Reported data calibrated to 2005 and 2010 levels. Estimate challenged by: R-2007: Reported data calibrated to 2005 and 2010 levels. Estimate challenged by: R-2006: Reported data calibrated to 2005 and 2010 levels. Estimate challenged by: R-
July 7, 2018; page 15 WHO and UNICEF estimates of national immunization coverage - next revision available July 15, 2019 data received as of July 4, 2018
Uganda - Hib3
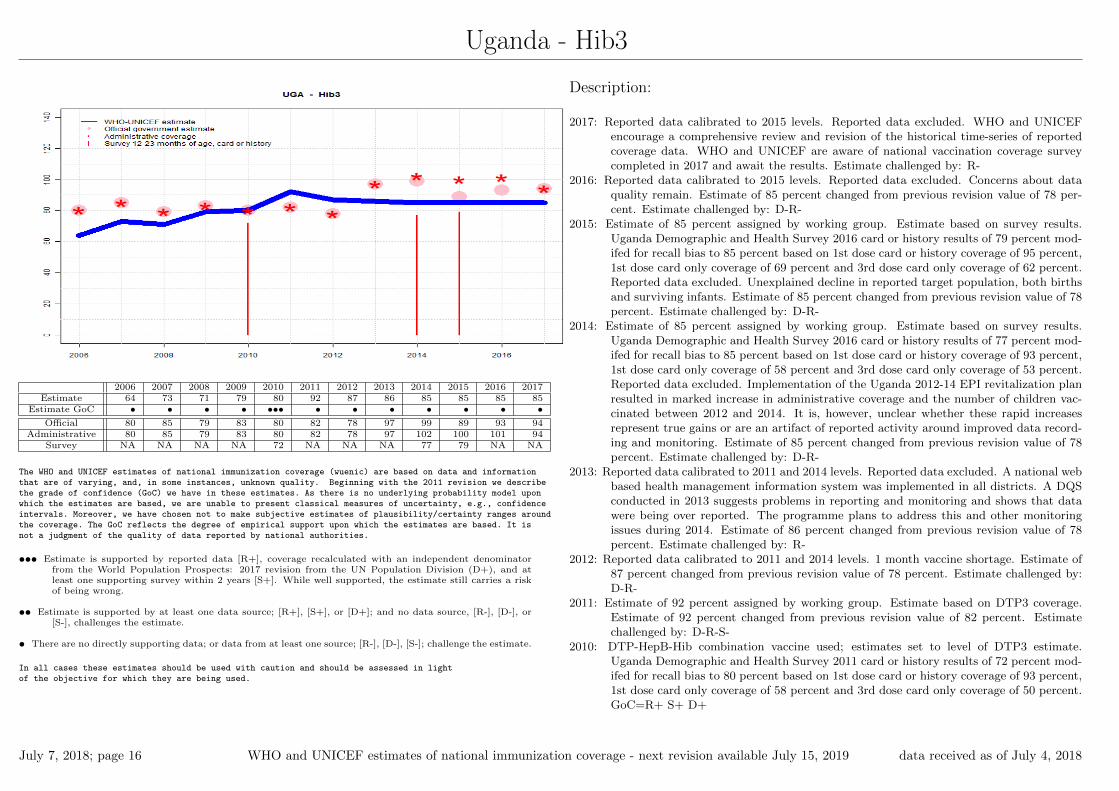
2006 2007 2008 2009 2010 2011 2012 2013 2014 2015 2016 2017Estimate 64 73 71 79 80 92 87 86 85 85 85 85
Estimate GoC • • • • ••• • • • • • • •Official 80 85 79 83 80 82 78 97 99 89 93 94
Administrative 80 85 79 83 80 82 78 97 102 100 101 94Survey NA NA NA NA 72 NA NA NA 77 79 NA NA
The WHO and UNICEF estimates of national immunization coverage (wuenic) are based on data and informationthat are of varying, and, in some instances, unknown quality. Beginning with the 2011 revision we describethe grade of confidence (GoC) we have in these estimates. As there is no underlying probability model uponwhich the estimates are based, we are unable to present classical measures of uncertainty, e.g., confidenceintervals. Moreover, we have chosen not to make subjective estimates of plausibility/certainty ranges aroundthe coverage. The GoC reflects the degree of empirical support upon which the estimates are based. It isnot a judgment of the quality of data reported by national authorities.
••• Estimate is supported by reported data [R+], coverage recalculated with an independent denominatorfrom the World Population Prospects: 2017 revision from the UN Population Division (D+), and atleast one supporting survey within 2 years [S+]. While well supported, the estimate still carries a riskof being wrong.
•• Estimate is supported by at least one data source; [R+], [S+], or [D+]; and no data source, [R-], [D-], or[S-], challenges the estimate.
• There are no directly supporting data; or data from at least one source; [R-], [D-], [S-]; challenge the estimate.
In all cases these estimates should be used with caution and should be assessed in lightof the objective for which they are being used.
Description:
2017: Reported data calibrated to 2015 levels. Reported data excluded. WHO and UNICEFencourage a comprehensive review and revision of the historical time-series of reportedcoverage data. WHO and UNICEF are aware of national vaccination coverage surveycompleted in 2017 and await the results. Estimate challenged by: R-
2016: Reported data calibrated to 2015 levels. Reported data excluded. Concerns about dataquality remain. Estimate of 85 percent changed from previous revision value of 78 per-cent. Estimate challenged by: D-R-
2015: Estimate of 85 percent assigned by working group. Estimate based on survey results.Uganda Demographic and Health Survey 2016 card or history results of 79 percent mod-ifed for recall bias to 85 percent based on 1st dose card or history coverage of 95 percent,1st dose card only coverage of 69 percent and 3rd dose card only coverage of 62 percent.Reported data excluded. Unexplained decline in reported target population, both birthsand surviving infants. Estimate of 85 percent changed from previous revision value of 78percent. Estimate challenged by: D-R-
2014: Estimate of 85 percent assigned by working group. Estimate based on survey results.Uganda Demographic and Health Survey 2016 card or history results of 77 percent mod-ifed for recall bias to 85 percent based on 1st dose card or history coverage of 93 percent,1st dose card only coverage of 58 percent and 3rd dose card only coverage of 53 percent.Reported data excluded. Implementation of the Uganda 2012-14 EPI revitalization planresulted in marked increase in administrative coverage and the number of children vac-cinated between 2012 and 2014. It is, however, unclear whether these rapid increasesrepresent true gains or are an artifact of reported activity around improved data record-ing and monitoring. Estimate of 85 percent changed from previous revision value of 78percent. Estimate challenged by: D-R-
2013: Reported data calibrated to 2011 and 2014 levels. Reported data excluded. A national webbased health management information system was implemented in all districts. A DQSconducted in 2013 suggests problems in reporting and monitoring and shows that datawere being over reported. The programme plans to address this and other monitoringissues during 2014. Estimate of 86 percent changed from previous revision value of 78percent. Estimate challenged by: R-
2012: Reported data calibrated to 2011 and 2014 levels. 1 month vaccine shortage. Estimate of87 percent changed from previous revision value of 78 percent. Estimate challenged by:D-R-
2011: Estimate of 92 percent assigned by working group. Estimate based on DTP3 coverage.Estimate of 92 percent changed from previous revision value of 82 percent. Estimatechallenged by: D-R-S-
2010: DTP-HepB-Hib combination vaccine used; estimates set to level of DTP3 estimate.Uganda Demographic and Health Survey 2011 card or history results of 72 percent mod-ifed for recall bias to 80 percent based on 1st dose card or history coverage of 93 percent,1st dose card only coverage of 58 percent and 3rd dose card only coverage of 50 percent.GoC=R+ S+ D+
July 7, 2018; page 16 WHO and UNICEF estimates of national immunization coverage - next revision available July 15, 2019 data received as of July 4, 2018
Uganda - Hib3
2009: Reported data calibrated to 2005 and 2010 levels. Estimate challenged by: R-2008: Reported data calibrated to 2005 and 2010 levels. Estimate challenged by: R-2007: Reported data calibrated to 2005 and 2010 levels. Estimate challenged by: R-2006: Reported data calibrated to 2005 and 2010 levels. Estimate challenged by: R-
July 7, 2018; page 17 WHO and UNICEF estimates of national immunization coverage - next revision available July 15, 2019 data received as of July 4, 2018

Uganda - RotaC
2006 2007 2008 2009 2010 2011 2012 2013 2014 2015 2016 2017Estimate NA NA NA NA NA NA NA NA NA NA NA NA
Estimate GoC NA NA NA NA NA NA NA NA NA NA NA NA
Official NA NA NA NA NA NA NA NA NA NA NA NAAdministrative NA NA NA NA NA NA NA NA NA NA NA NA
Survey NA NA NA NA NA NA NA NA 4 3 NA NA
The WHO and UNICEF estimates of national immunization coverage (wuenic) are based on data and informationthat are of varying, and, in some instances, unknown quality. Beginning with the 2011 revision we describethe grade of confidence (GoC) we have in these estimates. As there is no underlying probability model uponwhich the estimates are based, we are unable to present classical measures of uncertainty, e.g., confidenceintervals. Moreover, we have chosen not to make subjective estimates of plausibility/certainty ranges aroundthe coverage. The GoC reflects the degree of empirical support upon which the estimates are based. It isnot a judgment of the quality of data reported by national authorities.
••• Estimate is supported by reported data [R+], coverage recalculated with an independent denominatorfrom the World Population Prospects: 2017 revision from the UN Population Division (D+), and atleast one supporting survey within 2 years [S+]. While well supported, the estimate still carries a riskof being wrong.
•• Estimate is supported by at least one data source; [R+], [S+], or [D+]; and no data source, [R-], [D-], or[S-], challenges the estimate.
• There are no directly supporting data; or data from at least one source; [R-], [D-], [S-]; challenge the estimate.
In all cases these estimates should be used with caution and should be assessed in lightof the objective for which they are being used.
July 7, 2018; page 18 WHO and UNICEF estimates of national immunization coverage - next revision available July 15, 2019 data received as of July 4, 2018
Uganda - PcV3
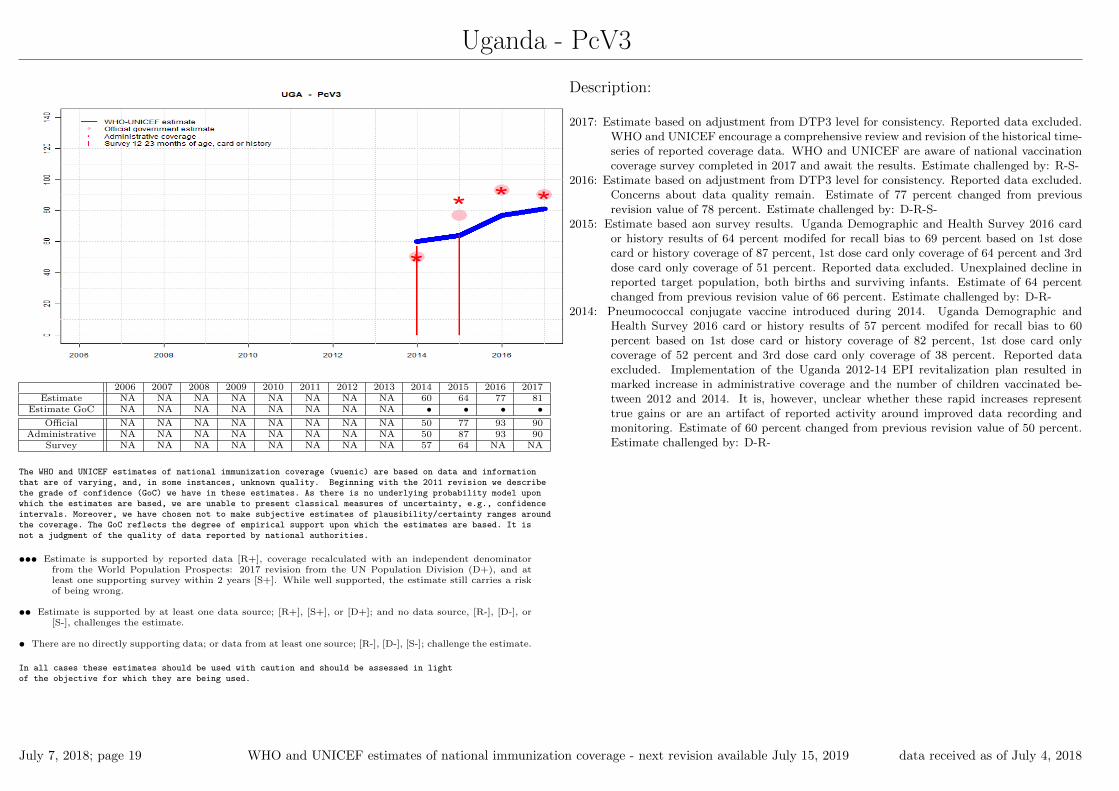
2006 2007 2008 2009 2010 2011 2012 2013 2014 2015 2016 2017Estimate NA NA NA NA NA NA NA NA 60 64 77 81
Estimate GoC NA NA NA NA NA NA NA NA • • • •Official NA NA NA NA NA NA NA NA 50 77 93 90
Administrative NA NA NA NA NA NA NA NA 50 87 93 90Survey NA NA NA NA NA NA NA NA 57 64 NA NA
The WHO and UNICEF estimates of national immunization coverage (wuenic) are based on data and informationthat are of varying, and, in some instances, unknown quality. Beginning with the 2011 revision we describethe grade of confidence (GoC) we have in these estimates. As there is no underlying probability model uponwhich the estimates are based, we are unable to present classical measures of uncertainty, e.g., confidenceintervals. Moreover, we have chosen not to make subjective estimates of plausibility/certainty ranges aroundthe coverage. The GoC reflects the degree of empirical support upon which the estimates are based. It isnot a judgment of the quality of data reported by national authorities.
••• Estimate is supported by reported data [R+], coverage recalculated with an independent denominatorfrom the World Population Prospects: 2017 revision from the UN Population Division (D+), and atleast one supporting survey within 2 years [S+]. While well supported, the estimate still carries a riskof being wrong.
•• Estimate is supported by at least one data source; [R+], [S+], or [D+]; and no data source, [R-], [D-], or[S-], challenges the estimate.
• There are no directly supporting data; or data from at least one source; [R-], [D-], [S-]; challenge the estimate.
In all cases these estimates should be used with caution and should be assessed in lightof the objective for which they are being used.
Description:
2017: Estimate based on adjustment from DTP3 level for consistency. Reported data excluded.WHO and UNICEF encourage a comprehensive review and revision of the historical time-series of reported coverage data. WHO and UNICEF are aware of national vaccinationcoverage survey completed in 2017 and await the results. Estimate challenged by: R-S-
2016: Estimate based on adjustment from DTP3 level for consistency. Reported data excluded.Concerns about data quality remain. Estimate of 77 percent changed from previousrevision value of 78 percent. Estimate challenged by: D-R-S-
2015: Estimate based aon survey results. Uganda Demographic and Health Survey 2016 cardor history results of 64 percent modifed for recall bias to 69 percent based on 1st dosecard or history coverage of 87 percent, 1st dose card only coverage of 64 percent and 3rddose card only coverage of 51 percent. Reported data excluded. Unexplained decline inreported target population, both births and surviving infants. Estimate of 64 percentchanged from previous revision value of 66 percent. Estimate challenged by: D-R-
2014: Pneumococcal conjugate vaccine introduced during 2014. Uganda Demographic andHealth Survey 2016 card or history results of 57 percent modifed for recall bias to 60percent based on 1st dose card or history coverage of 82 percent, 1st dose card onlycoverage of 52 percent and 3rd dose card only coverage of 38 percent. Reported dataexcluded. Implementation of the Uganda 2012-14 EPI revitalization plan resulted inmarked increase in administrative coverage and the number of children vaccinated be-tween 2012 and 2014. It is, however, unclear whether these rapid increases representtrue gains or are an artifact of reported activity around improved data recording andmonitoring. Estimate of 60 percent changed from previous revision value of 50 percent.Estimate challenged by: D-R-
July 7, 2018; page 19 WHO and UNICEF estimates of national immunization coverage - next revision available July 15, 2019 data received as of July 4, 2018
Uganda - survey details
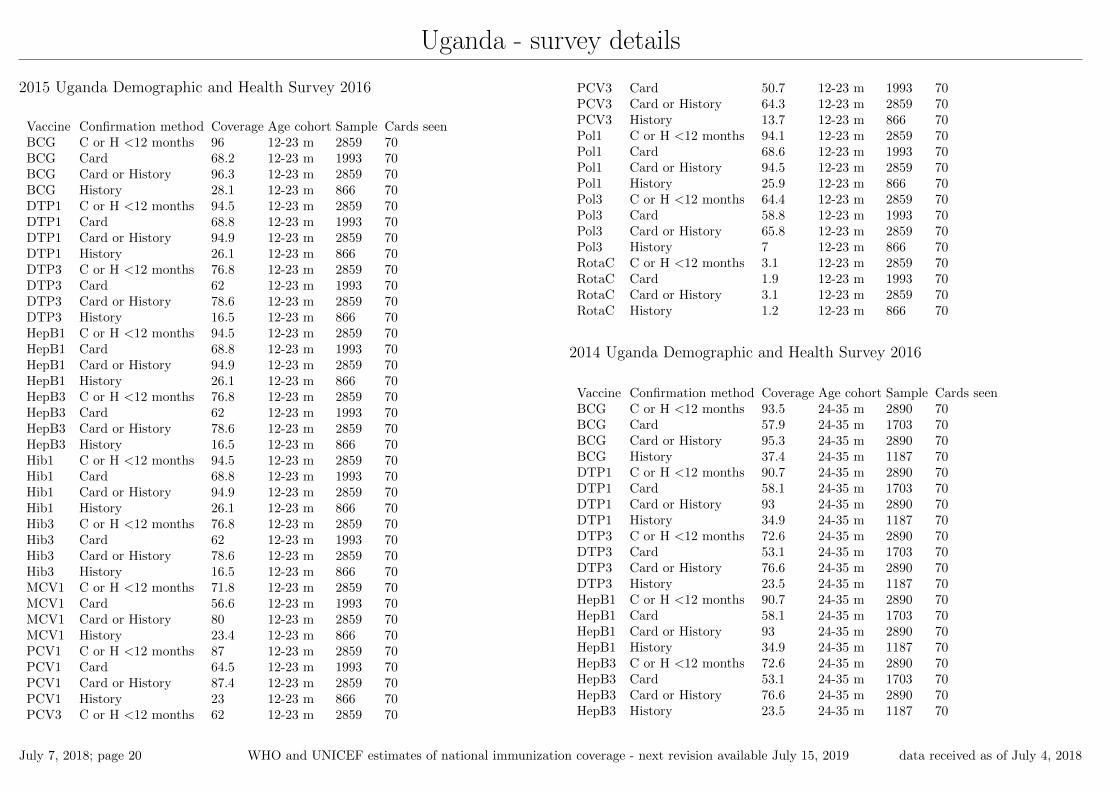
2015 Uganda Demographic and Health Survey 2016
Vaccine Confirmation method Coverage Age cohort Sample Cards seenBCG C or H <12 months 96 12-23 m 2859 70BCG Card 68.2 12-23 m 1993 70BCG Card or History 96.3 12-23 m 2859 70BCG History 28.1 12-23 m 866 70DTP1 C or H <12 months 94.5 12-23 m 2859 70DTP1 Card 68.8 12-23 m 1993 70DTP1 Card or History 94.9 12-23 m 2859 70DTP1 History 26.1 12-23 m 866 70DTP3 C or H <12 months 76.8 12-23 m 2859 70DTP3 Card 62 12-23 m 1993 70DTP3 Card or History 78.6 12-23 m 2859 70DTP3 History 16.5 12-23 m 866 70HepB1 C or H <12 months 94.5 12-23 m 2859 70HepB1 Card 68.8 12-23 m 1993 70HepB1 Card or History 94.9 12-23 m 2859 70HepB1 History 26.1 12-23 m 866 70HepB3 C or H <12 months 76.8 12-23 m 2859 70HepB3 Card 62 12-23 m 1993 70HepB3 Card or History 78.6 12-23 m 2859 70HepB3 History 16.5 12-23 m 866 70Hib1 C or H <12 months 94.5 12-23 m 2859 70Hib1 Card 68.8 12-23 m 1993 70Hib1 Card or History 94.9 12-23 m 2859 70Hib1 History 26.1 12-23 m 866 70Hib3 C or H <12 months 76.8 12-23 m 2859 70Hib3 Card 62 12-23 m 1993 70Hib3 Card or History 78.6 12-23 m 2859 70Hib3 History 16.5 12-23 m 866 70MCV1 C or H <12 months 71.8 12-23 m 2859 70MCV1 Card 56.6 12-23 m 1993 70MCV1 Card or History 80 12-23 m 2859 70MCV1 History 23.4 12-23 m 866 70PCV1 C or H <12 months 87 12-23 m 2859 70PCV1 Card 64.5 12-23 m 1993 70PCV1 Card or History 87.4 12-23 m 2859 70PCV1 History 23 12-23 m 866 70PCV3 C or H <12 months 62 12-23 m 2859 70
PCV3 Card 50.7 12-23 m 1993 70PCV3 Card or History 64.3 12-23 m 2859 70PCV3 History 13.7 12-23 m 866 70Pol1 C or H <12 months 94.1 12-23 m 2859 70Pol1 Card 68.6 12-23 m 1993 70Pol1 Card or History 94.5 12-23 m 2859 70Pol1 History 25.9 12-23 m 866 70Pol3 C or H <12 months 64.4 12-23 m 2859 70Pol3 Card 58.8 12-23 m 1993 70Pol3 Card or History 65.8 12-23 m 2859 70Pol3 History 7 12-23 m 866 70RotaC C or H <12 months 3.1 12-23 m 2859 70RotaC Card 1.9 12-23 m 1993 70RotaC Card or History 3.1 12-23 m 2859 70RotaC History 1.2 12-23 m 866 70
2014 Uganda Demographic and Health Survey 2016
Vaccine Confirmation method Coverage Age cohort Sample Cards seenBCG C or H <12 months 93.5 24-35 m 2890 70BCG Card 57.9 24-35 m 1703 70BCG Card or History 95.3 24-35 m 2890 70BCG History 37.4 24-35 m 1187 70DTP1 C or H <12 months 90.7 24-35 m 2890 70DTP1 Card 58.1 24-35 m 1703 70DTP1 Card or History 93 24-35 m 2890 70DTP1 History 34.9 24-35 m 1187 70DTP3 C or H <12 months 72.6 24-35 m 2890 70DTP3 Card 53.1 24-35 m 1703 70DTP3 Card or History 76.6 24-35 m 2890 70DTP3 History 23.5 24-35 m 1187 70HepB1 C or H <12 months 90.7 24-35 m 2890 70HepB1 Card 58.1 24-35 m 1703 70HepB1 Card or History 93 24-35 m 2890 70HepB1 History 34.9 24-35 m 1187 70HepB3 C or H <12 months 72.6 24-35 m 2890 70HepB3 Card 53.1 24-35 m 1703 70HepB3 Card or History 76.6 24-35 m 2890 70HepB3 History 23.5 24-35 m 1187 70
July 7, 2018; page 20 WHO and UNICEF estimates of national immunization coverage - next revision available July 15, 2019 data received as of July 4, 2018
Uganda - survey details
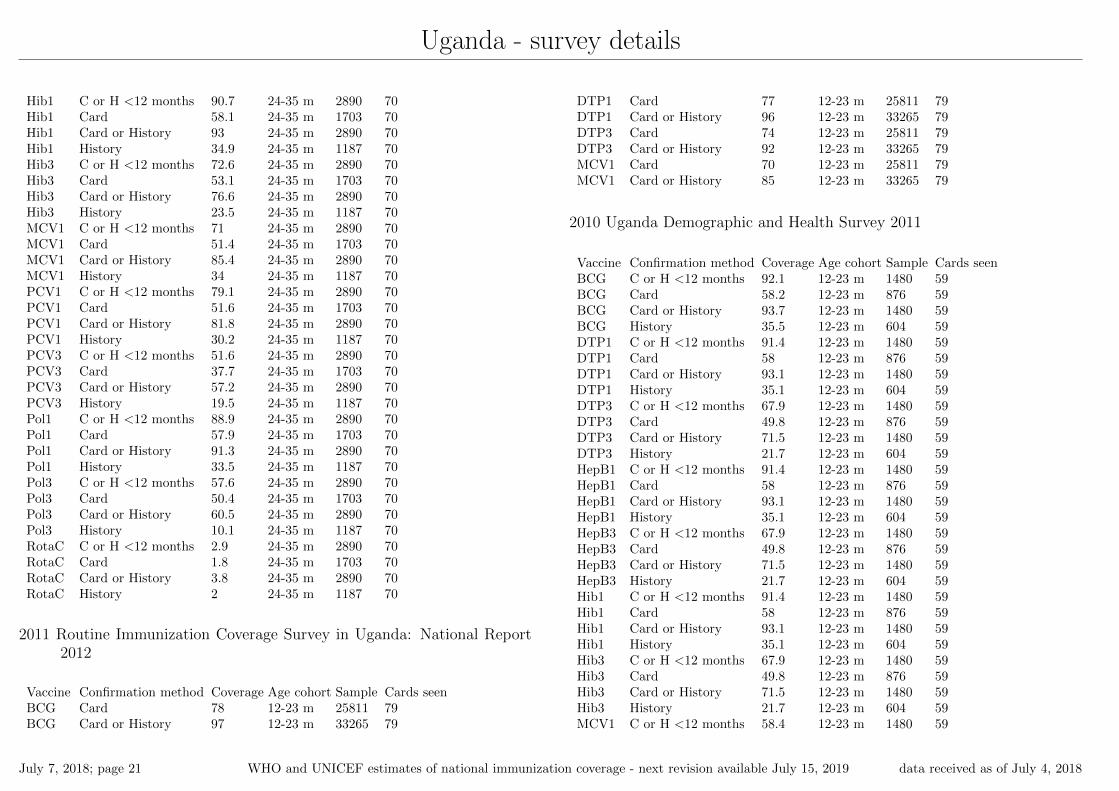
Hib1 C or H <12 months 90.7 24-35 m 2890 70Hib1 Card 58.1 24-35 m 1703 70Hib1 Card or History 93 24-35 m 2890 70Hib1 History 34.9 24-35 m 1187 70Hib3 C or H <12 months 72.6 24-35 m 2890 70Hib3 Card 53.1 24-35 m 1703 70Hib3 Card or History 76.6 24-35 m 2890 70Hib3 History 23.5 24-35 m 1187 70MCV1 C or H <12 months 71 24-35 m 2890 70MCV1 Card 51.4 24-35 m 1703 70MCV1 Card or History 85.4 24-35 m 2890 70MCV1 History 34 24-35 m 1187 70PCV1 C or H <12 months 79.1 24-35 m 2890 70PCV1 Card 51.6 24-35 m 1703 70PCV1 Card or History 81.8 24-35 m 2890 70PCV1 History 30.2 24-35 m 1187 70PCV3 C or H <12 months 51.6 24-35 m 2890 70PCV3 Card 37.7 24-35 m 1703 70PCV3 Card or History 57.2 24-35 m 2890 70PCV3 History 19.5 24-35 m 1187 70Pol1 C or H <12 months 88.9 24-35 m 2890 70Pol1 Card 57.9 24-35 m 1703 70Pol1 Card or History 91.3 24-35 m 2890 70Pol1 History 33.5 24-35 m 1187 70Pol3 C or H <12 months 57.6 24-35 m 2890 70Pol3 Card 50.4 24-35 m 1703 70Pol3 Card or History 60.5 24-35 m 2890 70Pol3 History 10.1 24-35 m 1187 70RotaC C or H <12 months 2.9 24-35 m 2890 70RotaC Card 1.8 24-35 m 1703 70RotaC Card or History 3.8 24-35 m 2890 70RotaC History 2 24-35 m 1187 70
2011 Routine Immunization Coverage Survey in Uganda: National Report2012
Vaccine Confirmation method Coverage Age cohort Sample Cards seenBCG Card 78 12-23 m 25811 79BCG Card or History 97 12-23 m 33265 79
DTP1 Card 77 12-23 m 25811 79DTP1 Card or History 96 12-23 m 33265 79DTP3 Card 74 12-23 m 25811 79DTP3 Card or History 92 12-23 m 33265 79MCV1 Card 70 12-23 m 25811 79MCV1 Card or History 85 12-23 m 33265 79
2010 Uganda Demographic and Health Survey 2011
Vaccine Confirmation method Coverage Age cohort Sample Cards seenBCG C or H <12 months 92.1 12-23 m 1480 59BCG Card 58.2 12-23 m 876 59BCG Card or History 93.7 12-23 m 1480 59BCG History 35.5 12-23 m 604 59DTP1 C or H <12 months 91.4 12-23 m 1480 59DTP1 Card 58 12-23 m 876 59DTP1 Card or History 93.1 12-23 m 1480 59DTP1 History 35.1 12-23 m 604 59DTP3 C or H <12 months 67.9 12-23 m 1480 59DTP3 Card 49.8 12-23 m 876 59DTP3 Card or History 71.5 12-23 m 1480 59DTP3 History 21.7 12-23 m 604 59HepB1 C or H <12 months 91.4 12-23 m 1480 59HepB1 Card 58 12-23 m 876 59HepB1 Card or History 93.1 12-23 m 1480 59HepB1 History 35.1 12-23 m 604 59HepB3 C or H <12 months 67.9 12-23 m 1480 59HepB3 Card 49.8 12-23 m 876 59HepB3 Card or History 71.5 12-23 m 1480 59HepB3 History 21.7 12-23 m 604 59Hib1 C or H <12 months 91.4 12-23 m 1480 59Hib1 Card 58 12-23 m 876 59Hib1 Card or History 93.1 12-23 m 1480 59Hib1 History 35.1 12-23 m 604 59Hib3 C or H <12 months 67.9 12-23 m 1480 59Hib3 Card 49.8 12-23 m 876 59Hib3 Card or History 71.5 12-23 m 1480 59Hib3 History 21.7 12-23 m 604 59MCV1 C or H <12 months 58.4 12-23 m 1480 59
July 7, 2018; page 21 WHO and UNICEF estimates of national immunization coverage - next revision available July 15, 2019 data received as of July 4, 2018
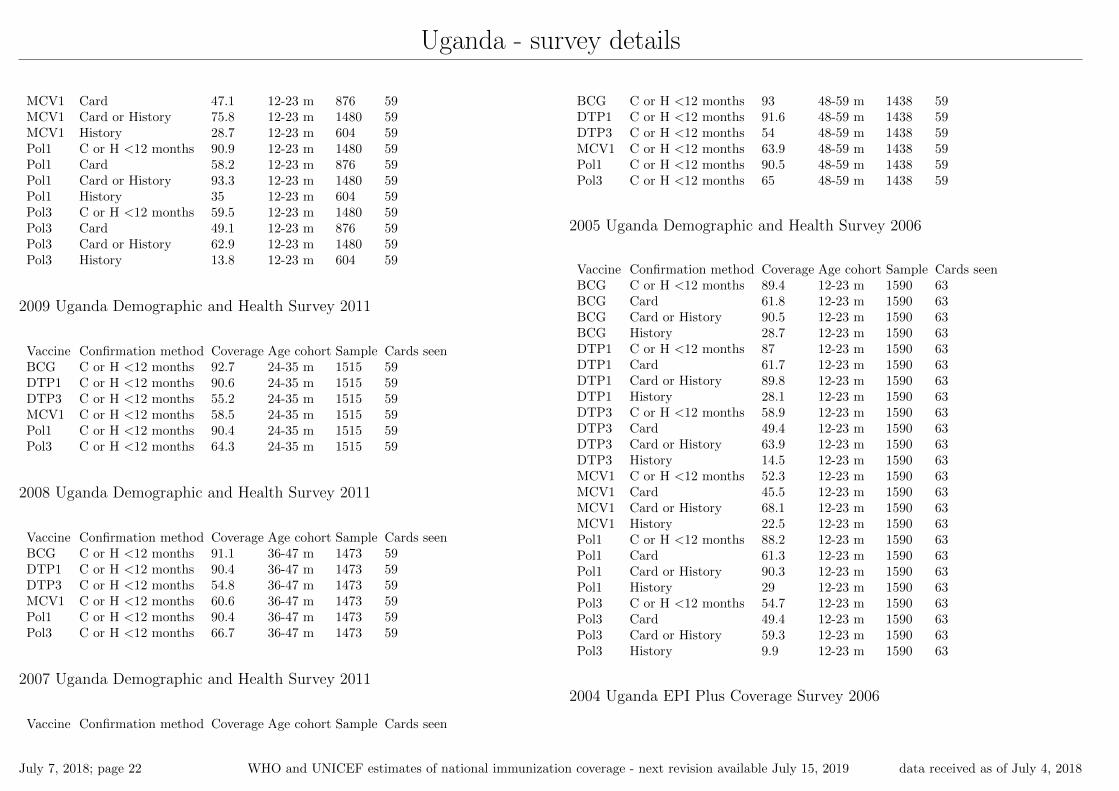
Uganda - survey details
MCV1 Card 47.1 12-23 m 876 59MCV1 Card or History 75.8 12-23 m 1480 59MCV1 History 28.7 12-23 m 604 59Pol1 C or H <12 months 90.9 12-23 m 1480 59Pol1 Card 58.2 12-23 m 876 59Pol1 Card or History 93.3 12-23 m 1480 59Pol1 History 35 12-23 m 604 59Pol3 C or H <12 months 59.5 12-23 m 1480 59Pol3 Card 49.1 12-23 m 876 59Pol3 Card or History 62.9 12-23 m 1480 59Pol3 History 13.8 12-23 m 604 59
2009 Uganda Demographic and Health Survey 2011
Vaccine Confirmation method Coverage Age cohort Sample Cards seenBCG C or H <12 months 92.7 24-35 m 1515 59DTP1 C or H <12 months 90.6 24-35 m 1515 59DTP3 C or H <12 months 55.2 24-35 m 1515 59MCV1 C or H <12 months 58.5 24-35 m 1515 59Pol1 C or H <12 months 90.4 24-35 m 1515 59Pol3 C or H <12 months 64.3 24-35 m 1515 59
2008 Uganda Demographic and Health Survey 2011
Vaccine Confirmation method Coverage Age cohort Sample Cards seenBCG C or H <12 months 91.1 36-47 m 1473 59DTP1 C or H <12 months 90.4 36-47 m 1473 59DTP3 C or H <12 months 54.8 36-47 m 1473 59MCV1 C or H <12 months 60.6 36-47 m 1473 59Pol1 C or H <12 months 90.4 36-47 m 1473 59Pol3 C or H <12 months 66.7 36-47 m 1473 59
2007 Uganda Demographic and Health Survey 2011
Vaccine Confirmation method Coverage Age cohort Sample Cards seen
BCG C or H <12 months 93 48-59 m 1438 59DTP1 C or H <12 months 91.6 48-59 m 1438 59DTP3 C or H <12 months 54 48-59 m 1438 59MCV1 C or H <12 months 63.9 48-59 m 1438 59Pol1 C or H <12 months 90.5 48-59 m 1438 59Pol3 C or H <12 months 65 48-59 m 1438 59
2005 Uganda Demographic and Health Survey 2006
Vaccine Confirmation method Coverage Age cohort Sample Cards seenBCG C or H <12 months 89.4 12-23 m 1590 63BCG Card 61.8 12-23 m 1590 63BCG Card or History 90.5 12-23 m 1590 63BCG History 28.7 12-23 m 1590 63DTP1 C or H <12 months 87 12-23 m 1590 63DTP1 Card 61.7 12-23 m 1590 63DTP1 Card or History 89.8 12-23 m 1590 63DTP1 History 28.1 12-23 m 1590 63DTP3 C or H <12 months 58.9 12-23 m 1590 63DTP3 Card 49.4 12-23 m 1590 63DTP3 Card or History 63.9 12-23 m 1590 63DTP3 History 14.5 12-23 m 1590 63MCV1 C or H <12 months 52.3 12-23 m 1590 63MCV1 Card 45.5 12-23 m 1590 63MCV1 Card or History 68.1 12-23 m 1590 63MCV1 History 22.5 12-23 m 1590 63Pol1 C or H <12 months 88.2 12-23 m 1590 63Pol1 Card 61.3 12-23 m 1590 63Pol1 Card or History 90.3 12-23 m 1590 63Pol1 History 29 12-23 m 1590 63Pol3 C or H <12 months 54.7 12-23 m 1590 63Pol3 Card 49.4 12-23 m 1590 63Pol3 Card or History 59.3 12-23 m 1590 63Pol3 History 9.9 12-23 m 1590 63
2004 Uganda EPI Plus Coverage Survey 2006
July 7, 2018; page 22 WHO and UNICEF estimates of national immunization coverage - next revision available July 15, 2019 data received as of July 4, 2018

Uganda - survey details
Vaccine Confirmation method Coverage Age cohort Sample Cards seenBCG Card or History 93.1 12-23 m 232 73DTP1 Card or History 85.2 12-23 m 232 73DTP3 Card or History 76.3 12-23 m 232 73HepB1 Card or History 85.2 12-23 m 232 73HepB3 Card or History 76.3 12-23 m 232 73Hib3 Card or History 76.3 12-23 m 232 73MCV1 Card or History 71.2 12-23 m 232 73Pol1 Card or History 88.4 12-23 m 232 73Pol3 Card or History 75 12-23 m 232 73
1999 Uganda Demographic and Health Survey 2000-2001
Vaccine Confirmation method Coverage Age cohort Sample Cards seenBCG C or H <12 months 75 12-23 m 1504 -BCG Card 46.2 12-23 m 1504 -BCG Card or History 78.7 12-23 m 1504 -BCG History 32.5 12-23 m 1504 -DTP1 C or H <12 months 72.9 12-23 m 1504 -DTP1 Card 44.8 12-23 m 1504 -DTP1 Card or History 77 12-23 m 1504 -DTP1 History 32.2 12-23 m 1504 -DTP3 C or H <12 months 42 12-23 m 1504 -DTP3 Card 31.2 12-23 m 1504 -DTP3 Card or History 46.1 12-23 m 1504 -
DTP3 History 15 12-23 m 1504 -MCV1 C or H <12 months 42.3 12-23 m 1504 -MCV1 Card 32.2 12-23 m 1504 -MCV1 Card or History 56.8 12-23 m 1504 -MCV1 History 24.6 12-23 m 1504 -Pol1 C or H <12 months 79.4 12-23 m 1504 -Pol1 Card 45.7 12-23 m 1504 -Pol1 Card or History 83.9 12-23 m 1504 -Pol1 History 38.2 12-23 m 1504 -Pol3 C or H <12 months 49.6 12-23 m 1504 -Pol3 Card 33.5 12-23 m 1504 -Pol3 Card or History 54.1 12-23 m 1504 -Pol3 History 20.6 12-23 m 1504 -
1997 Uganda Immunization Coverage Validation Survey 1998/1999
Vaccine Confirmation method Coverage Age cohort Sample Cards seenBCG Card or History 82.5 12-23 m 10466 -DTP1 Card or History 78 12-23 m 10466 -DTP3 Card or History 54.5 12-23 m 10466 -MCV1 Card or History 53.1 12-23 m 10466 -Pol1 Card or History 79.4 12-23 m 10466 -Pol3 Card or History 54.9 12-23 m 10466 -
Further information and estimates for previous years are available at:
http://www.data.unicef.org/child-health/immunization
http://www.who.int/immunization/monitoring_surveillance/routine/coverage/en/index4.html
July 7, 2018; page 23 WHO and UNICEF estimates of national immunization coverage - next revision available July 15, 2019 data received as of July 4, 2018