Embed Size (px)
Citation preview

DTI ECONOMICS PAPER NO. 3
UK Competitiveness: moving to the next stage
BY PROFESSOR MICHAEL E PORTERAND CHRISTIAN H M KETELS
INSTITUTE OF STRATEGY ANDCOMPETITIVENESS, HARVARD BUSINESS SCHOOL
MAY 2003

The DTI drives our ambition of‘prosperity for all’ by working to createthe best environment for businesssuccess in the UK. We help peopleand companies become moreproductive by promoting enterprise,innovation and creativity.
We champion UK business at homeand abroad. We invest heavily inworld-class science and technology.We protect the rights of workingpeople and consumers. And westand up for fair and open markets in the UK, Europe and the world.
ECONOMIC & SOCIALRESEARCH COUNCIL
The ESRC is the UK’s largest fundingagency for research and postgraduatetraining relating to social and economicissues. It provides independent, high-quality, relevant research to business,the public sector and Government. The ESRC invests more than £76 million every year in social scienceand at any time is supporting some2,000 researchers in academicinstitutions and research policyinstitutes. It also funds postgraduatetraining within the social sciences tonurture the researchers of tomorrow. More at http://www.esrc.ac.uk

DTI ECONOMICS PAPER NO. 3
UK Competitiveness: moving to the next stage
BY PROFESSOR MICHAEL E PORTERAND CHRISTIAN H M KETELS
INSTITUTE OF STRATEGY ANDCOMPETITIVENESS, HARVARD BUSINESS SCHOOL
MAY 2003

1UK COMPETITIVENESS: MOVING TO THE NEXT STAGE
ForewordThe persistence of the productivity gap with our main competitors is a key issue in UKeconomic policy-making. In order to understand this problem better, the DTI and theESRC asked Professor Michael Porter, of the Institute of Strategy and Competitiveness atHarvard Business School, to investigate the current state of UK competitiveness.
Professor Porter points to the UK’s recent success in raising prosperity. He demonstratesthe UK’s strengths in terms of science and engineering, its supportive market framework,and its improved macroeconomic environment. However, he highlights continuedweaknesses in terms of skills, clusters of interconnected companies and innovation.
The most valuable message is that the UK needs a new conception of competitiveness.In the past, the UK has been very successful in implementing key market-based reforms:deregulation, privatisation and competition. But these aspects of industrial policy are nowrunning into diminishing returns.
Professor Porter argues that the UK now needs an approach focussed on improving skills,stimulating innovation and fostering enterprise. It is only by building such capacity, thatwe will be able to move to the next stage of improving competitiveness and achievesustained higher levels of prosperity.
In addition to his policy recommendations, Professor Porter has set out an ambitiousresearch agenda for the UK. Both the DTI and ESRC are committed to improving thestate of knowledge about the UK economy in order to provide a robust evidence base forfuture policy development. Much of this work will be carried out through AIM, themanagement research initiative supported by the ESRC and led by Professor Anne Huff.Other investments by the ESRC will also make a significant contribution.
We hope Professor Porter's analysis will stimulate debate and form part of a widerdialogue involving the DTI, ESRC and all with an interest in the economic performanceof the UK.
Vicky Pryce Frances CairncrossChief Economist and Chair, Economic andDirector-General Economics, Social Research CouncilDTI
2
DTI Economics Papers
The reviews of the DTI in Autumn 2001 placed analysis at the heart of policy-making. Aspart of this process the Department has decided to make its analysis and evidence basemore publicly available through the publication of a series of DTI Economics Papers thatwill set out the thinking underpinning policy development. Previous titles include:
Bundling, Tying and Portfolio Effects, Professor Barry Nalebuff (Yale University),February 2003
A Comparative Study of the British and Italian Clothing and Textile Industries,
Nicholas Owen (DTI), Alan Canon Jones (London College of Fashion), April 2003
The views expressed within DTI Economics Papers are those of the authors and shouldnot be treated as Government policy. We welcome feedback on the issues raised by theDTI Economics Papers, and comments should be sent to [email protected]
UK COMPETITIVENESS: MOVING TO THE NEXT STAGE
3
Contents
UK COMPETITIVENESS: MOVING TO THE NEXT STAGE
1 Introduction 4
a) Project Background 4
b) Key Findings 5
2 Overall Performance of the UK Economy 7
a) Prosperity 7
b) Productivity 9
c) Internationalisation, Innovation and Productivity Growth 13
3 Competitiveness and the UK BusinessEnvironment: Summary of the Evidence 18
a) Macroeconomic, Political, Social, and Legal Context 18
b) Microeconomic Business Environment 19
c) Clusters 27
d) Roles, Institutions, and Processes 30
e) Influences of Different Geographical Levels 32
4 Competitiveness and UK CompanyBehaviour: The Role of Management 34
a) UK Company Performance 34
b) UK Company Operations and Strategy: Competitive Assessment 35
c) Understanding UK Company Behaviour 38
5 Implications for Policy and Future Research 42
a) UK Competitiveness at the Transition to a New Stage 43
b) The UK Competitiveness Agenda 2003 45
c) Implications for UK Competitiveness Research 47
References and Data Sources 49
Appendix A: UK Subcluster Exports by Value, 2000 54
Appendix B: Convergence or Divergence Among Regions - Selected Countries 55

4 UK COMPETITIVENESS: MOVING TO THE NEXT STAGE
1
Introduction
a) Project Background
In October 2002, the Economic and Social Research Council (ESRC) appointed ProfessorMichael Porter and his team to conduct a brief, three-month review of the existingevidence on UK competitiveness. The effort was funded jointly by the ESRC and theDepartment of Trade and Industry (DTI). The London School of Economics and PoliticalScience (LSE) graciously served as the UK-based academic sponsor of the project.
The objective of this review is to synthesise, interpret, and draw implications from theavailable evidence on the competitiveness of the United Kingdom, applying the Portercompetitiveness framework and drawing on the learning from dozens of nationalcompetitiveness projects over the last decade. The ESRC asked that special attention bepaid to the role of management in UK competitiveness.
The review is based primarily on existing, and sometimes conflicting, research by others.We have also analysed existing detailed data from the Global Competitiveness Report(GCR) that has not been previously published, but we have not created any new primarydata. Our findings build on the existing research on UK competitiveness and confirmmany of its findings. We aim to provide an integrative framework that can aid scholarsand decision makers in the public and private sectors to set priorities and identifymissing pieces in the UK competitiveness agenda.
The integrative framework provided by the Porter microeconomic approach tocompetitiveness goes beyond a growth accounting decomposition of economicperformance to identify the probable causes underlying UK economic performance. Italso offers a holistic way of assessing their interrelationships and the changingconstraints on UK productivity and prosperity growth over time. We hope that thisframework will enable a more informed policy debate in the UK on how to manage thetransition to the next stage of competitiveness.
This review is decidedly not a comprehensive study of UK competitiveness but isintended to provide high-level guidance to policy makers on broad priorities, and to assistin defining a priority research agenda for the ESRC. In particular, this review will bemade available to the ESRC initiative on management headed by Professor Anne Huff.
A preliminary version of this report was delivered by Professor Michael E. Porter in apublic lecture at the LSE on January 22nd 2003. This report also draws upon discussions
5UK COMPETITIVENESS: MOVING TO THE NEXT STAGE
during and after the lecture and the comments made in a closed policy workshop withparticipants invited by DTI.
b) Key Findings
Pessimism and the lack of an overall strategic perspective characterise much of thecurrent public discussion about UK competitiveness. Attention is focused on theprosperity and productivity gap that remains with the United States and primaryEuropean rivals Germany and France. This performance gap persists despite the UK’s farreaching economic policy reforms of the last two decades. A search for explanations hasso far not reached a clear consensus.
Looking at the UK’s future competitiveness, concerns dominate as well. A recent surveyof UK business leaders reported a significantly more negative view on the future versuscurrent UK competitiveness.1 Changing priorities in UK economic policy are perceived tothreaten the achievements of the past two decades, e.g. low levels of regulation andtaxation. Also, other countries are seen as having matched many of the reforms thatgave the UK a competitive edge in the past.
Our findings agree on many of the specifics, but are different in overall tone. The UK hasin fact achieved a remarkable success in halting the economy’s protracted downwardeconomic trajectory of the pre-1980 period. On many indicators of economicperformance, the UK has kept pace with, if not outpaced, competing locations, especially in Europe.2 This success in terms of economic performance is directly linked to the far-reaching economic policy reforms by successive UK governments that havefundamentally changed the macroeconomic and, more importantly, the microeconomiccontext for competition.
However, the UK currently faces a transition to a new phase of economic development.The old approach to economic development is reaching the limits of its effectiveness,and government, companies, and other institutions need to rethink their policy priorities.This rethinking is not a sign of the past strategy’s failure; it is a necessary part ofgraduating to the new stage. A public consensus on the direction of the transition and onthe next stage of the country’s competitiveness would help to manage the uncertaintiesof this process. The absence of such a consensus at a time when the old policyapproach is running its course explains much of the puzzlement and even pessimism inthe current UK debate.
We find that the competitiveness agenda facing UK leaders in government and businessreflects the challenges of moving from a location competing on relatively low costs ofdoing business to a location competing on unique value and innovation. This transitionrequires investments in different elements of the business environment, upgrading ofcompany strategies, and the creation or strengthening of new types of institutions.
As to management, we find that the role of management cannot be separated from the
Intoduction
6 UK COMPETITIVENESS: MOVING TO THE NEXT STAGE
Introduction
overall competitiveness issues facing the country. Management and its decisions areboth an input and a result of the business environment. Thus UK managementperformance in many ways either reflects weaknesses in the business environment orinvolves decisions that are consistent with the current business environment eventhough they do not improve competitiveness. Management practices, then, are not atthe core of the UK competitiveness challenge; however, there is always room forimprovement. As part of the overall effort to upgrade UK competitiveness there is a clearrole for management. Efforts to upgrade management will not however be sufficient toachieve a sustained improvement in UK competitiveness.
References
1 CBI (2002)
2 European Commission (2002)
7UK COMPETITIVENESS: MOVING TO THE NEXT STAGE
2
Overall Performanceof the UK Economy
Competitiveness remains a concept that is not well understood, despite widespreadacceptance of its importance.3 To understand competitiveness, the starting point mustbe the sources of a nation’s prosperity. A nation’s standard of living is determined by theproductivity of its economy, which is measured by the value of goods and servicesproduced per unit of the nation’s human, capital and natural resources. Productivitydepends both on the value of a nation’s products and services, measured by the pricesthey can command in open markets, and the efficiency with which they can beproduced. True competitiveness then, is measured by productivity. Productivity allows anation to support high wages, a strong currency and attractive returns to capital, andwith them a high standard of living.
The UK economy has performed well on the most important economic metrics in thelast two decades, and the awareness of competitiveness issues has increased markedly.Prosperity has improved in absolute terms and has also increased relative to many otheradvanced economies. Prosperity gains relative to other locations benefited from asignificant increase in the level of labour force utilisation in the economy (hours workedper employee, employment rate, and labour force participation rate). Labour productivitygrowth has been good, but not significantly above the level in other economies. Otherintermediate measures of competitiveness, such as the UK’s world export market shareand FDI attraction, have been stable.
Despite these improvements, the levels of productivity and prosperity in the UK still lagmany other advanced economies. With labour force utilisation already at a high level,only further catch-up in labour productivity will be able to reduce the gap. Labourproductivity can increase through higher skill labour inputs, higher capital intensity, andhigher total factor productivity (technology). In all three areas the UK currently lagsbehind important competitors such as the United States, France and Germany. It willneed to close these gaps to finally achieve prosperity catch-up. This will requiresustained improvements in the microeconomic business environment.
a) Prosperity
In the last five years, the UK was one of the few advanced economies that came close
8
Overall Performance of the UK Economy
UK COMPETITIVENESS: MOVING TO THE NEXT STAGE
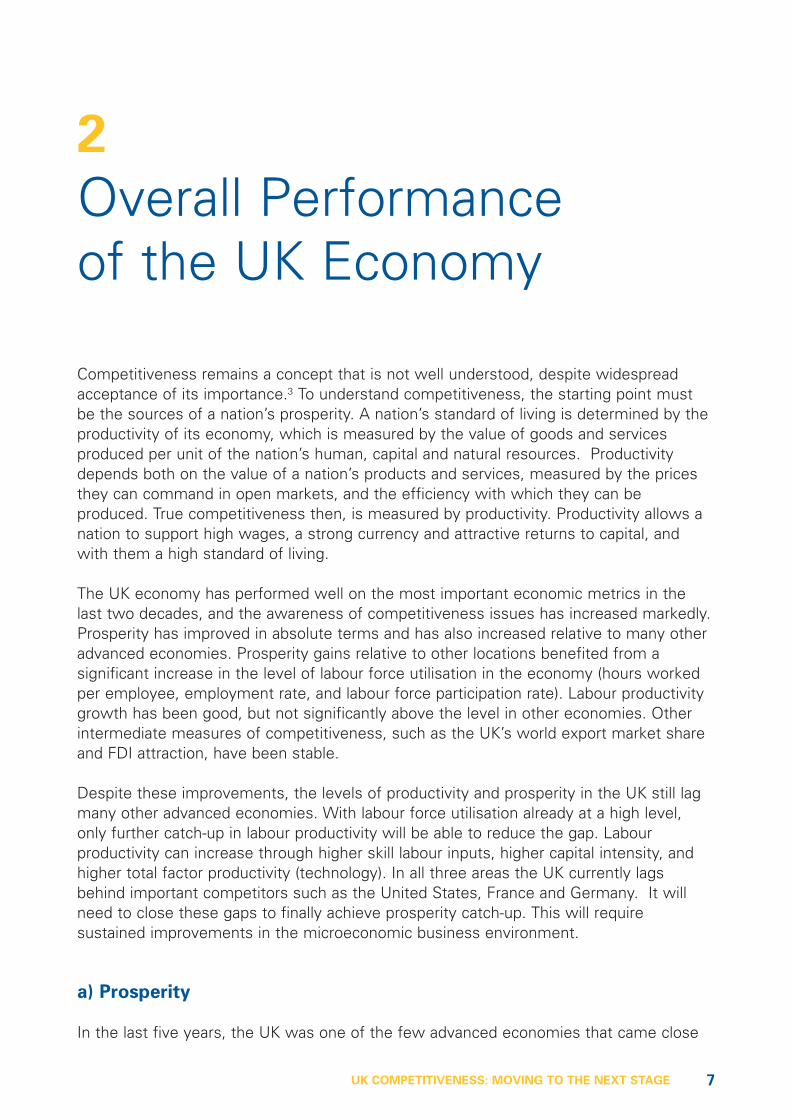
to matching the economic performance achieved by the United States. The UK’s growthrate of GDP per capita outpaced other European countries like Germany, France, Italy,and Sweden, and lagged only somewhat behind Australia, the United States, and theNetherlands. Only Ireland, Finland, and a number of European and Asian middle-incomecountries outpaced it significantly (Figure 1).
The UK’s current economic performance presents a significant change from the pre-1980period.4 In the decades before 1980, the UK lost ground against all major competingeconomies. From 1961 to 1970 the annual growth rate of GDP per working-age personfor the UK registered at 2.6%, significantly below most other advanced economiesincluding Germany (4.2%), France (4.4%), Italy (5.2%), Spain (6.6%), and Japan (8.2%).5
In the 1970’s, growth rates dropped globally due to oil price shocks. The UK’s annualgrowth rate, then at 1.6%, remained behind most other economies. The 1980’s broughtfirst stabilisation and later an increase of prosperity growth rates as the first wave ofmarket opening reforms set in. A macroeconomic crisis in the early 1990’s broughtprosperity growth to a halt. Macroeconomic stabilisation and further micro-economicreforms led to a rebound of prosperity growth in the second half of the 1990’s.
Despite its comparatively high growth rate in the last five years, the level of GDP percapita in the UK still falls behind most other advanced economies. In purchasing powerterms the gap to the United States is close to 40%, Switzerland 20%, Japan 11%,Germany 6%, and France and Sweden 3%. The UK prosperity level is on par with Italy,and outpaces countries like Singapore, New Zealand, and Spain.
GD
P p
er
Cap
ita
, 2
00
1,
US
=1
00
CAGR of GDP per Capita Relative to the
US, 1995-2001
75
50
100
Switzerland
Japan
Hong Kong
New Zealand
SingaporeItaly
Germany
Canada
FranceSweden
UK
Australia
United States
Netherlands
Taiwan
Spain
Korea Slovenia
Finland
Ireland
-2.0% -1.5% -1.0% -0.5% 0.0% 0.5% 1.0% 1.5% 2.0%
(92%,+6.6%)
Figure 1: Comparative Economic Performance - Selected Advanced Economies
Source: World Development Indicators 2002
9
Overall Performance of the UK Economy
UK COMPETITIVENESS: MOVING TO THE NEXT STAGE
The UK has, according to 1996 data, a high level of poverty relative to other Europeancountries at similar levels of prosperity.6 The existence of such pockets of povertyindicates an untapped potential for productivity growth as well as a social challenge. It isalso a signal for remaining weaknesses in the business environment, such as lack oftraining, discrimination, a low level of local government responsibility, and the separationof social and economic policies. The efforts of the last few years to address this problemmay have already led to an improvement in the situation, but no consistent data on thisis currently available.
b) Productivity
The UK’s GDP per head can be decomposed into two factors: its level of labour forceutilisation (hours worked per employee, employment rate, and labour force participationrate) and its labour productivity.
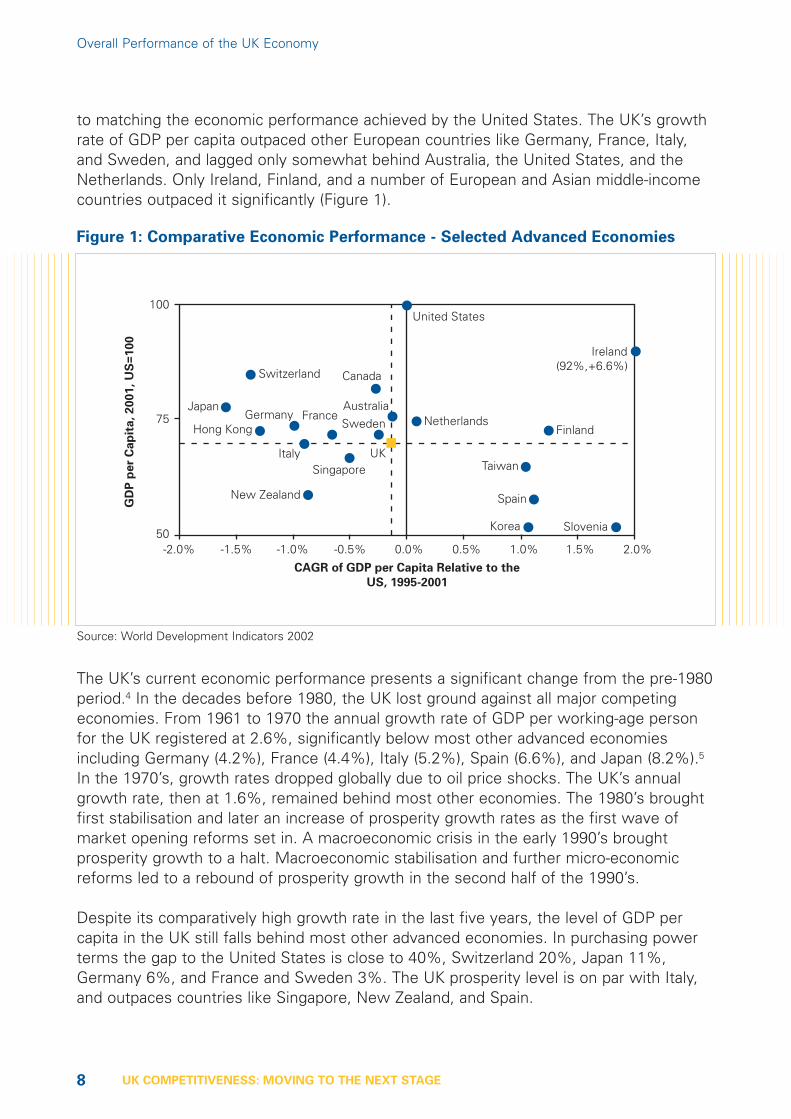
The UK currently has one of the highest levels of labour force utilisation in the OECDbehind only Japan and the United States but ahead of the Continental Europeancountries (Figure 2). The UK has a lower unemployment rate than many peer countries,and working hours per employee in the UK again fall between US and ContinentalEuropean levels. While the literature7 tends to view labour productivity as the solemeasure of economic performance, integrating a larger share of the potential workforcein the economy is an important economic and social achievement, and the UK deservescredit for its success in this area.
Lab
ou
r Fo
rce U
tilisati
on
, 1996-2
000,
UK
= 1
00
JapanGreece
ItalyBelgium
Germany
Canada
France
Sweden
UKAustraliaUnited States
Netherlands
Norway
DenmarkFinland
Spain
Ireland
Labour Productivity, 1999, UK = 100
60
60
70
80
90
100
110
120
70 80 90 100 110 120 130
Figure 2: Labour Force Utilisation and Productivity
Note: Labour Force Utilisation measured as hours worked per working age population; Labour Productivity measuredas output per hour worked.Source: OECD (2001), IMF (2003)
10
Overall Performance of the UK Economy
UK COMPETITIVENESS: MOVING TO THE NEXT STAGE
The growth in labour force utilisation in the UK has been stronger than in ContinentalEurope, and is the decisive factor that allowed the UK to catch up in terms of prosperity.8
It is always possible to raise labour productivity by shedding employment, but thisneither increases true prosperity nor a location’s competitiveness.9 Many ContinentalEuropean countries have gone down the road of making lower productivity employmentunattractive and have suffered high unemployment; the UK has instead increasedincentives for work. The UK did significantly reduce unemployment, and did not resort tocutting the average employee’s working week.
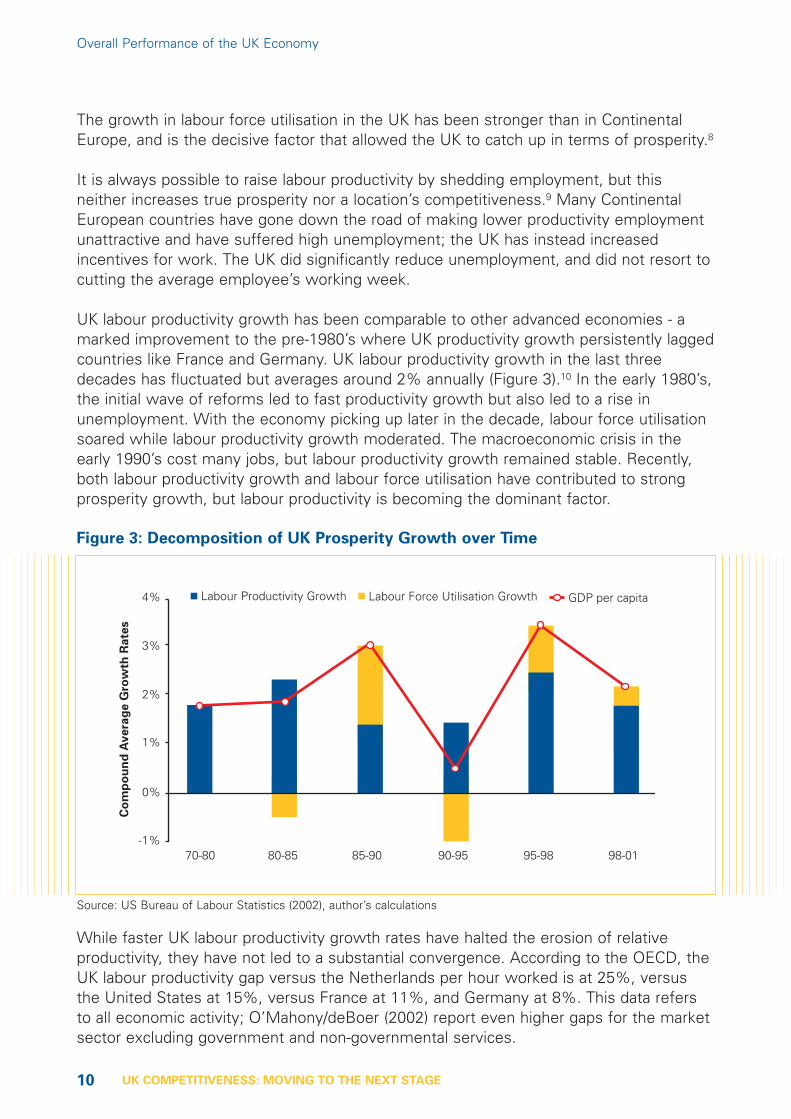
UK labour productivity growth has been comparable to other advanced economies - amarked improvement to the pre-1980’s where UK productivity growth persistently laggedcountries like France and Germany. UK labour productivity growth in the last threedecades has fluctuated but averages around 2% annually (Figure 3).10 In the early 1980’s,the initial wave of reforms led to fast productivity growth but also led to a rise inunemployment. With the economy picking up later in the decade, labour force utilisationsoared while labour productivity growth moderated. The macroeconomic crisis in theearly 1990’s cost many jobs, but labour productivity growth remained stable. Recently,both labour productivity growth and labour force utilisation have contributed to strongprosperity growth, but labour productivity is becoming the dominant factor.
While faster UK labour productivity growth rates have halted the erosion of relativeproductivity, they have not led to a substantial convergence. According to the OECD, theUK labour productivity gap versus the Netherlands per hour worked is at 25%, versusthe United States at 15%, versus France at 11%, and Germany at 8%. This data refersto all economic activity; O’Mahony/deBoer (2002) report even higher gaps for the marketsector excluding government and non-governmental services.
Co
mp
ou
nd
Avera
ge G
row
th R
ate
s
Labour Force Utilisation GrowthLabour Productivity Growth GDP per capita
70-80 80-85 85-90 90-95 95-98 98-01-1%
0%
1%
2%
3%
4%
Figure 3: Decomposition of UK Prosperity Growth over Time
Source: US Bureau of Labour Statistics (2002), author’s calculations
11
Overall Performance of the UK Economy
UK COMPETITIVENESS: MOVING TO THE NEXT STAGE
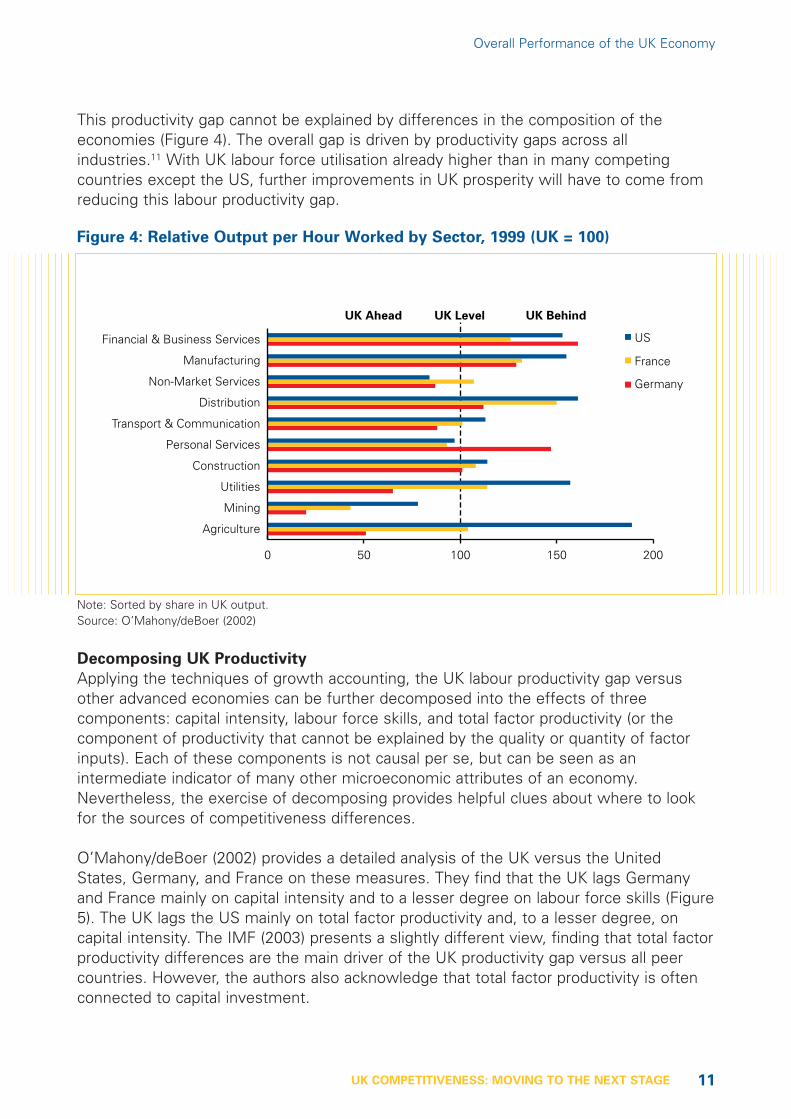
This productivity gap cannot be explained by differences in the composition of theeconomies (Figure 4). The overall gap is driven by productivity gaps across allindustries.11 With UK labour force utilisation already higher than in many competingcountries except the US, further improvements in UK prosperity will have to come fromreducing this labour productivity gap.
Decomposing UK Productivity
Applying the techniques of growth accounting, the UK labour productivity gap versusother advanced economies can be further decomposed into the effects of threecomponents: capital intensity, labour force skills, and total factor productivity (or thecomponent of productivity that cannot be explained by the quality or quantity of factorinputs). Each of these components is not causal per se, but can be seen as anintermediate indicator of many other microeconomic attributes of an economy.Nevertheless, the exercise of decomposing provides helpful clues about where to lookfor the sources of competitiveness differences.
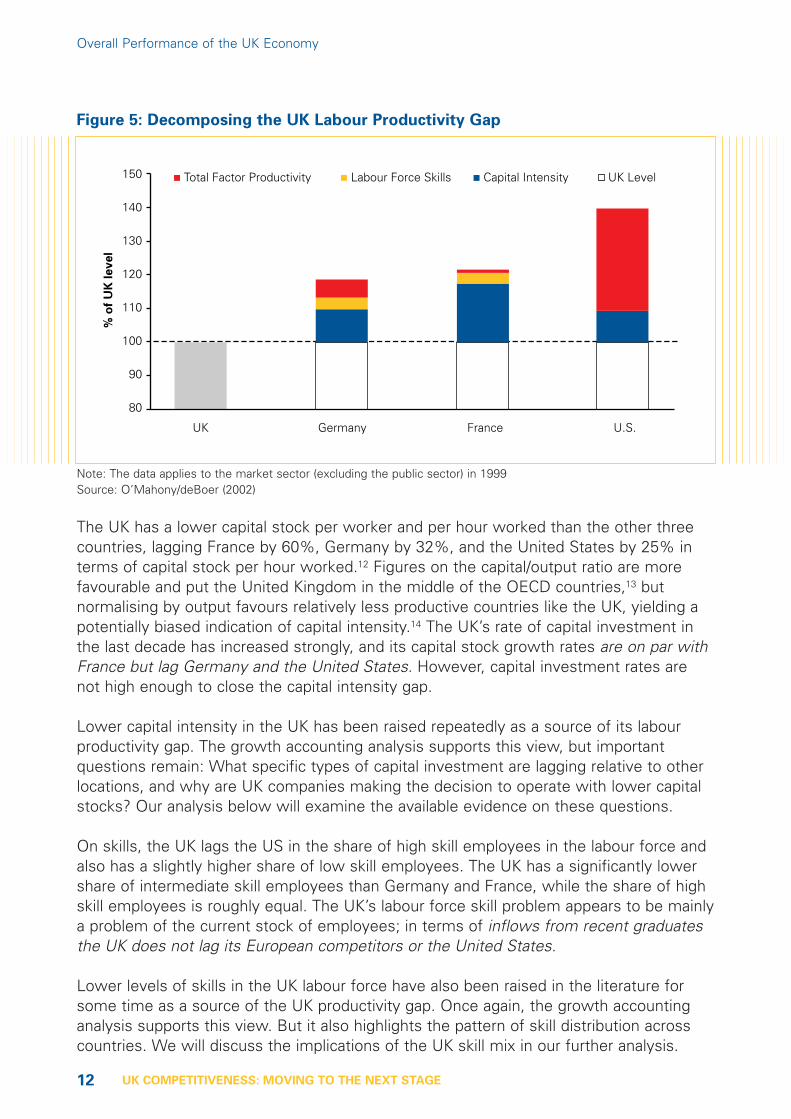
O’Mahony/deBoer (2002) provides a detailed analysis of the UK versus the UnitedStates, Germany, and France on these measures. They find that the UK lags Germanyand France mainly on capital intensity and to a lesser degree on labour force skills (Figure5). The UK lags the US mainly on total factor productivity and, to a lesser degree, oncapital intensity. The IMF (2003) presents a slightly different view, finding that total factorproductivity differences are the main driver of the UK productivity gap versus all peercountries. However, the authors also acknowledge that total factor productivity is oftenconnected to capital investment.
0 50 100 150 200
Germany
France
US
Agriculture
Mining
Utilities
Construction
Personal Services
Transport & Communication
Distribution
Non-Market Services
Manufacturing
Financial & Business Services
UK Ahead UK Level UK Behind
Figure 4: Relative Output per Hour Worked by Sector, 1999 (UK = 100)
Note: Sorted by share in UK output.Source: O’Mahony/deBoer (2002)
12
Overall Performance of the UK Economy
UK COMPETITIVENESS: MOVING TO THE NEXT STAGE
The UK has a lower capital stock per worker and per hour worked than the other threecountries, lagging France by 60%, Germany by 32%, and the United States by 25% interms of capital stock per hour worked.12 Figures on the capital/output ratio are morefavourable and put the United Kingdom in the middle of the OECD countries,13 butnormalising by output favours relatively less productive countries like the UK, yielding apotentially biased indication of capital intensity.14 The UK’s rate of capital investment inthe last decade has increased strongly, and its capital stock growth rates are on par withFrance but lag Germany and the United States. However, capital investment rates arenot high enough to close the capital intensity gap.
Lower capital intensity in the UK has been raised repeatedly as a source of its labourproductivity gap. The growth accounting analysis supports this view, but importantquestions remain: What specific types of capital investment are lagging relative to otherlocations, and why are UK companies making the decision to operate with lower capitalstocks? Our analysis below will examine the available evidence on these questions.
On skills, the UK lags the US in the share of high skill employees in the labour force andalso has a slightly higher share of low skill employees. The UK has a significantly lowershare of intermediate skill employees than Germany and France, while the share of highskill employees is roughly equal. The UK’s labour force skill problem appears to be mainlya problem of the current stock of employees; in terms of inflows from recent graduatesthe UK does not lag its European competitors or the United States.
Lower levels of skills in the UK labour force have also been raised in the literature forsome time as a source of the UK productivity gap. Once again, the growth accountinganalysis supports this view. But it also highlights the pattern of skill distribution acrosscountries. We will discuss the implications of the UK skill mix in our further analysis.
Total Factor Productivity Labour Force Skills Capital Intensity UK Level
U.S.
150
140
130
120
110
100
90
80
France
% o
f U
K l
ev
el
GermanyUK
Figure 5: Decomposing the UK Labour Productivity Gap
Note: The data applies to the market sector (excluding the public sector) in 1999Source: O’Mahony/deBoer (2002)
13
Overall Performance of the UK Economy
UK COMPETITIVENESS: MOVING TO THE NEXT STAGE
In total factor productivity (TFP), the part of labour productivity that cannot be directlyattributed to factor inputs, the UK falls in the lower middle group of advanced economies.The UK lags the US, the global leader, by roughly 50%, France by 10%, and is comparableto Germany; based on OECD data for the 1995-1998 period.15 The data on the growth ofTFP is somewhat conflicting: the US Bureau of Labour Statistics reports UK TFP growthto be high in the early phase of microeconomic reforms in the 1980’s, but falling back to alevel similar to other advanced economies more recently.16 The IMF instead reports UKTFP to be lower than in peer countries except the United States not only throughout the1970’s but also the 1980’s, and increasing in the first half of the 1990’s. As do othersources, the IMF reports falling UK TFP growth towards the end of the 1990’s.17
Lower levels of TFP indicate inefficiencies unrelated to the level and quality of factorinputs and reflect low levels of innovation, broadly defined, and less effective use oftechnology. Deficits in TFP are especially problematic for an advanced economy like theUK, because TFP becomes increasingly important for labour productivity as an economyseeks higher levels of prosperity. We will examine various measures of innovation andprobable explanations for UK innovation performance in our further analysis.
c) Internationalisation, Innovation and Productivity Growth
Productivity growth is underpinned by trade, foreign investment, and innovative activity.Here we examine these three areas as additional indications of the trajectory of the UKeconomy. In general, we find that the UK’s export position is stable; that itsattractiveness for foreign direct investment is high but decreasing; and that its innovationperformance is weak.
Exports
International trade is a direct way to ratchet up the productivity of the domestic economyby concentrating on those activities in which the country has a relative productivityadvantage. The ability to trade domestic for foreign goods and services is equivalent tohaving access to a more efficient technology. International exports are also an effectivemeasure of companies’ ability to compete successfully on world markets. Stable andgrowing export shares that are not engineered through devaluations foster risingproductivity.
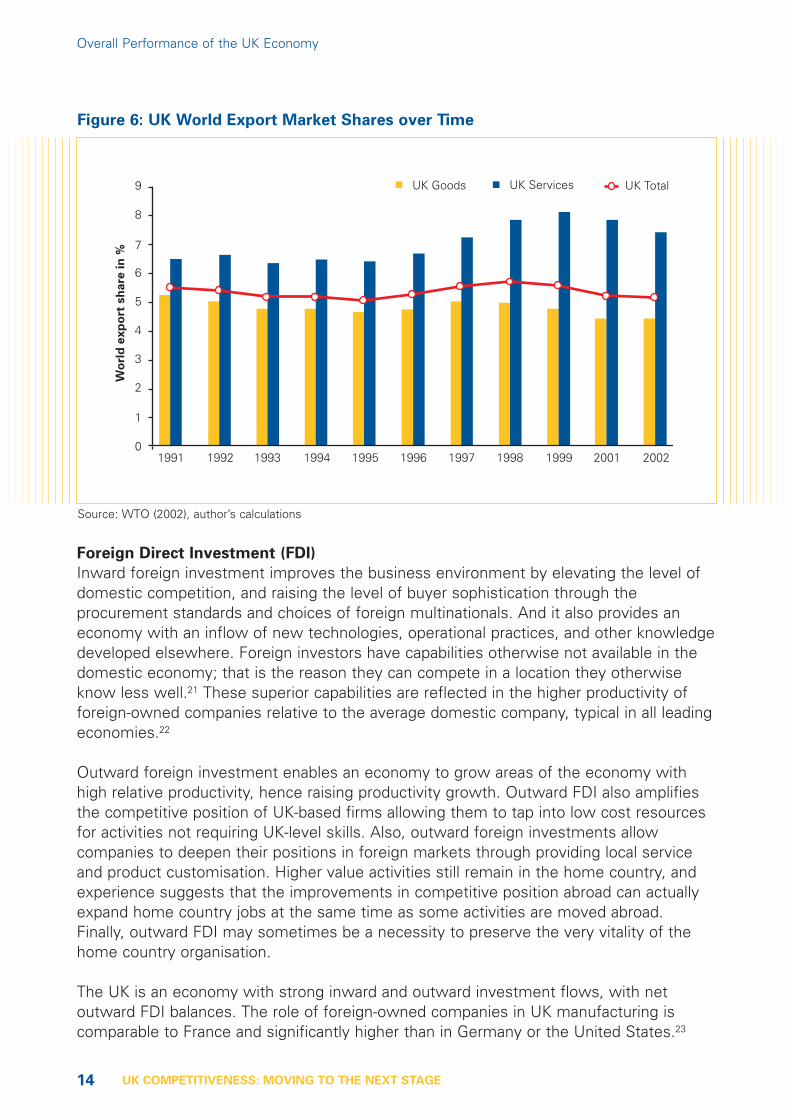
The UK’s share of exports and imports in GDP indicates significant openness tointernational trade and is in line with the size of its economy.18 The UK’s exportperformance has been strong over the last decade (Figure 6). Its share of world exportsin both goods and services has stayed relatively stable at about 5.2%19. The UK owes itsstable performance mainly to its increasing strengths in service exports, which haveoffset the slowly declining position in goods exports. Exports remained strong as theUK’s real exchange rate appreciated significantly after mid-1996.20 Only a few otheradvanced economies such as Canada and the Netherlands have maintained their worldexport shares, while many others including the United States, Japan, Germany, France,and Italy have experienced slower export growth than countries such as Chinaand Korea.
14
Overall Performance of the UK Economy
UK COMPETITIVENESS: MOVING TO THE NEXT STAGE
Foreign Direct Investment (FDI)
Inward foreign investment improves the business environment by elevating the level ofdomestic competition, and raising the level of buyer sophistication through theprocurement standards and choices of foreign multinationals. And it also provides aneconomy with an inflow of new technologies, operational practices, and other knowledgedeveloped elsewhere. Foreign investors have capabilities otherwise not available in thedomestic economy; that is the reason they can compete in a location they otherwiseknow less well.21 These superior capabilities are reflected in the higher productivity offoreign-owned companies relative to the average domestic company, typical in all leadingeconomies.22
Outward foreign investment enables an economy to grow areas of the economy withhigh relative productivity, hence raising productivity growth. Outward FDI also amplifiesthe competitive position of UK-based firms allowing them to tap into low cost resourcesfor activities not requiring UK-level skills. Also, outward foreign investments allowcompanies to deepen their positions in foreign markets through providing local serviceand product customisation. Higher value activities still remain in the home country, andexperience suggests that the improvements in competitive position abroad can actuallyexpand home country jobs at the same time as some activities are moved abroad.Finally, outward FDI may sometimes be a necessity to preserve the very vitality of thehome country organisation.
The UK is an economy with strong inward and outward investment flows, with netoutward FDI balances. The role of foreign-owned companies in UK manufacturing iscomparable to France and significantly higher than in Germany or the United States.23
0
1
2
3
4
5
6
7
8
9
Wo
rld
ex
po
rt s
ha
re i
n %
1991 1992 1993 1994 1995 1996 1997 1998 1999 2001 2002
UK Goods UK Services UK Total
Figure 6: UK World Export Market Shares over Time
Source: WTO (2002), author’s calculations
15
Overall Performance of the UK Economy
UK COMPETITIVENESS: MOVING TO THE NEXT STAGE
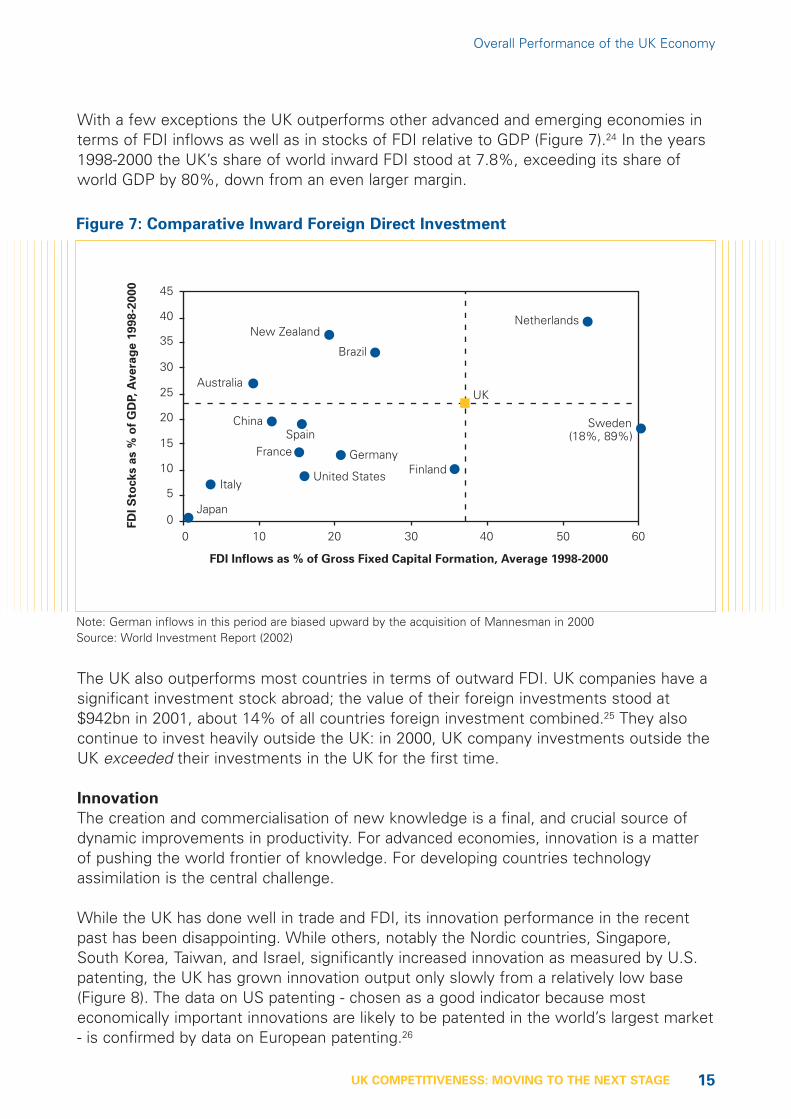
With a few exceptions the UK outperforms other advanced and emerging economies interms of FDI inflows as well as in stocks of FDI relative to GDP (Figure 7).24 In the years1998-2000 the UK’s share of world inward FDI stood at 7.8%, exceeding its share ofworld GDP by 80%, down from an even larger margin.
The UK also outperforms most countries in terms of outward FDI. UK companies have asignificant investment stock abroad; the value of their foreign investments stood at$942bn in 2001, about 14% of all countries foreign investment combined.25 They alsocontinue to invest heavily outside the UK: in 2000, UK company investments outside theUK exceeded their investments in the UK for the first time.
Innovation
The creation and commercialisation of new knowledge is a final, and crucial source ofdynamic improvements in productivity. For advanced economies, innovation is a matterof pushing the world frontier of knowledge. For developing countries technologyassimilation is the central challenge.
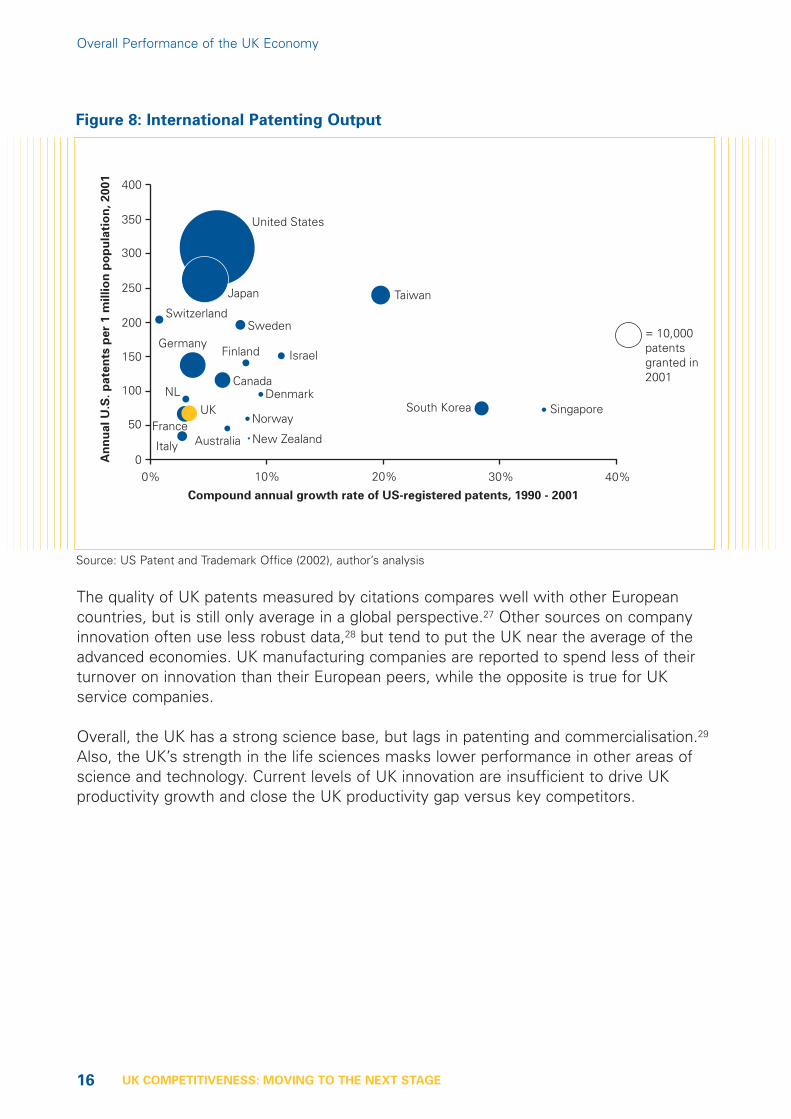
While the UK has done well in trade and FDI, its innovation performance in the recentpast has been disappointing. While others, notably the Nordic countries, Singapore,South Korea, Taiwan, and Israel, significantly increased innovation as measured by U.S.patenting, the UK has grown innovation output only slowly from a relatively low base(Figure 8). The data on US patenting - chosen as a good indicator because mosteconomically important innovations are likely to be patented in the world’s largest market- is confirmed by data on European patenting.26
FD
I S
tocks a
s %
of
GD
P, A
ve
rag
e 1
99
8-2
00
0
Japan
Italy
GermanyFrance
Sweden
UKAustralia
New Zealand
Brazil
China
United States
Netherlands
Finland
Spain
FDI Inflows as % of Gross Fixed Capital Formation, Average 1998-2000
0 10 20 30 40 50 600
10
15
20
25
30
35
40
45
5
(18%, 89%)
Figure 7: Comparative Inward Foreign Direct Investment
Note: German inflows in this period are biased upward by the acquisition of Mannesman in 2000Source: World Investment Report (2002)
16
Overall Performance of the UK Economy
UK COMPETITIVENESS: MOVING TO THE NEXT STAGE
The quality of UK patents measured by citations compares well with other Europeancountries, but is still only average in a global perspective.27 Other sources on companyinnovation often use less robust data,28 but tend to put the UK near the average of theadvanced economies. UK manufacturing companies are reported to spend less of theirturnover on innovation than their European peers, while the opposite is true for UKservice companies.
Overall, the UK has a strong science base, but lags in patenting and commercialisation.29
Also, the UK’s strength in the life sciences masks lower performance in other areas ofscience and technology. Current levels of UK innovation are insufficient to drive UKproductivity growth and close the UK productivity gap versus key competitors.
Compound annual growth rate of US-registered patents, 1990 - 2001
0% 10% 20% 30% 40%
An
nu
al
U.S
. p
ate
nts
pe
r 1
mil
lio
n p
op
ula
tio
n,
20
01
= 10,000patentsgranted in2001
0
50
100
150
200
250
300
350
400
Singapore
United States
Japan
SwitzerlandSweden
GermanyFinland
NL
UKFrance
Italy Australia New Zealand
Norway
DenmarkCanada
Israel
Taiwan
South Korea
Figure 8: International Patenting Output
Source: US Patent and Trademark Office (2002), author’s analysis
17
Overall Performance of the UK Economy
UK COMPETITIVENESS: MOVING TO THE NEXT STAGE
References
3 Porter (2002a)
4 For other discussions of recentUK economic performance seeNickell (2002), Nickell/VanReenen (2002), andCard/Freeman (2002). For amore long-term perspective seeMaddison (2001).
5 IMF (2003)
6 OECD (2002), Nickell (2002a)
7 For example IMF (2003) andEuropean Commission (2002).
8 Card/Freeman (2002), OECD(2002a), IMF (2003)
9 The same is true for reducingworking time and thusincreasing the intensity of workin the remaining hours.
10 Bureau of Labour Statistics(2002), IMF (2003)
11 O’Mahoney/deBoer (2002)
12 Recent work by the IMF (2003)relates this gap in overall capitalintensity to lower investmentsin non-residential construction.UK investments in machinery,however, are comparable toother OECD countries.
13 IMF (2003)
14 Oughton (1997)
15 The IMF (2003) reportssomewhat different gaps for theaverage of the 1996 - 2000period with the UK lagging theUnited States by 33%, Franceby 25%, and Germany by 12%.
16 US Bureau of Labour Statistics(2002)
17 IMF (2003)
18 DTI (2002)
19 WTO (2002)
20 IMF (2002)
21 Given this logic, it should be nosurprise that multinationalcompanies are everywheremore productive than their localcompetitiors. See, for example,Ashworth (2001),Griffith/Simpson (2000).
22 Pain (2000)
23 OECD (2001)
24 UNCTAD (2002)
25 UNCTAD (2002)
26 European Commission (2001)
27 National Science Foundation(2000) cited in Porter/Van Opstel(2001)
28 Nickell/Van Reenen (2002)discuss the quality of theEuropean Innovation Survey
29 Nickell/Van Reenen (2002)
18 UK COMPETITIVENESS: MOVING TO THE NEXT STAGE
3
Competitiveness and theUK Business Environment:Summary of the Evidence
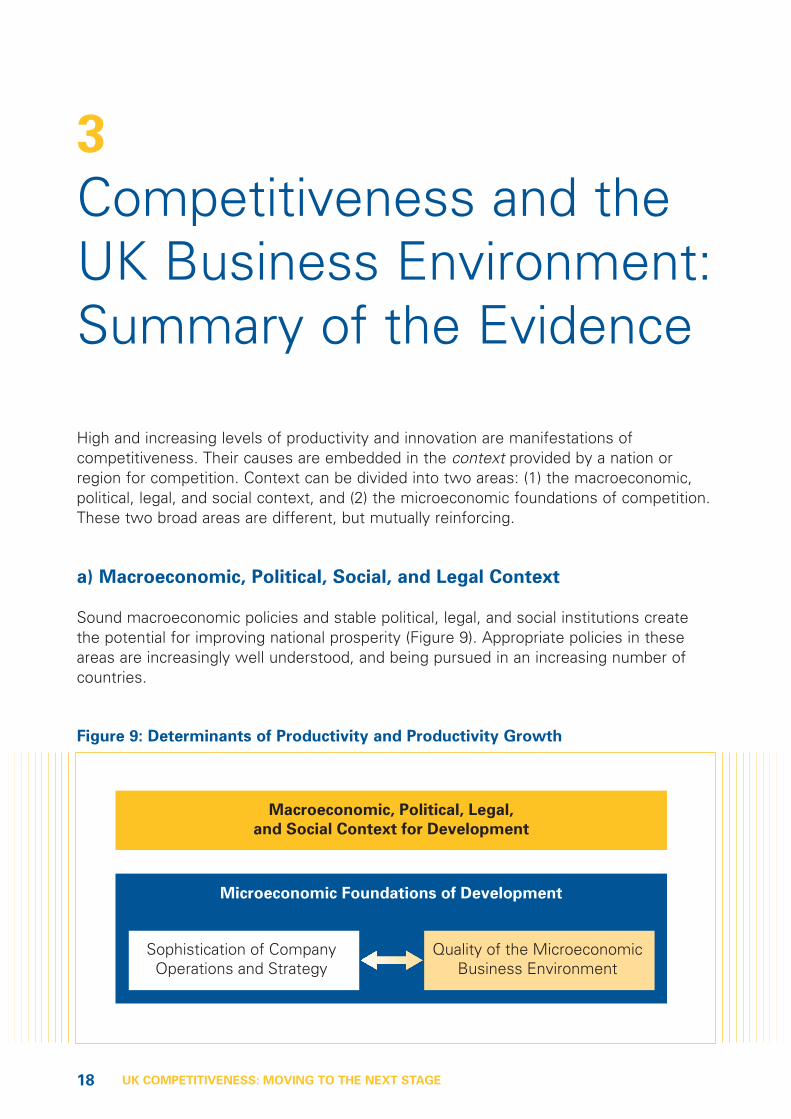
High and increasing levels of productivity and innovation are manifestations ofcompetitiveness. Their causes are embedded in the context provided by a nation orregion for competition. Context can be divided into two areas: (1) the macroeconomic,political, legal, and social context, and (2) the microeconomic foundations of competition.These two broad areas are different, but mutually reinforcing.
a) Macroeconomic, Political, Social, and Legal Context
Sound macroeconomic policies and stable political, legal, and social institutions createthe potential for improving national prosperity (Figure 9). Appropriate policies in theseareas are increasingly well understood, and being pursued in an increasing number ofcountries.
Macroeconomic, Political, Legal,
and Social Context for Development
Microeconomic Foundations of Development
Sophistication of CompanyOperations and Strategy
Quality of the MicroeconomicBusiness Environment
Figure 9: Determinants of Productivity and Productivity Growth
19UK COMPETITIVENESS: MOVING TO THE NEXT STAGE
However, competitiveness ultimately depends on firms and the way they compete.Hence, a sound macroeconomic, political, legal, and social context is necessary forachieving competitiveness, but not sufficient.30
The UK’s political and legal system is stable and not a barrier to economic development.The UK has in recent years achieved a higher level of macroeconomic stability than inany other period after 1945. Before 1980, deteriorating public finances, a high level ofinflation, and an erosion of the value of the pound hampered the economy. In the earlyphase of the post-1980 reforms the focus was on reducing the size of government andstabilising public finances. Monetary policy, however, remained volatile and growtherratic. In the last decade, however, fiscal and monetary policy have become much morestable, especially after the independence of the Bank of England. There remainsuncertainty about Economic Monetary Union (EMU) membership, but this uncertainty isin itself unlikely to be an important factor affecting the UK’s competitiveness.
Progress on social issues has been more mixed, and the UK still faces significanteconomic disparities across regions and population groups. So far, poverty has beenseen as more a social than an economic problem, but the demographic shift could in thefuture increase the economic costs of these social problems.
b) Microeconomic Business Environment
Wealth is actually created at the microeconomic level – in the ability of firms to createvaluable goods and services using efficient methods. Only in this way can a nationsupport high wages and the attractive returns to capital necessary to support sustainedinvestment. The microeconomic foundations of productivity rest on two interrelatedareas: the sophistication with which domestic companies or foreign subsidiariesoperating in the country compete, and the quality of the microeconomic businessenvironment.
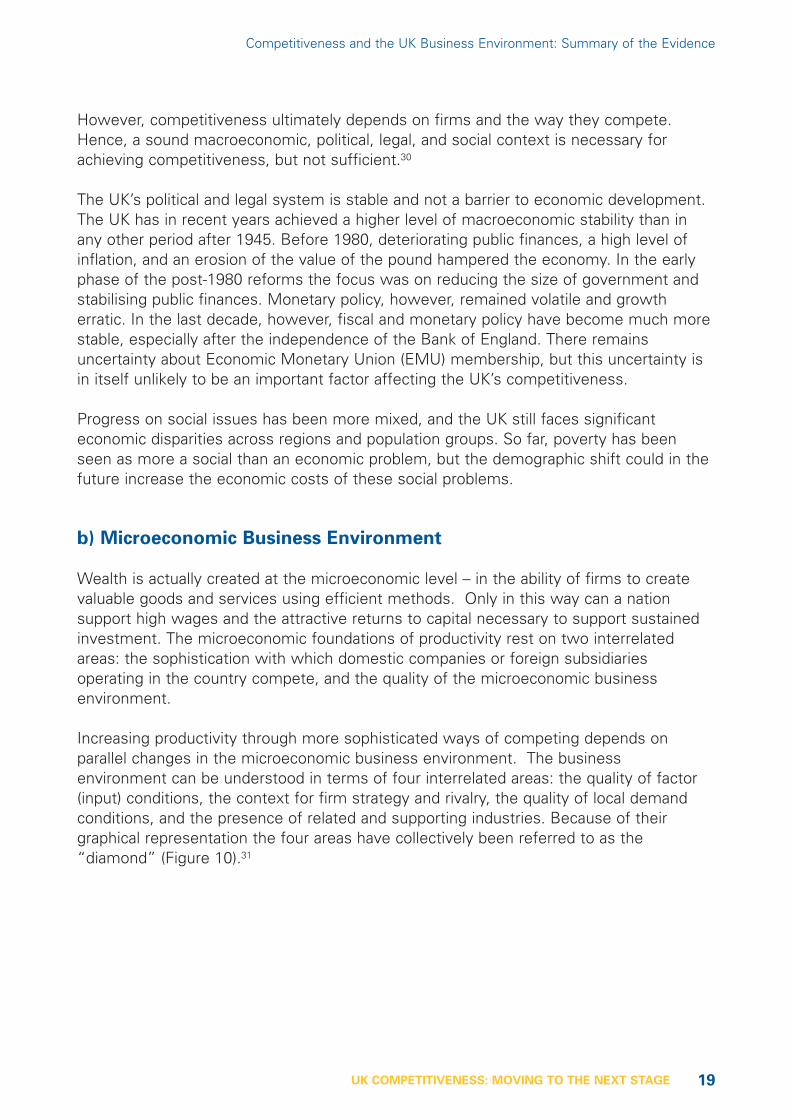
Increasing productivity through more sophisticated ways of competing depends onparallel changes in the microeconomic business environment. The businessenvironment can be understood in terms of four interrelated areas: the quality of factor(input) conditions, the context for firm strategy and rivalry, the quality of local demandconditions, and the presence of related and supporting industries. Because of theirgraphical representation the four areas have collectively been referred to as the“diamond” (Figure 10).31
Competitiveness and the UK Business Environment: Summary of the Evidence
20 UK COMPETITIVENESS: MOVING TO THE NEXT STAGE
The UK business environment has been fundamentally upgraded in the last twodecades.32 This has been the result of significant changes in policy starting in the late1970’s,33 which have made the UK a much more attractive place to do business and haveenabled companies located there to achieve much higher levels of productivity.
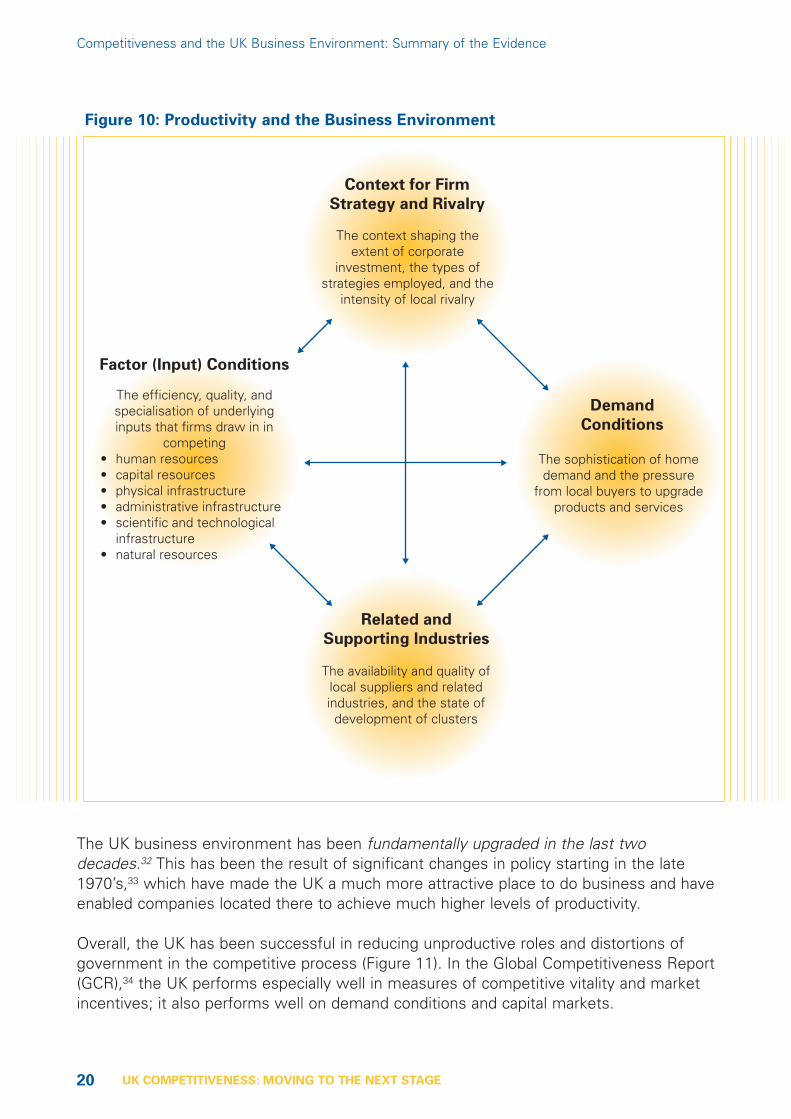
Overall, the UK has been successful in reducing unproductive roles and distortions ofgovernment in the competitive process (Figure 11). In the Global Competitiveness Report(GCR),34 the UK performs especially well in measures of competitive vitality and marketincentives; it also performs well on demand conditions and capital markets.
Competitiveness and the UK Business Environment: Summary of the Evidence
Context for Firm
Strategy and Rivalry
The context shaping the extent of corporate
investment, the types of strategies employed, and the
intensity of local rivalry
Factor (Input) Conditions
The efficiency, quality, and specialisation of underlying inputs that firms draw in in
competing• human resources• capital resources• physical infrastructure• administrative infrastructure• scientific and technological
infrastructure• natural resources
Related and
Supporting Industries
The availability and quality of local suppliers and related industries, and the state of development of clusters
Demand
Conditions
The sophistication of home demand and the pressure
from local buyers to upgrade products and services
Figure 10: Productivity and the Business Environment
21UK COMPETITIVENESS: MOVING TO THE NEXT STAGE
The UK has been less successful in areas that require long-term investments in assets orinstitutions by the public or private sector.35 Its most significant weaknesses according tothe GCR are in physical infrastructure and human resources.
i) Factor (Input) Conditions
Infrastructure
Physical infrastructure emerges, according to 2002 Global Competitiveness Report (GCR)Survey data, as the UK’s most important weakness. The quality of railways ranksparticularly low, but the port infrastructure and even the telecommunication infrastructureregister as relative disadvantages. In all three areas the UK’s ranking has dropped by 5 ormore places relative to other countries throughout the last five years.36 Theseweaknesses reflect the lower rate of public investment in the UK compared to otheradvanced economies over the last two decades. They may also be affected by the post-privatisation regulatory framework in which, for example, railroad companies haveoperated. UK public investment relative to GDP has been roughly 50% below the UnitedStates, France, and Germany, although the gap with Germany has decreased in the lastdecade.37
Skills
Labour force skills continue to be an area of competitive disadvantage for the UK,although the picture is mixed. In terms of education, in the GCR the UK receives lowmarks on the quality of its schools and specifically on the quality of its maths and
Competitiveness and the UK Business Environment: Summary of the Evidence
Competitive Advantages
• Highly open to international trade and investment
• Very low regulatory barriers to competition at the national level
• Sophisticated capital markets, especially equity markets
Competitive Disadvantages
• Weak and deteriorating physical
infrastructure
• Skill deficits in the labour force despite favourable international rankings on educational achievement
• Constrained access to debt capital• Low levels of R&D investment and
commercialisation infrastructure despite strong science base
• Large regional differences in the quality of the business environment
• Limited presence / effectiveness of Institutions For Collaboration
Figure 11: The UK Business Environment - Overview

22 UK COMPETITIVENESS: MOVING TO THE NEXT STAGE
science education. This is consistent with the comparatively low spending on educationin the UK; on a per student basis the UK ranks 15th among all OECD countries on thismeasure. However, UK students have performed well in the recent PISA study oneducational performance across countries where the UK ranks between 4 and 6 ondifferent educational areas.38
In terms of general labour force skills, the UK still falls behind competing economies,especially because of a high share of the population with low levels of educationalattainment.39 UK companies report significant skill shortages that are consistent withthese deficits.40
In terms of advanced skills, the UK ranks well in the GCR on management education, anarea in which the country attracts many foreign students. The UK receives low GCRmarks on the availability of scientists and engineers. The UK has, however, registered ahigher increase in the number of researchers per employees in the workforce than mostother advanced economies, although it still is at a low level.41
Financial markets
The City of London is one of the most competitive financial services clusters in theworld. The UK ranks 1 in the GCR on the sophistication of its financial markets. Its equitymarkets in particular are rated highly, although there is anecdotal evidence of companiesgoing private to avoid the markets short-term scrutiny.42 Venture capital availability is thehighest in Europe behind the Netherlands,43 although some observers are concernedabout the relatively greater focus on later stage investments. While equity financing iscompetitive, it tends to be more expensive than debt financing. There are signs that theenvironment for debt financing is not as competitive: Investments of UK companiesreact more strongly to cash-flow changes, indicating constrained access to externalfinancing.44 This would be particularly harmful to the growth prospects of small andmedium sized companies.
Science & Technology
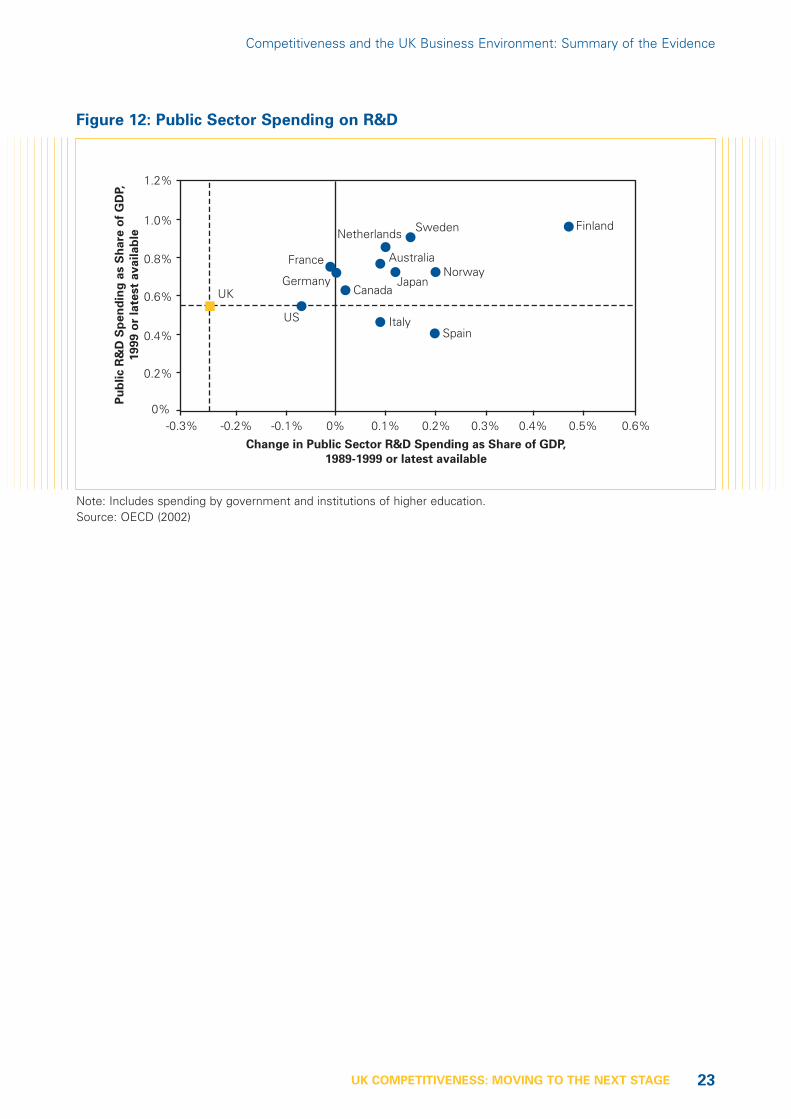
The UK has in the recent past invested less public sector money into R&D than mostother advanced economies. And over the last decade, the UK’s position on public R&Dspending relative to GDP has worsened (Figure 12).45 Recent policy changes have startedto address this, and the government budgets for the next few years register a significantramping up of public sector R&D spending. It will take a while, however, until theaccumulated effect of years of under investment in, for example, the universityinfrastructure, will have been overcome.46
Competitiveness and the UK Business Environment: Summary of the Evidence
23UK COMPETITIVENESS: MOVING TO THE NEXT STAGE
Competitiveness and the UK Business Environment: Summary of the Evidence
Pu
bli
c R
&D
Sp
en
din
g a
s S
ha
re o
f G
DP,
19
99
or
late
st
av
ail
ab
le
Finland
Norway
Sweden
SpainItaly
Canada
Netherlands
Australia
Japan
France
Germany
US
UK
Change in Public Sector R&D Spending as Share of GDP,
1989-1999 or latest available
-0.3% -0.2% -0.1% 0% 0.1% 0.2% 0.3% 0.4% 0.5% 0.6%0%
1.2%
1.0%
0.8%
0.6%
0.4%
0.2%
Figure 12: Public Sector Spending on R&D
Note: Includes spending by government and institutions of higher education.Source: OECD (2002)
24 UK COMPETITIVENESS: MOVING TO THE NEXT STAGE
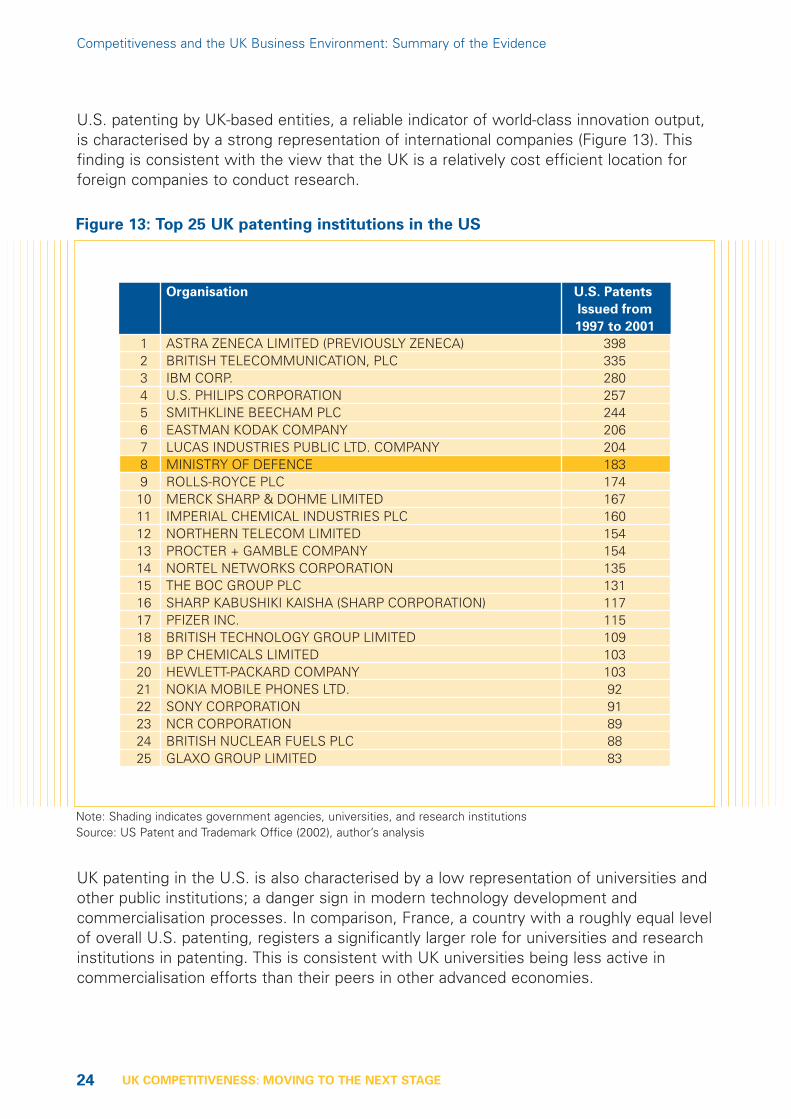
U.S. patenting by UK-based entities, a reliable indicator of world-class innovation output,is characterised by a strong representation of international companies (Figure 13). Thisfinding is consistent with the view that the UK is a relatively cost efficient location forforeign companies to conduct research.
UK patenting in the U.S. is also characterised by a low representation of universities andother public institutions; a danger sign in modern technology development andcommercialisation processes. In comparison, France, a country with a roughly equal levelof overall U.S. patenting, registers a significantly larger role for universities and researchinstitutions in patenting. This is consistent with UK universities being less active incommercialisation efforts than their peers in other advanced economies.
Competitiveness and the UK Business Environment: Summary of the Evidence
Organisation U.S. Patents
Issued from
1997 to 2001
1 ASTRA ZENECA LIMITED (PREVIOUSLY ZENECA) 3982 BRITISH TELECOMMUNICATION, PLC 3353 IBM CORP. 2804 U.S. PHILIPS CORPORATION 2575 SMITHKLINE BEECHAM PLC 2446 EASTMAN KODAK COMPANY 2067 LUCAS INDUSTRIES PUBLIC LTD. COMPANY 2048 MINISTRY OF DEFENCE 1839 ROLLS-ROYCE PLC 17410 MERCK SHARP & DOHME LIMITED 16711 IMPERIAL CHEMICAL INDUSTRIES PLC 16012 NORTHERN TELECOM LIMITED 15413 PROCTER + GAMBLE COMPANY 15414 NORTEL NETWORKS CORPORATION 13515 THE BOC GROUP PLC 13116 SHARP KABUSHIKI KAISHA (SHARP CORPORATION) 11717 PFIZER INC. 11518 BRITISH TECHNOLOGY GROUP LIMITED 10919 BP CHEMICALS LIMITED 10320 HEWLETT-PACKARD COMPANY 10321 NOKIA MOBILE PHONES LTD. 9222 SONY CORPORATION 9123 NCR CORPORATION 8924 BRITISH NUCLEAR FUELS PLC 8825 GLAXO GROUP LIMITED 83
Figure 13: Top 25 UK patenting institutions in the US
Note: Shading indicates government agencies, universities, and research institutionsSource: US Patent and Trademark Office (2002), author’s analysis
25UK COMPETITIVENESS: MOVING TO THE NEXT STAGE
ii) Context for Firm Strategy and Rivalry47
Market openness
The UK traditionally is an open economy with low barriers to foreign trade andinvestment, especially towards neighbouring European countries. As a member of theEuropean Union, it falls under the general rules of the common market and the commontrade policy.48 According to the GCR, the UK has an overall low level of tariffs but someremaining non-tariff barriers to trade.
Domestically, the reforms of the last two decades have left the UK with very lowadministrative costs for new business formation relative to other countries. However,while the rate of new business formation is high, UK start-ups have a significantly lowerlikelihood to survive the initial years than their peers in other European countries and theUnited States.49
Government regulations
The UK has the lowest level of product and labour market regulations in the OECD. Thelevel of distortive government subsidies in the UK is low, and the subsidies paid tend tobe horizontal rather than industry specific.50 While the UK outperforms many otherEuropean countries on the level of distortive government subsidies, it ranks only 12 inthe global comparison of the GCR. Specific local regulations, such as zoning laws, arealso mentioned as barriers to more investment and productivity.51 There is also someconcern in the business community about an increasing level of European Union-drivenregulation that the UK will be subject to.
Incentives
The UK has a generally competitive system of business taxation with incentives for R&Dinvestments and investments in economically distressed areas. The overall level oftaxation is slightly lower than in many other advanced economies; this relative advantageof the UK has, however, decreased in recent years.52 According to the GCR survey data,the UK has very strong intellectual property rights protection, providing a goodenvironment for innovation and technology transfer.
Competition
Relatively low levels of competitive intensity in some parts of the UK economy arerepeatedly mentioned in the literature. The examples often tend to be in the non-tradedsector of the economy. Reasons mentioned include the effects of past privatisation thatare argued to have been driven too heavily by fiscal considerations. The competitionpolicy in the UK was historically perceived to be more lenient than in other OECDcountries.53 Recent policy changes have markedly improved the policy context but willtake considerable time to be fully reflected in companies competitive behaviour.54
Competitiveness and the UK Business Environment: Summary of the Evidence
26 UK COMPETITIVENESS: MOVING TO THE NEXT STAGE
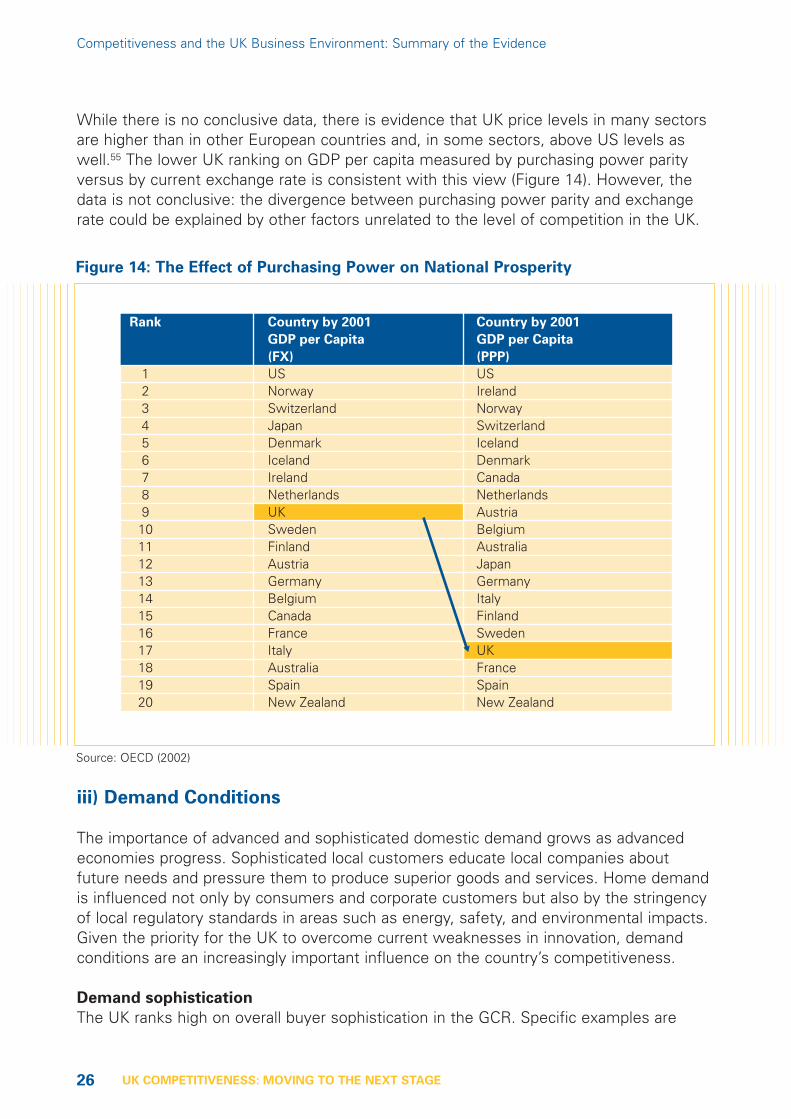
While there is no conclusive data, there is evidence that UK price levels in many sectorsare higher than in other European countries and, in some sectors, above US levels aswell.55 The lower UK ranking on GDP per capita measured by purchasing power parityversus by current exchange rate is consistent with this view (Figure 14). However, thedata is not conclusive: the divergence between purchasing power parity and exchangerate could be explained by other factors unrelated to the level of competition in the UK.
iii) Demand Conditions
The importance of advanced and sophisticated domestic demand grows as advancedeconomies progress. Sophisticated local customers educate local companies aboutfuture needs and pressure them to produce superior goods and services. Home demandis influenced not only by consumers and corporate customers but also by the stringencyof local regulatory standards in areas such as energy, safety, and environmental impacts.Given the priority for the UK to overcome current weaknesses in innovation, demandconditions are an increasingly important influence on the country’s competitiveness.
Demand sophistication
The UK ranks high on overall buyer sophistication in the GCR. Specific examples are
Competitiveness and the UK Business Environment: Summary of the Evidence
Rank Country by 2001 Country by 2001
GDP per Capita GDP per Capita
(FX) (PPP)
1 US US2 Norway Ireland3 Switzerland Norway4 Japan Switzerland5 Denmark Iceland6 Iceland Denmark7 Ireland Canada8 Netherlands Netherlands9 UK Austria10 Sweden Belgium11 Finland Australia12 Austria Japan13 Germany Germany14 Belgium Italy15 Canada Finland16 France Sweden17 Italy UK18 Australia France19 Spain Spain20 New Zealand New Zealand
Figure 14: The Effect of Purchasing Power on National Prosperity
Source: OECD (2002)
27UK COMPETITIVENESS: MOVING TO THE NEXT STAGE
related to individual clusters such as oil & gas, financial services, media, and others, butthere is little hard data available.
Standards and regulations
The regulatory context in the UK provides average incentives for companies to addresssophisticated consumer needs. On environmental regulations, for example, the UKperforms less well than Scandinavia, Germany, or France, but still outperforms theaverage of the advanced economies.56
Government procurement
The UK ranks low on the sophistication of government procurement in the GCR. There islittle other hard data available on this subject.
c) Clusters
Clusters constitute one facet of the diamond, but they are best seen as a manifestationof the interaction of all the diamond’s elements.57 Clusters are geographically proximategroups of interconnected companies, suppliers, service providers, and associatedinstitutions in a particular field, linked by commonalities and complementarities. Clusterssuch as IT in Silicon Valley or high performance cars in Southern Germany can beconcentrated in a particular region within a larger nation, and sometimes in a singletown. Other clusters are national and sometimes stretch across borders into adjacentcountries, such as Southern Germany and German-speaking Switzerland. Proximity mustbe sufficient to allow efficient interaction and flow of goods, services, ideas, and skillsacross the cluster.
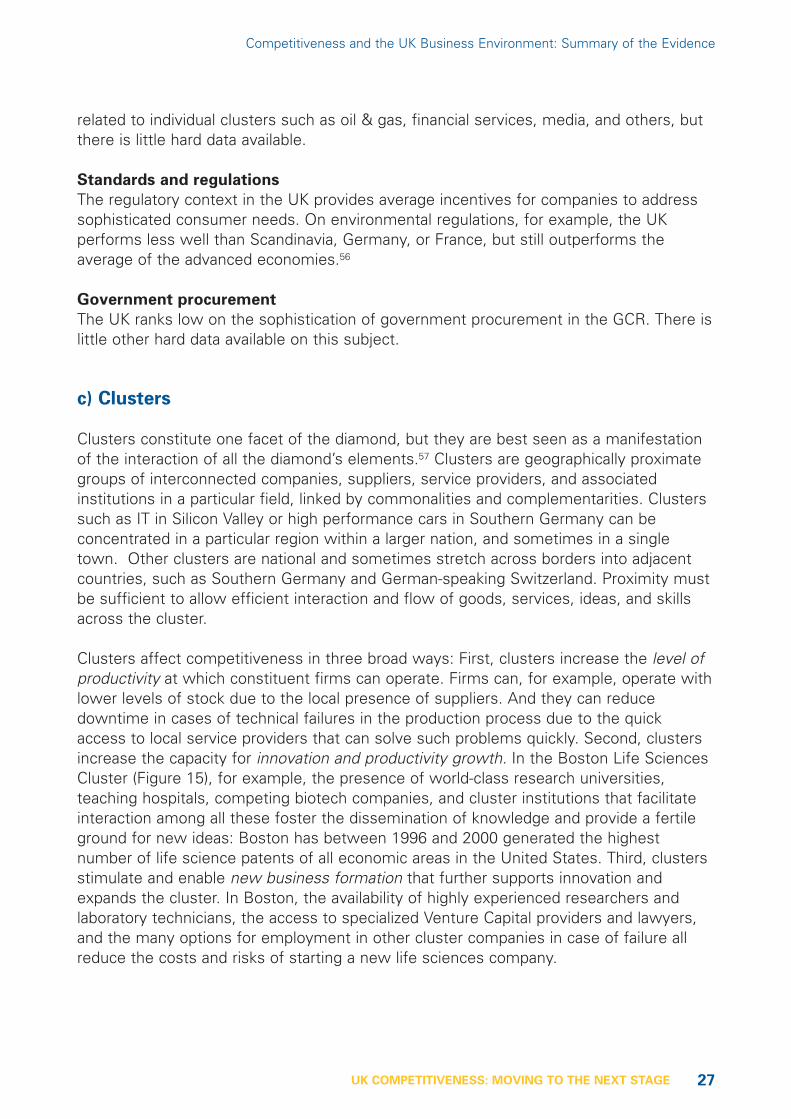
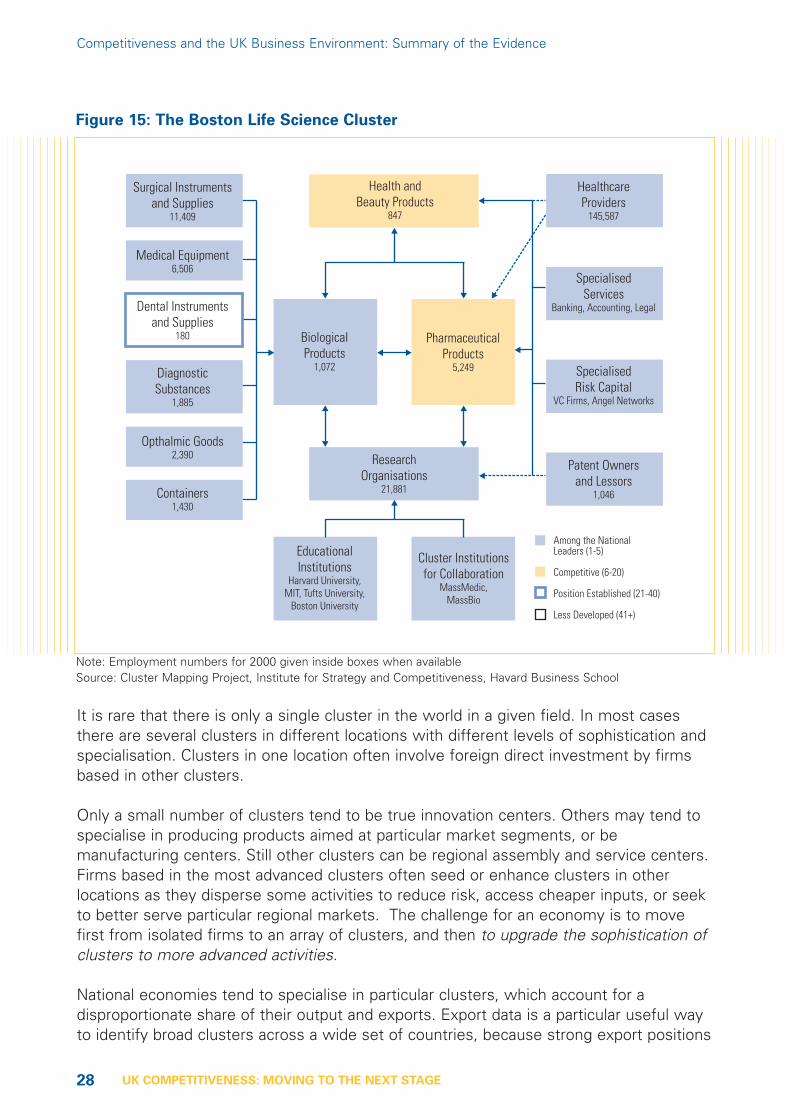
Clusters affect competitiveness in three broad ways: First, clusters increase the level ofproductivity at which constituent firms can operate. Firms can, for example, operate withlower levels of stock due to the local presence of suppliers. And they can reducedowntime in cases of technical failures in the production process due to the quickaccess to local service providers that can solve such problems quickly. Second, clustersincrease the capacity for innovation and productivity growth. In the Boston Life SciencesCluster (Figure 15), for example, the presence of world-class research universities,teaching hospitals, competing biotech companies, and cluster institutions that facilitateinteraction among all these foster the dissemination of knowledge and provide a fertileground for new ideas: Boston has between 1996 and 2000 generated the highestnumber of life science patents of all economic areas in the United States. Third, clustersstimulate and enable new business formation that further supports innovation andexpands the cluster. In Boston, the availability of highly experienced researchers andlaboratory technicians, the access to specialized Venture Capital providers and lawyers,and the many options for employment in other cluster companies in case of failure allreduce the costs and risks of starting a new life sciences company.
Competitiveness and the UK Business Environment: Summary of the Evidence
28 UK COMPETITIVENESS: MOVING TO THE NEXT STAGE
It is rare that there is only a single cluster in the world in a given field. In most casesthere are several clusters in different locations with different levels of sophistication andspecialisation. Clusters in one location often involve foreign direct investment by firmsbased in other clusters.
Only a small number of clusters tend to be true innovation centers. Others may tend tospecialise in producing products aimed at particular market segments, or bemanufacturing centers. Still other clusters can be regional assembly and service centers.Firms based in the most advanced clusters often seed or enhance clusters in otherlocations as they disperse some activities to reduce risk, access cheaper inputs, or seekto better serve particular regional markets. The challenge for an economy is to movefirst from isolated firms to an array of clusters, and then to upgrade the sophistication ofclusters to more advanced activities.
National economies tend to specialise in particular clusters, which account for adisproportionate share of their output and exports. Export data is a particular useful wayto identify broad clusters across a wide set of countries, because strong export positions
Competitiveness and the UK Business Environment: Summary of the Evidence
ResearchOrganisations
21,881
Among the NationalLeaders (1-5)
Competitive (6-20)
Position Established (21-40)
Less Developed (41+)
HealthcareProviders
145,587
SpecialisedServices
Banking, Accounting, Legal
SpecialisedRisk Capital
VC Firms, Angel Networks
Patent Ownersand Lessors
1,046
Health andBeauty Products
847
BiologicalProducts
1,072
PharmaceuticalProducts
5,249
EducationalInstitutions
Harvard University,MIT, Tufts University,
Boston University
Cluster Institutionsfor Collaboration
MassMedic,MassBio
Opthalmic Goods2,390
Containers1,430
Dental Instrumentsand Supplies
180
Medical Equipment6,506
Surgical Instrumentsand Supplies
11,409
DiagnosticSubstances
1,885
Figure 15: The Boston Life Science Cluster
Note: Employment numbers for 2000 given inside boxes when availableSource: Cluster Mapping Project, Institute for Strategy and Competitiveness, Havard Business School
29UK COMPETITIVENESS: MOVING TO THE NEXT STAGE
in specific clusters indicate a base of internationally competitive companies orsubsidiaries in these areas.
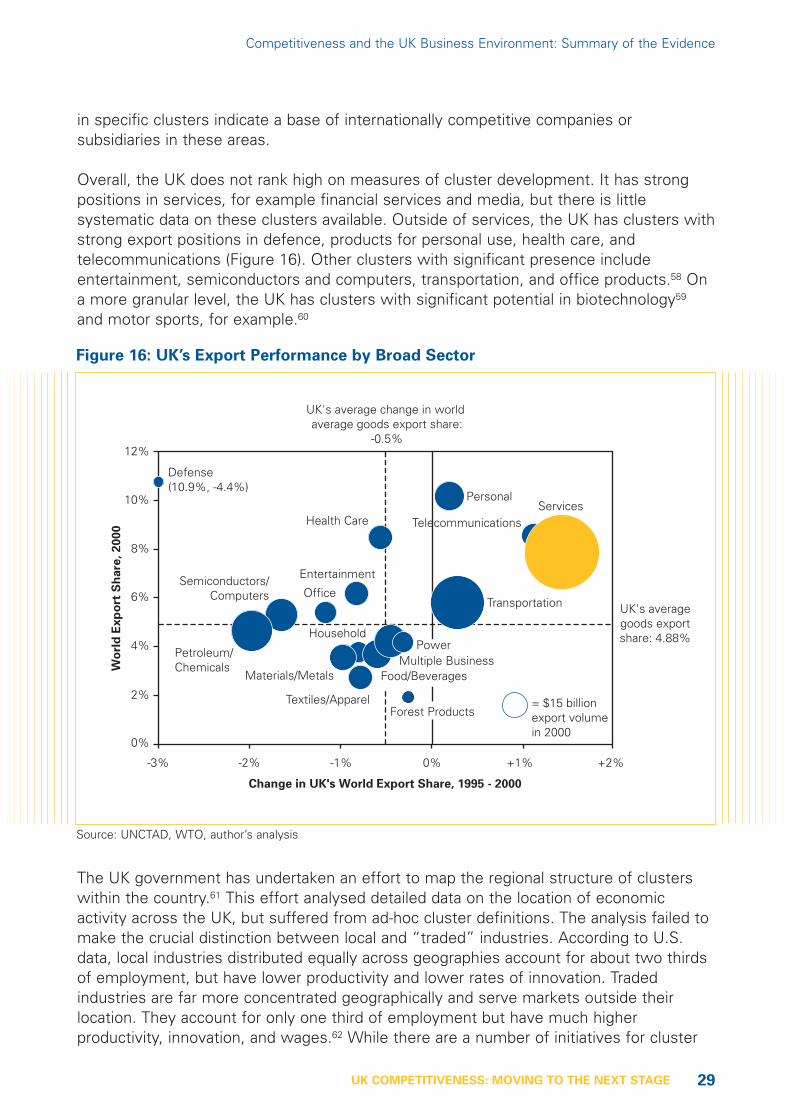
Overall, the UK does not rank high on measures of cluster development. It has strongpositions in services, for example financial services and media, but there is littlesystematic data on these clusters available. Outside of services, the UK has clusters withstrong export positions in defence, products for personal use, health care, andtelecommunications (Figure 16). Other clusters with significant presence includeentertainment, semiconductors and computers, transportation, and office products.58 Ona more granular level, the UK has clusters with significant potential in biotechnology59
and motor sports, for example.60
The UK government has undertaken an effort to map the regional structure of clusterswithin the country.61 This effort analysed detailed data on the location of economicactivity across the UK, but suffered from ad-hoc cluster definitions. The analysis failed tomake the crucial distinction between local and “traded” industries. According to U.S.data, local industries distributed equally across geographies account for about two thirdsof employment, but have lower productivity and lower rates of innovation. Tradedindustries are far more concentrated geographically and serve markets outside theirlocation. They account for only one third of employment but have much higherproductivity, innovation, and wages.62 While there are a number of initiatives for cluster
Competitiveness and the UK Business Environment: Summary of the Evidence
Change in UK's World Export Share, 1995 - 2000
-3% -2% -1% 0% +1% +2%
Wo
rld
Ex
po
rt S
ha
re,
20
00
UK's average change in world average goods export share:
-0.5%
UK's averagegoods exportshare: 4.88%
= $15 billionexport volumein 2000
0%
2%
4%
6%
8%
10%
12%
Defense(10.9%, -4.4%)
Health CareServices
Personal
Office
Entertainment
Household
Materials/Metals
Textiles/ApparelForest Products
Food/BeveragesMultiple Business
Power
Transportation
Telecommunications
Petroleum/Chemicals
Semiconductors/Computers
Figure 16: UK’s Export Performance by Broad Sector
Source: UNCTAD, WTO, author’s analysis
30 UK COMPETITIVENESS: MOVING TO THE NEXT STAGE
activation throughout the UK, often initiated by the Regional Development Agencies(RDA’s), the data provided by the existing cluster mapping effort seems to have had onlylimited practical value.
d) Roles, Institutions, and Processes
Competitiveness increasingly relies on a country’s appropriate structure of roles,institutions and processes to enable, organise, and drive efforts to improve businessenvironments and clusters. In the past, government, often at the national level, was incharge of improving competitiveness through policy decisions and incentives. Firmscompeted in the marketplace and took their environment as given. In moderncompetition, however, improving competitiveness becomes a collaborative processinvolving multiple levels of government, companies, educational institutions, andinstitutions for collaboration (IFC). At the microeconomic level a large number of factorsimpact on competitiveness and hence only a broad coalition can hope to improve anation’s foundations of competitiveness.
Government continues to play an important role because it affects many aspects of thebusiness environment. Government shapes factor conditions, for example, through itstraining and infrastructure policies and similar policy influences are present in allelements of the diamond. There are distinct roles for government in improving thebusiness environment at the national, state, and local level as well as amongneighbouring countries. Government at all levels also has a central role in convening andsupporting competitiveness efforts, even though these efforts will tend to be led by theprivate sector or other institutions. Without government involvement, initiatives lacklegitimacy and they fail to address those competitiveness issues government policy candirectly affect.
Companies play an increasingly important role for the competitiveness of their locations.Competitive advantage resides not only within the firm, but is also shaped by theexternal context firms operate in. Individual companies can improve their externalcontext by individual actions such as establishing schools, attracting suppliers, or definingstandards that not only benefit themselves but also improve the overall environment forcompetition. Companies can also take collective steps to enhance the ability of individualcompanies to improve operating practices and strategies, such as quality certificationprograms and manufacturing assistance centers.
Universities and other educational and research institutions have also becomeincreasingly important factors for national and regional competitiveness. Traditionally,they have been important in improving the skill base of the economy. But a shift in theway research and development (R&D) is organised is now also strengthening their role incommercial R&D. In the past, universities did basic science, while companies workedseparately on applications for commercial use. Today, these boundaries have blurred, andsuccessful R&D often involves cooperation throughout the innovation process.
Competitiveness and the UK Business Environment: Summary of the Evidence

31UK COMPETITIVENESS: MOVING TO THE NEXT STAGE
A wide variety of other organisations also have a significant effect on competitiveness.These entities, which we refer to as institutions for collaboration (IFC’s)63, are neitherfirms, government entities, nor universities. They include, for example, chambers ofcommerce, industry associations, professional associations, trade unions, technologytransfer organisations, quality centers, think tanks, university alumni associations, andothers. IFC’s perform important roles as intermediaries that organise and performcollective action and enable more effective collaboration between parts of a cluster.
The Australian Wine cluster, a success story with a world export market share more thandoubling within the last five years,64 provides a vivid example of the key role suchinstitutions can play in improving competitiveness (Figure 17).
In the UK, there is anecdotal evidence that these critical institutions are less numerousand less effective than in competing locations.65 The government effort to create anetwork of industry forums, for example, is believed to have had some success in the
Competitiveness and the UK Business Environment: Summary of the Evidence
Winemakers’ Federation
of Australia
• Established in 1990• Focus: Public policy representation
of companies in the wine cluster• Funding: Member companies
Cooperative Centre
for Viticulture
• Established in 1991• Focus: Coordination of research
and education policy in viticulture• Funding: other cluster
organisations
Australian Wine
Export Council
• Established in 1992• Focus: Wine export promotion
through international offices in London and San Francisco
• Funding: Government; cluster organisations
Grape and Wine
R&D Corporation
• Established in 1991 as statutory body
• Focus: Funding of research and development activities
• Funding: Government; statutory levy
Wine Industry
Information Service
• Established in 1998• Focus: Information collection,
organisation, and dissemination• Funding: Cluster organisations
Wine Industry National
Education and Training Council
• Established in 1995• Focus: Coordination, integration,
and standard maintenance for vocational training and education
• Funding: Government; other cluster organisations
Figure 17: Institutions for Collaboration in the Australian Wine Cluster
Source: UNCTAD, WTO, author’s analysis
32 UK COMPETITIVENESS: MOVING TO THE NEXT STAGE
automotive cluster, but little impact elsewhere. However, there is no systematicevidence on these efforts.
e) Influences of Different Geographical Levels
In the past, analysis of competitiveness has focused on the nation and national-levelpolicies. Increasingly it is becoming clear that this perspective is too limited:competitiveness is affected by assets and policies at many different geographic levels.These range from cross-national, e.g. the Baltic Rim or the European Union, to national,to regional, to local. Indeed, the most significant spillovers and interactions take place atthe regional and local level. A clear indication of the importance of regional businessenvironments is the sharp performance difference across regions within given countries,even though they are all exposed to the same national level policies.
Across UK regions, as in many other countries, there are strong differences in regionaleconomic prosperity that are consistent with differences in the quality of regionalbusiness environments.66 In countries such as the United States there is convergence ofprosperity across regions. In the UK, there is divergence of regional prosperity.67 The richare getting richer and the poor are getting poorer. In France and Germany there is nosignificant relationship between regional prosperity and prosperity growth, or no changein dispersion of performance. While GDP per capita differences in UK regions appear tobe more persistent than in other European countries, unemployment rates in the UK aremore similar across regions.68 This is consistent with flexible labour markets in the UK.Labour mobility and wage flexibility are effective, and regional differences in incomereflect the quality of the regional business environments.
Strong regions and regional institutions - from mayors to elected regional and state leveladministrations with significant decision rights - have proven to be an increasinglyimportant factor for competitiveness in many other countries. Their importance has goneup, because there has been convergence on the policies controlled at the national level,such as macroeconomic policy, taxation, and overall government regulation. Theremaining differences in regional business environments affected by the decisions ofregional institutions have become more important. In the United States, for example,there is clear evidence that much of the relevant progress in improving themicroeconomic foundations of competitiveness occurs on the regional level.69
In the UK only about 25% of public sector expenditure is controlled by regional and localgovernments, below most other OECD countries including Germany (35%) and theUnited States (42%), but above France (18%).70 The UK’s centralised organisationalstructure for government has repercussions for competitiveness: Public spending isinevitably less well adapted to regional and local opportunities and needs. And privatesector leaders are less willing to engage in local and regional efforts, if importantdecisions affecting the quality of their business environment are made in the capital.
The Regional Development Agencies (RDA’s),71 established by order of the RegionalDevelopment Agencies Act of 1998, has created new institutions to address regional
Competitiveness and the UK Business Environment: Summary of the Evidence
33UK COMPETITIVENESS: MOVING TO THE NEXT STAGE
competitiveness in the UK. The RDA’s are an innovative approach to strengthen regionalpolicy in the UK, but it will take more time to evaluate if they can overcome the inherentchallenges they face in the given structure of UK government.72
Competitiveness and the UK Business Environment: Summary of the Evidence
References
30 Porter (2002)
31 Porter (1998)
32 For a good overview on policyinitiatives and outcomes see DTI(2002) and OECD (2002)
33 Beath (2002) argues instead thatthere has been remarkableconsistency in much of themicroeconomic policies.
34 Porter (2002a)
35 The pharmaceutical sector andits ability to draw on the UKscience base is a notableexamples.
36 Global Competitiveness Report(2002), unpublished data.
37 OECD (2002a), IMF (2003). It isunclear if the higher level ofprivatization in the UK isimportant in explaining thisdifference.
38 OECD (2000)
39 OECD (2002a)
40 Hogarth/Wilson (2001)
41 OECD (2001)
42 Nickell/Van Reenen (2002)
43 European Commission (2002)
44 Ashworth et al. (2001)
45 OECD (2001)
46 JM Consulting (2001)
47 For general information onrecent policy changes see HMTreasury (2001a)
48 The research reviewed did notdistinguish more betweenopenness to EU members in thecommon market and opennessto countries outside the EU.
49 Bartelsmann et al. (2003)
50 European Commission (2001)
51 McKinsey (1998)
52 Bond/Chennells (2000)
53 Nickell (2002)
54 OECD (2002a)
55 European Commission (2001)
56 Porter/Esty (2001)
57 Porter (1998), Porter (2000)
58 In appendix A we have includeda more detailed ranking ofsubclusters by exportperformance.
59 There is a significant literature onthe UK biotechnology cluster.See DTI (1999) for thegovernment perspective. Seealso European Commission(2001) and OECD (2002b)
60 “Motorsport Valley” inOxfordshire is claimed to be
home to more than 700motorsport-related companies.
61 DTI (2001)
62 Porter (2003), Porter/Council onCompetitiveness/Monitor Group(2001).
63 Porter/Emmons (2003)
64 Porter/Sölvell (2003)
65 See, for example, the discussionof the Business Link-scheme inOughton (1997)
66 HM Treasury (2001b)
67 See the results of a statisticalanalysis in appendix B
68 Soltwedel (1999) quoted in IMF(2000).
69 Porter/Council onCompetitiveness/Monitor Group(2001), Porter (2001d)
70 OECD (2002a)
71 For more information on theRDA’s see www.dti.gov.uk/rda.Other regional efforts have beenundertaken with EU support inthe Innovating Regions in Europe(IRE) network. This effort ispromising, but lacks a consistentintellectual framework.
72 Cockerill (2002)
34 UK COMPETITIVENESS: MOVING TO THE NEXT STAGE
4
Competitiveness andUK Company Behaviour:The Role of Management
The productivity of a country is ultimately set by the productivity of its companies, bothdomestic firms and the subsidiaries of foreign companies operating there. However, thesophistication of companies is inextricably intertwined with the quality of the nationalbusiness environment. More sophisticated company strategies require more highlyskilled people, better information, improved infrastructure, more capable suppliers, moreadvanced research institutions, and stronger competitive pressure, among other things.
Companies in a nation must upgrade their operating practices and strategies if successfuleconomic development is to occur. The competitive advantages of a nation’s companiesmust shift from comparative advantages (low-cost labour or natural resources) tocompetitive advantages arising from unique products and processes. Companies mustmove from tapping foreign distribution channels to building their own channels.
a) UK Company Performance
The UK is home to a significant number of large, internationally successful companies.Within Europe, the UK has an equal or higher number of companies in the Fortune 100relative to GDP than do Germany or France. Among multinational companies (MNC’s)with the largest foreign assets (classified as transnational companies by UNCTAD) theUK is home to 14 companies, behind only the United States and Japan and ahead ofGermany, France, Italy, and the Netherlands.73 In a dataset of 10,000 large companiesfrom Canada, Germany, Japan, the United States, and the United Kingdom, UKcompanies reported the highest return on equity in the 1997-2001 period.74
Productivity levels of UK multinationals are roughly in line with German and Frenchmultinationals, but lag US multinationals.75 Productivity of domestic UK companies islower than that of the MNC’s operating in that country, as in other countries. Thedifference in relative UK productivity across industries is consistent with theircompetitiveness as revealed in their export positions: strengths in services (retail,banking) and selected manufacturing (oil & gas, pharmaceuticals, food processing) and
35UK COMPETITIVENESS: MOVING TO THE NEXT STAGE
weaknesses in many other manufacturing industries.76 The hypothesis of a “long tail” ofunderperforming firms, i.e. the presence of a higher share of companies with very lowperformance in the UK relative to other countries, finds no support in current research.77
b) UK Company Operations and Strategy: Competitive Assessment
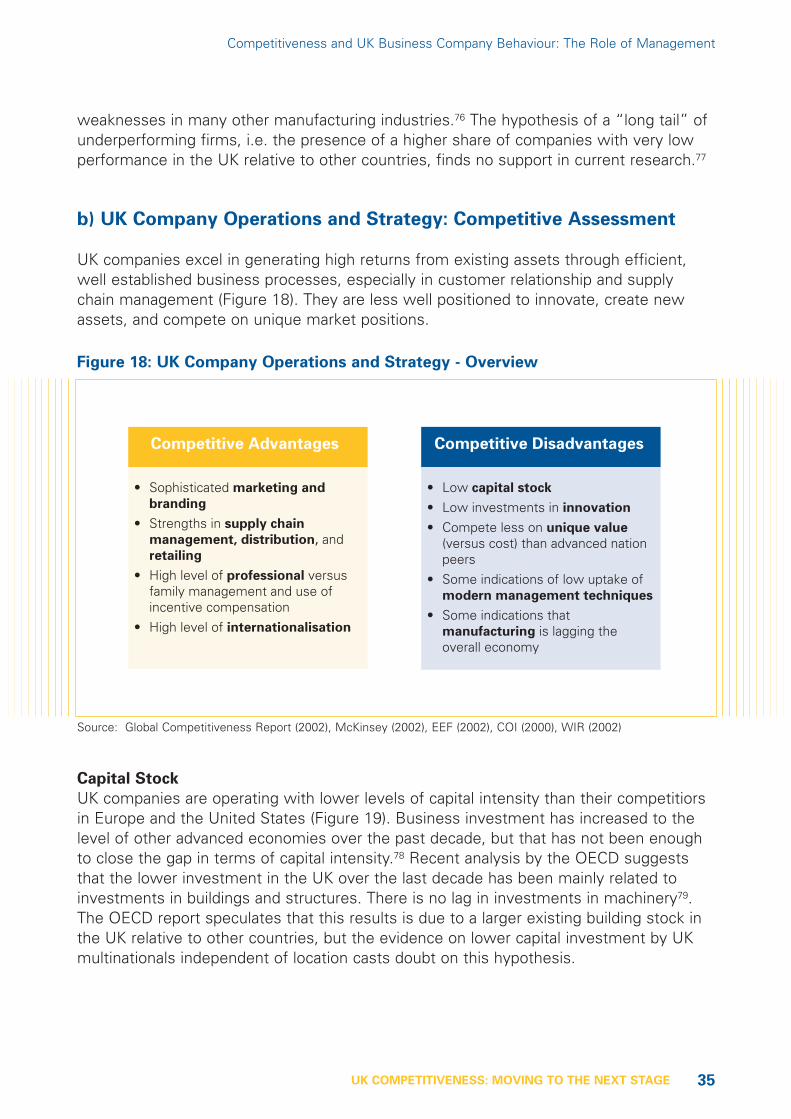
UK companies excel in generating high returns from existing assets through efficient,well established business processes, especially in customer relationship and supplychain management (Figure 18). They are less well positioned to innovate, create newassets, and compete on unique market positions.
Capital Stock
UK companies are operating with lower levels of capital intensity than their competitiorsin Europe and the United States (Figure 19). Business investment has increased to thelevel of other advanced economies over the past decade, but that has not been enoughto close the gap in terms of capital intensity.78 Recent analysis by the OECD suggeststhat the lower investment in the UK over the last decade has been mainly related toinvestments in buildings and structures. There is no lag in investments in machinery79.The OECD report speculates that this results is due to a larger existing building stock inthe UK relative to other countries, but the evidence on lower capital investment by UKmultinationals independent of location casts doubt on this hypothesis.
Competitiveness and UK Business Company Behaviour: The Role of Management
• Sophisticated marketing and
branding
• Strengths in supply chain
management, distribution, and retailing
• High level of professional versus family management and use of incentive compensation
• High level of internationalisation
Competitive DisadvantagesCompetitive Advantages
• Low capital stock
• Low investments in innovation
• Compete less on unique value (versus cost) than advanced nation peers
• Some indications of low uptake of modern management techniques
• Some indications that manufacturing is lagging the overall economy
Figure 18: UK Company Operations and Strategy - Overview
Source: Global Competitiveness Report (2002), McKinsey (2002), EEF (2002), COI (2000), WIR (2002)
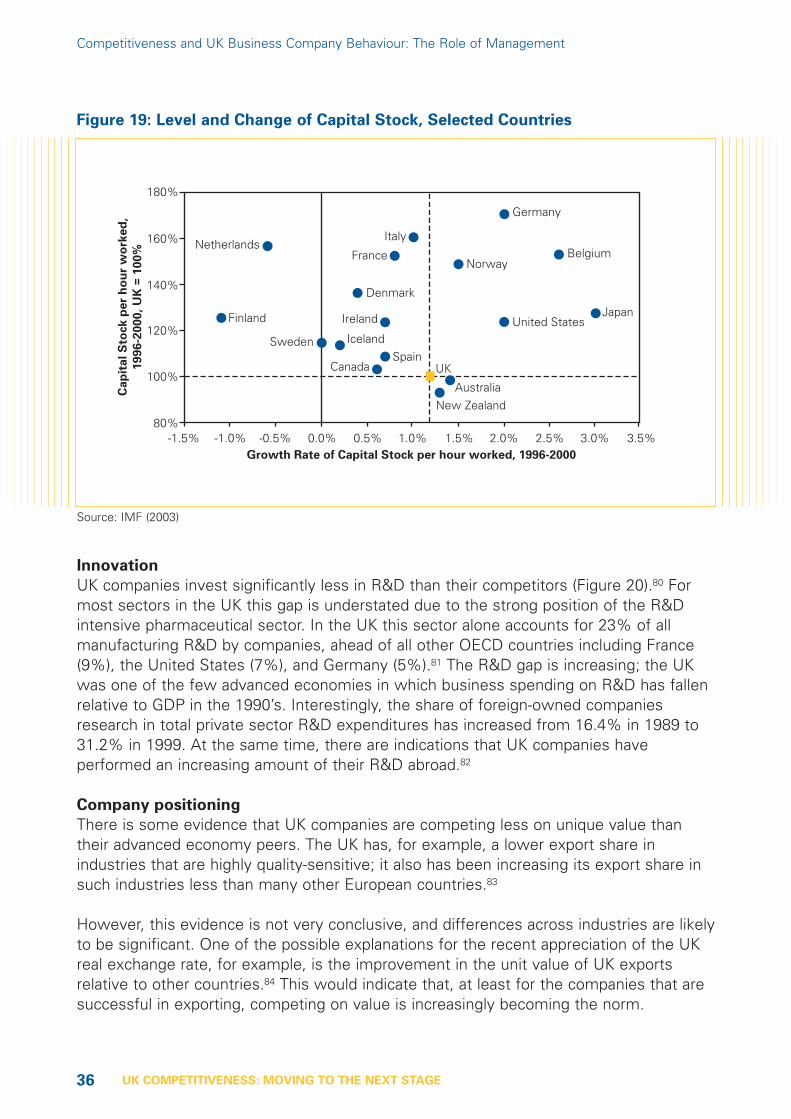
36 UK COMPETITIVENESS: MOVING TO THE NEXT STAGE
Innovation
UK companies invest significantly less in R&D than their competitors (Figure 20).80 Formost sectors in the UK this gap is understated due to the strong position of the R&Dintensive pharmaceutical sector. In the UK this sector alone accounts for 23% of allmanufacturing R&D by companies, ahead of all other OECD countries including France(9%), the United States (7%), and Germany (5%).81 The R&D gap is increasing; the UKwas one of the few advanced economies in which business spending on R&D has fallenrelative to GDP in the 1990’s. Interestingly, the share of foreign-owned companiesresearch in total private sector R&D expenditures has increased from 16.4% in 1989 to31.2% in 1999. At the same time, there are indications that UK companies haveperformed an increasing amount of their R&D abroad.82
Company positioning
There is some evidence that UK companies are competing less on unique value thantheir advanced economy peers. The UK has, for example, a lower export share inindustries that are highly quality-sensitive; it also has been increasing its export share insuch industries less than many other European countries.83
However, this evidence is not very conclusive, and differences across industries are likelyto be significant. One of the possible explanations for the recent appreciation of the UKreal exchange rate, for example, is the improvement in the unit value of UK exportsrelative to other countries.84 This would indicate that, at least for the companies that aresuccessful in exporting, competing on value is increasingly becoming the norm.
Competitiveness and UK Business Company Behaviour: The Role of Management
Ca
pit
al
Sto
ck
pe
r h
ou
r w
ork
ed
,
19
96
-20
00
, U
K =
10
0%
Japan
ItalyBelgium
Germany
Canada
France
Sweden
UK
Australia
United States
Netherlands
Norway
Iceland
New Zealand
Denmark
Finland
Spain
Ireland
Growth Rate of Capital Stock per hour worked, 1996-2000
1.0% 1.5% 2.0% 2.5% 3.0% 3.5%-1.0%-1.5% -0.5% 0.0% 0.5%80%
100%
120%
140%
160%
180%
Figure 19: Level and Change of Capital Stock, Selected Countries
Source: IMF (2003)
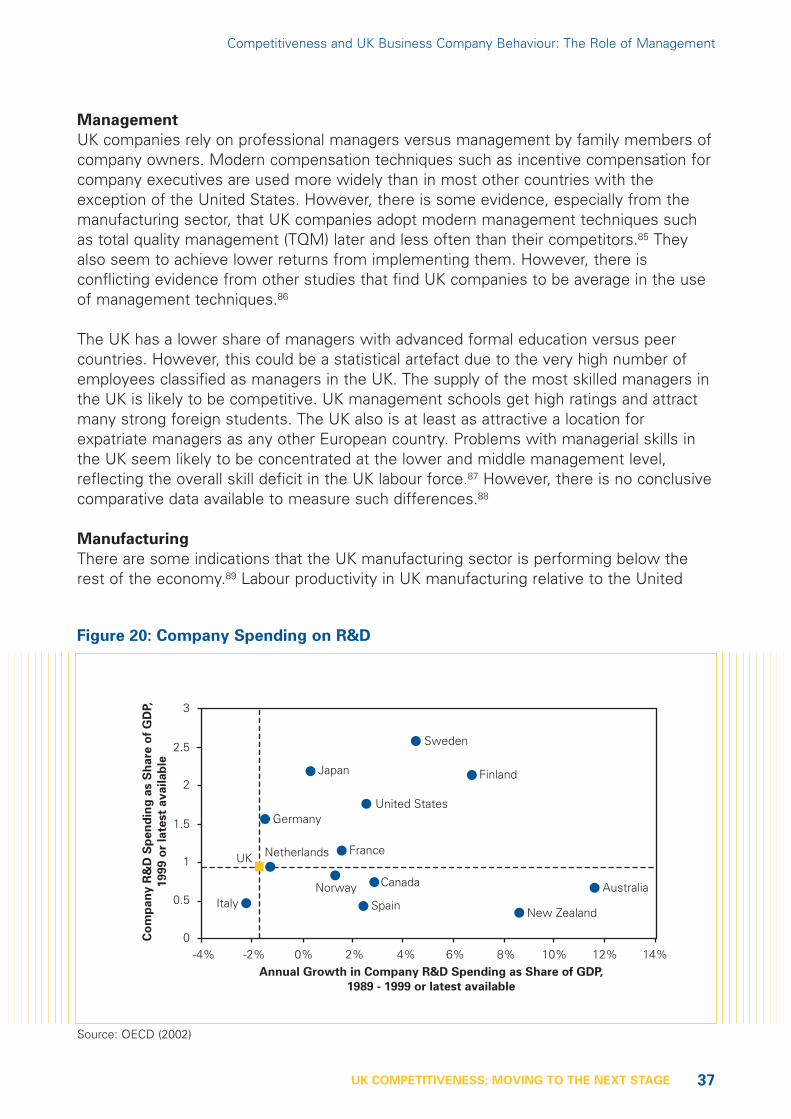
37UK COMPETITIVENESS: MOVING TO THE NEXT STAGE
Management
UK companies rely on professional managers versus management by family members ofcompany owners. Modern compensation techniques such as incentive compensation forcompany executives are used more widely than in most other countries with theexception of the United States. However, there is some evidence, especially from themanufacturing sector, that UK companies adopt modern management techniques suchas total quality management (TQM) later and less often than their competitors.85 Theyalso seem to achieve lower returns from implementing them. However, there isconflicting evidence from other studies that find UK companies to be average in the useof management techniques.86
The UK has a lower share of managers with advanced formal education versus peercountries. However, this could be a statistical artefact due to the very high number ofemployees classified as managers in the UK. The supply of the most skilled managers inthe UK is likely to be competitive. UK management schools get high ratings and attractmany strong foreign students. The UK also is at least as attractive a location forexpatriate managers as any other European country. Problems with managerial skills inthe UK seem likely to be concentrated at the lower and middle management level,reflecting the overall skill deficit in the UK labour force.87 However, there is no conclusivecomparative data available to measure such differences.88
Manufacturing
There are some indications that the UK manufacturing sector is performing below therest of the economy.89 Labour productivity in UK manufacturing relative to the United
Competitiveness and UK Business Company Behaviour: The Role of Management
Co
mp
an
y R
&D
Sp
en
din
g a
s S
hare
of
GD
P,
1999 o
r la
test
availab
le
Japan
Germany
Finland
New ZealandItaly
Canada
France
Sweden
UK
Australia
United States
Netherlands
NorwaySpain
Annual Growth in Company R&D Spending as Share of GDP,
1989 - 1999 or latest available
-4% -2% 0% 2% 4% 6% 8% 10% 12% 14%
0.5
1.5
2.5
3
2
1
0
Figure 20: Company Spending on R&D
Source: OECD (2002)
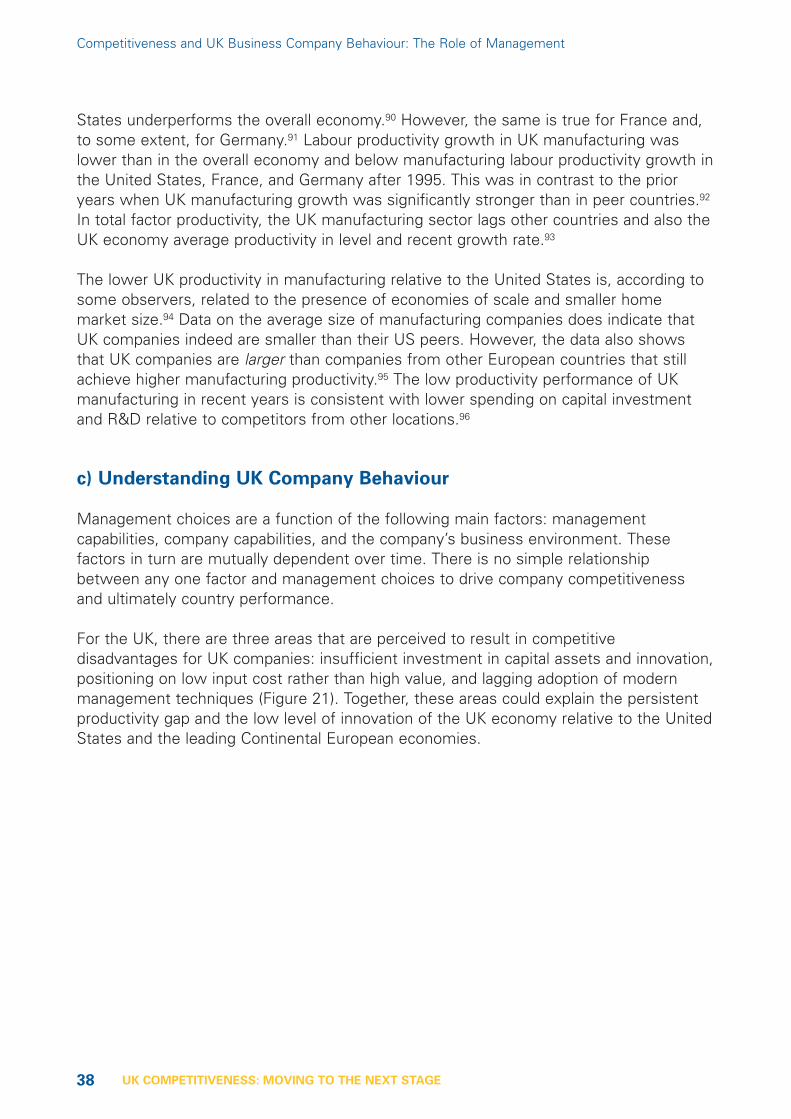
38 UK COMPETITIVENESS: MOVING TO THE NEXT STAGE
States underperforms the overall economy.90 However, the same is true for France and,to some extent, for Germany.91 Labour productivity growth in UK manufacturing waslower than in the overall economy and below manufacturing labour productivity growth inthe United States, France, and Germany after 1995. This was in contrast to the prioryears when UK manufacturing growth was significantly stronger than in peer countries.92
In total factor productivity, the UK manufacturing sector lags other countries and also theUK economy average productivity in level and recent growth rate.93
The lower UK productivity in manufacturing relative to the United States is, according tosome observers, related to the presence of economies of scale and smaller homemarket size.94 Data on the average size of manufacturing companies does indicate thatUK companies indeed are smaller than their US peers. However, the data also showsthat UK companies are larger than companies from other European countries that stillachieve higher manufacturing productivity.95 The low productivity performance of UKmanufacturing in recent years is consistent with lower spending on capital investmentand R&D relative to competitors from other locations.96
c) Understanding UK Company Behaviour
Management choices are a function of the following main factors: managementcapabilities, company capabilities, and the company’s business environment. Thesefactors in turn are mutually dependent over time. There is no simple relationshipbetween any one factor and management choices to drive company competitivenessand ultimately country performance.
For the UK, there are three areas that are perceived to result in competitivedisadvantages for UK companies: insufficient investment in capital assets and innovation,positioning on low input cost rather than high value, and lagging adoption of modernmanagement techniques (Figure 21). Together, these areas could explain the persistentproductivity gap and the low level of innovation of the UK economy relative to the UnitedStates and the leading Continental European economies.
Competitiveness and UK Business Company Behaviour: The Role of Management
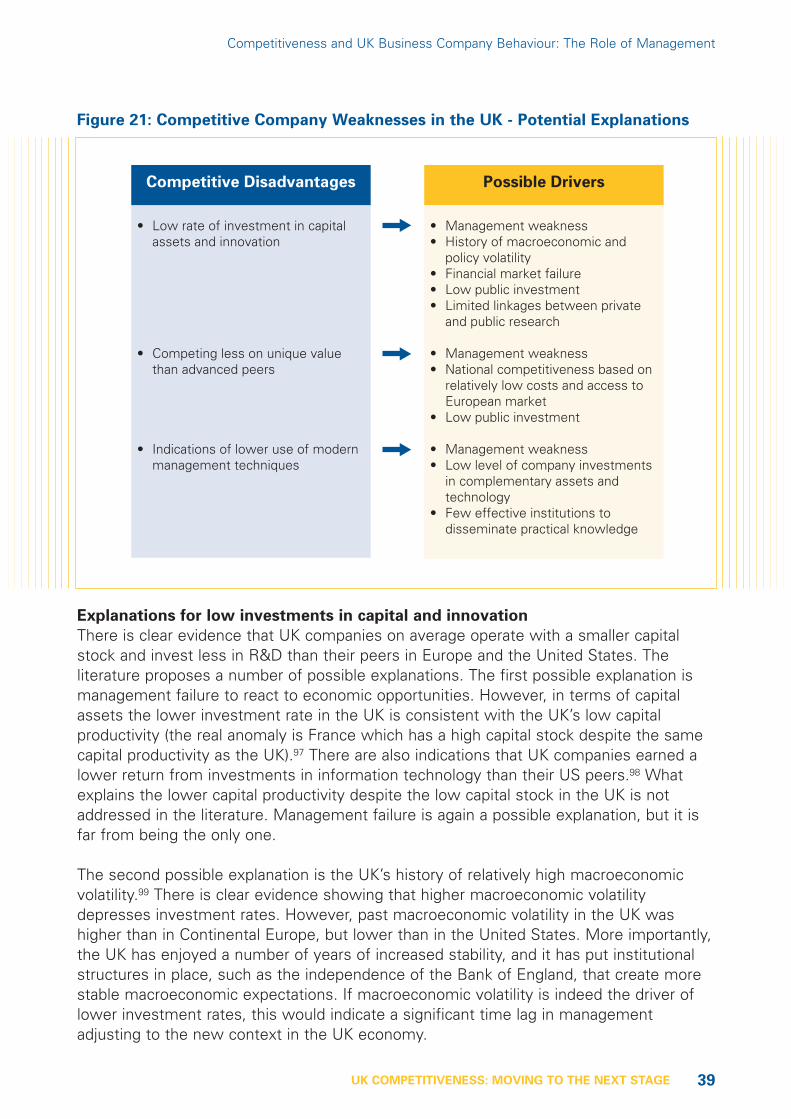
39UK COMPETITIVENESS: MOVING TO THE NEXT STAGE
Explanations for low investments in capital and innovation
There is clear evidence that UK companies on average operate with a smaller capitalstock and invest less in R&D than their peers in Europe and the United States. Theliterature proposes a number of possible explanations. The first possible explanation ismanagement failure to react to economic opportunities. However, in terms of capitalassets the lower investment rate in the UK is consistent with the UK’s low capitalproductivity (the real anomaly is France which has a high capital stock despite the samecapital productivity as the UK).97 There are also indications that UK companies earned alower return from investments in information technology than their US peers.98 Whatexplains the lower capital productivity despite the low capital stock in the UK is notaddressed in the literature. Management failure is again a possible explanation, but it isfar from being the only one.
The second possible explanation is the UK’s history of relatively high macroeconomicvolatility.99 There is clear evidence showing that higher macroeconomic volatilitydepresses investment rates. However, past macroeconomic volatility in the UK washigher than in Continental Europe, but lower than in the United States. More importantly,the UK has enjoyed a number of years of increased stability, and it has put institutionalstructures in place, such as the independence of the Bank of England, that create morestable macroeconomic expectations. If macroeconomic volatility is indeed the driver oflower investment rates, this would indicate a significant time lag in managementadjusting to the new context in the UK economy.
Competitiveness and UK Business Company Behaviour: The Role of Management
Competitive Disadvantages
• Low rate of investment in capital assets and innovation
• Competing less on unique value than advanced peers
• Indications of lower use of modern management techniques
Possible Drivers
• Management weakness• History of macroeconomic and
policy volatility• Financial market failure• Low public investment• Limited linkages between private
and public research
• Management weakness• National competitiveness based on
relatively low costs and access to European market
• Low public investment
• Management weakness• Low level of company investments
in complementary assets and technology
• Few effective institutions to disseminate practical knowledge
Figure 21: Competitive Company Weaknesses in the UK - Potential Explanations
40 UK COMPETITIVENESS: MOVING TO THE NEXT STAGE
The third possible explanation is the UK’s equity based financial market structure that, itis argued, favours short-term management outlook.100 There is clear evidence that thevalue of financial assets can be mis-priced for extended periods of time.101 There is,however, no systematic evidence that ties this to management behaviour. The anecdotalevidence on firms going private to enable more long-term strategies indicates that thismight be the case, but it also indicates that companies have a choice and that there is nodeterminism. The evidence from more general studies on the relationship betweenfinancial systems and economic performance indicates a more complex relationship withrelative advantages and disadvantages for the Anglo-Saxon versus Continental Europeansystem but no obvious superiority of any one model.
The fourth possible explanation for the low level of investment in capital stock andinnovation is the UK’s low level of complementary public capital assets and labour forceskills.102 There is clear evidence that the UK has weaknesses in the generalinfrastructure, such as the transportation networks, in public sector R&D spending, andin the overall skill base of its labour force. General economic research indicates thatthese factors will drive down the profitability of investments in capital assets and R&D.There is no specific data on the quantitative effect of these factors in the UK.103
The fifth explanation, related to the lower level of R&D investments, is the institutionalstructure and lagging financing of the university and public research sector. Private sectorresearch is increasingly related to public sector research.104 Low university R&D spendingand low levels of university interactions with companies are factors that directly effectcompanies incentives to invest in R&D. The relatively low level of financing for UKuniversities as well as universities’ low levels of patenting are indications that suchdeficits exists, at least outside of the life sciences.105
Explanations for company positioning on efficiency and low costs
There is some evidence that, on average, UK companies compete less on unique valueand innovation than their peers from other advanced countries.106 However, currentresearch provides no systematic explanation of why that might be the case. Onecandidate is management failure, especially in the area of strategy and innovation.107 UKmanagers might either fail to understand the opportunities of competing in premiumsegments, or might indeed be better at low cost processes, products, and services.
The alternative candidate to explain UK company positioning, however, is again thebusiness environment. The weaknesses in the infrastructure, science and technologysystem, and labour force skills make it harder for companies to compete on innovationand unique value. In contrast, historically the relatively low costs of labour and othercosts of doing business compared to peer countries made it attractive to compete onefficiency and lower cost.
Explanations for slow adoption of modern management practices
There is evidence from the manufacturing sector that UK companies are less active inadopting modern management practices. Given the success of UK retailers attributed toleading supply-chain management systems, it is unclear as to how broadly this
Competitiveness and UK Business Company Behaviour: The Role of Management
41UK COMPETITIVENESS: MOVING TO THE NEXT STAGE
observation holds. Accepting the notion that UK companies fall behind their peers inmodern management practices, management failure in the sense of resistance tochange or inadequate training in such practices are possible candidates for explanation.
However, another candidate to explain lower adoption of modern managementtechniques is the lower level of private and public investment in capital assets and R&D.Many of the new techniques need, it is argued, modern machinery and skilledemployees to reach their full potential. If those are missing, it might explain whymanagers decide not to migrate to these new techniques. The ultimate cause, then,would be the factors that drive low investment. Tackling those problems would then leadmanagers to adopt the new management techniques.
The third candidate for the slow adoption of modern management practices is theinsufficient presence of institutions for collaboration in the UK economy. Theseinstitutions, such as cluster organisation or university-linked networking institutions, oftenplay a particularly important role in the diffusion of new management best practice.Some of these techniques are hard to communicate in an abstract form, and are bestlearned in direct interaction with other professionals in the same cluster or industry.
While all of these individual explanations have some credibility, there is no systematicevidence evaluating their relative importance in explaining the facets of companybehaviour that underlie the UK productivity and innovation gap relative to its peers.
Competitiveness and UK Business Company Behaviour: The Role of Management
References
73 UNCTAD (2002). UK companiescome primarily from the oil &gas and the food & beveragessector, while for exampleGerman companies tend to befrom manufacturing sectors.
74 Conversely, Oughton (1997)notes that historically theprofitability of UK companieswas lower than by companies inother advanced economies. It isunclear if this data is conflictingwith the evidence mentioned inthe main text, or if a change inthe profitability patterns hasoccurred.
75 Griffith/Simpson (2000) andongoing research work atCERIBA (Center for Researchinto Business Activity)
76 DTI (2002)
77 Haskel (2002), unpublished
78 Ashworth et al. (2001)
79 OECD (2003)
80 Oughton (1997) argues thateven these aggregate numberscreate a too positive
impressions, because the strongspending on the life sciencesmasks deficits in other areas.
81 PICTF (2001)
82 Pain (2000)
83 Aiginger (2001)
84 IMF (2003)
85 EEF (2001), McKinsey (2002)
86 Nickell/Van Reenen (2002),OECD (1999)
87 See also Department forEducation and Skills (2001)
88 The Council for Excellence inLeadership and Management(2002) provides interesting dataon the UK situation.Comparative data on othercountries, however, isunfortunately not available.
89 McKinsey (2002), EEF (2001)
90 Pilat (1996), O’Mahoney/DeBoer (2002)
91 Germany has higher labourproductivity if measured by GDPper hour worked.
92 Bureau of Labour Statistics(2002), European Commission
(2001), O’Mahoney/deBoer(2002)
93 O’Mahoney/deBoer (2002)
94 EEF (2001)
95 Bartelsmann et at. (2003)
96 DTI (2001c)
97 McKinsey (1998)
98 Nickell (2002a)
99 Ashworth et al. (2001), Oughton(1997)
100 Nickell/Van Reenen (2002),Oughton (1997)
101 Myners-Report (2001)
102 Nickell (2002)
103 See Ford/Poret (1991) for someearlier empirical work on thisgeneral issue.
104 OECD (2002b)
105 In the life sciences, the UK hasa significant position, and in theuniversity-based clusters aroundOxford and Cambridgesignificant university-companyinteraction does take place.
106 Aiginger (2000)
107 TUC (2002)

42 UK COMPETITIVENESS: MOVING TO THE NEXT STAGE
5
Implications for Policyand Future Research
These findings, taken together, allow us to see the overall competitiveness of the UKand its stage of economic development. Successful economic development is a processof successive upgrading, in which a nation’s business environment evolves to supportand encourage increasingly sophisticated and productive ways of competing by firmsbased there. This process takes a long time, stretching far beyond the administration ofany individual government. Assets must be built, behaviour has to change, andinvestments have to feed through to generate results.108
As nations develop, they progress in terms of their characteristic competitive advantagesand modes of competing. This process can be described as a sequence of stages, eachwith a different set of economic characteristics and challenges. The first stage is theFactor-Driven Stage, in which competitive advantage is based exclusively onendowments of labour and natural resources. This supports only relatively low wages. Inthe Investment-Driven Stage, efficiency in producing standard products and servicesbecomes the dominant source of competitive advantage. Economies at this stageconcentrate on manufacturing and on outsourced service exports. They achieve higherwages, but are susceptible to financial crises’ and external, sector-specific demandshocks. In the Innovation-Driven Stage the ability to produce innovative products andservices at the global technology frontier using the most advanced methods becomesthe dominant source of competitive advantage. At this stage, the national businessenvironment is characterised by strengths in all areas of the diamond together with thepresence of deep clusters. Clusters become critical motors in generating not onlyproductivity but innovation at the world frontier. Institutions and incentives supportinginnovation are also well developed, increasing the efficiency of cluster interaction.Companies compete with unique strategies that are often global in scope, and investstrongly in advanced skills, the latest technology, and innovative capacity.
Seeing economic development as a sequential process of building interdependentmicroeconomic capabilities, shifting company strategies, improving incentives, andincreasing rivalry exposes important pitfalls in economic policy. The influence of one partof the microeconomic business environment depends on the state of the other parts.Lack of improvement in any important area can lead to a plateau in productivity growthand stalled development.
43UK COMPETITIVENESS: MOVING TO THE NEXT STAGE
This analysis also begins to make clear why countries find the transition to a new stageof development so difficult. Such inflection points require wholesale transformation ofmany interdependent dimensions of competition. This is a slow process however, ascompanies need to move to new types of strategies, investment priorities must change,and new institutions must be developed.109 While government policy can have relativelyrapid effects at the Investment-Driven Stage, the transition to the Innovation-DrivenStage is a slow process in which government must rely more on the private sector.
a) UK Competitiveness at the Transition to a New Stage
The UK economy has achieved a significant improvement in its competitiveness over thelast two decades. The decline in the international prosperity ranking has been halted and,to some degree, reversed. Labour productivity growth is relatively strong; and thecountry attracts significant amounts of foreign direct investment and has a stableposition on world export markets. These achievements were made possible byimprovements in the business environment that will continue to drive further advances.Markets were opened up, the government role in the economy was cut back, and themacroeconomic context was stabilised.
This successful phase of UK economic policy is now coming to an end. The returns frompast policy choices are becoming smaller, and the very success of the UK economy isundermining some of its past success factors. In the past, the UK competed as arelatively more efficient and less costly location than elsewhere in Europe to do businessin an advanced economy with access to the European market. Today, UK relative wagesare rising, the sign of an improving UK business environment and rising competitiveness:between 1996 and 2001, hourly wages in UK manufacturing, for example, have risen asfast as U.S. manufacturing wages, while wages in all other European countries in thedataset of the U.S. Bureau of Labour Statistics have risen much less.110 Also, otherEuropean countries have reduced some of their inefficiencies, and European Union rulesand regulation are increasingly being implemented in the UK as well. As the past policyapproach is both becoming less effective and is being modified, a sense of uncertaintyabout the future competitiveness of the UK is developing.
In our view, the current phase is a natural progression in the transition to the next stageof UK competitiveness. It is not indicating a failure of the past approach, nor is itsignalling imminent danger to the UK’s competitive position. As countries develop andincrease their prosperity, they have to upgrade their competitiveness. This upgradingprocess is especially evident in a transition, where the basis of a country’s competitiveadvantage has to be redefined. Factors that were important for past success becomebarriers to further growth.
The UK has now reached such a transition point. Competing on relatively low input costsand an efficient business environment is no longer sufficient to achieve the levels ofprosperity the country is aiming for. Lower taxes, less regulation, and an even smallerrole for the government are no longer the most critical elements for UK competitiveness.
Implications for Policy and Future Research

44 UK COMPETITIVENESS: MOVING TO THE NEXT STAGE
To achieve higher prosperity, UK companies will need to upgrade their productivity bycompeting on more unique and more innovative products and services. This will requirechanges in management behaviour, but it will also require targeted investments in thebusiness environment, and the development and strengthening of new types ofinstitutions. It will no longer be sufficient to just increase the efficiency of the existinginfrastructure, the educational institutions, and the science and technology system; it willrequire the commitment of additional resources.
The need for a revision of policy priorities is widely accepted in the public debate in theUK. Much of the relevant data is made available publicly, for example through theCompetitiveness Indicators published by the DTI.111 What seems to be missing,however, is a consistent, broad-based effort that gives direction to the significant numberof existing efforts and initiatives.
Broad consensus and shared direction, embodied in an economic “strategy” are criticalfor two reasons. One is in setting policy in the public sector: new trade-offs need to bemade about competing objectives. Without a broad consensus, these trade-offs will bemade inconsistently. What should the balance be between public investments and taxcuts? Where should incentives be created? These questions are much more importantnow than they were in the past when budget consolidation was the undisputed priority.A consensus on the overall policy direction is needed to answer them consistently.
A strategic perspective will also benefit the private sector. Many companies will have tomake choices, both individually and jointly, to upgrade their strategies and invest inimproving the business environment. An overall consensus on the country’s direction isneeded to guide these many individual choices. To implement a new stage of economicpolicy in the UK, both the public and private sector will have to review their traditionalroles. In the UK the challenge is not solely private sector management is sometimesassumed; it is how the public and private sector can jointly make the leap to the nextstage. This is different from, for example, Australia, where the onus is much more on theprivate sector to adjust to the business environment improvements the public sector hasachieved.112
The public sector will need to facilitate the transition to the new stage while acceptingincreasingly less control over critical elements of the competitiveness agenda. Powerneeds to be delegated to new regional institutions, a process that has already started tosome degree but will need to go a good deal further. In some ways the most importantshift will come from the need to give others, mainly in the private sector, the leading rolein competitiveness efforts and in identifying priorities for action.
Letting go of control over policy choices will be challenging for a government that overthe last two decades has seen competitiveness as its unique responsibility andcompetence. But tight government control of the competitiveness agenda will now makesuccess less likely. It will “crowd out” private sector leadership and runs the risk ofpicking bad priorities.
Implications for Policy and Future Research

45UK COMPETITIVENESS: MOVING TO THE NEXT STAGE
The private sector, too, is facing a transition in its ways of operating within companiesand in its role in shaping UK competitiveness. Companies need to realise that theircompetitive success is a function of the business environment they operate in as well asof their own decision. And the quality of the business environment is not only aresponsibility of the public sector; it is their responsibility, too. Companies will have toplay an increasingly central role in setting policy priorities, becoming involved in clusterdevelopment initiatives, and making their own contributions to upgradingcompetitiveness.113 The private sector needs to share the overall direction and be animportant part of the process. Otherwise company efforts will fail to be coordinated, andgovernment efforts will lack effectiveness.
b) The UK Competitiveness Agenda 2003
For the UK to make the transition to higher productivity and higher levels of prosperity,the country will need to create a national consensus about its competitive distinctivenessin the world economy. We have identified six priority areas on the UK competitivenessagenda in 2003. Addressing these areas is not solely the job of government. Indeed, thecentral government needs to moderate and evolve its role. Instead action needs to comefrom a broad coalition of government entities at different levels, private businesses,trade associations and professional organisations, universities and research institutions,and many other institutions that have an impact on the business environment.
Public investment
The UK has been successful in increasing the effectiveness of its existing capital stockand making public sector investments more efficient. For example, educational spendingis more effective because of the creation of more competition, from school league tablesto higher education assessment efforts. Now, however, the focus needs to includeramping up the rate of investment in the educational system, the transportationinfrastructure, and in the nation’s scientific and technological capacity. In areas that havebeen privatised, the next stage might require a review of existing regulatory structures.
Some budget decisions to step up investment have already been made, for example inthe science and technology budget. We commend these steps, but what is required is asustained commitment. As part of a consistent strategy to upgrade UK competitiveness,such a commitment can be reconciled with the fiscal prudence also required.
Productivity-driven regulatory context
The UK needs to create a policy context that raises the pressures and incentives forinvestment and upgrading. This includes continued efforts to enhance competition policy,a reform of the science and technology system to increase interaction betweenuniversities and private businesses, a comprehensive strategy for training in advancedmanagerial skills, and raising regulatory standards that enable rather than constraincompetition.
Implications for Policy and Future Research
46 UK COMPETITIVENESS: MOVING TO THE NEXT STAGE
Clusters
The UK needs to mount a sustained programme of cluster development to create a moreconducive environment for productivity growth and innovation through the collectiveaction of companies and other institutions. Such a programme can build on previousefforts to map the UK cluster landscape, but will have to utilise enhanced methodologyand include more of an action component. It will be essential to mobilise businesses andbusiness institutions that are willing and able to engage in the upgrading of their clusters.
Regions
The UK needs to further strengthen the regional focus of its economic policy. Thecreation of the Regional Development Agencies (RDA’s) has been an important step inthe right direction. However, more is needed to empower regional and local leaders,develop actionable regional economic strategies, and, address specific issues such asland use planning and zoning. Examples from other countries and regions in Europe andthe United States can provide helpful ideas on how to mobilise such regional efforts.
The UK also needs to continue its laudable efforts to revitalise disadvantagedcommunities114 using market based approaches. UK companies need to realise their self-interest and the economic potential of such communities, and play a bigger role in suchefforts.
Roles and institutions
New roles for the existing players as well as a new set of institutions are necessary ineconomic policy. At the center will have to be a shift in the role of government;government-led development must be transformed into private sector-led development.New and more effective institutions for collaboration will be needed to enable a strongerprivate collective action, and to strengthen the development and the interaction withinclusters. Universities and public research institutions need new structures to strengthentheir roles as active parts of the regional business environment of which they are part.
Management
UK managers need to reorientate company strategies towards a greater level ofinnovation and the provision of higher value goods and services. This will require steppedup investments in R&D, skills, modern production and logistics technology, and IT tosupport more sustainable competitive advantages. These investments will also require achange of perspective. The challenge is no longer to only drive down cost but to createassets that support unique value propositions.
Finally, business leaders must take a more prominent role in cluster development andother efforts to upgrade UK and regional competitiveness. Without improvements in theirbusiness environments, companies investments will otherwise be less profitable andeffective.
Implications for Policy and Future Research

47UK COMPETITIVENESS: MOVING TO THE NEXT STAGE
c) Implications for UK Competitiveness Research
Further research is needed in a number of areas identified in our work, both to clarify theUK’s competitive position and support the action agenda.
Technology commercialisation
Effective commercialisation of technology is of critical importance in the next stage ofUK competitiveness. Documenting and assessing the current state of university-businesscollaboration in the UK would provide valuable information to devise necessary changes.Ideally, this data would also allow comparison between the UK and other advancedeconomies that have a proven track record in successful technology commercialisation.
Institutions for Collaboration
Institutions for collaboration are essential actors in increasing the effectiveness ofclusters and provide a platform for collective action. There is the impression that in theUK such institutions are less numerous and less effective than in peer countries. Aninventory and assessment of UK institutions for collaboration, such as trade associations,quality centers, and standard setting entities, would help to better understand thecurrent situation and to develop appropriate action.
Clusters
Cluster development and upgrading needs to be based on a more rigorous understandingof emerging or established clusters in the UK. Past efforts have been incomplete andrigorous data to support cluster development is not yet available. The UK needs tomount a new, more comprehensive statistical effort on clusters at the national andregional level. New data requirements for companies may be needed to support the neweconomy.
The broad industries in which the UK has strong export positions are a suitable startingpoint for cluster case studies. These clusters have proven capabilities, and are goodcandidates for cluster evaluation and upgrading. Their geographic locations across the UKshould be mapped and the quality of their specific business environments evaluated.They can raise our understanding of the role of clusters in the UK relative to otherlocations. And their experience can help to inform efforts by less developed or narrowerclusters.
Management skills
The quality of UK management skills and the effectiveness of management training needto be assessed in a consistent, comparative way at multiple levels of management.Current studies have focused on identifying generic demands on future managers andhave developed recommendations on that basis. A better understanding of the currentsituation would help to make these recommendations more actionable and effective.
Financial markets
The interaction between financial market structure and company behaviour has beenlooked at on an economy-wide level, but there is little systematic evidence on the impact
Implications for Policy and Future Research
48 UK COMPETITIVENESS: MOVING TO THE NEXT STAGE
of the UK financial market on UK companies strategy and investment choices. Moresystematic evidence would help to raise the level of the debate.
Investment behaviour
Differences in investment levels between UK and foreign companies have beendocumented widely, but there is little systematic evidence evaluating the differentcompeting explanations. A matched pair study of UK and foreign firms within and outsidethe UK could shed more light on this issue, and direct future research.
Corporate involvement
UK companies need to be a central part in the effort to develop clusters and upgrade theUK’s business environment. An assessment of the current role of UK companies in theseareas would help to identify effective ways to engage them further. Also, a review of UKcompanies philanthropic activities, an area with significant potential importance forbusiness environment upgrading, could prove useful in this respect.
Implications for Policy and Future Research
References
108 Porter (1990)
109 For examples see Porter(2001a), Porter (2001b), andPorter (2001c)
110 BLS (2002b)
111 DTI (2002)
112 Porter (2002b)
113 For the role of corporatephilanthropy in this processsee Porter/Kramer (2002)
114 Small Business Services(2001). This work draws heavilyon concepts developed by theUS-based Initiative for aCompetitive Inner City (ICIC,www.icic.org)
49UK COMPETITIVENESS: MOVING TO THE NEXT STAGE
References andData Sources
Aiginger, Karl (2000), Europe’s position in quality competition, WIFO Background Reportfor the European Competitiveness Report 2000, WIFO: Vienna.
Ashworth, Paul, et al. (2001), UK Fixed Capital Formation: Determinants and Constraints,prepared for the DTI and the CBI/TUC Working Party on Investment, London.
Bartelsmann, Eric, Stefano Scarpetta, Fabiano Schivadi (2003), Comparative Analysis ofFirm Demographics and Survival, Economics Department Working Paper No. 348, OECD:Paris.
Beath, John (2002), UK Industrial Policy: Old tunes on new instruments?, Oxford Reviewof Economic Policy, Vol. 18, N0. 2, pp. 221-239.
Bond, Steven, Lucy Chennells (2000), Corporate Income Taxes and Investment: AComparative Study, Institute for Fiscal Studies: London.
Card, David, Richard B Freeman (2002), What have two decades of British reformdelivered, NBER Working Paper 8801.
CBI (2002), Economic Outlook Survey - Is the UK a good place to do business?, MORIStudy commissioned by the CBI, London: November 2002.
Cluster Mapping Project (2003), dataset compiled at the Institute for Strategy andCompetitiveness, Harvard Business School.
Cockerill, Tony (2002), Public-Private Partnerships and Regional Economic Development,Working Paper, Durham University.
Council for Excellence in Leadership and Management (2002), Managers and Leaders:Raising our Game, CEML: London 2002.
EEF - Engineering Employers Federation (2001), Catching up with Uncle Sam - EEF finalreport on UK and US manufacturing productivity, London.
El-Agraa, Ali M. (1997), UK Competitiveness Policy vs. Japanese Industrial Policy, TheEconomic Journal, Vol. 107, pp. 1504-1517.
50 UK COMPETITIVENESS: MOVING TO THE NEXT STAGE
References and Data Sources
European Commission (2002), European Competitiveness Report 2002, Brussels.
European Commission (2001), European Innovation Scoreboard 2001, Brussels.
European Commission (2001), Enterprise Policy Scoreboard 2001, Brussels.
Ford, Robert, Pierre Poret (1991), Infrastructure and Private-Sector Productivity,Economics Department Working Paper No. 91, OECD: Paris.
Griffith, Rachel, Helen Simpson (2000), Characteristics of Foreign-Owned Firms in BritishManufacturing, IFS discussion paper.
Haskel, Jonathan, Stephen Martin (2002), The UK Manufacturing Productivity Spread,CERIBA discussion paper.
Hogarth, Terence, Rob Wilson (2001), Skills Matter: A Synthesis or Research on theExtent, Causes, and Implications of Skill Deficiencies, Institute of Employment Research:Coventry.
Department for Education and Skills (2001), Skills Matter: A Synthesis of Research onthe Extent, Causes, and Implications of Skill Deficiencies, London.
Department of Trade and Industry (2002), Value Added Scoreboard, London.
Department of Trade and Industry (2001a), UK Competitiveness Indicators - 2nd Edition,London.
Department of Trade and Industry (2001b), Business Clusters in the UK - A FirstAssessment, London.
Department of Trade and Industry (2001c), Capex Scoreboard, London.
Department of Trade and Industry (1999), Biotechnology Clusters, London.
HM Treasury (2001a), Productivity in the UK: 3 - The Regional Dimension, London.
HM Treasury (2001b), United Kingdom Progress Report on Economic Reform: Productand Capital Markets, London.
International Monetary Fund (2003), United Kingdom: Selected Issues, IMF Staff CountryReport No. 03/47, Washington, D.C.
International Monetary Fund (2002), United Kingdom: Selected Issues, IMF Staff CountryReport No. 02/46, Washington, D.C.
International Monetary Fund (2000), United Kingdom: Selected Issues, IMF Staff Country

51UK COMPETITIVENESS: MOVING TO THE NEXT STAGE
References and Data Sources
Report No. 00/106, Washington, D.C.
JM Consulting (2001), Study of Science Research Infrastructure, study for the Office ofScience and Technology, Bristol
Johnson, Stephen, Jonathan Winterton (1999), Skill Task Force Research Paper 3:Management Skills, London.
Maddison, Angus (2001), The World Economy: A Millennial Perspective, OECD: Paris.
McKinsey & Company (2002), Reviving UK Manufacturing, McKinsey & Company:London: October 2002.
McKinsey Global Institute (1998), Driving Productivity and Growth in the UK Economy,McKinsey Global Institute: Washington, D.C.
Myners-Report (2001), Institutional Investment in the United Kingdom: A Review, Reportprepared for the Chancellor of the Exchequer, London.
Nickell, Stephen (2002), Productivity in the UK: Past, Present, and Future, Presentationgiven to HM Treasury, London.
Nickell, Stephen (2002), The Assessment: The Economic Record of the LabourGovernment since 1997, Oxford Review of Economic Policy, Vol. 18, No. 2, pp. 107-119.
Nickell, Stephen, John Van Reenen (2002), The United Kingdom, in: Benn Steil, David G.Victor, Richard R. Nelson (eds.), Technological Innovation and Economic Performance,Princeton University Press: Princeton, pp. 178-199.
OECD (2002a), Economic Surveys: United Kingdom, OECD: Paris.
OECD (2002b), Benchmarking Industry-Science Relationships, OECD: Paris.
OECD (2001), OECD Science, Technology, and Industry Scoreboard 2001. OECD: Paris.
OECD (2000), Measuring Student Knowledge and Skills: The PISA 2000 Assessment ofReading, Mathematical and Scientific Literacy, Paris.
OECD (1999), New Enterprise Work Practices and their Labour market implications,Employment Outlook, OECD: Paris.
Oughton, Christine (1997), Competitiveness Policy in the 1990s, The Economic Journal,Vol. 107, pp. 1486-1503.
O’Mahony, Mary, Willem deBoer (2002), Britain’s relative productivity performance:Updates to 1999, Final report to DTI/Treasury/ONS, National Institute of Economic andSocial Research.
52 UK COMPETITIVENESS: MOVING TO THE NEXT STAGE
References and Data Sources
Pain, Nigel (2000), The Impact of Inward Investment on the UK Economy, In: HMTreasury, Economic Growth and Government Policy, London.
Pharmaceutical Industry Competitiveness Task Force (2001), Final Report, HMDepartment of Health/Association of the British Pharmaceutical Industry: London.
Pilat, Dirk (1996), Labour Productivity Levels in OECD Countries: Estimates forManufacturing and Selected Service Sectors, Economics Department Working Paper No.169, OECD: Paris.
Porter, Michael E. (2003), Cluster Mapping Project, Information at www.isc.hbs.edu.
Porter, Michael E. (2002a), Building the Microeconomic Foundations of Prosperity:Findings from the Microeconomic Competitiveness Index, in: Michael E. Porter, KlausSchwab (eds.), The Global Competitiveness Report 2002-2003, World Economic Forum,Oxford University Press: New York
Porter, Michael E. (2002b), Australian Competitiveness, Presentation held at IIRConference, Sydney.
Porter, Michael E. (2001a), The Competitive Advantage of Singapore: Transition to theInnovation Stage, Presentation held at the New Economy Conference, Singapore.
Porter, Michael E. (2001b), New Zealand Competitiveness: The Next Agenda,Presentation held at the Catching the Knowledge Wave Conference, Auckland.
Porter, Michael E. (2001c), The Competitive Advantage of Taiwan, CommonwealthSpeech, Taipei.
Porter, Michael E. (2001d), Regions and the New Economics of Competition, in A.J.Scott (ed.), Global City-Regions, Oxford University Press: Oxford.
Porter, Michael E. (2000), Location, Clusters, and Company Strategy, in:Clark/Gertler/Feldman: Oxford Handbook of Economic Geography, Oxford UniversityPress: Oxford.
Porter, Michael E. (1998), Clusters and Competition: New Agendas for Companies,Governments, and Institutions, in: On Competition, Harvard Business School Press:Cambridge.
Porter, Michael E. (1990), The Competitive Advantage of Nations, Free Press: New York.
Porter, Michael E., Council on Competitiveness, Monitor Group (2001), Clusters ofInnovation: Regional Foundations of U.S. Competitiveness, Council on Competitiveness:Washington, D.C.
53UK COMPETITIVENESS: MOVING TO THE NEXT STAGE
References and Data Sources
Porter, Michael E., Willis Emmons (2003), Institutions for collaboration: Overview, HBSNote N9-703-436, Harvard Business School: Boston.
Porter, Michael E., Dan Esty (2001), Environmental Competitiveness, In: Michael. Porter,Jeffrey Sachs, Klaus Schwab (eds.), The Global Competitiveness Report 2001-2002,World Economic Forum, Oxford University Press: New York
Porter, Michael E., Mark Kramer (2002), The Competitive Advantage of CorporatePhilanthropy, Harvard Business Review, December 2002.
Porter, Michael E., Klaus Schwab (eds.) (2002), The Global Competitiveness Report 2002-2003, World Economic Forum, Oxford University Press: New York
Porter, Michael E., Örjan Sölvell (2003), The Australian Wine Cluster: SupplementaryInformation, Harvard Business School Case N9-703-493
Porter, Michael E., Deborah Van Opstel (2001), U.S. Competitiveness 2001: Strengths,Vulnerabilities, and Long-Term Priorities, Council on Competitiveness: Washington, D.C.
Scarpetta, Stefano, et al. (2002), The role of policies and institutions for productivity andfirm dynamics: Evidence from micro and industry data, Working Paper No. 328, OECD:Paris.
Small Business Services (2001), City Growth Strategies, Project concept paper, London.
Trade Union Congress (2002), The Low Road, London.
UNCTAD (2002), World Investment Report 2002, Geneva.
U.S. Department of Labour (2002a), International Statistics, Bureau of Labour Statistics:Washington, D.C.
U.S. Department of Labour (2002b), International Comparisons of Hourly CompensationCosts for Production Workers in Manufacturing, 1975-2001, News Release USDL 02-549,Bureau of Labour Statistics: Washington, D.C.
Word Trade Organisation (2002), International Trade Statistics 2002, Geneva.
Wren, Colin (2001), The Industrial Policy of Competitiveness: A Review of RecentDevelopments in the UK, Regional Studies, Vol. 35.9, pp. 847-860.
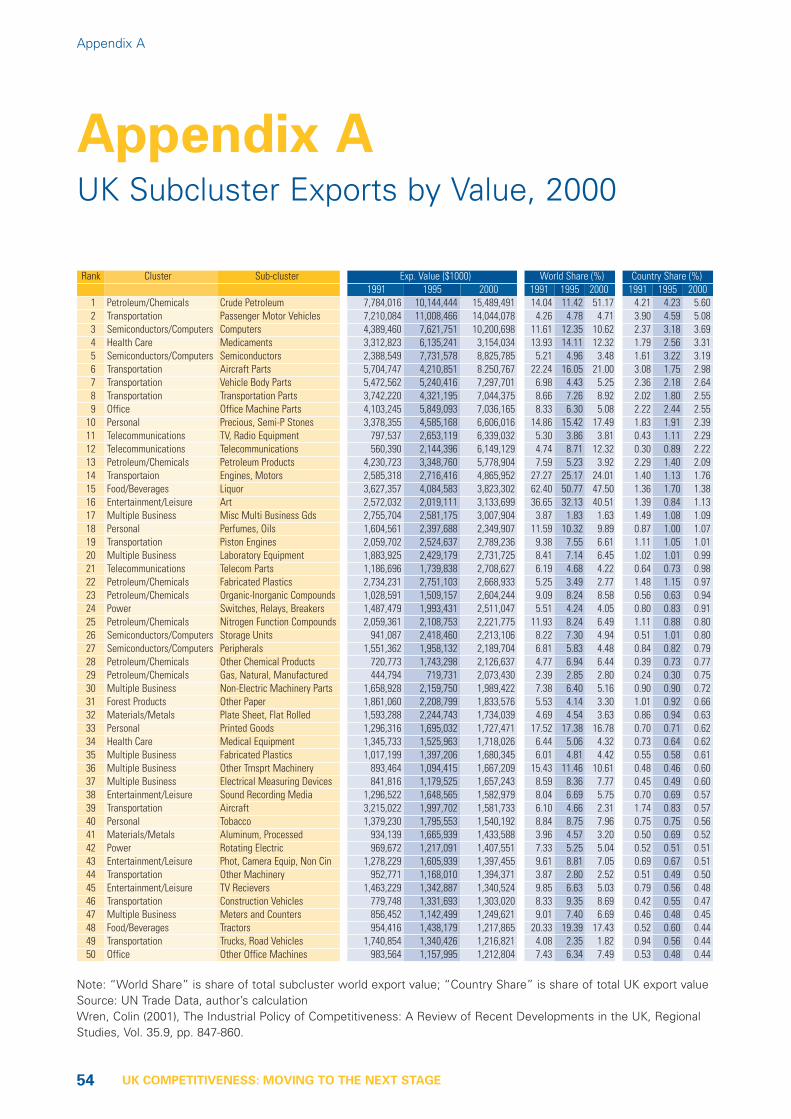
54 UK COMPETITIVENESS: MOVING TO THE NEXT STAGE
Appendix AUK Subcluster Exports by Value, 2000
Appendix A
Note: “World Share” is share of total subcluster world export value; “Country Share” is share of total UK export valueSource: UN Trade Data, author’s calculation Wren, Colin (2001), The Industrial Policy of Competitiveness: A Review of Recent Developments in the UK, RegionalStudies, Vol. 35.9, pp. 847-860.
Rank Cluster Sub-cluster Exp. Value ($1000) World Share (%) Country Share (%)1991 1995 2000 1991 1995 2000 1991 1995 2000
1 Petroleum/Chemicals Crude Petroleum 7,784,016 10,144,444 15,489,491 14.04 11.42 51.17 4.21 4.23 5.602 Transportation Passenger Motor Vehicles 7,210,084 11,008,466 14,044,078 4.26 4.78 4.71 3.90 4.59 5.083 Semiconductors/Computers Computers 4,389,460 7,621,751 10,200,698 11.61 12.35 10.62 2.37 3.18 3.694 Health Care Medicaments 3,312,823 6,135,241 3,154,034 13.93 14.11 12.32 1.79 2.56 3.315 Semiconductors/Computers Semiconductors 2,388,549 7,731,578 8,825,785 5.21 4.96 3.48 1.61 3.22 3.196 Transportation Aircraft Parts 5,704,747 4,210,851 8.250,767 22.24 16.05 21.00 3.08 1.75 2.987 Transportation Vehicle Body Parts 5,472,562 5,240,416 7,297,701 6.98 4.43 5.25 2.36 2.18 2.648 Transportation Transportation Parts 3,742,220 4,321,195 7,044,375 8.66 7.26 8.92 2.02 1.80 2.559 Office Office Machine Parts 4,103,245 5,849,093 7,036,165 8.33 6.30 5.08 2.22 2.44 2.55
10 Personal Precious, Semi-P Stones 3,378,355 4,585,168 6,606,016 14.86 15.42 17.49 1.83 1.91 2.3911 Telecommunications TV, Radio Equipment 797,537 2,653,119 6,339,032 5.30 3.86 3.81 0.43 1.11 2.2912 Telecommunications Telecommunications 560,390 2,144,396 6,149,129 4.74 8.71 12.32 0.30 0.89 2.2213 Petroleum/Chemicals Petroleum Products 4,230,723 3,348,760 5,778,904 7.59 5.23 3.92 2.29 1.40 2.0914 Transportaion Engines, Motors 2,585,318 2,716,416 4,865,952 27.27 25.17 24.01 1.40 1.13 1.7615 Food/Beverages Liquor 3,627,357 4,084,583 3,823,302 62.40 50.77 47.50 1.36 1.70 1.3816 Entertainment/Leisure Art 2,572,032 2,019,111 3,133,699 36.65 32.13 40.51 1.39 0.84 1.1317 Multiple Business Misc Multi Business Gds 2,755,704 2,581,175 3,007,904 3.87 1.83 1.63 1.49 1.08 1.0918 Personal Perfumes, Oils 1,604,561 2,397,688 2,349,907 11.59 10.32 9.89 0.87 1.00 1.0719 Transportation Piston Engines 2,059,702 2,524,637 2,789,236 9.38 7.55 6.61 1.11 1.05 1.0120 Multiple Business Laboratory Equipment 1,883,925 2,429,179 2,731,725 8.41 7.14 6.45 1.02 1.01 0.9921 Telecommunications Telecom Parts 1,186,696 1,739,838 2,708,627 6.19 4.68 4.22 0.64 0.73 0.9822 Petroleum/Chemicals Fabricated Plastics 2,734,231 2,751,103 2,668,933 5.25 3.49 2.77 1.48 1.15 0.9723 Petroleum/Chemicals Organic-Inorganic Compounds 1,028,591 1,509,157 2,604,244 9.09 8.24 8.58 0.56 0.63 0.9424 Power Switches, Relays, Breakers 1,487,479 1,993,431 2,511,047 5.51 4.24 4.05 0.80 0.83 0.9125 Petroleum/Chemicals Nitrogen Function Compounds 2,059,361 2,108,753 2,221,775 11.93 8.24 6.49 1.11 0.88 0.8026 Semiconductors/Computers Storage Units 941,087 2,418,460 2,213,106 8.22 7.30 4.94 0.51 1.01 0.8027 Semiconductors/Computers Peripherals 1,551,362 1,958,132 2,189,704 6.81 5.83 4.48 0.84 0.82 0.7928 Petroleum/Chemicals Other Chemical Products 720,773 1,743,298 2,126,637 4.77 6.94 6.44 0.39 0.73 0.7729 Petroleum/Chemicals Gas, Natural, Manufactured 444,794 719,731 2,073,430 2.39 2.85 2.80 0.24 0.30 0.7530 Multiple Business Non-Electric Machinery Parts 1,658,928 2,159,750 1,989,422 7.38 6.40 5.16 0.90 0.90 0.7231 Forest Products Other Paper 1,861,060 2,208,799 1,833,576 5.53 4.14 3.30 1.01 0.92 0.6632 Materials/Metals Plate Sheet, Flat Rolled 1,593,288 2,244,743 1,734,039 4.69 4.54 3.63 0.86 0.94 0.6333 Personal Printed Goods 1,296,316 1,695,032 1,727,471 17.52 17.38 16.78 0.70 0.71 0.6234 Health Care Medical Equipment 1,345,733 1,525,963 1,718,026 6.44 5.06 4.32 0.73 0.64 0.6235 Multiple Business Fabricated Plastics 1,017,199 1,397,206 1,680,345 6.01 4.81 4.42 0.55 0.58 0.6136 Multiple Business Other Trnsprt Machinery 893,464 1,094,415 1,667,209 15.43 11.46 10.61 0.48 0.46 0.6037 Multiple Business Electrical Measuring Devices 841,816 1,179,525 1,657,243 8.59 8.36 7.77 0.45 0.49 0.6038 Entertainment/Leisure Sound Recording Media 1,296,522 1,648,565 1,582,979 8.04 6.69 5.75 0.70 0.69 0.5739 Transportation Aircraft 3,215,022 1,997,702 1,581,733 6.10 4.66 2.31 1.74 0.83 0.5740 Personal Tobacco 1,379,230 1,795,553 1,540,192 8.84 8.75 7.96 0.75 0.75 0.5641 Materials/Metals Aluminum, Processed 934,139 1,665,939 1,433,588 3.96 4.57 3.20 0.50 0.69 0.5242 Power Rotating Electric 969,672 1,217,091 1,407,551 7.33 5.25 5.04 0.52 0.51 0.5143 Entertainment/Leisure Phot, Camera Equip, Non Cin 1,278,229 1,605,939 1,397,455 9.61 8.81 7.05 0.69 0.67 0.5144 Transportation Other Machinery 952,771 1,168,010 1,394,371 3.87 2.80 2.52 0.51 0.49 0.5045 Entertainment/Leisure TV Recievers 1,463,229 1,342,887 1,340,524 9.85 6.63 5.03 0.79 0.56 0.4846 Transportation Construction Vehicles 779,748 1,331,693 1,303,020 8.33 9.35 8.69 0.42 0.55 0.4747 Multiple Business Meters and Counters 856,452 1,142,499 1,249,621 9.01 7.40 6.69 0.46 0.48 0.4548 Food/Beverages Tractors 954,416 1,438,179 1,217,865 20.33 19.39 17.43 0.52 0.60 0.4449 Transportation Trucks, Road Vehicles 1,740,854 1,340,426 1,216,821 4.08 2.35 1.82 0.94 0.56 0.4450 Office Other Office Machines 983,564 1,157,995 1,212,804 7.43 6.34 7.49 0.53 0.48 0.44
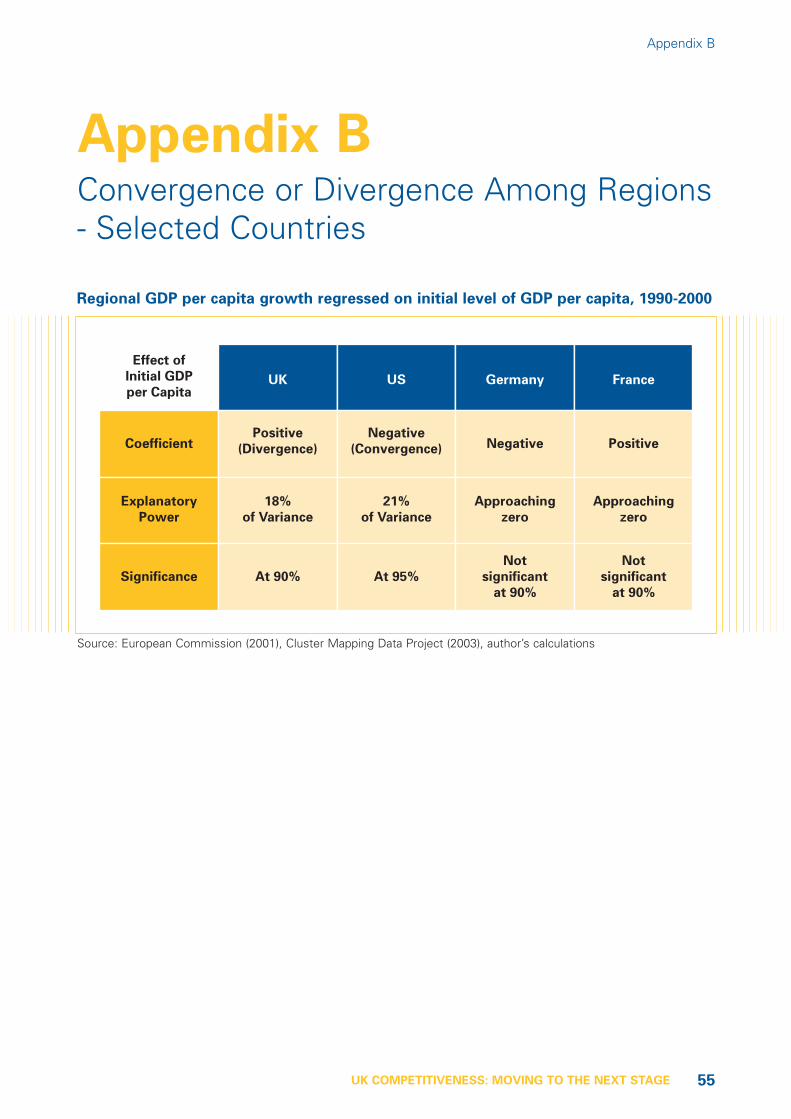
55UK COMPETITIVENESS: MOVING TO THE NEXT STAGE
Appendix BConvergence or Divergence Among Regions- Selected Countries
Appendix B
UK
Effect of
Initial GDP
per CapitaUS Germany France
Positive
(Divergence)CoefficientNegative
(Convergence) Negative Positive
18%
of Variance
Explanatory
Power
21%
of Variance
Approaching
zero
Approaching
zero
At 90%Significance At 95%
Not
significant
at 90%
Not
significant
at 90%
Regional GDP per capita growth regressed on initial level of GDP per capita, 1990-2000
Source: European Commission (2001), Cluster Mapping Data Project (2003), author’s calculations

Printed in the UK on recycled paper with a minimum HMSO score of 75May 2003 Department of Trade and Industry. http://www.dti.gov.uk
© Copyright Professor Michael E Porter. DTI/Pub 6580/5.5k/05/03/NP URN 03/899