Embed Size (px)
Citation preview
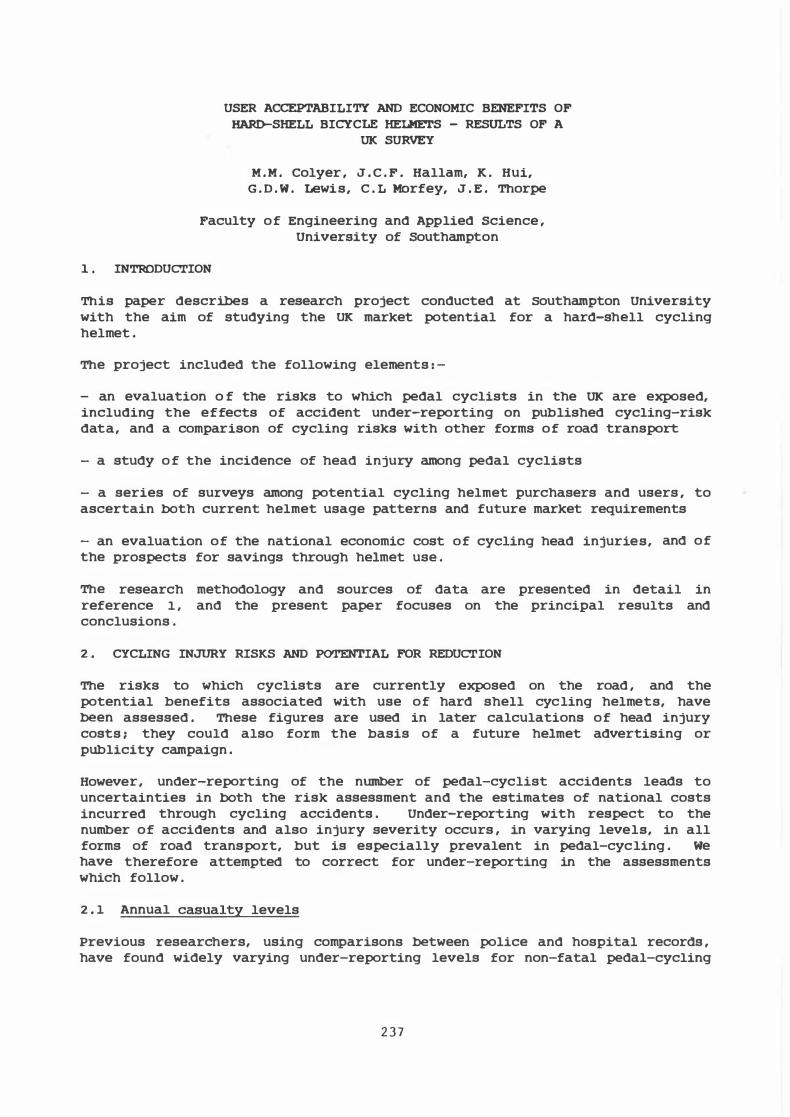
USER ACCEPTABILITY AND ECONOMIC BENEFITS OF HARirSHELL BICYCLE HELMETS - RESULTS OF A
UK SURVEY
M . M . Colyer , J . C . F . Hallam, K . Hui, G . D . W . Lewis, C . L Morfey, J . E . Thorpe
Faculty of Engineering and Applied Science , University of southampton
1 . INTRODUCTION
This paper descri.bes a research project conducted at southampton University with the aim of studying the ux market potential for a hard-shell cycling helmet .
The project included the following elernents : -
- an evaluation o f the risks to which pedal cyclists in the UK are exposed, including the effects of accident under-reporting on published cycling-risk data, and a comparison of cycling risks with other forms of road transport
a study o f the incidence of head injury among pedal cyclists
a series of surveys among potential cycling helmet purchasers and users , to ascertain both current helmet usage patterns and future market requirements
- an evaluation of the national economic cost of cycling head injuries, and of the prospects for savings through helmet use .
The research methodology and sources of data are presented in detail in reference 1 , and the present paper focuses on the principal results and conclusions .
2 . CYCLING INJURY RISKS AND POTENTIAL FOR REDUCTION
The risks to which cyclists are currently exposed on the road , and the potential benefits associated with use of hard shell cycling helmets, have been assessed . These figures are used in later calculations of head injury costs ; they could also form the basis of a future helmet advertising or publicity campaign .
However, under-reporting of the number of pedal-cyclist accidents leads to uncertainties in both the risk assessment and the estimates of national costs incurred through cycling accidents . Under-reporting with respect to the number of accidents and also injury severity occurs , in varying levels, in all forms of road transport, but is especially prevalent in pedal-cycling . We have therefore attempted to correct for under-reporting in the assessments which follow .
2 . 1 Annual casualty levels
Previous researchers, using comparisons between police and hospital records , have found widely varying under-reporting levels for non-fatal pedal-cycling
2 3 7
accidents ( Re f . l ) . These ranged frorn 21% to 83% for under-reporting of "serious" accidents, and 41% to 91% for under-reporting of accidents described as "slight" ( although these do not generally involve hospital adrnission ) .
The differences in these results can be explained by the variable accuracy , detail and cornpleteness of hospital inforrnation ( including errors in categorising on- and off-highway accidents ) , and discrepancies between police and hospital catchrnent areas . conservative under-reporting levels are 21% for "serious" accidents and 41% for "slight" accidents . These levels suggest road traffic accident ( RTA ) casualty leve ls in Britain of at least 8 , 000 pedal-cyclists seriously injured per year, with at least a further 40, 000 slight casualties ( based on 1982-84 average RTA figures ) . The total nurnber of on- and off-highway casualties is estirnated to be in the region of 200, 000 annually ( Re f . 2 ) .
2 . 2 casualty rates per distance travelled
Pedal-cyclist casualty rates , in terrns of casualties per io8 kilornetres travelled , vary considerably with age . The highest rates occur in the under-14 age group , and in fact the 5-9 age group has the highest casualty rates at all severity levels . The latter group , however, cycles only a marginal distance per week compared with that covered by the 10-14 year age band , and the nurnber of cycling casualties is correspondingly srnall.
An irnportant finding ( Ref . l ) is that cyclists in the high risk 10-14 year age band are at least as likely to be killed or seriously injured , per kilornetre travelled , as the average two wheeled rnotor vehicle rider ( ignoring any under-reporting of accidents in either category of transport ) . They are at significantly greater risk ( by around 30% ) , if under-reporting is allowed for .
2 . 3 Hospital loading due to bicycle accidents
In comparison with fatalities, non-fatal cycling injuries are not well documented in official statistics, and we have used hospital recor<ls to provide additional data on serious casualties . such data avoids the under-reporting problem of section 2 . 1 , and allows head injuries to be identified .
Information was provided by the East Anglia regional health authority for the years 1981-84, covering all cyclist and motorcyclist casualties Who attende<l accident and ernergency departments in the region ( population 1 . 77 M ) . The key findings are iternised below.
( i ) Annual nurnber of cycling casualties ( N ) , and the nurnber with head injury as rnajor cause of attendance ( N ' ) :
N ( 1981-84) = 754; N ' = 429 ; ( N ' /N ) = 0 . 57 av av av
Head injured cyclists rnake up 57% of hospital attendances, cornpared with 41% for motorcyclists ( i . e . TWMV users ) .
( i i ) The ratio R = N/P, where P is the nurnber of serious cycling casualties reported by the police for the same region :
238
( iii )
( iv )
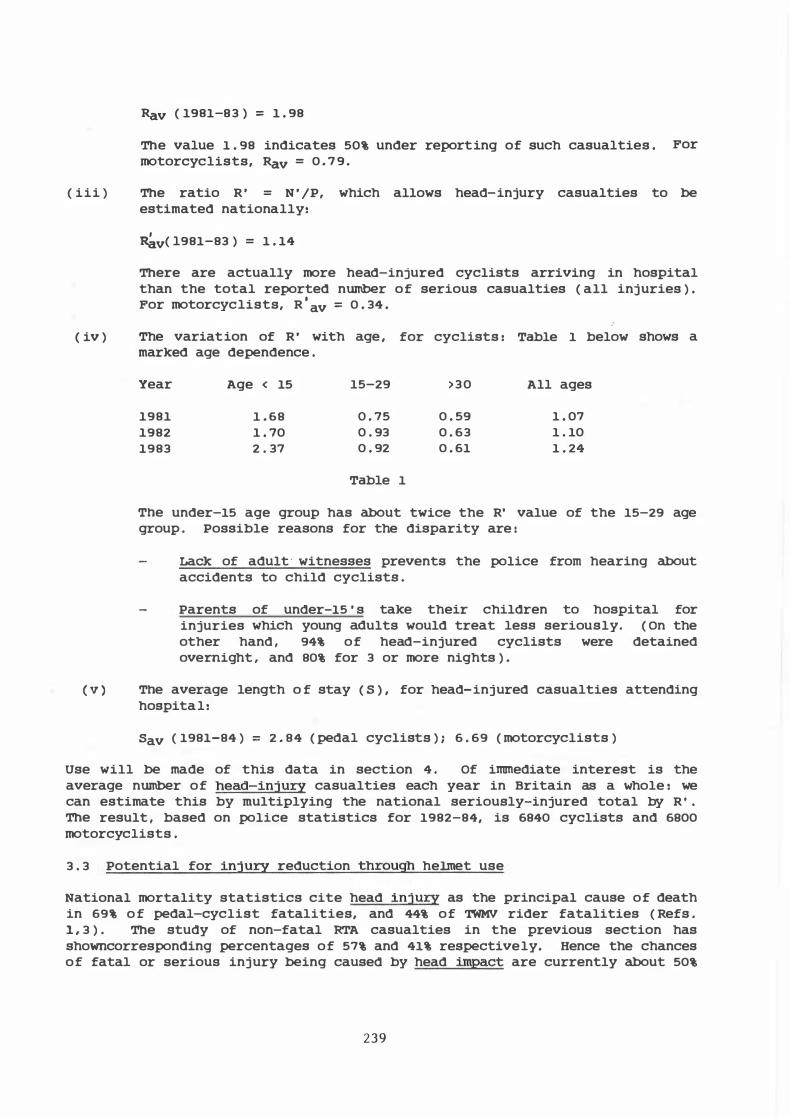
Ra.v ( 1981-83 ) = 1 . 98
The value 1 . 98 indicates 50\ under reporting of such casualties . For motorcyclists, Ra.v = 0 . 7 9 .
The ratio R ' = N ' /P, which allows head-injury casualties to be estimated nationally:
�v( l981-83 ) = 1 . 14
There are actually more head-injured cyclists arr1v1ng in hospital than the total reported nurnber of serious casualties ( all injuries ) . For motorcyclists, R
'av = 0 . 34 .
The variation of R ' with age , for cyclists : Table 1 below shows a marked age dependence .
Year Age < 15 15-29 >30 All ages
1981 1 . 68 0 . 75 0 . 59 1 . 07 1982 1 . 70 0 . 93 0 . 63 1 . 10 1983 2 . 37 0 . 92 0 . 61 1 . 24
Table 1
The under-15 age group has about twice the R' value of the 15-29 age group . Possible reasons for the disparity are :
Lack of adult witnesses prevents the police frorn hearing about accidents to child cyclists .
Parents of under-15 ' s take their children to hospital for injuries which young adults would treat lese seriously. ( On the other hand , 94% of head-injured cyclists were detained overnight , and 80\ for 3 or more nights ) .
( V ) The average length o f stay ( S ) , for head-injured casualties attending hospital:
Sav ( 1981-84 ) = 2 . 84 ( pedal cyclists ) ; 6 . 69 ( motorcyclists )
Use will be rnade of this data in section 4 . Of inUnediate interest is the average nurnber of head-injury casualties each year in Britain as a whole : we can estimate this by rnultiplying the national seriously-injured total by R ' . The result , based on police statistics for 1982-84, is 6840 cyclists and 6800 motorcyclists .
3 . 3 Potential for injuIY reduction through helrnet use
National mortality statistics cite head injuIY as the principal cause of death in 69% o f pedal-cyclist fatalities, and 44\ of TWMV rider fatalities ( Refs . 1 , 3 ) . The study of non-fatal RTA casualties in the previous section has showncorresponding percentages of 57\ and 41% respectively. Hence the chances of fatal or serious injury being caused by head irnpact are currently about 50\
239
greater for cyclists than for TWMV riders , who already wear helrnets .
The efficacy of ha�-shell cycling helrnets in real crashes is ha� to predict, but the odds of death from head injuries Whilst cycling are estimated to be reduced by a factor of 19 if a • good ' hard-shell helrnet is worn ( Re f . 4 ) , and it is expected that similar reductions in lesser injuries would be obtained .
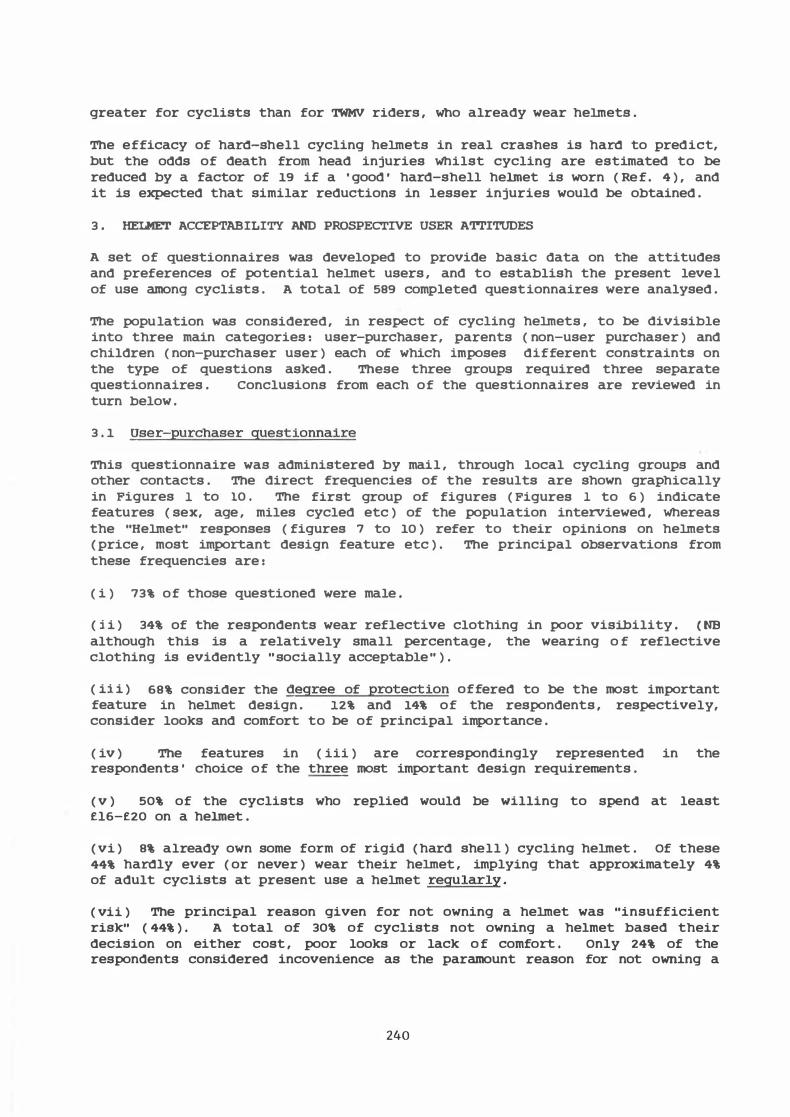
3 . HELMET ACCEPTABILITY AND PROSPECTIVE USER A'rl'ITUDES
A set of questionnaires was developed to provide basic data on the attitudes and preferences of potential helrnet users , and to establish the present level of use among cyclists . A total of 589 completed questionnaires were analysed .
The population was considered , in respect of cycling helrnets , to be divisible into three main categories : user-purchaser, parents ( non-user purchaser ) and children ( non-purchaser user ) each of which imposes different constraints on the type of questions asked . These three groups required three separate questionnaires . conclusions from each of the questionnaires are reviewed in turn below .
3 . 1 user-purchaser questionnaire
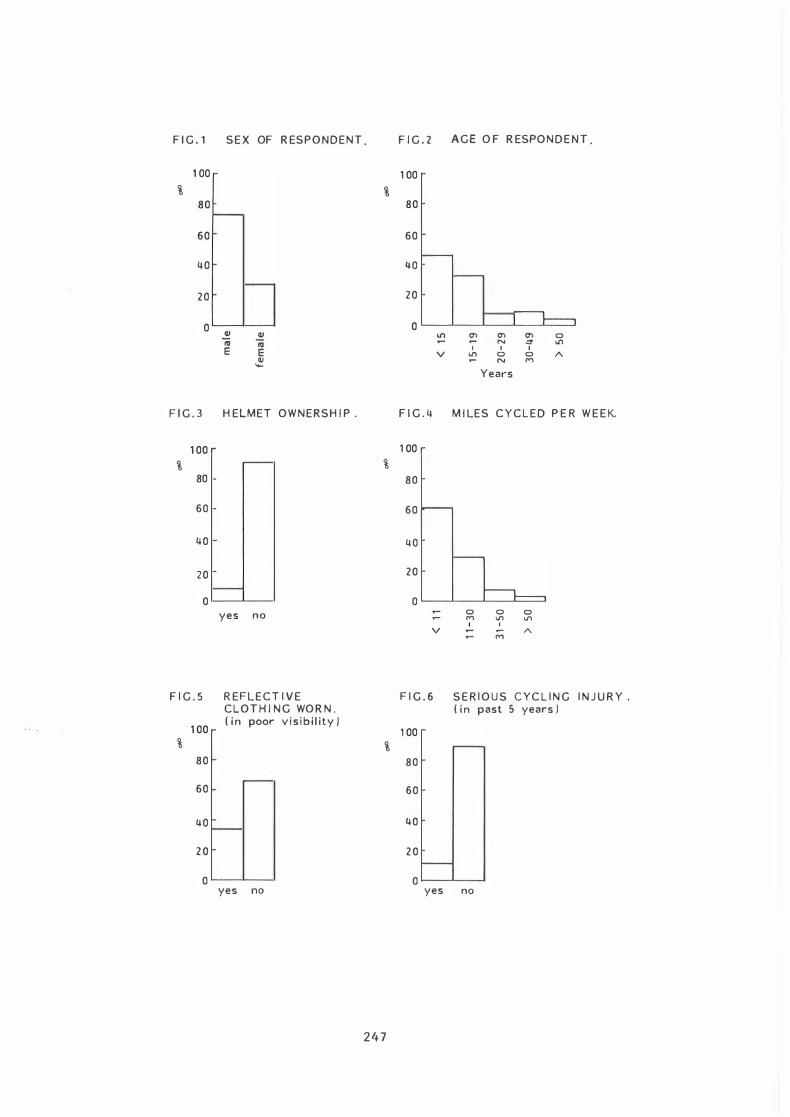
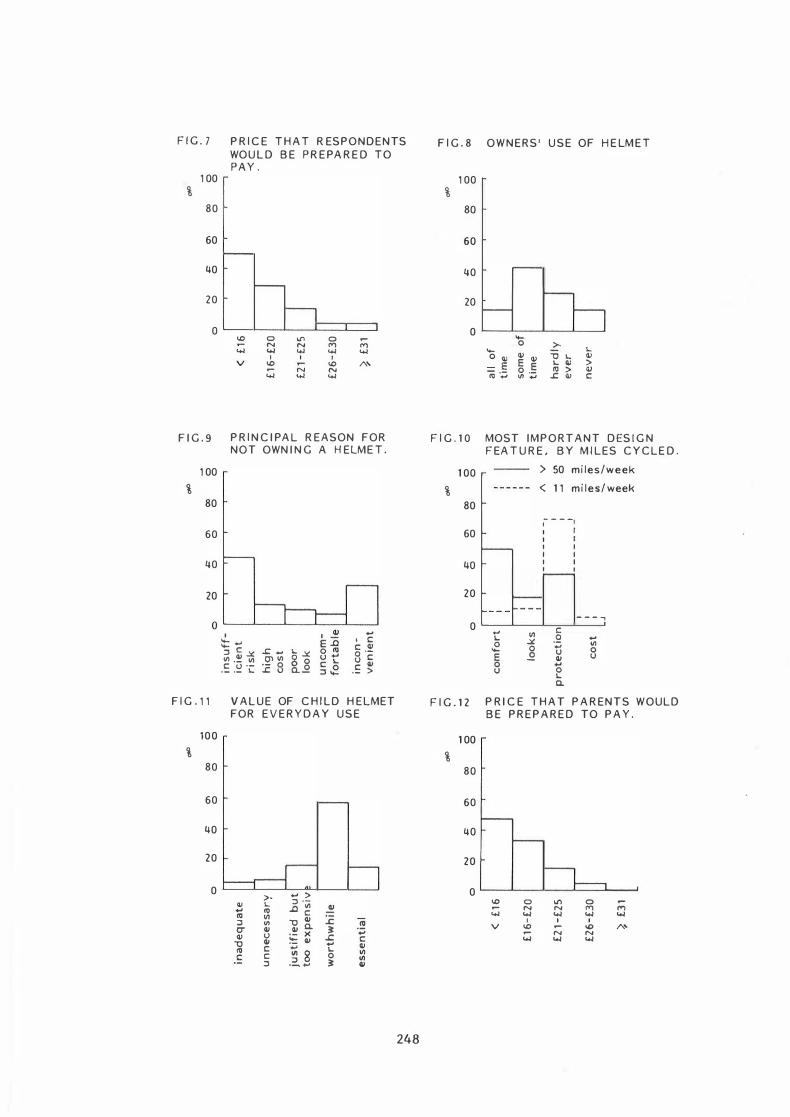
This questionnaire was administered by mail , through local cycling groups and other contacts . The direct frequencies of the results are shown graphically in Figures l to 10 . The first group of figures ( Figures l to 6 ) indicate features ( sex, age , miles cycled etc ) of the population interviewed , Whereas the "Helrnet" responses ( figures 7 to 10 ) refer to their opinions on helrnets ( price , most important design feature etc ) . The principal Observations from these frequencies are :
( i ) 73% of those questioned were male .
( i i ) 34% of the respondents wear reflective clothing in poor visibility . ( NB although this is a relatively small percentage , the wearing o f reflective clothing is evidently " socially acceptable " ) .
( ii i ) 68% consider the deqree of protection offered to be the most important feature in helrnet design . l.2% and 14% of the respondents , respectively, consider looks and comfort to be of principal importance .
( iv ) The features in ( iii ) are correspondingly represented in the respondents • choice of the three most important design requirements .
( v ) 50% of the cyclists who replied would be Willing to spend at least fl6-f20 on a helrnet .
( vi ) 8% already own some form of rigid ( hard shell ) cycling helrnet . Of these 44% ha�ly ever ( or never ) wear their helrnet , implying that approximately 4% of adult cyclists at present use a helrnet regularly .
( vii ) The principal reason given for not owning a helrnet was "insufficient risk" ( 44% ) . A total of 30% of cyclists not owning a helmet based their decision on either cost , poor looks or lack o f comfort . Only 24% of the respondents considered incovenience as the paramount reason for not owning a
240
helmet . It may be concluded that a rigid helmet would have an optimum marJcet of 76% of all cyclists in the user-purchaser category , given appropriate " risJc education" { advertising ) and suitable helmet design .
Possible connections between attitudes to helmet use and personal characteristics can be exarnined through use of cross-tabulations and significance tests ( e . g . does age affect the price that the respondent is Willing to pay for a helmet? ) .
From these cross-tabulations differences in attitude ernerge between different categories of cyclist . Thus it was demonstrated that women cyclists appear to be more safety conscious : a significantly higher proportion , at the 5% per cent leve l, selected "protection" as the most important helmet design feature . However , no significant difference was found in attitudes to helmet appearance as a controlling feature .
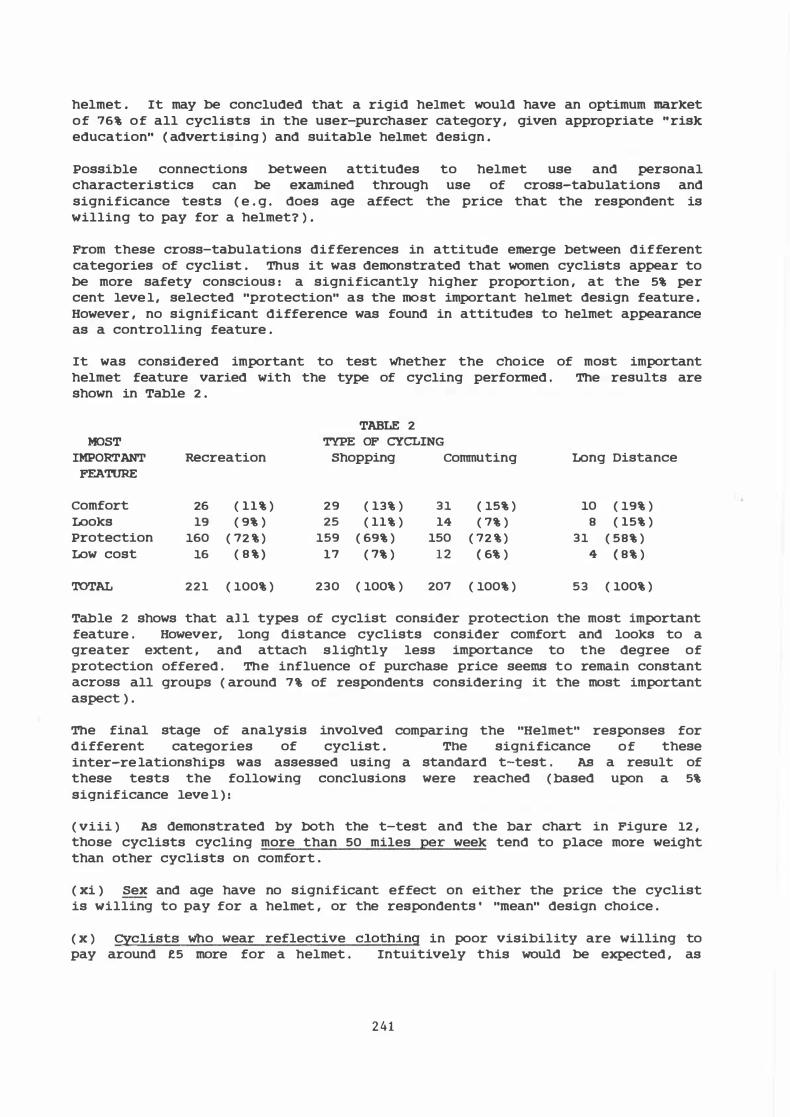
It was considered important to test Whether the choice of most important helmet feature varied with the type of cycling perforrned . The results are shown in Table 2 .
TABLE 2 MOST
IMPORTANT FEATURE
TYPE OF CYCLING
comfort Looks Protection Low cost
TOTAL
Recreation
26 ( 11% ) 19 ( 9% )
160 ( 72 % ) 16 ( 8 % )
221 ( 100% )
Shopping
29 ( 13% ) 25 ( 11% )
159 ( 69% ) 17 ( 7% )
230 ( 100% )
conunuting Lang Distance
31 ( 15% ) 10 ( 19% ) 14 ( 7% ) 8 ( 15% )
150 ( 72 % ) 31 ( 58% ) 12 { 6% ) 4 { 8% )
207 ( 100% ) 53 ( 100% )
Table 2 shows that all types of cyclist consider protection the most important feature . However, long distance cyclists consider cornfort and looks to a greater extent , and attach slightly less importance to the degree of protection offered . The influence of purchase price seerns to remain constant across all groups ( around 7% of respondents considering it the rnost important aspect ) .
comparing the "Helmet" responses for The final stage of analysis involved different categories of cyclist . inter-re lationships was assessed using a these tests the following conclusions significance leve l ) :
The significance of these standard t-test . AS a result of were reached ( based upon a 5%
( viii ) AS demonstrated by both the t-test and the bar chart in Figure 12 , those cyclists cycling more than 50 miles per week tend to place more weight than other cyclists on cornfort .
( xi ) Sex and age have no significant effect on either the price the cyclist is Willing to pay for a helmet , or the respondents • "rnean" design choice .
( x ) C:Vclists who wear reflective clothing in poor visibility are Willing to pay around f.5 rnore for a helmet . Intuitively this would be expected , as
241
cyclists who wear such clothing are generally more safety conscious .
( xi ) Those cyclists who had had a serious accident wi thin the previous 5 years were willing to pay around f5 more for a helmet.
( xi i ) Those cyclists Who cycle over 50 miles per week , compared with those who cycle less than 11 miles , were Willing to pay around flO more for a hel.met .
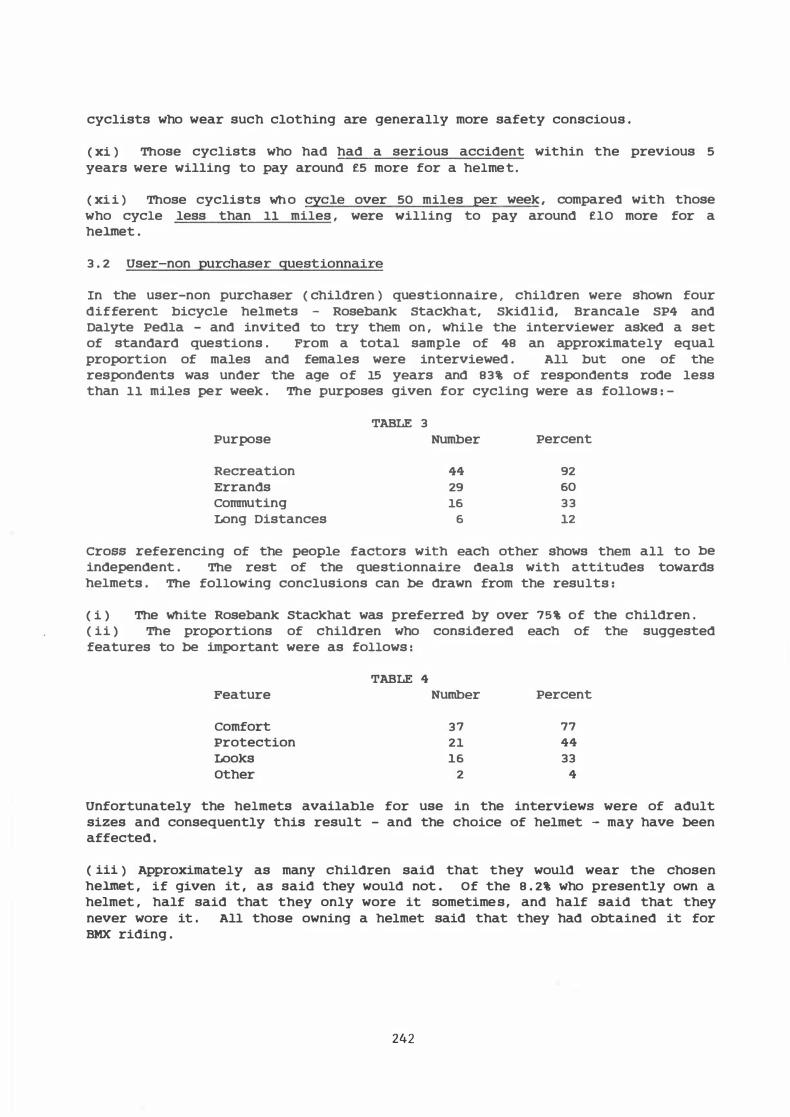
3 . 2 User-non purchaser guestionnaire
In the user-non purchaser ( children ) questionnaire , children were shown four different bicycle helmets - Rosebank stackhat, Skidlid, Brancale SP4 and Dalyte Pedla - and invited to try them on , while the interviewer asked a set of standard questions . From a total sample of 48 an approximately equal proportion of males and females were interviewed . All but one of the respondents was under the age of 15 years and 83% of respondents rode less than 11 miles per week . The purposes given for cycling were as follows : -
TABLE 3 Purpose Number Percent
Recreation 44 92 Errands 29 60 conunuting 16 33 Long Distances 6 12
Cross referencing of the people factors with each other shows thern all to be indepenc1ent . The rest of the questionnaire c1eals with attituc1es towarc1s helmets . The following conclusions can be drawn from the results :
( i ) The White Rosebank Stackhat was preferrec1 by over 75% of the chilc1ren . ( ii ) The proportions of children who considerec1 each of the suggested features to be important were as follows :
Feature
comfort Protection Looks Other
TABLE 4 Number
37 21 16
2
Percent
77 44 33
4
Unfortunately the helmets available for use in the interviewe were of adult sizes and consequently this result - and the choice of helmet - may have been affectec1 .
( iii ) Approximately as many children said that they would wear the chosen hel.met , if given it , as said they would not . Of the 8 . 2% who presently own a helmet , half said that they only wore it sometimes, and half said that they never wore it . All those owning a helmet said that they had obtained it for BMX riding .
242
OWing to the small sample , cross referencing of helmet and people factors does not produce statistically significant results . All of the cross tabulations can be found in Reference 1 , but the only significant observation is that 59% of ma.les said that they would wear a helmet if given one whilst only 36% of females gave this response .
3 . 3 Non-user purchaser guestionnaire
The sample characteristics for the non-user purchaser ( Parents ) questionnaire can be summarised as follows : -
( i ) The 107 families questioned had a total o f 191 children in the 8-16 year age group between them. There were 91 boys and 102 girls.
( ii ) 50 . 5% of the families had two children, and 38 . 2% a single child ( in this age group ) •
{ iii ) did .
Of the children, 1 1 . 1% of boys owned a helmet whilst only 2% of girls This probably reflects ownership of BMX helmets among boys .
{ iv ) In 88 . 9% of families none of the children owned a helmet , whilst in 2% some did and in 9 . 2% all did .
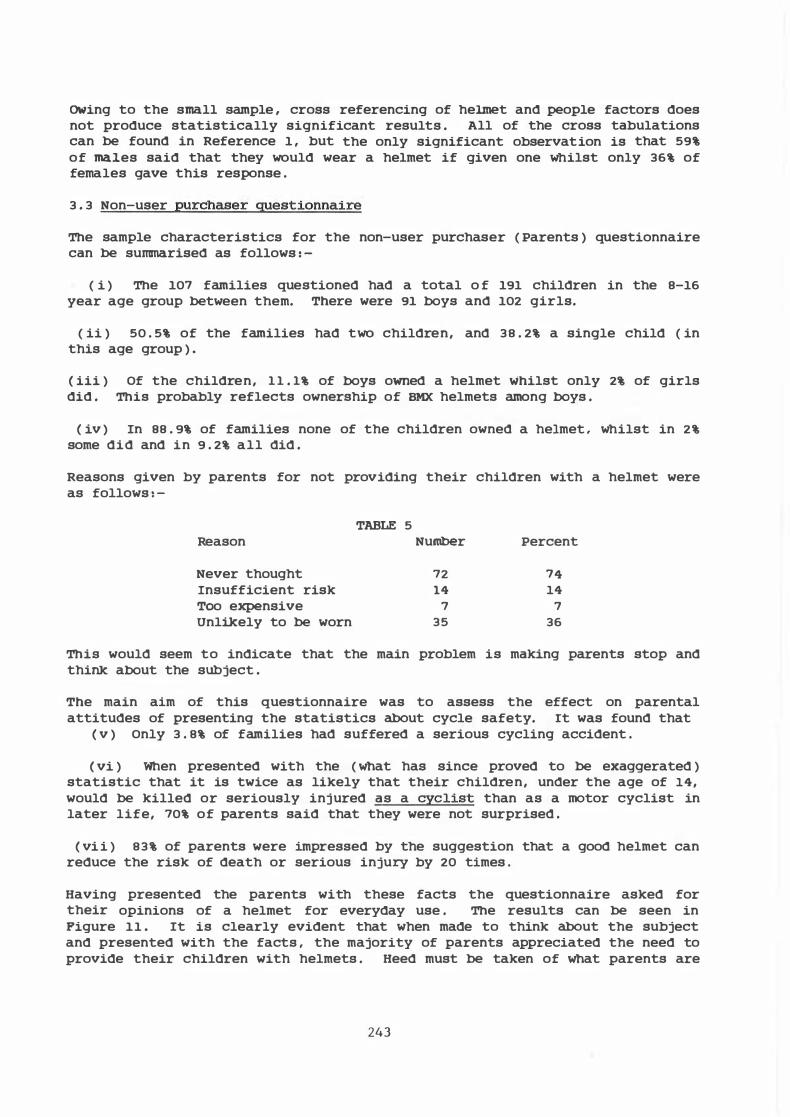
Reasons given by parents for not providing their children with a helmet were as follows : -
TABLE 5 Reason Number Percent
Never thought 72 74 Insufficient risk 14 14 TOo expensive 7 7 Unlikely to be worn 35 36
This would seem to indicate that the main problem is making parents stop and think about the subject .
The main aim of this questionnaire was to assess the effect on parental attitudes of presenting the statistics about cycle safety. rt was found that
{ v ) Only 3 . 8% of families had suffered a serious cycling accident .
{ vi ) When presented with the ( what has since proved to be exaggerated ) statistic that it is twice as likely that their children, under the age of 14, would be killed or seriously injured as a cyclist than as a motor cyclist in later life, 70% of parents said that they were not surprised .
{ vi i ) 83% of parents were impressed by the suggestion that a good helmet can reduce the risk of death or serious injury by 20 times .
Having presented the parents wi th these facts the questionnaire asked for their opinions of a helmet for everyday use . The resul ts can be seen in Pigure 11 . It is clearly evident that when made to think about the subject and presented with the facts , the majority of parents appreciated the need to provide their children with helmets . Heed must be taken of what parents are
243
prepared to pay , however; the limit is fl6-f20, if most parents are not to be deterred by price ( Figure 12 ) .
Cross referencing of helmet responses and family characteristics indicates that :
( viii ) The number of children in the family does not significantly affect the parents • attitudes towards helmets, and particularly the price that they would be prepared to pay for one .
( ix ) The parents of girls are no more concerned at the problem of the helmet not being worn than those of boys .
( x ) The fact of a serious cycling accident in the family does not change qualitative attitudes towards helmets , but all four of the families in this category were prepared to pay at least fl6-f20 for a helmet .
It was also demonstrated that approximately 50% of children would always/sometimes wear a helmet if given it . This corresponds to the 56% wearing rate obtained frorn user-purchaser helmet owners .
4 . COSTS OF CYCLING HEAD INJURIES AND PROSPECTS FOR REDUCTION
The data from sections 2 anci 3 rnay now be cornbined , in orcier to assess the economic case for bicycle helmet use by ordinary cyclists .
Of the various costs incurreci through cycling road accic1ents , those which are capable of reciuction via helmet use are :
( i ) ( ii )
( iii )
( iv )
LOss of output ciue to cieath or injury Ambulance anci medical treatment costs The costs of pain , grief and suffering ( PGS ) to relatives , friencis anci colleagues of the casualty PGS costs to the casualty directly .
Estimates are given below for iterns ( i ) and ( ii ) . Itern ( iii ) represents the value of the injureci person to the co:mmunity, over and above their paid output . Itern ( i v ) reflects the person • s value to thernselves . we rnake no atternpt to quantify these last two iterns , but return to thern in the final discussion.
4 . 1 Avoidable costs of head injuries to cyclists
Table 6 below sets out estimated annual costs for the three severity categories - fatal , serious and slight - used for road accidents by the UK Departrnent of Transport . The costs relate to pedal cyclists ( aged over 5 ) whose rnain injury is a head injury. Off-road accidents are not included .
244
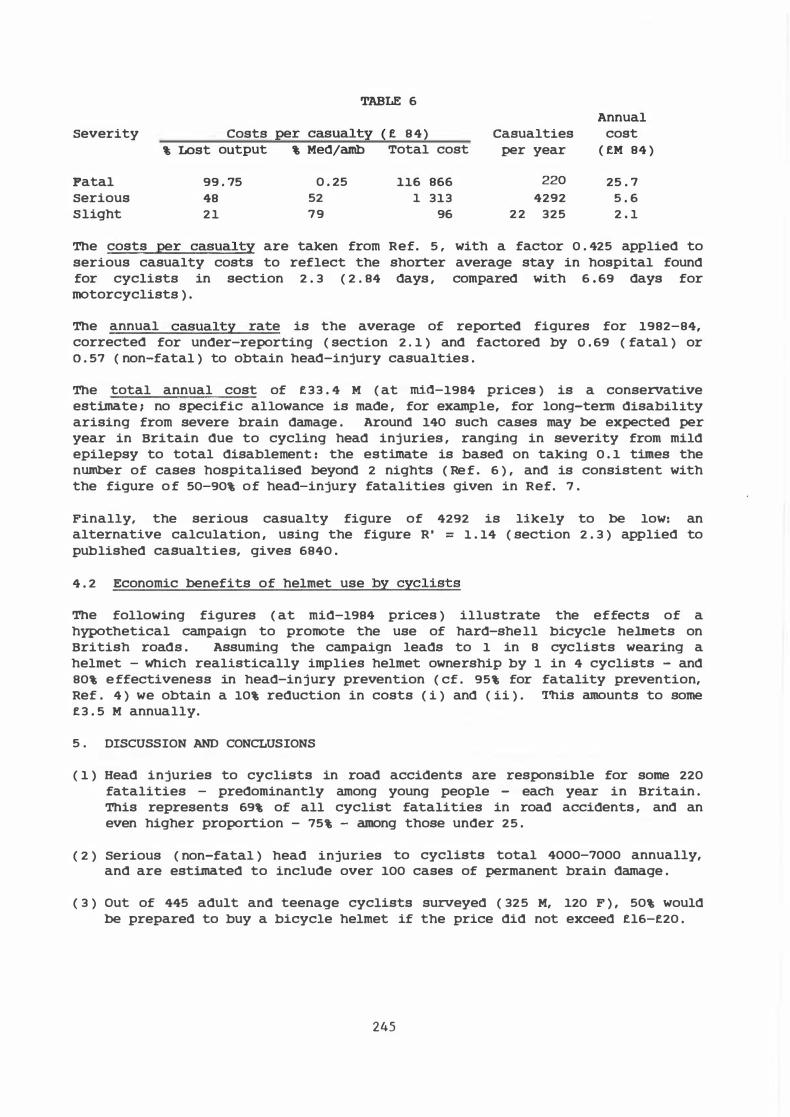
TABLE 6 Annual
severity costs per casualt:i: �f 8 4 ) casualties cost % Lost olitput % Med/amb Total cost per year ( fM 84 )
Fatal 99 , 75 0 . 25 116 866 220 25 . 7 serious 48 52 1 313 4292 5 . 6 Slight 21 79 96 2 2 325 2 . 1
The costs per casualty are taken frorn Ref. 5 , with a factor 0 . 425 applied to serious casualty costs to reflect the shorter average stay in hospital found for cyclists in section 2 . 3 ( 2 . 84 days , cornpared with 6 . 69 days for motorcyclists ) .
The annual casualty rate is the average of reported figures for 1982-84, corrected for under-reporting ( section 2 . 1 ) and factored by o . 69 ( fatal ) or o . 57 ( non-fatal ) to obtain head-injury casualties .
The total annual cost of f33 . 4 M ( at rnHJ-1984 prices ) is a conservative estirnate ; no specific allowance is made , for example, for long-terrn d1sab111ty arising frorn severe brain darnage . Around 140 such cases may be expected per year in Britain due to cycling head injuries , ranging in severity frorn mild epilepsy to total disablernent : the estirnate is based on taking 0 . 1 tirnes the nurnber of cases hospitalised beyond 2 nights ( Re f . 6 ) , and is consistent with the figure o f 50-90% of head-injury fatalities given in Ref. 7 .
Finally, the serious casualty figure of 4292 is likely to be low: an alternative calculation , using the figure R' = 1 . 14 ( section 2 . 3 ) applied to published casualties, gives 6840 .
4 . 2 Econornic benefits of helmet use by cyclists
The following figures ( at rnid-1984 prices ) illustrate the effects of a hypothetical carnpaign to promote the use of hard-shell bicycle helmets on British roads . Assuming the carnpaign leads to 1 in 8 cyclists wearing a helmet - which realistically irnplies helmet ownership by 1 in 4 cyclists - and 80% e ffectiveness in head-injury prevention ( cf . 95% for fatality prevention, Ref . 4 ) we obtain a 10% reduction in costs ( i ) and ( ii ) . This arnounts to sorne f3 . 5 M annually.
5 • DISCUSSION AND CONCLUSIONS
( 1 ) Head injuries to cyclists in road accidents are responsible for sorne 220 fatalities - predorninantly arnong young people - each year in Britain . This represents 69% of all cyclist fatalities in road accidents , and an even higher proportion - 75% - arnong those under 25 .
( 2 ) serious ( non-fatal ) head injuries to cyclists total 4000-7000 annually, and are estirnated to include over 100 cases of permanent brain darnage .
( 3 ) out of 445 adult and teenage cyclists surveyed ( 325 M, 120 F ) , 50% would be prepared to buy a bicycle helmet if the price did not exceed fl6-f20 .
245
( 4 ) "Insufficient risk" was given as the main reason for not owning a helmet by 44% of these cyclists .
( 5 ) Promotion of a helmet that would be worn by 1 in 8 cyclists on British roads would save f3 . 5M pe r year in head inj ury costs ( representing lost output and medical services ) .
( 6 ) An additional incentive , particularly applicable to parents, is the prospect of pain, grief and suffering avoided . In a survey of 107 families with children under 12 , two-thirds had never thought about providing a helmet for their children to wear while cycling; after reading some of the statistical facts, 73% said they thought a helmet worthwhile/essential .
( 7 ) Finally, the cyclist • s valuation of his/her own life would almost certainly extend to the cost of purchasing a high-quality helmet , in the case of the safety-conscious 1 in 4 at whom a promotional campaign might initially be aimed . A possible means of increasing ownership still further would be to use part of the f3 . 5M cost savings as a helmet subsidy to purchasers rather than for direct publicity .
REFERENCES
1 . COLYER, M. M. , BALLAM, J . C . P . , HUI , K. , LEWIS, G . D . W. , and THORPE, J . E . ( 1986 ) . 4-year course multidisciplinary project report ( May 1986 ) , Faculty of Engineering and Applied Science , University of southampton . Marketing assessment for bicycle helmets in the UK .
2 . 1'0RRELL, J . ( 1986 ) . Personal communication ( Senior Registrar in Accident and Emergency , Queen Alexandra Hospital , Portsmouth ) .
3 . AVERY, J . G . ( 1984 ) . Report of the PACTS working party on head protection for cycl.ists . Presented Nov. 6 , 1984 to the Parliamentary Advisory council for Transport Safety ( Chairman : Barry Sheerman , MP ) .
4 . DORSCH, M.M. , 1IOODllARD, A . J . , and SOMERS , R.L. , ( 1982 ) . 00 bicycle safety helmets reduce severity of head injury in real crashes? - Joint report of the North and MRC Road Accident Research Unit and Department of community Medicine , university of Ade laide , south Australia .
5 . DEPAR'l'MEN'l' OP 'l'RANSPOR'l', tnt ( 1985 ) . Highway Economics Note No 1 (September 1985) . Road accident costs 1984 . ( supplementary breakdowns supplied by DTp , July 1986 ) .
6 . .J.EifHE"I•r, B . ( 1975 ) . Epil.epsv after Non-missile Head Injuries . London : Heineman Medical , 95 .
7 . MllIP ( 1985 ) . Publicity l.eaflet , us National Head Injury Foundation, Ohio Association Inc .
246
F I G . 1 S E X OF R ES P O N D E N T . F I G . 2 A G E O F R ESPO N D E N T .
1 00 1 00
% % 80 80
60 60
40 40
20 20
0 0 � Qj ...... C7> C7> C7> 0 III III - N j ......
1 1 1 E E V � 0 0 /\ Qj N M ....
Years
F I G . 3 H ELMET O W N E R S H I P . F I G . 4 M I LES C Y C L E D P E R W E E K
1 00 1 00
% % 80 80
60 60
40 40
20 20
0 0
yes no 0 0 0 M ...... ...... 1 1 V ;;:; /\
F I G . 5 R EF L E C T I VE F I G . 6 S E R I O U S C YC L I N G I N J U R Y . C L O T H I N G WO R N . ( i n past 5 years J
1 00 ( i n poor v i s i b i l ity )
1 00 % %
80 80
60 60
40 40
2 0 2 0
0 0 yes no yes no
247
F I G . 7
1 00
% 80
60
40
20
0
P R I C E T H A T R ESPONDENTS WOU L D B E P R E PA R E D TO P A Y .
<O 0 "' 0 -N N M M "" "" "" "" "" 1 1 1
V <O <O ""' - N N "" "" ""
F I G . 9 P R I N C I PA L R EASON FOR NOT OWN I N G A H ELME T .
1 00
% 80
60
40
20
F I G . 1 1
100
% 80
60
40
20
0
1 � ... ::i C � .t:; .., L � II) .� II) Ol 111 8 0 c u ·- ·- 0 0 ·- ·- L .I: U Q. -
... 1 c c llJ o ·
u c c llJ
·- >
V A L U E OF C H I LD H ELMET FOR E V E R Y D A Y U S E
... > >-llJ L ::i ·-... .,, ..0 II) � .,, II)
c llJ .I: :J II) " Q. .,, r::r llJ llJ � ·� llJ u � X .I: c " llJ llJ ... llJ c ... L .,, � 8 II) c c 0 Ul :J ._ ... � llJ
248
F I G . 8 O W N E R S' U S E OF H E LM E T
1 00
% 80
60
40
20
0 .... 0 >-.... L
0 llJ llJ llJ "tl L llJ
- .§ E E L llJ > 0 ·- .,, > llJ .,, ... II) ... .I: llJ c
F I G . 1 0 MOST I M P O R T A N T DES I G N F EA T U R E , B Y M I LES C Y C LE D .
1 00
% 80
60
40
20
0 ... L II)
0 � .... 0 E .2 0 u
> 50 miles/week < 1 1 miles/ week
1- - - -,
c:
.2 ... u llJ ... 0 L a.
1 1
- - - -, ... II) 0 u
F I G . 1 2 P R I C E T H A T P A R EN T S WOULD B E P R E P A R E D TO P A Y .
1 00
% 80
60
40
20
0 <O 0 "' 0 -- N N M M "" "" "" "" ""
1 1 1 V <O - <O ""' - N N "" "" ""