Embed Size (px)
Citation preview
THIS REPORT CONTAINS ASSESSMENTS OF COMMODITY AND TRADE ISSUES MADE BY
USDA STAFF AND NOT NECESSARILY STATEMENTS OF OFFICIAL U.S. GOVERNMENT
POLICY
Date:
GAIN Report Number:
Approved By:
Prepared By:
Report Highlights:
The sudden drop in consumption experienced in 2008/09 was followed by stabilization in 2010/11.
Agricultural and food product markets were slowly recovering in 2011. The Ukrainian retail and
food processing sectors are surviving difficult times. Ukraine is the second largest market for US
products after Russia among the former Soviet Union countries. The trading environment remains
complicated and non-transparent. Potential exporters are advised to secure an experienced
Ukrainian partner with established contacts who is capable of navigating the myriad obstacles
facing imported agricultural products.
Post:
Kiev
Oleksandr Tarassevych,
Agricultural Specialist
Randall Hager
Annual Report
Exporter Guide
Ukraine
UP1147
12/9/2011
Required Report - public distribution
SECTION I. MARKET OVERVIEW
Macroeconomic performance and other indicators Despite a lack of economic reforms throughout the 2000’s, in 2010 Ukraine’s macroeconomic
indicators had stabilized and in 2011 demonstrated modest growth despite a rather turbulent world
economic environment. The growth came after a significant economic decline caused by loose
domestic financial policies and the world financial crisis. Ukrainian trade in food products developed
rapidly over the past seven years. In the past this growth had been driven by a strong economy
and by an increase in consumer incomes. The October 2008 financial crisis ended these rapid
expansion trends and opened a period of new developments in Ukrainian agricultural and food
markets. Ukraine’s currency, the Hryvna (UAH), lost 63 percent of its value against the US dollar
before stabilizing in the early fall of 2009. This drop significantly reduced the attractiveness of
imported food products or Ukrainian consumers.
In 2011, expected GDP growth is around 4.8 percent. This continues the positive developments of
2010, but most of the growth comes from exports of raw materials and depends on world
markets. The economic situation in the domestic market remains worrisome. The performance of
the food sector is tied to performance of the rest of the economy and consumer incomes.
Developments in 2011 have been turbulent: due to state budget income shortage the Government
of Ukraine (GOU) reduced or eliminated many expensive socially oriented programs. In prior
years, these programs cushioned the impact of the financial crisis on the population. In 2010/11
the GOU conducted tax and administrative reforms. Both had mixed success and contributed to
already cumbersome business environment. Despite financial hardships, the GOU and
international organizations agree on a GDP growth forecast in 2012 of a modest 2-3 percent.
Together with social program reductions, this forecast gives little chance for consumer income
growth and large scale recovery of the trade in food.
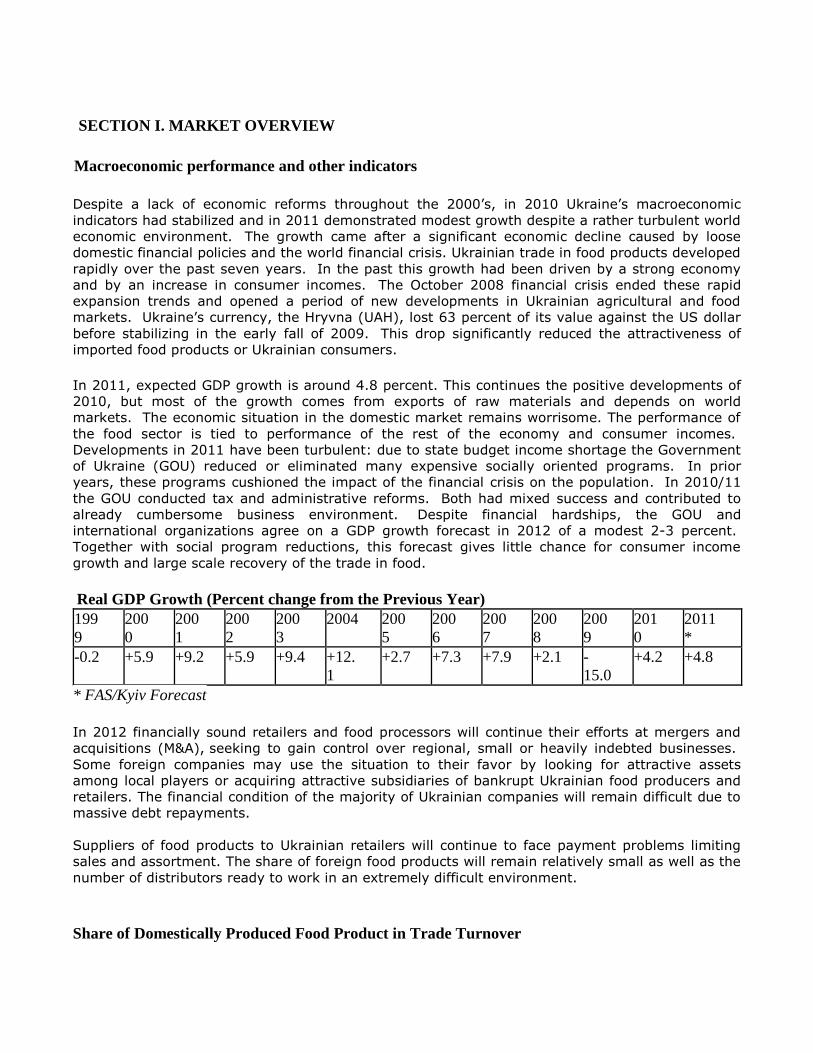
Real GDP Growth (Percent change from the Previous Year)
199
9 200
0 200
1 200
2 200
3 2004 200
5 200
6 200
7 200
8 200
9 201
0 2011
*
-0.2 +5.9 +9.2 +5.9 +9.4 +12.
1 +2.7 +7.3 +7.9 +2.1 -
15.0 +4.2 +4.8
* FAS/Kyiv Forecast
In 2012 financially sound retailers and food processors will continue their efforts at mergers and
acquisitions (M&A), seeking to gain control over regional, small or heavily indebted businesses.
Some foreign companies may use the situation to their favor by looking for attractive assets
among local players or acquiring attractive subsidiaries of bankrupt Ukrainian food producers and
retailers. The financial condition of the majority of Ukrainian companies will remain difficult due to
massive debt repayments.
Suppliers of food products to Ukrainian retailers will continue to face payment problems limiting
sales and assortment. The share of foreign food products will remain relatively small as well as the
number of distributors ready to work in an extremely difficult environment.
Share of Domestically Produced Food Product in Trade Turnover
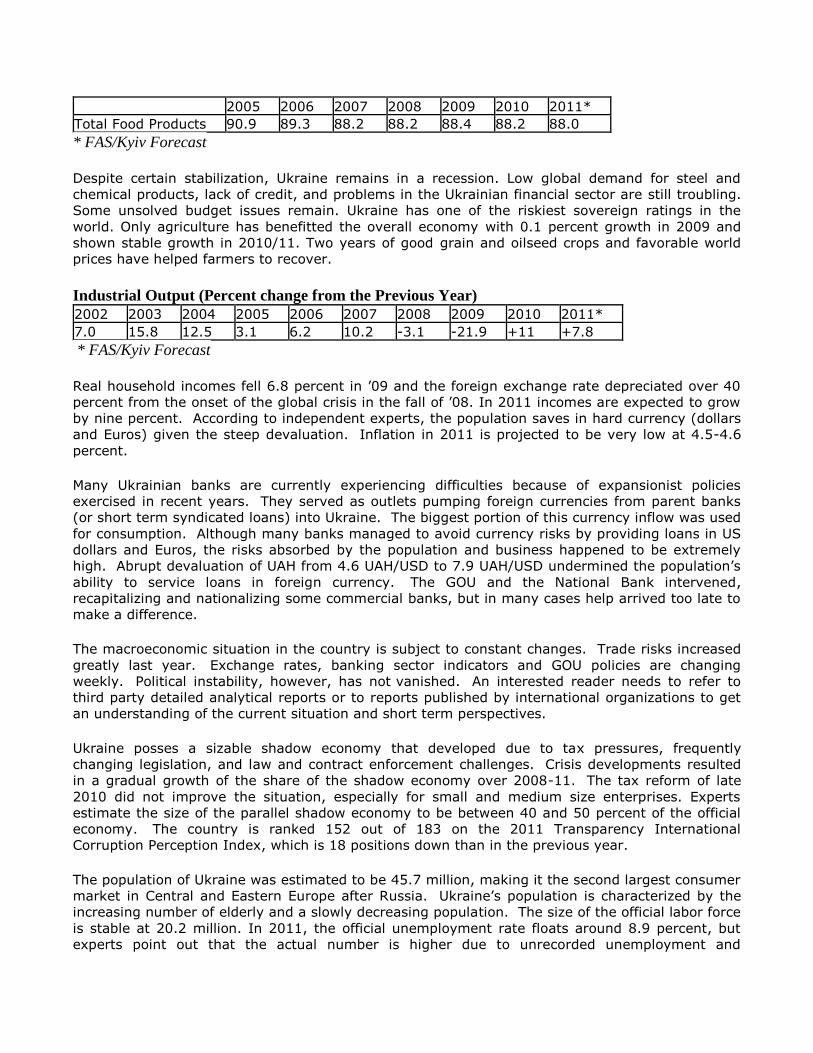
2005 2006 2007 2008 2009 2010 2011*
Total Food Products 90.9 89.3 88.2 88.2 88.4 88.2 88.0
* FAS/Kyiv Forecast Despite certain stabilization, Ukraine remains in a recession. Low global demand for steel and
chemical products, lack of credit, and problems in the Ukrainian financial sector are still troubling.
Some unsolved budget issues remain. Ukraine has one of the riskiest sovereign ratings in the
world. Only agriculture has benefitted the overall economy with 0.1 percent growth in 2009 and
shown stable growth in 2010/11. Two years of good grain and oilseed crops and favorable world
prices have helped farmers to recover.
Industrial Output (Percent change from the Previous Year) 2002 2003 2004 2005 2006 2007 2008 2009 2010 2011*
7.0 15.8 12.5 3.1 6.2 10.2 -3.1 -21.9 +11 +7.8
* FAS/Kyiv Forecast
Real household incomes fell 6.8 percent in ’09 and the foreign exchange rate depreciated over 40
percent from the onset of the global crisis in the fall of ’08. In 2011 incomes are expected to grow
by nine percent. According to independent experts, the population saves in hard currency (dollars
and Euros) given the steep devaluation. Inflation in 2011 is projected to be very low at 4.5-4.6
percent.
Many Ukrainian banks are currently experiencing difficulties because of expansionist policies
exercised in recent years. They served as outlets pumping foreign currencies from parent banks
(or short term syndicated loans) into Ukraine. The biggest portion of this currency inflow was used
for consumption. Although many banks managed to avoid currency risks by providing loans in US
dollars and Euros, the risks absorbed by the population and business happened to be extremely
high. Abrupt devaluation of UAH from 4.6 UAH/USD to 7.9 UAH/USD undermined the population’s
ability to service loans in foreign currency. The GOU and the National Bank intervened,
recapitalizing and nationalizing some commercial banks, but in many cases help arrived too late to
make a difference.
The macroeconomic situation in the country is subject to constant changes. Trade risks increased
greatly last year. Exchange rates, banking sector indicators and GOU policies are changing
weekly. Political instability, however, has not vanished. An interested reader needs to refer to
third party detailed analytical reports or to reports published by international organizations to get
an understanding of the current situation and short term perspectives.
Ukraine posses a sizable shadow economy that developed due to tax pressures, frequently
changing legislation, and law and contract enforcement challenges. Crisis developments resulted
in a gradual growth of the share of the shadow economy over 2008-11. The tax reform of late
2010 did not improve the situation, especially for small and medium size enterprises. Experts
estimate the size of the parallel shadow economy to be between 40 and 50 percent of the official
economy. The country is ranked 152 out of 183 on the 2011 Transparency International
Corruption Perception Index, which is 18 positions down than in the previous year.
The population of Ukraine was estimated to be 45.7 million, making it the second largest consumer
market in Central and Eastern Europe after Russia. Ukraine’s population is characterized by the
increasing number of elderly and a slowly decreasing population. The size of the official labor force
is stable at 20.2 million. In 2011, the official unemployment rate floats around 8.9 percent, but
experts point out that the actual number is higher due to unrecorded unemployment and
underemployment, especially in rural areas. Stabilized real incomes and demand drove the
stabilization in the domestic consumer market.
Ukraine joined the World Trade Organization (WTO) on May 16, 2008, decreasing most agricultural
import duties to previously negotiated levels. The country is also bound by international
agreements on Technical Barriers to Trade and Sanitary and Phytosanitary measures. Ukraine is on
the final stage of Free Trade Agreement (FTA) negotiations with the EU and framework FTA with
the Custom union Countries (Russia, Kazakhstan and Belarus).
Because of relatively low incomes and nearly 60 percent currency devaluation in 2008-10, the sale
of the vast majority of U.S. food products available on the Ukrainian market is limited. Most U.S.
products are of premium quality and value added and found in some niche markets frequented by
wealthy consumers (1.5-1.8 percent of the Ukrainian population) and the growing middle class
(13-17 percent of the population). Concomitantly, the rapid development of the Ukrainian food
processing industry is opening the door for U.S. ingredient suppliers.
Ukraine is endowed with inputs critical to establishing a strong agricultural sector. If the
government is able to sustain reforms designed to increase farm efficiency and stimulate growth,
then Ukrainian agriculture will continue to grow. However, it is important to note that policy
makers are still applying administrative controls that limit the increase of agricultural and food
prices or limiting market development. Opponents to these measures are attempting to prevent
implementation of many of these provisions because they will decrease farm efficiency, be a
disincentive to investment, drain the national treasury, and are WTO inconsistent.
Retail trade For most of the last decade a buoyant economy and strong growth in the local food retail sector
contributed to an increase in sales of processed food products. The number of supermarkets and
hypermarkets continued to expand up to the crisis. In 2002, the retail network was comprised of
approximately 600 hypermarkets and supermarkets. By 2010, the number of outlets expanded
significantly due to the overwhelming acceptance of them by consumers. Ukrainian supermarkets
maintain the widest product mix and the largest proportion of imported products. Despite the
rapid expansion of supermarkets in large urban areas, many food products continue to be sold
through open-air markets and small convenience stores. 2010 FAS Retail Trade Report provides a
detailed description of Ukraine’s retail sector.
Foreign trade Upon accession to the WTO Ukraine decreased its import duties to reasonable levels. However it
still maintains veterinary and sanitary control. Some existing standards and veterinary regulations
have complicated trade in U.S. ready-to-eat products, food ingredients, fish, poultry, red meats,
animal genetics, and live animals. Abolishment of most of these trade barriers is yet to be done
to bring the country in compliance with WTO rules. All these non-tariff barriers to trade add to
high distribution and shipping costs. Custom valuation of the imported products remains to be the
biggest problem for U.S. exporters.
Because Ukraine signed FTAs with Macedonia, Russia and other countries within the
Commonwealth of Independent States (CIS), food and some agricultural products from these
countries have price advantages over imported products from the United States. It must be noted
that many of these FTAs contain multiple exceptions (especially for agricultural products) that
decrease their role. A finalized FTA with the EU could have much bigger impact as many EU food
products are in direct competition with the U.S. Despite the U.S. capturing a relatively small share
of the trade, in 2010 U.S. agricultural exports reached $245 million. The opening of the Ukrainian
red meat market in the end of 2008 and WTO accession further facilitated trade growth for U.S.
products. (Note: These are official numbers that fail to capture products imported through the
shadow economy.)
Despite the crisis, Ukraine will continue to be a major exporter of food and agricultural products,
especially within the CIS region. Since the late 1990’s, Ukraine has become an established
supplier of grains and oilseeds to the world market. Recent developments suggest that Ukraine
can also become a major poultry supplier. Most Ukrainian grain is sold to the Near East, Eastern
Europe, and EU countries. Once sizable, exports of dairy products from Ukraine are decreasing
due to a shrinking cattle population. Exports of processed and high value added products are not
significant, but growing.
Advantages and Challenges Facing U.S. Products
Advantages Challenges
Structural changes in consumption lead to
greater demand for value added food
products.
High trade risks due to volatile exchange rate
and political instability in the country.
Investment growth in the food processing
industry increases demand for additives and
other ingredients not produced in Ukraine.
Strong competition in the local market from
domestic producers and increasing imports from
CIS (mainly from Russia), EU and Baltic
countries.
Joining the WTO made access for imported
goods easier.
Long-established consumer preference for
domestic fresh products with no additives.
Current veterinary requirements impede the
import of red meat and biotech products.
Growth of international fast food and
restaurant chains in Ukraine that use
standard procurement systems and that
source food ingredients from the U.S.
High distribution, shipping costs and technical
barriers to trade.
The retail sector is looking for innovative
high value added food imports.
Low awareness of U.S. products; extremely low
presence of U.S. products on the shelves of
supermarkets and discounters.
U.S. food and agricultural products traditionally suffer from low customer awareness in Ukraine.
Several constraints and misconceptions have contributed to the small market presence of U.S.
foods:
U.S. companies have little reliable information about the country, current market
opportunities and potential business partners.
Minimum quantities offered for export are often too large for the Ukrainian market.
A perception that persists among Ukrainian importers is that landed costs of U.S. products
are higher relative to European products due to higher transportation costs.
The perception that U.S. exporters are simply too far away to follow market trends and
service the Ukrainian market.
SECTION II. EXPORTER BUSINESS TIPS
Local Business Practices and Customs
Entry Strategy
There is no single market entry strategy recommended for new-to-market exporters. First, the
exporter should define whether Ukraine is a major market for the product, or if only occasional
deliveries will be made. The following factors should be considered:
Market product need, given consumers income trend and particular food sector
development prospects (separate market research in order to assess product prospects
maybe required);
Availability of similar domestically produced products, (often Ukrainian producers are
effective in building barriers to trade by lobbying the GOU, Parliament, veterinary or health
inspection services).
Calculation of the landed cost of a product in order to make price comparisons vis-à-vis
competitors.
Availability of similar products from EU or FSU suppliers. Also, comparative advantages /
disadvantages of U.S. products relative to products from major competitors (e.g. quality,
price, transportation expenses, packaging, labeling, etc.)
Availability of a local distributor familiar with the product. It is advisable to initiate personal
contact in order to discuss marketing strategies, funding for advertising, slotting
allowances, BTL in-store promotions, tasting and sampling events. Suppliers may also
want to consider trade fair participation to increase awareness of their products.
Tariff and non-tariff regulations affecting the product. (Note: in some cases large Ukrainian
food producers lobby for tariff reductions for much-needed ingredients and can settle
veterinary or SPS problems should they arise.)
Currently, almost all U.S. food and agricultural product exporters work through a Ukraine-based
subsidiary, importer or through the procurement service of the buyer (the latter is the most
convenient if there are only two or three potential buyers). Local distributors are more flexible,
usually have established marketing channels and can provide local customers with short-term (5-
30 days) credits in kind. Recently due to crisis developments in Ukraine’s retail sector credits in
kind tend to grow in length from 21-30 days (on average three years ago) to six months. Many
Ukrainian retailers are surviving on the expense of importers and local distributors. Due to
unavailability of other sales channels for many imported products distributors have no other option
but to concur on new terms. Trend for financing of the retailers from the distributors’ pocket was
also notable before the crisis, but now this practice became widespread.
Importers are also responsible for the entire logistical chain and inland transportation. Due to
frequent changes in Ukrainian legislation, non-transparent custom clearance rules, SPS and
veterinary procedures, it is recommended that the Ukrainian partner handle all logistics. Some
Ukrainian distributors have already established representative offices in major exporting countries.
U.S. companies should approach potential Ukrainian partners with due diligence. While
information on Ukrainian companies has improved, there is still a significant dearth of background
data and credit histories on potential Ukrainian distributors. This presents the greatest obstacle to
finding reliable, competent distributors. In order to obtain a due diligence report on a potential
Ukrainian partner, a U.S. company is advised to contact either a law firm or an internationally
accredited financial service company. It is advised that all U.S. companies consider legal counsel
before and while doing business in Ukraine. Ukrainian laws and regulations are vague and open to
interpretation. U.S. businesses are advised that establishing a partnership with a Ukrainian
company is a challenge that is beyond the control of the U.S. partner and his legal advisors.
If the Ukrainian market looks promising, establishing a representative office is recommended to
deal with buyers directly. Personal relationships are very important in Ukrainian business
practices and often problems cannot be effectively resolved over the phone. It is a very common
practice in Ukraine to purchase inputs directly from the producer. Even if the exporter’s policy
requires importers to work through the foreign-based distributor, most Ukrainian partners will still
attempt to contact and work directly with the producer. In the past, many U.S. companies dealt
with Ukrainian partners through a Russian-based representative office (usually in Moscow). This is
no longer the case because trade regulations and laws that were once common between the two
nations differ more and more. (Note: the Ukrainian food ingredient market is small at the moment
and relatively few products can justify a representative office in Kyiv).
Select U.S. products may also enter the Ukrainian market through a different route; via a Ukraine-
based U.S. intermediary able to manage the distribution scheme more efficiently than a Ukrainian
importer. This is vital if the Ukrainian importer lacks technical skills and expertise in product
promotion.
Exporters of high value-added products must note that larger Ukrainian retail chains use their own
procurement centers. Few wholesalers undertake nationwide distribution, and very few carry a
complete range of products. In many cases, supplier choices are based on informal personal
relationships and ownership ties, rather than driven by quality and price factors.
General Consumer Tastes and Preferences
Consumer preferences differ significantly among various income and age groups. Similar to other
nations, young consumers tend to experiment with new products, but many of them remain at the
“tasting level.” Middle-aged and elderly consumers are much more conservative in their taste
preferences and often treat new products with caution. Consumers of all ages and income groups
are highly patriotic in their choices and often will not buy an imported product if a domestically
produced one of comparable price and quality is available.
All categories of consumers analyze the content/ingredients of products with great care. There is
widespread belief that preservatives, stabilizers, colorants and flavoring agents are not healthy
and one should avoid them if possible. However, consumers pay little attention to fat, sugar or
protein content. The trend for healthier food consumption (low fat and reduced cholesterol, sugar
free) is not yet evident in Ukraine. The diet of many low-income people is not nutritionally
balanced and health concerns are found only in big cities, where consumers are wealthier and can
afford more expensive products.
Biotech products have a negative public perception in Ukraine and the government has imposed
compulsory labeling although one will not find labeled products in the supermarkets. There are no
registered GM plant varieties for human consumption and there are only intentions to have them
registered for animal feed. Ukrainian legislation on biotechnology in general is in development.
With average per capita income still quite low, Ukrainians spend approximately 56-57 percent of
their incomes on foodstuffs. Prepared home meals are preferred over dining out. Women account
for 49 percent of the total work force (20.6 million people) and contribute to the increased
demand for meals consumed away from home, easy to cook and ready-to-eat products. The
market trend for frozen and convenience food is relatively new in Ukraine, but with a large
proportion of two-income families and growing incomes of city dwellers this market segment is
expanding very rapidly.
Almost 33 percent of the population lives in rural areas. Their incomes are quite low and many
people rely on subsidiary household plots to provide staple foods (potatoes, vegetables and
fruits). Many rural families sell vegetables, meats and traditional dairy products in open-air
markets. The majority of their consumers are low income and elderly (these two categories
overlap considerably).
Food Standards and Regulations
For an extensive explanation of Ukrainian Food and Agricultural Import Regulations and
Standards, a prospective exporter should refer to FAS\Kyiv’s FAIRS Report, and Subject FAIRS
report, which are available on the FAS/USDA web site. An abbreviated review of Ukrainian import
regulations and food standards is provided below:
Ukraine possesses a complicated and costly food safety system inherited from the Soviet Union.
Controls are implemented by various state agencies that often have overlapping functions. In late
2010 the Government of Ukraine (GOU) started a major reform of the regulatory system aimed at
reducing the number of controlling bodies and clear separation of their authorities. Although GOU
intended to finish most of the transformation by the end of 2011, the process is still in progress
and may not be finished by that date. The authority scopes of both new and old agencies in
transformation are provided in the report where possible. Due to ongoing reform these scopes are
changing over time. So far the reform has not led to simplification of food import regime. The
reader is encouraged to contact FAS/Kyiv should questions arise.
The following GOU agencies are involved in assuring the safety of domestically produced and
imported food products, and animal and plant health issues:
State Epidemiological Service (SES) of the Ministry of Health Care of Ukraine (MHCU)
establishes food safety standards and is responsible for all aspects of food safety;
State Veterinary and Phytosanitary Service (SVPS) is responsible for animal health, safety
and wholesomeness of meat, seafood, other products of animal origin and live animals
(State Phytosanitary Inspection Service of the Ministry of Agricultural Policy and Food of
Ukraine has not yet joined the SVPS as intended by regulatory reform. It functions
separately and is responsible for plant health issues);
Agricultural Inspection Service (AIS) of the Ministry of Agricultural Policy and Food of
Ukraine (MAPFU) is responsible for plant varieties;
State Inspection for Consumer Rights Protection is responsible for compliance of food
products with Technical Requirements and safety norms (listed in outdated State Standards
which are voluntary for non-safety parts) if they are not controlled by other agencies and
not covered by the new Technical Requirements.
State Ecological Inspection Service (SEIS) of the Ministry of Ministry of Ecology and Natural
Resources of Ukraine (MENRU) is responsible for radiological and environmental control.
Imported food products must meet the same requirements as domestically produced foods. While
enforcement of food safety norms has been generally effective, outdated nutritional norms have
not been rigorously enforced. All food products sold in Ukraine must have Ukrainian language
labels attached to the package that contain the following information:
1) Name of food product;
2) Nominal quantity of food product (weight or volume in metric system measurement);
3) List of all ingredients found in the food product, including other food products and food
additives used;
4) Nutritive values and energy;
5) Expiry date, or the date of production with indicated shelf life;
6) Storage conditions;
7) Name, country, address of producer, packer, exporter and importer of the product;
8) Terms of use (if any);
9) Presence or absence of genetically modified organisms (GMO) - please note text explanation on
below;
10) Consumption of food product warnings for certain consumer categories (children, pregnant,
senior people, athletes etc.)
11) Consumption warning for food products by certain consumer categories (children, pregnant,
elderly, athletes, etc.);
This information must be present even on the packaging of products not intended for retail trade.
Stick-on labels that meet Ukrainian food safety law requirements are allowed and can be affixed
on the side or over the standard US label. Customs authorities require compliance with the
Ukrainian labeling requirements prior to granting final clearance to the product. Most importers
prefer to deal with products that already contain labels and meet Ukrainian requirements although
some chose to attach labels in the customs licensed warehouse in Ukraine. Health claims and
statements targeting particular consumer groups (children, pregnant women, and athletes) are
prohibited without prior approval from the Ministry of Health.
The product’s expiration date (or shelf life indication containing the date of production) must
appear on the label. Although Ukrainian food safety legislation allows producers to determine the
shelf life of the product, it is highly advisable to verify with the importer whether it meets existing
Ukrainian technical regulations (GOST or DSTU).
According to GOU Resolution #661, any food product that contains more than 0.9 percent of
GMOs, or if any ingredient in a food product contains GMOs as well as food products that do not
contain any GMOs but are produced at least in part with agricultural products that contain GMOs
and the total weight of GMO or GMO derived products is a single food product package exceeds
0.9 percent of its total weight, this food product has to be labeled “Contains GMO.” If a single
package of food product contains no GMOs or less than 0.9 percent GMOs, it has to be labeled “No
GMO.” Products without relevant labeling are not permitted for sale in Ukraine and are a subject to
confiscation and fines. GMO food product labeling is a responsibility of the producer/supplier.
Stick-on labels may be used. Please note that there are potential new recent developments in the
law that could change these requirements.
Ukraine maintains a positive list of food additives and establishes its own maximum residue limits
for chemical and biological contaminants in food products. Recommendations from the CODEX
Alimentarius Commission, an international food safety standard setting body is considered in
approving new food additives; however Ukrainian authorities conduct their own risk assessment
for each new substance. Importing food products that contain food additives that have not
received official approval is prohibited.
The list of products subject to compulsory certification is provided in a separate GAIN Report. The
list is not extensive and includes mostly seafood, canned product for children consumption, wine
and tobacco products. In its design, current Ukrainian legislation in many instances mimics EU
system, but remains in transition from Soviet-type scheme to a modern one. This transition adds
to uncertainty that agricultural producer or importer face. The system is based on both compulsory
(Technical Regulation a.k.a. Technical Reglaments) and voluntary (State Standard) regulations.
The applicant (either exporter or importer) is responsible for the cost of the certification. There
are usually two options available to exporters and importers depending on the value and the
frequency of shipments. The first option envisions compliance of a foreign facility to existing
Ukrainian norms and regulations on quality and safety. The supplier receives a certificate of
conformity valid for two to three years that avoids having to certify each shipment. The second
option involves certification of each product shipment with mandatory laboratory tests upon arrival
in Ukraine.
All food products of animal origin are subject to veterinary surveillance and control in Ukraine. A
prospective U.S. exporter should refer to FAIRS GAIN Report for more information even if the
exported commodity is not subject to veterinary controls in the United States. A Ukrainian state
veterinarian conducts inspections at the border for canned products that contain any amount of
meat or animal fat, animal feeds of plant origin (such as soybean meal), ready-to-eat seafood
products, and frozen fish. The report also contains multiple reference lists.
General Import and Inspection Procedures
Import regulations in Ukraine are similar to regulations found in other countries. All applicable
duties and taxes are collected by customs authorities upon clearance of imported goods at the
border, unless the cargo is forwarded to a bonded warehouse. Almost all Ukrainian import duties
are calculated on ad valorem basis. According to Ukraine’s WTO obligations, the only commodity
subject to a quota restriction is raw sugar.
Agricultural and food products imported into the customs territory of Ukraine may be subject to
sanitary testing, certification, radiological, veterinary and/or phytosanitary inspections. Every
shipment arriving in Ukraine is inspected and sampled regardless of the statements made in the
accompanying health certificate. Custom clearances and co-related inspections are fee-based and
are viewed a source of revenue. Ukrainian Customs Service often rejects the declared custom
value of imported product as the basis for custom duty calculations. In this case importer should
be ready to use appeal procedure and litigation in the court. The testing procedure takes up to
seven days, which makes the import of some highly perishable products difficult at best or
impossible.
Due to small import volumes from overseas, U.S. exporters should be prepared to ship mixed
product loads in one container. A separate health certificate is required for each homogenous
product lot within the container. There may be specific import requirements (alcohol, tobacco,
etc.) or prior notice requirements for certain products. At the planning stage, exporters are
advised to verify with their importer what types of controls are applicable to the product. Any
food product (except those produced for personal consumption), food raw materials and
agricultural products are prohibited entry into Ukraine without documented evidence of their
quality and safety. Control over adherence to the procedure of food and agricultural product
imports rests with the Customs Service of Ukraine. The product will not be granted final clearance
until all legal procedures are met. The following documentation is required for customs clearance:
Copy of a contract and an invoice;
Bill of lading;
Freight custom declaration;
Certificate of conformity (if applicable);
State sanitary and epidemiological expertise certificate, (or certificate on state registration
of special food products);
Veterinary certificate (if applicable);
Import permit and original phytosanitary certificate (if applicable);
Manufacturer’s Certificate of Quality.
Ukrainian is the only official language recognized in Ukraine. All documents must be bilingual,
submitted in Ukrainian or be accompanied by an official translation.
SECTION III. MARKET SECTOR STRUCTURE AND TRENDS Competition
For the past six years, Ukraine has been a net exporter of agricultural and food products (HTS 1-
24 groups). In 2010, total exports of agricultural products from Ukraine are expected to reached
$8.2 billion dollars (a nine percent drop from 2009), exceeding agricultural imports ($4.9 billion
dollars).
Import of Agricultural Products in 2010
Source: State Statistics Committee of Ukraine
The development of the food industry in Ukraine has led to a significant increase in the use of raw
materials and additives for foodstuff production and comprises the majority of Ukrainian imports.
For more information on opportunities in Ukraine’s food processing industry, please refer to FAS
Kyiv’s report: UP7003 Food Processing Ingredients Sector Report found on the FAS homepage.
In 2005-2010, imports of the following commodities experienced the highest rates of growth:
Food additives (stabilizers, emulsifiers, flavorings, proteins, pigments, ferments, albumin,
oil-and-fat mixes, modified starch etc.)
Palm oil or fractions
Fish
Swine, live except pure-bred breeding
Grape wines
Cocoa powder
Spirits
Some imported soya products are used as ingredients in food and compound feed industries (such
as soya meal and flour, soya protein concentrates, lecithin, vegetable oil mixes and isolates on
soya base for confectionery, dairy and meat industries).
Food products imported from EU and CIS countries are now the major competitors for U.S.
commodities in Ukraine and will continue to be in the foreseeable future. Below is a list of the top
10 U.S. export commodities experiencing the highest import growth rate in Ukraine (for 2005-
2010 with turnover over $5 million):
Meat (predominately poultry)
Seeds for Planting (Corn Hybrids)
Miscellaneous food
Edible Fruits and Nuts
Preserved Food (mostly Juice Concentrates)
Tobacco
Pet Food
Fish and Seafood (Whiting and Hake)
For many staple products, domestic production meets demand. Imported food and agricultural
products have difficulty competing with domestic products due to the high cost of foreign
exchange high import duties and generally efficient production of unsophisticated food products.
Imports add to the variety of foods available on the market and also include products that are
either not grown in the country or for which domestic production is insufficient to meet domestic
demand.
Retail Food Sector
Due to the quickly growing number of super- and hypermarkets in 2001-2011, experts estimate
their market share at 43 percent, and it will continue to grow in the future. Traditional retailers in
big cities are losing their clientele due to new and improved services that are provided by big
retailers. Open-air markets and kiosks cannot compete due to low quality products (this is a
major channel for uncertified and counterfeit goods), while traditional grocery stores cannot offer
a wide assortment of products at low prices. Supermarkets are not completely driving out open-
air wholesale markets and Soviet-type grocery stores, but forcing them to modernize equipment
and marketing techniques.
Supermarkets, Hypermarkets
Staff of these entities privatized the majority of retail outlets during the first wave of Ukrainian
privatization in the early 1990’s. Large trade centers with a self-service system (the Soviet
counterpart to supermarkets) built in the time of the Soviet Union ceased to exist after the first
year of Ukraine’s independence. Later, individuals or businesses purchased these food stores. In
order to survive, the overwhelming majority of these stores sold both non-food and food
products.
The stabilization of the national economy helped to create the current retail structure. The first
domestic supermarket chains emerged to satisfy the new and growing demand in early 2000s.
These stores began to emulate western standards on floor space, product assortment, and quality
of service.
The average floor space of a Ukrainian supermarket grew from 822 square meters in 2005 to 914
square meters in 2007 and 1200 square meters in 2009. The first Ukrainian mall – “Karavan” (is
still classified as hypermarket by the State Statistics Committee) was built in Ukraine in 2004 with
a total area of 13,000 square meters and total floor space of 8,000 square meters. The small floor

space of many Ukrainian supermarkets is a result of limited capital and limited availability of
buildings or land plots in proper locations suitable for such operations. Only Western investors
and very few Ukrainian companies are capable of full-scale construction projects from the ground
up.
According to supermarket owners, stock lists of smaller stores include 30–50,000 items. 80-90
percent of these items are of Ukrainian origin. Dairy and fish products, meat, bakery and spirits
are widely represented. Supermarkets often cut their margins to attract as many customers as
possible. The largest chain supermarkets use over 1,000 different suppliers represented by large
wholesale companies, producers and importers. Local chains are adopting foreign practices and
standards, and introducing production quality control departments and distribution centers. Many
supermarkets are open round-the-clock.
There are several factors contributing to the rapid success of hypermarkets and supermarkets in
Ukraine. First, retail chains guarantee higher quality goods. Second, the majority of chains offer
attractive prices through improved logistics and substantial supplier discounts in return for
guaranteed large procurements. These advantages attract customers from traditional wholesale
open-air markets and grocery stores. Third, supermarkets guarantee comfortable shopping
conditions (free parking, etc.), additional discounts for regular customers (discount cards), and
additional services for goods purchased (home deliveries, Internet shopping, etc.).
Due to the rapid market development and abundance of retail formats, local retail chains have had
little competition from foreign companies. Today, Kyiv commands approximately one-fifth of all
retail trade in food products conducted by specialized and non-specialized stores, as reported by
official statistics. Meanwhile, according to some retailers these supermarket chains are only
satisfying 45-50 percent of all demand. Operators agree that the market for larger stores will
continue to develop in the near-term despite the economic slow-down. Now supermarkets do not
compete with each other, but with traditional open-air markets. The latest trend in supermarket
development is to locate these trade outlets in shopping malls, which reduces construction costs
and attracts additional customers. Construction of movie theaters also opens new possibilities for
supplying the “American way of life” (popcorn, soft drinks and different snacks).
Kiosks and Gas Marts
The number of kiosks, which were popular trade outlets in the early 1990’s, has gradually
diminished. The typical kiosk operates 24 hours a day and sells cheap alcohol, cigarettes and a
limited number of food products. Limited floor space (usually 8-25 square meters) and a relatively
wide stock list (on the order of 100-200 kinds of goods), as well as minimal required capital and
operation costs ensures their existence. Competition from larger private stores and supermarkets
that offered lower prices resulted in a reduction in the number of kiosks. They survive at road
intersections, bus stops, underground stations, near open-air markets, in bedroom communities,
and in rural areas. Kiosks offer a variety of the cheapest living essentials including food products.
Lately, kiosks are becoming more specialized. For example, producers of meat and bakery
products have opened kiosks to sell their own products near public transportation stops.
The number of modern gas stations continues to grow rapidly in Ukraine. Approximately 10-15
percent of all Ukrainian gas stations have stores that sell packaged food products. This includes
mainly soft drinks, cookies, chocolates, and various snacks. These gas station stores account for
1-2 percent of all food stores. The service-store network is under development and is not viewed
as a major revenue source by gas station managers. The developing network has good prospects
and may increase its share of retail sales.
Chain Convenience Stores and Self-service Groceries
Chain grocery stores are not yet very common in Ukraine, although they are becoming more so.
The shortage of suitable land plots makes many retailers consider smaller formats. The Fozzy
Group is developing a network of Fora and Bumi-market grocery stores. According to
management, the chain may slow down development of its Silpo supermarkets chain, but will not
cut back on its Fora chain despite economic downturn. Their competitor in the Dnipropetrivsk
region, ATB Corporation, has a network of over four hundred stores, although these stores are
quite close to supermarkets in size. Usually groceries are located in suburbs, offer a narrow
product range and have limited floor space. These new groceries are quickly replacing the Soviet-
style food stores. The average floor space varies from 300 to 500 square meters. Stock lists
include a range of 1,500 to 3,500 items. Grocery outlets have became rather popular among
pension-age consumers who prefer to shop close to home. Retirees often make small purchases
throughout the week. These outlets also target consumers with below average incomes and who
generally purchase goods daily. These products tend to have a short shelf life (bread, dairy
products, fruits and vegetables, etc.). Market analysts note that convenience stores lack regular
customers and their market share is small. Nevertheless, grocery stores are very successful in
small Ukrainian towns.
Traditional Outlets: Independent Grocery Stores and Open-Air Markets
Soviet-style stores with behind-the-counter sales (traditional groceries) are quite common in
Ukraine. Some of these groceries are situated in central districts selling food products to office
employees during the workweek and to a small number of urbanites. These stores have often
been taken over by chain convenience store companies and converted into modern self-service
convenience stores. Other traditional grocery stores survived in suburban communities in large
cities. These stores are likely to leave the market due to fierce competition with supermarkets
and modern convenience stores. They are losing clientele due to their limited product line, higher
prices, poor customer service, and unprofessional vendors. In order to survive, many offer round-
the-clock operations and lease some floor space to sellers of industrial goods (DVD and CD sales)
and services (photo development). Some are operating successfully in distant small districts of
large cities and small provincial towns where the construction of supermarkets or modern chain
convenience stores is economically unjustified.
Grocery stores, especially those operating 24 hours a day, can be of certain interest to potential
U.S. exporters. These may become outlets for less expensive food products, manufactured abroad
with a long shelf life: alcohol drinks, assorted snacks, confectionery products, meat goods, canned
goods, goods for elderly people. The overwhelming majority of these stores (except small ones
with 150-200 square meter floor space) procure products through wholesale companies. Smaller
ones buy products in Cash&Carry stores or from large wholesale open-air markets.
According to experts’ estimates, in 2011, approximately 20 percent of food products in Ukraine
were sold through this channel. For meat products this indicator reached 90 percent. These trade
outlets are leading sellers of vegetables, fruits, meat, honey, and dried fruits. At the same time,
sales of dairy products, sunflower oil, and alcoholic drinks are gradually moving from open-air
markets to outlets of other types. Open-air markets provide poor customer service, lack storage
equipment and often sell low quality products for a price that is often higher than in
supermarkets.
HRI Food Service
The HRI sector in Ukraine remains small, but is developing quite rapidly. In 2011, the number of
restaurants, cafes, bars and other HRI institutions in Ukraine exceeded 30,000. New fast food
outlets and restaurants with international-style cuisines have begun to alter the structure of the
food service sector. The market niche for expensive and elite restaurants is saturated, so the
lower cost mass market is developing. Existing restaurants are divided into three categories: fast
food, canteens and cafés, mid-level restaurants, and restaurants with “high-quality cuisine.” The
majority of outlets belong to the first group. With over 20 million visitors in 2010, tourists have
become the major driving force behind the success of the HRI sector and the introduction of new
food products to the Ukrainian market. Even more tourists are expected to attend the country in
2012, when Ukraine hosts the European Soccer Championship.
In addition to fast food establishments that offer pizzas, hot dogs and hamburgers, outlets of
various ethnic cuisines, such as Mexican, Chinese, Vietnamese, Japanese, Italian, Indian and
others, have entered the food service industry. However, the majority of customers prefer family-
style menus featuring traditional Ukrainian food. In addition to McDonald’s (with over 70
restaurants in 21 city of Ukraine), there are other fast-food restaurant chains like McSmak, “Pizza
Chelentano” and “Kartoplyana khata” (Potato house), “Shvydko”, etc.
HRI Prospects: The HRI sector will continue to grow. The number of customers is expected to
increase as “eating out” habits become popular among the middle class and wealthy Ukrainians.
Restaurant chains consisting of coffee bars, healthy food restaurants (separate eating, healthy
food), and a fast-food fish chains, are not developed in Ukraine. These are good prospect areas
for new restaurants, but the middle class is currently at the mercy of the economic crisis.
Food Processing Sector
The food-processing sector in Ukraine has developed rapidly in the past five years (up until late
2008) with an average growth rate of 10-15 percent. The food industry’s share in manufacturing
is almost 20 percent. In 2010, the industry’s total output of exceeded $12 billion dollars
(FAS/Kyiv estimates). Over 20,000 enterprises operate in the food processing sector of Ukraine.
The fastest growth rate is found in fruit and vegetable processing, edible oils production, pastry
and biscuits, baby food, and alcoholic beverages production.
Imports of food ingredients are estimated at $1.5 billion for 2010 (including products for further
re-packing). Major imported products for the processing industries included poultry, fish, palm oil,
cocoa products, juice concentrates, spices and seasonings, vegetables, additives, tobacco and
others.
The development of the food processing industry is currently impeded by inadequate domestic
supply of raw agricultural products and limited export possibilities. Only a few food processors
comply with EU quality requirements and packaging standards (mainly dairy, meat, confectionery,
and beverages). Large food processors purchase raw materials and food ingredients directly from
foreign exporters. Large wholesalers and distributors also supply the sector.
Sector trends: The Ukrainian food processing industry will be driven mainly by domestic demand,
through production of dairy products, especially hard cheese and whole milk products. Production
of beef will be driven by demand in Russia and some Former Soviet Union countries.
SECTION IV. BEST HIGH VALUE PRODUCT PROSPECTS
Given the potential of the Ukrainian agricultural industry and relatively low incomes, U.S. high
value added products will penetrate some niche markets, especially for those products that are not
produced in Ukraine or are produced in limited quantities. In many cases, Ukrainian agriculture is
not capable of producing products of consistently high quality (e.g. high quality beef steaks and
pork medallions). There are markets for specialty products including low-fat, low-salt and sugar-
free products, cake & bread mixes, corn meal, Graham Crackers and chocolate chips. U.S.
suppliers could also supply new market segments that are just beginning to develop. This includes
microwaveable and semi prepared food as well as TV-dinners. Potential importers must be aware
that promotion of innovative or new to market products is expensive.
Other potential U.S. export items include snack foods, raisins, dried foods, nuts, spices, peanut
butter, frozen and dried yogurt, soft drinks, frozen juices, fruit & vegetable pure and concentrates,
fresh fruits and vegetables, wine, frozen foods, meat (especially chicken and turkey), pasta
preparations, frozen and canned seafood, frozen and canned vegetables and fruits, soft cheese,
soya sauces, salad dressings and breakfast cereals, baking improvers and bread mixes, and dry
gluten. Quick-to-prepare main and side dishes as well as ethnic international foods are all gaining
popularity.
Products with Best Sales Prospects in Ukraine Product 2010
Market
volume
2010
Import
volume
Average
growth of
import
over the
last 3
years
Import taxes Main factors
hindering
import
development
Attractiveness
of the market
for the USA
Beef 115 ths.
tons
4 ths.
tons
No change 15 percent Consumer
unawareness
of U.S. high
quality beef;
Sizable
Insignificant
specialized beef
production;
Constantly
growing beef
domestic
production,
Complicated
import
procedures.
prices; Niche
markets for
meat delicacies
(steak, etc.) and
meat offal; Fast
HRI
development.
Pork 284 ths.
tons
112
ths.
tons
Over
30 percent
10-12
percent
Competition
from Brazilian
pork and
informal
trade.
Shortage of
pork in the
country;
declining
production;
high prices;
Demand for
stable deliveries
of both cheap
and high quality
product.
Fish and
Seafood
613
ths. tons
468
ths.
tons
10-20
percent
0 – 5 percent
for all frozen
fish; 10
percent for
prepared fish,
live fish,
Mackerel,
Trout, some
Crustaceous,
Anchovy,
Salmon and
Lobsters.
Regular
deliveries of
high quality
product from
Norway;
Shortage of
suitable
equipment at
retail trade
outlets;
Deficit of
proper storage
facilities with
below –20C
temperature.
Growing
demand for
higher quality
seafood from
consumers;
Very modest
assortment in
markets;
Significant
demand from
supermarkets
and HRI sector.
Planting
Seeds
n/a 3.1 ths.
tons
8 percent 0-20 percent
depending on
the plant
Uncertain
customs
regulations
and clearance
delays,
customs
valuation,
variety
registration
issues
Superior quality
of hybrid seeds
(especially corn
and sunflower),
good and well
established
reputation
Dried
fruits
and nuts
50 ths.
tons
8.1 ths.
tons
20-30
percent
From 0
percent to 20
percent
Sharp
competition
with Iran and
Intensive
development of
confectionery
(exclude.
peanuts)
Turkey.
Desire of
packers to
save on raw
stock,
procuring low
quality stock
from Iran,
Uzbekistan,
and
Afghanistan
industry and
start of retail
sales of rare
dried fruits
(exceed world
prices by 3 – 6
times).
High quality of
U.S. product;
Development of
premium-class
confectionery
products
Wine 64
million
deciliters
33
million
liters
Contracted
by 15
percent
Significantly
Varies by
product
High import
duties, tough
competition
with
Ukrainian-
made spirits
and drinks
produced in
the CIS states
Relatively high
level of alcohol
consumption;
Demand for
exotic drinks
(whiskey, gin,
rum, bourbon).
Pet food N/a 133
ths.
tons
20-30
percent
5-10 percent Large supply
of Russian-
made cheap
pet food;
informal
trade,
Strong
tradition of
feeding pets
with table
scraps;
Long
registration
and
certification
procedures.
Traditionally
large number of
home pets;
Increased
population
incomes
followed by
growing
demand for
ready to use pet
food.
Comparatively
low import duty
* All imported products are subject to 20 percent VAT tax;
** No 2010 data is available by the time when this report was drafted.
SECTION V. KEY CONTACTS AND FURTHER INFORMATION
Ministry of Agrarian Policy and Food of Ukraine
24, Khrezhchatyk,
Kyiv, Ukraine, 01001
+380 44 226 34 66
E-mail: [email protected]
www.minagro.kiev.ua
State Veterinary and Phytosanitary Service
1, Hrynchenka Str.,
Kyiv, Ukraine, 01001
+380 44 279-12-70, 279-47-61, 279-49-81
E-mail: [email protected]
http://www.vet.org.ua
State Consumer Right Protection Inspection
(former Derzhspozhyvstandart of Ukraine)
174, Gorkogo st., Kyiv, Ukraine, 03680
+380 44 268-84-12
+380 44 268-74-26 fax
E-mail: [email protected]
www.dssu.gov.ua
The Ukrainian Chamber of Commerce and Industry
33, Velyka Zhytomyrska str.,
Kyiv, 01601, Ukraine
+380 44 212-2911
+380-44 212-3353fax
E-mail: [email protected]
www.ucci.org.ua
Ministry of Public Health of Ukraine
7 Hrushevsky st., Kyiv, Ukraine, 01021
+380 44 253-52-71, 253-61-65, 293-24-39
+380 44 253-69-75 fax
E-mail: [email protected]
www.moz.gov.ua
Central Sanitary and Epidemiological Station of Ministry of Public Health of Ukraine
41, Yaroslavskaya, str., Kyiv, Ukraine, 04071
+380 44 416-43-54
+380 44 417-37-75 (fax)
American Embassy Kyiv, Ukraine
Foreign Agricultural Service
US Department of Agriculture
Washington, D.C. 20521-5850
tel.: +38044-490-4005
fax: +38044-490-4110
E-mail: [email protected]
http://ukraine.usembassy.gov/fas.html
ATTACHMENTS
Table A. Sales of Major Food Product in Ukraine in 2009-10
Food Product Volume Sales 2009
percent to 2010 2009 2010
Meat, poultry and fresh frozen 1000 T 715.8 819.4 114
Meat, smoked and salted meats " 733.9 842.1 115
Canned, prepared meat products " 105.3 115.8 110
including semi-finished meat " 8.2 6.0 73
Fish and seafood " 338.8 416.2 123
Canned, ready to eat fish products " 139.8 163.4 117
including semi-finished " 520.5 686.6 132
Ice cream " 71.8 95.6 133
Hard cheese, soft and melted cheese " 324.3 409.8 126
Butter " 135.0 179.3 133
Eggs and egg products Million pcs. 143.5 168.0 117
Oils and Fats 1000 T 152.4 186.4 122
Margarine " 47.2 42.7 90
Sugar " 124.3 156.9 126
Confectionery sugar " 851.7 1068.3 125
Flour " 67.0 68.7 102
Bakery products (except confectionery) " 337.7 380.0 113
Groats and Beans " 131.2 170.3 130
Noodles " 125.9 132.9 106
Potatoes " 58.7 68.8 117
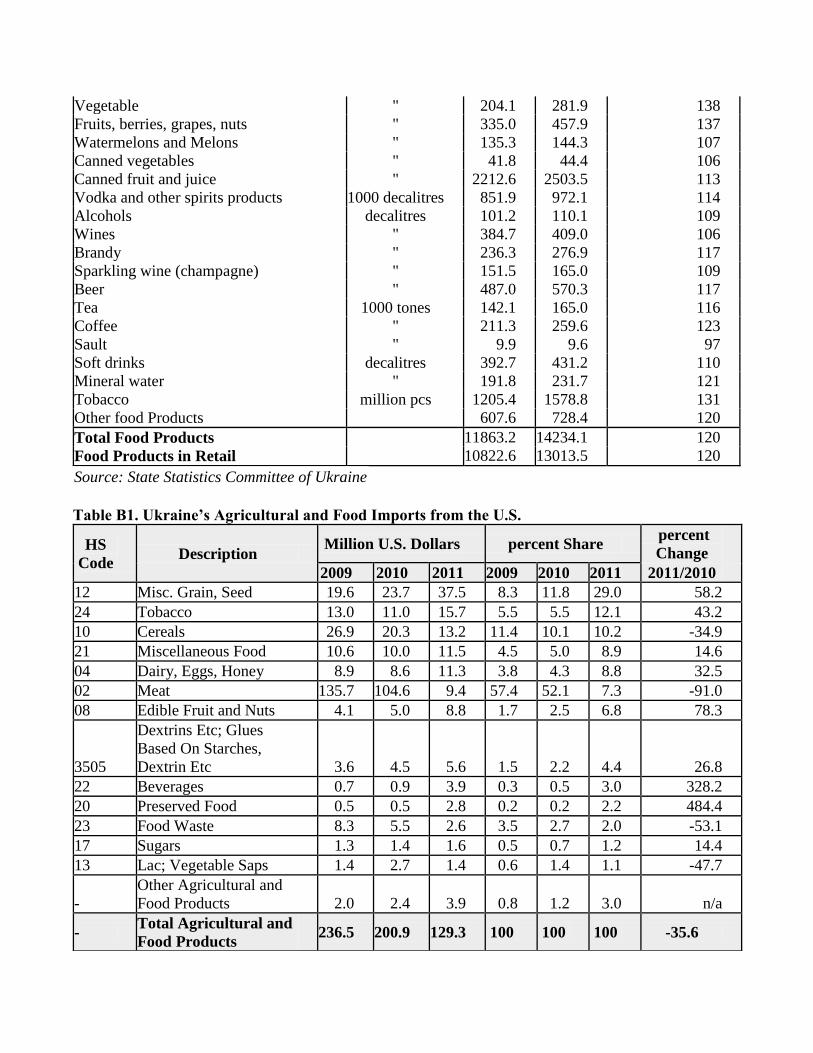
Vegetable " 204.1 281.9 138
Fruits, berries, grapes, nuts " 335.0 457.9 137
Watermelons and Melons " 135.3 144.3 107
Canned vegetables " 41.8 44.4 106
Canned fruit and juice " 2212.6 2503.5 113
Vodka and other spirits products 1000 decalitres 851.9 972.1 114
Alcohols decalitres 101.2 110.1 109
Wines " 384.7 409.0 106
Brandy " 236.3 276.9 117
Sparkling wine (champagne) " 151.5 165.0 109
Beer " 487.0 570.3 117
Tea 1000 tones 142.1 165.0 116
Coffee " 211.3 259.6 123
Sault " 9.9 9.6 97
Soft drinks decalitres 392.7 431.2 110
Mineral water " 191.8 231.7 121
Tobacco million pcs 1205.4 1578.8 131
Other food Products 607.6 728.4 120
Total Food Products 11863.2 14234.1 120
Food Products in Retail 10822.6 13013.5 120
Source: State Statistics Committee of Ukraine
Table B1. Ukraine’s Agricultural and Food Imports from the U.S.
HS
Code Description
Million U.S. Dollars percent Share percent
Change
2009 2010 2011 2009 2010 2011 2011/2010
12 Misc. Grain, Seed 19.6 23.7 37.5 8.3 11.8 29.0 58.2
24 Tobacco 13.0 11.0 15.7 5.5 5.5 12.1 43.2
10 Cereals 26.9 20.3 13.2 11.4 10.1 10.2 -34.9
21 Miscellaneous Food 10.6 10.0 11.5 4.5 5.0 8.9 14.6
04 Dairy, Eggs, Honey 8.9 8.6 11.3 3.8 4.3 8.8 32.5
02 Meat 135.7 104.6 9.4 57.4 52.1 7.3 -91.0
08 Edible Fruit and Nuts 4.1 5.0 8.8 1.7 2.5 6.8 78.3
3505
Dextrins Etc; Glues
Based On Starches,
Dextrin Etc 3.6 4.5 5.6 1.5 2.2 4.4 26.8
22 Beverages 0.7 0.9 3.9 0.3 0.5 3.0 328.2
20 Preserved Food 0.5 0.5 2.8 0.2 0.2 2.2 484.4
23 Food Waste 8.3 5.5 2.6 3.5 2.7 2.0 -53.1
17 Sugars 1.3 1.4 1.6 0.5 0.7 1.2 14.4
13 Lac; Vegetable Saps 1.4 2.7 1.4 0.6 1.4 1.1 -47.7
-
Other Agricultural and
Food Products 2.0 2.4 3.9 0.8 1.2 3.0 n/a
- Total Agricultural and
Food Products 236.5 200.9 129.3 100 100 100 -35.6
Source: State Statistic Committee of Ukraine/GTI (trade data from UN Statistics Division for Ukraine
is not available);
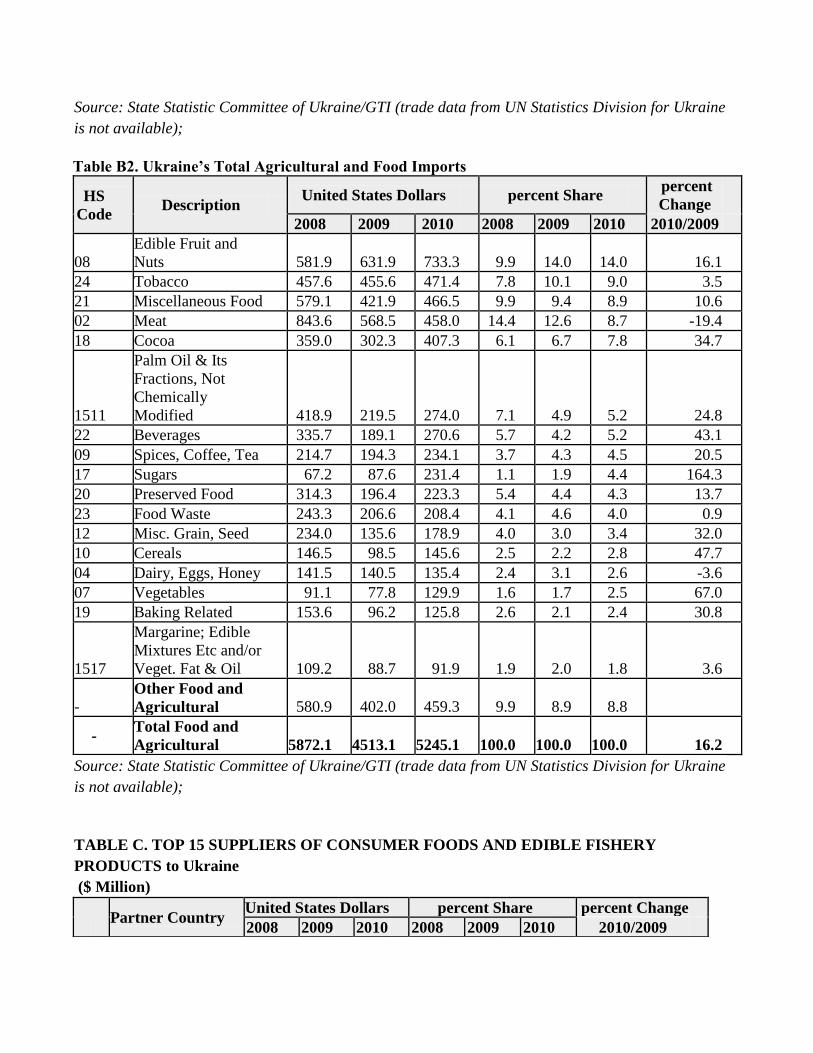
Table B2. Ukraine’s Total Agricultural and Food Imports
HS
Code Description
United States Dollars percent Share percent
Change
2008 2009 2010 2008 2009 2010 2010/2009
08
Edible Fruit and
Nuts 581.9 631.9 733.3 9.9 14.0 14.0 16.1
24 Tobacco 457.6 455.6 471.4 7.8 10.1 9.0 3.5
21 Miscellaneous Food 579.1 421.9 466.5 9.9 9.4 8.9 10.6
02 Meat 843.6 568.5 458.0 14.4 12.6 8.7 -19.4
18 Cocoa 359.0 302.3 407.3 6.1 6.7 7.8 34.7
1511
Palm Oil & Its
Fractions, Not
Chemically
Modified 418.9 219.5 274.0 7.1 4.9 5.2 24.8
22 Beverages 335.7 189.1 270.6 5.7 4.2 5.2 43.1
09 Spices, Coffee, Tea 214.7 194.3 234.1 3.7 4.3 4.5 20.5
17 Sugars 67.2 87.6 231.4 1.1 1.9 4.4 164.3
20 Preserved Food 314.3 196.4 223.3 5.4 4.4 4.3 13.7
23 Food Waste 243.3 206.6 208.4 4.1 4.6 4.0 0.9
12 Misc. Grain, Seed 234.0 135.6 178.9 4.0 3.0 3.4 32.0
10 Cereals 146.5 98.5 145.6 2.5 2.2 2.8 47.7
04 Dairy, Eggs, Honey 141.5 140.5 135.4 2.4 3.1 2.6 -3.6
07 Vegetables 91.1 77.8 129.9 1.6 1.7 2.5 67.0
19 Baking Related 153.6 96.2 125.8 2.6 2.1 2.4 30.8
1517
Margarine; Edible
Mixtures Etc and/or
Veget. Fat & Oil 109.2 88.7 91.9 1.9 2.0 1.8 3.6
- Other Food and
Agricultural 580.9 402.0 459.3 9.9 8.9 8.8
- Total Food and
Agricultural 5872.1 4513.1 5245.1 100.0 100.0 100.0 16.2
Source: State Statistic Committee of Ukraine/GTI (trade data from UN Statistics Division for Ukraine
is not available);
TABLE C. TOP 15 SUPPLIERS OF CONSUMER FOODS AND EDIBLE FISHERY
PRODUCTS to Ukraine
($ Million)
Partner Country
United States Dollars percent Share percent Change
2008 2009 2010 2008 2009 2010 2010/2009
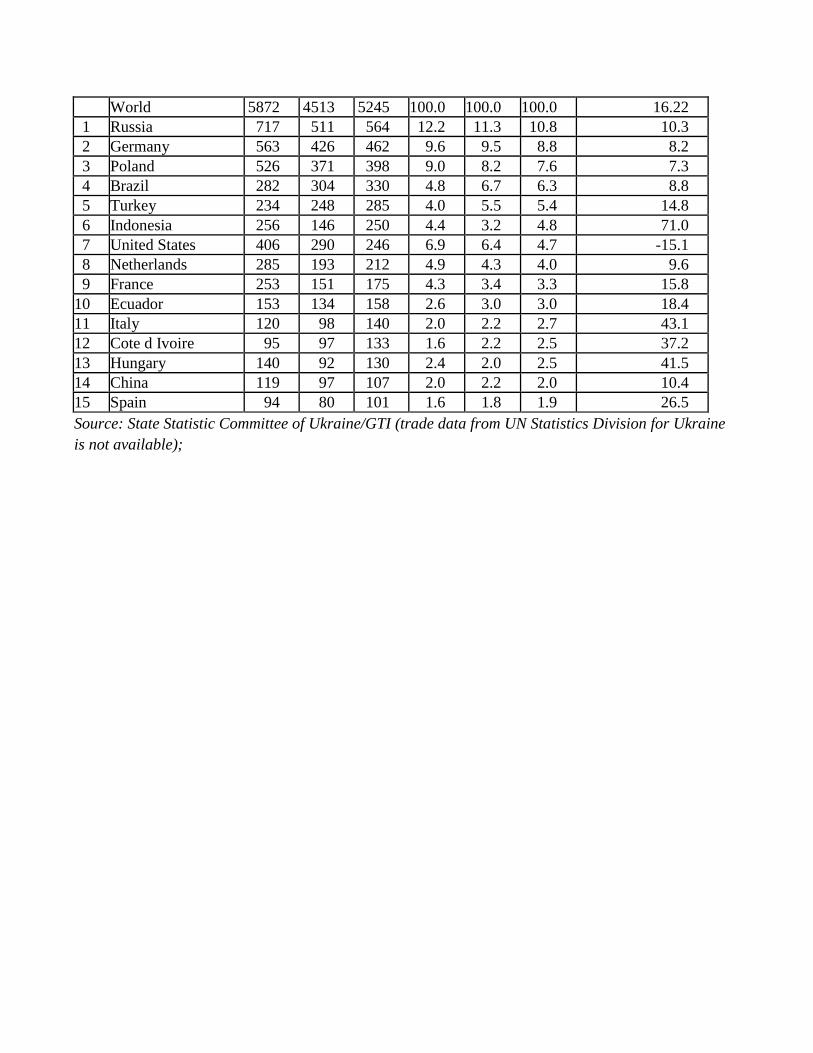
World 5872 4513 5245 100.0 100.0 100.0 16.22
1 Russia 717 511 564 12.2 11.3 10.8 10.3
2 Germany 563 426 462 9.6 9.5 8.8 8.2
3 Poland 526 371 398 9.0 8.2 7.6 7.3
4 Brazil 282 304 330 4.8 6.7 6.3 8.8
5 Turkey 234 248 285 4.0 5.5 5.4 14.8
6 Indonesia 256 146 250 4.4 3.2 4.8 71.0
7 United States 406 290 246 6.9 6.4 4.7 -15.1
8 Netherlands 285 193 212 4.9 4.3 4.0 9.6
9 France 253 151 175 4.3 3.4 3.3 15.8
10 Ecuador 153 134 158 2.6 3.0 3.0 18.4
11 Italy 120 98 140 2.0 2.2 2.7 43.1
12 Cote d Ivoire 95 97 133 1.6 2.2 2.5 37.2
13 Hungary 140 92 130 2.4 2.0 2.5 41.5
14 China 119 97 107 2.0 2.2 2.0 10.4
15 Spain 94 80 101 1.6 1.8 1.9 26.5
Source: State Statistic Committee of Ukraine/GTI (trade data from UN Statistics Division for Ukraine
is not available);