Embed Size (px)
Citation preview
ISSN 2409–4951(Online) ISSN 2310–1008 (Print)
Ukrainian Journal of Food Science
Volume 4, Issue 2
2016
Kyiv 2016
─── Ukrainian Journal of Food Science. 2016. Volume 4. Issue 2 ─── 201
Ukrainian Journal of Food Science publishes original research articles, short communications, review papers, news and literature reviews.
Topic covered by the journal include:
Food engineering Food chemistry Biotechnology, microbiology Physical property of food Food quality and safety Health
Food nanotechnologies Food processes Economics and management Automation of food processes Food packaging
Periodicity of the journal 2 issues per year (June, December).
Studies must be novel, have a clear connection to food science, and be of general interest to the international scientific community.
The editors make every effort to ensure rapid and fair reviews, resulting in timely publication of accepted manuscripts.
Ukrainian Journal of Food Science is Abstracted and indexated by bases: EBSCO (2013) Google Scholar (2013) Index Copernicus (2014) Universal Impact Factor (2014) Directory of Open Access scholarly Resources (ROAD) (2014) CAS Source Index (CASSI) (2016)
Reviewing a Manuscript for Publication. All scientific articles submitted for publication in “Ukrainian Journal of Food Science” are double-blind reviewed by at least two academics appointed by the Editors' Board: one from the Editorial Board and one independent scientist.
Copyright. Authors submitting articles for publication warrant that the work is not an infringement of any existing copyright and will indemnify the publisher against any breach of such warranty. For ease of dissemination and to ensure proper policing of use papers and contributions become the legal copyright of the publisher unless otherwise agreed.
Academic ethics policy. The Editorial Board of "Ukrainian Journal of Food Science" follows the rules on academic writing and academic ethics, according to the work by Miguel Roig (2003, 2006) "Avoiding plagiarism, self-plagiarism, and other questionable writing practices. A guide to ethical writing”. The Editorial Board suggests to potential contributors of the journal, reviewers and readers to dully follow this guidance in order to avoid misconceptions in academic writing.
For a full guide for Autor please visit website at http://ukrfoodscience.ho.ua
Editorial office address: National University of Food Technologies Volodymyrska str., 68 Kyiv 01601 Ukraine
E-mail:
© National University of Food Technologies, 2016

─── Ukrainian Journal of Food Science. 2016. Volume 4. Issue 2 ─── 203
Editorial board
Editor-in-Chief: Anatiliy Ukrainets, Ph. D. Hab., Prof., National University of Food Technologies, Ukraine Members of Editorial board: Aleksandr Ivanov, Ph. D. Hab., Prof., Mogiliov State University of Food, Belarus Aleksandr Mamtsev, Ph. D. Hab., Prof., the Branch of Moscow State University of Technologies and Management, Meleuz, Bashkortostan, Russia Anatolii Saiganov, Ph. D. Hab., Prof., Institute of System Research in Agroindustrial Complex of NAS of Belarus Andrzej Kowalski, Ph.D., Prof., Institute of Agricultural and Food Economics – National Research Institute, Poland Antonella Dorochovich, Ph. D. Hab., Prof., National University of Food Technologies, Ukraine Galyna Simakhina, Ph. D. Hab., Prof., National University of Food Technologies, Ukraine Ivan Malezhik, Ph. D. Hab., Prof., National University of Food Technologies, Ukraine Nataliia Skopenko, Ph. D. Hab., National University of Food Technologies, Ukraine Liviu Gaceu, Ph.D., Prof., Transilvania University of Brasov, Romania Mark Shamtsian, PhD, As. Prof, St. Petersburg State Technological Institute, Russia Mykola Sichevskii, Ph. D. Hab., Prof., Institute of Food Resources of National Academy of Sciences of Ukraine Oleksandr Shevchenko, Ph. D. Hab., Prof., National University of Food Technologies, Ukraine Oleksandr Seriogin, Ph. D. Hab., Prof., National University of Food Technologies, Ukraine Olena Grabovska, Ph. D. Hab., Prof., National University of Food Technologies, Ukraine Olena Sologub, Ph. D. Hab., Prof., National University of Food Technologies, Ukraine Stanka Damianova, Ph.D., University of Ruse, Branch Razgrad, Bulgaria Tetiana Mostenska, Ph. D. Hab., Prof., National University of Food Technologies, Ukraine Tetiana Pyrog, Ph. D. Hab., Prof., National University of Food Technologies, Ukraine Zapriana Denkova, Ph. D. Hab., Prof., University of Food Technologies, Bulgaria Oleksii Gubenia (managing editor), Ph.D., As. Prof., National University of Food Technologies, Ukraine
─── Ukrainian Journal of Food Science. 2016. Volume 4. Issue 2 ─── 204
Contents Food Technologies........................................................................................
206
Olena Kobets, Oksana Arpul, Viktor Dotsenko, Iryna Dovgun Use of dietary fibre concentrates in semi-finished biscuits technology…….
206
Abdalbasit A. Mariod, Yousif M.A. Idris, Nuha M. Osman, Maha A. Mohamed, Awad M.A. Sukrab, Marwa Y. Farag, B. Matthaus Three Sudanese sorghum-based fermented foods (kisra, hulu-mur and abreh): Comparison of proximate, nutritional value, microbiological load and acrylamide content…………………………………………….............
216
Liudmyla Peshuk, Oleg Galenko, Iryna Radzievska, Volodymyr Bohun Development of technology of gerontologic food pastes…………………..
229
Olha Masliichuk, Maria Paska Histological characterics of improving meat chopped semis ………………
236
Joshua Olanrewaju Olaoye, Obafemi Ibitayo Obajemihi, Temiloluwa Charity Metiboba Effects of processing methods and packaging materials on the quality attributes of Suya meat……………………………………………………...
248
Oleg Kuzmin, Yana Kovalchuk, Volodymyr Velychko, Nataliia Romanchenko Improvement technologies of aqueous-alcoholic infusions for the production of syrups………………………………………………………..
258
Olayinka Ramota Karim, Balogun Mutiat Adebanke, Olaide Akinwunmi Akintayo, Wasiu Awoyale Physical, chemical and sensory properties of cassava (Manihot esculenta) – sweet potato (Ipomoea batatas) gari………………………………………
276
Iuliana Beleuzu Boda, Marius Cristian Boda Observations and results of pathogenic bacteria from untreated freshwater sources………………………………………………………………………
290
Natalya Miedviedieva Mayonnaise quality expertise ………………………………………………
299
─── Ukrainian Journal of Food Science. 2016. Volume 4. Issue 2 ─── 205
Vitaliy Borodin, Ganna Tsygankova Mathematical model of liquid activization while making breads in domestic breadmaker……………………………………………………….
309
Processes and Equipment of Food Productions……………..…………
316
Vyacheslav Mykhailyk, Sviatoslav Lementar, Roman Yakobchuk, Yevhen Skrynnyk, Roman Semenko
Wheat grain drying kinetics in a thin layer…………………………………
316
Igor Volchyn, Liudmyla Haponych Engineering method for calculating the parameters of flue gas parameters of coal-fired thermal power plants based on solid fuel characteristics….….
327
Pavlo Shvets, Alla Toropenko, Ievgene Naumenko, Husain Walid Sher Mathematical modeling in CAD elements vehicles food and chemical industry……………………………………………………………………..
339
Economics and Management………………….……………………….… 350
Olena Dragan, Alina Berger Methodology of estimation of system efficiency of personnel management on the enterprises of meat processing industry……………………………..
350
Abstracts…………………………………………………………………...
360
Instructions for authors…………………………………….......................
376
─── Food Technologies ───
─── Ukrainian Journal of Food Science. 2016. Volume 4. Issue 2 ─── 206
Use of dietary fibre concentrates in semi-finished biscuits technology Olena Kobets, Oksana Arpul, Viktor Dotsenko, Iryna Dovgun National University of Food Technologies, Kyiv, Ukraine
Abstract
Keywords:
Flour Emulsifier Gluten Fibre
Article history: Received 29.08.2016 Received in revised form 26.11.2016 Accepted 30.12.2016
Corresponding author: Olena Kobets E-mail: Еlenka021991@ ukr.net
DOI: 10.24263/2310–1008-2016-4-2-3
Introduction. The effect of the dietary fibre
concentrates, namely, wheat, cocoa and apple fibres on the protein-proteinase and carbohydrate-amylase complexes of wheat flour is studied.
Materials and methods. The study of the influence of dietary fibres on the quality indicators of dough gluten was conducted using conventional methods, and structural-and-mechanical properties – with the help of alveograph, amylograph and farinograph.
Results and discussion. The presence of fibre promotes an increase of water-absorbing capacity and time of the dough formation and reduce its stability. It is established that fibre increases a degree of water binding by the dough on average by 12.5–23.2%, due to the ability of its polysaccharide complex to bind and retain water. The results of the study on alveograph indicate that the introduction of fibre in the amount of 15–25% by weight of flour compared to the control increases the dough elasticity by 1,2–2 times and reduces its extensibility by 1.3–3 times. The necessity of the use of surface-active surfactants in the technology of semi-finished biscuits to improve the quality of the finished products is proved. It is determined that the introduction of a mixture of the emulsifiers «Grindsted Cake» with fibre into the dough increases its extensibility on average by 2.6% and elasticity by 2.6–6.8%, which will obviously have a positive impact on the quality of the finished products.
Conclusion. Adding a mixture of the emulsifiers «Grindsted Cake» leads to increased porosity, specific volume and lifting coefficient of the finished products with the addition of wheat fibre, apple fibre and cocoa fibre, thus allowing to bring the quality indicators of the semi-finished products to that of a control or surpass them.
─── Food Technologies ───
─── Ukrainian Journal of Food Science. 2016. Volume 4. Issue 2 ─── 207
Introduction Human health is determined by its nutritional status, which is a degree of providing the
body with required essential substances and energy. Health can only be preserved if there is a full satisfaction of physiological needs of energy and food nutrients. Human diet should meet modern concepts of nutrition science whose requirements should be considered when developing the strategic development of the food industry [1].
Unfortunately, diet imbalance is growing in Ukraine with every year – deficiency in proteins, vitamins, macro- and microelements and other biologically active substances, which leads to the weakening of the immune system, increasing the number of chronic non-communicable diseases. This indicates the need to develop food products of functional purpose, which will consist of essential substances for the human body [2, 3].
Analysis of literature data and problem statement. Recently, scientists have been paying great attention to the enrichment of the diet of the population with dietary fibres (DF), which are a complex of biopolymers containing polysaccharides (cellulose, hemicellulose, pectin) as well as lignin and its associated proteins that form the cell walls of the plants. The structure of these substances and their intermolecular interactions determine the properties of DF, including the ability to retain moisture, ion exchange, and other properties, the behaviour in the technological and culinary processing, impact on quality of food [4].
The deficit of DF in human nutrition is one of the main risk factors for various diseases: dyskinesia of colon with constipation, irritable bowel syndrome, colon cancer and rectal cancer, atherosclerosis, metabolic syndrome, obesity, type 2 diabetes, hemorrhoids, varicose veins of lower extremities, etc. [5].
DF have a wide range of effects on the human body. They stimulate intestine peristalsis and regulate its motor function; reduce the absorption of cholesterol and fatty acids; adsorb intestinal toxic products, alien substances, carcinogens, radionuclides, and some proteins, fats and carbohydrates; stimulate the processes of secretion of bile, prevent its absorption and normalize the function of bile ducts; create a sense of satiety and reduce energy consumption; form and increase stool, thinning intestine contents; promote the rapid excretion of products of incomplete digestion of food substances (toxins); slow the rate of absorption of glucose, which reduces the need for insulin; increase the sensitivity of tissue receptors for insulin and tolerance to carbohydrates; positively affect the intestinal microflora; accelerate the process of fat metabolism in the body [6, 7].
Deterioration of the environmental conditions and food quality require that scientists and manufacturers develop new food products with functional properties. That is why the enrichment of flour confectionery products (FCP) with DF is an urgent problem.
The research conducted previously established reasonability of the enrichment of FCP, namely semi-finished biscuits and cakes, with the concentrates of DF – wheat fibre (WF), apple fibre (AF) and cocoa fibre (CF) containing 65–95% DF. It was determined that optimal dosage of the fibre to the mass of the top-grade flour is 20% that reflects a decrease of organoleptic characteristics in case of dosage exceeding.
The purpose and objectives of research. The purpose of the research was to determine the effect of the concentrates of DF – WF, AF and CF on the quality of gluten and structural-and-mechanical properties of dough and finished products.
The objective of the work was to study the changes of the quality of gluten, protein-proteinase and carbohydrate-amylase complexes of biscuit dough when adding DF to it and determine their impact on structural-and-mechanical properties of the quality of the finished product.
─── Food Technologies ───
─── Ukrainian Journal of Food Science. 2016. Volume 4. Issue 2 ─── 208
Materials and methods The objective of the research is concentrates of DF – wheat fibre, apple fibre and cocoa
fibre produced by Microstructure (Poland), which contain 65...95% of DF, and their impact on the quality of the dough. Fiber was added to the mass of top-grade wheat flour in an amount of 15, 20 and 25%.
The influence of DF on the quality of dough gluten was conducted by the conventional methods [8]. Structural-and-mechanical properties of the dough quality were determined with the help of alveograph, amylograph and farinograph [9].
The porosity of the finished products and specific volume were determined by the scanned images made in the photo lab using Canon iR1210 copier at the highest contrast and with further using the program Microsoft Excel [10]. The baking loss was measured by the difference in mass of the dough piece before and after baking.
The coefficient of product lifting was determined by the ratio of the height of the finished product to the height of the dough piece under conditions of pouring the dough of equal weight to identical forms.
Results and discussion The need to study the impact of fibre on the content and quality indicators of gluten is
caused by the peculiarities of its chemical composition, high degree of its dispersion. It is possible that high dispersion of the product leads not only to changes in the quantitative and qualitative content of its individual components, enzyme activity, degree of assimilation, but also to changes of its influence on the dough biopolymers.
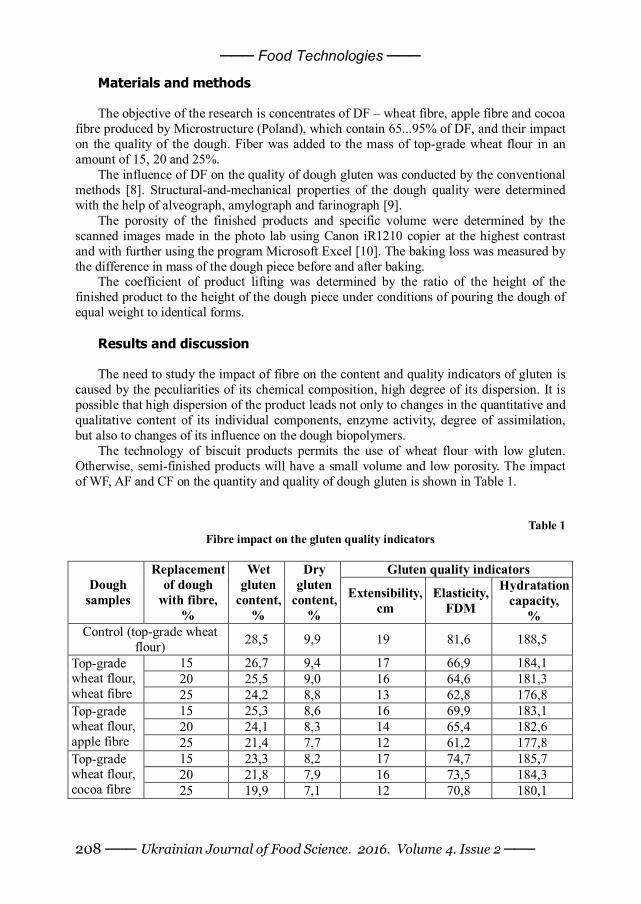
The technology of biscuit products permits the use of wheat flour with low gluten. Otherwise, semi-finished products will have a small volume and low porosity. The impact of WF, AF and CF on the quantity and quality of dough gluten is shown in Table 1.
Table 1 Fibre impact on the gluten quality indicators
Gluten quality indicators
Dough samples
Replacement of dough
with fibre, %
Wet gluten
content, %
Dry gluten
content, %
Extensibility, cm
Elasticity, FDM
Hydratation capacity,
% Control (top-grade wheat
flour) 28,5 9,9 19 81,6 188,5
15 26,7 9,4 17 66,9 184,1 20 25,5 9,0 16 64,6 181,3
Top-grade wheat flour, wheat fibre 25 24,2 8,8 13 62,8 176,8
15 25,3 8,6 16 69,9 183,1 20 24,1 8,3 14 65,4 182,6
Top-grade wheat flour, apple fibre 25 21,4 7,7 12 61,2 177,8
15 23,3 8,2 17 74,7 185,7 20 21,8 7,9 16 73,5 184,3
Top-grade wheat flour, cocoa fibre 25 19,9 7,1 12 70,8 180,1
─── Food Technologies ───
─── Ukrainian Journal of Food Science. 2016. Volume 4. Issue 2 ─── 209
The obtained data show (Table 1) that adding fibre results reduces the number of wet and dry gluten. Thus, when replacing 20% wheat flour with fibre, the content of wet gluten reduces to 10.5% for WF, 15.4% for AF and 23.5% for CF and dry gluten to – 9.0%, 16.2% and 20.2% respectively compared to the control.
With increasing dosage of fibre in the test range, gluten strengthening happens. It becomes more elastic and has lower extensibility. Strengthening effect of the concentrates is connected with high hydrophilic constituents of their polysaccharide complexes that have a significant dehydrating impact on the dough biopolymers. It is evidenced by the reduction in hydration capacity of dough gluten with the raw material, namely 2.3–6.2% when added WF, 2.8–5.6% with the addition of AF and 1.4–4.5% when added CF compared to hydration of gluten washed from the dough without it.
It should be noted that the formation of the strong fibrinous frame might cause the excessive compaction of the dough structure through the considerable resistance of elastic gluten to the expansion of the air bubbles due to temperature rise while baking and getting not enough loosened crumb of the baked semi-finished biscuits and reduce their volume and porosity [4].
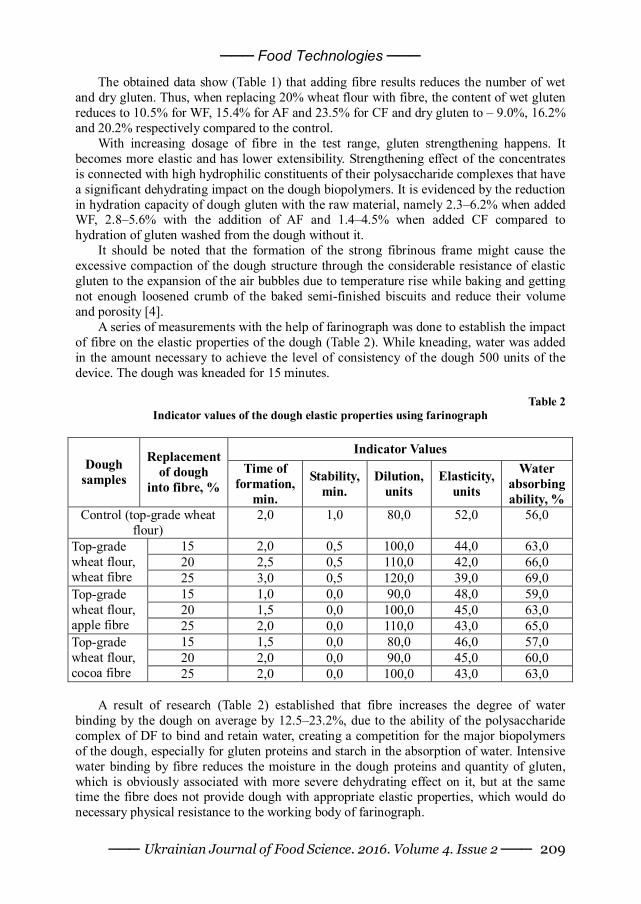
A series of measurements with the help of farinograph was done to establish the impact of fibre on the elastic properties of the dough (Table 2). While kneading, water was added in the amount necessary to achieve the level of consistency of the dough 500 units of the device. The dough was kneaded for 15 minutes.
Table 2
Indicator values of the dough elastic properties using farinograph
Indicator Values Dough
samples
Replacement of dough
into fibre, % Time of
formation, min.
Stability, min.
Dilution, units
Elasticity, units
Water absorbing ability, %
Control (top-grade wheat flour)
2,0 1,0 80,0 52,0 56,0
15 2,0 0,5 100,0 44,0 63,0 20 2,5 0,5 110,0 42,0 66,0
Top-grade wheat flour, wheat fibre 25 3,0 0,5 120,0 39,0 69,0
15 1,0 0,0 90,0 48,0 59,0 20 1,5 0,0 100,0 45,0 63,0
Top-grade wheat flour, apple fibre 25 2,0 0,0 110,0 43,0 65,0
15 1,5 0,0 80,0 46,0 57,0 20 2,0 0,0 90,0 45,0 60,0
Top-grade wheat flour, cocoa fibre 25 2,0 0,0 100,0 43,0 63,0
A result of research (Table 2) established that fibre increases the degree of water
binding by the dough on average by 12.5–23.2%, due to the ability of the polysaccharide complex of DF to bind and retain water, creating a competition for the major biopolymers of the dough, especially for gluten proteins and starch in the absorption of water. Intensive water binding by fibre reduces the moisture in the dough proteins and quantity of gluten, which is obviously associated with more severe dehydrating effect on it, but at the same time the fibre does not provide dough with appropriate elastic properties, which would do necessary physical resistance to the working body of farinograph.
─── Food Technologies ───
─── Ukrainian Journal of Food Science. 2016. Volume 4. Issue 2 ─── 210
It should be noted that the introduction of the investigated concentrates leads to hardening of the dough compared to the control sample by 11.5–17.3% for CF and 7.7–17.3% for AF. The most noticeable decrease of this indicator is typical for the dough with WF, namely by 15.4–25%. The loss of elasticity of the dough is apparently associated with the reduced proportion of gluten in the dough and a significant dehydrating impact of fibre on gluten proteins. The lack of a well-formed elastic fibrinous frame leads to the loss of elasticity, which correlates with data on the quality of gluten [5].
Confirmation of the results is the definition of structural-and-mechanical properties of the dough with fibre on alveograph, which showed that when adding the studied material in an amount of 15–25% to the weight of flour, the dough loses its elasticity and acquires plasticity.
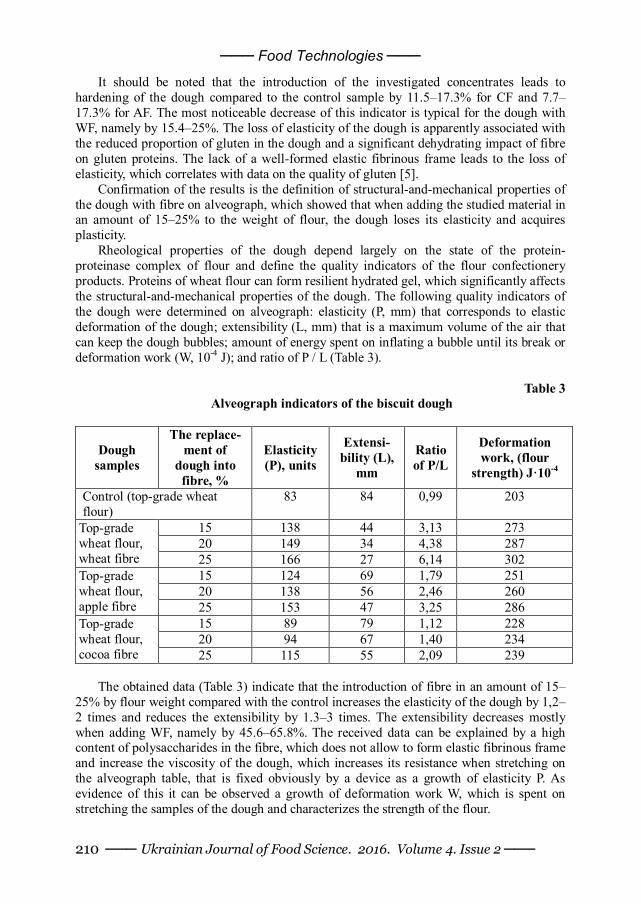
Rheological properties of the dough depend largely on the state of the protein-proteinase complex of flour and define the quality indicators of the flour confectionery products. Proteins of wheat flour can form resilient hydrated gel, which significantly affects the structural-and-mechanical properties of the dough. The following quality indicators of the dough were determined on alveograph: elasticity (P, mm) that corresponds to elastic deformation of the dough; extensibility (L, mm) that is a maximum volume of the air that can keep the dough bubbles; amount of energy spent on inflating a bubble until its break or deformation work (W, 10-4 J); and ratio of P / L (Table 3).
Table 3
Alveograph indicators of the biscuit dough
Dough samples
The replace-ment of
dough into fibre, %
Elasticity (P), units
Extensi-bility (L),
mm
Ratio of P/L
Deformation work, (flour
strength) J·10-4
Control (top-grade wheat flour)
83 84 0,99 203
15 138 44 3,13 273 20 149 34 4,38 287
Top-grade wheat flour, wheat fibre 25 166 27 6,14 302
15 124 69 1,79 251 20 138 56 2,46 260
Top-grade wheat flour, apple fibre 25 153 47 3,25 286
15 89 79 1,12 228 20 94 67 1,40 234
Top-grade wheat flour, cocoa fibre 25 115 55 2,09 239
The obtained data (Table 3) indicate that the introduction of fibre in an amount of 15–
25% by flour weight compared with the control increases the elasticity of the dough by 1,2–2 times and reduces the extensibility by 1.3–3 times. The extensibility decreases mostly when adding WF, namely by 45.6–65.8%. The received data can be explained by a high content of polysaccharides in the fibre, which does not allow to form elastic fibrinous frame and increase the viscosity of the dough, which increases its resistance when stretching on the alveograph table, that is fixed obviously by a device as a growth of elasticity P. As evidence of this it can be observed a growth of deformation work W, which is spent on stretching the samples of the dough and characterizes the strength of the flour.
─── Food Technologies ───
─── Ukrainian Journal of Food Science. 2016. Volume 4. Issue 2 ─── 211
The ratio of P/L, which characterizes a balance between indicators of the physical properties of the dough, rises. This is because the elastic properties of the dough decrease at a slower pace than extensibility.
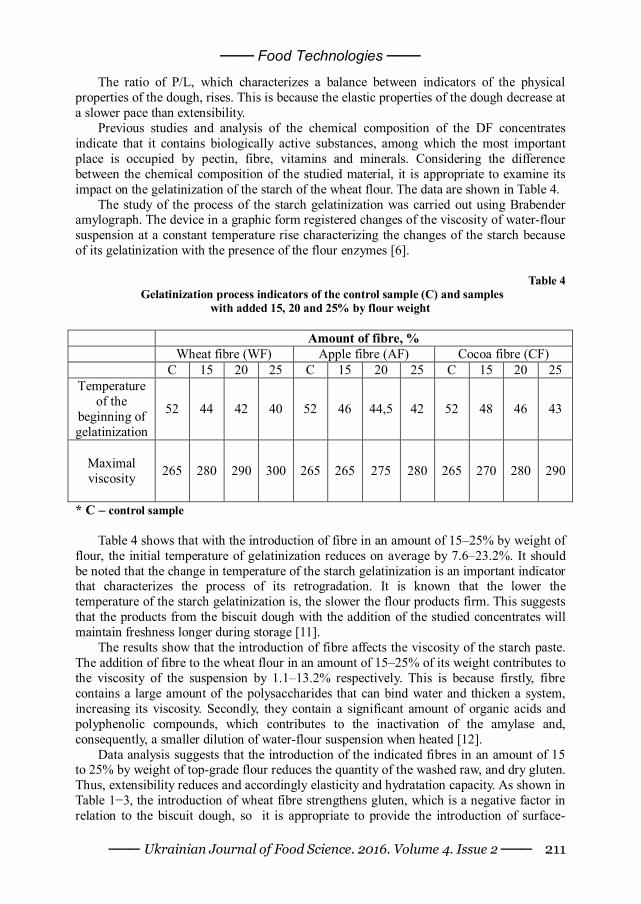
Previous studies and analysis of the chemical composition of the DF concentrates indicate that it contains biologically active substances, among which the most important place is occupied by pectin, fibre, vitamins and minerals. Considering the difference between the chemical composition of the studied material, it is appropriate to examine its impact on the gelatinization of the starch of the wheat flour. The data are shown in Table 4.
The study of the process of the starch gelatinization was carried out using Brabender amylograph. The device in a graphic form registered changes of the viscosity of water-flour suspension at a constant temperature rise characterizing the changes of the starch because of its gelatinization with the presence of the flour enzymes [6].
Table 4
Gelatinization process indicators of the control sample (C) and samples with added 15, 20 and 25% by flour weight
Amount of fibre, % Wheat fibre (WF) Apple fibre (AF) Cocoa fibre (CF) C 15 20 25 C 15 20 25 C 15 20 25
Temperature of the
beginning of gelatinization
52 44 42 40 52 46 44,5 42 52 48 46 43
Maximal viscosity
265 280 290 300 265 265 275 280 265 270 280 290
* C – control sample
Table 4 shows that with the introduction of fibre in an amount of 15–25% by weight of flour, the initial temperature of gelatinization reduces on average by 7.6–23.2%. It should be noted that the change in temperature of the starch gelatinization is an important indicator that characterizes the process of its retrogradation. It is known that the lower the temperature of the starch gelatinization is, the slower the flour products firm. This suggests that the products from the biscuit dough with the addition of the studied concentrates will maintain freshness longer during storage [11].
The results show that the introduction of fibre affects the viscosity of the starch paste. The addition of fibre to the wheat flour in an amount of 15–25% of its weight contributes to the viscosity of the suspension by 1.1–13.2% respectively. This is because firstly, fibre contains a large amount of the polysaccharides that can bind water and thicken a system, increasing its viscosity. Secondly, they contain a significant amount of organic acids and polyphenolic compounds, which contributes to the inactivation of the amylase and, consequently, a smaller dilution of water-flour suspension when heated [12].
Data analysis suggests that the introduction of the indicated fibres in an amount of 15 to 25% by weight of top-grade flour reduces the quantity of the washed raw, and dry gluten. Thus, extensibility reduces and accordingly elasticity and hydratation capacity. As shown in Table 1−3, the introduction of wheat fibre strengthens gluten, which is a negative factor in relation to the biscuit dough, so it is appropriate to provide the introduction of surface-
─── Food Technologies ───
─── Ukrainian Journal of Food Science. 2016. Volume 4. Issue 2 ─── 212
active surfactants (SAS) that will weaken it and thus contribute to obtain finished products with greater porosity and specific volume.
SAS – chemical compounds, concentrating on the interface, causing reduction of the surface tension. One of the most common surfactants, which gained recognition in the technology of flour confectionery products is non-ionic. They are usually compatible with other classes of surfactants, are added to the raw materials in small quantities and are relatively inexpensive. Non-ionic surfactants enable mostly to form an even thin-walled structure of the crumb of FCP that is able to be fresh for a long time and create a relaxative effect on gluten of the dough.
It is suggested to use non-ionic surfactants in the capacity of SAS for the semi-finished biscuits – a mixture of the emulsifiers «Grindsted Cake» produced by Danisco (Denmark) [11] consisting of propylene glycol ester and fatty acids (E 477), mono- and diglycerides of fatty acids (E 471), lactic acid sodium stearate (E 481).
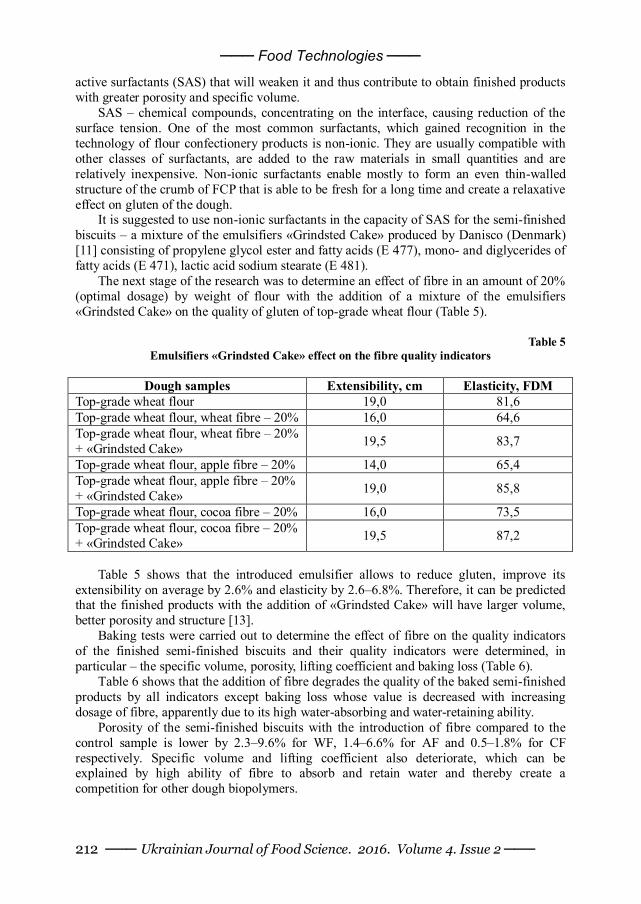
The next stage of the research was to determine an effect of fibre in an amount of 20% (optimal dosage) by weight of flour with the addition of a mixture of the emulsifiers «Grindsted Cake» on the quality of gluten of top-grade wheat flour (Table 5).
Table 5
Emulsifiers «Grindsted Cake» effect on the fibre quality indicators
Dough samples Extensibility, cm Elasticity, FDM Top-grade wheat flour 19,0 81,6 Top-grade wheat flour, wheat fibre – 20% 16,0 64,6 Top-grade wheat flour, wheat fibre – 20% + «Grindsted Cake» 19,5 83,7
Top-grade wheat flour, apple fibre – 20% 14,0 65,4 Top-grade wheat flour, apple fibre – 20% + «Grindsted Cake» 19,0 85,8
Top-grade wheat flour, cocoa fibre – 20% 16,0 73,5 Top-grade wheat flour, cocoa fibre – 20% + «Grindsted Cake» 19,5 87,2
Table 5 shows that the introduced emulsifier allows to reduce gluten, improve its
extensibility on average by 2.6% and elasticity by 2.6–6.8%. Therefore, it can be predicted that the finished products with the addition of «Grindsted Cake» will have larger volume, better porosity and structure [13].
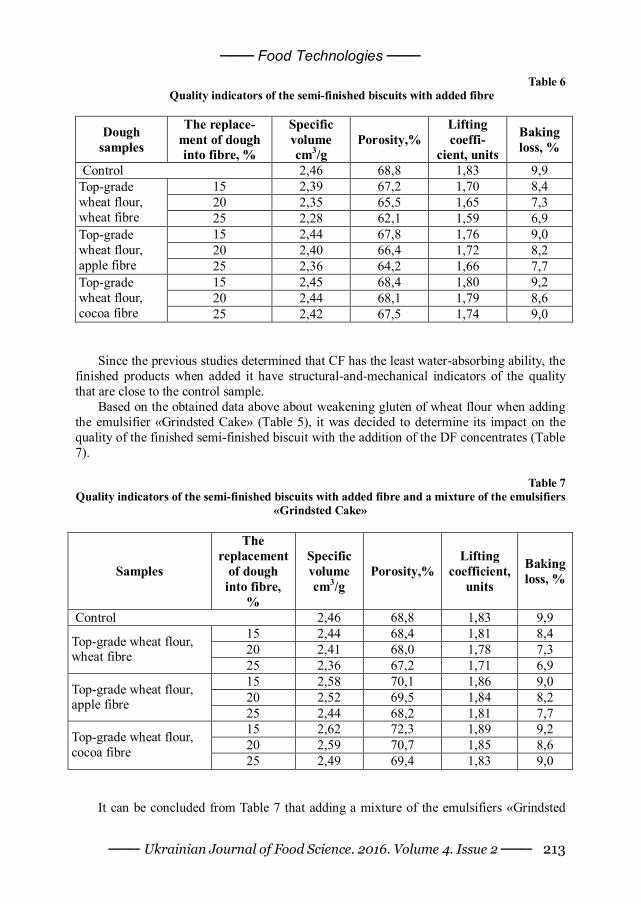
Baking tests were carried out to determine the effect of fibre on the quality indicators of the finished semi-finished biscuits and their quality indicators were determined, in particular – the specific volume, porosity, lifting coefficient and baking loss (Table 6).
Table 6 shows that the addition of fibre degrades the quality of the baked semi-finished products by all indicators except baking loss whose value is decreased with increasing dosage of fibre, apparently due to its high water-absorbing and water-retaining ability.
Porosity of the semi-finished biscuits with the introduction of fibre compared to the control sample is lower by 2.3–9.6% for WF, 1.4–6.6% for AF and 0.5–1.8% for CF respectively. Specific volume and lifting coefficient also deteriorate, which can be explained by high ability of fibre to absorb and retain water and thereby create a competition for other dough biopolymers.
─── Food Technologies ───
─── Ukrainian Journal of Food Science. 2016. Volume 4. Issue 2 ─── 213
Table 6 Quality indicators of the semi-finished biscuits with added fibre
Dough samples
The replace-ment of dough into fibre, %
Specific volume cm3/g
Porosity,% Lifting coeffi-
cient, units
Baking loss, %
Control 2,46 68,8 1,83 9,9 15 2,39 67,2 1,70 8,4 20 2,35 65,5 1,65 7,3
Top-grade wheat flour, wheat fibre 25 2,28 62,1 1,59 6,9
15 2,44 67,8 1,76 9,0 20 2,40 66,4 1,72 8,2
Top-grade wheat flour, apple fibre 25 2,36 64,2 1,66 7,7
15 2,45 68,4 1,80 9,2 20 2,44 68,1 1,79 8,6
Top-grade wheat flour, cocoa fibre 25 2,42 67,5 1,74 9,0
Since the previous studies determined that CF has the least water-absorbing ability, the
finished products when added it have structural-and-mechanical indicators of the quality that are close to the control sample.
Based on the obtained data above about weakening gluten of wheat flour when adding the emulsifier «Grindsted Cake» (Table 5), it was decided to determine its impact on the quality of the finished semi-finished biscuit with the addition of the DF concentrates (Table 7).
Table 7
Quality indicators of the semi-finished biscuits with added fibre and a mixture of the emulsifiers «Grindsted Cake»
Samples
The replacement
of dough into fibre,
%
Specific volume cm3/g
Porosity,% Lifting
coefficient, units
Baking loss, %
Control 2,46 68,8 1,83 9,9 15 2,44 68,4 1,81 8,4 20 2,41 68,0 1,78 7,3 Top-grade wheat flour,
wheat fibre 25 2,36 67,2 1,71 6,9 15 2,58 70,1 1,86 9,0 20 2,52 69,5 1,84 8,2 Top-grade wheat flour,
apple fibre 25 2,44 68,2 1,81 7,7 15 2,62 72,3 1,89 9,2 20 2,59 70,7 1,85 8,6 Top-grade wheat flour,
cocoa fibre 25 2,49 69,4 1,83 9,0
It can be concluded from Table 7 that adding a mixture of the emulsifiers «Grindsted
─── Food Technologies ───
─── Ukrainian Journal of Food Science. 2016. Volume 4. Issue 2 ─── 214
Cake» leads to increased porosity, specific volume and lifting coefficient of the finished product with the addition of WF, AF, and CF, thus, allowing to bring the quality indicators of the semi-finished biscuits to that of a control, or surpass them. In particular, for the samples with the replacement of flour with AF and CF in the amount of 20% a specific volume of the finished products increased by 2.4% and 5.2%, porosity by 1.0% and 2.8%, and lifting coefficient by 0.5% and 1% respectively compared with the control.
The studied quality indicators approach the controls for the sample with the introduction of WF. Thus, the specific volume is lower by 0.8–4.0%, porosity – 0.6–2.3%, and lifting coefficient – 1–2.7% respectively.
Therefore, it can be concluded that in order to improve the quality of the semi-finished biscuits with added fibre it is appropriate to introduce the emulsifier «Grindsted Cake».
Conclusion Thus, adding 15–25% fibre to the weight of flour reduces the amount of wet gluten by
10.5% for WF, 15.4% for AF and 23.5% for CF and dry gluten respectively by 9.0%, 16.2%, and 20.2%. There is a strengthening effect of fibre on the fibrinous frame, which can be associated with high hydrophilic constituents of their polysaccharide complexes that have a significant dehydrating impact on the dough biopolymers.
It is researched that the presence of fibre promotes water absorption ability and formation time of the dough and reduces its stability. It is found that fibre increases the degree of water binding by the dough on average by 12.5–23.2%, due to the ability of polysaccharide complex to bind and retain water. It should be noted that the introduction of the investigated concentrates leads to hardening of the dough by 1.7–23.2% compared to the control sample. The most noticeable decrease of this indicator is typical for the dough with WF.
The results of the study on alveograph indicate that the introduction of fibre in the amount of 15–25% of flour weight compared with the control increases the dough elasticity by 1,2–2 and reduces the extensibility by 1.3–3 times. The obtained data can be explained by a high content of the polysaccharides in the raw materials, which do not allow to form the elastic fibrinous frame and increase the viscosity of the dough.
It is found that initial temperature for gelatinization of the water-flour mixture with added fibre reduces on average by 7.6–23.2%. The study material affects the viscosity of the starch paste and contributes to its increase by 1.1–13.2%, which can be explained by a large number of polysaccharides in its structure that can bind water and thicken the system increasing its viscosity.
It is determined that the introduction of fibre together with a mixture of emulsifiers «Grindsted Cake» to the dough increases its extensibility on average by 2.6% and elasticity by 2.6–6.8%, which will obviously have a positive impact on the quality of finished products.
The obtained data allows to assert that structural-and-mechanical indicators of the quality of semi-finished biscuits with the introduction of dietary fibre concentrates compared with the control reduce, in particular, the porosity by 2.3–9.6% for WF, 1.4% … 6.6 for AF and by 0.5–1.8% for CF respectively. Adding a mixture of the emulsifiers «Grindsted Cake» leads to increased porosity, specific volume and lifting coefficient of the finished products with the addition of WF, AF, and CF, thus allowing to bring the quality indicators of the semi-finished products to that of a control or surpass them.
─── Food Technologies ───
─── Ukrainian Journal of Food Science. 2016. Volume 4. Issue 2 ─── 215
References
1. Samuel F. (2012), Nutrient and Antinutrient content of soy- enriched tapioca, Food
and Nutrition Sciences, 23(3), pp. 23–32. 2. Majzoobi M. (2013), Effect of different Levels and Particle Sizes of Wheat bran on the
quality of flat bread, Garg Sci Tech Glass, 5(1), рр. 115–123. 3. Bruno Ricardo De Castro Leite Júnior, Marcelo Cristianini (2016), Determination of
the influence of High pressure processing on calf rennet using response surface methodology: Effects on milkcoagulation, Food Science and Technology, 65, рр. 10–17.
4. Zapototska О. V. (2012), Vukorustannya harchovuh volokon pru vurobnutstvi rusovogo korpusu dlya koekstryziynuh prodyktiv, Ukrainian Food Journal, 3, pp. 27–30.
5. Steigman A. (2008) All Dietary Fiber is fundamentally functional, Cereal foods world, 48, pp. 128–132.
6. Djuruk N.P., Kovalchyk M.P. (2008), Novi vudu hlibobulochnih vurobiv pidvuschenoyi harchovoi tsinnosti, Hlebopekarskoe i konditerskoe delo, 1, pp. 18–19.
7. Bonsdorff M., Rantanen T., Sipila S. (2011), Birth size and childhood growth as determinants of physical function in ginolderage: the Helsinki birth cohort study, Am. J. Epidemiol, 174(12), pp. 1336–1344.
8. Sabanis D. (2011), Effect of hydrocolloids on selected properties of gluten-free dough and bread, Food Scienceand Technology , 17(4), рр. 91–100.
9. Vasilica N. (2011), Strong flour improvement using maltflour, Journal of Agroalimentary Processesand Technologies, 15(2), pp. 242–244.
10. Svek I. (2009) Image Data of Crumb Structure of Bread from Flour of Czech Spring Wheat Cultivars, Czech Journal of Food Technologies, № 22(4), pp. 133–142.
11. Sidorova L.N., Glovenko M.V. (2008), Pischevie volokna v proizvodstve konditerskih isdeliy, Konditerskoe proszvodstvo, 2, рр.18–20.
12. Samohvalova O.V., Kasabova K.R. (2011), Zbagachennya mafiniv harchovumi voloknami, Naykovi pratsi ONAHT, 40(1), рр. 161–163.
13. Brennan C. S., Tan C. K. (2014), The pasting behavior and freeze-thaw stability of native starch and native-xanthat gym pastes, International Journal of food Scienceand Technology, 10(39), рр. 1017–1022.
─── Food Technologies ───
─── Ukrainian Journal of Food Science. 2016. Volume 4. Issue 2 ─── 216
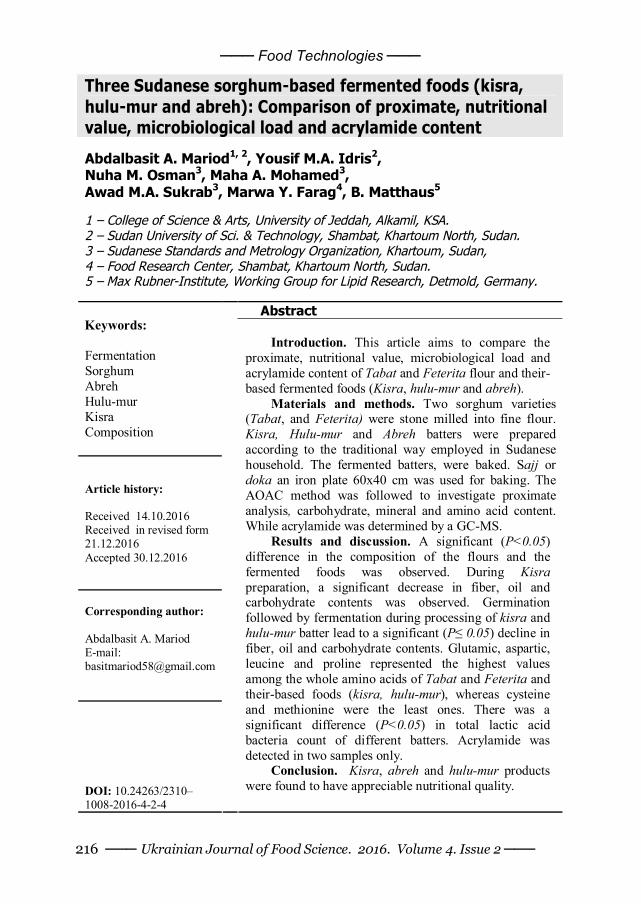
Three Sudanese sorghum-based fermented foods (kisra, hulu-mur and abreh): Comparison of proximate, nutritional value, microbiological load and acrylamide content Abdalbasit A. Mariod1, 2, Yousif M.A. Idris2, Nuha M. Osman3, Maha A. Mohamed3, Awad M.A. Sukrab3, Marwa Y. Farag4, B. Matthaus5 1 – College of Science & Arts, University of Jeddah, Alkamil, KSA. 2 – Sudan University of Sci. & Technology, Shambat, Khartoum North, Sudan. 3 – Sudanese Standards and Metrology Organization, Khartoum, Sudan, 4 – Food Research Center, Shambat, Khartoum North, Sudan. 5 – Max Rubner-Institute, Working Group for Lipid Research, Detmold, Germany.
Abstract
Keywords: Fermentation Sorghum Abreh Hulu-mur Kisra Composition
Article history: Received 14.10.2016 Received in revised form 21.12.2016 Accepted 30.12.2016
Corresponding author: Abdalbasit A. Mariod E-mail: [email protected]
DOI: 10.24263/2310–1008-2016-4-2-4
Introduction. This article aims to compare the
proximate, nutritional value, microbiological load and acrylamide content of Tabat and Feterita flour and their-based fermented foods (Kisra, hulu-mur and abreh).
Materials and methods. Two sorghum varieties (Tabat, and Feterita) were stone milled into fine flour. Kisra, Hulu-mur and Abreh batters were prepared according to the traditional way employed in Sudanese household. The fermented batters, were baked. Sajj or doka an iron plate 60x40 cm was used for baking. The AOAC method was followed to investigate proximate analysis, carbohydrate, mineral and amino acid content. While acrylamide was determined by a GC-MS.
Results and discussion. A significant (P<0.05) difference in the composition of the flours and the fermented foods was observed. During Kisra preparation, a significant decrease in fiber, oil and carbohydrate contents was observed. Germination followed by fermentation during processing of kisra and hulu-mur batter lead to a significant (P≤ 0.05) decline in fiber, oil and carbohydrate contents. Glutamic, aspartic, leucine and proline represented the highest values among the whole amino acids of Tabat and Feterita and their-based foods (kisra, hulu-mur), whereas cysteine and methionine were the least ones. There was a significant difference (P<0.05) in total lactic acid bacteria count of different batters. Acrylamide was detected in two samples only.
Conclusion. Kisra, abreh and hulu-mur products were found to have appreciable nutritional quality.
─── Food Technologies ───
─── Ukrainian Journal of Food Science. 2016. Volume 4. Issue 2 ─── 217
Introduction Sorghum bicolor (family Poaceae), represents the most important staple food for 40%
of Sudan's population with a remarkable degree of rural consumption. The mechanized rain-fed sorghum is the more contributing production wise. It accounts for more than 60% of sorghum total production in Sudan [1]. Sorghum is insufficient in lysine, threonine, and tryptophan, and rich in leucine, proline and glutamic acid. Both fermentation and germination affected sorghum proteins, but with different mechanisms. Germination resulted in the significant breakdown of sorghum starch. Fermented sorghum flour gave rice pasta with improved cooking properties [2]. In many parts of Sudan, people consume whole grain sorghum as fermented flat bread (Kisra), thick porridge (Aceda), thin fermented gruel (Nasha), boiled grain (Balela) and beverages like Abreh and Hulu-mur [3].
Acrylamide or 2-propenamide is a chemical compound, that can be created at abnormal states in high-carbohydrate heat-treated foods. Elements influencing acrylamide composition and degradation in foods are acrylamide precursors for example free amino acids (mainly asparagine), reducing sugars and preparing conditions (i.e. baking time and temperature, moisture content and framework of the item) [4]. This study aims to compare between three Sudanese sorghum-based fermented foods (kisra, hulu-mur and abreh) for their proximate composition, nutritional value, microbiological load and acrylamide content
Materials and methods Sample collection. Two sorghum varieties, named in Sudan as Tabat, and Feterita
were collected from the grain market in Khartoum North, Sudan, and were stone milled into fine flour. The flour was stored at 25°C until used.
Preparation and baking of sorghum kisra batter. Sorghum kisra batter
fermentation and baking were carried out in a conventional way following Mahgoub et al. [3]. A natural fermentation was done by microorganisms found in the previously fermented batter. The fermented batter, (known as Ajin is thin to behave like a liquid). Samples were calculated in triplicate.
Hulu-mur dough preparation and baking procedures. Hulu-mur dough was
prepared following the conventional way utilized in Sudanese household [5]. The dough was kept in a refrigerator at 4°C for chemical analysis. Sajj or doka an iron plate 60x40 cm was used for baking of hulu-mur.
Abreh batter preparation and baking. Abreh batter was prepared according to the
traditional way employed in Sudanese household. The process of baking the fermented batter is done following Mahgoub et al. [3].
Proximate analysis. Moisture, ash, lipid, and crude fiber contents were investigated
following the AOAC method [6]. The carbohydrate percentage was calculated by difference. All analyses were carried out in triplicate.
Carbohydrates and mineral content procedure. Soluble carbohydrates from 4
grams of every flour and processed samples were separated with 50mL of 80% ethanol at 60°C for 30 min. Separation and quantization were carried out on bonded column with a
─── Food Technologies ───
─── Ukrainian Journal of Food Science. 2016. Volume 4. Issue 2 ─── 218
versatile stage of CH3CN and water (80:20 V: V). The AOAC method [6] was utilized to determine minerals. All analyses were carried out in triplicate.
Determination of amino acids. Amino acids were analyzed following AOAC [6]
procedures and separated using Amino Acids Analyzer (Beckman Coulter, Mannheim, Germany). The chemical score was calculated, following Stipanuk & Caudill [7]. All analyses were performed in triplicate.
Acrylamide determination. Acrylamide was determined by a GC-MS method in the
EI mode after extraction of acrylamide from the food material. The quantification was carried out by ions with masses 71 and 74. The separation was completed with a DB-23 capillary column (J&W Scientific Products GmbH, Köln, Germany) (30 m x 0.25 mm i.d., 0.25 mm film thickness). The carrier gas was helium at a stream rate of 1.0 mL/min. The column temperature was at first kept at 80 °C for 2 min and afterward expanded from 80 °C–220 °C at 10° /min. The acrylamide limit of determination was <10 µg/kg in all food materials tested [8-9].
Microbial analysis and total viable count of bacteria. The Plate Count Agar (PCA)
was incubated at 37°C for 48 h. The inoculation was spread all over the plate using sterile bent glass rod (L) shape. The plate was incubated at 37°C for 2-3 days (48-72 h) [10]. In all cases, the bacterial, yeast and mold counts were converted into log CFU g before analysis. All tests were carried out three times.
Statistical analysis. Representative random samples were drawn for analysis. One-
factor Complete Randomize Design (CRD) was performed. Data were analyzed using the Analysis of Variance (ANOVA). Duncan’s multiple range test (DMR) was used to separate means. Significance was accepted at P ≤ 0.05 using a statistical program (SPSS version 20). Three replicates were carried out for each determination [11].
Results and discussion
Proximate composition
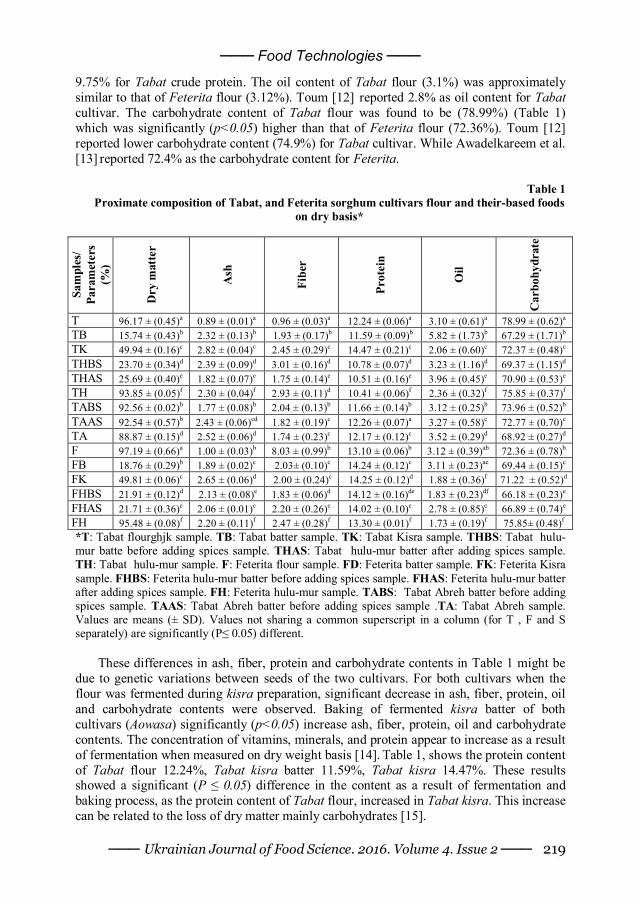
Table (1) shows the proximate composition of dry matter, ash, fiber, protein, oil and carbohydrate of Tabat, and Feterita sorghum cultivars flour and their-based foods on a dry basis. The dry matter of Tabat, and Feterita sorghum cultivars flour was assessed as 96.17 %, and 97.19%, respectively. No significant (p≥0. 05) change was found in the dry matter between Tabat and Feterita flours. Ash content of Tabat flour was found to be 0.89%, which was significantly (p≤0. 05) lower than that of Feterita flour (1.0%). Toum [12] reported very high (2.38%) ash content of Tabat flour. Dietary fiber is all parts of a plant we eat that contain carbohydrates that are resistant to digestion and absorption in the human digestive system. The fiber content of Tabat sorghum cultivar flour was detected at 0.96%, which was significantly (p≤0. 05) lower than that of Feterita flour (8.03%). Awadelkareem, et al. [13] recorded lower fiber content of Feterita at 2.1 and 2.02%, respectively. Toum [12] reported very high fiber content (2.86%) for Tabat flour may be due to climatic or location differences.
The protein content of Tabat flour was found to be 12.24%, which was significantly (p≤0. 05) lower than that of Feterita flour (13.10%). The results obtained were similar to that reported by Awadelkareem, et al.13 who recorded 13.4%. While Toum [12] reported
─── Food Technologies ───
─── Ukrainian Journal of Food Science. 2016. Volume 4. Issue 2 ─── 219
9.75% for Tabat crude protein. The oil content of Tabat flour (3.1%) was approximately similar to that of Feterita flour (3.12%). Toum [12] reported 2.8% as oil content for Tabat cultivar. The carbohydrate content of Tabat flour was found to be (78.99%) (Table 1) which was significantly (p<0.05) higher than that of Feterita flour (72.36%). Toum [12]
reported lower carbohydrate content (74.9%) for Tabat cultivar. While Awadelkareem et al. [13] reported 72.4% as the carbohydrate content for Feterita.
Table 1
Proximate composition of Tabat, and Feterita sorghum cultivars flour and their-based foods on dry basis*
Sam
ples
/ Pa
ram
eter
s (%
)
Dry
mat
ter
Ash
Fibe
r
Prot
ein
Oil
Car
bohy
drat
e
T 96.17 ± (0.45)a 0.89 ± (0.01)a 0.96 ± (0.03)a 12.24 ± (0.06)a 3.10 ± (0.61)a 78.99 ± (0.62)a TB 15.74 ± (0.43)b 2.32 ± (0.13)b 1.93 ± (0.17)b 11.59 ± (0.09)b 5.82 ± (1.73)b 67.29 ± (1.71)b TK 49.94 ± (0.16)c 2.82 ± (0.04)c 2.45 ± (0.29)c 14.47 ± (0.21)c 2.06 ± (0.60)c 72.37 ± (0.48)c THBS 23.70 ± (0.34)d 2.39 ± (0.09)d 3.01 ± (0.16)d 10.78 ± (0.07)d 3.23 ± (1.16)d 69.37 ± (1.15)d THAS 25.69 ± (0.40)e 1.82 ± (0.07)e 1.75 ± (0.14)e 10.51 ± (0.16)e 3.96 ± (0.45)e 70.90 ± (0.53)e TH 93.85 ± (0.05)f 2.30 ± (0.04)f 2.93 ± (0.11)d 10.41 ± (0.06)f 2.36 ± (0.32)f 75.85 ± (0.37)f TABS 92.56 ± (0.02)b 1.77 ± (0.08)b 2.04 ± (0.13)b 11.66 ± (0.14)b 3.12 ± (0.25)b 73.96 ± (0.52)b TAAS 92.54 ± (0.57)b 2.43 ± (0.06)cd 1.82 ± (0.19)c 12.26 ± (0.07)a 3.27 ± (0.58)c 72.77 ± (0.70)c TA 88.87 ± (0.15)d 2.52 ± (0.06)d 1.74 ± (0.23)c 12.17 ± (0.12)c 3.52 ± (0.29)d 68.92 ± (0.27)d F 97.19 ± (0.66)a 1.00 ± (0.03)b 8.03 ± (0.99)b 13.10 ± (0.06)b 3.12 ± (0.39)ab 72.36 ± (0.78)b FB 18.76 ± (0.29)b 1.89 ± (0.02)c 2.03± (0.10)c 14.24 ± (0.12)c 3.11 ± (0.23)ae 69.44 ± (0.15)c FK 49.81 ± (0.06)c 2.65 ± (0.06)d 2.00 ± (0.24)c 14.25 ± (0.12)d 1.88 ± (0.36)f 71.22 ± (0.52)d FHBS 21.91 ± (0.12)d 2.13 ± (0.08)e 1.83 ± (0.06)d 14.12 ± (0.16)de 1.83 ± (0.23)df 66.18 ± (0.23)e FHAS 21.71 ± (0.36)e 2.06 ± (0.01)e 2.20 ± (0.26)e 14.02 ± (0.10)e 2.78 ± (0.85)e 66.89 ± (0.74)e FH 95.48 ± (0.08)f 2.20 ± (0.11)f 2.47 ± (0.28)f 13.30 ± (0.01)f 1.73 ± (0.19)f 75.85± (0.48)f *T: Tabat flourghjk sample. TB: Tabat batter sample. TK: Tabat Kisra sample. THBS: Tabat hulu-mur batte before adding spices sample. THAS: Tabat hulu-mur batter after adding spices sample. TH: Tabat hulu-mur sample. F: Feterita flour sample. FD: Feterita batter sample. FK: Feterita Kisra sample. FHBS: Feterita hulu-mur batter before adding spices sample. FHAS: Feterita hulu-mur batter after adding spices sample. FH: Feterita hulu-mur sample. TABS: Tabat Abreh batter before adding spices sample. TAAS: Tabat Abreh batter before adding spices sample .TA: Tabat Abreh sample. Values are means (± SD). Values not sharing a common superscript in a column (for T , F and S separately) are significantly (P≤ 0.05) different.
These differences in ash, fiber, protein and carbohydrate contents in Table 1 might be
due to genetic variations between seeds of the two cultivars. For both cultivars when the flour was fermented during kisra preparation, significant decrease in ash, fiber, protein, oil and carbohydrate contents were observed. Baking of fermented kisra batter of both cultivars (Aowasa) significantly (p<0.05) increase ash, fiber, protein, oil and carbohydrate contents. The concentration of vitamins, minerals, and protein appear to increase as a result of fermentation when measured on dry weight basis [14]. Table 1, shows the protein content of Tabat flour 12.24%, Tabat kisra batter 11.59%, Tabat kisra 14.47%. These results showed a significant (P ≤ 0.05) difference in the content as a result of fermentation and baking process, as the protein content of Tabat flour, increased in Tabat kisra. This increase can be related to the loss of dry matter mainly carbohydrates [15].
─── Food Technologies ───
─── Ukrainian Journal of Food Science. 2016. Volume 4. Issue 2 ─── 220
From Table 1, the protein content of Tabat flour is 12.24% and it was decreased in Tabat hulu-mur batter before adding spices to 10.78%, and to 10.51% in Tabat hulu-mur batter after adding spices, and to 10.41% in Tabat hulu-mur. There was a significant (P≥ 0.05) decrease in protein content from 12.24 to 10.41% during Tabat hulu-mur batter fermentation. This reduction may be identified with germination and malting forms as malting is a biotechnological strategy which includes the controlled germination of a cereal grain, which goes for initiating enzyme systems that catalyze the hydrolysis of polymerized reserved food materials, notably, proteins, starches and cell-wall substances, thus, extracting fermentable materials [16]. The slight change in protein content may attribute to the fact that water-soluble nitrogen was lost during soaking of seeds (sorghum seeds were soaked prior germination) and also, during seed germination, part of the protein was utilized for the development and advancement of the embryo [17].
The carbohydrate content of Tabat flour was 78.99 %, and that of Tabat kisra batter was 67.29%, and Tabat kisra was 72.37% (Table1). While the carbohydrate content of Tabat hulu-mur batter before adding spices was 69.37%, and Tabat hulu-mur batter after adding spices was 70.90%, and Tabat hulu-mur was 75.85%. Table 1 clearly indicates a significant (P≥ 0.05) decrease in carbohydrate content with fermentation. This is due to microbial activity on Tabat fermentation. The available carbohydrates are converted to organic acids due to the fermentation process and significantly (P≥ 0.05) reduced the amount of carbohydrates which may be attributed to the utilization of sugars by the fermenting microflora [18].
The proximate composition of Abreh produced from Tabat cultivar is given in Table 1. The ash, fiber, protein, oil and carbohydrate contents of Tabat flour and Abreh product were significantly (P≤ 0.05) different. In the decorticated sorghum, the germ was partly or completely removed. This may have nutritious results as the germ contains most minerals and lipids. During Abreh processing the seeds first decorticated so this decortication had numerous effects on grain composition. The protein content of Tabat flour was 12.24% it was signed (P≤0.05) decreased to 11.66% in Abreh batter before the addition of spices, this decrease was related to a fermentation process. No significant (P≤0.05) difference in protein content of Tabat flour and Abreh as a final product.
The proximate composition of Feteria flour and its based products (Kisra and Hulu-mur) is given in Table 1. The ash, fiber, protein, oil and carbohydrate contents of Feterita flour and its based products (Kisra and Hulu-mur) were significantly (P≤ 0.05) different. When the flour was fermented during Kisra preparation, a significant decrease in fiber, oil, and carbohydrate contents were observed. While the crude protein content was increased by fermentation. These results are in good agreement with that of EI Tinay et al. [19] who reported a slight increase in protein content of Kisra produced from three sorghum varieties as a result of fermentation. Adams[14] reported an increase in the concentration of minerals and protein as result of cereal fermentation.
Baking of fermented kisra batter (Aowasa) significantly (p<0.05) increase ash, and protein contents. These results were disagreeing with the results of Elkhalifa et al. [20] who reported that, the protein content of Kisra was slightly lower than the value for its fermented batter.
The proximate composition of Feteria flour and it is based product Hulu-mur is given in Table 1. The ash, fiber, protein, oil and carbohydrate contents of Feterita flour and that of Hulu-mur produced from it were significantly (P≤ 0.05) different. Germination of Feterita seeds followed by fermentation during processing of hulu-mur batter lead to a significant (P≤ 0.05) decline in fiber, oil and carbohydrate contents, and a slight increase of ash and protein, respectively. These outcomes are in good agreement with that of Mella
─── Food Technologies ───
─── Ukrainian Journal of Food Science. 2016. Volume 4. Issue 2 ─── 221
[21] who reported that fermentation brought about an expansion in the amounts of soluble proteins and the free amino acids. Malting and fermentation pre-treatments can enhance the composition and functionality of sorghum flour. The reduction in fat and carbohydrate contents might be because of the way that biochemical and physiological changes happened during germination; such changes need the energy to continue, and therefore part of the seed fat was utilized for the production of this energy [22]. Adding spices to the germinated fermented batter of hulu-mur significantly (P≤ 0.05) increase fiber, oil and carbohydrate contents, respectively. Baking (Aowasa) of hulu-mur batter significantly (P≤ 0.05) increase the dry matter, ash, and fiber contents, and decreased protein and oil contents, respectively. In contrast Khalil, et al. [23] reported that baking had no impact on fatty and amino acid composition. However, it increased the Na and Ca levels, but decreased the K, P, and vitamin B5 amounts
Carbohydrate content
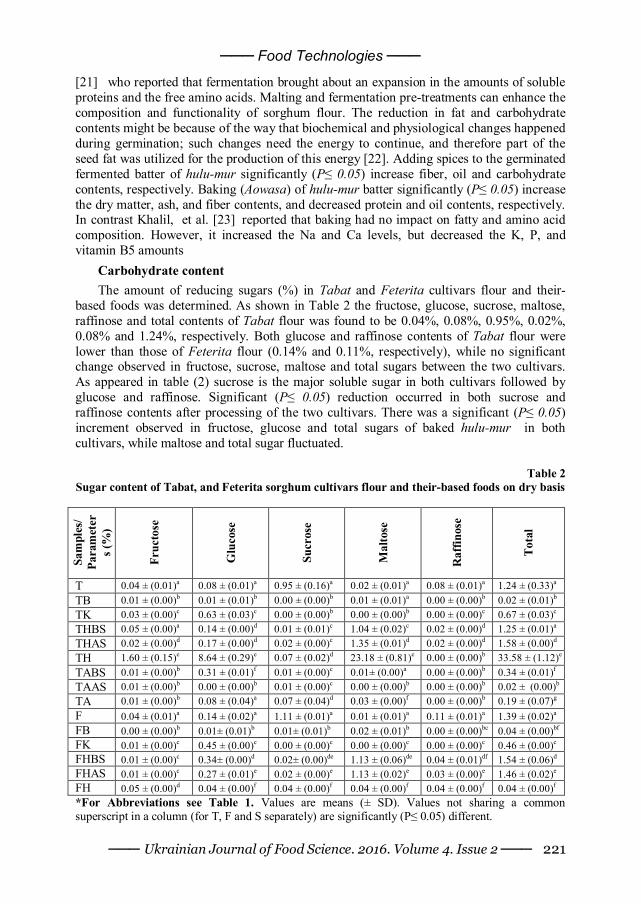
The amount of reducing sugars (%) in Tabat and Feterita cultivars flour and their-based foods was determined. As shown in Table 2 the fructose, glucose, sucrose, maltose, raffinose and total contents of Tabat flour was found to be 0.04%, 0.08%, 0.95%, 0.02%, 0.08% and 1.24%, respectively. Both glucose and raffinose contents of Tabat flour were lower than those of Feterita flour (0.14% and 0.11%, respectively), while no significant change observed in fructose, sucrose, maltose and total sugars between the two cultivars. As appeared in table (2) sucrose is the major soluble sugar in both cultivars followed by glucose and raffinose. Significant (P≤ 0.05) reduction occurred in both sucrose and raffinose contents after processing of the two cultivars. There was a significant (P≤ 0.05) increment observed in fructose, glucose and total sugars of baked hulu-mur in both cultivars, while maltose and total sugar fluctuated.
Table 2
Sugar content of Tabat, and Feterita sorghum cultivars flour and their-based foods on dry basis
Sam
ples
/ Pa
ram
eter
s (%
)
Fruc
tose
Glu
cose
Sucr
ose
Mal
tose
Raf
finos
e
Tota
l
T 0.04 ± (0.01)a 0.08 ± (0.01)a 0.95 ± (0.16)a 0.02 ± (0.01)a 0.08 ± (0.01)a 1.24 ± (0.33)a TB 0.01 ± (0.00)b 0.01 ± (0.01)b 0.00 ± (0.00)b 0.01 ± (0.01)a 0.00 ± (0.00)b 0.02 ± (0.01)b TK 0.03 ± (0.00)c 0.63 ± (0.03)c 0.00 ± (0.00)b 0.00 ± (0.00)b 0.00 ± (0.00)c 0.67 ± (0.03)c THBS 0.05 ± (0.00)a 0.14 ± (0.00)d 0.01 ± (0.01)c 1.04 ± (0.02)c 0.02 ± (0.00)d 1.25 ± (0.01)a THAS 0.02 ± (0.00)d 0.17 ± (0.00)d 0.02 ± (0.00)c 1.35 ± (0.01)d 0.02 ± (0.00)d 1.58 ± (0.00)d TH 1.60 ± (0.15)e 8.64 ± (0.29)e 0.07 ± (0.02)d 23.18 ± (0.81)e 0.00 ± (0.00)b 33.58 ± (1.12)e TABS 0.01 ± (0.00)b 0.31 ± (0.01)f 0.01 ± (0.00)c 0.01± (0.00)a 0.00 ± (0.00)b 0.34 ± (0.01)f TAAS 0.01 ± (0.00)b 0.00 ± (0.00)b 0.01 ± (0.00)c 0.00 ± (0.00)b 0.00 ± (0.00)b 0.02 ± (0.00)b TA 0.01 ± (0.00)b 0.08 ± (0.04)a 0.07 ± (0.04)d 0.03 ± (0.00)f 0.00 ± (0.00)b 0.19 ± (0.07)g F 0.04 ± (0.01)a 0.14 ± (0.02)a 1.11 ± (0.01)a 0.01 ± (0.01)a 0.11 ± (0.01)a 1.39 ± (0.02)a FB 0.00 ± (0.00)b 0.01± (0.01)b 0.01± (0.01)b 0.02 ± (0.01)b 0.00 ± (0.00)bc 0.04 ± (0.00)bf FK 0.01 ± (0.00)c 0.45 ± (0.00)c 0.00 ± (0.00)c 0.00 ± (0.00)c 0.00 ± (0.00)c 0.46 ± (0.00)c FHBS 0.01 ± (0.00)c 0.34± (0.00)d 0.02± (0.00)de 1.13 ± (0.06)de 0.04 ± (0.01)df 1.54 ± (0.06)d FHAS 0.01 ± (0.00)c 0.27 ± (0.01)e 0.02 ± (0.00)e 1.13 ± (0.02)e 0.03 ± (0.00)e 1.46 ± (0.02)e FH 0.05 ± (0.00)d 0.04 ± (0.00)f 0.04 ± (0.00)f 0.04 ± (0.00)f 0.04 ± (0.00)f 0.04 ± (0.00)f *For Abbreviations see Table 1. Values are means (± SD). Values not sharing a common superscript in a column (for T, F and S separately) are significantly (P≤ 0.05) different.
─── Food Technologies ───
─── Ukrainian Journal of Food Science. 2016. Volume 4. Issue 2 ─── 222
Minerals content
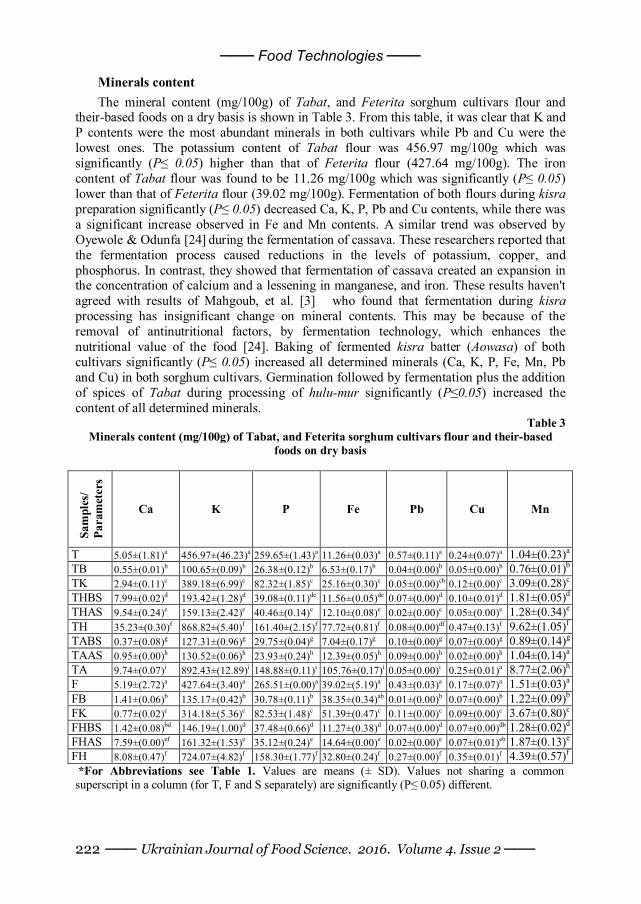
The mineral content (mg/100g) of Tabat, and Feterita sorghum cultivars flour and their-based foods on a dry basis is shown in Table 3. From this table, it was clear that K and P contents were the most abundant minerals in both cultivars while Pb and Cu were the lowest ones. The potassium content of Tabat flour was 456.97 mg/100g which was significantly (P≤ 0.05) higher than that of Feterita flour (427.64 mg/100g). The iron content of Tabat flour was found to be 11.26 mg/100g which was significantly (P≤ 0.05) lower than that of Feterita flour (39.02 mg/100g). Fermentation of both flours during kisra preparation significantly (P≤ 0.05) decreased Ca, K, P, Pb and Cu contents, while there was a significant increase observed in Fe and Mn contents. A similar trend was observed by Oyewole & Odunfa [24] during the fermentation of cassava. These researchers reported that the fermentation process caused reductions in the levels of potassium, copper, and phosphorus. In contrast, they showed that fermentation of cassava created an expansion in the concentration of calcium and a lessening in manganese, and iron. These results haven't agreed with results of Mahgoub, et al. [3] who found that fermentation during kisra processing has insignificant change on mineral contents. This may be because of the removal of antinutritional factors, by fermentation technology, which enhances the nutritional value of the food [24]. Baking of fermented kisra batter (Aowasa) of both cultivars significantly (P≤ 0.05) increased all determined minerals (Ca, K, P, Fe, Mn, Pb and Cu) in both sorghum cultivars. Germination followed by fermentation plus the addition of spices of Tabat during processing of hulu-mur significantly (P≤0.05) increased the content of all determined minerals.
Table 3 Minerals content (mg/100g) of Tabat, and Feterita sorghum cultivars flour and their-based
foods on dry basis
Sam
ples
/ Pa
ram
eter
s
Ca K P Fe Pb Cu Mn
T 5.05±(1.81)a 456.97±(46.23)a 259.65±(1.43)a 11.26±(0.03)a 0.57±(0.11)a 0.24±(0.07)a 1.04±(0.23)a TB 0.55±(0.01)b 100.65±(0.09)b 26.38±(0.12)b 6.53±(0.17)b 0.04±(0.00)b 0.05±(0.00)b 0.76±(0.01)b TK 2.94±(0.11)c 389.18±(6.99)c 82.32±(1.85)c 25.16±(0.30)c 0.05±(0.00)cb 0.12±(0.00)c 3.09±(0.28)c THBS 7.99±(0.02)d 193.42±(1.28)d 39.08±(0.11)de 11.56±(0.05)de 0.07±(0.00)d 0.10±(0.01)d 1.81±(0.05)d THAS 9.54±(0.24)e 159.13±(2.42)e 40.46±(0.14)e 12.10±(0.08)e 0.02±(0.00)e 0.05±(0.00)e 1.28±(0.34)e TH 35.23±(0.30)f 868.82±(5.40)f 161.40±(2.15)f 77.72±(0.81)f 0.08±(0.00)df 0.47±(0.13)f 9.62±(1.05)f TABS 0.37±(0.08)g 127.31±(0.96)g 29.75±(0.04)g 7.04±(0.17)g 0.10±(0.00)g 0.07±(0.00)g 0.89±(0.14)g TAAS 0.95±(0.00)h 130.52±(0.06)h 23.93±(0.24)h 12.39±(0.05)h 0.09±(0.00)h 0.02±(0.00)h 1.04±(0.14)a TA 9.74±(0.07)i 892.43±(12.89)i 148.88±(0.11)i 105.76±(0.17)i 0.05±(0.00)i 0.25±(0.01)a 8.77±(2.06)h F 5.19±(2.72)a 427.64±(3.40)a 265.51±(0.00)a 39.02±(5.19)a 0.43±(0.03)a 0.17±(0.07)a 1.51±(0.03)a FB 1.41±(0.06)b 135.17±(0.42)b 30.78±(0.11)b 38.35±(0.34)ab 0.01±(0.00)b 0.07±(0.00)b 1.22±(0.09)b FK 0.77±(0.02)c 314.18±(5.36)c 82.53±(1.48)c 51.39±(0.47)c 0.11±(0.00)c 0.09±(0.00)c 3.67±(0.80)c FHBS 1.42±(0.08)bd 146.19±(1.00)d 37.48±(0.66)d 11.27±(0.38)d 0.07±(0.00)d 0.07±(0.00)db 1.28±(0.02)d FHAS 7.59±(0.00)ef 161.32±(1.53)e 35.12±(0.24)e 14.64±(0.00)e 0.02±(0.00)e 0.07±(0.01)eb 1.87±(0.13)e FH 8.08±(0.47)f 724.07±(4.82)f 158.30±(1.77)f 32.80±(0.24)f 0.27±(0.00)f 0.35±(0.01)f 4.39±(0.57)f *For Abbreviations see Table 1. Values are means (± SD). Values not sharing a common superscript in a column (for T, F and S separately) are significantly (P≤ 0.05) different.
─── Food Technologies ───
─── Ukrainian Journal of Food Science. 2016. Volume 4. Issue 2 ─── 223
The mineral content of Abreh produced from Tabat cultivar is given in Table 3. This content was significantly different than that of Tabat flour. During Abreh processing the grains were decorticated and the bran was separated. This process decreased the content of minerals as shown in Table 3. The addition of spices followed by baking increased the mineral content of Abreh produced from Tabat flour. Akhtar, et al. [25] reported minor losses during baking of fortified whole wheat flour. Germination followed by fermentation plus the addition of spices of Feterita during processing of hulu-mur significantly (P≤0.05) increased the contents of Ca, K, Cu and Mn minerals. While the contents of P, Fe and Pb were decreased (Table 3).
Amino acids
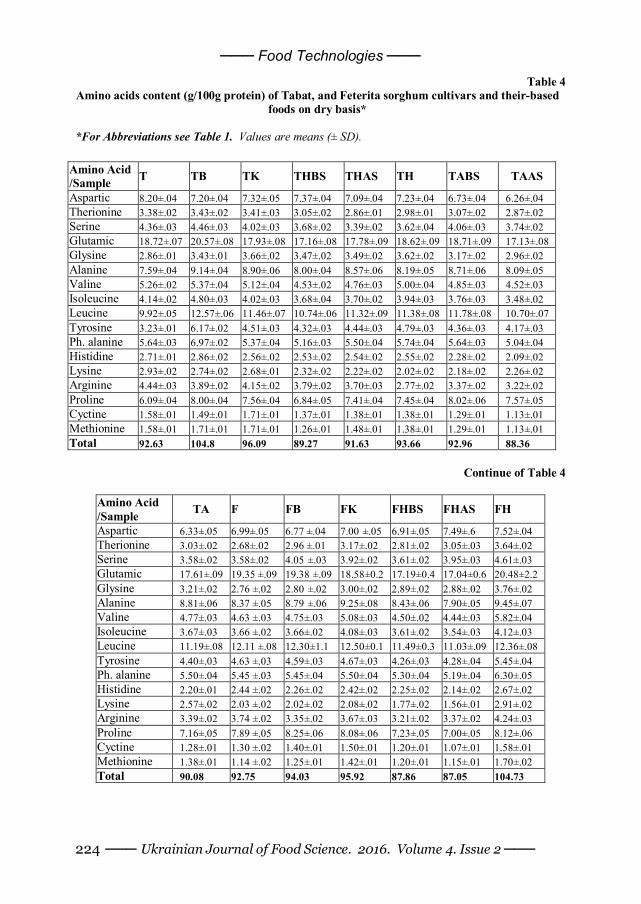
Table 4 shows the amino acid content (g/100g protein) of Tabat, and Feterita sorghum cultivars flour and their-based foods (kisra, hulu-mur) on a dry basis. As shown in Table 4 glutamic, aspartic, leucine and proline represent the highest values among the whole amino acids of Tabat and Feterita and their-based foods (kisra, hulu-mur), whereas cyctine and methionine were the lowest ones. Youssef, [26] revealed that glutamic acid, leucine, alanine and proline were found in highest amounts among the amino acids of total protein of sorghum varieties. Osman, [15] reported a significant (P≤0.05) decrease in glycine, lysine and arginine content of pearl millet during preparation of Lohoh when fermented for 24 h.
The total amino acid in Tabat flour (92.63 g/100gm protein) was affected by fermentation and preparation as it was increased to 104.09 and 96.09 g/100gm protein in TD and TK, respectively. Fermentation of Tabat flour resulted in a decrease in the level of nine amino acids (aspartic, serine, glutamic, valine, isoluecine, phenyle alanine, histidine, lysine and arginine) in TK. While Threonine, methionine, cysteine, proline, tyrosine, leucine, alanine and glycine were enriched during Kisra fermentation in Tabat sorghum studied (Table 4). El Tinay, et al. [27] found that fermentation of sorghum resulted in a decrease in the level of most of the essential amino acids. In a previous study El Tinay, et al. [19] investigated the nutritive value of sorghum Kisra and they showed no increase in lysine or threonine but tyrosine and methionine did increase.
The total amino acid in Tabat flour (92.63 g/100gm protein) decreased to 89.27, in MHBS as affected by germination and fermentation processes during Hulu-mur preparation, and it was increased to 91.63 g/100gm in THAS as a result of spices addition. The previous amount was increased to 93.66 g/100gm protein in TH as affected by the baking process. Mella, [21] reported an increase in free amino acids in the malted and fermented sorghum flour. Decortication of Tabat grains followed by a fermentation process for the batter decreased the total amino acid of Tabat flour from 92.63 g/100gm protein to 92.96 in TABS and 88.36 in TAAS and 90.08 in TA. The content of eleven amino acids was decreased during Abreh processing and after addition of spices. While the content of glycine, alanine, leucine, tyrosine and proline was increased (Table 4).
─── Food Technologies ───
─── Ukrainian Journal of Food Science. 2016. Volume 4. Issue 2 ─── 224
Table 4 Amino acids content (g/100g protein) of Tabat, and Feterita sorghum cultivars and their-based
foods on dry basis*
*For Abbreviations see Table 1. Values are means (± SD).
Amino Acid /Sample T TB TK THBS THAS TH TABS TAAS
Aspartic 8.20±.04 7.20±.04 7.32±.05 7.37±.04 7.09±.04 7.23±.04 6.73±.04 6.26±.04 Therionine 3.38±.02 3.43±.02 3.41±.03 3.05±.02 2.86±.01 2.98±.01 3.07±.02 2.87±.02 Serine 4.36±.03 4.46±.03 4.02±.03 3.68±.02 3.39±.02 3.62±.04 4.06±.03 3.74±.02 Glutamic 18.72±.07 20.57±.08 17.93±.08 17.16±.08 17.78±.09 18.62±.09 18.71±.09 17.13±.08 Glysine 2.86±.01 3.43±.01 3.66±.02 3.47±.02 3.49±.02 3.62±.02 3.17±.02 2.96±.02 Alanine 7.59±.04 9.14±.04 8.90±.06 8.00±.04 8.57±.06 8.19±.05 8.71±.06 8.09±.05 Valine 5.26±.02 5.37±.04 5.12±.04 4.53±.02 4.76±.03 5.00±.04 4.85±.03 4.52±.03 Isoleucine 4.14±.02 4.80±.03 4.02±.03 3.68±.04 3.70±.02 3.94±.03 3.76±.03 3.48±.02 Leucine 9.92±.05 12.57±.06 11.46±.07 10.74±.06 11.32±.09 11.38±.08 11.78±.08 10.70±.07 Tyrosine 3.23±.01 6.17±.02 4.51±.03 4.32±.03 4.44±.03 4.79±.03 4.36±.03 4.17±.03 Ph. alanine 5.64±.03 6.97±.02 5.37±.04 5.16±.03 5.50±.04 5.74±.04 5.64±.03 5.04±.04 Histidine 2.71±.01 2.86±.02 2.56±.02 2.53±.02 2.54±.02 2.55±.02 2.28±.02 2.09±.02 Lysine 2.93±.02 2.74±.02 2.68±.01 2.32±.02 2.22±.02 2.02±.02 2.18±.02 2.26±.02 Arginine 4.44±.03 3.89±.02 4.15±.02 3.79±.02 3.70±.03 2.77±.02 3.37±.02 3.22±.02 Proline 6.09±.04 8.00±.04 7.56±.04 6.84±.05 7.41±.04 7.45±.04 8.02±.06 7.57±.05 Cyctine 1.58±.01 1.49±.01 1.71±.01 1.37±.01 1.38±.01 1.38±.01 1.29±.01 1.13±.01 Methionine 1.58±.01 1.71±.01 1.71±.01 1.26±.01 1.48±.01 1.38±.01 1.29±.01 1.13±.01 Total 92.63 104.8 96.09 89.27 91.63 93.66 92.96 88.36
Continue of Table 4
Amino Acid /Sample TA F FB FK FHBS FHAS FH
Aspartic 6.33±.05 6.99±.05 6.77 ±.04 7.00 ±.05 6.91±.05 7.49±.6 7.52±.04 Therionine 3.03±.02 2.68±.02 2.96 ±.01 3.17±.02 2.81±.02 3.05±.03 3.64±.02 Serine 3.58±.02 3.58±.02 4.05 ±.03 3.92±.02 3.61±.02 3.95±.03 4.61±.03 Glutamic 17.61±.09 19.35 ±.09 19.38 ±.09 18.58±0.2 17.19±0.4 17.04±0.6 20.48±2.2 Glysine 3.21±.02 2.76 ±.02 2.80 ±.02 3.00±.02 2.89±.02 2.88±.02 3.76±.02 Alanine 8.81±.06 8.37 ±.05 8.79 ±.06 9.25±.08 8.43±.06 7.90±.05 9.45±.07 Valine 4.77±.03 4.63 ±.03 4.75±.03 5.08±.03 4.50±.02 4.44±.03 5.82±.04 Isoleucine 3.67±.03 3.66 ±.02 3.66±.02 4.08±.03 3.61±.02 3.54±.03 4.12±.03 Leucine 11.19±.08 12.11 ±.08 12.30±1.1 12.50±0.1 11.49±0.3 11.03±.09 12.36±.08 Tyrosine 4.40±.03 4.63 ±.03 4.59±.03 4.67±.03 4.26±.03 4.28±.04 5.45±.04 Ph. alanine 5.50±.04 5.45 ±.03 5.45±.04 5.50±.04 5.30±.04 5.19±.04 6.30±.05 Histidine 2.20±.01 2.44 ±.02 2.26±.02 2.42±.02 2.25±.02 2.14±.02 2.67±.02 Lysine 2.57±.02 2.03 ±.02 2.02±.02 2.08±.02 1.77±.02 1.56±.01 2.91±.02 Arginine 3.39±.02 3.74 ±.02 3.35±.02 3.67±.03 3.21±.02 3.37±.02 4.24±.03 Proline 7.16±.05 7.89 ±.05 8.25±.06 8.08±.06 7.23±.05 7.00±.05 8.12±.06 Cyctine 1.28±.01 1.30 ±.02 1.40±.01 1.50±.01 1.20±.01 1.07±.01 1.58±.01 Methionine 1.38±.01 1.14 ±.02 1.25±.01 1.42±.01 1.20±.01 1.15±.01 1.70±.02 Total 90.08 92.75 94.03 95.92 87.86 87.05 104.73
─── Food Technologies ───
─── Ukrainian Journal of Food Science. 2016. Volume 4. Issue 2 ─── 225
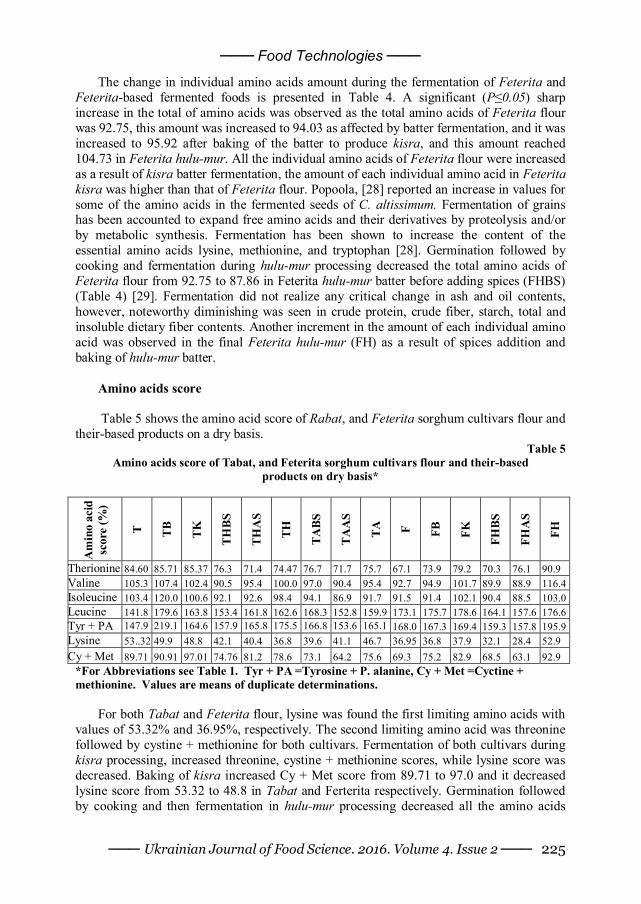
The change in individual amino acids amount during the fermentation of Feterita and Feterita-based fermented foods is presented in Table 4. A significant (P≤0.05) sharp increase in the total of amino acids was observed as the total amino acids of Feterita flour was 92.75, this amount was increased to 94.03 as affected by batter fermentation, and it was increased to 95.92 after baking of the batter to produce kisra, and this amount reached 104.73 in Feterita hulu-mur. All the individual amino acids of Feterita flour were increased as a result of kisra batter fermentation, the amount of each individual amino acid in Feterita kisra was higher than that of Feterita flour. Popoola, [28] reported an increase in values for some of the amino acids in the fermented seeds of C. altissimum. Fermentation of grains has been accounted to expand free amino acids and their derivatives by proteolysis and/or by metabolic synthesis. Fermentation has been shown to increase the content of the essential amino acids lysine, methionine, and tryptophan [28]. Germination followed by cooking and fermentation during hulu-mur processing decreased the total amino acids of Feterita flour from 92.75 to 87.86 in Feterita hulu-mur batter before adding spices (FHBS) (Table 4) [29]. Fermentation did not realize any critical change in ash and oil contents, however, noteworthy diminishing was seen in crude protein, crude fiber, starch, total and insoluble dietary fiber contents. Another increment in the amount of each individual amino acid was observed in the final Feterita hulu-mur (FH) as a result of spices addition and baking of hulu-mur batter.
Amino acids score Table 5 shows the amino acid score of Rabat, and Feterita sorghum cultivars flour and
their-based products on a dry basis. Table 5
Amino acids score of Tabat, and Feterita sorghum cultivars flour and their-based products on dry basis*
Am
ino
acid
sc
ore
(%)
T TB
TK
THBS
THA
S
TH
TABS
TAA
S
TA
F FB
FK
FHBS
FHA
S
FH
Therionine 84.60 85.71 85.37 76.3 71.4 74.47 76.7 71.7 75.7 67.1 73.9 79.2 70.3 76.1 90.9 Valine 105.3 107.4 102.4 90.5 95.4 100.0 97.0 90.4 95.4 92.7 94.9 101.7 89.9 88.9 116.4 Isoleucine 103.4 120.0 100.6 92.1 92.6 98.4 94.1 86.9 91.7 91.5 91.4 102.1 90.4 88.5 103.0 Leucine 141.8 179.6 163.8 153.4 161.8 162.6 168.3 152.8 159.9 173.1 175.7 178.6 164.1 157.6 176.6 Tyr + PA 147.9 219.1 164.6 157.9 165.8 175.5 166.8 153.6 165.1 168.0 167.3 169.4 159.3 157.8 195.9 Lysine 53..32 49.9 48.8 42.1 40.4 36.8 39.6 41.1 46.7 36.95 36.8 37.9 32.1 28.4 52.9 Cy + Met 89.71 90.91 97.01 74.76 81.2 78.6 73.1 64.2 75.6 69.3 75.2 82.9 68.5 63.1 92.9
*For Abbreviations see Table 1. Tyr + PA =Tyrosine + P. alanine, Cy + Met =Cyctine + methionine. Values are means of duplicate determinations.
For both Tabat and Feterita flour, lysine was found the first limiting amino acids with
values of 53.32% and 36.95%, respectively. The second limiting amino acid was threonine followed by cystine + methionine for both cultivars. Fermentation of both cultivars during kisra processing, increased threonine, cystine + methionine scores, while lysine score was decreased. Baking of kisra increased Cy + Met score from 89.71 to 97.0 and it decreased lysine score from 53.32 to 48.8 in Tabat and Ferterita respectively. Germination followed by cooking and then fermentation in hulu-mur processing decreased all the amino acids
─── Food Technologies ───
─── Ukrainian Journal of Food Science. 2016. Volume 4. Issue 2 ─── 226
except leucine and Tyr + PA which was increased sharply. Baking of Tabat hulu-mur decreased all amino acid scores except leucine and Tyr + PA which were increased when compared to Tabat flour (Table 5). In abreh processing seeds were fermented, decorticated, fermented and cooked, then baked these processes decreased the amino acid scores of valine, isoleucine, threonine, lysine, and Cy + Met from 105.3, 103.4, 84.60, 53.32, and 89.71, in Tabat flour to 95.4, 91.7, 75.7, 46.7, and 75.6 in TA, respectively. While the scores of leucine and Tyr + PA were increased from 141.8 and 147.9 in Tabat flour to 159.9 and 165.1 in TA respectively (Table 5).
Microbial analysis and total viable count of bacteria: Table (6) shows the microbiological load (cfu/g) of kisra, Abreh and hulu-mur batters of Tabat, and Feterita sorghum cultivars. From this table, it was clear that there was a significant difference (P<0.05) in total lactic acid bacteria count of TKD (7.25x10⁵), THAS (5.15x10⁵), THBS (5.65x10⁶ CFU/g), TABS (4.15x10⁵), and TAAS (5.05x10⁴). As shown the differences might be related to each batter fermentation time and different process steps, as in TKD only fermentation while in hulu-mur batter there besides fermentation there were germination and cooking processes. From table 6, there were significant differences (P<0.05) in yeast and mold count of Feterita batter, as in FKD this account was 3.20*103 , and it was significantly (P<0.05) increased to 4.75*103 in FHBS and to 6.50*102 in FHAS. These outcomes are in agreement with Sulieman et al. [30] who reported high yeast counts in Hulu-mur batter samples. The increase in lactic acid bacteria and yeast counts in these batters could be due to the long fermentation time and the availability of essential nutrients in Tabat and Feterita. Probably added spices has provided more nutrients, particularly minerals, and consequently resulted in more favorable conditions for growth of yeast, hence more yeast count in TAAS compared to TABS and the same trend in FHAS compared to FHBS. Sulieman et al. [30], found that addition of spices to Hulu-mur batter stimulated yeast growth during fermentation. The increase in microbial counts of kisra batter is in agreement with Mohammed, et al. [31] who reported an increase in both bacterial and yeast counts of Kisra batter as a result of fermentation.
Acrylamide content
In this study 20 kisra samples made from Tabat and Feterita cultivars were collected from Khartoum, Omdurman and Bahri states. No acrylamide content was found in all samples except one sample of the Tabat kisra obtained from Omdurman State contained (22 µg/kg). 15 hulu-mur samples made from Feterita cultivar were collected from different states. From those entire 15 samples just one obtained from Shendi state contained acrylamide with a value of (84 µg/kg) (data not shown). The occurrence of acrylamide in those two samples might be due to differences in the preparation of hulu-mur and kisra in each state. Omer, [32] measured acrylamide in hulu-mur using 3 different methods for determination and found that the values of acylamide are 51.50 ug/kg, 59.43 ug/kg and not detected according to the method used.
Conclusions In conclusion sorghum cultivars (Tabat and Feterita) and their final products (Kisra
and hulu-mur) contain great levels of carbohydrate, protein, K, P, Fe, Mn and essential amino acids (Valine, isoleucine, leucine, tyrosine, and phenylalanine, while lysine, threonine and sulfur amino acids were insufficient. Acrylamide was found in two samples
─── Food Technologies ───
─── Ukrainian Journal of Food Science. 2016. Volume 4. Issue 2 ─── 227
(Tabat kisra and Ferterita hulu-mur ) of 35 samples analyzed in amounts less than 0.2 mg/kg which confirm that traditional Sudanese food at this study (hulu-mur and kisra) are safe for human consumption. Further research must be done to detect the level of acrylamide in coffee, cookies like biscuits, and other traditional Sudanese homemade cookies, which ammonium bicarbonate is utilized as additives because it is one of the primary materials induce the formation of acrylamide. Acrylamide was detected in two samples Tabat kisra (22 µg/kg), and Ferterita hulu-mur (84 µg/kg) only.
Acknowledgement: The authors are grateful to the Sudanese
Standards and Metrology Organization for financing this research. References
1. Mohamed O. E. F. (2002), Supplementation of sorghum with chickpea and nutritional
evaluation, M.Sc. Thesis, Faculty of Agriculture, University of Khartoum, Khartoum. 2. Llopart E.E., Drago S.R. (2016), Physicochemical properties of sorghum and technological
aptitude for popping, Nutritional changes after popping, LWT – Food Sci. Tech., 71, pp. 316–322.
3. Mahgoub S.E.O., Ahmed B.M., Ahmed M.M.O. & El Agib E.N.A.A. (1999), Effect of traditional Sudanese processing of kisra bread and hulu-mur drink on their thiamine, riboflavin and mineral contents. Food Chem., 67, pp. 129–133.
4. Keramat J., LeBail A., Prost C., & Jafari M. (2011), Acrylamide in Baking Products: A Review, Food Bioprocess Technol., 4, pp. 530–543.
5. Dirar H.A. (1993), Indigenous fermented foods of the Sudan. CTA., Technical Center for Agriculture and Rural Cooperation, Wageningen.
6. AOAC (2012), Official Methods of Analysis of the Association of Official Analytical Chemist. No.994.12, chapter 4. pp. 9-13. 19th Edition, Revision.
7. Stipanuk M. H., & Caudill M. A. (2013), Biochemical, physiological, and molecular aspects of human nutrition, 3rd edn. St. Louis, Mo: Elsevier/Saunders.
8. Aladedunye F. A., Matthäus B. & Przybylski R. (2011), Carbon dioxide blanketing impedes the formation of 4-hydroxynonenal and acrylamide during frying. A novel procedure for HNE quantification, Eur. J. Lipid Sci Tech., 113(7), pp. 916–923.
9. Matthäus B., Haase N.U., & Vosmann K. (2004),Factors affecting the concentration of acrylamide during deep-fat frying of potatoes, Eur. J. Lipid Sci. Tech., 106(11), pp. 793–801.
10. Harrigan W.F. (1998), Laboratory Methods in Food Microbiology, Academic Press, San Diego, USA.
11. Bewick V. Cheek L. & Ball J. (2004), Review Statistics review 9: One-way analysis of variance, Critical Care, 8 (2), pp. 130–136.
12. Toum S.A.E.M. (2009), Nutritional evaluation of Sorghum (Sorghum bicolor L. Monech) flour supplemented with white bean (Phaseolus vulgaris) M. Sc. Thesis, University of Khartoum, Sudan.
13. Awadelkareem A. M., Hassan E. G., Fageer A. h.M., Sulieman A.M.E. & Mustafa A. M. I. (2015), The nutritive value of two sorghum cultivar, Int. J. Food Nut. Sci., 4(1), pp. 1–7.
14. Adams M. R. (1990), Topical aspects of fermented foods, Trend Food Sci. Tech., pp. 141–144.
15. Osman M. A. (2011), Effect of traditional fermentation process on the nutrient and antinutrient contents of pearl millet during preparation of Lohoh, J. Saudi Soc. Agric. Sci., 10, pp. 1–6.
─── Food Technologies ───
─── Ukrainian Journal of Food Science. 2016. Volume 4. Issue 2 ─── 228
16. Ogbonna A. C., Abuajah C. I., Ide E.O., & Udofia U.S. (2012), Effect of malting conditions on the nutritional and anti-nutritional factors of sorghum grist, The Annals of the University Dunarea de Jos of Galati Fascicle VI AUDJG – Food Tech., 36(2), pp. 64-72.
17. Kim S.T., Wang Y., Kang S.Y., Kim S.G., Rakwal R., Kim Y.C. & Kang K.Y. (2009), Developing rice embryo proteomics reveal an essential role for embryonic proteins in regulation of seed germination, J. Proteome Res., 8(7), pp. 3598–3605.
18. Suganya P., & Kailappan R. (2013), Changes in Nutritional Quality of Traditional Fermented Food Made from Pearl Millet, Inter. J. Sci Res., 2(12), pp. 4–6.
19. El Tinay A. H., Abd-el Gadir A. M. & Elhidia M. (1979), Sorghum fermented kisra bread. 1. Nutritive value of kisra, J. Sci. Food Agric., 30, pp. 859–863.
20. Elkhalifa A. O., Ali A.M., El Tinay, A. H. (2007), Fermented sorghum foods of Sudan – a review, J. Food Sci. Technol., 44(4), pp. 343–349.
21. Mella, Onesmo N.O. (2011), Effects of Malting and Fermentation on the Composition and Functionality of Sorghum Flour. M.Sc. Thesis in Food Science and Technology, The Graduate College at the University of Nebraska, USA.
22. Elmaki H. B., Babiker E.E., & El Tinay A. H. (1999), Changes in chemical composition, grain malting, starch and tannin contents and protein digestibility during germination of sorghum cultivars, Food Chem., 64, pp. 331–336.
23. Khalil J. K., Sawaya W. N., Safi W. J. , & Al-Mohammad H. M. (1984), Chemical composition and nutritional quality of sorghum flour and bread, Plant Foods Hum. Nutr., 34(2), pp. 141–150.
24. Oyewole O. B., & Odunfa S. A. (1989), Effects of Fermentation on the Carbohydrate, Mineral, and Protein Contents of Cassava during ‘Fufu’ Production, J. Food Comp. Anal., 2(2), pp. 170-176.
25. Akhtar S., Anjum F.M. Ur-Rehman S. & Sheikh M.A. (2010), Effect of storage and baking on mineral contents of fortified whole wheat flour, J. Food Proc. Pres., 34(2), pp. 335–349.
26. Youssef A. M. (1998), Extractability, fractionation and nutritional value of low and high tannin sorghum proteins, Food Chem., 63, pp. 325–329.
27. El Tinay A. H., El Mahdi Z. M. & El Soubki A. (1985), Supplementation of fermented sorghum Kisra bread with legume protein isolates, J. Food Tech., 20, pp. 679–687.
28. Popoola T.O.S., Jolaoso A.A. & Akintokun A.A. (2005), An assessment of the nutritional value of oso- a condiment made by fermenting seeds of Cathormion altissimum, J. Food Tech., 3 (2), pp. 149-151.
29. Arora S., Jood S. & Khetarpaul N. (2010), Effect of germination and probiotic fermentation on nutrient composition of barley based food mixtures, Food Chem., 119, pp. 779–784.
30. Abdel Moneim E. Sulieman1, Esra A.M , Warda S. (2015), Abdelgadir Isolation and Identification of Yeasts from the Different Stages of Hulu-mur Fermentation, J. Microb. Res., 5(2), pp. 71–76.
31. Mohammed S.I., Steenson L.R., & Kirleis L.W. (1991), Isolation and Characterization of Microorganisms Associated with the Traditional Sorghum Fermentation for Production of Sudanese Kisra, Appl. Enviro. Microb., 57(9), pp. 2529–2533.
32. Omar M. M. A., Elbashir A. A., Schmitz O. J. (2015), Determination of acrylamide in Sudanese food by high performance liquid chromatography coupled with LTQ Orbitrap mass spectrometry, Food Chem., 176, pp. 342–349.
─── Food Technologies ───
─── Ukrainian Journal of Food Science. 2016. Volume 4. Issue 2 ─── 229
Development of technology of gerontologic food pastes
Liudmyla Peshuk, Oleg Galenko, Iryna Radzievska, Volodymyr Bohun National University of food technologies, Kyiv, Ukraine
Abstract
Keywords: Meat Nutrition Herodiet Paste Protein Calcium
Article history: Received 24.09.2016 Received in revised form 17.12.2016 Accepted 30.12.2016
Corresponding author: Oleg Galenko E-mail: [email protected]
DOI: 10.24263/2310–1008-2016-4-2-5
Introduction. Technology of production the pastes which are balanced by micronutritional composition is researches for the purpose of developing and widening of assortment of gerontologic products.
Materials and methods. The potential raw material for the development of special products for the elderly, nursing and long-lived people was analyzed. For development of recipes were used mathematical modeling methods which consider chemical composition, structure and mechanical properties of the product.
Results and discussion. Designed paste has a more balanced micronutritional composition compared with control samples. Found that in the control sample of pastes content of Ca and P is dramatically unbalanced – 1: 9.8 at recommended 2: 1. While increasing content of protein-mineral gerontologic enricher, the content of Ca is increasing and content of P is decreasing. Thus when you add 10% protein-mineral gerontologic enricher to paste recipes, you get almost perfect ratio of Ca: P = 1: 0.5. Also found that the addition of 5% protein-mineral gerontologic enricher (recipe №1) is not sustainable because it is not optimal for gerontologic products – the content of Ca is just 174.1 mg per 100 g or 13.7% of the daily requirement.
The microstructure of the developed paste includes in its composition the muscle tissue in the form of muscle fibers fragments up to 0.7-0.8 mm. Muscle tissue has a microstructural changes which are typical for temperature impact – moderate destruction of muscle fibers, resulting in swelling, appearance of gaps and fragmentation. The cells found in the nucleus of muscle fibers in the form of shadows, in the connective tissue they survive better.
The replacement of part of raw meat by protein and mineral gerontologic enricher results in remaining porosity moderated and responsible to this type of meat product. Adding fermented food collagenase of rumen of cattle don't lead to significant changes of the microstructure of muscle and connective tissue structures.
Conclusions. It is recommended to use the developed product in nutrition of elderly and centenarians.
─── Food Technologies ───
─── Ukrainian Journal of Food Science. 2016. Volume 4. Issue 2 ─── 230
Introduction
There is an international problem with providing population with diverse and high qualitied products.
The irony of the situation of shortage of food protein is in the fact that we have considerable source of protein (average 180 g / day per person), but we use 80... 90% of protein for fodder purposes, namely on the development of animal husbandry. The other part is scarce food protein – represented by 50... 56% by a plant protein, 7... 8% – meat one, 5% – eggs and egg products, 5... 6% – fish and 20... 30% – protein of oilseeds [2, 3]. According to the biomedical requirements the human body needs not just food protein, but complete protein (in an amount not less than 20 kg / year), which can be found mainly in animal raw material: meat, milk, fish, eggs and, in part, oilseeds [1].
Results of regular mass screening [2] of the actual nutrition evidence about significant violations of the diet, such as excessive consumption of animal fats that leads to an increase in the number of people with overweight and different forms of obesity, lack of complete protein, polyunsaturated fatty acids, deficiency of vitamins (B, A and C) and minerals (calcium, iron, magnesium, iodine and selenium). Unbalanced diet is contributed by consuming a monotonous food due to the low purchasing power and low food culture – lack of knowledge of most of the population about the benefits of individual components of food and bad habits, such as excessive consumption of fatty foods, smoked and refined foods which are poor in vitamins and minerals [1]. Therefore, the question of development of new innovative technologies in the food industry is very important.
Everything mentioned above leads to find additional alternative sources of calcium and development of technology of food products which will use these sources. The problem is especially actual in the meat industry because for meat products is an important component of the human diet, source of complete protein, minerals and biologically active substances. Due to excessive phosphorus and a small amount of calcium in raw meat products in the finished product is broken calcium – phosphorus balance.
The task of the research presented in this paper was to study the properties of developed gerontologic pastes with using protein-mineral gerontologic enricher obtained by enzymatic proteolysis and calcining the rumen of cattle [2].
To solve this problem held: - A comprehensive study functional and technological, structural and mechanical and
organoleptic characteristics of minced meat, prepared using protein-mineral gerontologic enricher;
- Rational number protein-mineral gerontologic enricher the production of ground beef for Gerontologic pastes;
- Studied the chemical composition, biological value and microbiological safety of pates Gerontologic protein-mineral gerontologic enricher.
Statistics show that a need of complete protein can be solved by variability in diets in different countries. However, it can have a good result in high developed countries, while in Ukraine there is a chronic deficit in the amount of protein in general. Several ways of solution of this crisis situation are offered and their implementation can go in parallel ways:
- Increasing the number of livestock and poultry, Raising a productivity of animals. It needs long termined programs, significant economic investitions in the development of research in genetics, breeding, bioengineering, reconstruction of animal breeding, expansion fodder, fodder production, purchase feed grains, feed etc.;
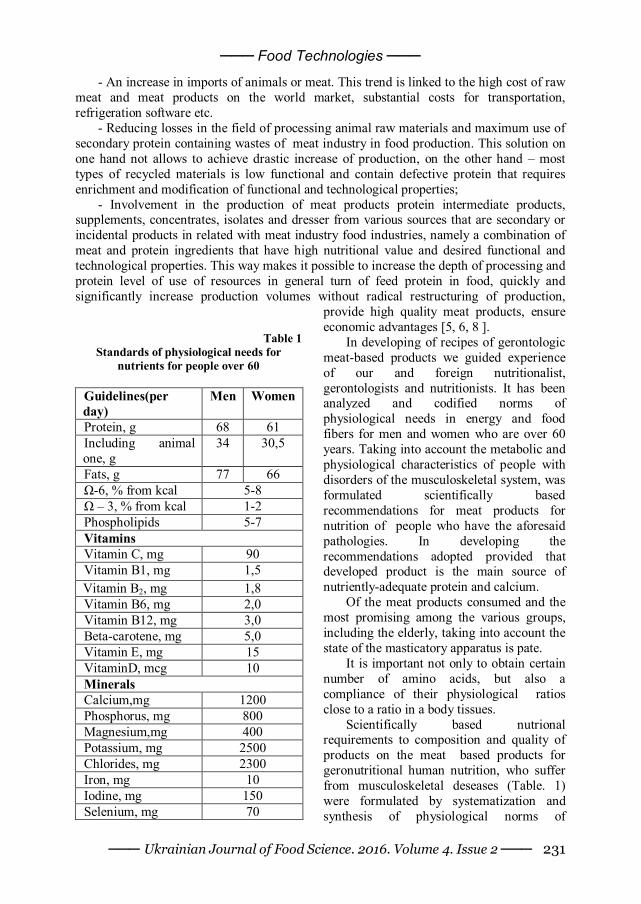
─── Food Technologies ───
─── Ukrainian Journal of Food Science. 2016. Volume 4. Issue 2 ─── 231
- An increase in imports of animals or meat. This trend is linked to the high cost of raw meat and meat products on the world market, substantial costs for transportation, refrigeration software etc.
- Reducing losses in the field of processing animal raw materials and maximum use of secondary protein containing wastes of meat industry in food production. This solution on one hand not allows to achieve drastic increase of production, on the other hand – most types of recycled materials is low functional and contain defective protein that requires enrichment and modification of functional and technological properties;
- Involvement in the production of meat products protein intermediate products, supplements, concentrates, isolates and dresser from various sources that are secondary or incidental products in related with meat industry food industries, namely a combination of meat and protein ingredients that have high nutritional value and desired functional and technological properties. This way makes it possible to increase the depth of processing and protein level of use of resources in general turn of feed protein in food, quickly and significantly increase production volumes without radical restructuring of production,
provide high quality meat products, ensure economic advantages [5, 6, 8 ].
In developing of recipes of gerontologic meat-based products we guided experience of our and foreign nutritionalist, gerontologists and nutritionists. It has been analyzed and codified norms of physiological needs in energy and food fibers for men and women who are over 60 years. Taking into account the metabolic and physiological characteristics of people with disorders of the musculoskeletal system, was formulated scientifically based recommendations for meat products for nutrition of people who have the aforesaid pathologies. In developing the recommendations adopted provided that developed product is the main source of nutriently-adequate protein and calcium.
Of the meat products consumed and the most promising among the various groups, including the elderly, taking into account the state of the masticatory apparatus is pate.
It is important not only to obtain certain number of amino acids, but also a compliance of their physiological ratios close to a ratio in a body tissues.
Scientifically based nutrional requirements to composition and quality of products on the meat based products for geronutritional human nutrition, who suffer from musculoskeletal deseases (Table. 1) were formulated by systematization and synthesis of physiological norms of
Table 1
Standards of physiological needs for nutrients for people over 60
Guidelines(per day)
Men Women
Protein, g 68 61 Including animal one, g
34 30,5
Fats, g 77 66 Ω-6, % from kcal 5-8 Ω – 3, % from kcal 1-2 Phospholipids 5-7 Vitamins Vitamin С, mg 90 Vitamin В1, mg 1,5 Vitamin В2, mg 1,8 Vitamin В6, mg 2,0 Vitamin В12, mg 3,0 Beta-carotene, mg 5,0 Vitamin Е, mg 15 VitaminD, mcg 10 Minerals Calcium,mg 1200 Phosphorus, mg 800 Magnesium,mg 400 Potassium, mg 2500 Chlorides, mg 2300 Iron, mg 10 Iodine, mg 150 Selenium, mg 70
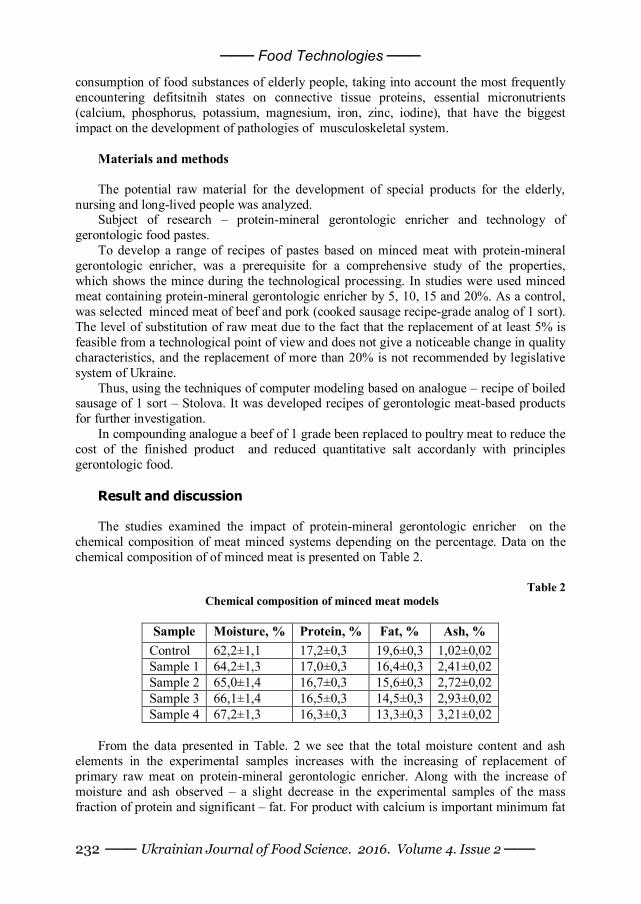
─── Food Technologies ───
─── Ukrainian Journal of Food Science. 2016. Volume 4. Issue 2 ─── 232
consumption of food substances of elderly people, taking into account the most frequently encountering defitsitnih states on connective tissue proteins, essential micronutrients (calcium, phosphorus, potassium, magnesium, iron, zinc, iodine), that have the biggest impact on the development of pathologies of musculoskeletal system.
Materials and methods The potential raw material for the development of special products for the elderly,
nursing and long-lived people was analyzed. Subject of research – protein-mineral gerontologic enricher and technology of
gerontologic food pastes. To develop a range of recipes of pastes based on minced meat with protein-mineral
gerontologic enricher, was a prerequisite for a comprehensive study of the properties, which shows the mince during the technological processing. In studies were used minced meat containing protein-mineral gerontologic enricher by 5, 10, 15 and 20%. As a control, was selected minced meat of beef and pork (cooked sausage recipe-grade analog of 1 sort). The level of substitution of raw meat due to the fact that the replacement of at least 5% is feasible from a technological point of view and does not give a noticeable change in quality characteristics, and the replacement of more than 20% is not recommended by legislative system of Ukraine.
Thus, using the techniques of computer modeling based on analogue – recipe of boiled sausage of 1 sort – Stolova. It was developed recipes of gerontologic meat-based products for further investigation.
In compounding analogue a beef of 1 grade been replaced to poultry meat to reduce the cost of the finished product and reduced quantitative salt accordanly with principles gerontologic food.
Result and discussion The studies examined the impact of protein-mineral gerontologic enricher on the
chemical composition of meat minced systems depending on the percentage. Data on the chemical composition of of minced meat is presented on Table 2.
Table 2 Chemical composition of minced meat models
Sample Moisture, % Protein, % Fat, % Ash, %
Control 62,2±1,1 17,2±0,3 19,6±0,3 1,02±0,02 Sample 1 64,2±1,3 17,0±0,3 16,4±0,3 2,41±0,02 Sample 2 65,0±1,4 16,7±0,3 15,6±0,3 2,72±0,02 Sample 3 66,1±1,4 16,5±0,3 14,5±0,3 2,93±0,02 Sample 4 67,2±1,3 16,3±0,3 13,3±0,3 3,21±0,02
From the data presented in Table. 2 we see that the total moisture content and ash
elements in the experimental samples increases with the increasing of replacement of primary raw meat on protein-mineral gerontologic enricher. Along with the increase of moisture and ash observed – a slight decrease in the experimental samples of the mass fraction of protein and significant – fat. For product with calcium is important minimum fat
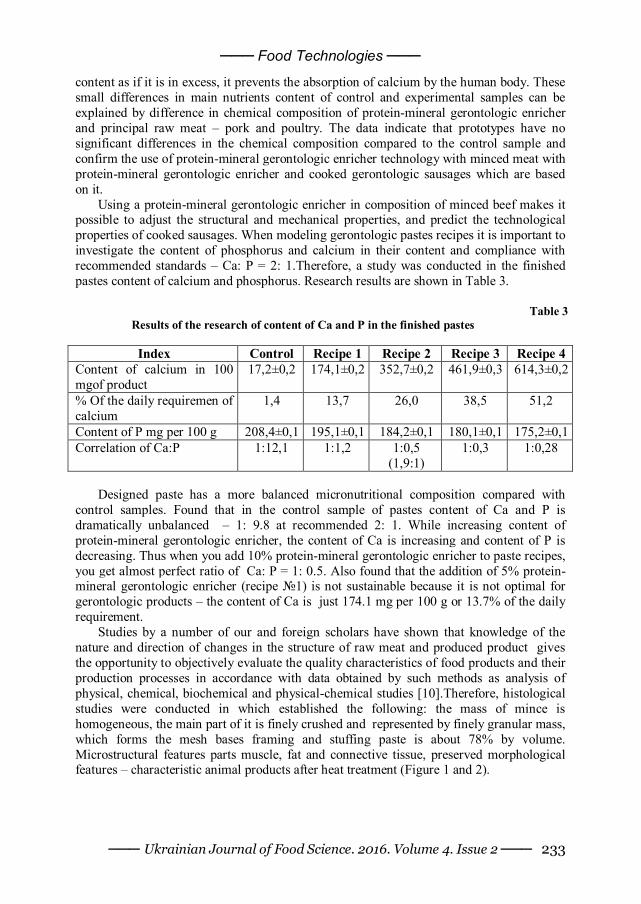
─── Food Technologies ───
─── Ukrainian Journal of Food Science. 2016. Volume 4. Issue 2 ─── 233
content as if it is in excess, it prevents the absorption of calcium by the human body. These small differences in main nutrients content of control and experimental samples can be explained by difference in chemical composition of protein-mineral gerontologic enricher and principal raw meat – pork and poultry. The data indicate that prototypes have no significant differences in the chemical composition compared to the control sample and confirm the use of protein-mineral gerontologic enricher technology with minced meat with protein-mineral gerontologic enricher and cooked gerontologic sausages which are based on it.
Using a protein-mineral gerontologic enricher in composition of minced beef makes it possible to adjust the structural and mechanical properties, and predict the technological properties of cooked sausages. When modeling gerontologic pastes recipes it is important to investigate the content of phosphorus and calcium in their content and compliance with recommended standards – Ca: P = 2: 1.Therefore, a study was conducted in the finished pastes content of calcium and phosphorus. Research results are shown in Table 3.
Table 3
Results of the research of content of Ca and P in the finished pastes
Index Control Recipe 1 Recipe 2 Recipe 3 Recipe 4 Content of calcium in 100 mgof product
17,2±0,2 174,1±0,2 352,7±0,2 461,9±0,3 614,3±0,2
% Of the daily requiremen of calcium
1,4 13,7 26,0 38,5 51,2
Content of P mg per 100 g 208,4±0,1 195,1±0,1 184,2±0,1 180,1±0,1 175,2±0,1 Correlation of Са:Р 1:12,1 1:1,2 1:0,5
(1,9:1) 1:0,3 1:0,28
Designed paste has a more balanced micronutritional composition compared with
control samples. Found that in the control sample of pastes content of Ca and P is dramatically unbalanced – 1: 9.8 at recommended 2: 1. While increasing content of protein-mineral gerontologic enricher, the content of Ca is increasing and content of P is decreasing. Thus when you add 10% protein-mineral gerontologic enricher to paste recipes, you get almost perfect ratio of Ca: P = 1: 0.5. Also found that the addition of 5% protein-mineral gerontologic enricher (recipe №1) is not sustainable because it is not optimal for gerontologic products – the content of Ca is just 174.1 mg per 100 g or 13.7% of the daily requirement.
Studies by a number of our and foreign scholars have shown that knowledge of the nature and direction of changes in the structure of raw meat and produced product gives the opportunity to objectively evaluate the quality characteristics of food products and their production processes in accordance with data obtained by such methods as analysis of physical, chemical, biochemical and physical-chemical studies [10].Therefore, histological studies were conducted in which established the following: the mass of mince is homogeneous, the main part of it is finely crushed and represented by finely granular mass, which forms the mesh bases framing and stuffing paste is about 78% by volume. Microstructural features parts muscle, fat and connective tissue, preserved morphological features – characteristic animal products after heat treatment (Figure 1 and 2).
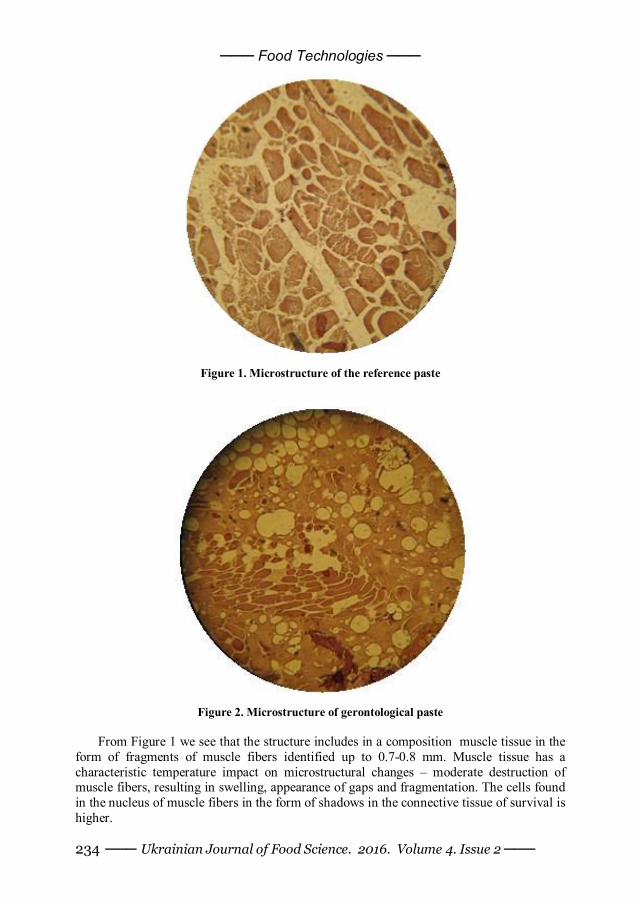
─── Food Technologies ───
─── Ukrainian Journal of Food Science. 2016. Volume 4. Issue 2 ─── 234
Figure 1. Microstructure of the reference paste
Figure 2. Microstructure of gerontological paste
From Figure 1 we see that the structure includes in a composition muscle tissue in the
form of fragments of muscle fibers identified up to 0.7-0.8 mm. Muscle tissue has a characteristic temperature impact on microstructural changes – moderate destruction of muscle fibers, resulting in swelling, appearance of gaps and fragmentation. The cells found in the nucleus of muscle fibers in the form of shadows in the connective tissue of survival is higher.
─── Food Technologies ───
─── Ukrainian Journal of Food Science. 2016. Volume 4. Issue 2 ─── 235
From Figure 2 we see that the replacement of raw meat protein and gerontologic mineral dresser porousness of structure remains moderate and response to this type of meat product. Adding of fermented by food collagenase rumen of cattle does not lead to significant changes in the microstructure of muscle and connective tissue structures.
In both cases, shallow discovered fragments of cellular elements of natural spices. These cells have cellulose membrane and quite varied in shape and size.
Conclusion
1. An optimal amount of bringing of protein-mineral gerontologic enricher in recipes of pastes – 10%.
2. It was investigated a microstructure of developed gerontologic pates and proved that bringing fermented by food collagenase rumen of cattle does not lead to significant changes in the microstructure of muscle and connective tissue structure of the material.
3. The use of prototypes by the elderly people for 3 days does not lead to worsening of clinical symptoms. Researched product shows that calcium in it is accessible for elderly human body and can be absorbed from the gastrointestinal tract into the bloodstream. References
1. Jochen Weiss, Monika Gibis, Valerie Schuh, Hanna Salminen, (2010), Advances in ingredient and processing systems for meat and meat products, Meat Science, 86(1), pp. 196-213.
2. Hoffman L.C., Wiklund E. (2006), Game and venison – meat for the modern consumer, Meat Science, 74(1), pp. 197-208.
3. Alison J. McAfee, Emeir M. McSorley, Geraldine J. Cuskelly, Bruce W. Moss, Julie M.W. Wallace, Maxine P. Bonham, Anna M. Fearon (2010), Red meat consumption: An overview of the risks and benefits, Meat Science, 84(1), pp. 1-13.
4. Huang S.C., Tsai Y.F., Chen C.M. (2011), Effects of wheat fiber, oat fiber on sensory and physico-chemical properties of Chinese-style sausages, Asian–Australian Journal of Animal Science, 24(6), pp. 875–880.
5. Bou R., Codony R., Tres A., Decker E.A., Guardiola F. (2009), Dietary strategies to improve nutritional value, oxidative stability, and sensory properties of poultry products, Critical Review on Food Science and Nutrition, 49(9), pp. 800–822.
6. Peshuk L., Galenko O. (2011), Gerodietic meat products technology enriched with calcium and phosphorus, Food and Environment Safety, 4(15), pp. 18-23.
7. Richardson D.P. (2002), Functional Food and Health Claims, The world of Functional ingredients, 9, рр. 12–20.
8. Peshuk L., Galenko O. (2014), Use of collagenase in technology gerodietetic products, Journal of food and packing science, technique and technologies, II(3), pp. 8-11.
9. Peshuk L., Galenko O. (2014), Rational use of the collagen, Ukrainian Journal of Food Science, 2(1), pp. 361-370.
10. Peña F., Bonvillani A., Freire B., Juárez M., Perea J., Gómez G. (2009), Effects of genotype and slaughter weight on the meat quality of Criollo Cordobes and Anglonubian kids produced under extensive feeding conditions, Meat Science, 83(3), pp. 417-422.
11. Hutchison C.L., Mulley R.C., Wiklund E., Flesch J.S. (2012), Effect of concentrate feeding on instrumental meat quality and sensory characteristics of fallow deer venison Meat Science, 90(3), pp. 801-806.
─── Food Technologies ───
─── Ukrainian Journal of Food Science. 2016. Volume 4. Issue 2 ─── 236
Histological characterics of improving meat chopped semis
Olha Masliichuk, Maria Paska Lviv National University of Veterinary Medicine and Biotechnology named after S.Z. Gzhytskyi, Lviv, Ukraine
Abstract
Keywords: Histology lupine flour Elecampane Meat Patties
Article history: Received 06.09.2016 Received in revised form 13.11.2016 Accepted 30.12.2016
Corresponding author: Maria Paska E-mail: [email protected]
DOI: 10.24263/2310–1008-2016-4-2-6
Introduction. Holding histological characteristics of
meat split semifinished components can detect, differentiate the properties of various tissue and cell structures, and to control production.
Materials and methods. Minced beef as the objects of research were improved with the replacement of 5%, 10%, 15% of meat part with lupine flour and adding 0.5% of Elecampane root powder as aromatic raw. For microscopic examination it was used materials of developed ground meat, they were stamped and fixed in 10% neutral formalin solution. We produced cuts on Sannomiya microtome with thickness of 0.5-1 cm, they were stained with hematoxylin and eosin, PAS reaction. Light microscopy and microphotography of histopreparations were performed with a microscope Leica DM 2500 and camera Leica DFC 450C Software Leica aplitation suite 4.4.
Results and discussion. In the of micro-samples studies of mince examples we found muscle polygonal and round fibers, cytoplasm was painted in a reddish-pink colour, and their dark blue nuclei were good noted under sarcolemma . This indicates that they used for stuffing fresh chilled meat, as among muscle fibers it was looked through pockets of fatty tissue that histologically characterized by a mesh structure. In locations slices of bacon it was showed vacuoles of various shapes and sizes, which gave the cut mesh look. Groups collected round light purple cytoplasm and nuclei of dark purple cells located in the center of polygonal shapes represent lupine flour; crumbly brown fibers show bread mass; wavy violet fibers show onion, dark brown single points marked Elecampane.
Conclusions. Histological studies showed for the PAS reaction developed content in meat semis, meat and plant parts. For hematoxylin and eosin it was determined the composition of ground meat.
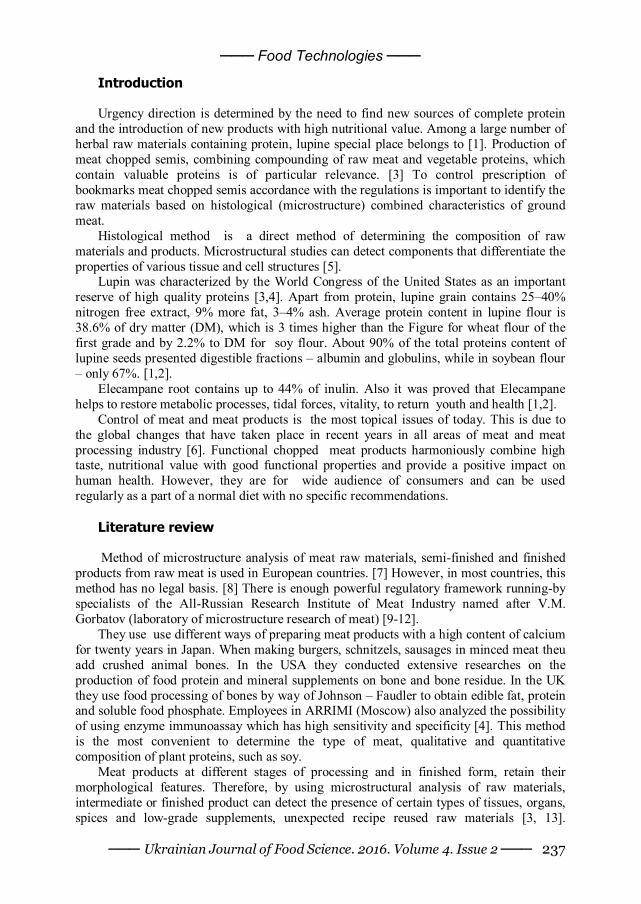
─── Food Technologies ───
─── Ukrainian Journal of Food Science. 2016. Volume 4. Issue 2 ─── 237
Introduction Urgency direction is determined by the need to find new sources of complete protein
and the introduction of new products with high nutritional value. Among a large number of herbal raw materials containing protein, lupine special place belongs to [1]. Production of meat chopped semis, combining compounding of raw meat and vegetable proteins, which contain valuable proteins is of particular relevance. [3] To control prescription of bookmarks meat chopped semis accordance with the regulations is important to identify the raw materials based on histological (microstructure) combined characteristics of ground meat.
Histological method is a direct method of determining the composition of raw materials and products. Microstructural studies can detect components that differentiate the properties of various tissue and cell structures [5].
Lupin was characterized by the World Congress of the United States as an important reserve of high quality proteins [3,4]. Apart from protein, lupine grain contains 25–40% nitrogen free extract, 9% more fat, 3–4% ash. Average protein content in lupine flour is 38.6% of dry matter (DM), which is 3 times higher than the Figure for wheat flour of the first grade and by 2.2% to DM for soy flour. About 90% of the total proteins content of lupine seeds presented digestible fractions – albumin and globulins, while in soybean flour – only 67%. [1,2].
Elecampane root contains up to 44% of inulin. Also it was proved that Elecampane helps to restore metabolic processes, tidal forces, vitality, to return youth and health [1,2].
Control of meat and meat products is the most topical issues of today. This is due to the global changes that have taken place in recent years in all areas of meat and meat processing industry [6]. Functional chopped meat products harmoniously combine high taste, nutritional value with good functional properties and provide a positive impact on human health. However, they are for wide audience of consumers and can be used regularly as a part of a normal diet with no specific recommendations.
Literature review Method of microstructure analysis of meat raw materials, semi-finished and finished
products from raw meat is used in European countries. [7] However, in most countries, this method has no legal basis. [8] There is enough powerful regulatory framework running-by specialists of the All-Russian Research Institute of Meat Industry named after V.M. Gorbatov (laboratory of microstructure research of meat) [9-12].
They use use different ways of preparing meat products with a high content of calcium for twenty years in Japan. When making burgers, schnitzels, sausages in minced meat theu add crushed animal bones. In the USA they conducted extensive researches on the production of food protein and mineral supplements on bone and bone residue. In the UK they use food processing of bones by way of Johnson – Faudler to obtain edible fat, protein and soluble food phosphate. Employees in ARRIMI (Moscow) also analyzed the possibility of using enzyme immunoassay which has high sensitivity and specificity [4]. This method is the most convenient to determine the type of meat, qualitative and quantitative composition of plant proteins, such as soy.
Meat products at different stages of processing and in finished form, retain their morphological features. Therefore, by using microstructural analysis of raw materials, intermediate or finished product can detect the presence of certain types of tissues, organs, spices and low-grade supplements, unexpected recipe reused raw materials [3, 13].
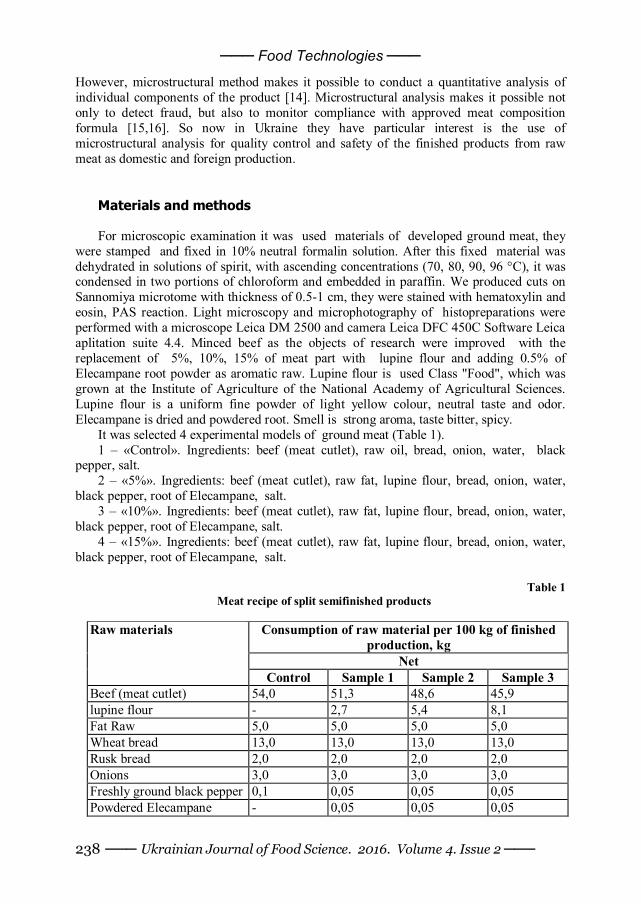
─── Food Technologies ───
─── Ukrainian Journal of Food Science. 2016. Volume 4. Issue 2 ─── 238
However, microstructural method makes it possible to conduct a quantitative analysis of individual components of the product [14]. Microstructural analysis makes it possible not only to detect fraud, but also to monitor compliance with approved meat composition formula [15,16]. So now in Ukraine they have particular interest is the use of microstructural analysis for quality control and safety of the finished products from raw meat as domestic and foreign production.
Materials and methods For microscopic examination it was used materials of developed ground meat, they
were stamped and fixed in 10% neutral formalin solution. After this fixed material was dehydrated in solutions of spirit, with ascending concentrations (70, 80, 90, 96 °C), it was condensed in two portions of chloroform and embedded in paraffin. We produced cuts on Sannomiya microtome with thickness of 0.5-1 cm, they were stained with hematoxylin and eosin, PAS reaction. Light microscopy and microphotography of histopreparations were performed with a microscope Leica DM 2500 and camera Leica DFC 450C Software Leica aplitation suite 4.4. Minced beef as the objects of research were improved with the replacement of 5%, 10%, 15% of meat part with lupine flour and adding 0.5% of Elecampane root powder as aromatic raw. Lupine flour is used Class "Food", which was grown at the Institute of Agriculture of the National Academy of Agricultural Sciences. Lupine flour is a uniform fine powder of light yellow colour, neutral taste and odor. Elecampane is dried and powdered root. Smell is strong aroma, taste bitter, spicy.
It was selected 4 experimental models of ground meat (Table 1). 1 – «Control». Ingredients: beef (meat cutlet), raw oil, bread, onion, water, black
pepper, salt. 2 – «5%». Ingredients: beef (meat cutlet), raw fat, lupine flour, bread, onion, water,
black pepper, root of Elecampane, salt. 3 – «10%». Ingredients: beef (meat cutlet), raw fat, lupine flour, bread, onion, water,
black pepper, root of Elecampane, salt. 4 – «15%». Ingredients: beef (meat cutlet), raw fat, lupine flour, bread, onion, water,
black pepper, root of Elecampane, salt.
Table 1 Meat recipe of split semifinished products
Consumption of raw material per 100 kg of finished
production, kg Net
Raw materials
Control Sample 1 Sample 2 Sample 3 Beef (meat cutlet) 54,0 51,3 48,6 45,9 lupine flour - 2,7 5,4 8,1 Fat Raw 5,0 5,0 5,0 5,0 Wheat bread 13,0 13,0 13,0 13,0 Rusk bread 2,0 2,0 2,0 2,0 Onions 3,0 3,0 3,0 3,0 Freshly ground black pepper 0,1 0,05 0,05 0,05 Powdered Elecampane - 0,05 0,05 0,05
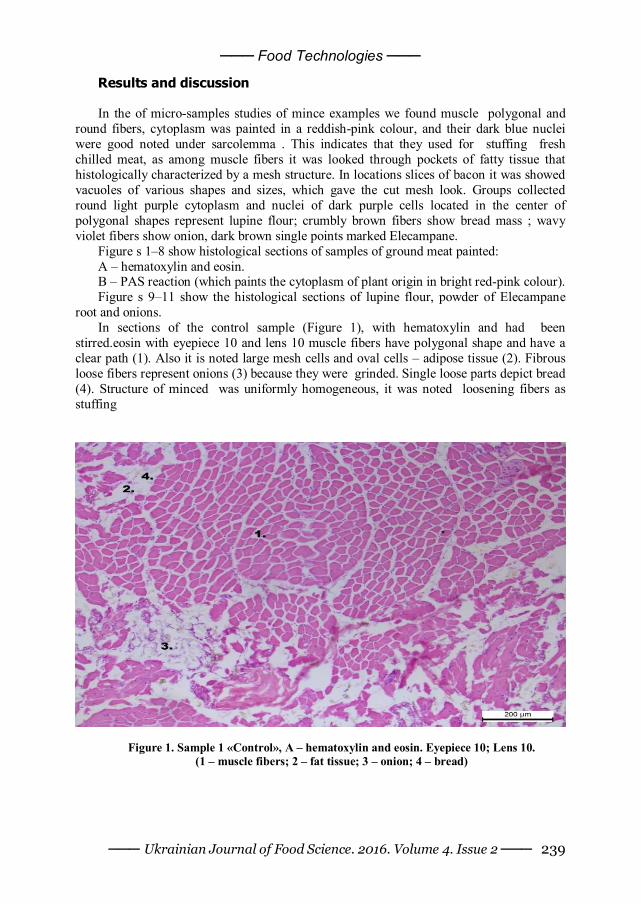
─── Food Technologies ───
─── Ukrainian Journal of Food Science. 2016. Volume 4. Issue 2 ─── 239
Results and discussion In the of micro-samples studies of mince examples we found muscle polygonal and
round fibers, cytoplasm was painted in a reddish-pink colour, and their dark blue nuclei were good noted under sarcolemma . This indicates that they used for stuffing fresh chilled meat, as among muscle fibers it was looked through pockets of fatty tissue that histologically characterized by a mesh structure. In locations slices of bacon it was showed vacuoles of various shapes and sizes, which gave the cut mesh look. Groups collected round light purple cytoplasm and nuclei of dark purple cells located in the center of polygonal shapes represent lupine flour; crumbly brown fibers show bread mass ; wavy violet fibers show onion, dark brown single points marked Elecampane.
Figure s 1–8 show histological sections of samples of ground meat painted: A – hematoxylin and eosin. B – PAS reaction (which paints the cytoplasm of plant origin in bright red-pink colour). Figure s 9–11 show the histological sections of lupine flour, powder of Elecampane
root and onions. In sections of the control sample (Figure 1), with hematoxylin and had been
stirred.eosin with eyepiece 10 and lens 10 muscle fibers have polygonal shape and have a clear path (1). Also it is noted large mesh cells and oval cells – adipose tissue (2). Fibrous loose fibers represent onions (3) because they were grinded. Single loose parts depict bread (4). Structure of minced was uniformly homogeneous, it was noted loosening fibers as stuffing
Figure 1. Sample 1 «Control», A – hematoxylin and eosin. Eyepiece 10; Lens 10. (1 – muscle fibers; 2 – fat tissue; 3 – onion; 4 – bread)
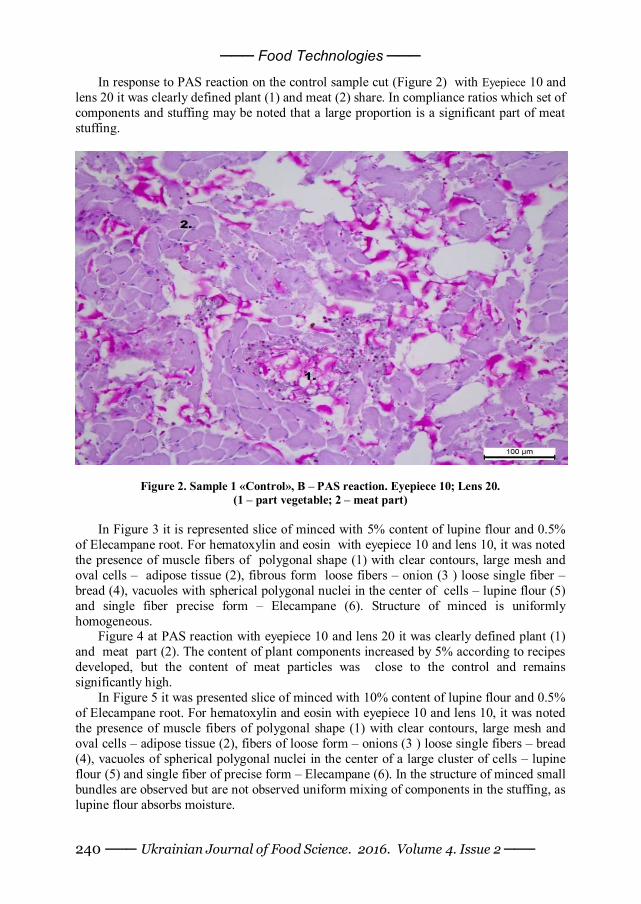
─── Food Technologies ───
─── Ukrainian Journal of Food Science. 2016. Volume 4. Issue 2 ─── 240
In response to PAS reaction on the control sample cut (Figure 2) with Eyepiece 10 and lens 20 it was clearly defined plant (1) and meat (2) share. In compliance ratios which set of components and stuffing may be noted that a large proportion is a significant part of meat stuffing.
Figure 2. Sample 1 «Control», B – PAS reaction. Eyepiece 10; Lens 20. (1 – part vegetable; 2 – meat part)
In Figure 3 it is represented slice of minced with 5% content of lupine flour and 0.5%
of Elecampane root. For hematoxylin and eosin with eyepiece 10 and lens 10, it was noted the presence of muscle fibers of polygonal shape (1) with clear contours, large mesh and oval cells – adipose tissue (2), fibrous form loose fibers – onion (3 ) loose single fiber – bread (4), vacuoles with spherical polygonal nuclei in the center of cells – lupine flour (5) and single fiber precise form – Elecampane (6). Structure of minced is uniformly homogeneous.
Figure 4 at PAS reaction with eyepiece 10 and lens 20 it was clearly defined plant (1) and meat part (2). The content of plant components increased by 5% according to recipes developed, but the content of meat particles was close to the control and remains significantly high.
In Figure 5 it was presented slice of minced with 10% content of lupine flour and 0.5% of Elecampane root. For hematoxylin and eosin with eyepiece 10 and lens 10, it was noted the presence of muscle fibers of polygonal shape (1) with clear contours, large mesh and oval cells – adipose tissue (2), fibers of loose form – onions (3 ) loose single fibers – bread (4), vacuoles of spherical polygonal nuclei in the center of a large cluster of cells – lupine flour (5) and single fiber of precise form – Elecampane (6). In the structure of minced small bundles are observed but are not observed uniform mixing of components in the stuffing, as lupine flour absorbs moisture.
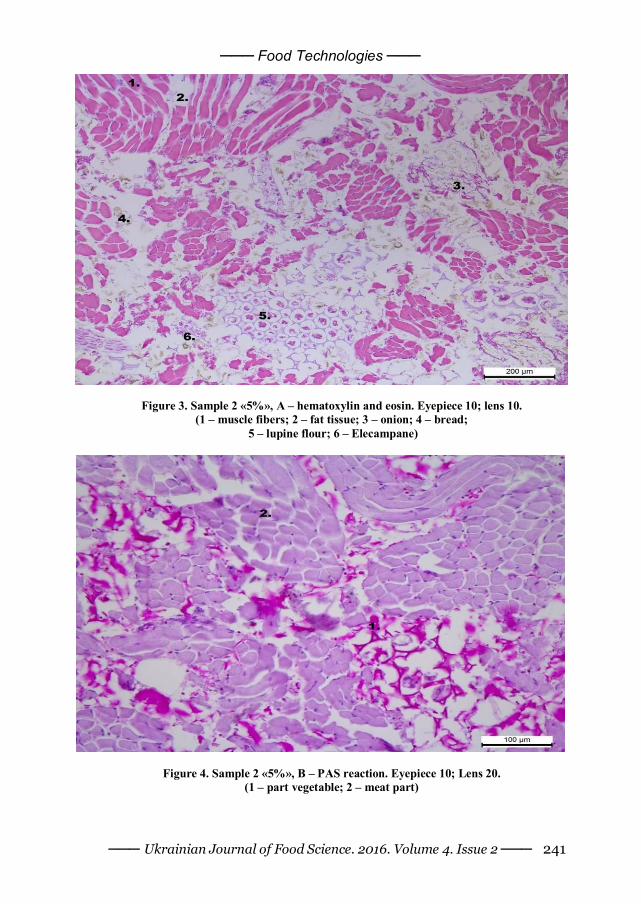
─── Food Technologies ───
─── Ukrainian Journal of Food Science. 2016. Volume 4. Issue 2 ─── 241
Figure 3. Sample 2 «5%», A – hematoxylin and eosin. Eyepiece 10; lens 10. (1 – muscle fibers; 2 – fat tissue; 3 – onion; 4 – bread;
5 – lupine flour; 6 – Elecampane)
Figure 4. Sample 2 «5%», B – PAS reaction. Eyepiece 10; Lens 20. (1 – part vegetable; 2 – meat part)
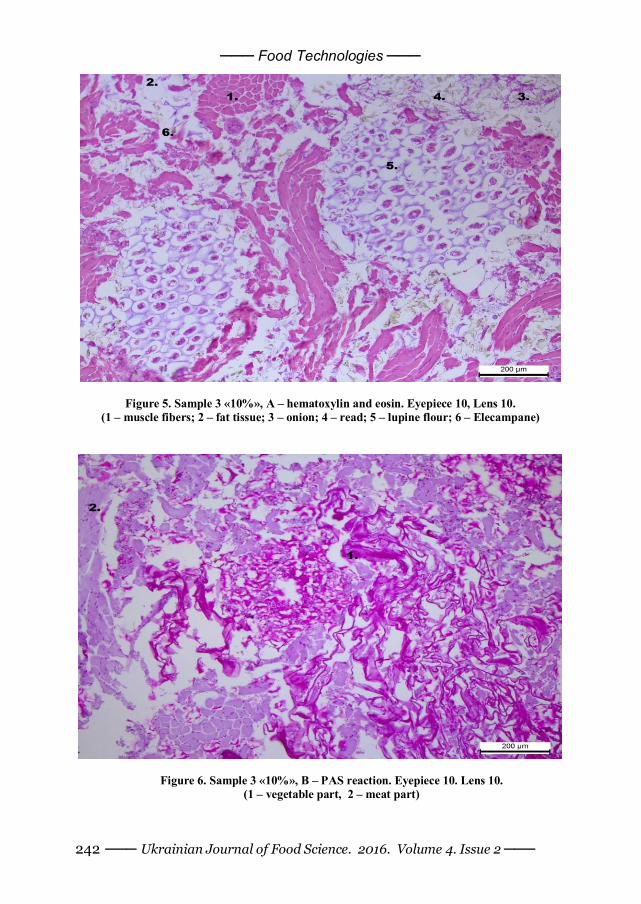
─── Food Technologies ───
─── Ukrainian Journal of Food Science. 2016. Volume 4. Issue 2 ─── 242
Figure 5. Sample 3 «10%», A – hematoxylin and eosin. Eyepiece 10, Lens 10. (1 – muscle fibers; 2 – fat tissue; 3 – onion; 4 – read; 5 – lupine flour; 6 – Elecampane)
Figure 6. Sample 3 «10%», B – PAS reaction. Eyepiece 10. Lens 10. (1 – vegetable part, 2 – meat part)
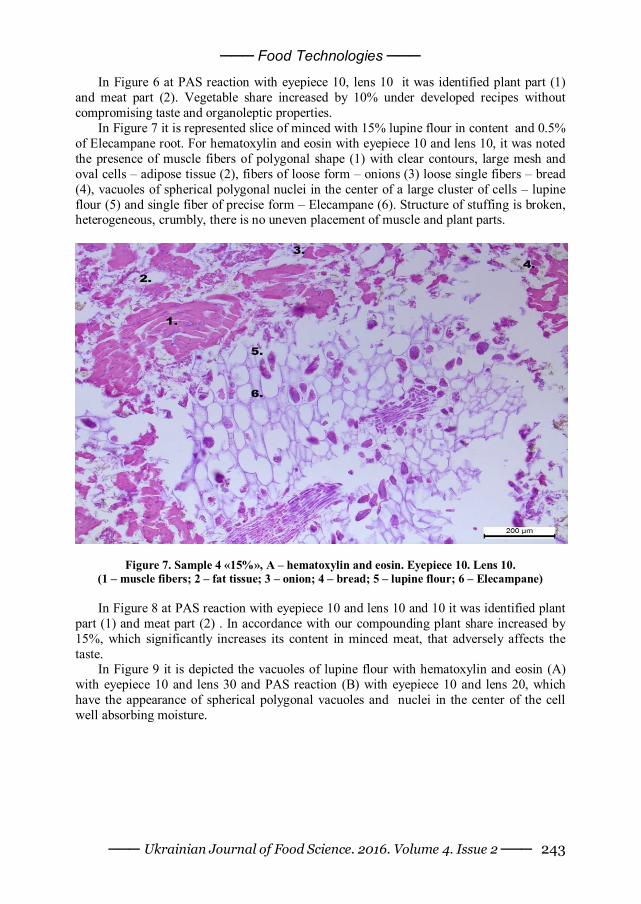
─── Food Technologies ───
─── Ukrainian Journal of Food Science. 2016. Volume 4. Issue 2 ─── 243
In Figure 6 at PAS reaction with eyepiece 10, lens 10 it was identified plant part (1) and meat part (2). Vegetable share increased by 10% under developed recipes without compromising taste and organoleptic properties.
In Figure 7 it is represented slice of minced with 15% lupine flour in content and 0.5% of Elecampane root. For hematoxylin and eosin with eyepiece 10 and lens 10, it was noted the presence of muscle fibers of polygonal shape (1) with clear contours, large mesh and oval cells – adipose tissue (2), fibers of loose form – onions (3) loose single fibers – bread (4), vacuoles of spherical polygonal nuclei in the center of a large cluster of cells – lupine flour (5) and single fiber of precise form – Elecampane (6). Structure of stuffing is broken, heterogeneous, crumbly, there is no uneven placement of muscle and plant parts.
Figure 7. Sample 4 «15%», A – hematoxylin and eosin. Eyepiece 10. Lens 10. (1 – muscle fibers; 2 – fat tissue; 3 – onion; 4 – bread; 5 – lupine flour; 6 – Elecampane) In Figure 8 at PAS reaction with eyepiece 10 and lens 10 and 10 it was identified plant
part (1) and meat part (2) . In accordance with our compounding plant share increased by 15%, which significantly increases its content in minced meat, that adversely affects the taste.
In Figure 9 it is depicted the vacuoles of lupine flour with hematoxylin and eosin (A) with eyepiece 10 and lens 30 and PAS reaction (B) with eyepiece 10 and lens 20, which have the appearance of spherical polygonal vacuoles and nuclei in the center of the cell well absorbing moisture.
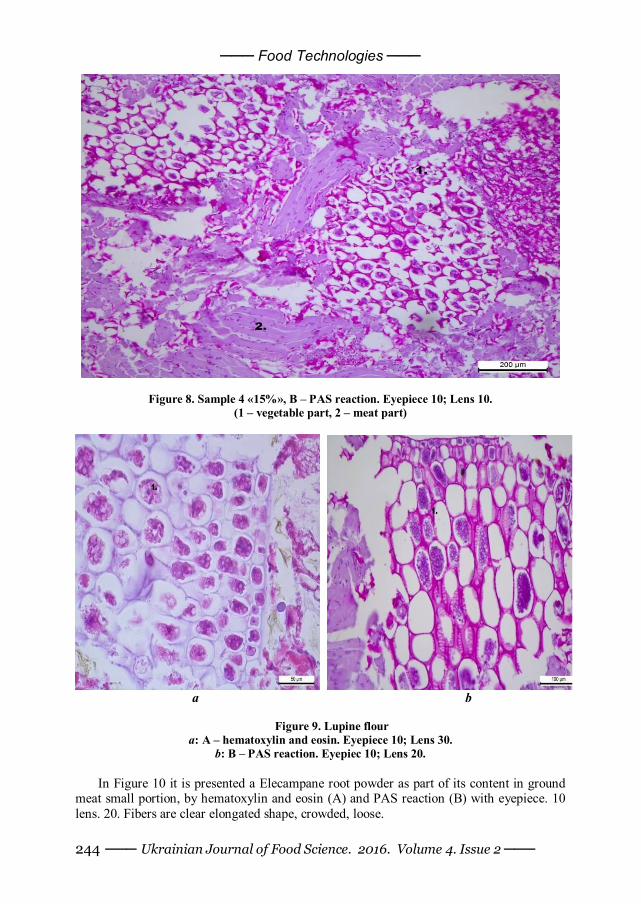
─── Food Technologies ───
─── Ukrainian Journal of Food Science. 2016. Volume 4. Issue 2 ─── 244
Figure 8. Sample 4 «15%», B – PAS reaction. Eyepiece 10; Lens 10. (1 – vegetable part, 2 – meat part)
a b
Figure 9. Lupine flour a: A – hematoxylin and eosin. Eyepiece 10; Lens 30.
b: B – PAS reaction. Eyepiec 10; Lens 20. In Figure 10 it is presented a Elecampane root powder as part of its content in ground
meat small portion, by hematoxylin and eosin (A) and PAS reaction (B) with eyepiece. 10 lens. 20. Fibers are clear elongated shape, crowded, loose.
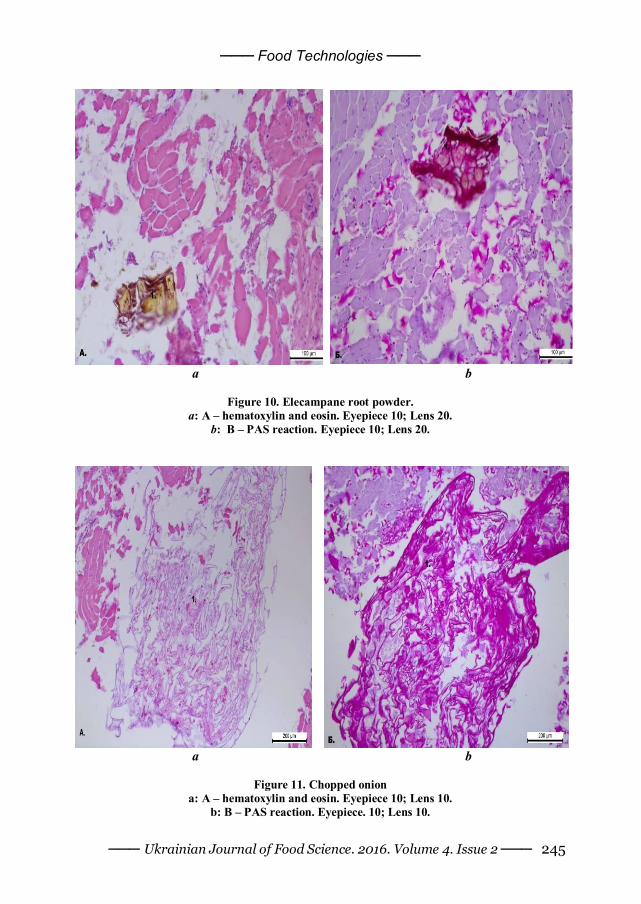
─── Food Technologies ───
─── Ukrainian Journal of Food Science. 2016. Volume 4. Issue 2 ─── 245
a b
Figure 10. Elecampane root powder. a: A – hematoxylin and eosin. Eyepiece 10; Lens 20.
b: В – PAS reaction. Eyepiece 10; Lens 20.
a b
Figure 11. Chopped onion
a: A – hematoxylin and eosin. Eyepiece 10; Lens 10. b: B – PAS reaction. Eyepiece. 10; Lens 10.
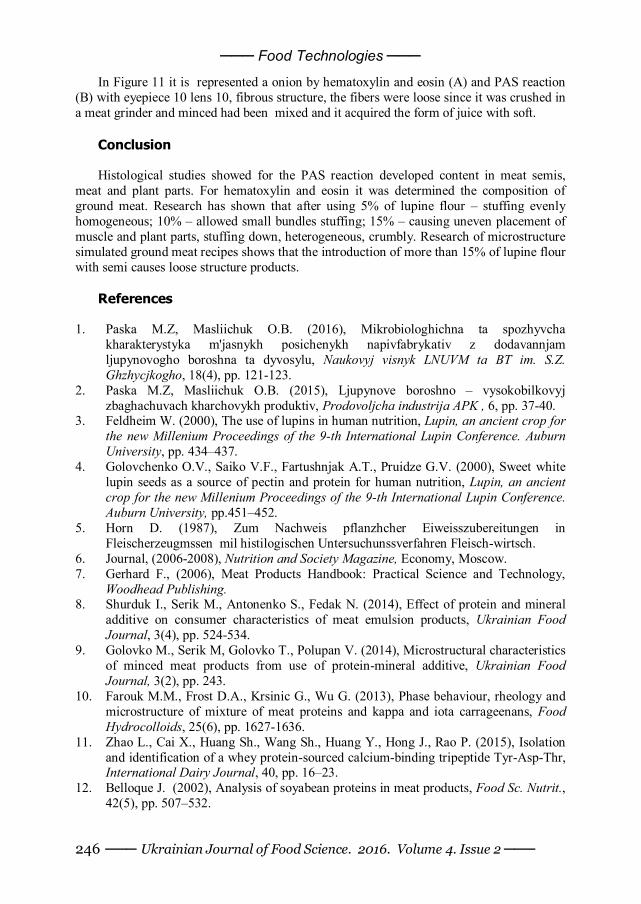
─── Food Technologies ───
─── Ukrainian Journal of Food Science. 2016. Volume 4. Issue 2 ─── 246
In Figure 11 it is represented a onion by hematoxylin and eosin (A) and PAS reaction (B) with eyepiece 10 lens 10, fibrous structure, the fibers were loose since it was crushed in a meat grinder and minced had been mixed and it acquired the form of juice with soft.
Conclusion Histological studies showed for the PAS reaction developed content in meat semis,
meat and plant parts. For hematoxylin and eosin it was determined the composition of ground meat. Research has shown that after using 5% of lupine flour – stuffing evenly homogeneous; 10% – allowed small bundles stuffing; 15% – causing uneven placement of muscle and plant parts, stuffing down, heterogeneous, crumbly. Research of microstructure simulated ground meat recipes shows that the introduction of more than 15% of lupine flour with semi causes loose structure products.
References
1. Paska M.Z, Masliichuk O.B. (2016), Mikrobiologhichna ta spozhyvcha kharakterystyka m'jasnykh posichenykh napivfabrykativ z dodavannjam ljupynovogho boroshna ta dyvosylu, Naukovyj visnyk LNUVM ta BT im. S.Z. Ghzhycjkogho, 18(4), рр. 121-123.
2. Paska M.Z, Masliichuk O.B. (2015), Ljupynove boroshno – vysokobilkovyj zbaghachuvach kharchovykh produktiv, Prodovoljcha industrija APK , 6, рр. 37-40.
3. Feldheim W. (2000), The use of lupins in human nutrition, Lupin, an ancient crop for the new Millenium Proceedings of the 9-th International Lupin Conference. Auburn University, рр. 434–437.
4. Golovchenko O.V., Saiko V.F., Fartushnjak A.T., Pruidze G.V. (2000), Sweet white lupin seeds as a source of pectin and protein for human nutrition, Lupin, an ancient crop for the new Millenium Proceedings of the 9-th International Lupin Conference. Auburn University, рр.451–452.
5. Horn D. (1987), Zum Nachweis pflanzhcher Eiweisszubereitungen in Fleischerzeugmssen mil histilogischen Untersuchunssverfahren Fleisch-wirtsch.
6. Journal, (2006-2008), Nutrition and Society Magazine, Economy, Moscow. 7. Gerhard F., (2006), Meat Products Handbook: Practical Science and Technology,
Woodhead Publishing. 8. Shurduk I., Serik M., Antonenko S., Fedak N. (2014), Effect of protein and mineral
additive on consumer characteristics of meat emulsion products, Ukrainian Food Journal, 3(4), pp. 524-534.
9. Golovko M., Serik M, Golovko T., Polupan V. (2014), Microstructural characteristics of minced meat products from use of protein-mineral additive, Ukrainian Food Journal, 3(2), pp. 243.
10. Farouk M.M., Frost D.A., Krsinic G., Wu G. (2013), Phase behaviour, rheology and microstructure of mixture of meat proteins and kappa and iota carrageenans, Food Hydrocolloids, 25(6), pp. 1627-1636.
11. Zhao L., Cai X., Huang Sh., Wang Sh., Huang Y., Hong J., Rao P. (2015), Isolation and identification of a whey protein-sourced calcium-binding tripeptide Tyr-Asp-Thr, International Dairy Journal, 40, рр. 16–23.
12. Belloque J. (2002), Analysis of soyabean proteins in meat products, Food Sc. Nutrit., 42(5), рр. 507–532.
─── Food Technologies ───
─── Ukrainian Journal of Food Science. 2016. Volume 4. Issue 2 ─── 247
13. Bookwalter G. N. (1978), Soy protein utilization in food systems , Adv. Exp. Med. Biol., 105, рр. 749–766.
14. Flores-Mungula M. E. (2000), Detection of adulteration in processed traditional meat products, J. Muscle Foods, 11, рр. 319–325.
15. Giovannacci I. (2004), Species identification of meat products by ELISA, International Journal of Food Science & Technology, 39(8), рр. 863–867.
16. Haeney M. R. (1982), Soya protein antibodies in man: their occurrence and possible relevance in coeliac disease, J. Clin Pathol., 35, рр. 319–322.
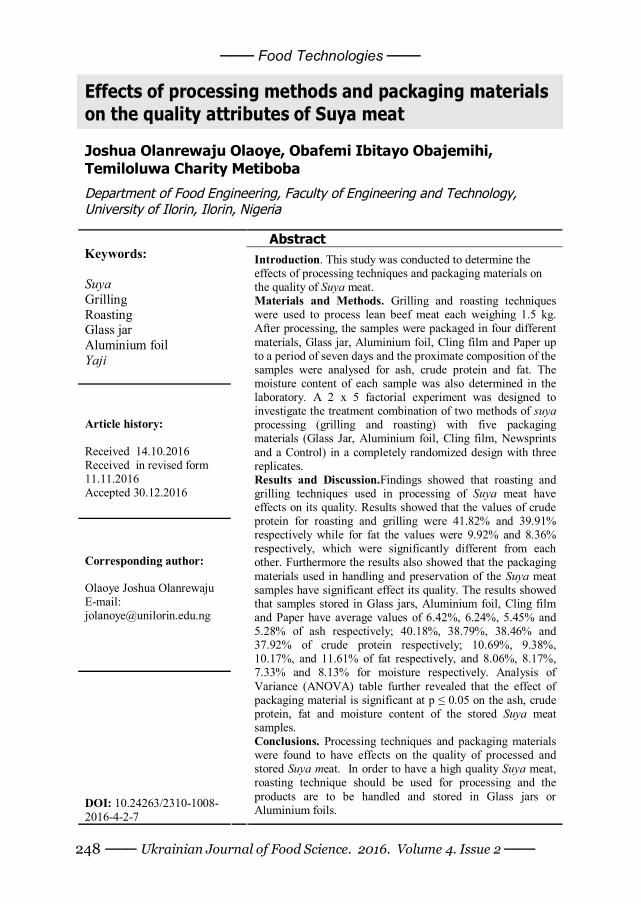
─── Food Technologies ───
─── Ukrainian Journal of Food Science. 2016. Volume 4. Issue 2 ─── 248
Effects of processing methods and packaging materials on the quality attributes of Suya meat
Joshua Olanrewaju Olaoye, Obafemi Ibitayo Obajemihi, Temiloluwa Charity Metiboba
Department of Food Engineering, Faculty of Engineering and Technology, University of Ilorin, Ilorin, Nigeria
Abstract
Keywords: Suya Grilling Roasting Glass jar Aluminium foil Yaji
Article history: Received 14.10.2016 Received in revised form 11.11.2016 Accepted 30.12.2016
Corresponding author: Olaoye Joshua Olanrewaju E-mail: [email protected]
DOI: 10.24263/2310-1008-2016-4-2-7
Introduction. This study was conducted to determine the effects of processing techniques and packaging materials on the quality of Suya meat. Materials and Methods. Grilling and roasting techniques were used to process lean beef meat each weighing 1.5 kg. After processing, the samples were packaged in four different materials, Glass jar, Aluminium foil, Cling film and Paper up to a period of seven days and the proximate composition of the samples were analysed for ash, crude protein and fat. The moisture content of each sample was also determined in the laboratory. A 2 x 5 factorial experiment was designed to investigate the treatment combination of two methods of suya processing (grilling and roasting) with five packaging materials (Glass Jar, Aluminium foil, Cling film, Newsprints and a Control) in a completely randomized design with three replicates. Results and Discussion.Findings showed that roasting and grilling techniques used in processing of Suya meat have effects on its quality. Results showed that the values of crude protein for roasting and grilling were 41.82% and 39.91% respectively while for fat the values were 9.92% and 8.36% respectively, which were significantly different from each other. Furthermore the results also showed that the packaging materials used in handling and preservation of the Suya meat samples have significant effect its quality. The results showed that samples stored in Glass jars, Aluminium foil, Cling film and Paper have average values of 6.42%, 6.24%, 5.45% and 5.28% of ash respectively; 40.18%, 38.79%, 38.46% and 37.92% of crude protein respectively; 10.69%, 9.38%, 10.17%, and 11.61% of fat respectively, and 8.06%, 8.17%, 7.33% and 8.13% for moisture respectively. Analysis of Variance (ANOVA) table further revealed that the effect of packaging material is significant at p ≤ 0.05 on the ash, crude protein, fat and moisture content of the stored Suya meat samples. Conclusions. Processing techniques and packaging materials were found to have effects on the quality of processed and stored Suya meat. In order to have a high quality Suya meat, roasting technique should be used for processing and the products are to be handled and stored in Glass jars or Aluminium foils.
─── Food Technologies ───
─── Ukrainian Journal of Food Science. 2016. Volume 4. Issue 2 ─── 249
Introduction Suya is a form of processed stick-meat consumed by people in West Africa. It is
produced from boneless meat hung on stick and spiced with peanut cake, salt, vegetable oil and other flavourings followed by roasting around a glowing charcoal fire [1]. It originated from the northern part of the country where the population of animals found in the area is large compared with other areas. The processed meat has a unique taste, flavour, colour and texture that distinguish it from other meats which are products of other processing techniques. Suya meat is produced from beef or mutton. There are three types of Suya namely, Tsire, Balangu and Kilishi. The process of preparation of Suya meat involves a few steps, first is the grounding of peanut. The shell and the skin are removed from the peanut before grinding into fine powder using mortar and pestle or crushed with a rolling pin. If the powder is oily; it is wrapped with an absorbent paper and squeezed for a minute or two. Next, the grinded pepper, garlic, ginger are stirred into the peanut powder and mixed properly. The meat is then cut into small sizes or thin sliced, dipped and rolled in a bowl containing the mixed peanut-spice and allowed to coat completely. The minced meat are then kept for thirty minutes or more for the peanut cake to stick to it after which the meat slices are threaded unto skewer and brushed with vegetable oil and roasted on the glowing charcoal fire for fifteen to twenty minutes [2].
Today Suya meat has gained wide popularity and it is been consumed by majority. Most of the processors of this meat were found in strategic locations and were people who does not have much formal education and as a result still uses traditional methods of handling, processing and packaging the products, which are considered to be unhygienic, unsafe and can result in rapid deterioration of the processed meat if not consumed within a short period of time. The processors have been accustomed to collecting old newspapers from different homes and using same to package Suya meat for their customers, which are considered to be dirty and dusty, also in some homes where chemicals were being used to control insects like cockroaches and mosquitoes, there is tendency of the chemicals being sprayed on the newspapers, which the chemicals when in contact with the meat and being consumed can poised serious health issues. Besides the fact that the use of old newspapers in packaging of Suya meat product does not give a good professional image to the processor, the printed inks on the papers contain pigments, colorants, binders, additives and photo initiators [3] which can be harmful to the health of the consumer.
Packaging does not only ensure that foods contains and maintains the amount and forms of the required ingredient and nutrients but also improves the sensory quality and colour stability. It has been demonstrated that food packaging can retard product deterioration, retain the beneficial effects of processing, extend shelf-life and maintain or increase the quality and safety of food [4]. Therefore it is important that food packaging materials should possess proper mechanical, thermal and optical properties for foods. In addition anti-microbial and barrier functions against gases, vapour and aroma are also important in food packaging materials [5]. Suya meats are to be stored between 50 to 600C to disfavour the growth of microbes [6].
The principal roles of packaging are to protect food products from outside influences and damages, to contain the food, and to provide consumers with ingredient and nutritional information [7]. Packaging maintains the benefits of food processing after the process is completed, enabling food to travel safely for long distances from their point of origin and still be wholesome at the time of consumption. It is in view of these that this study was conducted to investigate the effects processing methods and packaging materials on the quality attributes of Suya meat.
─── Food Technologies ───
─── Ukrainian Journal of Food Science. 2016. Volume 4. Issue 2 ─── 250
Materials and methods The materials and equipment that were used to carry out this research and the basis for
their selection and also some of their standard properties were discussed. This is with reference to existing packaging materials in Nigeria for processed suya meat [8, 9, 10, 11] and the details are as follow:
Glass Jar. A glass jars which are impervious to moisture, gases and microorganism
were used. It has a density of 2.52 kg/m3 [12]. Aluminum foil. Aluminum foil is used as the second packaging material with a
thickness of 0.0065 mm with a specific gravity of 2.7, melting point of 6600C and a thermal conductivity of 235W/m.K. The molecular structure of the metal provides a high performance barrier. The naturally occurring oxide acts as a shield in the presence of oxygen in the atmosphere which makes it to be corrosion resistant. It is chemically resistant when in contact with substances with in the pH scale of range 4-9. It is non-absorbent and proof against water, oil and grease and other liquids.
Cling film. A thin film of flexible transparent polymer that clings to itself and to food
containers to form a tight seal, which offers strong tear resistance, it is highly impermeable to oxygen and water and also has excellent organoleptic properties which does not affect the taste of the product.
Paper (Newsprint). Paper made from thin material produced by pressing together
moist fibres of cellulose pulp derived from wood and being dried into flexible sheets was used.
Processing Techniques. Two processing techniques were used in the preparation of
Suya meat. These techniques were grilling and roasting. Two processing techniques are appropriate for meat conditioning and processing that can mitigate spoilage [11, 13].
Grilling Method. The grilling method for the Preparation of Suya meat was carried out
at a Suya processor spot at Tanke Oke-odo, Ilorin, Kwara State, Nigeria. The process of preparation involved the following unit operations as earlier adopted by [13]. The procedure includes spice mixing, cleaning, size reduction, placing on grill, grilling and cooling.
Spice Mixing. The spices used in preparing the ingredient were purchased from
specialized spice market. They included red pepper (Capsicum fructescens), Seasoning (Monosodium glutamate), Maggi (Levisticum officinales) Curry powder (Trigonella foenum), salt (Sodium chloride) and Yaji sauce.
Cleaning. 1.5 kilogram lean meat from beef was bought from the meat market and
cleaned in a potable water to get rid of all dirt Size Reduction. The meat was sliced into thin fillets manually by the use of a sharp
edge of knife in order to remove undesirable materials and to increase the surface area
─── Food Technologies ───
─── Ukrainian Journal of Food Science. 2016. Volume 4. Issue 2 ─── 251
Placing on Grill. The pieces of meat were placed on the grill and sprinkled with the ingredients and about 5ml of groundnut oil for grilling
Grilling (Heat Process). Grilling was achieved by the grill method where the pieces of
meat were placed on the grill directly over a burning mass of charcoal and firewood. The meat pieces were allowed to stay on fire for about thirty minutes. The pieces of meat were turned and sprinkled with the ingredient and groundnut oil at regular intervals to avoid burning
Cooling. After the grilling process, the fillets of meat were cooled and sprinkled with
Yaji sauce. Roasting Method. The roasting method for the preparation of Suya meat was carried at
the Food Science laboratory, Faculty of Agriculture, University of Ilorin following the processing steps highlighted by [13]. The process of preparation involved spice mixing, cleaning, size reduction, placement on oven rack, roasting and cooling.
Placement on Oven Rack. The pieces of meat were placed on the oven rack and
sprinkled with the ingredients and about 5ml of groundnut oil for Roasting. Roasting (Heat Process). Roasting was achieved by placing the thin fillet of meat on
the oven rack and placed into the oven set at 150 0C.After twenty minutes; the fillets of meat were flipped and sprinkled with the ingredients and vegetable oil. The total roasting time for both sides of the meat was fifty minutes.
The spices were mixed together in a specific proportion as described in Table 1.
Table 1 Composition of Suya ingredient for grilling and roasting techniques
Ingredient
constituents Proportion by weight
(g) Percent proportion in mixture
(%) Curry powder 10 9.01
Seasoning 10 9.01 Condiment 36 32.43 Red pepper 5 4.50
Salt 50 45.05 Total 111 100.00
Packaging. After Suya meat was prepared by the grilling and roasting method. Fifty
(50) grams of Suya meat samples were weighed and filled into the packaging materials [14]. Each packaging material was labelled based on the design setup.
Experimental Design. A 2 x 5 factorial experiment was designed to investigate the
treatment combination of two methods of suya processing (grilling and roasting) with five packaging materials (Glass Jar, Aluminium foil, Cling film, Newsprints and a Control). The factorial experiment was carried out in a completely randomized design with three
─── Food Technologies ───
─── Ukrainian Journal of Food Science. 2016. Volume 4. Issue 2 ─── 252
replicates. The factors considered were five packaging materials and two treatment techniques for suya processing.
Methods for Evaluating Suya meat Quality. The packaged Suya meat was taken to
chemistry laboratory, University of Ilorin for proximate analysis. The analysis was carried out at six hours interval for seven days.
Determination of Ash content of Suya meat. This was carried out as described by [15].The crucible was washed and dried in the oven and allowed to cool in a desiccator and weighed 2g of Suya sample was weighed into an empty porcelain crucible which had been previously ignited and weighed. The Suya sample was then ignited over a hot plate in the fume cupboard to char organic matter. The crucible was placed in a muffle furnace maintained at a temperature of 600 0C for hours and transferred directly to a desiccator, cooled and weighed immediately. The calculation of the percentage ash was determined using equation (1).
3 1
2 1% 100
W WAsh
W W
(1)
where: W1 = Weight of empty crucible (g) W2 = Weight of crucible + suya sample (g) W3 = Weight of crucible +ash (g)
Determination of Moisture Content of Suya. This was carried out as described by [16]. 2g of Suya sample was weighed into a Petri-dish which has been weighed previously, and then the Petri-dish was transferred into the oven at 101 0C until constant weight was achieved. The Petri-dish and the Suya sample were reweighed after cooling. The calculation of the percentage ash was determined using equation (2)
2 1
3% 100
W WMc
W
(2)
where: Mc = Moisture Content (%) W1 =Weight of dried Petri-dish (g) W2 = Weight of Suya sample + Petri-dish (g) W3 = Weight of dried Suya sample (g)
Determination of Crude protein of Suya. This was carried out as described by [15]. 2g of Suya sample was mashed in a sterile laboratory type mortar and pestle. The mashed Suya sample was shaken with 100ml of 0.05M of sodium hydroxide solution for fifteen minutes. It was then centrifuge for ten minutes in a 500ml graduated cylinder. 5ml clear extract was added to 50ml with 30% sulphur salicylic acid solution. It was inverted several times and immediately the degree of turbidity at 450nm in a 4cm cell read against sulphur salicylic acid solution as instrument blank. The percentage protein content was determined using the equation as shown in equation (3).
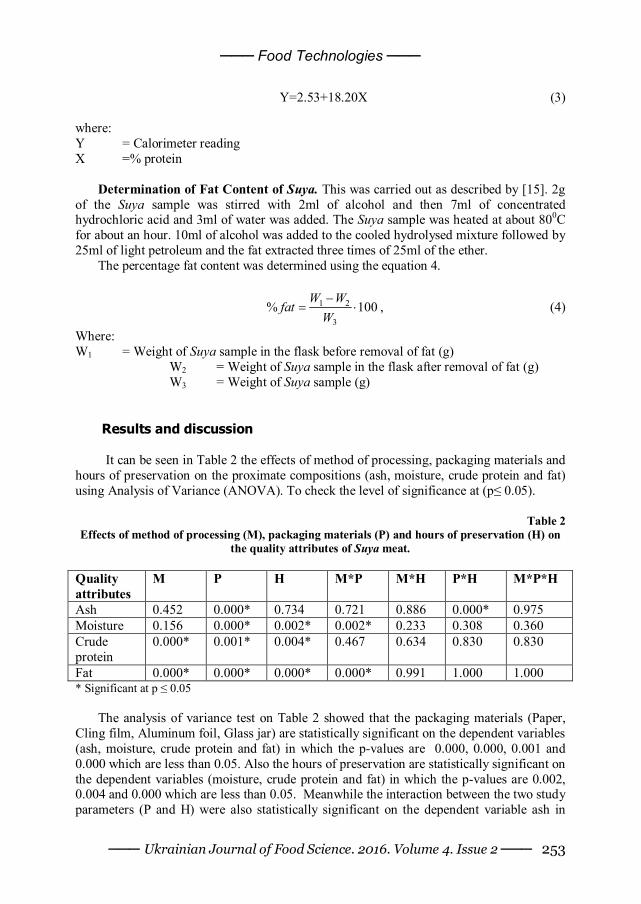
─── Food Technologies ───
─── Ukrainian Journal of Food Science. 2016. Volume 4. Issue 2 ─── 253
Y=2.53+18.20X (3)
where: Y = Calorimeter reading X =% protein
Determination of Fat Content of Suya. This was carried out as described by [15]. 2g of the Suya sample was stirred with 2ml of alcohol and then 7ml of concentrated hydrochloric acid and 3ml of water was added. The Suya sample was heated at about 800C for about an hour. 10ml of alcohol was added to the cooled hydrolysed mixture followed by 25ml of light petroleum and the fat extracted three times of 25ml of the ether.
The percentage fat content was determined using the equation 4.
1 2
3% 100
W Wfat
W
, (4)
Where: W1 = Weight of Suya sample in the flask before removal of fat (g) W2 = Weight of Suya sample in the flask after removal of fat (g) W3 = Weight of Suya sample (g)
Results and discussion
It can be seen in Table 2 the effects of method of processing, packaging materials and hours of preservation on the proximate compositions (ash, moisture, crude protein and fat) using Analysis of Variance (ANOVA). To check the level of significance at (p≤ 0.05).
Table 2 Effects of method of processing (M), packaging materials (P) and hours of preservation (H) on
the quality attributes of Suya meat. Quality attributes
M P H M*P M*H P*H M*P*H
Ash 0.452 0.000* 0.734 0.721 0.886 0.000* 0.975 Moisture 0.156 0.000* 0.002* 0.002* 0.233 0.308 0.360 Crude protein
0.000* 0.001* 0.004* 0.467 0.634 0.830 0.830
Fat 0.000* 0.000* 0.000* 0.000* 0.991 1.000 1.000 * Significant at p ≤ 0.05
The analysis of variance test on Table 2 showed that the packaging materials (Paper, Cling film, Aluminum foil, Glass jar) are statistically significant on the dependent variables (ash, moisture, crude protein and fat) in which the p-values are 0.000, 0.000, 0.001 and 0.000 which are less than 0.05. Also the hours of preservation are statistically significant on the dependent variables (moisture, crude protein and fat) in which the p-values are 0.002, 0.004 and 0.000 which are less than 0.05. Meanwhile the interaction between the two study parameters (P and H) were also statistically significant on the dependent variable ash in
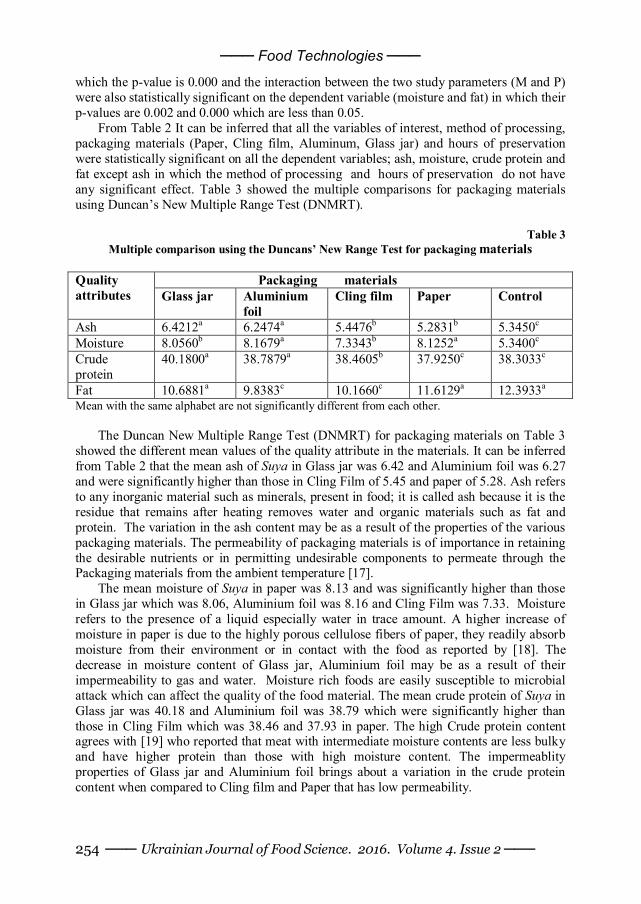
─── Food Technologies ───
─── Ukrainian Journal of Food Science. 2016. Volume 4. Issue 2 ─── 254
which the p-value is 0.000 and the interaction between the two study parameters (M and P) were also statistically significant on the dependent variable (moisture and fat) in which their p-values are 0.002 and 0.000 which are less than 0.05.
From Table 2 It can be inferred that all the variables of interest, method of processing, packaging materials (Paper, Cling film, Aluminum, Glass jar) and hours of preservation were statistically significant on all the dependent variables; ash, moisture, crude protein and fat except ash in which the method of processing and hours of preservation do not have any significant effect. Table 3 showed the multiple comparisons for packaging materials using Duncan’s New Multiple Range Test (DNMRT).
Table 3 Multiple comparison using the Duncans’ New Range Test for packaging materials
Packaging materials Quality
attributes Glass jar Aluminium foil
Cling film Paper Control
Ash 6.4212a 6.2474a 5.4476b 5.2831b 5.3450c Moisture 8.0560b 8.1679a 7.3343b 8.1252a 5.3400c Crude protein
40.1800a 38.7879a 38.4605b 37.9250c 38.3033c
Fat 10.6881a 9.8383c 10.1660c 11.6129a 12.3933a Mean with the same alphabet are not significantly different from each other.
The Duncan New Multiple Range Test (DNMRT) for packaging materials on Table 3 showed the different mean values of the quality attribute in the materials. It can be inferred from Table 2 that the mean ash of Suya in Glass jar was 6.42 and Aluminium foil was 6.27 and were significantly higher than those in Cling Film of 5.45 and paper of 5.28. Ash refers to any inorganic material such as minerals, present in food; it is called ash because it is the residue that remains after heating removes water and organic materials such as fat and protein. The variation in the ash content may be as a result of the properties of the various packaging materials. The permeability of packaging materials is of importance in retaining the desirable nutrients or in permitting undesirable components to permeate through the Packaging materials from the ambient temperature [17].
The mean moisture of Suya in paper was 8.13 and was significantly higher than those in Glass jar which was 8.06, Aluminium foil was 8.16 and Cling Film was 7.33. Moisture refers to the presence of a liquid especially water in trace amount. A higher increase of moisture in paper is due to the highly porous cellulose fibers of paper, they readily absorb moisture from their environment or in contact with the food as reported by [18]. The decrease in moisture content of Glass jar, Aluminium foil may be as a result of their impermeability to gas and water. Moisture rich foods are easily susceptible to microbial attack which can affect the quality of the food material. The mean crude protein of Suya in Glass jar was 40.18 and Aluminium foil was 38.79 which were significantly higher than those in Cling Film which was 38.46 and 37.93 in paper. The high Crude protein content agrees with [19] who reported that meat with intermediate moisture contents are less bulky and have higher protein than those with high moisture content. The impermeablity properties of Glass jar and Aluminium foil brings about a variation in the crude protein content when compared to Cling film and Paper that has low permeability.
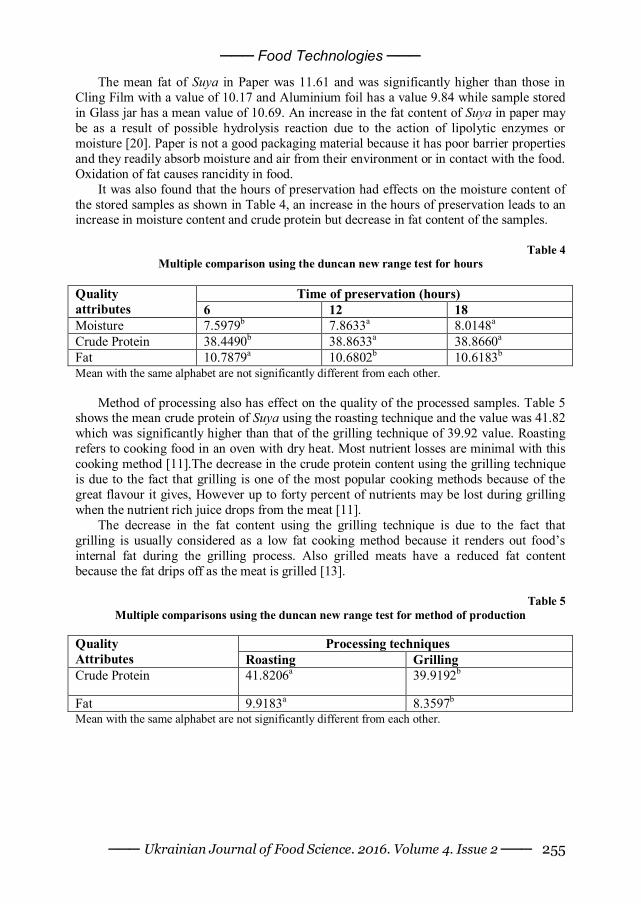
─── Food Technologies ───
─── Ukrainian Journal of Food Science. 2016. Volume 4. Issue 2 ─── 255
The mean fat of Suya in Paper was 11.61 and was significantly higher than those in Cling Film with a value of 10.17 and Aluminium foil has a value 9.84 while sample stored in Glass jar has a mean value of 10.69. An increase in the fat content of Suya in paper may be as a result of possible hydrolysis reaction due to the action of lipolytic enzymes or moisture [20]. Paper is not a good packaging material because it has poor barrier properties and they readily absorb moisture and air from their environment or in contact with the food. Oxidation of fat causes rancidity in food.
It was also found that the hours of preservation had effects on the moisture content of the stored samples as shown in Table 4, an increase in the hours of preservation leads to an increase in moisture content and crude protein but decrease in fat content of the samples.
Table 4
Multiple comparison using the duncan new range test for hours
Time of preservation (hours) Quality attributes 6 12 18 Moisture 7.5979b 7.8633a 8.0148a Crude Protein 38.4490b 38.8633a 38.8660a Fat 10.7879a 10.6802b 10.6183b Mean with the same alphabet are not significantly different from each other.
Method of processing also has effect on the quality of the processed samples. Table 5 shows the mean crude protein of Suya using the roasting technique and the value was 41.82 which was significantly higher than that of the grilling technique of 39.92 value. Roasting refers to cooking food in an oven with dry heat. Most nutrient losses are minimal with this cooking method [11].The decrease in the crude protein content using the grilling technique is due to the fact that grilling is one of the most popular cooking methods because of the great flavour it gives, However up to forty percent of nutrients may be lost during grilling when the nutrient rich juice drops from the meat [11].
The decrease in the fat content using the grilling technique is due to the fact that grilling is usually considered as a low fat cooking method because it renders out food’s internal fat during the grilling process. Also grilled meats have a reduced fat content because the fat drips off as the meat is grilled [13].
Table 5 Multiple comparisons using the duncan new range test for method of production
Processing techniques Quality
Attributes Roasting Grilling Crude Protein 41.8206a 39.9192b
Fat 9.9183a 8.3597b Mean with the same alphabet are not significantly different from each other.
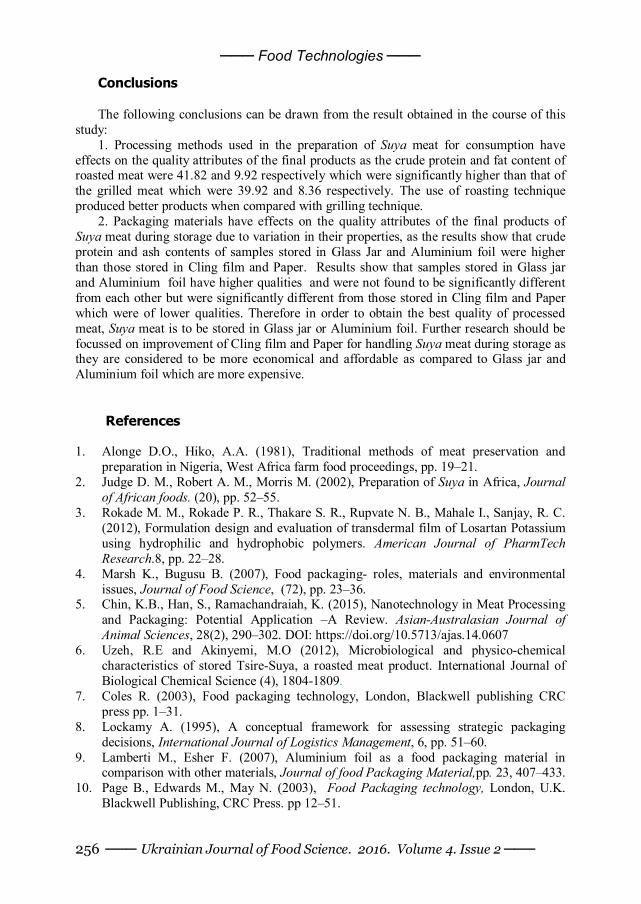
─── Food Technologies ───
─── Ukrainian Journal of Food Science. 2016. Volume 4. Issue 2 ─── 256
Conclusions
The following conclusions can be drawn from the result obtained in the course of this study:
1. Processing methods used in the preparation of Suya meat for consumption have effects on the quality attributes of the final products as the crude protein and fat content of roasted meat were 41.82 and 9.92 respectively which were significantly higher than that of the grilled meat which were 39.92 and 8.36 respectively. The use of roasting technique produced better products when compared with grilling technique.
2. Packaging materials have effects on the quality attributes of the final products of Suya meat during storage due to variation in their properties, as the results show that crude protein and ash contents of samples stored in Glass Jar and Aluminium foil were higher than those stored in Cling film and Paper. Results show that samples stored in Glass jar and Aluminium foil have higher qualities and were not found to be significantly different from each other but were significantly different from those stored in Cling film and Paper which were of lower qualities. Therefore in order to obtain the best quality of processed meat, Suya meat is to be stored in Glass jar or Aluminium foil. Further research should be focussed on improvement of Cling film and Paper for handling Suya meat during storage as they are considered to be more economical and affordable as compared to Glass jar and Aluminium foil which are more expensive.
References
1. Alonge D.O., Hiko, A.A. (1981), Traditional methods of meat preservation and preparation in Nigeria, West Africa farm food proceedings, pp. 19–21.
2. Judge D. M., Robert A. M., Morris M. (2002), Preparation of Suya in Africa, Journal of African foods. (20), pp. 52–55.
3. Rokade M. M., Rokade P. R., Thakare S. R., Rupvate N. B., Mahale I., Sanjay, R. C. (2012), Formulation design and evaluation of transdermal film of Losartan Potassium using hydrophilic and hydrophobic polymers. American Journal of PharmTech Research.8, pp. 22–28.
4. Marsh K., Bugusu B. (2007), Food packaging- roles, materials and environmental issues, Journal of Food Science, (72), pp. 23–36.
5. Chin, K.B., Han, S., Ramachandraiah, K. (2015), Nanotechnology in Meat Processing and Packaging: Potential Application –A Review. Asian-Australasian Journal of Animal Sciences, 28(2), 290–302. DOI: https://doi.org/10.5713/ajas.14.0607
6. Uzeh, R.E and Akinyemi, M.O (2012), Microbiological and physico-chemical characteristics of stored Tsire-Suya, a roasted meat product. International Journal of Biological Chemical Science (4), 1804-1809.
7. Coles R. (2003), Food packaging technology, London, Blackwell publishing CRC press pp. 1–31.
8. Lockamy A. (1995), A conceptual framework for assessing strategic packaging decisions, International Journal of Logistics Management, 6, pp. 51–60.
9. Lamberti M., Esher F. (2007), Aluminium foil as a food packaging material in comparison with other materials, Journal of food Packaging Material,pp. 23, 407–433.
10. Page B., Edwards M., May N. (2003), Food Packaging technology, London, U.K. Blackwell Publishing, CRC Press. pp 12–51.
─── Food Technologies ───
─── Ukrainian Journal of Food Science. 2016. Volume 4. Issue 2 ─── 257
11. Franziska S. (2012), How cooking affects the nutrient content of food, https://authoritynutrition.com/cooking-nutrient-content/.
12. Floros J. D., Dock L. L., Han J. H. (1997), Active packaging technologies and applications, Food Cosmet Drug Packag, 20, pp.10–7.
13. Becker F. (2014), The difference in roasting and grilling, available at: http://www.livestrong.com/article/457331-recommended-way-to-cook-boneless-sirloin-roast-beef/.
14. Adeyeye S. A. (2017), The role of food processing and appropriate storage technologies in ensuring food security and food availability in Africa, Nutrition and Food Science, 47(1), pp. 35–42.
15. Jekayinka S., Omisakin O. (2005),The energy potentials of some agricultural wastes as local fuel materials in Nigeria, Agricultural Engineering International Journal, (7).
16. AOAC (2000), Official method of analysis of the Association of Official Analytical Chemists, 15th Edition, Washington USA.
17. Floros J. D., Matsos K. I. (2005), Introduction to modified atmosphere packaging, In, Han J. H., editor. Innovations in Food Packaging, London , Elsevier Ltd., pp. 159–72.
18. Jong W.R. (2010), Effect of moisture content on tensile properties of paper based food packaging materials, Journal of Food Science and Biotechnology, (19), pp. 243–247.
19. Egbuike G.N., Okunbanjo A.O. (2000), Effects of processing on the quality of Nigerian meat products, Livestock production science, 59, pp.155–163.
20. Velasco J., Marmesat S., Dobarganes M.C. (2008), Chemistry of frying in deep fat, Frying of Foods, pp. 35–36.
─── Food Technologies ───
─── Ukrainian Journal of Food Science. 2016. Volume 4. Issue 2 ─── 258
Improvement technologies of aqueous-alcoholic infusions for the production of syrups
Oleg Kuzmin, Yana Kovalchuk, Volodymyr Velychko, Nataliia Romanchenko National university of food technologies, Kyiv, Ukraine
Abstract
Keywords: Biscuit Extract Syrup Alcohol Antioxidant
Article history: Received 17.11.2016 Received in revised form 26.12.2016 Accepted 30.12.2016
Corresponding author: Oleg Kuzmin E-mail: [email protected]
DOI: 10.24263/2310-1008-2016-4-2-8
Introduction. The aim is scientific justification and innovative technologies of aqueous-alcoholic infusions (AAI) for producing syrups in confectionery products, for giving them functional and health qualities.
Materials and methods. Methods of investigation: redoxometry – determination of antioxidant capacity of AAI from plant raw materials; pH-metry; methods of determining of the organoleptic indicators.
Results and discussion. The minimal theoretically expected meaning of Ehmin for plant water-alcohol extracts was got, which has meanings from 203,0 mV (ginger root) to 480,9 mV (Sudan rose), and actually measured Ehact – 82,0 mV (strawberry leaves) to 246,0 mV (ginger root). Thus, the minimum quantity of redox reaction (RR) is – 42,3 mV and typical for ginger root, and the highest meaning 266,0 mV has the AAI from guilder rose fruits. The pH level for AAI has meaning from 2,985 (Sudanese rose) to 7,605 (ginger root) that infusios have reactions from acidic to slightly alkaline.
The groups of infusions for antioxidant ability were defined: infusions with low activity – 3 samples (25%), among them are ginger roots, apple fruits, elderberry fruits; infusions with middle activity – 4 samples (33%), among them the lowest meaning 133,4 mV has cinnamon, and the most – 171,8 mV has cherry leaves; infusions with the high activity – 5 samples (42%), among them are rowan – 234,3 mV, cherry – 247,5 mV, Sudanese rose – 260,4 mV, guelder rose – 266 mV and buckthorn – 282,4 mV.
Conclusion. The most promising sources of natural antioxidants for usage in syrups technology for impregnation of confectionery product were defined.
─── Food Technologies ───
─── Ukrainian Journal of Food Science. 2016. Volume 4. Issue 2 ─── 259
Introduction Today the market of confectionery products is expanding day by day in number and
variety. There is a large number of new varieties of confectionery products with health and functional purpose, too.
Modern consumer imparts particular importance to the consequences, connected with consumption of confectionery. It is known, that this group of products consisting of large amounts of fats and carbohydrates, is very caloric, but in a few number it satisfies organism with necessary substances in the daily ration. Therefore, the creation of confectionery products, in less measures has a harmful impact on the organism, constantly are maintained for satisfaction of buyer’s desires.
A wide range of confectionery products are based on the using of different raw materials which are substitutes for existing, but with more useful properties. On the one hand, it provides the product with the functional properties, on the other – in different ways the taste indicators of the usual, for consumer recipe selection change. Consequently, the question of searching of key moments of influence on the body and their solutions with minimal impact on its organoleptic become relevant.
The main tool that provides the vital functions of any organism and regulates the ratio of energy for maintaining of homeostasis (relative dynamic constancy of composition and properties of the internal environment and sustainability of basic physiological functions of organism) and is spent on the regeneration of cells, is a change of the speed of redox reactions (RR). This speed depends on the concentration and the ratio of oxidized and reduced forms of substances in the body, including substances from food and drinks. Therefore, one of the most important factors of the indicator regulations of RR is redox potential (RP).
In the confectionery industry, one of the ways to influence on the antioxidant properties of the product – is the infusion of plant components into the alcohol – raw materials, namely syrups for impregnation of products.
So, syrups for impregnation should not only perform its basic technological function – to moisturize and to improve the organoleptic indicators of confectionery, and should enrich the finished product with useful for the human body substances and provide desired properties.
It is possible, due to the leading to the recipe of herbal extracts, which are prepared by infusion of plant raw materials (both aromatic and non-aromatic), based on aqueous-alcoholic and wine-cognac raw materials.
In consequence of extracting of plant raw material into the raw alcohol material, an enrichment of the last by nutrients (vitamins, minerals, organic acids, polyphenolic compounds) is held, which increases the antioxidant properties of the solution.
Therefore, the purpose of our work is to study the antioxidant activity of infusions from raw plant materials on aqueous-alcoholic and wine-cognac raw materials, identification of the most promising sources of natural antioxidants for use in syrup technology for impregnation in the confectionery industry and determine the best composition of syrup for impregnation of confectionery products of these infusions.
The object of study is the characteristics and indicators of quality of AAI, brandy infusions from plant raw materials, syrups for impregnation, organoleptic properties (color, smell, taste); physicochemical indicators (pH, RP).
The subject of study is aqueous-alcohol solution (control); AAI from plant raw materials: ginger root, apple fruits, cherry fruits, strawberry fruits, elderberry fruits,
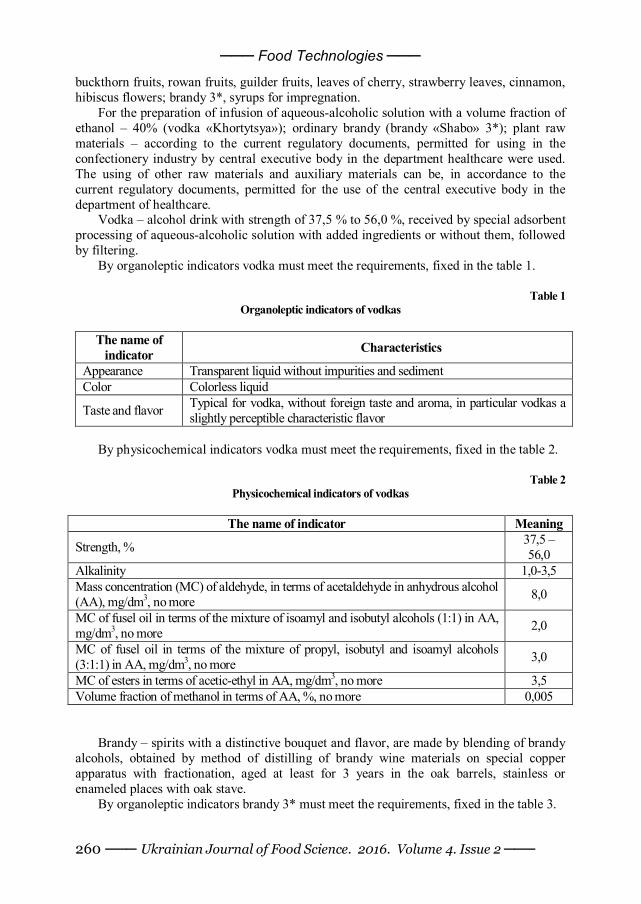
─── Food Technologies ───
─── Ukrainian Journal of Food Science. 2016. Volume 4. Issue 2 ─── 260
buckthorn fruits, rowan fruits, guilder fruits, leaves of cherry, strawberry leaves, cinnamon, hibiscus flowers; brandy 3*, syrups for impregnation.
For the preparation of infusion of aqueous-alcoholic solution with a volume fraction of ethanol – 40% (vodka «Khortytsya»); ordinary brandy (brandy «Shabo» 3*); plant raw materials – according to the current regulatory documents, permitted for using in the confectionery industry by central executive body in the department healthcare were used. The using of other raw materials and auxiliary materials can be, in accordance to the current regulatory documents, permitted for the use of the central executive body in the department of healthcare.
Vodka – alcohol drink with strength of 37,5 % to 56,0 %, received by special adsorbent processing of aqueous-alcoholic solution with added ingredients or without them, followed by filtering.
By organoleptic indicators vodka must meet the requirements, fixed in the table 1.
Table 1 Organoleptic indicators of vodkas
The name of
indicator Characteristics
Appearance Transparent liquid without impurities and sediment Color Colorless liquid
Taste and flavor Typical for vodka, without foreign taste and aroma, in particular vodkas a slightly perceptible characteristic flavor
By physicochemical indicators vodka must meet the requirements, fixed in the table 2.
Table 2
Physicochemical indicators of vodkas
The name of indicator Meaning
Strength, % 37,5 – 56,0
Alkalinity 1,0-3,5 Mass concentration (MC) of aldehyde, in terms of acetaldehyde in anhydrous alcohol (AA), mg/dm3, no more 8,0
МC of fusel oil in terms of the mixture of isoamyl and isobutyl alcohols (1:1) in AA, mg/dm3, no more 2,0
МC of fusel oil in terms of the mixture of propyl, isobutyl and isoamyl alcohols (3:1:1) in AA, mg/dm3, no more 3,0
МC of esters in terms of acetic-ethyl in AA, mg/dm3, no more 3,5 Volume fraction of methanol in terms of AA, %, no more 0,005
Brandy – spirits with a distinctive bouquet and flavor, are made by blending of brandy alcohols, obtained by method of distilling of brandy wine materials on special copper apparatus with fractionation, aged at least for 3 years in the oak barrels, stainless or enameled places with oak stave.
By organoleptic indicators brandy 3* must meet the requirements, fixed in the table 3.
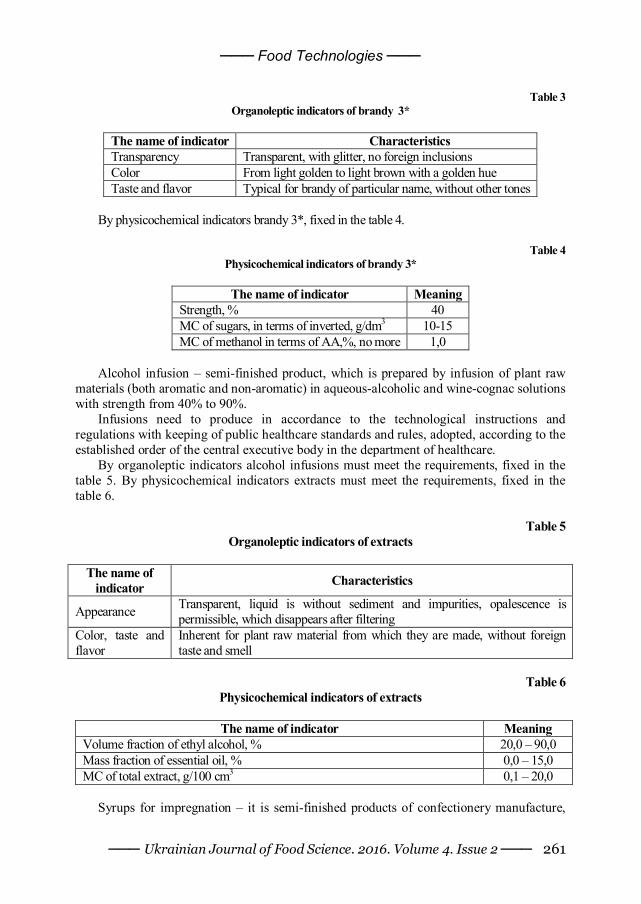
─── Food Technologies ───
─── Ukrainian Journal of Food Science. 2016. Volume 4. Issue 2 ─── 261
Table 3
Organoleptic indicators of brandy 3*
The name of indicator Characteristics Transparency Transparent, with glitter, no foreign inclusions Color From light golden to light brown with a golden hue Taste and flavor Typical for brandy of particular name, without other tones
By physicochemical indicators brandy 3*, fixed in the table 4.
Table 4
Physicochemical indicators of brandy 3*
The name of indicator Meaning Strength, % 40 МC of sugars, in terms of inverted, g/dm3 10-15 МC of methanol in terms of AA,%, no more 1,0
Alcohol infusion – semi-finished product, which is prepared by infusion of plant raw
materials (both aromatic and non-aromatic) in aqueous-alcoholic and wine-cognac solutions with strength from 40% to 90%.
Infusions need to produce in accordance to the technological instructions and regulations with keeping of public healthcare standards and rules, adopted, according to the established order of the central executive body in the department of healthcare.
By organoleptic indicators alcohol infusions must meet the requirements, fixed in the table 5. By physicochemical indicators extracts must meet the requirements, fixed in the table 6.
Table 5
Organoleptic indicators of extracts
The name of indicator Characteristics
Appearance Transparent, liquid is without sediment and impurities, opalescence is permissible, which disappears after filtering
Color, taste and flavor
Inherent for plant raw material from which they are made, without foreign taste and smell
Table 6
Physicochemical indicators of extracts
The name of indicator Meaning Volume fraction of ethyl alcohol, % 20,0 – 90,0 Mass fraction of essential oil, % 0,0 – 15,0 MC of total extract, g/100 cm3 0,1 – 20,0
Syrups for impregnation – it is semi-finished products of confectionery manufacture,
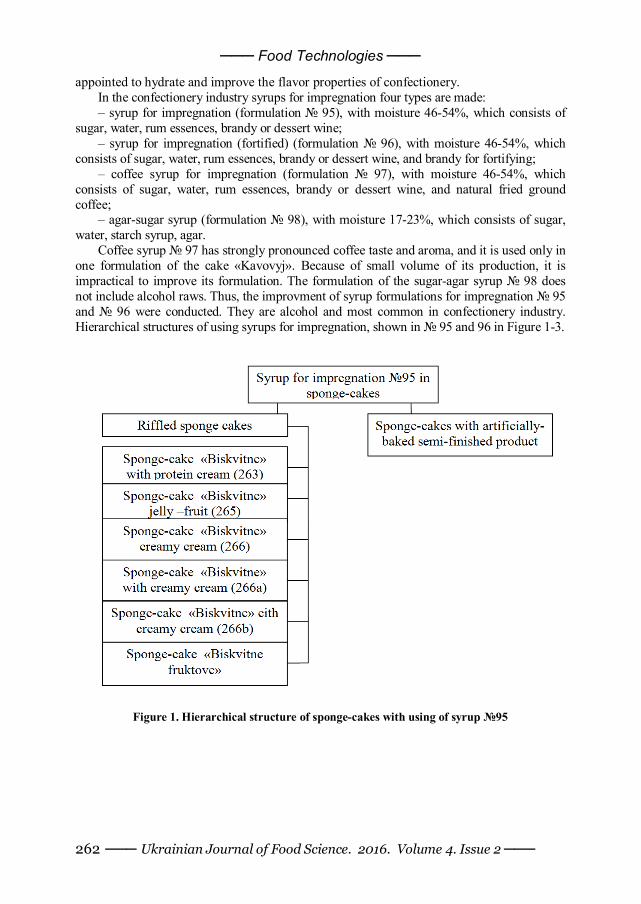
─── Food Technologies ───
─── Ukrainian Journal of Food Science. 2016. Volume 4. Issue 2 ─── 262
appointed to hydrate and improve the flavor properties of confectionery. In the confectionery industry syrups for impregnation four types are made: – syrup for impregnation (formulation № 95), with moisture 46-54%, which consists of
sugar, water, rum essences, brandy or dessert wine; – syrup for impregnation (fortified) (formulation № 96), with moisture 46-54%, which
consists of sugar, water, rum essences, brandy or dessert wine, and brandy for fortifying; – coffee syrup for impregnation (formulation № 97), with moisture 46-54%, which
consists of sugar, water, rum essences, brandy or dessert wine, and natural fried ground coffee;
– agar-sugar syrup (formulation № 98), with moisture 17-23%, which consists of sugar, water, starch syrup, agar.
Coffee syrup № 97 has strongly pronounced coffee taste and aroma, and it is used only in one formulation of the cake «Kavovyj». Because of small volume of its production, it is impractical to improve its formulation. The formulation of the sugar-agar syrup № 98 does not include alcohol raws. Thus, the improvment of syrup formulations for impregnation № 95 and № 96 were conducted. They are alcohol and most common in confectionery industry. Hierarchical structures of using syrups for impregnation, shown in № 95 and 96 in Figure 1-3.
Figure 1. Hierarchical structure of sponge-cakes with using of syrup №95
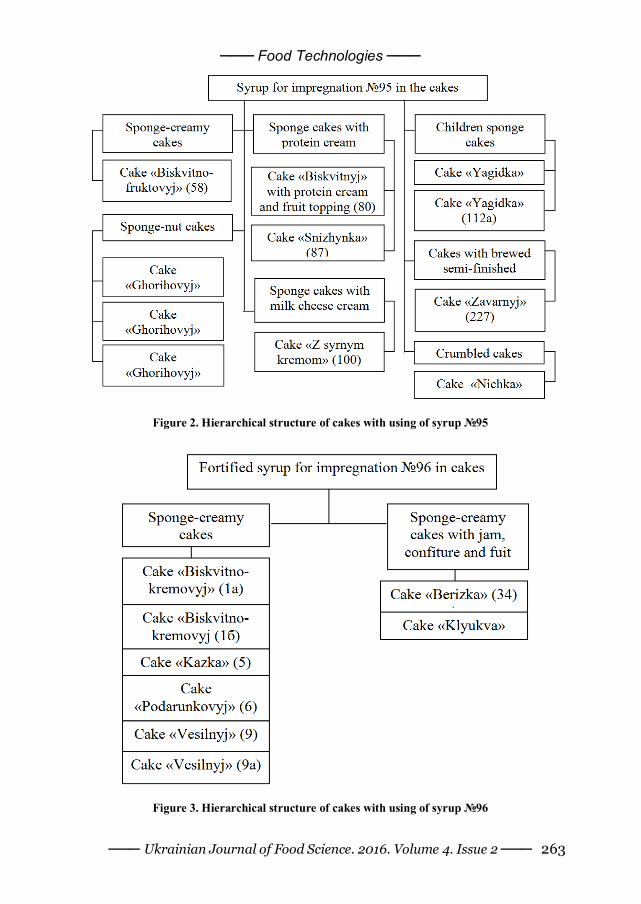
─── Food Technologies ───
─── Ukrainian Journal of Food Science. 2016. Volume 4. Issue 2 ─── 263
Figure 2. Hierarchical structure of cakes with using of syrup №95
Figure 3. Hierarchical structure of cakes with using of syrup №96
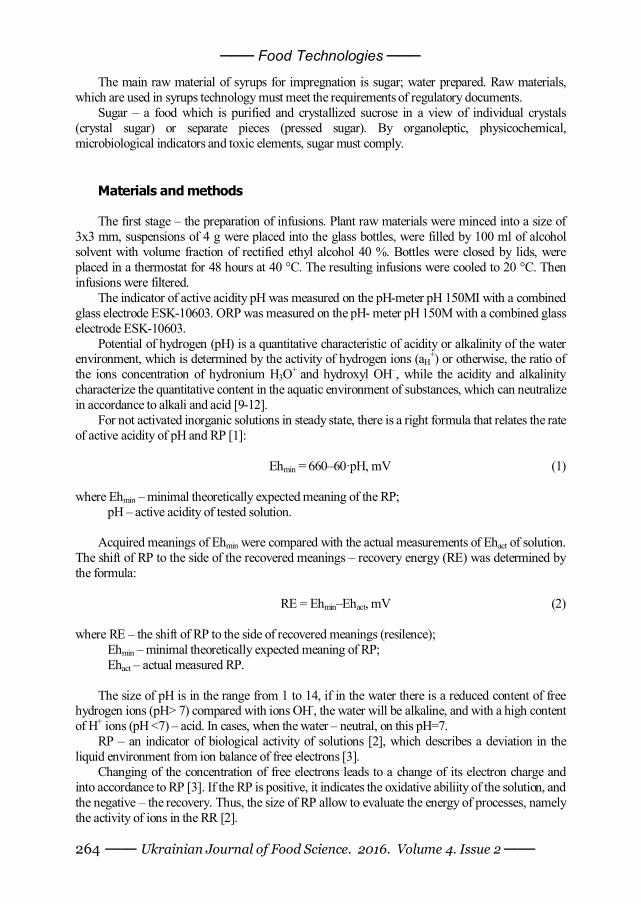
─── Food Technologies ───
─── Ukrainian Journal of Food Science. 2016. Volume 4. Issue 2 ─── 264
The main raw material of syrups for impregnation is sugar; water prepared. Raw materials, which are used in syrups technology must meet the requirements of regulatory documents.
Sugar – a food which is purified and crystallized sucrose in a view of individual crystals (crystal sugar) or separate pieces (pressed sugar). By organoleptic, physicochemical, microbiological indicators and toxic elements, sugar must comply.
Materials and methods
The first stage – the preparation of infusions. Plant raw materials were minced into a size of
3x3 mm, suspensions of 4 g were placed into the glass bottles, were filled by 100 ml of alcohol solvent with volume fraction of rectified ethyl alcohol 40 %. Bottles were closed by lids, were placed in a thermostat for 48 hours at 40 °C. The resulting infusions were cooled to 20 °C. Then infusions were filtered.
The indicator of active acidity pH was measured on the pH-meter pH 150MI with a combined glass electrode ESK-10603. ORP was measured on the pH- meter pH 150M with a combined glass electrode ESK-10603.
Potential of hydrogen (рН) is a quantitative characteristic of acidity or alkalinity of the water environment, which is determined by the activity of hydrogen ions (аН
+) or otherwise, the ratio of the ions concentration of hydronium H3O+ and hydroxyl OH–, while the acidity and alkalinity characterize the quantitative content in the aquatic environment of substances, which can neutralize in accordance to alkali and acid [9-12].
For not activated inorganic solutions in steady state, there is a right formula that relates the rate of active acidity of pH and RP [1]:
Ehmin = 660–60·рН, mV (1)
where Ehmin – minimal theoretically expected meaning of the RP; рН – active acidity of tested solution.
Acquired meanings of Ehmin were compared with the actual measurements of Ehact of solution.
The shift of RP to the side of the recovered meanings – recovery energy (RE) was determined by the formula:
RE = Ehmin–Ehact, mV (2)
where RE – the shift of RP to the side of recovered meanings (resilence); Ehmin – minimal theoretically expected meaning of RP; Ehact – actual measured RP.
The size of pH is in the range from 1 to 14, if in the water there is a reduced content of free
hydrogen ions (pH> 7) compared with ions ОН-, the water will be alkaline, and with a high content of H+ ions (pH <7) – acid. In cases, when the water – neutral, on this рН=7.
RP – an indicator of biological activity of solutions [2], which describes a deviation in the liquid environment from ion balance of free electrons [3].
Changing of the concentration of free electrons leads to a change of its electron charge and into accordance to RP [3]. If the RP is positive, it indicates the oxidative abiliity of the solution, and the negative – the recovery. Thus, the size of RP allow to evaluate the energy of processes, namely the activity of ions in the RR [2].
─── Food Technologies ───
─── Ukrainian Journal of Food Science. 2016. Volume 4. Issue 2 ─── 265
During redoxometry (metering by the platinum electrode into camparison with silver chloride electrode) RP of internal environment of organism of healthy person has meaning less than zero (-100...-200 mV). By this RP of drinking water from the city water network, depending on the place of watershed, season, water system (except electrochemical activation) is always above zero (+100...+ 400 mV).
These differences of RP of internal environment of the human body and drinking water means that the activity of electrons in the internal environment is much higher than the activity of electrons in water. Herewith, in the body the necessary change of RP of drinking water is held, due to electric power consumption of cell membranes, namely the highest level of energy, energy, which actually is the end product of the biochemical chain of transformation of nutrients. The amount of energy, expended by the body to achieve biological compatibility of water, is proportional to its amount and the difference of RP of water and internal environment [4].
Except of drinking water, person consumes aquaeous and aqueous-alcoholic solutions, food, RP which is positive. When such products reach into the tissues, the subtracting of electrons from cells and tissues that consist of 80-90% of water occurs. As a result, the biological structure of the organism (cell membranes, organelles of cells, nucleic acids, etc.) subjects to oxidative destruction, body wears down, ages, vital organs lose their function.
When aqueous solutions or foods with negative RP, similar to the meaning of RP of internal environment of the human body, enter into the body, the electrical energy of cell membranes are not spent on correcting the activity of electrons of these aqueous solutions or foods, therefore, the products are immediately assimilated, because they have biological compatibility on this parameter.
If aqueous solutions or foods have more negative RP than RP of internal environment, they fed it by this energy, which is used by cells as an energy reserve of antioxidant protection of the body from the adverse effect of the environment [7].
So, if the human body optimally uses aqueous-alcohol solutions and foods in metabolic processes, the meaning of RP must conform the meaning of RP of internal environment of organism or has more negative meanings.
The second stage – cooking of syrup. Sugar was leaded into the boiling water at a ratio weight of 1:1,1 and boiled it to the density of 1,22-1,25 kg/dm3 at constant stirring with removing foam, received syrup was cooled to the temperature of 20 °C and was filtered. Blending of sugar syrup was carried out with the addition of rum essence, brandy 3* and (or) plant AAI. In the result, the transparent viscous syrup with humidity of 46-54% with rum, cognac flavor, with notes of plant raw material was got, which was extracted into the added extracts [5].
According to the research the tasting evaluation was conducted and the most optimal composition of syrup formulation for impregnation was determined.
Results and discussions
As a control, vodka «Khortytsya» and brandy «Shabo» 3* were used. During the study all plant AAI are grouped by antioxidant activity, infusions of low
activity (from 0 to 100 mV); infusions with middle activity (from 100 to 200 mV); infusions with high activity (from 200 mV and higher).
Improvement of syrups for impregnation of confectionery products by AAI from plant raw materials.
For the study, 12 samples were selected from plant raw materials – fruits, roots, leaves, flowers (Figure 4).
After all stages of infusion preparations, which are shown in Figure 5, the researches of
─── Food Technologies ───
─── Ukrainian Journal of Food Science. 2016. Volume 4. Issue 2 ─── 266
them were carried out by organoleptic and physicochemical indicators [6]. The samples were evaluated by organoleptic characteristics. The results of organoleptic
evaluation of infusions are presented in the table 7.
Table 7 Organoleptic characteristics of vodka extracts from plant raw materials
№ Name Color Smell Taste Overall, point
0 Vodka (control) transparent alcohol burning, synthetic
aftertaste 9,610
1 Ginger infusion
feculent, light-yellow
alcohol, brightly expressed,
gingery
bitter, burning, intense 9,630
2 Apple infusion
transparent, light-strawed
a faint smell of alcohol, fresh savorless, sour 9,650
3 Strawberry fruits infusion
transparent, saturated yellow
berry-alcohol, yeast
Sour-bittered, astringent aftertaste
9,640
4 Infusion of cherry leaves
transparent, yellow-green tart, wood bitter, tart,
saturated 9,510
5 Infusion of srawberry
leaves
transparent, brown rubber spicy 9,620
6 Herry fruits infusion
transparent, light-pink light cherry of fresh fruits 9,650
7 Cinamon infusion ruby-brown cinamon tart, oak 9,625
8 Hibiscus infusion ruby-saturated brightly fruit sweet and sour,
tart, 9,670
9 Elder infusion feculent, gray-purple earthy of mushrooms,
sweet 9,645
10 Buckthorn infusion
transparent, light-strawed bright, fruit, oily Easy bitter taste,
acerbity 9,635
11 Rowan infusion
transparent, light-pink alcohol, plant light bitter, tart 9,655
12 Guelder rose infusion
Transparent, slightly orange light medical soft, tart, bitter
aftertaste 9,600
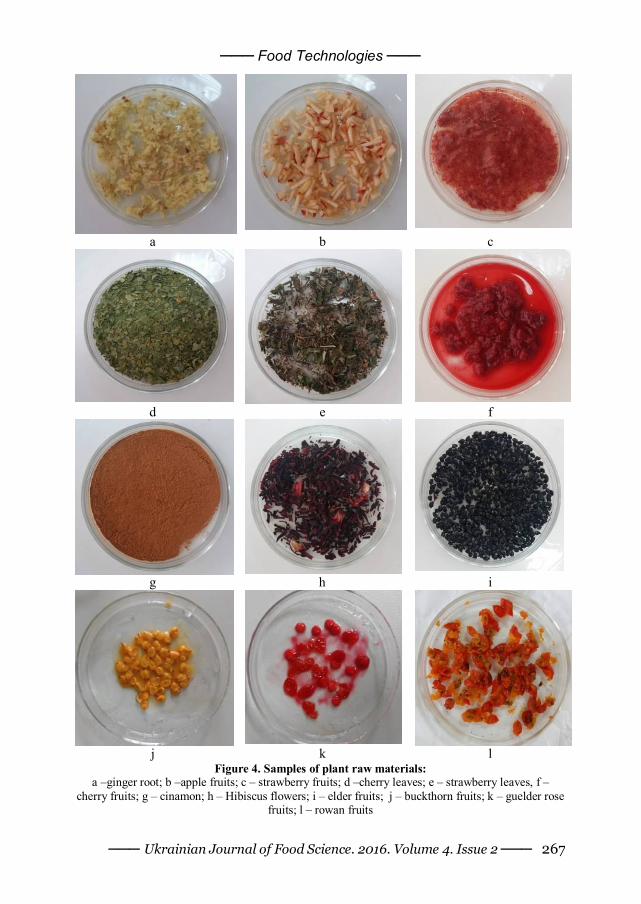
─── Food Technologies ───
─── Ukrainian Journal of Food Science. 2016. Volume 4. Issue 2 ─── 267
а b c
d e f
g h i
j k l
Figure 4. Samples of plant raw materials: а –ginger root; b –apple fruits; c – strawberry fruits; d –cherry leaves; e – strawberry leaves, f –
cherry fruits; g – cinamon; h – Hibiscus flowers; i – elder fruits; j – buckthorn fruits; k – guelder rose fruits; l – rowan fruits
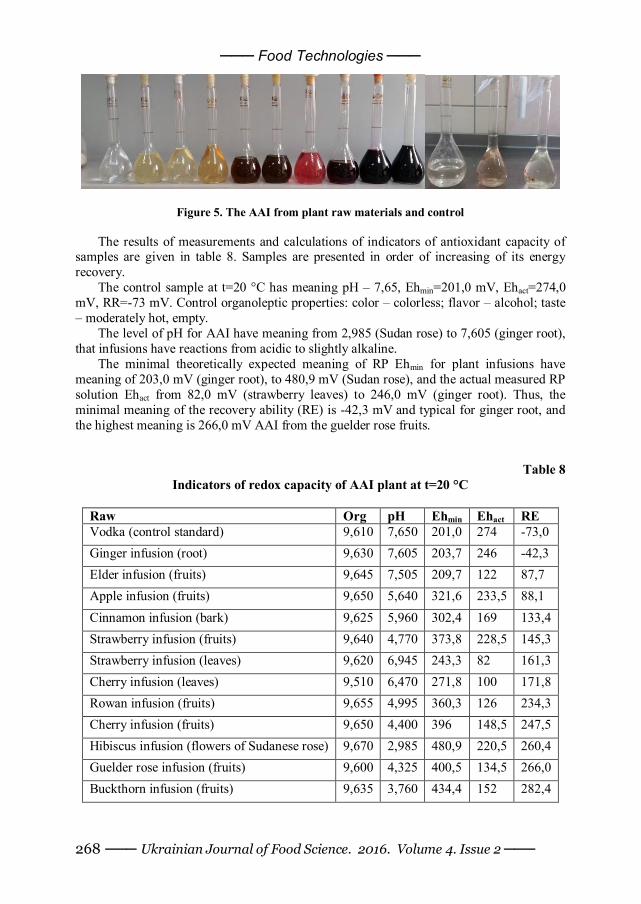
─── Food Technologies ───
─── Ukrainian Journal of Food Science. 2016. Volume 4. Issue 2 ─── 268
Figure 5. The AAI from plant raw materials and control
The results of measurements and calculations of indicators of antioxidant capacity of samples are given in table 8. Samples are presented in order of increasing of its energy recovery.
The control sample at t=20 °C has meaning pH – 7,65, Ehmin=201,0 mV, Ehact=274,0 mV, RR=-73 mV. Control organoleptic properties: color – colorless; flavor – alcohol; taste – moderately hot, empty.
The level of pH for AAI have meaning from 2,985 (Sudan rose) to 7,605 (ginger root), that infusions have reactions from acidic to slightly alkaline.
The minimal theoretically expected meaning of RP Ehmin for plant infusions have meaning of 203,0 mV (ginger root), to 480,9 mV (Sudan rose), and the actual measured RP solution Ehact from 82,0 mV (strawberry leaves) to 246,0 mV (ginger root). Thus, the minimal meaning of the recovery ability (RE) is -42,3 mV and typical for ginger root, and the highest meaning is 266,0 mV AAI from the guelder rose fruits.
Table 8 Indicators of redox capacity of AAI plant at t=20 °C
Raw Org рН Ehmin Ehact RE Vodka (control standard) 9,610 7,650 201,0 274 -73,0 Ginger infusion (root) 9,630 7,605 203,7 246 -42,3 Elder infusion (fruits) 9,645 7,505 209,7 122 87,7 Apple infusion (fruits) 9,650 5,640 321,6 233,5 88,1 Cinnamon infusion (bark) 9,625 5,960 302,4 169 133,4 Strawberry infusion (fruits) 9,640 4,770 373,8 228,5 145,3 Strawberry infusion (leaves) 9,620 6,945 243,3 82 161,3 Cherry infusion (leaves) 9,510 6,470 271,8 100 171,8 Rowan infusion (fruits) 9,655 4,995 360,3 126 234,3 Cherry infusion (fruits) 9,650 4,400 396 148,5 247,5 Hibiscus infusion (flowers of Sudanese rose) 9,670 2,985 480,9 220,5 260,4 Guelder rose infusion (fruits) 9,600 4,325 400,5 134,5 266,0 Buckthorn infusion (fruits) 9,635 3,760 434,4 152 282,4
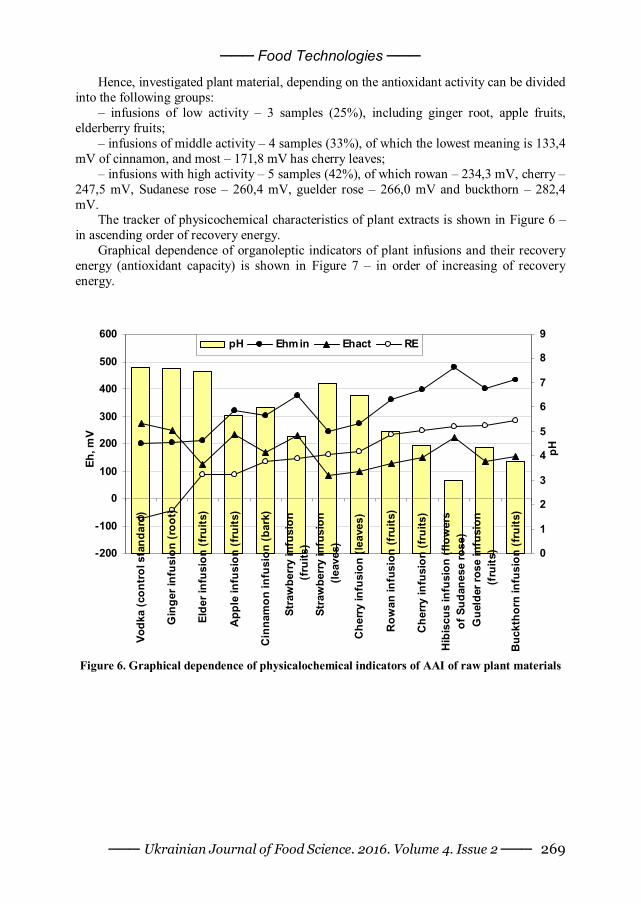
─── Food Technologies ───
─── Ukrainian Journal of Food Science. 2016. Volume 4. Issue 2 ─── 269
Hence, investigated plant material, depending on the antioxidant activity can be divided into the following groups:
– infusions of low activity – 3 samples (25%), including ginger root, apple fruits, elderberry fruits;
– infusions of middle activity – 4 samples (33%), of which the lowest meaning is 133,4 mV of cinnamon, and most – 171,8 mV has cherry leaves;
– infusions with high activity – 5 samples (42%), of which rowan – 234,3 mV, cherry – 247,5 mV, Sudanese rose – 260,4 mV, guelder rose – 266,0 mV and buckthorn – 282,4 mV.
The tracker of physicochemical characteristics of plant extracts is shown in Figure 6 – in ascending order of recovery energy.
Graphical dependence of organoleptic indicators of plant infusions and their recovery energy (antioxidant capacity) is shown in Figure 7 – in order of increasing of recovery energy.
-200
-100
0
100
200
300
400
500
600
Vodk
a (c
ontr
ol s
tand
ard)
Gin
ger i
nfus
ion
(roo
t)
Elde
r inf
usio
n (f
ruits
)
App
le in
fusi
on (f
ruits
)
Cin
nam
on in
fusi
on (b
ark)
Stra
wbe
rry
infu
sion
(fru
its)
Stra
wbe
rry
infu
sion
(leav
es)
Che
rry
infu
sion
(lea
ves)
Row
an in
fusi
on (f
ruits
)
Che
rry
infu
sion
(fru
its)
Hib
iscu
s in
fusi
on (f
low
ers
of S
udan
ese
rose
)G
ueld
er ro
se in
fusi
on(f
ruits
)
Buc
ktho
rn in
fusi
on (f
ruits
)
Eh, m
V
0
1
2
3
4
5
6
7
8
9
рН
рН Ehmin Ehact RE
Figure 6. Graphical dependence of physicalochemical indicators of AAI of raw plant materials
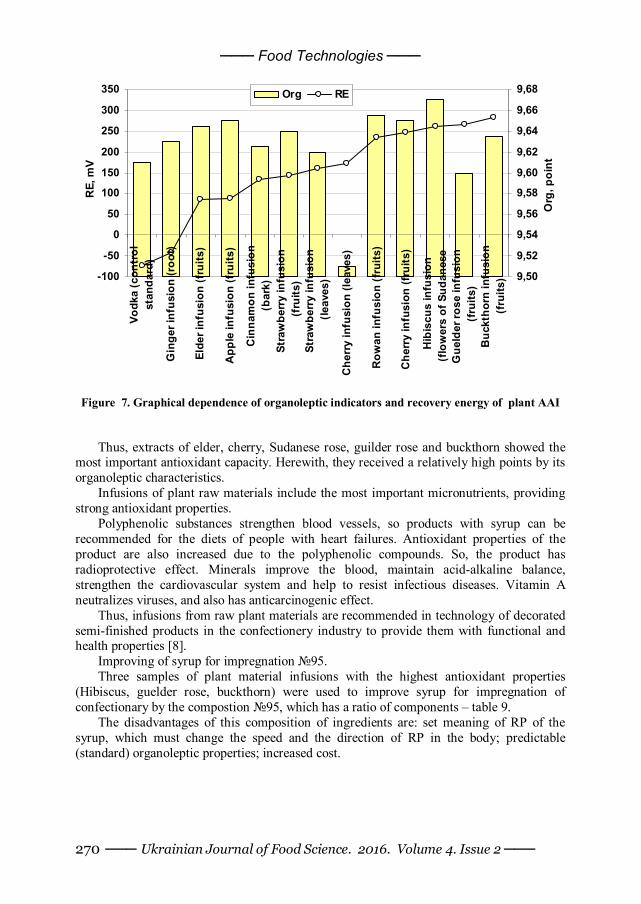
─── Food Technologies ───
─── Ukrainian Journal of Food Science. 2016. Volume 4. Issue 2 ─── 270
-100
-50
0
50
100
150
200
250
300
350
Vodk
a (c
ontr
olst
anda
rd)
Gin
ger i
nfus
ion
(roo
t)
Elde
r inf
usio
n (f
ruits
)
App
le in
fusi
on (f
ruits
)
Cin
nam
on in
fusi
on(b
ark)
Stra
wbe
rry
infu
sion
(fru
its)
Stra
wbe
rry
infu
sion
(leav
es)
Che
rry
infu
sion
(lea
ves)
Row
an in
fusi
on (f
ruits
)
Che
rry
infu
sion
(fru
its)
Hib
iscu
s in
fusi
on(f
low
ers
of S
udan
ese
Gue
lder
rose
infu
sion
(fru
its)
Buc
ktho
rn in
fusi
on(f
ruits
)
RE,
mV
9,50
9,52
9,54
9,56
9,58
9,60
9,62
9,64
9,66
9,68
Org
, poi
nt
Org RE
Figure 7. Graphical dependence of organoleptic indicators and recovery energy of plant AAI Thus, extracts of elder, cherry, Sudanese rose, guilder rose and buckthorn showed the
most important antioxidant capacity. Herewith, they received a relatively high points by its organoleptic characteristics.
Infusions of plant raw materials include the most important micronutrients, providing strong antioxidant properties.
Polyphenolic substances strengthen blood vessels, so products with syrup can be recommended for the diets of people with heart failures. Antioxidant properties of the product are also increased due to the polyphenolic compounds. So, the product has radioprotective effect. Minerals improve the blood, maintain acid-alkaline balance, strengthen the cardiovascular system and help to resist infectious diseases. Vitamin A neutralizes viruses, and also has anticarcinogenic effect.
Thus, infusions from raw plant materials are recommended in technology of decorated semi-finished products in the confectionery industry to provide them with functional and health properties [8].
Improving of syrup for impregnation №95. Three samples of plant material infusions with the highest antioxidant properties
(Hibiscus, guelder rose, buckthorn) were used to improve syrup for impregnation of confectionary by the compostion №95, which has a ratio of components – table 9.
The disadvantages of this composition of ingredients are: set meaning of RP of the syrup, which must change the speed and the direction of RP in the body; predictable (standard) organoleptic properties; increased cost.
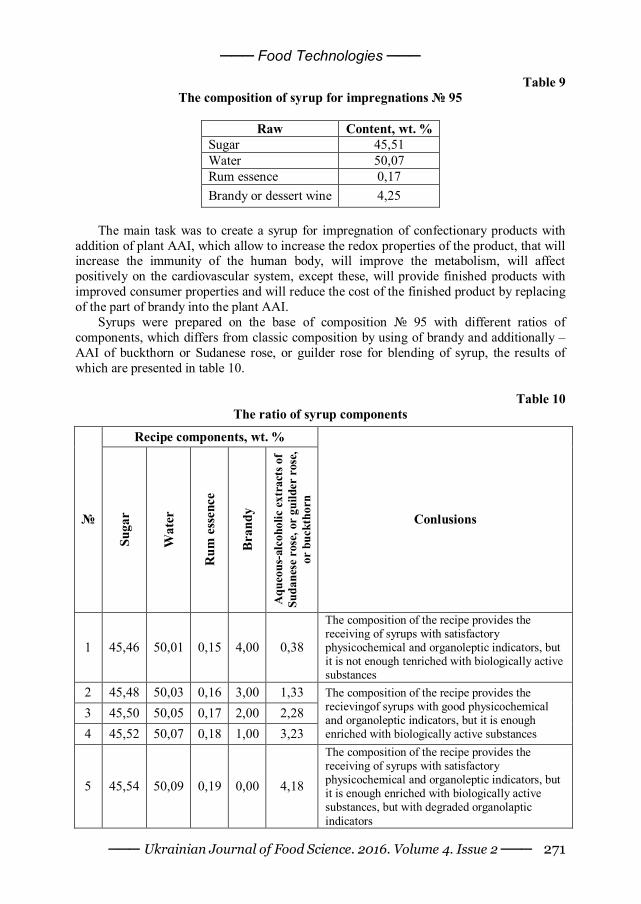
─── Food Technologies ───
─── Ukrainian Journal of Food Science. 2016. Volume 4. Issue 2 ─── 271
Table 9 The composition of syrup for impregnations № 95
Raw Content, wt. %
Sugar 45,51 Water 50,07 Rum essence 0,17 Brandy or dessert wine 4,25
The main task was to create a syrup for impregnation of confectionary products with
addition of plant AAI, which allow to increase the redox properties of the product, that will increase the immunity of the human body, will improve the metabolism, will affect positively on the cardiovascular system, except these, will provide finished products with improved consumer properties and will reduce the cost of the finished product by replacing of the part of brandy into the plant AAI.
Syrups were prepared on the base of composition № 95 with different ratios of components, which differs from classic composition by using of brandy and additionally – AAI of buckthorn or Sudanese rose, or guilder rose for blending of syrup, the results of which are presented in table 10.
Table 10
The ratio of syrup components
Recipe components, wt. %
№
Suga
r
Wat
er
Rum
ess
ence
Bra
ndy
Aqu
eous
-alc
ohol
ic e
xtra
cts o
f Su
dane
se r
ose,
or
guild
er r
ose,
or
buc
ktho
rn
Conlusions
1 45,46 50,01 0,15 4,00 0,38
The composition of the recipe provides the receiving of syrups with satisfactory physicochemical and organoleptic indicators, but it is not enough tenriched with biologically active substances
2 45,48 50,03 0,16 3,00 1,33 3 45,50 50,05 0,17 2,00 2,28 4 45,52 50,07 0,18 1,00 3,23
The composition of the recipe provides the recievingof syrups with good physicochemical and organoleptic indicators, but it is enough enriched with biologically active substances
5 45,54 50,09 0,19 0,00 4,18
The composition of the recipe provides the receiving of syrups with satisfactory physicochemical and organoleptic indicators, but it is enough enriched with biologically active substances, but with degraded organolaptic indicators
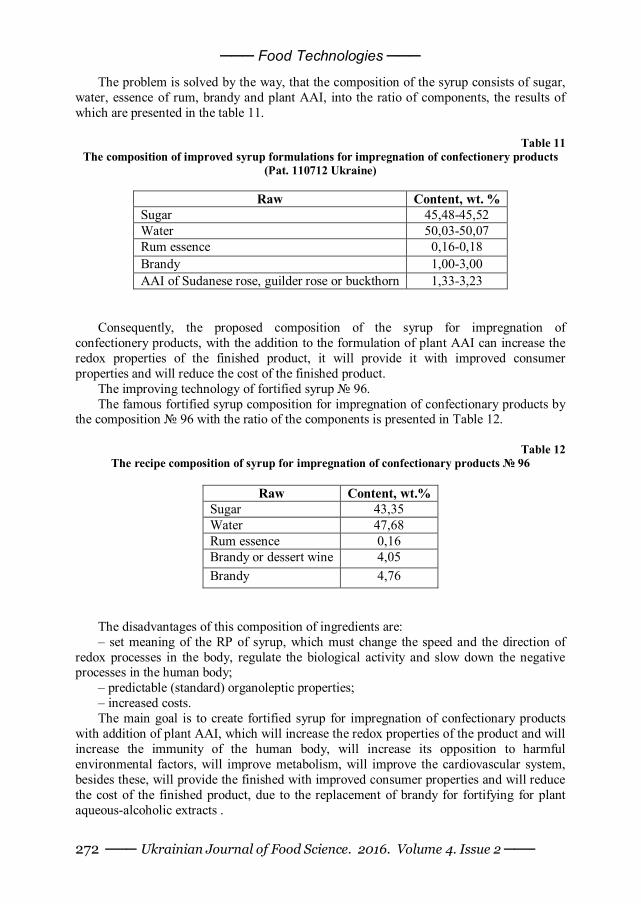
─── Food Technologies ───
─── Ukrainian Journal of Food Science. 2016. Volume 4. Issue 2 ─── 272
The problem is solved by the way, that the composition of the syrup consists of sugar, water, essence of rum, brandy and plant AAI, into the ratio of components, the results of which are presented in the table 11.
Table 11
The composition of improved syrup formulations for impregnation of confectionery products (Pat. 110712 Ukraine)
Raw Content, wt. %
Sugar 45,48-45,52 Water 50,03-50,07 Rum essence 0,16-0,18 Brandy 1,00-3,00 AAI of Sudanese rose, guilder rose or buckthorn 1,33-3,23
Consequently, the proposed composition of the syrup for impregnation of
confectionery products, with the addition to the formulation of plant AAI can increase the redox properties of the finished product, it will provide it with improved consumer properties and will reduce the cost of the finished product.
The improving technology of fortified syrup № 96. The famous fortified syrup composition for impregnation of confectionary products by
the composition № 96 with the ratio of the components is presented in Table 12.
Table 12 The recipe composition of syrup for impregnation of confectionary products № 96
Raw Content, wt.%
Sugar 43,35 Water 47,68 Rum essence 0,16 Brandy or dessert wine 4,05 Brandy 4,76
The disadvantages of this composition of ingredients are: – set meaning of the RP of syrup, which must change the speed and the direction of
redox processes in the body, regulate the biological activity and slow down the negative processes in the human body;
– predictable (standard) organoleptic properties; – increased costs. The main goal is to create fortified syrup for impregnation of confectionary products
with addition of plant AAI, which will increase the redox properties of the product and will increase the immunity of the human body, will increase its opposition to harmful environmental factors, will improve metabolism, will improve the cardiovascular system, besides these, will provide the finished with improved consumer properties and will reduce the cost of the finished product, due to the replacement of brandy for fortifying for plant aqueous-alcoholic extracts .
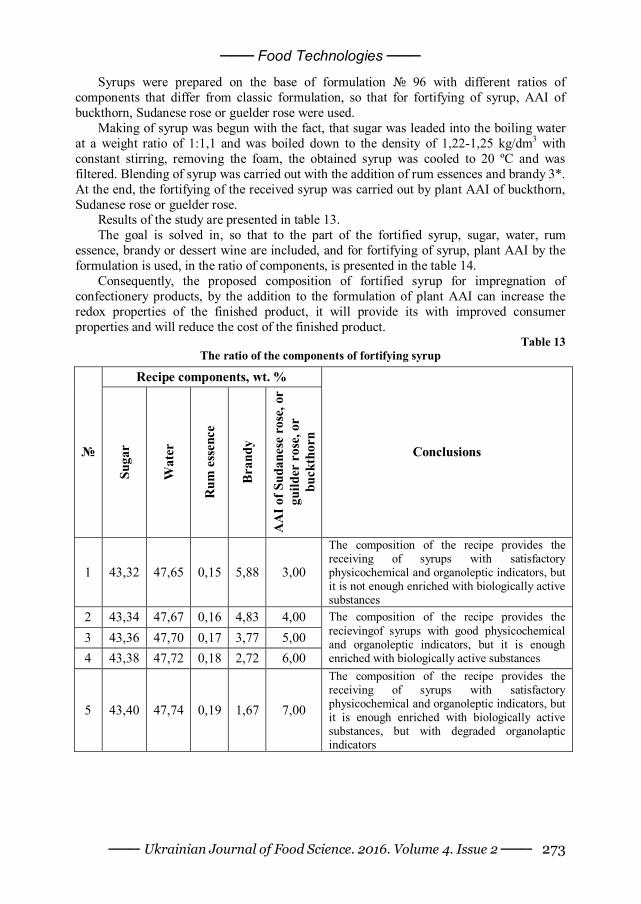
─── Food Technologies ───
─── Ukrainian Journal of Food Science. 2016. Volume 4. Issue 2 ─── 273
Syrups were prepared on the base of formulation № 96 with different ratios of components that differ from classic formulation, so that for fortifying of syrup, AAI of buckthorn, Sudanese rose or guelder rose were used.
Making of syrup was begun with the fact, that sugar was leaded into the boiling water at a weight ratio of 1:1,1 and was boiled down to the density of 1,22-1,25 kg/dm3 with constant stirring, removing the foam, the obtained syrup was cooled to 20 ºC and was filtered. Blending of syrup was carried out with the addition of rum essences and brandy 3*. At the end, the fortifying of the received syrup was carried out by plant AAI of buckthorn, Sudanese rose or guelder rose.
Results of the study are presented in table 13. The goal is solved in, so that to the part of the fortified syrup, sugar, water, rum
essence, brandy or dessert wine are included, and for fortifying of syrup, plant AAI by the formulation is used, in the ratio of components, is presented in the table 14.
Consequently, the proposed composition of fortified syrup for impregnation of confectionery products, by the addition to the formulation of plant AAI can increase the redox properties of the finished product, it will provide its with improved consumer properties and will reduce the cost of the finished product.
Table 13 The ratio of the components of fortifying syrup
Recipe components, wt. %
№
Suga
r
Wat
er
Rum
ess
ence
Bra
ndy
AA
I of S
udan
ese
rose
, or
guild
er r
ose,
or
buck
thor
n
Conclusions
1 43,32 47,65 0,15 5,88 3,00
The composition of the recipe provides the receiving of syrups with satisfactory physicochemical and organoleptic indicators, but it is not enough enriched with biologically active substances
2 43,34 47,67 0,16 4,83 4,00 3 43,36 47,70 0,17 3,77 5,00 4 43,38 47,72 0,18 2,72 6,00
The composition of the recipe provides the recievingof syrups with good physicochemical and organoleptic indicators, but it is enough enriched with biologically active substances
5 43,40 47,74 0,19 1,67 7,00
The composition of the recipe provides the receiving of syrups with satisfactory physicochemical and organoleptic indicators, but it is enough enriched with biologically active substances, but with degraded organolaptic indicators
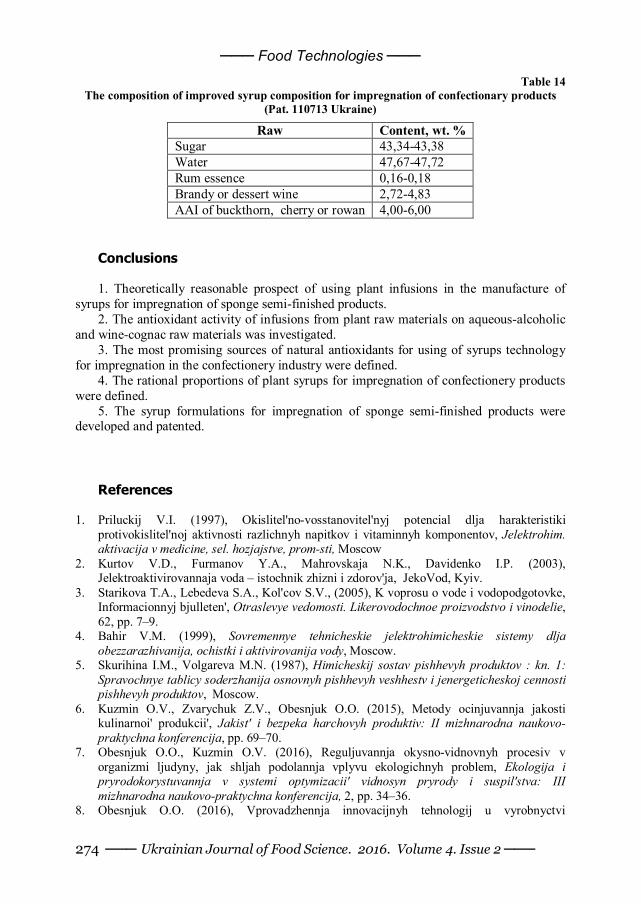
─── Food Technologies ───
─── Ukrainian Journal of Food Science. 2016. Volume 4. Issue 2 ─── 274
Table 14 The composition of improved syrup composition for impregnation of confectionary products
(Pat. 110713 Ukraine)
Raw Content, wt. % Sugar 43,34-43,38 Water 47,67-47,72 Rum essence 0,16-0,18 Brandy or dessert wine 2,72-4,83 AAI of buckthorn, cherry or rowan 4,00-6,00
Conclusions
1. Theoretically reasonable prospect of using plant infusions in the manufacture of
syrups for impregnation of sponge semi-finished products. 2. The antioxidant activity of infusions from plant raw materials on aqueous-alcoholic
and wine-cognac raw materials was investigated. 3. The most promising sources of natural antioxidants for using of syrups technology
for impregnation in the confectionery industry were defined. 4. The rational proportions of plant syrups for impregnation of confectionery products
were defined. 5. The syrup formulations for impregnation of sponge semi-finished products were
developed and patented.
References
1. Priluckij V.I. (1997), Okislitel'no-vosstanovitel'nyj potencial dlja harakteristiki
protivokislitel'noj aktivnosti razlichnyh napitkov i vitaminnyh komponentov, Jelektrohim. aktivacija v medicine, sel. hozjajstve, prom-sti, Moscow
2. Kurtov V.D., Furmanov Y.A., Mahrovskaja N.K., Davidenko I.P. (2003), Jelektroaktivirovannaja voda – istochnik zhizni i zdorov'ja, JekoVod, Kyiv.
3. Starikova T.A., Lebedeva S.A., Kol'cov S.V., (2005), K voprosu o vode i vodopodgotovke, Informacionnyj bjulleten', Otraslevye vedomosti. Likerovodochnoe proizvodstvo i vinodelie, 62, pp. 7–9.
4. Bahir V.M. (1999), Sovremennye tehnicheskie jelektrohimicheskie sistemy dlja obezzarazhivanija, ochistki i aktivirovanija vody, Moscow.
5. Skurihina I.M., Volgareva M.N. (1987), Himicheskij sostav pishhevyh produktov : kn. 1: Spravochnye tablicy soderzhanija osnovnyh pishhevyh veshhestv i jenergeticheskoj cennosti pishhevyh produktov, Moscow.
6. Kuzmin O.V., Zvarychuk Z.V., Obesnjuk O.O. (2015), Metody ocinjuvannja jakosti kulinarnoi' produkcii', Jakist' i bezpeka harchovyh produktiv: II mizhnarodna naukovo-praktychna konferencija, pp. 69–70.
7. Obesnjuk O.O., Kuzmin O.V. (2016), Reguljuvannja okysno-vidnovnyh procesiv v organizmi ljudyny, jak shljah podolannja vplyvu ekologichnyh problem, Ekologija i pryrodokorystuvannja v systemi optymizacii' vidnosyn pryrody i suspil'stva: III mizhnarodna naukovo-praktychna konferencija, 2, pp. 34–36.
8. Obesnjuk O.O. (2016), Vprovadzhennja innovacijnyh tehnologij u vyrobnyctvi
─── Food Technologies ───
─── Ukrainian Journal of Food Science. 2016. Volume 4. Issue 2 ─── 275
kondyters'kyh vyrobiv, Innovacijni naprjamky rozvytku osvity, sfery poslug i tehnologij: zb. tez dopovidej mizhn. nauk.-prakt. konferencii' studentiv i molodyh uchenyh, pp. 109–110.
9. Sujkov S., Topol'nik V., Kuzmin O. (2013), The change of the hydroxyl protons in aqueous alcoholic mixtures under the process of making vodkas, The advanced science journal, pp. 15–27.
10. Kuzmin O., Topol'nik V. (2014), Eduction of unsteady equilibrium in vodkas by means of 1H NMR spectroscopy, The advanced science journal, 10, pp. 43–46.
11. Topol'nik V., Kuzmin O., (2014), Eduction of transitional equilibrium in vodkas by means of 1H NMR spectroscopy, The advanced science journal, 12., pp. 61–64.
12. Kuzmin O., Topol'nik V., Myronchuk V. (2014), Eduction of equilibrium state in vodkas by means of 1H NMR spectroscopy, Ukrainian journal of food science, 2(2), pp. 220–228.
13. Manley D. (2011), 11 – Sugars and syrups as biscuit ingredients, Manley’s Technology of Biscuits, Crackers and Cookies (Fourth edition), pp. 143–159.
14. Clarke M.A. (2003), Syrups, Encyclopedia of Food Sciences and Nutrition (Second Edition), pp. 5711–5717.
15. Bassiouny S.S., Hassanien F.R., Abd El-Razik Ali F., Sohair M. El-Kayati (1990), Efficiency of antioxidants from natural sources in bakery products, Food Chemistry, 37(4), 1990, pp. 297–305
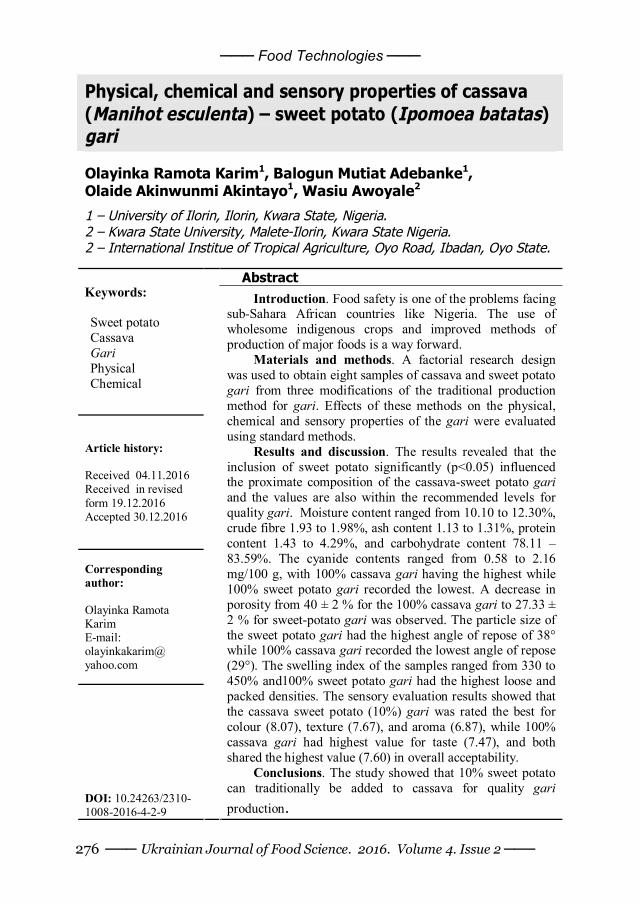
─── Food Technologies ───
─── Ukrainian Journal of Food Science. 2016. Volume 4. Issue 2 ─── 276
Physical, chemical and sensory properties of cassava (Manihot esculenta) – sweet potato (Ipomoea batatas) gari
Olayinka Ramota Karim1, Balogun Mutiat Adebanke1, Olaide Akinwunmi Akintayo1, Wasiu Awoyale2
1 – University of Ilorin, Ilorin, Kwara State, Nigeria. 2 – Kwara State University, Malete-Ilorin, Kwara State Nigeria. 2 – International Institue of Tropical Agriculture, Oyo Road, Ibadan, Oyo State.
Abstract
Keywords: Sweet potato Cassava Gari Physical Chemical
Article history: Received 04.11.2016 Received in revised form 19.12.2016 Accepted 30.12.2016
Corresponding author: Olayinka Ramota Karim E-mail: olayinkakarim@ yahoo.com
DOI: 10.24263/2310-1008-2016-4-2-9
Introduction. Food safety is one of the problems facing sub-Sahara African countries like Nigeria. The use of wholesome indigenous crops and improved methods of production of major foods is a way forward.
Materials and methods. A factorial research design was used to obtain eight samples of cassava and sweet potato gari from three modifications of the traditional production method for gari. Effects of these methods on the physical, chemical and sensory properties of the gari were evaluated using standard methods.
Results and discussion. The results revealed that the inclusion of sweet potato significantly (p<0.05) influenced the proximate composition of the cassava-sweet potato gari and the values are also within the recommended levels for quality gari. Moisture content ranged from 10.10 to 12.30%, crude fibre 1.93 to 1.98%, ash content 1.13 to 1.31%, protein content 1.43 to 4.29%, and carbohydrate content 78.11 – 83.59%. The cyanide contents ranged from 0.58 to 2.16 mg/100 g, with 100% cassava gari having the highest while 100% sweet potato gari recorded the lowest. A decrease in porosity from 40 ± 2 % for the 100% cassava gari to 27.33 ± 2 % for sweet-potato gari was observed. The particle size of the sweet potato gari had the highest angle of repose of 38° while 100% cassava gari recorded the lowest angle of repose (29°). The swelling index of the samples ranged from 330 to 450% and100% sweet potato gari had the highest loose and packed densities. The sensory evaluation results showed that the cassava sweet potato (10%) gari was rated the best for colour (8.07), texture (7.67), and aroma (6.87), while 100% cassava gari had highest value for taste (7.47), and both shared the highest value (7.60) in overall acceptability.
Conclusions. The study showed that 10% sweet potato can traditionally be added to cassava for quality gari production.
─── Food Technologies ───
─── Ukrainian Journal of Food Science. 2016. Volume 4. Issue 2 ─── 277
Introduction Cassava is a tropical root crop, requiring at least eight months of warm weather to
produce [21]. In sub-Saharan Africa, cassava is processed using methods which improve its food safety limitations. It is mainly a subsistence food crop grown for food by small-scale farmers; the surplus is sold. Roots can be harvested between 6 months and 3 years after planting [15]. Cassava has multiple uses: it is consumed in many processed forms, used in the industry and also as livestock feed [5]. Its roots are made into granular flours. Flours are of three types, yellow gari, white gari, or intermediate colour, with yellow gari considered the best product in Nigeria. Gari is a granulated product, made from the lactic acid fermentation of cassava roots, and cherished by urban consumer because of its convenience, long shelf life and its ready-to-eat form [17, 25, 6]. Unit operations involved include peeling, washing, grating, dewatering, fermentation, and roasting [29]. The resulting dry granular gari can be stored for a long period. It may be pound or ground to make fine flour. It comes in various particle size, categorized as: rough, medium, and fine.
Sweet potato (Ipomoea batatas) is a hardy and nutritious staple food crop, which is grown throughout the humid tropical and subtropical regions of the world, from sea level to 2,700m altitude [32]. It has short growing period of 90-120 days [31]. The crop requires just sufficient water and attention for their cultivation. The tuberous root features oblong/elongated shape with tapering ends and has smooth outer skin whose color ranges from red, purple, brown, and white, depending on the variety [34]. Sweet potato does not have the cyanogenic limitation associated with cassava, yet less recognised than the latter. This can be attributed to its relatively lower level of utilization. Nutritionally, sweet potato is one of very high caloric foods (provides 90 calories/100g vs. 70 calories/100g of potato), a rich source of dietary fibre, antioxidants, vitamins, and minerals. It is a good source of vitamin A [28]. However, sweet potato is yet to be recognized as a vital ingredient in food production and safety.
The use of sweet potato and cassava to produce gari has been discovered to be technically feasible [18, 24]. However, there still lies a drawback in the area of sensory properties of the obtained product. This problem can be attributed to the enzymatic browning of the polyphenolic compounds in the tubers of sweet potato. This is yet the main limitation in the acceptability of sweet potato gari by the potential consumers [24]. There have been efforts to solve this problem but with little or no success. Therefore, the aim of this work was to study the effect of different production methods on the physical, chemical and sensory properties of gari produced from cassava roots and sweet potato tubers.
Materials and methods The bitter cassava TS53201 (Manihot esculenta crantz) and yellow fleshed sweet
potato tubers roots were obtained from the Teaching and Research Farm, Faculty of Agriculture, University of Ilorin. They were processed few hours after harvesting.
Preparation of Lime-Sodium Metabisulphite Solution Fresh lime (Citrus aurantifolia) fruits were cut into halves to extract the juice. The
juice was then clarified using a sieve and 160 ml of this was made to 5 litres with water. A solution containing 35 g of sodium metabisulphite (food grade) in 5 litres was prepared. The lime and sodium metabisulphite solutions were mixed together and then further diluted with water up to 20 litres.
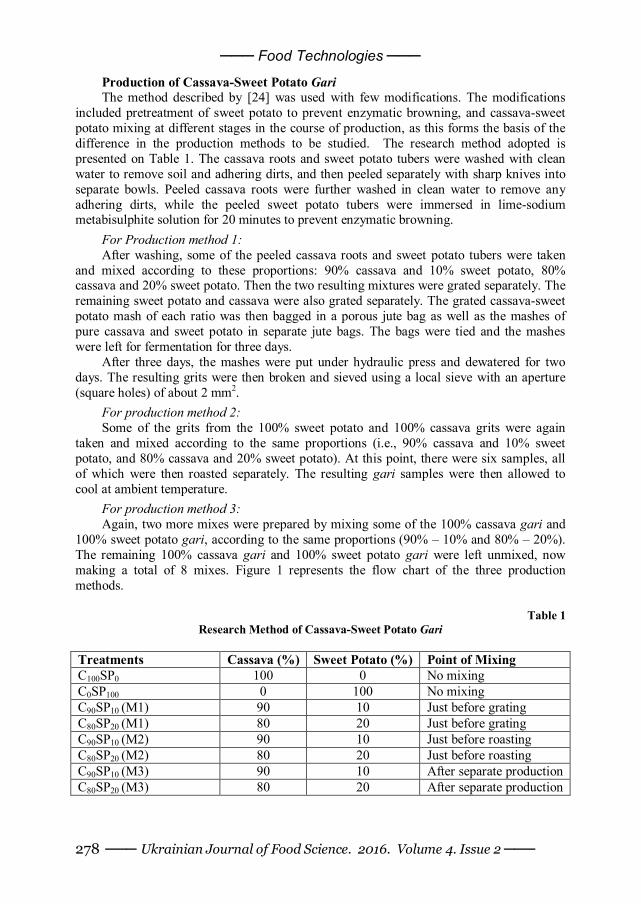
─── Food Technologies ───
─── Ukrainian Journal of Food Science. 2016. Volume 4. Issue 2 ─── 278
Production of Cassava-Sweet Potato Gari The method described by [24] was used with few modifications. The modifications
included pretreatment of sweet potato to prevent enzymatic browning, and cassava-sweet potato mixing at different stages in the course of production, as this forms the basis of the difference in the production methods to be studied. The research method adopted is presented on Table 1. The cassava roots and sweet potato tubers were washed with clean water to remove soil and adhering dirts, and then peeled separately with sharp knives into separate bowls. Peeled cassava roots were further washed in clean water to remove any adhering dirts, while the peeled sweet potato tubers were immersed in lime-sodium metabisulphite solution for 20 minutes to prevent enzymatic browning.
For Production method 1: After washing, some of the peeled cassava roots and sweet potato tubers were taken
and mixed according to these proportions: 90% cassava and 10% sweet potato, 80% cassava and 20% sweet potato. Then the two resulting mixtures were grated separately. The remaining sweet potato and cassava were also grated separately. The grated cassava-sweet potato mash of each ratio was then bagged in a porous jute bag as well as the mashes of pure cassava and sweet potato in separate jute bags. The bags were tied and the mashes were left for fermentation for three days.
After three days, the mashes were put under hydraulic press and dewatered for two days. The resulting grits were then broken and sieved using a local sieve with an aperture (square holes) of about 2 mm2.
For production method 2: Some of the grits from the 100% sweet potato and 100% cassava grits were again
taken and mixed according to the same proportions (i.e., 90% cassava and 10% sweet potato, and 80% cassava and 20% sweet potato). At this point, there were six samples, all of which were then roasted separately. The resulting gari samples were then allowed to cool at ambient temperature.
For production method 3: Again, two more mixes were prepared by mixing some of the 100% cassava gari and
100% sweet potato gari, according to the same proportions (90% – 10% and 80% – 20%). The remaining 100% cassava gari and 100% sweet potato gari were left unmixed, now making a total of 8 mixes. Figure 1 represents the flow chart of the three production methods.
Table 1 Research Method of Cassava-Sweet Potato Gari
Treatments Cassava (%) Sweet Potato (%) Point of Mixing C100SP0 100 0 No mixing C0SP100 0 100 No mixing C90SP10 (M1) 90 10 Just before grating C80SP20 (M1) 80 20 Just before grating C90SP10 (M2) 90 10 Just before roasting C80SP20 (M2) 80 20 Just before roasting C90SP10 (M3) 90 10 After separate production C80SP20 (M3) 80 20 After separate production
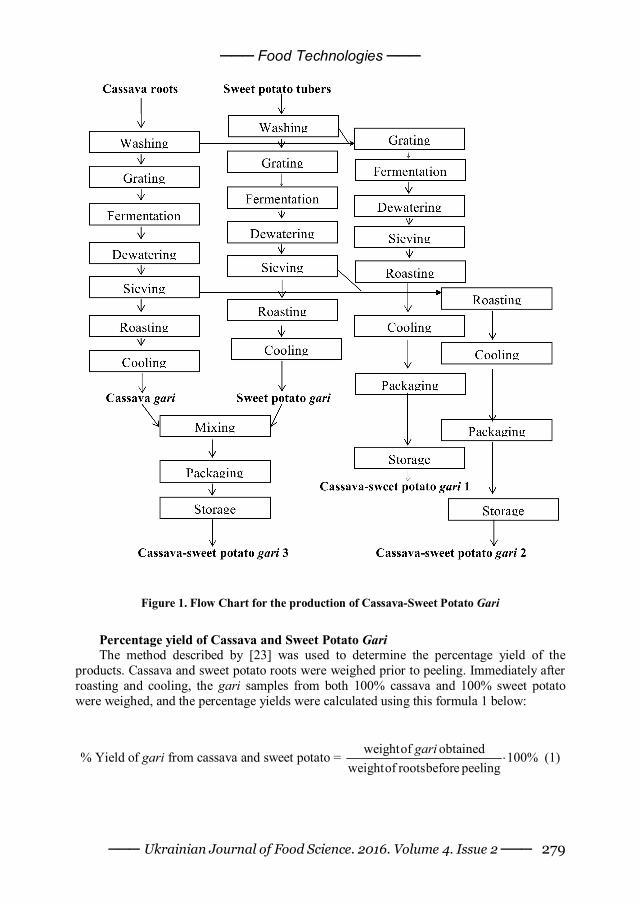
─── Food Technologies ───
─── Ukrainian Journal of Food Science. 2016. Volume 4. Issue 2 ─── 279
Figure 1. Flow Chart for the production of Cassava-Sweet Potato Gari
Percentage yield of Cassava and Sweet Potato Gari The method described by [23] was used to determine the percentage yield of the
products. Cassava and sweet potato roots were weighed prior to peeling. Immediately after roasting and cooling, the gari samples from both 100% cassava and 100% sweet potato were weighed, and the percentage yields were calculated using this formula 1 below:
% Yield of gari from cassava and sweet potato = weightof obtained 100%weightof rootsbefore peeling
gari (1)
─── Food Technologies ───
─── Ukrainian Journal of Food Science. 2016. Volume 4. Issue 2 ─── 280
Determination of chemical properties of Cassava-Sweet Potato Gari
Prosimate composition Moisture content. This was determined by drying 2 g of each of the gari samples in
an oven at 105oC for about 2 hours. The difference between the weights before and after drying was calculated as the moisture content [1].
Crude fibre content. The crude fibre content of the various gari samples was determined by defatting (with petroleum ether) and boiling (with H2SO4 and NaOH) 2 g of the gari samples followed by incineration in a murfle furnace. The incinerated sample was thereafter cooled in a desiccator [1].
Ash content. Gari sample (2 g) was incinerated in a murfle furnace to burn off all organic components present. The residue left after the ashing was the ash content [1].
Crude protein. The protein content of the gari samples was determined by digestion of 2 g of the sample followed by distillation and titration as described by [1].
Carbohydrate content. This was calculated by subtracting the sum of the percentage contents of moisture, crude fibre, ash, crude protein and crude fat from 100%.
i.e., carbohydrate content = 100% – %(moisture + crude fibre + ash + crude protein +fat) (2)
Crude fat content. This involved the extraction of 2 g of each of the gari samples in a soxhlet apparatus with a petroleum ether, after which the samples were dried in an oven and cooled in a desiccator. The weight lost during extraction was the fat content of the gari samples [1].
pH Determination. The pH of the gari sample was determined using the method of [2]. Each of the gari samples (10 g) was put into a 100 ml beaker and 100 ml of distilled water was added to it. This was allowed to stay for a few minutes after which it was filtered with a whatmann filter paper. The filtrate was then taken and tested using a standardized pH meter. Triplicate values were obtained, the mean of which was then calculated.
Determination of total titratable acidity. The percentage total titratable acidity of the gari samples was determined using the method described by [12]. Five grams of each of the samples was dissolved in a beaker and made up to 100 ml with distilled water, then allowed to stand for about 30 mins. The resulting suspension was filtered with a filter paper, and 25 ml of the filtrate was taken and titrated against 0.1 M NaOH, using phenolphthalein as indicator. The end point was obtained when the colour became pink. The mean (TTA) was then calculated from triplicate values.
TTA (%) = 0.005X x 100 = 0.01X, where X is the mean titre value. Determination of hydrogen cyanide content. The residual hydrogen cyanide (HCN)
content of gari was determined using the method of [10]. Using this metod, thirty grams (30 g) of gari was milled and homogenized with 250 ml of 0.1 M orthophosphoric acid. The homogenate was centrifuged. The supernatant was taken as the extract; 0.1 ml of the enzyme (linamarase prepared from the freshly harvested cassava roots) was added into 0.6 ml of the extract. The 3.4 ml of the acetate buffer (pH 4.5) was added and stirred to mix. After which 0.2 ml of 0.5% chloramin-T and 0.6 ml of colour reagent were added and allowed to stand for 15 min. for colour development. The absorbance value was obtained at 605 nm against a blank similarly prepared containing all reagents and 0.1 ml phosphate buffer added instead of KCN.
Calculation. The data from the standard were used to obtain a standard curve and its slope (b) by plotting absorbance values (Y-axis) against standard concentrations (X-axis).
The unknown mean absorbance (A) and the weight of the sample (w) were used to calculate the residual hydrogen cyanide, using the formula:
─── Food Technologies ───
─── Ukrainian Journal of Food Science. 2016. Volume 4. Issue 2 ─── 281
Residual cyanide = A x 250 x 0.4151 b x W and the unit in mg HCN equivalent kg-1 sample (formula 3). Where A is absorbance, b is the slope, and W is weight of sample.
Determination of Physical and Technological Properties
Swelling index. The method of [33] was used for the determination of swelling index (SI) with slight modification. Ten grams (10 g) of the garisample was transferred into a clean, dried, calibrated measuring cylinder. The gari was gently leveled by tapping the cylinder and the initial volume recorded. Fifty milliliter (50 ml) of distilled water was poured into the cylinder and allowed to stand for 4 h. The value for SI was taken as the multiples of the original volume.
Water Absorption Capacity. The method of [30] as described by [3] was followed for the determination of water absorption capacity. One gram (1 g) of gari was weighed into an already weighed clean dried centrifuge tube. Twenty milliliter (20 ml) of distilled water was poured into the centrifuge tube and stirred thoroughly; centrifuge at a speed of 3500 rpm for 45 min. The supernatant was discarded and the tube and its content reweighed. The gain in mass was taken as the water absorption capacity.
Bulk density. The method of [8] was used for bulk density (BD) determination. Ten grams (10 g) of the gari were transferred into 50 ml measuring cylinder. The cylinder was tapped repeatedly for 5 min. The BD of the gari sample was calculated as the mass of gari over the volume at the end of tapping. The mean value was recorded from triplicate determinations
Sensory evaluation
A multiple – paired comparison test as described by [14] was used. Panelists were selected from among gariconsumers. Fifteen panelists were made to assess the gari samples in the dry particulate form for taste, colour, aroma, sourness, texture, and overall acceptability. The cassava-sweet potato gari samples were made into “eba” and were assessed by twenty panelists for aroma, taste, texture, colour, mouldability, and overall acceptability. The gari samples were also assessed in soaked form for aroma, taste, texture, colour, soakability and overall acceptability. In each case, the samples were rated according to a 9-point hedonic scale of preference with ratings ranging from 1 (dislike extremely) and 9 (like extremely). The results of the evaluation were then subjected to statistical analysis.
Statistical Analysis The Statistical Package for Social Sciences (SPSS version 16.0) was used to
statistically analyze the data generated from the experiments. The data were further subjected to analysis of variance (ANOVA) to determine significant differences among the samples, and the means were separated with a Tukey test.
Results and discussion Percentage Yield of Cassava-Sweet Potato Gari Production
The percentage yields of the various cassava-sweet potato gari samples ranged from 20 to 28%, with 100% cassava gari having 20%, 100% sweet potato gari having 28% while 10% and 20% substitution level of sweet potato had 20.8% and 21.6%, respectively. [13] reported 15-20 % conversion rate for cassava gari, while [24] reported 40-42% for sweet potato gari. The difference between the 28% conversion rate obtained in this research work and the 42% reported by [24] could be attributed to the difference in the moisture contents
─── Food Technologies ───
─── Ukrainian Journal of Food Science. 2016. Volume 4. Issue 2 ─── 282
of the products which were 6.28-7.10% and 7.95-8.8% respectively. The difference could also be as a result of factors ranging from tuber varieties, time of harvesting, age of plant, to other environmental factors [13].
The proximate composition of the various cassava-sweet potato gari is presented in Table 2. The moisture contents ranged from 10.10 – 12.30%. The 100% sweet potato gari had the highest level of moisture content while the lowest was 100% cassava gari. There was a significant difference (p<0.05) among the cassava-sweet potato gari samples and an increase in the level of moisture content as the level of sweet potato incorporation increased was observed (Table 2). This variation can be attributed to the difference in the production methods. The highest moisture content recorded for 100% sweet potato gari could be attributed to the fibrous nature of sweet potato which would make moisture removal during roasting more difficult hence, longer roasting time requirement to obtain the same level of dryness. Moisture content of 10% is recommended for storage of gari by Standard Organisation of Nigeria [27].
The crude fibre contents of the cassava-sweet potato gari samples ranged from 1.93 to 1.98%. Cassava-sweet potato gari with 20% level of sweet potato of method one had the highest crude fibre content while that of method three with 10% sweet potato incorporation had the lowest value. The samples however did not differ significantly (p>0.05). Though the expected increase in the level of crude fibre contents of the cassava-sweet potato gari samples with increase in the level of sweet potato incorporation was not obtained, the values are close to those (1.24–1.64%) recorded by [18] The deviation from the expected trend might be as a result of the difference in the production method. Crude fibre through its water absorption capacity has been found to aid bowel movement and aid digestion [4] and therefore significant in diet.
The protein contents of the gari samples differed significantly (p<0.05) and ranged from 1.43 to 4.29%. Cassava-sweet potato gari of method one which had 10% sweet potato had the lowest crude protein content while that of method three with 10% sweet potato had the highest amount. It was expected that the protein content would increase invariably with increased level of sweet potato incorporation which was however not the case. This deviation could be as a result of the effects of the different production methods on the protein content of the cassava-sweet potato gari samples. However, [24] and [18] reported protein contents of 1.27–2.38% and 2.56–3.07%, respectively for gari samples in their research work. These are fairly similar to the values obtained in this study.
The fat contents of the various cassava-sweet potato gari samples ranged from 1.31 to 2.11%, and differed significantly among the samples (p<0.05). Gari from 90% cassava and 10% sweet potato and 80% cassava and 20% sweet potato from method one and three had the highest and lowest fat contents respectively. These values agree with the 1.08 – 2.11% reported by [24]. The variation in the level of fat content could be attributed to the effect of the different production methods on the cassava-sweet potato gari samples. The ash content of the cassava-sweet potato gari samples ranged from 1.13 to 1.31% and differed significantly (p<0.05). Cassava-sweet potato gari with 20% sweet potato incorporation of method one had the highest level of ash content while 100% cassava gari had the lowest. These values fall within the range of values (0.12-0.48%) and (1.40–1.82%) reported by [24] and [18] respectively. The cassava-sweet potato gari of method one with 80% cassava and 20% sweet potato recorded the highest value probably due to the level of sweet potato in it. Ash content is a representation of mineral content in food.Therefore the cassava-sweet potato gari will be a good source of minerals which are essential in many biochemical reactions of the body.
─── Food Technologies ───
─── Ukrainian Journal of Food Science. 2016. Volume 4. Issue 2 ─── 283
There was a significant difference (p<0.05) in the carbohydrate contents of the cassava-sweet potato gari samples. Gari from 10% sweet potato of method one (mixing just before grating) had the highest carbohydrate content while 10% sweet potato gari of method three (mixing just before roasting after grating) had the lowest. The carbohydrate content of the cassava-sweet potato gari (78.11 – 83.59%) are close to the 82.53 – 87.10% reported by [24]. Except for method 3, there was a decrease in the carbohydrate content of the cassava-sweet potato gari with increased level of sweet potato incorporation which suggests that the cassava roots used had more carbohydrate content than the sweet potato used, or sweet potato incorporation increased level of fermentation which consequently resulted to higher level of carbohydrate break down. This might be as a result of higher sugar content in sweet potato which is the main substrate for fermentation. Sweet potatoes contain simple sugars such as glucose, fructose, sucrose and maltose which make up about 32% of its carbohydrate content [20]
The values obtained for the total titratible acidity (TTA) and pH are shown in Table 3. There was a significant (p<0.05) difference among the samples in terms of TTA. The values ranged from 1.36 to 1.70%. Sweet potato gari (100%) had the highest TTA while 10% sweet potato gari of method 3 had the lowest. This could be attributed to the high level of free sugar in sweet potato which increased its tendency to readily undergo lactic acid fermentation. There was a significant (p<0.05) difference in the pH values obtained for the cassava-sweet potato gari samples (Table 3). The values ranged from 4.65 to 4.90. These were within the range of values (4.42–5.98) reported by [27] for gari samples. The pH of gari is also a function of the extent of fermentation. The lower the pH, the better will be the keeping quality of gari.
There was a significant (p<0.05) difference among the cassava-sweet potato gari samples in terms of hydrogen cyanide (HCN) content (Table 3). Cassava gari (100%) had the highest HCN content while that of 100% sweet potato had the lowest. Table 5 shows the HCN contents of the various cassava-sweet potato gari samples. The highest level of HCN obtained for 100% cassava gari could be attributed to the high content in the raw cassava root. Sweet cultivars of cassava can produce as little as 20 mg of HCN per kg of fresh roots, while bitter ones may produce more than 50 times as much [14] The value obtained would be far less than what was in the raw cassava root as a result of the detoxification brought about by fermentation [22] tissue disintegration (Hahn et al., 1987), dewatering, roasting, etc., in the course of production.
The physical and technological properties of cassava-sweet potato gari samples are shown in Table 4. The swelling index of the samples ranged from 330 to 450%, with 20% cassava-sweet potato gari of method 2 having the highest value and that of 100% sweet potato had the least. These values agreed with those (301–430%) reported by [24] The high values can be attributed to the dryness of the gari samples as indicated by the low moisture content (6.28–7.01%). Swelling index indicates the ability of the gari to swell and this is influenced by the quantity and starch components (amylose and amylopectin) present in the gari. Swelling index has been shown to give a greater volume and more feeling of satiety per unit weight of gari to a consumer and a swelling index of at least 3.0 (300%) was recommended to be preferred by consumers [9, 7).
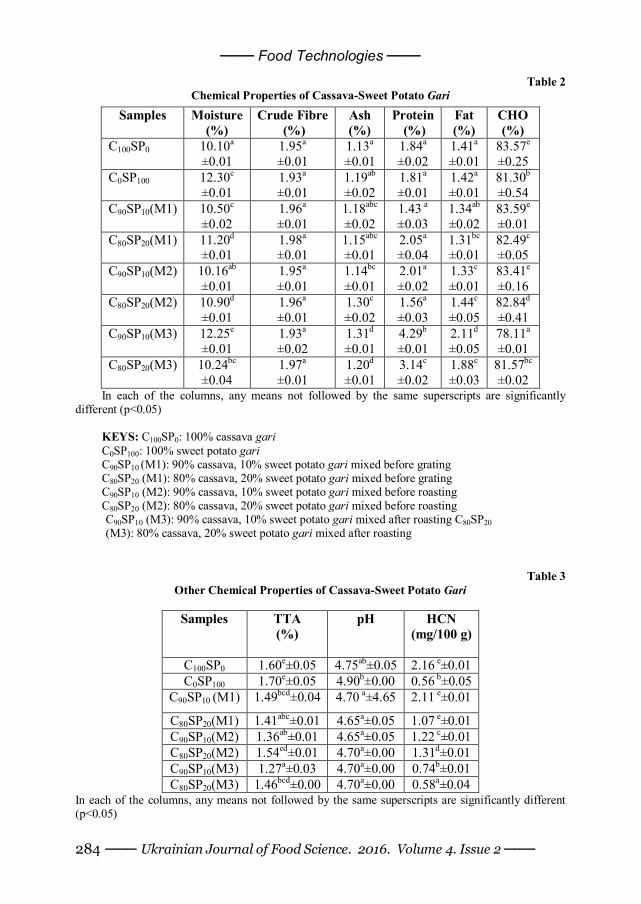
─── Food Technologies ───
─── Ukrainian Journal of Food Science. 2016. Volume 4. Issue 2 ─── 284
Table 2 Chemical Properties of Cassava-Sweet Potato Gari
Samples
Moisture (%)
Crude Fibre (%)
Ash (%)
Protein (%)
Fat (%)
CHO (%)
C100SP0
10.10a
±0.01 1.95a
±0.01 1.13a
±0.01 1.84a
±0.02 1.41a
±0.01 83.57e
±0.25 C0SP100 12.30e
±0.01 1.93a
±0.01 1.19ab
±0.02 1.81a
±0.01 1.42a
±0.01 81.30b
±0.54 C90SP10(M1) 10.50c
±0.02 1.96a ±0.01
1.18abc
±0.02 1.43 a
±0.03 1.34ab
±0.02 83.59e
±0.01 C80SP20(M1)
11.20d
±0.01 1.98a
±0.01 1.15abc
±0.01 2.05a
±0.04 1.31bc
±0.01 82.49c
±0.05 C90SP10(M2) 10.16ab
±0.01 1.95a
±0.01 1.14bc
±0.01 2.01a
±0.02 1.33c
±0.01 83.41e
±0.16 C80SP20(M2) 10.90d
±0.01 1.96a
±0.01 1.30c
±0.02 1.56a
±0.03 1.44c
±0.05 82.84d
±0.41 C90SP10(M3) 12.25e
±0.01 1.93a
±0.02 1.31d
±0.01 4.29b
±0.01 2.11d
±0.05 78.11a
±0.01 C80SP20(M3) 10.24bc
±0.04 1.97a
±0.01 1.20d
±0.01 3.14c
±0.02 1.88c
±0.03 81.57bc
±0.02 In each of the columns, any means not followed by the same superscripts are significantly
different (p<0.05) KEYS: C100SP0: 100% cassava gari C0SP100: 100% sweet potato gari C90SP10 (M1): 90% cassava, 10% sweet potato gari mixed before grating C80SP20 (M1): 80% cassava, 20% sweet potato gari mixed before grating C90SP10 (M2): 90% cassava, 10% sweet potato gari mixed before roasting C80SP20 (M2): 80% cassava, 20% sweet potato gari mixed before roasting C90SP10 (M3): 90% cassava, 10% sweet potato gari mixed after roasting C80SP20 (M3): 80% cassava, 20% sweet potato gari mixed after roasting
Table 3 Other Chemical Properties of Cassava-Sweet Potato Gari
Samples
TTA (%)
pH
HCN (mg/100 g)
C100SP0 1.60e±0.05 4.75ab±0.05 2.16 e±0.01 C0SP100 1.70e±0.05 4.90b±0.00 0.56 b±0.05
C90SP10 (M1) 1.49bcd±0.04 4.70 a±4.65 2.11 e±0.01
C80SP20(M1) 1.41abc±0.01 4.65a±0.05 1.07 e±0.01 C90SP10(M2) 1.36ab±0.01 4.65a±0.05 1.22 c±0.01 C80SP20(M2) 1.54cd±0.01 4.70a±0.00 1.31d±0.01 C90SP10(M3) 1.27a±0.03 4.70a±0.00 0.74b±0.01 C80SP20(M3) 1.46bcd±0.00 4.70a±0.00 0.58a±0.04
In each of the columns, any means not followed by the same superscripts are significantly different (p<0.05)
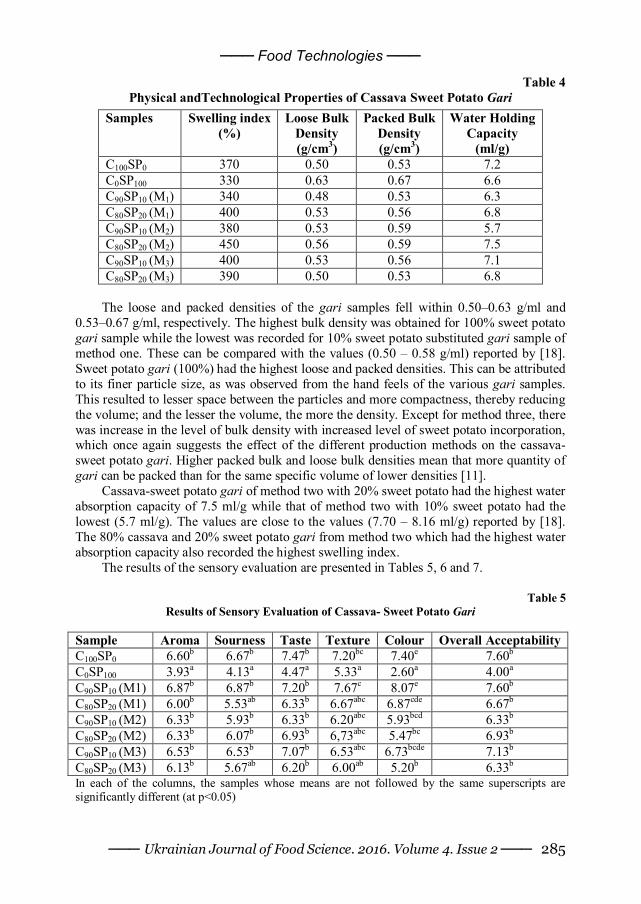
─── Food Technologies ───
─── Ukrainian Journal of Food Science. 2016. Volume 4. Issue 2 ─── 285
Table 4 Physical andTechnological Properties of Cassava Sweet Potato Gari
Samples Swelling index (%)
Loose Bulk Density (g/cm3)
Packed Bulk Density (g/cm3)
Water Holding Capacity
(ml/g) C100SP0 370 0.50 0.53 7.2 C0SP100 330 0.63 0.67 6.6 C90SP10 (M1) 340 0.48 0.53 6.3 C80SP20 (M1) 400 0.53 0.56 6.8 C90SP10 (M2) 380 0.53 0.59 5.7 C80SP20 (M2) 450 0.56 0.59 7.5 C90SP10 (M3) 400 0.53 0.56 7.1 C80SP20 (M3) 390 0.50 0.53 6.8
The loose and packed densities of the gari samples fell within 0.50–0.63 g/ml and
0.53–0.67 g/ml, respectively. The highest bulk density was obtained for 100% sweet potato gari sample while the lowest was recorded for 10% sweet potato substituted gari sample of method one. These can be compared with the values (0.50 – 0.58 g/ml) reported by [18]. Sweet potato gari (100%) had the highest loose and packed densities. This can be attributed to its finer particle size, as was observed from the hand feels of the various gari samples. This resulted to lesser space between the particles and more compactness, thereby reducing the volume; and the lesser the volume, the more the density. Except for method three, there was increase in the level of bulk density with increased level of sweet potato incorporation, which once again suggests the effect of the different production methods on the cassava-sweet potato gari. Higher packed bulk and loose bulk densities mean that more quantity of gari can be packed than for the same specific volume of lower densities [11].
Cassava-sweet potato gari of method two with 20% sweet potato had the highest water absorption capacity of 7.5 ml/g while that of method two with 10% sweet potato had the lowest (5.7 ml/g). The values are close to the values (7.70 – 8.16 ml/g) reported by [18]. The 80% cassava and 20% sweet potato gari from method two which had the highest water absorption capacity also recorded the highest swelling index.
The results of the sensory evaluation are presented in Tables 5, 6 and 7.
Table 5 Results of Sensory Evaluation of Cassava- Sweet Potato Gari
Sample Aroma Sourness Taste Texture Colour Overall Acceptability C100SP0 6.60b 6.67b 7.47b 7.20bc 7.40e 7.60b C0SP100 3.93a 4.13a 4.47a 5.33a 2.60a 4.00a C90SP10 (M1) 6.87b 6.87b 7.20b 7.67c 8.07e 7.60b C80SP20 (M1) 6.00b 5.53ab 6.33b 6.67abc 6.87cde 6.67b C90SP10 (M2) 6.33b 5.93b 6.33b 6.20abc 5.93bcd 6.33b C80SP20 (M2) 6.33b 6.07b 6.93b 6,73abc 5.47bc 6.93b C90SP10 (M3) 6.53b 6.53b 7.07b 6.53abc 6.73bcde 7.13b C80SP20 (M3) 6.13b 5.67ab 6.20b 6.00ab 5.20b 6.33b In each of the columns, the samples whose means are not followed by the same superscripts are significantly different (at p<0.05)
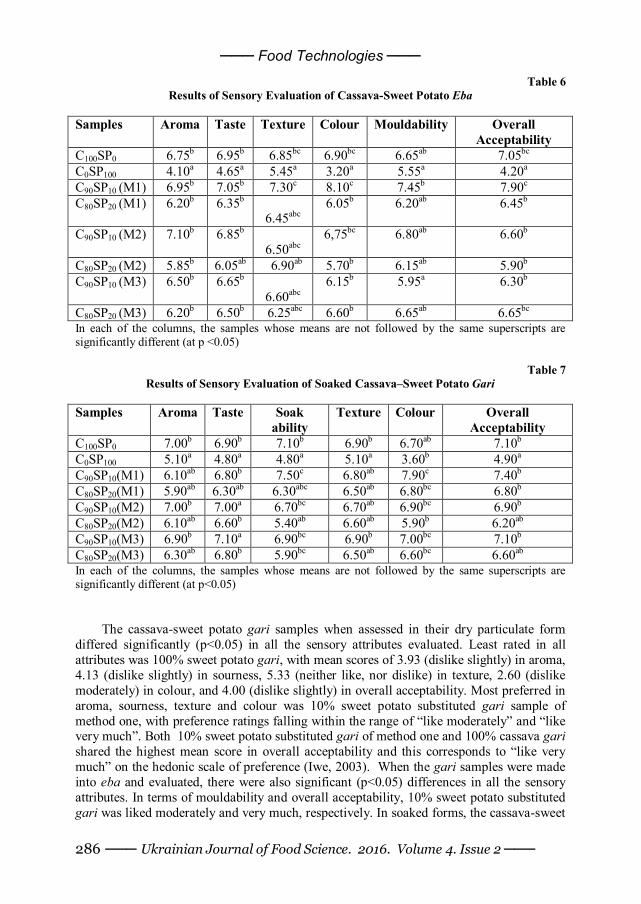
─── Food Technologies ───
─── Ukrainian Journal of Food Science. 2016. Volume 4. Issue 2 ─── 286
Table 6 Results of Sensory Evaluation of Cassava-Sweet Potato Eba
Samples Aroma Taste Texture Colour Mouldability Overall
Acceptability C100SP0 6.75b 6.95b 6.85bc 6.90bc 6.65ab 7.05bc C0SP100 4.10a 4.65a 5.45a 3.20a 5.55a 4.20a C90SP10 (M1) 6.95b 7.05b 7.30c 8.10c 7.45b 7.90c C80SP20 (M1) 6.20b 6.35b
6.45abc 6.05b 6.20ab 6.45b
C90SP10 (M2) 7.10b 6.85b 6.50abc
6,75bc 6.80ab 6.60b
C80SP20 (M2) 5.85b 6.05ab 6.90ab 5.70b 6.15ab 5.90b C90SP10 (M3) 6.50b 6.65b
6.60abc 6.15b 5.95a 6.30b
C80SP20 (M3) 6.20b 6.50b 6.25abc 6.60b 6.65ab 6.65bc In each of the columns, the samples whose means are not followed by the same superscripts are significantly different (at p <0.05)
Table 7
Results of Sensory Evaluation of Soaked Cassava–Sweet Potato Gari
Samples Aroma Taste Soak ability
Texture Colour Overall Acceptability
C100SP0 7.00b 6.90b 7.10b 6.90b 6.70ab 7.10b C0SP100 5.10a 4.80a 4.80a 5.10a 3.60b 4.90a
C90SP10(M1) 6.10ab 6.80b 7.50c 6.80ab 7.90c 7.40b C80SP20(M1) 5.90ab 6.30ab 6.30abc 6.50ab 6.80bc 6.80b C90SP10(M2) 7.00b 7.00a 6.70bc 6.70ab 6.90bc 6.90b
C80SP20(M2) 6.10ab 6.60b 5.40ab 6.60ab 5.90b 6.20ab C90SP10(M3) 6.90b 7.10a 6.90bc 6.90b 7.00bc 7.10b C80SP20(M3) 6.30ab 6.80b 5.90bc 6.50ab 6.60bc 6.60ab In each of the columns, the samples whose means are not followed by the same superscripts are significantly different (at p<0.05)
The cassava-sweet potato gari samples when assessed in their dry particulate form differed significantly (p<0.05) in all the sensory attributes evaluated. Least rated in all attributes was 100% sweet potato gari, with mean scores of 3.93 (dislike slightly) in aroma, 4.13 (dislike slightly) in sourness, 5.33 (neither like, nor dislike) in texture, 2.60 (dislike moderately) in colour, and 4.00 (dislike slightly) in overall acceptability. Most preferred in aroma, sourness, texture and colour was 10% sweet potato substituted gari sample of method one, with preference ratings falling within the range of “like moderately” and “like very much”. Both 10% sweet potato substituted gari of method one and 100% cassava gari shared the highest mean score in overall acceptability and this corresponds to “like very much” on the hedonic scale of preference (Iwe, 2003). When the gari samples were made into eba and evaluated, there were also significant (p<0.05) differences in all the sensory attributes. In terms of mouldability and overall acceptability, 10% sweet potato substituted gari was liked moderately and very much, respectively. In soaked forms, the cassava-sweet
─── Food Technologies ───
─── Ukrainian Journal of Food Science. 2016. Volume 4. Issue 2 ─── 287
potato gari samples differed (p<0.05) significantly in all the sensory attributes, with 10% sweet potato substituted gari sample of method 1 having the highest rating (corresponding to “like very much”) in soakability.
The difference in level of preference can be attributed to the effect of the different production methods as well as the different levels of sweet potato incorporation. Gari from 90% cassava and 10% sweet potato from method one was most preferred due to the presence of sweet potato in moderate level in the product.
Conclusions The study revealed that the different methods of cassava-sweet potato gari production
have significant effects on the physical, chemical and sensory qualities of cassava-sweet potato gari.
It can be concluded that the inclusion of sweet potato in the production of gari by 10% is acceptable as attested to by the responses of the panelists selected for the sensory evaluation of the products.
The method involving mixing of 90% cassava and 10% sweet potato just before grating gave a gari product of the highest overall acceptability.
Gari produced from the three methods had good proximate coompositions; the various cassava-sweet potato gari products had protein, fat, carbohydrate and ash contents that compared favourably well with those of 100% cassava gari.
The study has also shown that through modifications of traditional method, the physical and technological properties of gari, such as swelling index, bulk density and water absorbtion capacity, could be well improved.
References
1. A.O.A.C (2000), Official Methods of Analysis, 17th Edition, Association of Official
Analytical Chemists, Washington D.C. 2. A.O.A.C (1990), Official Methods of Analysis, 15th Edition. Association of Official
Analytical Chemists, Washington D.C. 3. Abbey B.W., Ibeh G.O. (1988), Functional properties of raw and heat processed
cowpea (Vigna unguiculata, Walp) flour, Journal of Food Science, 53, pp. 1775–1777. 4. Abu J.O., Badifu G.T.O., Akpapunam M.A. (2006), Effect of Crude palm oil inclusion
on some physicochemical properties of gari – a fermented cassava Food product.Nigerian, Food Journal, 24(1), pp. 73–75.
5. Adeniji A.A., Adeniyi B.O., Akoroda M.O., Balogun A., Ega L.A., Ugwu A.A. (2005), "Cassava Development in Nigeria", Department of Agriculture Federal Ministry of Agricultureand Natural Resources Nigeria, FAO Africa`s Best Kept Secret, Michigan State University Press, USA, pp. 7–206.
6. Ajala A.S., Adejuyitan J.A., Babarinde G.O., Adeola F.D. (2008), “Some physicochemical properties of gari obtained from some cottage/household processing locations in Ogbomosho, Southwest, Nigeria”, Proceeding 32ndAnnual Conference/General Meeting of Nigerian Institute of Food Science and Technology, pp. 272-273.
─── Food Technologies ───
─── Ukrainian Journal of Food Science. 2016. Volume 4. Issue 2 ─── 288
7. Akingbala O.J., Oyewole B.O., Uzo-Peters I.P., Karim O.R., Baccus-Taylor H.G.S. (2005), Evaluating stored cassava quality in gari production, Journal of Food, Agriculture and Environment, 3 (1), pp. 75–80.
8. Akpapunam M.A., Markakis P. (1981), “Physicochemical and nutritional aspects of cowpea flour”, Journal of Food Science, 46, pp. 972–973.
9. Almazan (1992), Influence of cassava variety and storage on gari quality. Tropical. Agriculture.(Trinidad), 69 (4), pp. 386–390.
10. Essier A.J.A., Bosveld A.G.J., Vander C. (1993), Studies on the Quantification of Specific Cyanogens in Cassava Products and Introduction of New Chromogen, Journal of Science of Food and Agric., 63, pp. 288–290.
11. Fagbemi, T. N. (1999), Effect of blanching and ripening on functional properties of Plantain (Musa aab) Flour. Plant Food for Human Nutrition, 54 (2), pp. 261–269.
12. FAO (1970), Food and Agricultural and Organization Year Book FAO, Rome 13. Hahn N.D., Ekpere J.A., Ezumah H., Gebremeskel T., Ikpi, A.E. (1986), Cassava, a
crop for household food security, A 1986 situation analysis from Oyo Local Government Area.
14. Ihekoronye A. I., Ngoddy P.O. (1985), Integrated Food Science and Technology for the Tropics. Macmillan Publisher, London.
15. IITA (2003), Assessment of Nigeria’s Agricultural Policy, USAID – Nigeria 16. Iwe M. O., Onadipe O.O. (2001), Effect of addition of extruded full fat soy flour into
sweet potato flour on functional properties of the mixture, Journal of Sustainable Agriculture and Environment, 3(1), pp. 109–117.
17. Karim O.R., Oluwole O.B, Olatunji O.A., Odunfa S.A. (2004), Production and Quality Attributes of Gari from Dried cassava chips. Journal of Sustainable Tropical Agricultural Research, 10, pp. 71–75.
18. Kure O.A, Nwankwo L., Nyasu G. (2012), Production and quality evaluation of gari-like products from sweet potato, Scholars Research Library.
19. Nozipho M. M., Albert T. M. (2015), Sweet Potato (Ipomoea batatas L.) as a Draught Tolerant and Food Security Crop. S Afr J Sci.,111 (11/12), p. 8
20. Remya M., Subha, S. (2014), Sweet Potato – A Valuable Medicinal Food: A Review Journal of Medicinal Food 17 (7), pp. 733–741.
21. O’Hair, Stephen K. (1993), Cassava Research and Education Centre, University Florida
22. Odunfa S.A. (1985), African fermented foods, In: Microbiology of fermented foods, 2, Elsevier, pp. 155–191,
23. Oduro I., Ellis W.O., Dziedzoave N.T. (2000), Quality of Gari from selected processing zones in Ghana, Food Contro, 2, pp. 297–303
24. Ojo A., Akande E.A. (2013), Quality evaluation of gari produced from cassava and sweet potato tuber mixes, African Journal of Biotechnology, 12(31), pp. 4920–4924.
25. Onabolu A., (2001), Cassava Processing, Consumption and Dietary Cyanide Exposure, IHCAR Karohnska Institute, Sweden, pp. 6–7.
26. Sanni L. O., Babajide J. M., Ojerinde M. W. (2007), Effect of Chemical Pretreatments on the Physico-Chemical and Sensory Attributes of Sweet Potato-Gari, International Journal of Agricultural Sciences, Sciences, Environment and Technology. 6(1), pp. 41–49
27. Sanni L.O., Maziya-Dixon B., Akanya J., Okoro C.I., Alaya Y., Egwuonwu, C.V., Okechukwu R., Ezedinma C., Akoroda M., Lemchi J., Okoro E., Dixon A. (2005), Standards for Cassava Products and Guidelines for Export, IITA, Ibadan, Nigeria.
─── Food Technologies ───
─── Ukrainian Journal of Food Science. 2016. Volume 4. Issue 2 ─── 289
28. Sobukola O.P., Akinpelu O.O., Awonorin S.O. (2010), Functional and sensory properties of a sweet potato based extruded snack. 34th Annual conference General meeting Nigerian Institute of Food Science and Technology, pp. 132–133.
29. Sokari T.G., Karibo P.S. (1992), Changes in cassava toxicity during processing into gari and ijapu two fermented food products, Food Additive Contaminants, 9, pp. 379–384.
30. Sosulski F.W. (1962), The centrifuge methods for determining flour absorption in hard red spring wheat, Cereal Chemistry 39, pp. 344–350.
31. Southern Exposure Seed Exchange (2016), Sweet Potato Growing Guide. 32. Sullivan J.N., Asher C.J., Blamey F.P.C. (1997), Nutrient disorders of sweet potato,
Austriallian Centre for International Agricultural Research, Canberra, pp. 9–14. 33. Ukpabi U.J., Ndimele C. (1990), Evaluation of gari production in Imo State Nigeria,
Nigeria Food Journal, 8, pp. 105–110. 34. Umesh R. (2009), Sweet potato nutrition facts, Your guide to healthier nutrition,
available at: www.nutrition-and-you.com.
─── Food Technologies ───
─── Ukrainian Journal of Food Science. 2016. Volume 4. Issue 2 ─── 290
Observations and results of pathogenic bacteria from untreated freshwater sources
Iuliana Beleuzu Boda, Marius Cristian Boda University of Agronomic Sciences and Veterinary Medicine of Bucharest, Biotechnology Faculty, Romania
Abstract
Keywords: Water Microbiology Drinking Microorganisms Escherichia coli Pseudomonas aeruginosa
Article history: Received 01.10.2016 Received in revised form 07.12.2016 Accepted 30.12.2016
Corresponding author: Marius Cristian Boda E-mail: [email protected]
DOI: 10.24263/2310-1008-2016-4-2-10
Introduction. Insufficient drinking water sources, quality
and in some cases reduced cleanness are between the humanity key reasons of inevitable illness and mortality causing between two million to four million deceases per year.
Materials and methods. The investigation results were obtained using membrane filtration method running water samples across two counties in UK last year. The rest of the sources provided are from lakes, reservoirs and rivers. The culture media plates were prepared in house or bought ready to be used for Pseudomonas aeruginosa, Escherichia Coli and Coliform Sp.
Results and discussion. Findings of microorganisms in the freshwater sources were not surprising as almost all the sources can be contaminated through natural processes, although positive results for pathogen organisms were found on the locations where the contamination was more like to happen, like busy River canals or near animals grazing areas.
The study results establish Pseudomonas and other microorganisms’ contamination, through the membrane filtration method, in several samples taken from freshwater sources. In addition, in depth study made for the laboratory examination of some microorganisms, such Coliform sp., Escherichia Coli or Pseudomonas Aeruginosa, exactly for the premises where animals or industry are developing their activity.
Between 2 to 10 colonies/100ml Escherichia Coli presence found in Wiltshire pond and Avon Canal of these samples. Most of these water sources are considered freshwater even if large activity going on by or on their location, so the outcomes of the study are revealing potential risks and what kind of future steps can be taken to improve the quality of the water.
The contamination is spontaneously through the activity around the location, and cannot be considered as a continuous process, as the results of previous and further investigation found none or similar, but less colonies per sample.
Conclusions. The outcomes of this study were obtained through the Pseudomonas and pathogens presence into local pond and Avon Canal.
─── Food Technologies ───
─── Ukrainian Journal of Food Science. 2016. Volume 4. Issue 2 ─── 291
Introduction The research is based on taking raw water samples from different sources like lakes,
ponds, rivers and tests them for microbiological key indicators like Coliforms sp., Escherichia coli and Pseudomonas aeruginosa. Local authorities are required to monitor Regulation 10 (Monitoring and risk assessment for water Conductivity, Enterococci, Escherichia coli, Turbidity etc.) supplies at least every five years, and more frequently if indicated by the risk assessment, the microbiological parameters.
The samples had to be collected multiple times from the same source as the examination of any single water sample is conclusive only at the time at when the sample is picked. Adequate outcomes from single test do not validate a supposition that the water is safe to be used for long period of time.
Contamination is frequently alternating and cannot be revealed by the analysis of a single sample. Drinking water must be safe for consumption and this is demarcated in law by specific principles for an extensive variety of constituents, microbiology and properties of water in the guidelines [26].
The standards are established to be shielding of public health and the significance of warranting that water quality is adequate to public consumption [6].
There is moral settlement between global scientific specialists, who define the health founded principles for drinking water, and the confirmation is acknowledged by the World Health Organization in the Guidelines for Drinking Water Quality. Other standards and specifications set in the EU by Drinking Water Directive and apply in all the member states of the European Union [23].
These are national standards and specifications in the regulations which apply only in the UK. In the UK all drinking water, whether from public supplies or other sources, has to meet standards laid down in the EU Drinking Water Directive (98/83/EC) [3].
The Drinking Water Inspectorate (DWI) was formed in 1990 to provide independent reassurance that public water supplies in England and Wales are safe and drinking water quality is acceptable to consumers. In the last years other UK regulation were realized to define better the internal laws regarding water for public consumption. In order to do that the laboratory assessments and procedures of testing water samples were carefully created and adjusted with law requirements [9]. Our research was conducted according within DWI regulations and testing methods.
Materials and methods We used incubators and water bath capable of sustaining a temperature to within of
35 °C ± 2; and 37 °C and to within ± 0.25 °C of 44 and 44.5 °C. The temperature setting it is determined by the bacteria and the media of development. Other machinery: membrane filtration apparatus with vacuum electrically activated pump and the suction flask. Membrane filters were used with 0.45 μm porosity and of diameter fitting for absorbent pads.
In this research we collected sample within Lower Bristol Avon, Avoncliff weir (west of Bradford- on-Avon), Avonmouth Dock pier area, the Kennet and Avon Canal, Cotswolds, Frome River, Tellisford Gauging Station, North West Wiltshire ponds. Previously testing the samples were collected 500/1000 ml water into sterile water bottles.
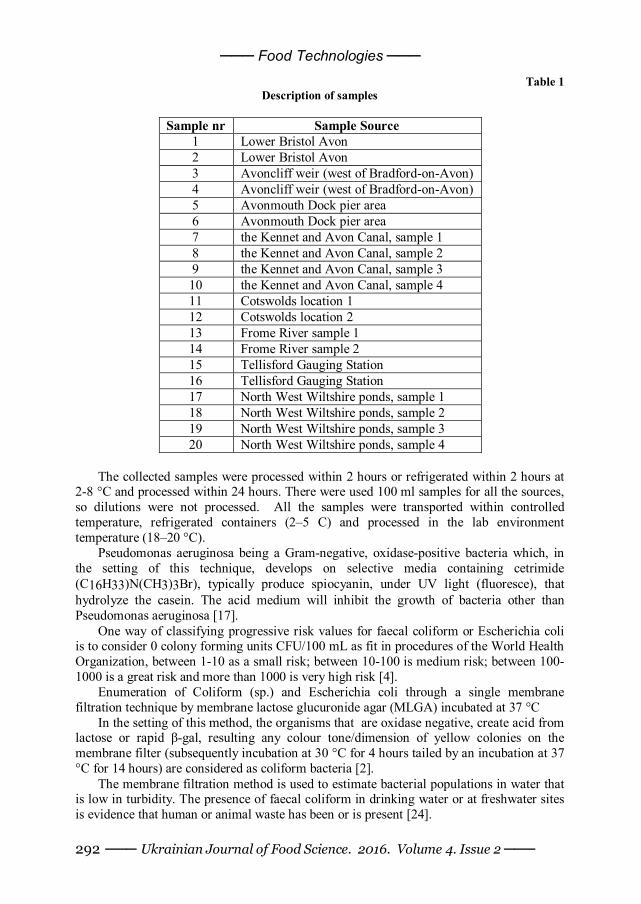
─── Food Technologies ───
─── Ukrainian Journal of Food Science. 2016. Volume 4. Issue 2 ─── 292
Table 1 Description of samples
Sample nr Sample Source
1 Lower Bristol Avon 2 Lower Bristol Avon 3 Avoncliff weir (west of Bradford-on-Avon) 4 Avoncliff weir (west of Bradford-on-Avon) 5 Avonmouth Dock pier area 6 Avonmouth Dock pier area 7 the Kennet and Avon Canal, sample 1 8 the Kennet and Avon Canal, sample 2 9 the Kennet and Avon Canal, sample 3 10 the Kennet and Avon Canal, sample 4 11 Cotswolds location 1 12 Cotswolds location 2 13 Frome River sample 1 14 Frome River sample 2 15 Tellisford Gauging Station 16 Tellisford Gauging Station 17 North West Wiltshire ponds, sample 1 18 North West Wiltshire ponds, sample 2 19 North West Wiltshire ponds, sample 3 20 North West Wiltshire ponds, sample 4
The collected samples were processed within 2 hours or refrigerated within 2 hours at
2-8 °C and processed within 24 hours. There were used 100 ml samples for all the sources, so dilutions were not processed. All the samples were transported within controlled temperature, refrigerated containers (2–5 C) and processed in the lab environment temperature (18–20 °C).
Pseudomonas aeruginosa being a Gram-negative, oxidase-positive bacteria which, in the setting of this technique, develops on selective media containing cetrimide (C16H33)N(CH3)3Br), typically produce spiocyanin, under UV light (fluoresce), that hydrolyze the casein. The acid medium will inhibit the growth of bacteria other than Pseudomonas aeruginosa [17].
One way of classifying progressive risk values for faecal coliform or Escherichia coli is to consider 0 colony forming units CFU/100 mL as fit in procedures of the World Health Organization, between 1-10 as a small risk; between 10-100 is medium risk; between 100-1000 is a great risk and more than 1000 is very high risk [4].
Enumeration of Coliform (sp.) and Escherichia coli through a single membrane filtration technique by membrane lactose glucuronide agar (MLGA) incubated at 37 °C
In the setting of this method, the organisms that are oxidase negative, create acid from lactose or rapid β-gal, resulting any colour tone/dimension of yellow colonies on the membrane filter (subsequently incubation at 30 °C for 4 hours tailed by an incubation at 37 °C for 14 hours) are considered as coliform bacteria [2].
The membrane filtration method is used to estimate bacterial populations in water that is low in turbidity. The presence of faecal coliform in drinking water or at freshwater sites is evidence that human or animal waste has been or is present [24].
─── Food Technologies ───
─── Ukrainian Journal of Food Science. 2016. Volume 4. Issue 2 ─── 293
This may be cause for concern because many diseases can be spread through faecal transmission. Also, coliform are principle indicators of water quality, pollution and effectiveness of the treatment processes. Procedure:
1. Measure 50ml of water into a filtration funnel. 2. Observe as a vacuum pulls the sample through a membrane filter. 3. Use tweezers to remove filter and place filter in a Petri dish containing media broth
Predominantly, suitable membrane filtration device and incubators and a number of utensils that will include:
Sterile sample bottles are used with proper volume, made from glass. Machinery used are: incubators capable of retaining temperatures of 30.0 ± 2.0 °C,
37.0 ± 2.0°C and 44.0 ± 0.5 °C; cycling incubators, fitted with timers, capable of achieving these temperatures.
Filtration device, disposable sterile filter funnels or filters funnels that can be sterilized and vacuum pump. Sterile gridded membrane filters were used, white, cellulose-created with 0.45 μm pore size.
The volumes and dilutions of samples were chosen so that the counting of colonies on the MLGA membrane to be the best possible.
The time between the end of the filtration and the incubation phase was no longer than 2 hours, but preferably less than that.
The Petri dishes were overturned and positioned in the cycle incubator at 30 °C for 4.00 ± 0.25 hours and second stage at 37 °C for a minimum of 14 hours. Tracking of the right temperature are made through the computer software linked directly to the incubators. After incubation period ended we observed the MLGA membrane filters under additional light source, using magnifying lens.
All yellow colonies were presumptive non- Escherichia coli, Coliform sp. bacteria and green colonies are Escherichia coli [22].
The total joined count of yellow and green colonies (and blue colonies are present) were regarded as the number of presumptive coliform bacteria. It was essential to note where pink colonies were existent in numbers that could affect the evolution of coliforms bacteria [7].
Expression of results. Counts for presumptive and confirmed Coliform sp. bacteria and Escherichia coli are expressed in colony forming unit per volume of sample. For drinking water the volume is typically 100 ml. Isolation and enumeration of Pseudomonas aeruginosa by membrane filtrationThe membrane filtration method was used to estimate Pseudomonas populations in water samples of this study.
Pseudomonas aeruginosa is environmental bacteria commonly found in soil and on plants. The organisms are capable to propagate in waters having decreased level of nutrients and should be absent in all drinking waters.
Pseudomonas aeruginosa are malleable pathogens, mainly in humans who have low level immune system. Important Figure s growing in untreated waters, swimming/spa pool water may, after soaking, yield ear infections or the follicular dermatitis. This microorganism importance as it is resistant to antibiotics [11].
We did the assessment of the incubated membrane filter after 24 hours and again after 48 hours for colonies of Pseudomonas aeruginosa demonstrating piocyanin production (green coloration).
The number of colonies at 24 hours may need to be noted as growth between 24 and 48 hours may be such that colonial growth results in the merging of colonies and the number of colonies at 48 hours may be less than the number of colonies at 24 hours. Colonies color may also be blue green, greenish brown/brown [23].
─── Food Technologies ───
─── Ukrainian Journal of Food Science. 2016. Volume 4. Issue 2 ─── 294
Also we examined the filter membrane below the UV lamp and add up all fluorescent colonies. These colonies, could be or not be pigmented, should also be measured as presumptive Pseudomonas aeruginosa.
Pseudomonas Agar Base is intended when the addition of the appropriate supplement (the medium becomes selective for Pseudomonas aeruginosa or Pseudomonas spp. generally.
The base medium is a modification in which magnesium chloride and potassium sulphate are present to increase pigment production.
Pseudomonas CN Supplement is recommended for the selective isolation of Pseudomonas aeruginosa (Incubated at 35°C±2). This media provided better recovery of Pseudomonas aeruginosa with boosted pigment development although intensely destroying Klebsiella, Proteus, Providencia spp., these being the upsetting contaminants of regular Pseudomonas C-N Selective Agar.
Colonial Appearance Growing on CN or CFC medium is usually restricted to Pseudomonas sp. but other
microorganism of the family Enterobacteriaceae could be present. The incidence of bluish green or brown coloration or fluorescence can be considered as
reasonable evidence of Pseudomonas spp., but confirmation tests must be carried out to confirm the identity of the organism.
Expression of results Counts for presumptive and confirmed Coliform sp. bacteria and Escherichia coli are
expressed in colony forming unit per volume of sample. For drinking water the volume is typically 100 ml.
The results were reported of Psudomonas aeruginosa colonies/100 ml of the neat sample (for 100 ml water sample, the sum total on the membrane; for 10 ml of sample, the amount on the membrane multiplied by 10; for 1 ml of sample, the count on the membrane multiplied with 100).
Results and discussion Determination of pathogen microorganisms are essential as daily simulations and
situations with new sources of contamination near farms or were waste is dumped into freshwater sources. Water samples were enumerated from 1 to 20 (4 of each been taken from Wiltshire pond, Avon Canal, river and freshwater lake), and they been tested for all the indicators enumerated through membrane filter method.
Our results revealed that some of the sources analyzed contained pathogen microorganisms contaminations. Pseudomonas aeruginosa produced characteristic blue green or brown colored colonies when samples were kept at 37°C for up to 48 hours (indicative growth may exist after 18 hours).
The positive Pseudomonas locations were diverse, including lake, river, pond or canal, which may indicate contaminated untreated water. Chart 1 displays the incidence results. A total of 20 waters samples (rivers, canals, lakes, ponds) were collected from South West of UK (Somerset and North West Wiltshire) to be analyzed. A batch of 8 samples (10%) were counted more than 10 colonies in 100 ml for Pseudomonas aeruginosa, and 2 <10 colonies/100 ml; 10 samples were counted as zero colonies. Most of the positive samples with more than 10 colonies were processed from Kennet and Avon Canal and from local pond, nearby farming locations.
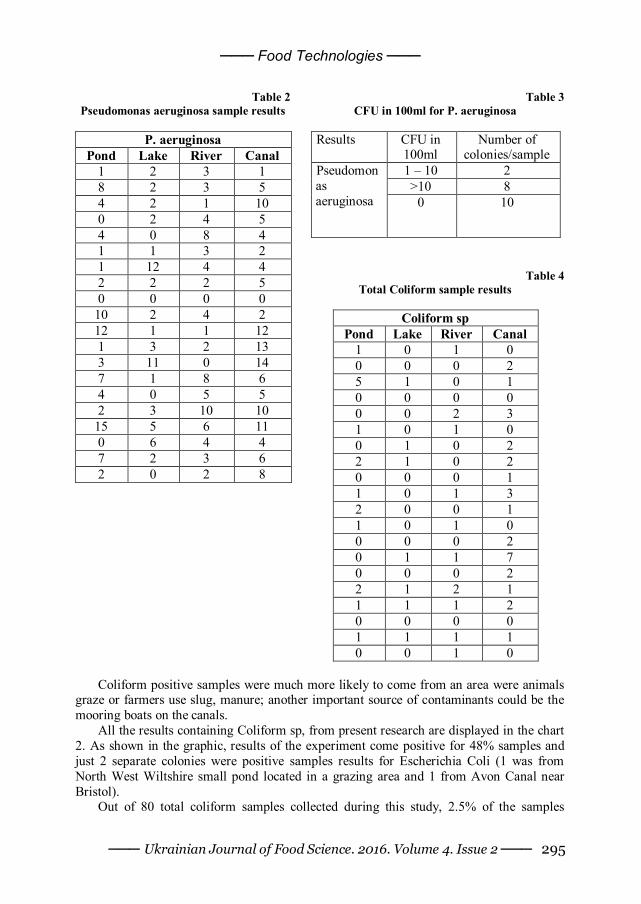
─── Food Technologies ───
─── Ukrainian Journal of Food Science. 2016. Volume 4. Issue 2 ─── 295
Table 2
Pseudomonas aeruginosa sample results
P. aeruginosa Pond Lake River Canal
1 2 3 1 8 2 3 5 4 2 1 10 0 2 4 5 4 0 8 4 1 1 3 2 1 12 4 4 2 2 2 5 0 0 0 0
10 2 4 2 12 1 1 12 1 3 2 13 3 11 0 14 7 1 8 6 4 0 5 5 2 3 10 10
15 5 6 11 0 6 4 4 7 2 3 6 2 0 2 8
Table 3 CFU in 100ml for P. aeruginosa
Results CFU in
100ml Number of
colonies/sample 1 – 10 2 >10 8
Pseudomonas aeruginosa
0 10
Table 4 Total Coliform sample results
Coliform sp
Pond Lake River Canal 1 0 1 0 0 0 0 2 5 1 0 1 0 0 0 0 0 0 2 3 1 0 1 0 0 1 0 2 2 1 0 2 0 0 0 1 1 0 1 3 2 0 0 1 1 0 1 0 0 0 0 2 0 1 1 7 0 0 0 2 2 1 2 1 1 1 1 2 0 0 0 0 1 1 1 1 0 0 1 0
Coliform positive samples were much more likely to come from an area were animals
graze or farmers use slug, manure; another important source of contaminants could be the mooring boats on the canals.
All the results containing Coliform sp, from present research are displayed in the chart 2. As shown in the graphic, results of the experiment come positive for 48% samples and just 2 separate colonies were positive samples results for Escherichia Coli (1 was from North West Wiltshire small pond located in a grazing area and 1 from Avon Canal near Bristol).
Out of 80 total coliform samples collected during this study, 2.5% of the samples
─── Food Technologies ───
─── Ukrainian Journal of Food Science. 2016. Volume 4. Issue 2 ─── 296
reached a total coliform count more than 5 CFU/100 ml, and 2.5% were Escherichia coli samples.
Conclusions These results indicate that catchment area studied has a small probability of having a
human health concern due to the fact the water taken from counties sources is treated and any detection of Coliform or Pseudomonas bacteria is not a pervasive issue, especially as the positive results for treated water are raised up with maximum professionalism.
The highest Coliform count was 7 colonies/100ml obtained in the samples from Canal may be an indication that the water sources are faecal contaminated.
This might be from local fauna or just boats contamination (due to improper dumping of waste, contamination of water by manure, private proper disposal of litter, is the reason for the microbial contamination of the fresh water and the suggestion that water borne diseases need for treatment and decontaminate the water to make it suitable for human consumption). According to the parameters given by the research presence of coliforms, pseudomonas in any water samples indicates that the water is highly polluted and is not water potable quality, because pathogens may origin various illnesses like cholera, which are highly damaging.
No drinking water sample should contain Coliform sp., Escherichia coli or Pseudomonas. Positive results of Coliform bacteria that are detected in the drinking water are immediately inspected. The suspected samples containing Faecal Coliform or Escherichia coli cannot be consumed without treatment (boiling for at least minute) [4].
Although total coliforms are not the best indicator of faecal contamination, they could signpost a greater risk for swimmers etc. developing skin eruptions or ear infections. For example, Pseudomonas aeruginosa is a probable human pathogen that is present on soil, plants etc. It roots a variety of contagious diseases, containing same skin rashes and external ear infections [26].
Some correlations between counts of P. aeruginosa and total coliform counts can be useful for future studies and future studies comparing bacteria from lakes, ponds, rivers and the results of the samples might be an important concern for human health. Future research will involve taking samples from more fresh water sources and mapping the area better, in order to recognize the highest count and possible contaminants sources. It is really important to determine if the highest coliform count is caused and linked with a high number of Escherichia coli counter, and if is related with animal or leakage infestation, and what is the casual risk and finally to diminish waterborne infections for this sources.
References
1. Code of Good Agricultural Practice for the Protection of Water (1998), London, Ministry of Agriculture, Fisheries and Food and Welsh Office Agriculture Department.
2. Sartory D.P. & Howard L. (1992), A medium detecting ecglucuronidase for the simultaneous membrane filtration enumeration of Escherichia coli and coliforms from drinking water. Letters in Applied.
3. Dawson D. (2000), Water Quality for the Food Industry: Management and Microbiological Issues. Guideline No. 27, Campden and Chorleywood Food Research Association.
4. Edberg, S. C., Rice, E. W., Karlin, R. J. and Allen, M. J., (2000), Escherichia coli: the best
─── Food Technologies ───
─── Ukrainian Journal of Food Science. 2016. Volume 4. Issue 2 ─── 297
biological drinking water indicator 5. Public health protection (2000), Journal of Applied Microbiology. 6. Geldreich, E. E., (1996), Microbial Quality of Water Supply in Distribution Systems, CRC
Press Inc./Lewis Publishers. 7. Hijnen W. A. M., van Veenendaal, D. A., van der Speld, W. H. M., Visser, A.,
Hoogenboezem, W. and van der Kooij (2000), Enumeration of faecal indicator bacteria in large volumes using in site membrane filtration to assess water treatment efficiency
8. Industry Guide to Good Hygiene Practice: Vending and Dispensing Guide Supplement (To the Catering Guide) (2000), Automatic Vending Association, London, Chadwick House Group Ltd.
9. ISO 1990b Water Quality C Detection and Enumeration of Coliform Organisms (2016), Thermotolerant Coliform Organisms and Presumptive Escherichia coli.
10. Manual on Treatment for Small Water Supply Systems (2001), Drinking Water Inspectorate/WRc, Medmenham, WRc Ltd.
11. Mara, D., Cairncross A. (1989), Guidelines for the Safe Use of Wastewater and Excreta in Agriculture and Aquaculture, World Health Organization, Geneva.
12. Operational guidelines for the protection of drinking water supplies: safe guards in the operation and management of public water supplies in England and Wales (1988). London, Water Authorities’ Association.
13. Standard methods for the examination of water and waste water, 19th edition (1995), Washington D.C., American Public Health Association.
14. Standing Committee of Analysts, The Microbiology of Drinking Water (2002), Part 2 – Practices and procedures for sampling, Methods for the Examination of Waters and Associated Materials, Environment Agency.
15. Standing Committee of Analysts, The Microbiology of Drinking Water (2002), Part 6 Methods for the isolation and enumeration of Sulphite Reducing Clostridia and Clostridium perfringens by membrane filtration, Methods for the Examination of Waters and Associated Materials, Environment Agency.
16. Standing Committee of Analysts, The Microbiology of Drinking Water (2002), Part 9 Methods for the isolation and enumeration of Salmonella and Shigella by selective enrichment, membrane filtration and multiple tube most probable number techniques, Methods for the Examination of Waters and Associated Materials, Environment Agency.
17. Standing Committee of Analysts, The Microbiology of Drinking Water (2002), Part 8 Methods for the isolation and detection of Aeromonas and Pseudomonas aeruginosa by membrane filtration, Methods for the Examination of Waters and Associated Materials, Environment Agency.
18. Standing Committee of Analysts, The collection and processing of water and other environmental samples for the detection of legionella bacteria (2002), Methods for the Examination of Waters and Associated Materials, in this series, Environment Agency.
19. Principles of Water Supply Hygiene and Technical Guidance Notes (1998), London, Water UK.
20. Standing Committee of Analysts, The Microbiology of Drinking Water (2002), Part 7 The enumeration of Heterotrophic Bacteria by pour and spread plate techniques, Methods for the Examination of Waters and Associated Materials, Environment Agency.
21. Standing Committee of Analysts, The Microbiology of Drinking Water (2002), Part10 – Methods for the isolation of Yersinia, Vibrio and Campylobacter by selective enrichment, Methods for the Examination of Waters and Associated Materials, Environment Agency.
22. Standing Committee of Analysts, The Microbiology of Drinking Water (2002), Part 5 Isolation and enumeration of Enterococci by membrane filtration, Methods for the Examination of Waters and Associated Materials, Environment Agency.
23. Standing Committee of Analysts, The Microbiology of Drinking Water – Part 1 (2002),
─── Food Technologies ───
─── Ukrainian Journal of Food Science. 2016. Volume 4. Issue 2 ─── 298
Water Quality and Public Health. Methods for the Examination of Waters and Associated Materials.
24. Standing Committee of Analysts, The Microbiology of Drinking Water (2002) Part 3 – Practices and Procedures for Laboratories. Methods for the Examination of Waters and Associated Materials, Environment Agency.
25. The Natural Mineral Water, Spring Water and Bottled Drinking Water Regulations (1999). Statutory Instrument 1999 No. 1540. Stationery Office Ltd.
26. The Private Water Supply Regulations (2002). 27. The Safe Sludge Matrix – Guidelines for the Application of Sewage Sludge to Agricultural
Land (2001), Agricultural Development and Advisory Service. 28. The Water Supply (Water Quality) Regulations (2016), Statutory Instrument 2000 No.3184,
Stationery Office Ltd. 29. Water Fittings and Materials Directory (2016), Water Regulations Advisory Scheme.
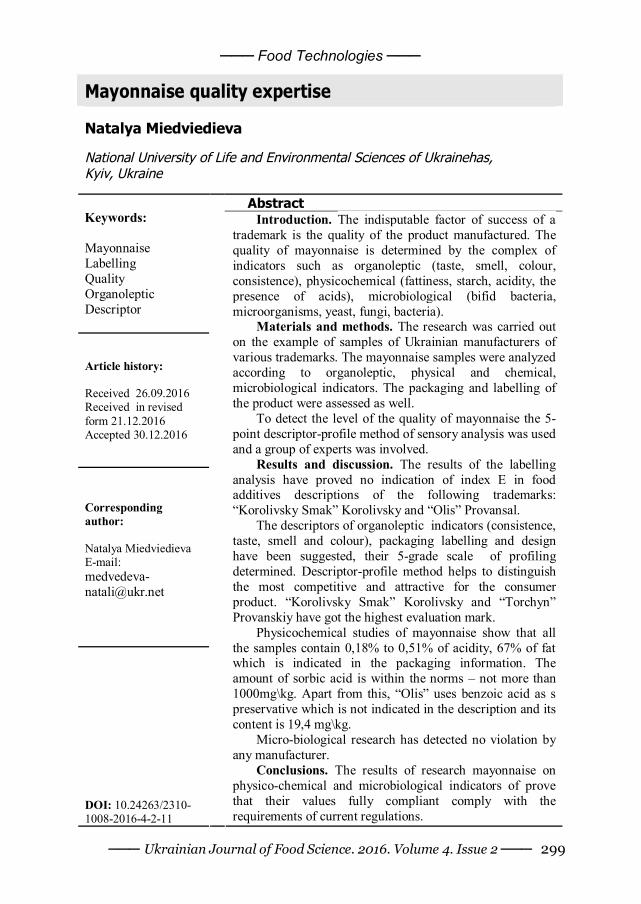
─── Food Technologies ───
─── Ukrainian Journal of Food Science. 2016. Volume 4. Issue 2 ─── 299
Mayonnaise quality expertise
Natalya Miedviedieva National University of Life and Environmental Sciences of Ukrainehas, Kyiv, Ukraine
Abstract
Keywords: Mayonnaise Labelling Quality Organoleptic Descriptor
Article history: Received 26.09.2016 Received in revised form 21.12.2016 Accepted 30.12.2016
Corresponding author: Natalya Miedviedieva E-mail: [email protected]
DOI: 10.24263/2310-1008-2016-4-2-11
Introduction. The indisputable factor of success of a trademark is the quality of the product manufactured. The quality of mayonnaise is determined by the complex of indicators such as organoleptic (taste, smell, colour, consistence), physicochemical (fattiness, starch, acidity, the presence of acids), microbiological (bifid bacteria, microorganisms, yeast, fungi, bacteria).
Materials and methods. The research was carried out on the example of samples of Ukrainian manufacturers of various trademarks. The mayonnaise samples were analyzed according to organoleptic, physical and chemical, microbiological indicators. The packaging and labelling of the product were assessed as well.
To detect the level of the quality of mayonnaise the 5-point descriptor-profile method of sensory analysis was used and a group of experts was involved.
Results and discussion. The results of the labelling analysis have proved no indication of index E in food additives descriptions of the following trademarks: “Korolivsky Smak” Korolivsky and “Olis” Provansal.
The descriptors of organoleptic indicators (consistence, taste, smell and colour), packaging labelling and design have been suggested, their 5-grade scale of profiling determined. Descriptor-profile method helps to distinguish the most competitive and attractive for the consumer product. “Korolivsky Smak” Korolivsky and “Torchyn” Provanskiy have got the highest evaluation mark.
Physicochemical studies of mayonnaise show that all the samples contain 0,18% to 0,51% of acidity, 67% of fat which is indicated in the packaging information. The amount of sorbic acid is within the norms – not more than 1000mg\kg. Apart from this, “Olis” uses benzoic acid as s preservative which is not indicated in the description and its content is 19,4 mg\kg.
Micro-biological research has detected no violation by any manufacturer.
Conclusions. The results of research mayonnaise on physico-chemical and microbiological indicators of prove that their values fully compliant comply with the requirements of current regulations.
─── Food Technologies ───
─── Ukrainian Journal of Food Science. 2016. Volume 4. Issue 2 ─── 300
Introduction Mayonnaise occupies a leading place among various fat-based sauces and dressing.
They are easily digested and are recommended for daily use by all population groups, including prophylactic and dietary food, for making different dishes, sandwiches, salads both in home cooking and in public catering.
Therefore, the relevance of monitoring the varieties of mayonnaise and its quality analysis is beyond any doubt.
The aim of the research is to carry out the quality analysis of the mayonnaise and the comparative analysis of labeling of different manufacturers, organoleptic, physical, chemical and microbiological indicators. To achieve the aim the following tasks are to be carried out: to consider the mayonnaise quality requirements, to conduct a comparative expertise of the quality of mayonnaise of different manufacturers.
Mayonnaise products enjoy a high popularity among the population of Ukraine and occupies an important place in the nutrition structure.
Mayonnaise is a finely dispersed creamy "oil in water" type emulsion, made of refined, deodorized vegetable oils with the addition of emulsifiers, stabilizers, thickeners, flavorings and spices [1].
The traditional mayonnaise recipe includes refined and deodorized vegetable oil, (72%), egg yolks (9.2%), mustard (2.4%), sugar (2%), food acid (14.4%) [2]. But this type of mayonnaise contains an increased cholesterol content, biological value being low. It has low stability to delamination and a high energy value. It contains food acid, which makes it impossible to use by a wide range of consumers. [3].
The analysis of production and perspective needs of mayonnaise products has revealed the need of quality improvement and diversification by using food additives that will provide the necessary nutritional value of the product [4].
Food additives in the recipe of mayonnaise not only improve the nutritional and biological value, but also stabilize the emulsion, and help avoid traditional structure-creators, which have undesirable side effects. [5] In some cases an emulsifier is introduced to create a stable emulsion of high-calorie mayonnaise. In case of low-fat recipes stabilizers are used to provide stability and prevent separation. They improve viscosity of the disperse environment, prevent oil drop fusion, being hydrophilic by nature [6].
Calorie reducing is very important when developing health-improving products. Since nowadays fats provide 30-35 % of one’s dietary energy, fat reduction is one of the requirements for producing dietary and health-improving emulsion products. In health-improving mayonnaise the proportion of polyunsaturated fatty acids ω-6 and ω-3 should be (5-10):1 [7].
Food acids added to mayonnaise serve as both flavorings and preservatives. Reducing calorie emulsions pH from 6.9 to 4.0-4.7, they prevent the production of undesirable microorganisms [8]. Speaking about the functionality of the product, it should be noted that acetic acid or citric acid used in the recipe of mayonnaise, has a significant irritating effect on the mucous membranes of the gastrointestinal tract.
In recent years, the people’s attitude to the diet and its importance has changed dramatically. Consumers are increasingly interested in the influence of various foods and their components on health.
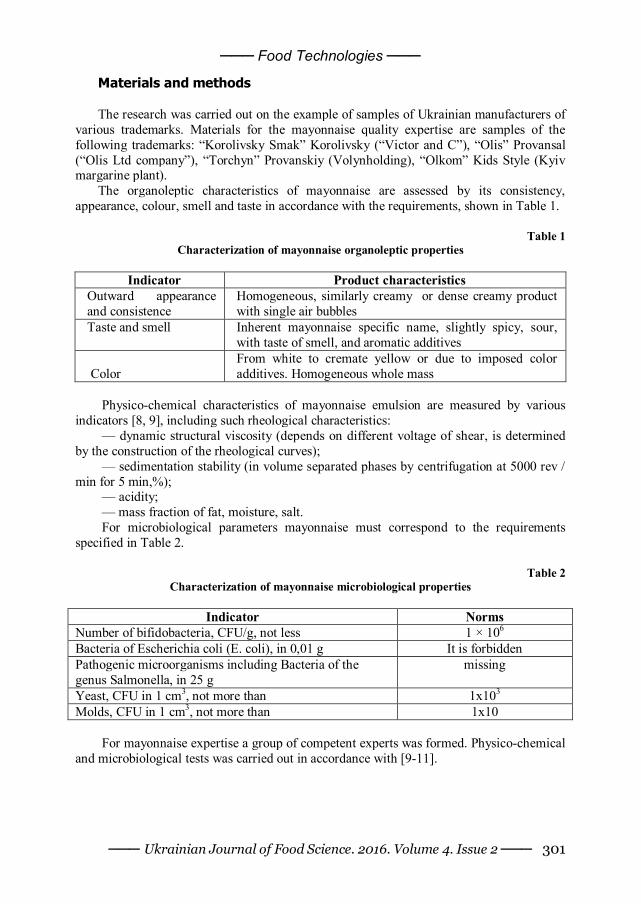
─── Food Technologies ───
─── Ukrainian Journal of Food Science. 2016. Volume 4. Issue 2 ─── 301
Materials and methods The research was carried out on the example of samples of Ukrainian manufacturers of
various trademarks. Materials for the mayonnaise quality expertise are samples of the following trademarks: “Korolivsky Smak” Korolivsky (“Victor and C”), “Olis” Provansal (“Olis Ltd company”), “Torchyn” Provanskiy (Volynholding), “Olkom” Kids Style (Kyiv margarine plant).
The organoleptic characteristics of mayonnaise are assessed by its consistency, appearance, colour, smell and taste in accordance with the requirements, shown in Table 1.
Тable 1
Characterization of mayonnaise organoleptic properties
Indicator Product characteristics Outward appearance and consistence
Homogeneous, similarly creamy or dense creamy product with single air bubbles
Taste and smell Inherent mayonnaise specific name, slightly spicy, sour, with taste of smell, and aromatic additives
Color From white to cremate yellow or due to imposed color additives. Homogeneous whole mass
Physico-chemical characteristics of mayonnaise emulsion are measured by various
indicators [8, 9], including such rheological characteristics: — dynamic structural viscosity (depends on different voltage of shear, is determined
by the construction of the rheological curves); — sedimentation stability (in volume separated phases by centrifugation at 5000 rev /
min for 5 min,%); — acidity; — mass fraction of fat, moisture, salt. For microbiological parameters mayonnaise must correspond to the requirements
specified in Table 2.
Table 2 Characterization of mayonnaise microbiological properties
Indicator Norms
Number of bifidobacteria, CFU/g, not less 1 × 10⁶ Bacteria of Escherichia coli (E. coli), in 0,01 g It is forbidden Pathogenic microorganisms including Bacteria of the genus Salmonella, in 25 g
missing
Yeast, CFU in 1 cm3, not more than 1х103 Molds, CFU in 1 cm3, not more than 1x10
For mayonnaise expertise a group of competent experts was formed. Physico-chemical
and microbiological tests was carried out in accordance with [9-11].
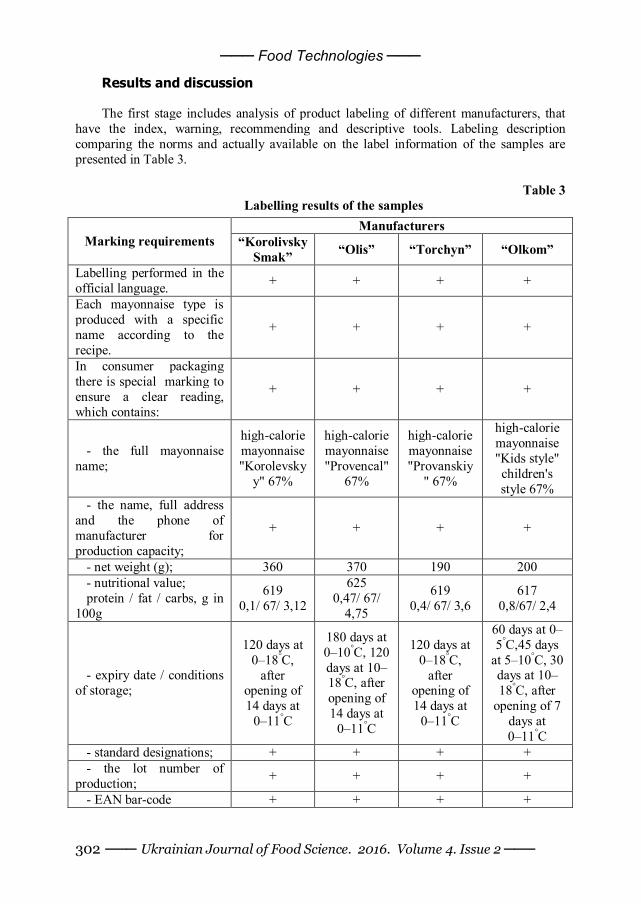
─── Food Technologies ───
─── Ukrainian Journal of Food Science. 2016. Volume 4. Issue 2 ─── 302
Results and discussion The first stage includes analysis of product labeling of different manufacturers, that
have the index, warning, recommending and descriptive tools. Labeling description comparing the norms and actually available on the label information of the samples are presented in Table 3.
Table 3
Labelling results of the samples
Manufacturers Marking requirements “Korolivsky
Smak” “Olis” “Torchyn” “Olkom”
Labelling performed in the official language. + + + +
Each mayonnaise type is produced with a specific name according to the recipe.
+ + + +
In consumer packaging there is special marking to ensure a clear reading, which contains:
+ + + +
- the full mayonnaise name;
high-calorie mayonnaise "Korolevsky
y" 67%
high-calorie mayonnaise "Provencal"
67%
high-calorie mayonnaise "Provanskiy
" 67%
high-calorie mayonnaise "Kids style" children's style 67%
- the name, full address and the phone of manufacturer for production capacity;
+ + + +
- net weight (g); 360 370 190 200 - nutritional value; protein / fat / carbs, g in
100g
619 0,1/ 67/ 3,12
625 0,47/ 67/
4,75
619 0,4/ 67/ 3,6
617 0,8/67/ 2,4
- expiry date / conditions of storage;
120 days at 0–18°С,
after opening of 14 days at
0–11°С
180 days at 0–10°С, 120 days at 10–18°С, after opening of 14 days at
0–11°С
120 days at 0–18°С,
after opening of 14 days at
0–11°С
60 days at 0–5°С,45 days
at 5–10°С, 30 days at 10–18°С, after
opening of 7 days at 0–11°С
- standard designations; + + + + - the lot number of
production; + + + +
- EAN bar-code + + + +
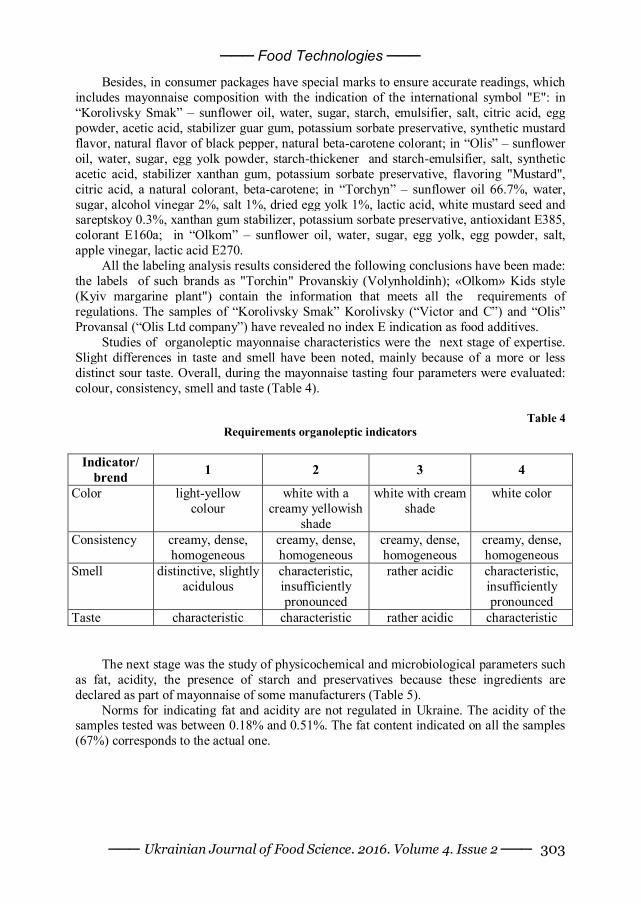
─── Food Technologies ───
─── Ukrainian Journal of Food Science. 2016. Volume 4. Issue 2 ─── 303
Besides, іn consumer packages have special marks to ensure accurate readings, which includes mayonnaise composition with the indication of the international symbol "E": in “Korolivsky Smak” – sunflower oil, water, sugar, starch, emulsifier, salt, citric acid, egg powder, acetic acid, stabilizer guar gum, potassium sorbate preservative, synthetic mustard flavor, natural flavor of black pepper, natural beta-carotene colorant; in “Olis” – sunflower oil, water, sugar, egg yolk powder, starch-thickener and starch-emulsifier, salt, synthetic acetic acid, stabilizer xanthan gum, potassium sorbate preservative, flavoring "Mustard", citric acid, a natural colorant, beta-carotene; in “Torchyn” – sunflower oil 66.7%, water, sugar, alcohol vinegar 2%, salt 1%, dried egg yolk 1%, lactic acid, white mustard seed and sareptskoy 0.3%, xanthan gum stabilizer, potassium sorbate preservative, antioxidant E385, colorant E160a; in “Olkom” – sunflower oil, water, sugar, egg yolk, egg powder, salt, apple vinegar, lactic acid E270.
All the labeling analysis results considered the following conclusions have been made: the labels of such brands as "Torchin" Provanskiy (Volynholdinh); «Olkom» Kids style (Kyiv margarine plant") contain the information that meets all the requirements of regulations. The samples of “Korolivsky Smak” Korolivsky (“Victor and C”) and “Olis” Provansal (“Olis Ltd company”) have revealed no index E indication as food additives.
Studies of organoleptic mayonnaise characteristics were the next stage of expertise. Slight differences in taste and smell have been noted, mainly because of a more or less distinct sour taste. Overall, during the mayonnaise tasting four parameters were evaluated: colour, consistency, smell and taste (Table 4).
Table 4
Requirements organoleptic indicators
Indicator/ brend 1 2 3 4
Color light-yellow colour
white with a creamy yellowish
shade
white with cream shade
white color
Consistency creamy, dense, homogeneous
creamy, dense, homogeneous
creamy, dense, homogeneous
creamy, dense, homogeneous
Smell distinctive, slightly acidulous
characteristic, insufficiently pronounced
rather acidic characteristic, insufficiently pronounced
Taste characteristic characteristic rather acidic characteristic The next stage was the study of physicochemical and microbiological parameters such
as fat, acidity, the presence of starch and preservatives because these ingredients are declared as part of mayonnaise of some manufacturers (Table 5).
Norms for indicating fat and acidity are not regulated in Ukraine. The acidity of the samples tested was between 0.18% and 0.51%. The fat content indicated on all the samples (67%) corresponds to the actual one.
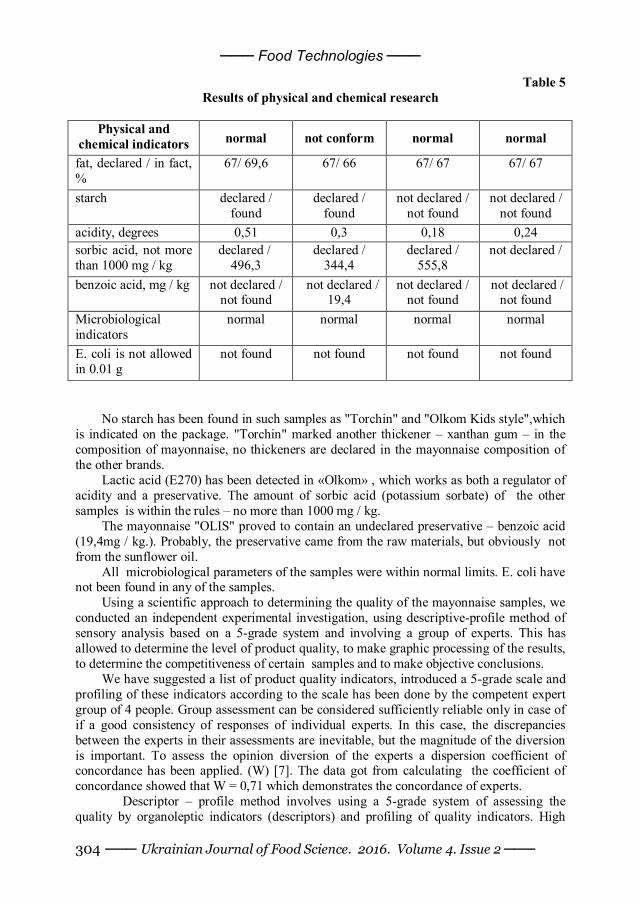
─── Food Technologies ───
─── Ukrainian Journal of Food Science. 2016. Volume 4. Issue 2 ─── 304
Table 5 Results of physical and chemical research
Physical and
chemical indicators normal not conform normal normal
fat, declared / in fact, %
67/ 69,6 67/ 66 67/ 67 67/ 67
starch declared / found
declared / found
not declared / not found
not declared / not found
acidity, degrees 0,51 0,3 0,18 0,24 sorbic acid, not more than 1000 mg / kg
declared / 496,3
declared / 344,4
declared / 555,8
not declared /
benzoic acid, mg / kg not declared / not found
not declared / 19,4
not declared / not found
not declared / not found
Microbiological indicators
normal normal normal normal
E. coli is not allowed in 0.01 g
not found not found not found not found
No starch has been found in such samples as "Torchin" and "Olkom Kids style",which
is indicated on the package. "Torchin" marked another thickener – xanthan gum – in the composition of mayonnaise, no thickeners are declared in the mayonnaise composition of the other brands.
Lactic acid (E270) has been detected in «Olkom» , which works as both a regulator of acidity and a preservative. The amount of sorbic acid (potassium sorbate) of the other samples is within the rules – no more than 1000 mg / kg.
The mayonnaise "OLІS" proved to contain an undeclared preservative – benzoic acid (19,4mg / kg.). Probably, the preservative came from the raw materials, but obviously not from the sunflower oil.
All microbiological parameters of the samples were within normal limits. E. coli have not been found in any of the samples.
Using a scientific approach to determining the quality of the mayonnaise samples, we conducted an independent experimental investigation, using descriptive-profile method of sensory analysis based on a 5-grade system and involving a group of experts. This has allowed to determine the level of product quality, to make graphic processing of the results, to determine the competitiveness of certain samples and to make objective conclusions.
We have suggested a list of product quality indicators, introduced a 5-grade scale and profiling of these indicators according to the scale has been done by the competent expert group of 4 people. Group assessment can be considered sufficiently reliable only in case of if a good consistency of responses of individual experts. In this case, the discrepancies between the experts in their assessments are inevitable, but the magnitude of the diversion is important. To assess the opinion diversion of the experts a dispersion coefficient of concordance has been applied. (W) [7]. The data got from calculating the coefficient of concordance showed that W = 0,71 which demonstrates the concordance of experts.
Descriptor – profile method involves using a 5-grade system of assessing the quality by organoleptic indicators (descriptors) and profiling of quality indicators. High
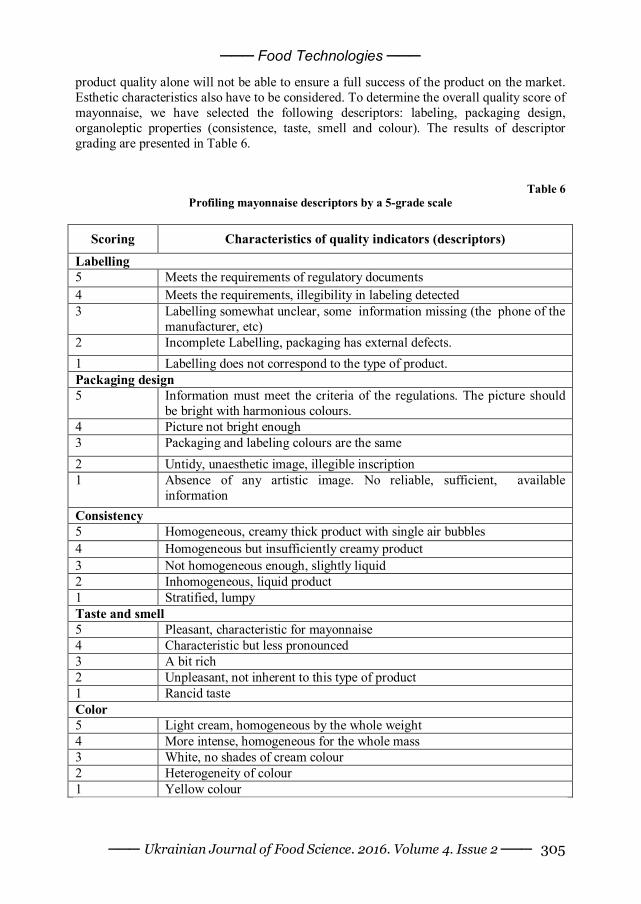
─── Food Technologies ───
─── Ukrainian Journal of Food Science. 2016. Volume 4. Issue 2 ─── 305
product quality alone will not be able to ensure a full success of the product on the market. Esthetic characteristics also have to be considered. To determine the overall quality score of mayonnaise, we have selected the following descriptors: labeling, packaging design, organoleptic properties (consistence, taste, smell and colour). The results of descriptor grading are presented in Table 6.
Table 6 Profiling mayonnaise descriptors by a 5-grade scale
Scoring Characteristics of quality indicators (descriptors)
Labelling 5 Meets the requirements of regulatory documents 4 Meets the requirements, illegibility in labeling detected 3 Labelling somewhat unclear, some information missing (the phone of the
manufacturer, etc) 2 Incomplete Labelling, packaging has external defects. 1 Labelling does not correspond to the type of product. Packaging design 5 Information must meet the criteria of the regulations. The picture should
be bright with harmonious colours. 4 Picture not bright enough 3 Packaging and labeling colours are the same 2 Untidy, unaesthetic image, illegible inscription 1 Absence of any artistic image. No reliable, sufficient, available
information Consistency 5 Homogeneous, creamy thick product with single air bubbles 4 Homogeneous but insufficiently creamy product 3 Not homogeneous enough, slightly liquid 2 Inhomogeneous, liquid product 1 Stratified, lumpy Taste and smell 5 Pleasant, characteristic for mayonnaise 4 Characteristic but less pronounced 3 A bit rich 2 Unpleasant, not inherent to this type of product 1 Rancid taste Color 5 Light cream, homogeneous by the whole weight 4 More intense, homogeneous for the whole mass 3 White, no shades of cream colour 2 Heterogeneity of colour 1 Yellow colour
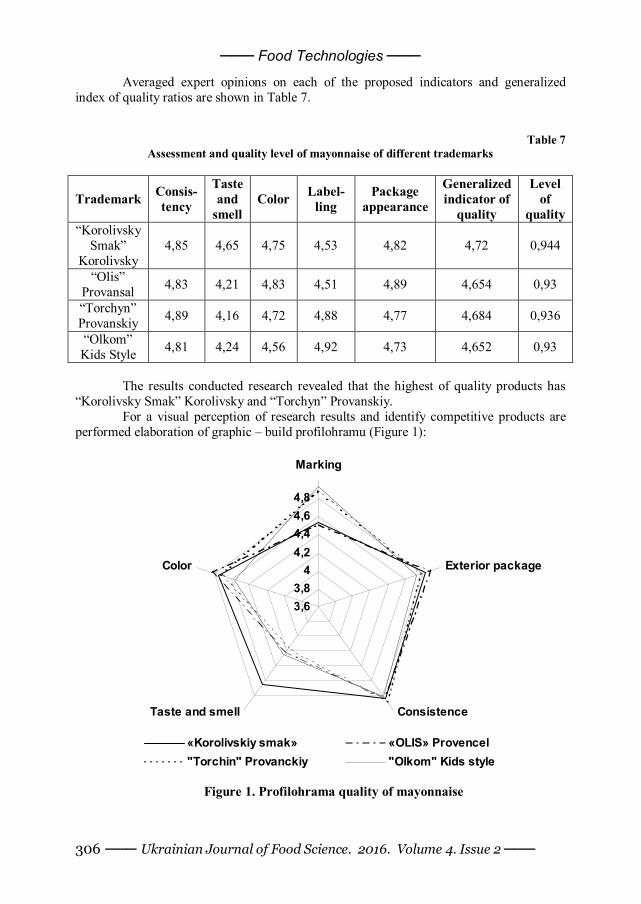
─── Food Technologies ───
─── Ukrainian Journal of Food Science. 2016. Volume 4. Issue 2 ─── 306
Averaged expert opinions on each of the proposed indicators and generalized index of quality ratios are shown in Table 7.
Table 7 Assessment and quality level of mayonnaise of different trademarks
Trademark Consis-tency
Taste and
smell Color Label-
ling Package
appearance
Generalized indicator of
quality
Level of
quality “Korolivsky
Smak” Korolivsky
4,85 4,65 4,75 4,53 4,82 4,72 0,944
“Olis” Provansal 4,83 4,21 4,83 4,51 4,89 4,654 0,93
“Torchyn” Provanskiy 4,89 4,16 4,72 4,88 4,77 4,684 0,936
“Olkom” Kids Style 4,81 4,24 4,56 4,92 4,73 4,652 0,93
The results conducted research revealed that the highest of quality products has
“Korolivsky Smak” Korolivsky and “Torchyn” Provanskiy. For a visual perception of research results and identify competitive products are
performed elaboration of graphic – build profilohramu (Figure 1):
3,63,8
44,24,44,64,8
Marking
Exterior package
ConsistenceTaste and smell
Color
«Korolivskiy smak» «OLIS» Provencel"Torchin" Provanckiy "Olkom" Kids style
Figure 1. Profilohrama quality of mayonnaise
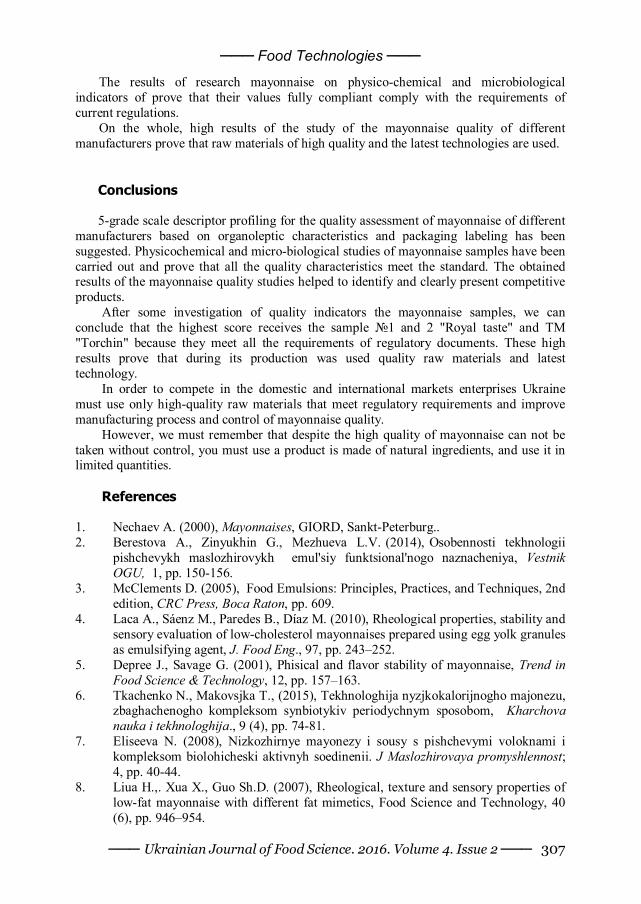
─── Food Technologies ───
─── Ukrainian Journal of Food Science. 2016. Volume 4. Issue 2 ─── 307
The results of research mayonnaise on physico-chemical and microbiological indicators of prove that their values fully compliant comply with the requirements of current regulations.
On the whole, high results of the study of the mayonnaise quality of different manufacturers prove that raw materials of high quality and the latest technologies are used.
Conclusions 5-grade scale descriptor profiling for the quality assessment of mayonnaise of different
manufacturers based on organoleptic characteristics and packaging labeling has been suggested. Physicochemical and micro-biological studies of mayonnaise samples have been carried out and prove that all the quality characteristics meet the standard. The obtained results of the mayonnaise quality studies helped to identify and clearly present competitive products.
After some investigation of quality indicators the mayonnaise samples, we can conclude that the highest score receives the sample №1 and 2 "Royal taste" and TM "Torchin" because they meet all the requirements of regulatory documents. These high results prove that during its production was used quality raw materials and latest technology.
In order to compete in the domestic and international markets enterprises Ukraine must use only high-quality raw materials that meet regulatory requirements and improve manufacturing process and control of mayonnaise quality.
However, we must remember that despite the high quality of mayonnaise can not be taken without control, you must use a product is made of natural ingredients, and use it in limited quantities.
References
1. Nechaev A. (2000), Mayonnaises, GIORD, Sankt-Peterburg.. 2. Berestova A., Zinyukhin G., Mezhueva L.V. (2014), Osobennosti tekhnologii
pishchevykh maslozhirovykh emul'siy funktsional'nogo naznacheniya, Vestnik OGU, 1, рр. 150-156.
3. McClements D. (2005), Food Emulsions: Principles, Practices, and Techniques, 2nd edition, CRC Press, Boca Raton, pp. 609.
4. Laca A., Sáenz M., Paredes B., Díaz M. (2010), Rheological properties, stability and sensory evaluation of low-cholesterol mayonnaises prepared using egg yolk granules as emulsifying agent, J. Food Eng., 97, pp. 243–252.
5. Depree J., Savage G. (2001), Phisical and flavor stability of mayonnaise, Trend in Food Science & Technology, 12, рр. 157–163.
6. Tkachenko N., Makovsjka T., (2015), Tekhnologhija nyzjkokalorijnogho majonezu, zbaghachenogho kompleksom synbiotykiv periodychnym sposobom, Kharchova nauka i tekhnologhija., 9 (4), рр. 74-81.
7. Eliseeva N. (2008), Nizkozhirnye mayonezy i sousy s pishchevymi voloknami i kompleksom biolohicheski aktivnyh soedinenii. J Maslozhirovaya promyshlennost; 4, рр. 40-44.
8. Liua H.,. Xua X., Guo Sh.D. (2007), Rheological, texture and sensory properties of low-fat mayonnaise with different fat mimetics, Food Science and Technology, 40 (6), рр. 946–954.
─── Food Technologies ───
─── Ukrainian Journal of Food Science. 2016. Volume 4. Issue 2 ─── 308
9. Kucherepa N., Shemet V., Dragonyuk M., Chujko I. (2012), Metody vyznachennya fizy`chnoyi ta okyslyuvalnoyi stabilnosti majonezu, Nauk. Visn. VNU im. Lesi Ukrayinky. Ximichni nauky, 17, рр. 150 s.
10. Gill A., Greer G., Nattress F. (2014) Microbiological analysis. Standard Methods, Food ScienceEncyclopedia of Meat Sciences, 2, рр. 306–316.
11. Izidoro D., Sierakowski M., Waszczynskyj N., Haminiuk C., Scheer A. de P (2007), Sensory evaluation and rheological behavior of commercial mayonnaise, Int J Food Eng, 3, pp. 1-15
12. Fabian F. and Wethington M. (1950), Bacterial and chemical analyses of mayonnaise, salad dressing, and related products, Journal of Food Science 15(2), рр. 138–145.
─── Food Technologies ───
─── Ukrainian Journal of Food Science. 2016. Volume 4. Issue 2 ─── 309
Mathematical model of liquid activization while making breads in domestic breadmaker
Vitaliy Borodin, Ganna Tsygankova National University of Food Technologies, Kyiv, Ukraine
Abstract
Keywords:
Bread Modeling Foaming
Article history: Received 04.06.2016 Received in revised form 27.11.2016 Accepted 30.12.2016
Corresponding author: Ganna Tsygankova E-mail: [email protected]
DOI: 10.24263/2310-1008-2016-4-2-12
Introduction. When preparing ingredients for bread
baking cooking books say that beating eggs up improves quality of bread. The basis of this fact is given in this paper.
Materials and methods. Maked in domestic breadmaker bread brioche is studied. Methods of mathematical modeling are applied to consideration of a problem of a liquid activization during breads making in domestic breadmaker.
Results and discussion. We understand liquid as any substance which can spread. If we receive a positive changes in results of application of certain technology (which can be fixed measurements) in some characteristics of a ready product we can speak about liquid activization. Examples of liquid activization are given.
The mathematical model, which shows, that intensity of contact of firm and liquid fractions while transformation liquid into foam must increase is developed. They considere, that foam consists of set of spherical segments of spheres with any radius R and different height h . Natural restriction is put on heights of segments h to distribute them uniformly on an interval [ 0, R ]. For the characteristic of the contact area of firm and liquid fractions the concept of dome coefficient is considered. The mathematical expectation of dome coefficient of spherical segments defines average dome coefficient. It is proved, that the average dome coefficient is equal 1,5 for the offered model of foam.
Conclusion. The offered mathematical model of foam shows possibility of intensification of firm and a liquid fractions contact in 1,5 times during transformation a liquid into foam.
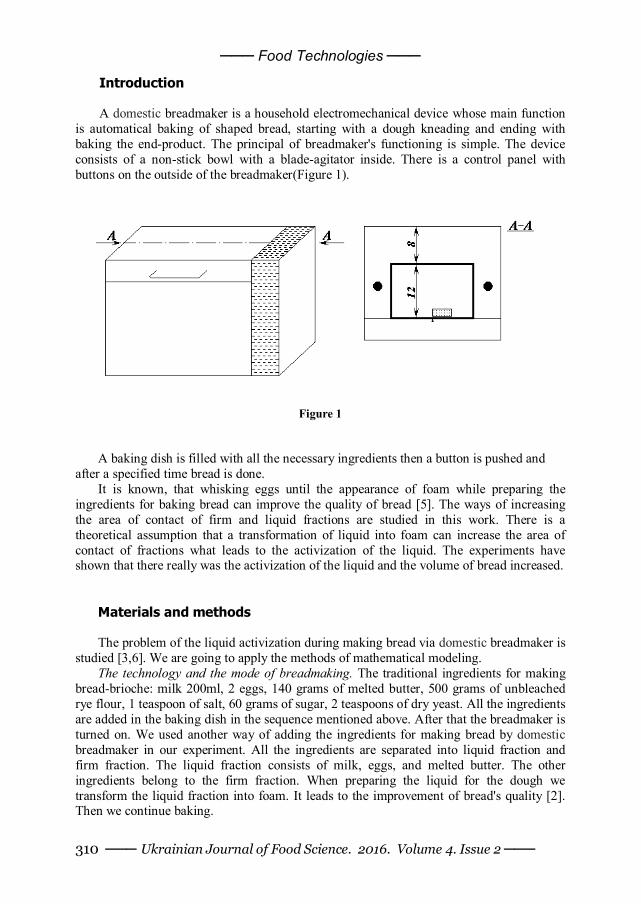
─── Food Technologies ───
─── Ukrainian Journal of Food Science. 2016. Volume 4. Issue 2 ─── 310
Introduction A domestic breadmaker is a household electromechanical device whose main function
is automatical baking of shaped bread, starting with a dough kneading and ending with baking the end-product. The principal of breadmaker's functioning is simple. The device consists of a non-stick bowl with a blade-agitator inside. There is a control panel with buttons on the outside of the breadmaker(Figure 1).
Figure 1
A baking dish is filled with all the necessary ingredients then a button is pushed and after a specified time bread is done.
It is known, that whisking eggs until the appearance of foam while preparing the ingredients for baking bread can improve the quality of bread [5]. The ways of increasing the area of contact of firm and liquid fractions are studied in this work. There is a theoretical assumption that a transformation of liquid into foam can increase the area of contact of fractions what leads to the activization of the liquid. The experiments have shown that there really was the activization of the liquid and the volume of bread increased.
Materials and methods The problem of the liquid activization during making bread via domestic breadmaker is
studied [3,6]. We are going to apply the methods of mathematical modeling. The technology and the mode of breadmaking. The traditional ingredients for making
bread-brioche: milk 200ml, 2 eggs, 140 grams of melted butter, 500 grams of unbleached rye flour, 1 teaspoon of salt, 60 grams of sugar, 2 teaspoons of dry yeast. All the ingredients are added in the baking dish in the sequence mentioned above. After that the breadmaker is turned on. We used another way of adding the ingredients for making bread by domestic breadmaker in our experiment. All the ingredients are separated into liquid fraction and firm fraction. The liquid fraction consists of milk, eggs, and melted butter. The other ingredients belong to the firm fraction. When preparing the liquid for the dough we transform the liquid fraction into foam. It leads to the improvement of bread's quality [2]. Then we continue baking.
─── Food Technologies ───
─── Ukrainian Journal of Food Science. 2016. Volume 4. Issue 2 ─── 311
Liquid activization. The liquid is turned into foam via the V-technology of whisking [1]. According to this technology the axis of whisks is situated parallel to the surface of liquid while whisking. An overtime taken to whisk liquid by the V-technology is not more than a minute. We transform liquid into foam according to the next rules:
1. All the steps of whisking must be done by V-technology. 2. The first step – whisking eggs 20 sec. 3. The second step – add milk and whisk 20 sec. 4. The third step – add melted butter and whisk 20 sec. Mathematical modeling of foaming. The process of foaming is considered. We accept
that foam itself is a complex of spherical segments with the arbitrary radius. We find the dome coefficient of the spherical segment. It depends on the parameters of fragments of the foam (radius and height of the spherical segment). An average dome coefficient is a constant measurement which shows increasing of the area of the surface of contact between firm and liquid fractions while transforming the liquid into the foam, what leads to the increasing of bread's volume.
Results and discussion Water, steam, humidity in capillaries, mix of water and flour, dough and everything
that can flow is considered as a liquid. If the application of certain technology brings changes (which can be fixed by measurements) in some characteristics of an end-product a liquid activization may be discussed. For example in various cookbooks it is said that bread tastes much better if eggs are replaced by eggs whisked into foam while preparing the dough [5]. This characteristic is not considered as the activization. But if the bread made with whisked eggs is sold at least 5 percent more expensive than we can talk about the activization of the liquid the bread made of. Another example. We shall whisk eggwhite or we can call it "liquid" until foaming. According to the traditional technology of whisking and the instruction of a blender this process takes 5 minutes. At the same time using the V-technology allows to get the foam for 1 minute. We can say that the V-technology of whisking activates the liquid no matter what the aim of using the whisked eggwhite.
In some cases the term "activization" is used incorrectly. Let's look at the example. Conduction and convection are the main ways of heating the liquid. We can see the conduction while heating one end of a metal rod with insulated lateral surface and watch the changing of the temperature at the other end of the rod. While heating atmosphere we can see the almost pure convection. Firstly, the sun's rays pass through the air and heat the ground. The air gets warm from the ground, becomes lighter, and goes up. After that colder layers of air go down replacing the warm air described above. There are convective flows going up and the more intensive the are the more effective and convective the heat transfer. Thus all the manuals are suggesting to create a forced vortical circulation to get more effective convective heat transfer. We have to admit that this statement (about the effectiveness of the vortical circulation for the convective heat transfer) is correct for water, however it is unjust for the complex liquids like milk, for instance. We shall let the milk boil in the pan. A simple mixing can help to save the situation at the moment when the milk is going to leak out of the pan. It means that a forced vortical circulation weakens the convective heat transfer rather than increases. It means that the qualitative general characteristics of the esteem of the effectiveness can not be accepted without numerical estimations.
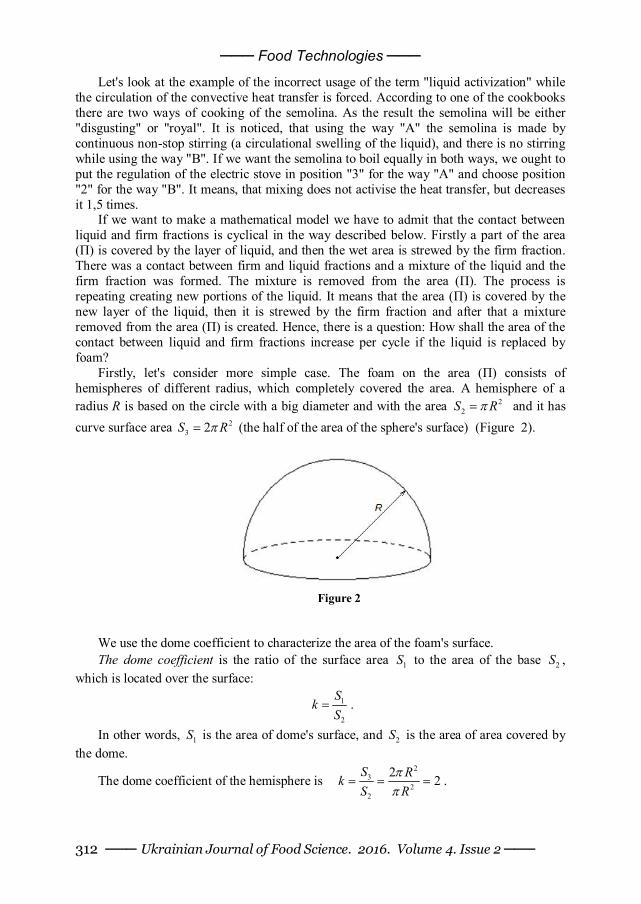
─── Food Technologies ───
─── Ukrainian Journal of Food Science. 2016. Volume 4. Issue 2 ─── 312
Let's look at the example of the incorrect usage of the term "liquid activization" while the circulation of the convective heat transfer is forced. According to one of the cookbooks there are two ways of cooking of the semolina. As the result the semolina will be either "disgusting" or "royal". It is noticed, that using the way "A" the semolina is made by continuous non-stop stirring (a circulational swelling of the liquid), and there is no stirring while using the way "B". If we want the semolina to boil equally in both ways, we ought to put the regulation of the electric stove in position "3" for the way "A" and choose position "2" for the way "B". It means, that mixing does not activise the heat transfer, but decreases it 1,5 times.
If we want to make a mathematical model we have to admit that the contact between liquid and firm fractions is cyclical in the way described below. Firstly a part of the area (П) is covered by the layer of liquid, and then the wet area is strewed by the firm fraction. There was a contact between firm and liquid fractions and a mixture of the liquid and the firm fraction was formed. The mixture is removed from the area (П). The process is repeating creating new portions of the liquid. It means that the area (П) is covered by the new layer of the liquid, then it is strewed by the firm fraction and after that a mixture removed from the area (П) is created. Hence, there is a question: How shall the area of the contact between liquid and firm fractions increase per cycle if the liquid is replaced by foam?
Firstly, let's consider more simple case. The foam on the area (П) consists of hemispheres of different radius, which completely covered the area. A hemisphere of a radius R is based on the circle with a big diameter and with the area 2
2S R and it has curve surface area 2
3 2S R (the half of the area of the sphere's surface) (Figure 2).
Figure 2
We use the dome coefficient to characterize the area of the foam's surface. The dome coefficient is the ratio of the surface area 1S to the area of the base 2S ,
which is located over the surface: 1
2
Sk
S .
In other words, 1S is the area of dome's surface, and 2S is the area of area covered by the dome.
The dome coefficient of the hemisphere is 2
32
2
2 2S RkS R
.
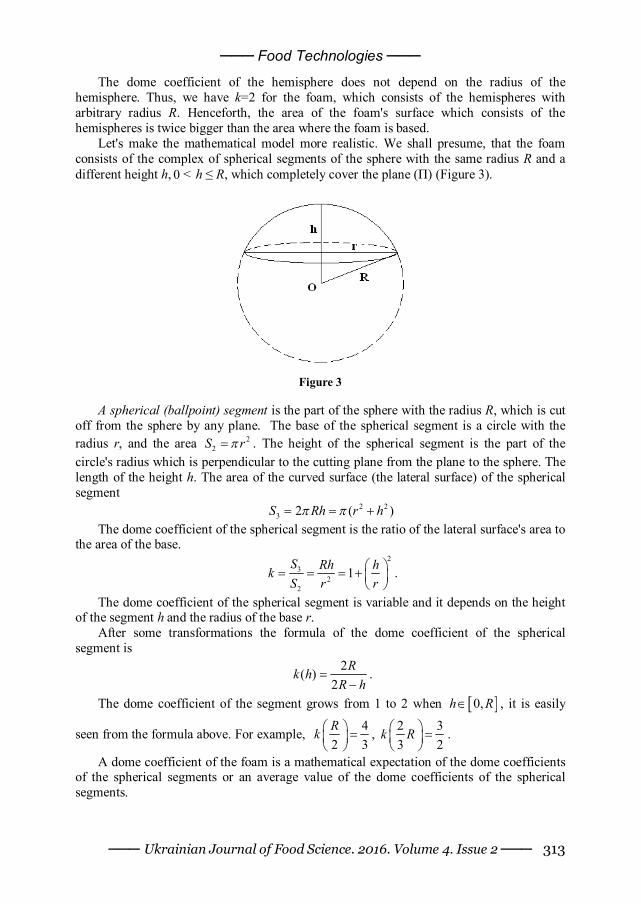
─── Food Technologies ───
─── Ukrainian Journal of Food Science. 2016. Volume 4. Issue 2 ─── 313
The dome coefficient of the hemisphere does not depend on the radius of the hemisphere. Thus, we have k=2 for the foam, which consists of the hemispheres with arbitrary radius R. Henceforth, the area of the foam's surface which consists of the hemispheres is twice bigger than the area where the foam is based.
Let's make the mathematical model more realistic. We shall presume, that the foam consists of the complex of spherical segments of the sphere with the same radius R and a different height h, 0 < h ≤ R, which completely cover the plane (П) (Figure 3).
Figure 3
A spherical (ballpoint) segment is the part of the sphere with the radius R, which is cut
off from the sphere by any plane. The base of the spherical segment is a circle with the radius r, and the area 2
2S r . The height of the spherical segment is the part of the circle's radius which is perpendicular to the cutting plane from the plane to the sphere. The length of the height h. The area of the curved surface (the lateral surface) of the spherical segment
2 23 2 ( )S Rh r h
The dome coefficient of the spherical segment is the ratio of the lateral surface's area to the area of the base.
23
22
1S Rh hkS rr
.
The dome coefficient of the spherical segment is variable and it depends on the height of the segment h and the radius of the base r.
After some transformations the formula of the dome coefficient of the spherical segment is
2( )2
Rk hR h
.
The dome coefficient of the segment grows from 1 to 2 when 0,h R , it is easily
seen from the formula above. For example, 42 3Rk
, 2 3
3 2k R
.
A dome coefficient of the foam is a mathematical expectation of the dome coefficients of the spherical segments or an average value of the dome coefficients of the spherical segments.
─── Food Technologies ───
─── Ukrainian Journal of Food Science. 2016. Volume 4. Issue 2 ─── 314
Let's make an assumption that the spherical segments with the height h, 0 h R , are
equally possible. According to this hypothesis the dome coefficients 2( )2
Rk hR h
are
divided with a density
3
3 (2 ), 0, ,( ) 2
0, 0, .
h R h h Rf h R
h R
The mathematical expectation of the dome coefficients
( ) ( )срk f h k h dh
.
Substituting the functions' value and calculating the integral, we get 32срk .
As the срk does not depend on the radius of the big sphere, our assumption that all the spherical segment are created from the sphere of the same radius R is unnecessary. We can put the result we have got on the more realistic mathematical model.
Conclusion If a segment height division is even for each of the R, the average dome coefficient of
the foam is 32срk for the foam which consists of the spherical segments with the arbitrary
radius. The mathematical model which is made, shows that the surface area of the interaction
of the firm and liquid fractions, while transforming the liquid into the foam, grows 1,5 times bigger. This implies that using the foam instead of the liquid intensifies a technological process of kneading dough.
References
1. Vitaliy Borodin (2012), V-technology of whisking, International Scientific and
Practical Conference “Improving processes and equipment – the guarantee of innovation development of the food industry”, Kyiv, Ukraine, April 10-11, pp.146–147.
2. Vitaliy Borodin, Ganna Tsygankova (2013), Liquid activization while baking breads in breadmaker, The Second North and East European Congress on Food, Kyiv, Ukraine, May 26-29, p.70.
3. Alain Le-bail, Tzvetelin Dessev, Dominique Leray, Tiphaine Lucas, Sylvia Mariani, Giovanni Mottollese, Vanessa Jury (2011), Influence of the amount of steaming during baking on the kinetic of heating and on selected quality attributes of bread, Journal of Food Engineering, 105(2), pp. 379–385.
4. Flick D., Doursat C., Grenier D., Lucas T. (2015), 5 – Modelling of baking processes, Modeling Food Processing Operations, pp. 129–161.
5. Wilde P. (2012), 15 – Foam formation in dough and bread quality, Breadmaking (Second edition), pp. 370–399.
6. Rodrigo Baravalle, Gustavo Ariel Patow, Claudio Delrieux (2015), Procedural bread making, Computers & Graphics, 50, pp. 13–24.
─── Food Technologies ───
─── Ukrainian Journal of Food Science. 2016. Volume 4. Issue 2 ─── 315
7. Gjore Nakov, Viktorija Stamatovska, Ljupka Necinova, Nastia Ivanova, Stanka Damyanova (2016), Sensor analysis of functional biscuits, Ukrainian Food Journal, 5(1), pp. 56–62.
8. Litovchenko I., Stefanov S., Hadzhiyski V. (2015), Investigation work proofers by computer simulation, Ukrainian Food Journal, 4(1), pp, 119-126.
9. Jérôme Bikard, Thierry Coupez, Guy Della Valle, Bruno Vergnes (2008), Simulation of bread making process using a direct 3D numerical method at microscale: Analysis of foaming phase during proofing, Journal of Food Engineering, 85(2), pp. 259–267
10. Małgorzata Wronkowska, Monika Jadacka, Maria Soral-Śmietana, Lidia Zander, Fabian Dajnowiec, Paweł Banaszczyk, Tomasz Jeliński, Beata Szmatowicz (2015), ACID whey concentrated by ultrafiltration a tool for modeling bread properties, LWT – Food Science and Technology, 61(1), pp. 172–176
11. O’Shea N., Rößle C., Arendt E., Gallagher E. (2015), Modelling the effects of orange pomace using response surface design for gluten-free bread baking, Food Chemistry, 166(1), pp. 223–230
12. Flick D., Doursat C., Grenier D., Lucas T. (2015), 5 – Modelling of baking processes, Modeling Food Processing Operations, pp. 129–161
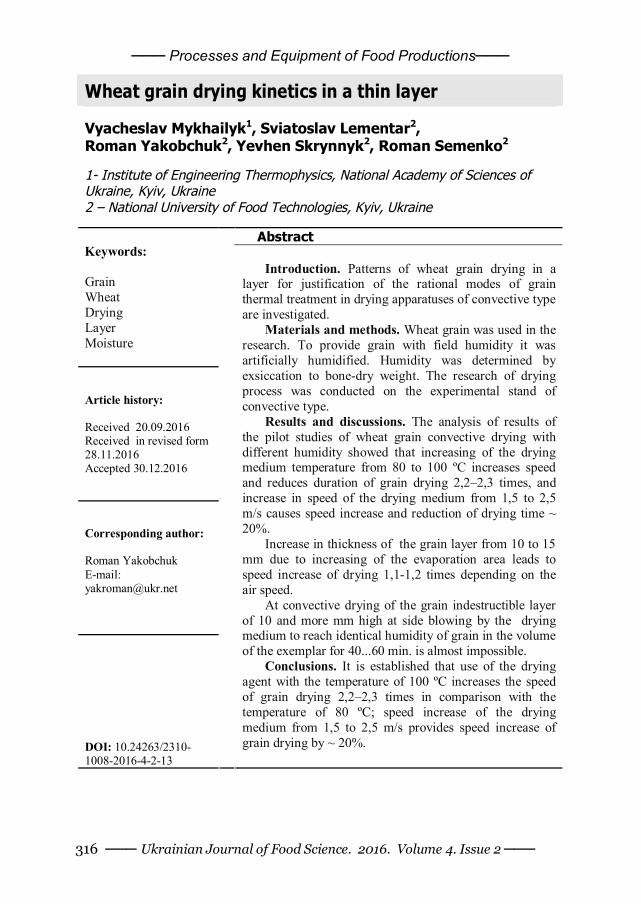
─── Processes and Equipment of Food Productions───
─── Ukrainian Journal of Food Science. 2016. Volume 4. Issue 2 ─── 316
Wheat grain drying kinetics in a thin layer
Vyacheslav Mykhailyk1, Sviatoslav Lementar2, Roman Yakobchuk2, Yevhen Skrynnyk2, Roman Semenko2 1- Institute of Engineering Thermophysics, National Academy of Sciences of Ukraine, Kyiv, Ukraine 2 – National University of Food Technologies, Kyiv, Ukraine
Abstract
Keywords:
Grain Wheat Drying Layer Moisture
Article history: Received 20.09.2016 Received in revised form 28.11.2016 Accepted 30.12.2016
Corresponding author: Roman Yakobchuk E-mail: [email protected]
DOI: 10.24263/2310-1008-2016-4-2-13
Introduction. Patterns of wheat grain drying in a
layer for justification of the rational modes of grain thermal treatment in drying apparatuses of convective type are investigated.
Materials and methods. Wheat grain was used in the research. To provide grain with field humidity it was artificially humidified. Humidity was determined by exsiccation to bone-dry weight. The research of drying process was conducted on the experimental stand of convective type.
Results and discussions. The analysis of results of the pilot studies of wheat grain convective drying with different humidity showed that increasing of the drying medium temperature from 80 to 100 ºС increases speed and reduces duration of grain drying 2,2–2,3 times, and increase in speed of the drying medium from 1,5 to 2,5 m/s causes speed increase and reduction of drying time ~ 20%.
Increase in thickness of the grain layer from 10 to 15 mm due to increasing of the evaporation area leads to speed increase of drying 1,1-1,2 times depending on the air speed.
At convective drying of the grain indestructible layer of 10 and more mm high at side blowing by the drying medium to reach identical humidity of grain in the volume of the exemplar for 40...60 min. is almost impossible.
Conclusions. It is established that use of the drying agent with the temperature of 100 ºС increases the speed of grain drying 2,2–2,3 times in comparison with the temperature of 80 ºС; speed increase of the drying medium from 1,5 to 2,5 m/s provides speed increase of grain drying by ~ 20%.
─── Processes and Equipment of Food Productions ───
─── Ukrainian Journal of Food Science. 2016. Volume 4. Issue 2 ─── 317
Introduction For development and improvement of small-size mobile grain-dryers of convective
type for small farms the problem of technological parameters determination of wheat grain drying in a layer (10...15 mm) aroses [8, 9, 10, 12].
It is possible to dry grain in the different ways [1, 2, 7, 8, 9, 13, 14]. The greatest practical use received a convective way with the rapid course of a thermal mass transfer in grain-dryers to the given humidity of grain. A delayed way applies less often, by means of aeration systems, the combined method is rare. In practice almost all wet grain of the reaped crops is dried in the high-speed way. From the total number of the grain-dryers at the enterprises most of all, to 70%, is the share of stationary dryers of the mine type with efficiency more than 10000 kg/hr. The efficiency of the majority of these dryers does not exceed 40 – 45%, and specific consumption of power supplies on drying of one tone of grain makes about 12,2 kg of standard fuel that is by 20 – 35% exceeded this index of leading companies analogs such as Shmidt-Zinger, Kembria, Riyela, Metgyuz-k, Pharm-fanz, GSI, ME, and so forth [3, 4, 5].
The use of heat carrier recycling is a perspective way of essential economy of power supplies. Uses of the drying agent with raised, at the expense of recycling, moisture content (from 8 to 30 g/kg dry air) at a temperature of 105 – 120С intensifies heating of grain and practically does not reduce intensity of the process in general for a cycle. At temperature of the drying agent up to 60 С (the seed mode) increase in moisture content of the drying agent up to 20 g/kg of the dry air causes the decrease of grain drying speed in the layer. It is also proved [5] that at 4 – 5 multiple circulation of grain, increase in grain moving speed 4,8 – 5,1 times provides the greatest effectiveness, at the same time efficiency of the dryer increases by 6 – 14%, evaporating ability – by 26 – 28%, and fuel consumption decrease by 24,4 – 29,7%.
The main indicators that influence intensity of process and achievement of high rates of grain quality are the temperature of the drying agent, the maximal temperature of grain and duration of drying. For the choice of the optimum drying mode it is necessary that the process of drying would provide high quality of material with minimum drying time. Parameters of drying process can influence differently on grain quality, depending on thermal resistance of its constituents.
As it is specified in [6] with the temperature increase of grain less gluten is washed, especially, when the temperature of the carrier is above 100 °C, and the heating temperature of grain is above 55 °C. The least amount of gluten was washed at the heat carrier temperature when drying at the level of 120 °C on exposure 60 min. (initial humidity of grain made 20 – 21%). With temperature increase of the heat carrier above 100 °C and extension of drying term the heating temperature of grain increased more than 50 – 55 °C that led to slight decrease of gluten and its strengthening in it. The increase in initial humidity of grain caused more considerable changes. The best index of gluten content was observed at the option of the air-and-sunshine drying, and also when drying at a temperature of 80 °C of the heat carrier.
Determination of technological parameters of grain drying process in a layer was the purpose of our research, quality indicators of dry grain were not taken into account.
It is apparent that it is also necessary to consider not only the maximal temperature of a product, but also speed of reaching it, that is heating rate, and also duration of endurance of a product at the maximal temperature. Besides, interaction of streams of the heat carrier and grain caused by design features of this dryer [7, 11] is important.
─── Processes and Equipment of Food Productions───
─── Ukrainian Journal of Food Science. 2016. Volume 4. Issue 2 ─── 318
Therefore, determination of patterns of grain drying process at variable parameters of process for justification of the rational modes of wheat grain thermal treatment in dryers was the purpose of the research.
Materials and methods The research object is drying process. For the research of convective grain drying
wheat with humidity of 9,1% was taken. For granting humidity to grain, close to humidity after collecting, it was placed in exsiccators with water for 14 days that provided its with humidification through adsorption to 13,6 – 18,1%. A part of grain was extra humidified with a spray and placed in an exsiccator with water for 24 hours that allowed to increase humidity to ~ 24,5 – 25,8%.
For comparison of curves of grain drying with various humidity the value of absolute moisture content (the relation of water mass to the mass of nonvolatile solids in percentage terms) was given to the dimensionless quantity (moisture content is given).
Grain after humidification was placed in the container (90х45х20 mm) made of a bolter with holes of 2,5х2,5 mm. In all experiments the container in a drying room was installed with the larger side along a flow of the drying medium. The grain layer height in the container was 10 and 15 mm. Drying was carried out at temperatures of the drying medium of 80, 90 and 100 °C at speed of 1,5 and 2,5 m/s. Such parameters were chosen because for the use of grain drying in mobile small-size fluidized-bed driers, tape and similar types – warming up of a product happens quickly. In such dryers there is an intensive washing of every seed that provides complete warming up of a grain layer.
At a heat carrier speed more than 3 m/s, there will be an influence on the weighing-machine, that will not allow to provide measurement accuracy of the material mass change while drying. Influence on the weighing-machine will not be carried out at side blowing also.
Researches were conducted at the experimental drying stand which scheme is submitted in Figure 1. The stand consists of the isolated air ducts system with devices for heating (2) and circulation (3) air (drying medium), drying rooms (1), system of automatic control and maintaining of temperature of drying medium (4, 5), data collection and processing about the course of the deaquation material process.
The drying room with side blowing has the transparent hatches via which loading of exemplars and overseeing the condition of material in the course of drying are carried out. The drying medium moves by means of a fan blower with the frequency regulation of the impeller turns number that allows to change moving speed of the heat carrier smoothly. The ratio between used and fresh air can be established with the express valves.
The air speed in the drying rooms was controlled by means of a cup anemometer MS-13. The temperature of the drying medium and the exemplar during drying time was recorded by means of the thermoelectric converters which are built in the express needle probes. Measurement accuracy of temperature is not worse than 0,1 °C. Calibration of thermoelectric converters was carried out on the boiling water.
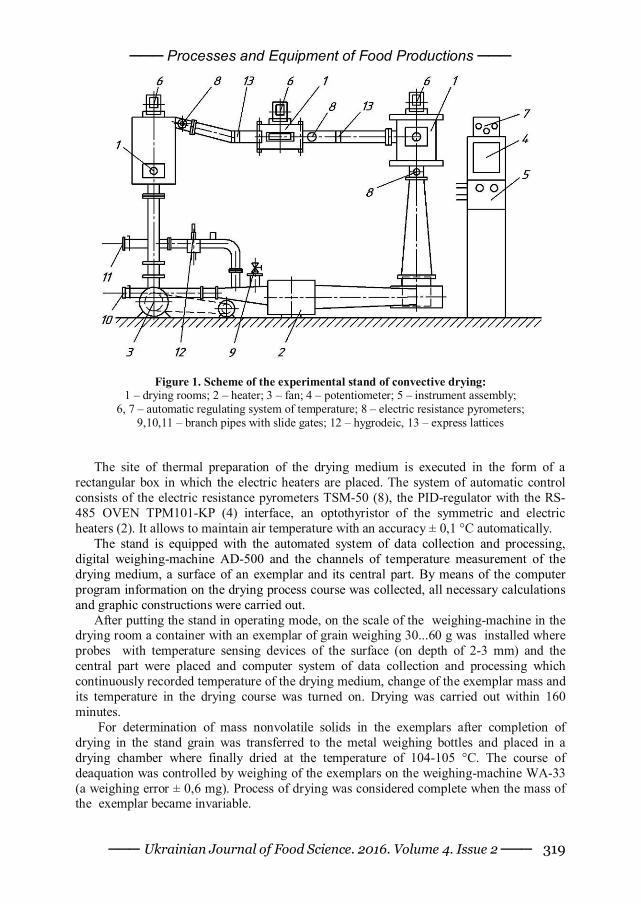
─── Processes and Equipment of Food Productions ───
─── Ukrainian Journal of Food Science. 2016. Volume 4. Issue 2 ─── 319
Figure 1. Scheme of the experimental stand of convective drying: 1 – drying rooms; 2 – heater; 3 – fan; 4 – potentiometer; 5 – instrument assembly;
6, 7 – automatic regulating system of temperature; 8 – electric resistance pyrometers; 9,10,11 – branch pipes with slide gates; 12 – hygrodeic, 13 – express lattices
The site of thermal preparation of the drying medium is executed in the form of a rectangular box in which the electric heaters are placed. The system of automatic control consists of the electric resistance pyrometers TSM-50 (8), the PID-regulator with the RS-485 OVEN TPM101-KP (4) interface, an optothyristor of the symmetric and electric heaters (2). It allows to maintain air temperature with an accuracy ± 0,1 °C automatically.
The stand is equipped with the automated system of data collection and processing, digital weighing-machine AD-500 and the channels of temperature measurement of the drying medium, a surface of an exemplar and its central part. By means of the computer program information on the drying process course was collected, all necessary calculations and graphic constructions were carried out.
After putting the stand in operating mode, on the scale of the weighing-machine in the drying room a container with an exemplar of grain weighing 30...60 g was installed where probes with temperature sensing devices of the surface (on depth of 2-3 mm) and the central part were placed and computer system of data collection and processing which continuously recorded temperature of the drying medium, change of the exemplar mass and its temperature in the drying course was turned on. Drying was carried out within 160 minutes.
For determination of mass nonvolatile solids in the exemplars after completion of drying in the stand grain was transferred to the metal weighing bottles and placed in a drying chamber where finally dried at the temperature of 104-105 °C. The course of deaquation was controlled by weighing of the exemplars on the weighing-machine WA-33 (a weighing error ± 0,6 mg). Process of drying was considered complete when the mass of the exemplar became invariable.
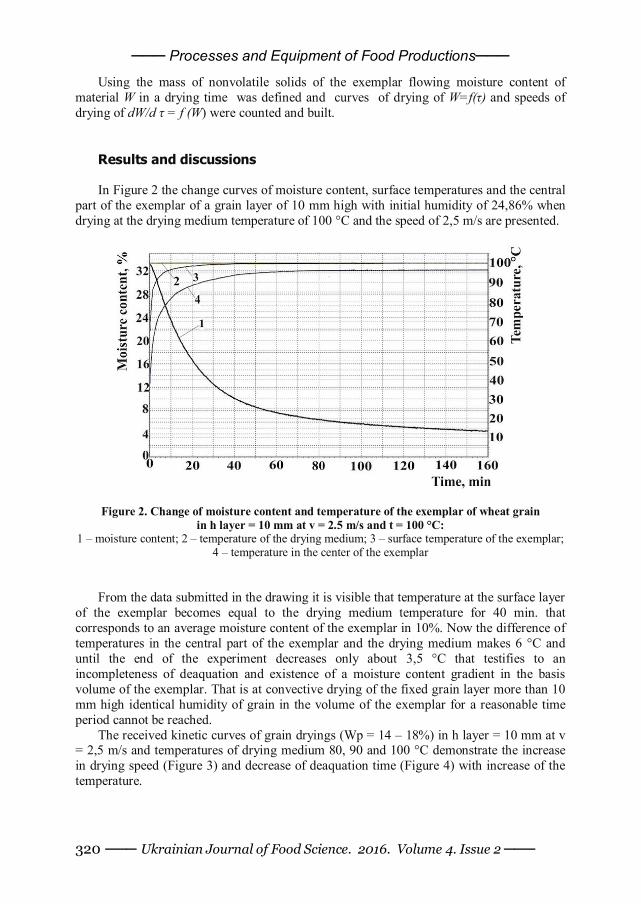
─── Processes and Equipment of Food Productions───
─── Ukrainian Journal of Food Science. 2016. Volume 4. Issue 2 ─── 320
Using the mass of nonvolatile solids of the exemplar flowing moisture content of material W in a drying time was defined and curves of drying of W=f(τ) and speeds of drying of dW/d τ = f (W) were counted and built.
Results and discussions In Figure 2 the change curves of moisture content, surface temperatures and the central
part of the exemplar of a grain layer of 10 mm high with initial humidity of 24,86% when drying at the drying medium temperature of 100 °C and the speed of 2,5 m/s are presented.
Figure 2. Change of moisture content and temperature of the exemplar of wheat grain in h layer = 10 mm at v = 2.5 m/s and t = 100 °C:
1 – moisture content; 2 – temperature of the drying medium; 3 – surface temperature of the exemplar; 4 – temperature in the center of the exemplar
From the data submitted in the drawing it is visible that temperature at the surface layer of the exemplar becomes equal to the drying medium temperature for 40 min. that corresponds to an average moisture content of the exemplar in 10%. Now the difference of temperatures in the central part of the exemplar and the drying medium makes 6 °C and until the end of the experiment decreases only about 3,5 °C that testifies to an incompleteness of deaquation and existence of a moisture content gradient in the basis volume of the exemplar. That is at convective drying of the fixed grain layer more than 10 mm high identical humidity of grain in the volume of the exemplar for a reasonable time period cannot be reached.
The received kinetic curves of grain dryings (Wp = 14 – 18%) in h layer = 10 mm at v = 2,5 m/s and temperatures of drying medium 80, 90 and 100 °C demonstrate the increase in drying speed (Figure 3) and decrease of deaquation time (Figure 4) with increase of the temperature.
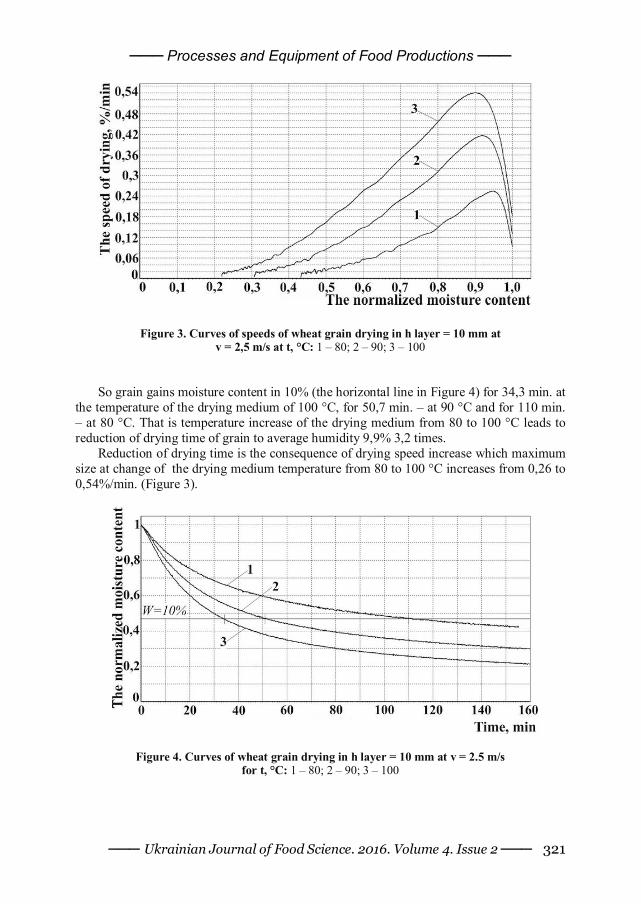
─── Processes and Equipment of Food Productions ───
─── Ukrainian Journal of Food Science. 2016. Volume 4. Issue 2 ─── 321
Figure 3. Curves of speeds of wheat grain drying in h layer = 10 mm at v = 2,5 m/s at t, °C: 1 – 80; 2 – 90; 3 – 100
So grain gains moisture content in 10% (the horizontal line in Figure 4) for 34,3 min. at
the temperature of the drying medium of 100 °C, for 50,7 min. – at 90 °C and for 110 min. – at 80 °C. That is temperature increase of the drying medium from 80 to 100 °C leads to reduction of drying time of grain to average humidity 9,9% 3,2 times.
Reduction of drying time is the consequence of drying speed increase which maximum size at change of the drying medium temperature from 80 to 100 °C increases from 0,26 to 0,54%/min. (Figure 3).
Figure 4. Curves of wheat grain drying in h layer = 10 mm at v = 2.5 m/s for t, °C: 1 – 80; 2 – 90; 3 – 100
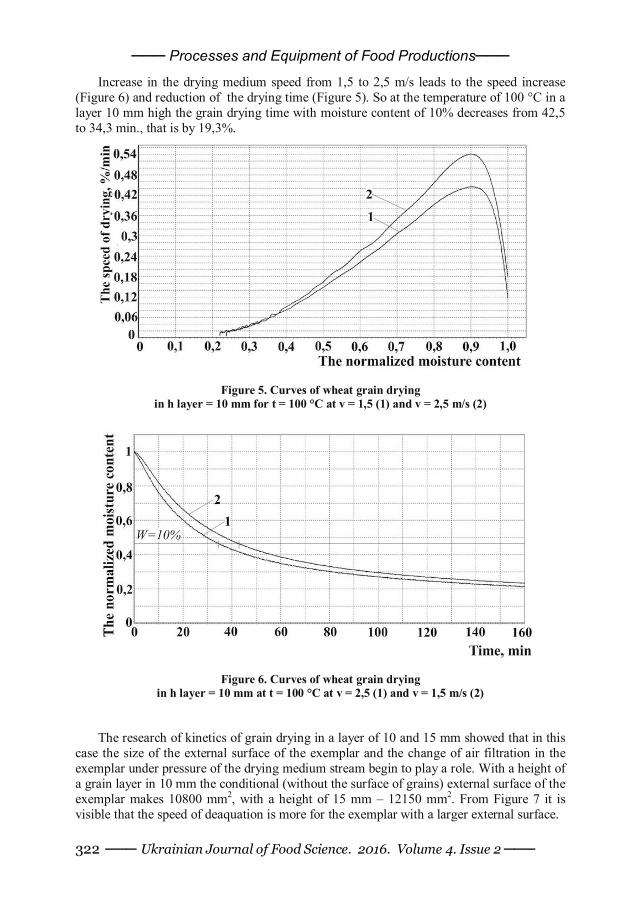
─── Processes and Equipment of Food Productions───
─── Ukrainian Journal of Food Science. 2016. Volume 4. Issue 2 ─── 322
Increase in the drying medium speed from 1,5 to 2,5 m/s leads to the speed increase (Figure 6) and reduction of the drying time (Figure 5). So at the temperature of 100 °C in a layer 10 mm high the grain drying time with moisture content of 10% decreases from 42,5 to 34,3 min., that is by 19,3%.
Figure 5. Curves of wheat grain drying in h layer = 10 mm for t = 100 °C at v = 1,5 (1) and v = 2,5 m/s (2)
Figure 6. Curves of wheat grain drying in h layer = 10 mm at t = 100 °C at v = 2,5 (1) and v = 1,5 m/s (2)
The research of kinetics of grain drying in a layer of 10 and 15 mm showed that in this
case the size of the external surface of the exemplar and the change of air filtration in the exemplar under pressure of the drying medium stream begin to play a role. With a height of a grain layer in 10 mm the conditional (without the surface of grains) external surface of the exemplar makes 10800 mm2, with a height of 15 mm – 12150 mm2. From Figure 7 it is visible that the speed of deaquation is more for the exemplar with a larger external surface.
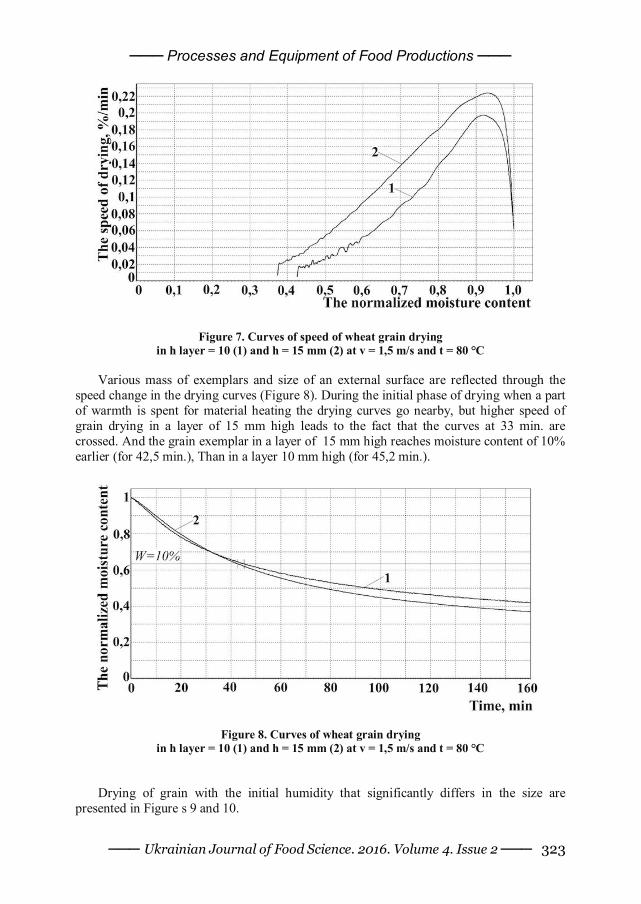
─── Processes and Equipment of Food Productions ───
─── Ukrainian Journal of Food Science. 2016. Volume 4. Issue 2 ─── 323
Figure 7. Curves of speed of wheat grain drying in h layer = 10 (1) and h = 15 mm (2) at v = 1,5 m/s and t = 80 °C
Various mass of exemplars and size of an external surface are reflected through the
speed change in the drying curves (Figure 8). During the initial phase of drying when a part of warmth is spent for material heating the drying curves go nearby, but higher speed of grain drying in a layer of 15 mm high leads to the fact that the curves at 33 min. are crossed. And the grain exemplar in a layer of 15 mm high reaches moisture content of 10% earlier (for 42,5 min.), Than in a layer 10 mm high (for 45,2 min.).
Figure 8. Curves of wheat grain drying in h layer = 10 (1) and h = 15 mm (2) at v = 1,5 m/s and t = 80 °C
Drying of grain with the initial humidity that significantly differs in the size are presented in Figure s 9 and 10.
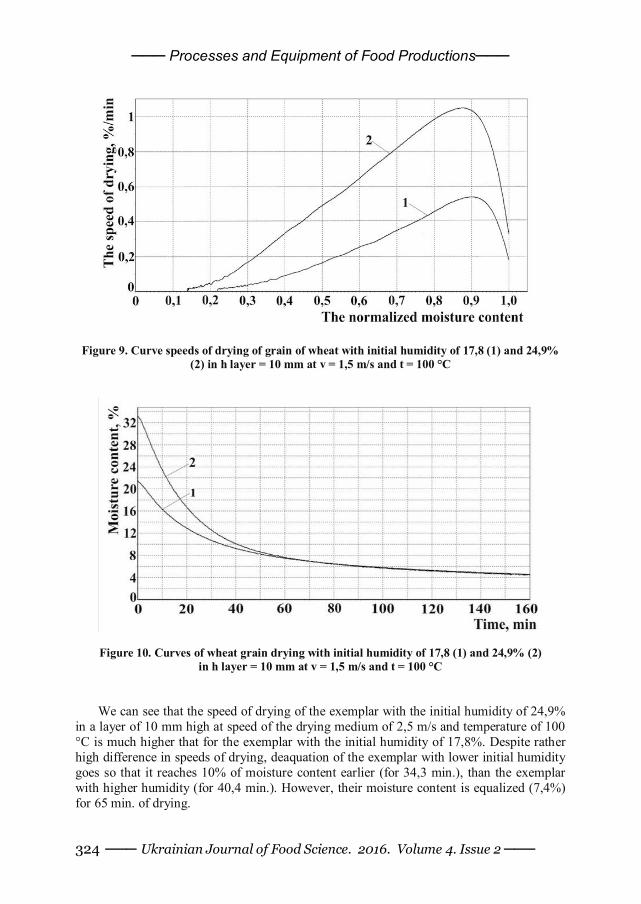
─── Processes and Equipment of Food Productions───
─── Ukrainian Journal of Food Science. 2016. Volume 4. Issue 2 ─── 324
Figure 9. Curve speeds of drying of grain of wheat with initial humidity of 17,8 (1) and 24,9% (2) in h layer = 10 mm at v = 1,5 m/s and t = 100 °C
Figure 10. Curves of wheat grain drying with initial humidity of 17,8 (1) and 24,9% (2) in h layer = 10 mm at v = 1,5 m/s and t = 100 °C
We can see that the speed of drying of the exemplar with the initial humidity of 24,9%
in a layer of 10 mm high at speed of the drying medium of 2,5 m/s and temperature of 100 °C is much higher that for the exemplar with the initial humidity of 17,8%. Despite rather high difference in speeds of drying, deaquation of the exemplar with lower initial humidity goes so that it reaches 10% of moisture content earlier (for 34,3 min.), than the exemplar with higher humidity (for 40,4 min.). However, their moisture content is equalized (7,4%) for 65 min. of drying.
─── Processes and Equipment of Food Productions ───
─── Ukrainian Journal of Food Science. 2016. Volume 4. Issue 2 ─── 325
The received results of the pilot studies of convective wheat grain drying allowed to establish dependences of duration and speed of drying on parameters of the heat carrier and characteristics of starting material (wheat grain). These results can be used for development new and improvement of the existing mobile small-size drying equipment for grain crops drying.
Legends: W – moisture content of grain, g of water/g of nonvolatile solids in %; v – speed of drying medium, m/s; t – temperature of drying medium, °C; h – height of a grain layer , mm; wi – initial humidity of grain, %. Conclusions The pilot studies of convective wheat grain drying in a layer showed positive influence
on the drying kinetics temperature increase and speeds of the drying medium: – temperature increase of the drying medium from 80 to 100 °C increases speed and
reduces duration of grain drying 2,2 – 2,3 times; – increase in speed of the drying medium from 1,5 to 2,5 m/s causes speed increase and
reduction of the drying time ~ 20% Increase in thickness of the grain layer from 10 to 15 mm due to increase in the
evaporation area leads to increase in speed of drying 1,1 – 1,2 times depending on the air speed.
Due to a moisture content gradient in the volume of the exemplar in the fixed state arising at convective wheat grain drying of 10 and more mm high with a side blowing by the drying medium to reach identical humidity of grain in the volume of the exemplar for 40...60 min. is almost impossible.
Influence of temperature (in limits of 80 – 100ºС) and speeds of the drying medium (within 1,5 – 2,5 m/s) on the speed of the grain side layer drying of 10 and 15 mm thick was defined for the first time.
References 1. Malin N.I., Veselovskaja T.I. (2001), Teoreticheskie osnovy tehnologicheskih
processov [Theoretical bases of technological processes], Hleboprodinform, Moscow.
2. Maier D.E., Bakker-Arkema F.W. (2002), Grain drying systems. In: Proceedings of the 2002 Facility Design Conference of the Grain Elevator & Processing Society, St. Charles, IL, July 28–31, 2002, pp. 1–53.
3. Haponyuk I.I (2009), Udoskonalennya tekhnolohiyi sushinnya zerna [Improving the technology of grain drying], Polihraf, Odesa.
4. Lisets'kyy V.O., Kotov B.I. (2001), Pidvyshchennya enerhetychnoyi efektyvnosti zernosusharok [Improving the energy efficiency of dryers], Agricultural Machinery, 9, pp. 104–109.
5. Kotov B.I., Lisets'kyy V.O. (2001), Analiz vplyvu rezhymu sushinnya zerna na enerhetychni kharakterystyky zernosusharok [Analysis of the influence of grain drying mode on the energy characteristics of grain dryers], Bulletin of Kharkiv State Technical University of Agriculture, 8, pp. 166–170.
─── Processes and Equipment of Food Productions───
─── Ukrainian Journal of Food Science. 2016. Volume 4. Issue 2 ─── 326
6. Kovalenko O.A., Kosovska N.V. (2012), Vplyv rezhymiv sushinnya zerna pshenytsi ozymoyi na pokaznyky yoho prodovol'chykh i nasinnyevykh yakostey [Influence of drying modes of winter wheat in the performance of its food and seed quality], Proceedings of Petro Mohyla Black Sea State University complex "Kyiv-Mohyla Academy",179(no. 167), pp. 68–72.
7. Scaar H., Franke G., Weigler F., Delele M.A., Tsotsas E., Mellmann J. (2016), Experimental and numerical study of the airflow distribution during mixed-flow grain drying, Drying Technology 34(5), pp. 595–607,
http://www.doi.org/10.1080/07373937.2015.1064946 8. Yakobchuk R. (2014), The influence of design parameters of rotary dryer on
sunflower seeds drying, Ukrainian Food Journal 3(3), pp. 437–445. 9. Pokhozhaiev O., Yakobchuk R. (2014), Improvement of drying process of beer
pellet in the fluidized bed apparatus, Ukrainian Journal of Food Science 2(2), pp. 296–304.
10. Debabandya Mohapatra, P. Srinivasa Rao (2005), A thin layer drying model of parboiled wheat, Journal of Food Engineering, 66(4), pp. 513-518, http://dx.doi.org/10.1016/j.jfoodeng.2004.04.023
11. Fabian Weigler, Jochen Mellmann (2014), Investigation of grain mass flow in a mixed flow dryer, Particuology 12, pp. 33–39,
http://dx.doi.org/10.1016/j.partic.2013.04.004 12. Sivakumar R., Saravanan R., Elaya Perumal A., Iniyan S. (2016), Fluidized bed
drying of some agro products – A review, Renewable and Sustainable Energy Reviews 61, pp. 280–301, http://dx.doi.org/10.1016/j.rser.2016.04.014
13. Al-Mahasneh M.A., Rababah T.M., Bani-Amer M.M., Al-Omari N.M., Mahasneh M.K. (2013), Fuzzy and conventional modeling of open sun drying kinetics for roasted green wheat, International Journal of Food Properties, 16(1), pp. 70–80, http://dx.doi.org/10.1080/10942912.2010.528108
14. Haydar Kucuk, Adnan Midilli, Aydin Kilic, Ibrahim Dincer (2014), A review on thin-layer drying-curve equations, Drying Technology An International Journal, 32(7), pp. 757–773, http://dx.doi.org/10.1080/07373937.2013.873047
─── Processes and Equipment of Food Productions ───
─── Ukrainian Journal of Food Science. 2016. Volume 4. Issue 2 ─── 327
Engineering method for calculating the parameters of flue gas parameters of coal-fired thermal power plants based on solid fuel characteristics
Igor Volchyn1, Liudmyla Haponych2 1 – Coal Energy Technology Institute, Kyiv, Ukraine 2 – National University of Food Technologies, Kyiv, Ukraine
Abstract
Keywords: Power Industry Environment Thermal Flue gas Emission Sulfur dioxide Article history: Received 29.09.2016 Received in revised form 30.11.2016 Accepted 30.12.2016
Corresponding author: Liudmyla Haponych E-mail: [email protected]
DOI: 10.24263/2310-1008-2016-4-2-14
Introduction. The increase in coal share in the fuel balance of
thermal power plants has led to increasing the SO2 annual gross emissions to about 1 million tons. This fact require to introduce technological measures for the reduction of SO2 emission at coal-fired thermal power plants.
Materials and Methods. Using a standard procedure, we have performed calculations of the specific flue gases volumes and SO2 concentrations in them by the data of 96 certificates for coal products from mines and concentrating plants of the Donetsk coal basin.
Results and Discussion. As a result, we have obtained empirical linear dependences of the specific volume of dry flue gases on lower heating value and ash content in the fuel and dependences of SO2 concentration on sulfur and ash content in the fuel, which are different for low-reactive and high-reactive coals. In the case of presence of unburned carbon, the specific volume of dry flue gases decreases by a factor of (1 – qu/100), and SO2 concentration in them increases in the same proportion.
We have created an engineering method for determining the specific volume of dry flue gases of coal-fired boilers and expected SO2 concentration in them based on the data of coal technical analysis in the presence of the heat loss due to unburnt carbon. The method of the specific emissions’ calculation at the TPPs and CHPs and the sulphur dioxide concentration expected in it is proposed to use in a range of the fuel ash content Ad from 4.0 to 50.0% and the fuel low heat value Qi
r from 14.5 to 32.0 MJ/kg. The proposed engineering method has been used for
calculating an estimate of the gross SO2 emissions and volumes of dry flue gases at the Ukrainian coal-fired thermal power plants from 2012 to 2016. The values of sulfur specific emission in flue gases during recent years are at a level of 16–20 grams per kilowatt-hour (kW-h) of electricity supplied.
Conclusions. The method developed allows to make the evaluation of the sulphur dioxide emission expected on the basis of the technical analysis data and choose necessary desulphurization technology to meet the environment legislation requirements.
─── Processes and Equipment of Food Productions───
─── Ukrainian Journal of Food Science. 2016. Volume 4. Issue 2 ─── 328
Introduction The problem of emissions reduction of contaminants from flue gas formed by burning
of solid fuels at Thermal Power Plants (TPPs) and Combined Heat and Power Plants (CHPs) is of large environmental, technological, and economical importance. In recent years, 90% of SO2 emission in Ukraine falls on thermal power industry. The coal share increasing in fuel balance of TPPs to 98% and in fuel balance of large-scale CHPs’ to 20% led to increasing of the SO2 annual gross emissions to near 1 million tons [1]. The current SO2 permissible emissions standards are practically determined on the basis of the fuel quality that is supplied to the TPPs of Ukraine, and the burning technology. The emission limit values of SO2 from the large existing coal-dust boilers are 3400 milligrams per cubic meter under normal conditions (0 °C and 101.325 kPa) and 6% oxygen content in dry gas (mg/mn
3) for anthracite (A), 4500 mg/mn3 for semi-anthracite (SA) and 5100 mg/mn
3 for bituminous (B), subbituminous (SB) coal and lignite. For solid fuel combustion in the circulating fluidized bed, the emission limit value of the sulfur dioxide is 400 mg/mn
3. The current permissible SO2 emission limit values are valid until December, 31, 2017.
The Ukraine as a Member of the Energy Community should provide since January, 1, 2018 the compliance of the output sulfur dioxide concentration in the flue gas from the existing coal-fired TPPs and CHPs not more than 400 mg/mn
3, but for new power units – 200 mg/mn
3 as required by the Directive 2001/80/EU. Nowadays, the level of the SO2 emissions at TPPs of Ukraine exceeds these limit values in 5–17 times [1]. The payment for SO2 emissions exceeded 1.2 billion UAH (106.5 million USD) in 2014, 1.6 billion UAH (74 million USD) in 2015 and 2.0 billion UAH (76.8 million USD) in 2016.
Besides, the Ukraine’s economy bears huge social and economic losses due to deterioration of the health status of the population living at the territories adjacent to the coal-fired boilers, and continuous increase of costs for health care. Contaminants emission will lead to significant increase of general level of mortality. It will increase the number of cardio-pneumatic diseases and lung cancer to 68% of total mortality from all diseases (according to the International Centre for Policy Studies). According to the estimates of World Health Organization, increase of average SO2 daily concentration in the atmosphere by 10 μg/m3 leads to an increase in the total mortality by 0.6%, from respiratory diseases – for 1.2%, from heart diseases – for 0.6%. In 2012, about 3.7 million additional events of the death are connected with air pollution from the stationary sources. The level of the additional deaths due to air pollution in Ukraine reaches 30 thousand persons per year, and following our estimates, the number of the additional deaths due to pollution by SO2 reaches 11 thousand people per year.
In Ukraine, the annual volume of the direct medical costs for treatment due to diseases caused by air pollution exceeds 125 million USD (according to the International Centre for Policy Studies). Taking into account the negative influence of the SO2 on human health and environment, introduction of the measures to reduce sulfur dioxide emissions at TPPs and CHPs is necessary.
Thus, the interest is the issue of the assessment of SO2 output concentration in dry flue gas based on the fuel characteristics. This will select the sources of supply of coal of the need quality into power plant and choose the desulphurization technology.
The purpose of this work was to develop an engineering method creation to calculate specific dry flue gas volumes at TPPs and CHPs and the sulfur dioxide concentration expected in the flue gas.
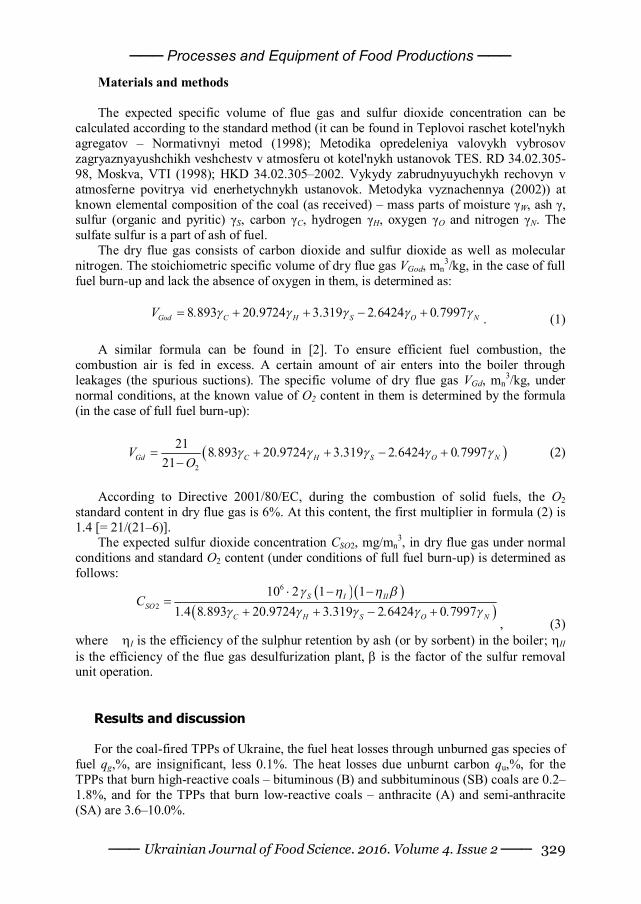
─── Processes and Equipment of Food Productions ───
─── Ukrainian Journal of Food Science. 2016. Volume 4. Issue 2 ─── 329
Materials and methods The expected specific volume of flue gas and sulfur dioxide concentration can be
calculated according to the standard method (it can be found in Teplovoi raschet kotel'nykh agregatov – Normativnyi metod (1998); Metodika opredeleniya valovykh vybrosov zagryaznyayushchikh veshchestv v atmosferu ot kotel'nykh ustanovok TES. RD 34.02.305-98, Moskva, VTI (1998); HKD 34.02.305–2002. Vykydy zabrudnyuyuchykh rechovyn v atmosferne povitrya vid enerhetychnykh ustanovok. Metodyka vyznachennya (2002)) at known elemental composition of the coal (as received) – mass parts of moisture γW, ash γ, sulfur (organic and pyritic) γS, carbon γC, hydrogen γH, oxygen γO and nitrogen γN. The sulfate sulfur is a part of ash of fuel.
The dry flue gas consists of carbon dioxide and sulfur dioxide as well as molecular nitrogen. The stoichiometric specific volume of dry flue gas VGod, mn
3/kg, in the case of full fuel burn-up and lack the absence of oxygen in them, is determined as:
8 893 20.9724 3.319 2 6424 0 7997God C H S O NV . . . . (1)
A similar formula can be found in [2]. To ensure efficient fuel combustion, the
combustion air is fed in excess. A certain amount of air enters into the boiler through leakages (the spurious suctions). The specific volume of dry flue gas VGd, mn
3/kg, under normal conditions, at the known value of O2 content in them is determined by the formula (in the case of full fuel burn-up):
2
21 8 893 20.9724 3.319 2 6424 0 799721Gd C H S O NV . . .
O
(2)
According to Directive 2001/80/EC, during the combustion of solid fuels, the O2
standard content in dry flue gas is 6%. At this content, the first multiplier in formula (2) is 1.4 [= 21/(21–6)].
The expected sulfur dioxide concentration CSO2, mg/mn3, in dry flue gas under normal
conditions and standard O2 content (under conditions of full fuel burn-up) is determined as follows:
6
2
10 2 1 11 4 8 893 20.9724 3.319 2 6424 0 7997
S I IISO
C H S O N
C. . . .
, (3)
where I is the efficiency of the sulphur retention by ash (or by sorbent) in the boiler; II is the efficiency of the flue gas desulfurization plant, is the factor of the sulfur removal unit operation.
Results and discussion For the coal-fired TPPs of Ukraine, the fuel heat losses through unburned gas species of
fuel qg,%, are insignificant, less 0.1%. The heat losses due unburnt carbon qu,%, for the TPPs that burn high-reactive coals – bituminous (B) and subbituminous (SB) coals are 0.2–1.8%, and for the TPPs that burn low-reactive coals – anthracite (A) and semi-anthracite (SA) are 3.6–10.0%.
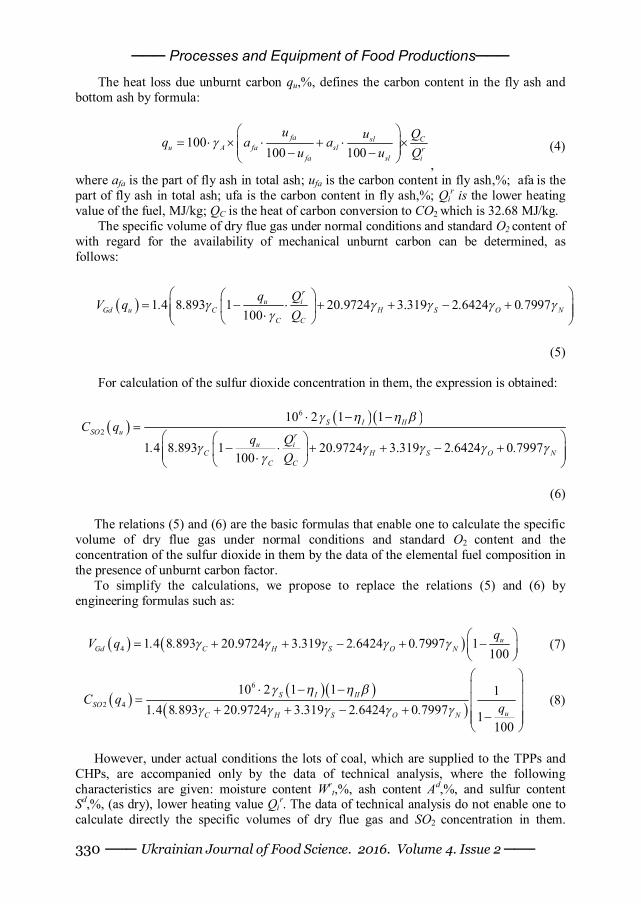
─── Processes and Equipment of Food Productions───
─── Ukrainian Journal of Food Science. 2016. Volume 4. Issue 2 ─── 330
The heat loss due unburnt carbon qu,%, defines the carbon content in the fly ash and bottom ash by formula:
100100 100
fa sl Cu A fa sl r
fa sl i
u u Qq a au u Q
,
(4)
where afa is the part of fly ash in total ash; ufa is the carbon content in fly ash,%; afa is the part of fly ash in total ash; ufa is the carbon content in fly ash,%; Qi
r is the lower heating value of the fuel, MJ/kg; QС is the heat of carbon conversion to CO2 which is 32.68 MJ/kg.
The specific volume of dry flue gas under normal conditions and standard O2 content of with regard for the availability of mechanical unburnt carbon can be determined, as follows:
1 4 8.893 1 20.9724 3.319 2 6424 0 7997100
ru i
Gd u C H S O NC C
q QV q . . .Q
(5)
For calculation of the sulfur dioxide concentration in them, the expression is obtained:
6
2
10 2 1 1
1 4 8.893 1 20.9724 3.319 2 6424 0 7997100
S I IISO u r
u iC H S O N
C C
C qq Q. . .
Q
(6)
The relations (5) and (6) are the basic formulas that enable one to calculate the specific
volume of dry flue gas under normal conditions and standard O2 content and the concentration of the sulfur dioxide in them by the data of the elemental fuel composition in the presence of unburnt carbon factor.
To simplify the calculations, we propose to replace the relations (5) and (6) by engineering formulas such as:
4 1 4 8 893 20.9724 3.319 2 6424 0 7997 1100
uGd C H S O N
qV q . . . .
(7)
6
2 4
10 2 1 1 11 4 8 893 20.9724 3.319 2 6424 0 7997 1
100
S I IISO
uC H S O N
C qq. . . .
(8)
However, under actual conditions the lots of coal, which are supplied to the TPPs and
CHPs, are accompanied only by the data of technical analysis, where the following characteristics are given: moisture content Wr
t,%, ash content Ad,%, and sulfur content Sd,%, (as dry), lower heating value Qi
r. The data of technical analysis do not enable one to calculate directly the specific volumes of dry flue gas and SO2 concentration in them.
─── Processes and Equipment of Food Productions ───
─── Ukrainian Journal of Food Science. 2016. Volume 4. Issue 2 ─── 331
Therefore, our method of calculating the expected specific volumes of dry flue gas and SO2 concentration sulfur uses only the data of the technical analysis.
The calculations of the specific volumes of the dry flue gas and concentrations of the sulfur dioxide are made following the data of 96 certificates for coal products from mines and processing plants of Donetsk coal basin, for samples of high-reactive and low-reactive coals. The given certificates are drawn up and approved by the Ukrainian Coal Reaching Institute, Luhansk. The elemental composition for each fuel sample was determined on the basis of such certificates. In the Certificate in particular the characteristics are defined, as follows: the coal rank, the production name (class), the volatile content Vdaf (as dry ash free),%, the ash content Ad (as dry),%, the total sulfur St
d,%, higher heating value Qidaf,
MJ/kg, the total moisture content Wtr,%, the pyritic sulfur Sp
d,%, the sulfate sulfur Ssd,%, the
low heat value, the organic carbon Cdaf,%, the organic hydrogen to Hdaf,%, the organic sulfur So
daf,%, the nitrogen and oxygen (N+O)daf,%, etc. I.e., the calculations were carried out in according the standard procedure as per formulas (1)–(4) following the present certificates.
The results of the calculation of the specific volume of the dry flue gas for the samples of the high-reactive and low-reactive coal provided full fuel burn-up (q4 = 0) are shown in Figure 1 and Figure 2. It is specified, that the dependence of the specific volume of the dry flue gas VGd, mn
3/kg, from the fuel lower heating value Qir, MJ/kg, has linear character (Fig.1):
VGd = KQir, (9)
where K – the factor that depends on coal metamorphism degree, mn3/MJ.
The K values for bituminous coal and separately for high-reactive (B, SB) and low-reactive (A, SA) coals, are determined. The factor received by us, are well agreed with sources published. Specifically, the K = 0.358 mn
3/MJ is used for the high-reactive coal in the National Emission Reduction Plans (NERP) of the Limited Gross Emissions Calculation Rules.
The value of the K factor for high-reactive Donetsk coals is similar to European value. For coal-fired boilers that burn low-reactive Donetsk coals, to calculate the volume of dry flue gas need to use the local factor K = 0.368 mn
3/MJ. The difference in the K values for the high-reactive and low-reactive coals could be explained by high content of hydrogen and oxygen in the high-reactive coals in comparison with the low-reactive coals. Therefore, lower values of the specific volumes of dry flue gas are typical for the high-reactive fuel (see the Figure 1).
─── Processes and Equipment of Food Productions───
─── Ukrainian Journal of Food Science. 2016. Volume 4. Issue 2 ─── 332
5
7
9
11
13
14 17 20 23 26 29 32
1
2
VGd, mn3/kg
LHV, MJ/kg
Figure 1. The dependence of the specific volume calculated of the dry flue gas formed under coal combustion, from lower heating value (LHV) of the fuel: 1 – low-reactive coal (A, SA), 2 –
high-reactive coal (B, SB)
4
6
8
10
12
0 10 20 30 40 50 Ad, %
1
2
VGd, mn3/kg
Figure 2. The dependence of the specific volume calculated of the dry flue gas formed under
coal combustion, from ash content: 1 – low-reactive coal (A, SA), 2 – high-reactive coal (B, SB)
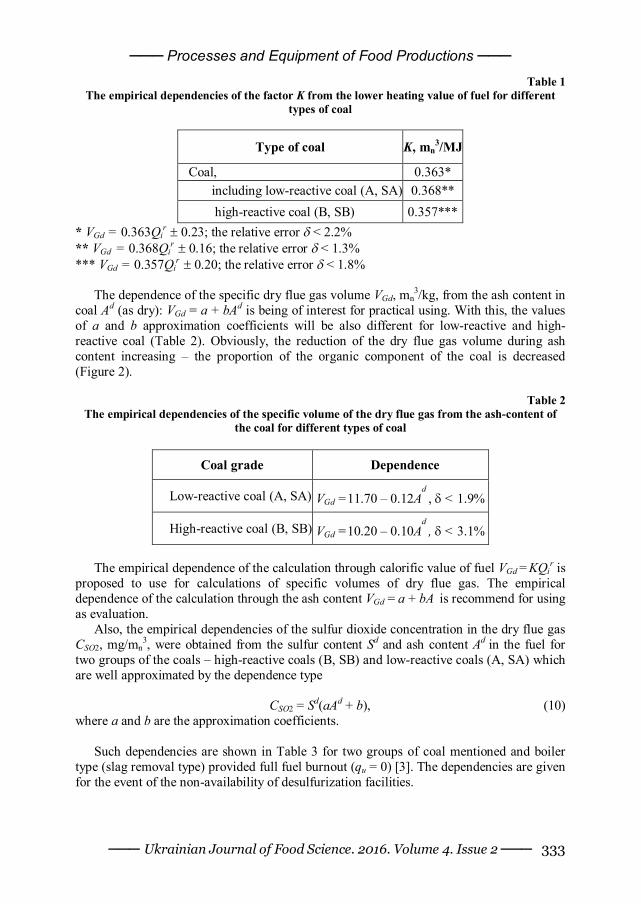
─── Processes and Equipment of Food Productions ───
─── Ukrainian Journal of Food Science. 2016. Volume 4. Issue 2 ─── 333
Table 1 The empirical dependencies of the factor K from the lower heating value of fuel for different
types of coal
Type of coal K, mn3/MJ
Coal, 0.363* including low-reactive coal (A, SA) 0.368** high-reactive coal (B, SB) 0.357***
* VGd = 0.363Qir 0.23; the relative error < 2.2%
** VGd = 0.368Qir 0.16; the relative error < 1.3%
*** VGd = 0.357Qir 0.20; the relative error < 1.8%
The dependence of the specific dry flue gas volume VGd, mn
3/kg, from the ash content in coal Ad (as dry): VGd = a + bAd is being of interest for practical using. With this, the values of a and b approximation coefficients will be also different for low-reactive and high-reactive coal (Table 2). Obviously, the reduction of the dry flue gas volume during ash content increasing – the proportion of the organic component of the coal is decreased (Figure 2).
Table 2
The empirical dependencies of the specific volume of the dry flue gas from the ash-content of the coal for different types of coal
Coal grade Dependence
Low-reactive coal (A, SA) VGd =11.70 – 0.12Ad
, < 1.9%
High-reactive coal (B, SB) VGd =10.20 – 0.10Ad
, < 3.1% The empirical dependence of the calculation through calorific value of fuel VGd = KQi
r is proposed to use for calculations of specific volumes of dry flue gas. The empirical dependence of the calculation through the ash content VGd = a + bA is recommend for using as evaluation.
Also, the empirical dependencies of the sulfur dioxide concentration in the dry flue gas CSO2, mg/mn
3, were obtained from the sulfur content Sd and ash content Ad in the fuel for two groups of the coals – high-reactive coals (B, SB) and low-reactive coals (A, SA) which are well approximated by the dependence type
CSO2 = Sd(aAd + b), (10)
where a and b are the approximation coefficients.
Such dependencies are shown in Table 3 for two groups of coal mentioned and boiler type (slag removal type) provided full fuel burnout (qu = 0) [3]. The dependencies are given for the event of the non-availability of desulfurization facilities.
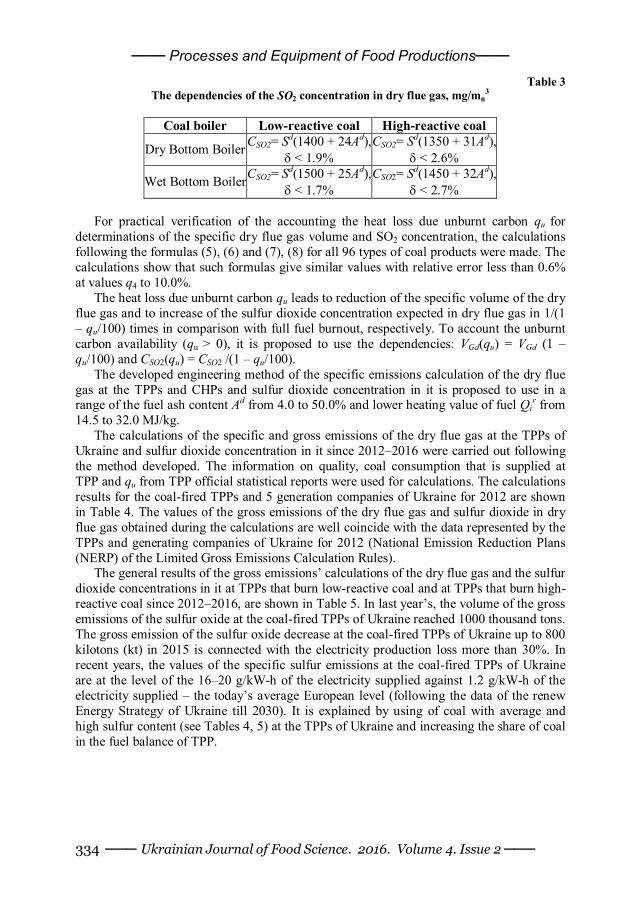
─── Processes and Equipment of Food Productions───
─── Ukrainian Journal of Food Science. 2016. Volume 4. Issue 2 ─── 334
Table 3 The dependencies of the SO2 concentration in dry flue gas, mg/mn
3
Coal boiler Low-reactive coal High-reactive coal
Dry Bottom Boiler CSO2= Sd(1400 + 24Ad), < 1.9%
CSO2= Sd(1350 + 31Ad), < 2.6%
Wet Bottom BoilerCSO2= Sd(1500 + 25Ad), < 1.7%
CSO2= Sd(1450 + 32Ad), < 2.7%
For practical verification of the accounting the heat loss due unburnt carbon qu for
determinations of the specific dry flue gas volume and SO2 concentration, the calculations following the formulas (5), (6) and (7), (8) for all 96 types of coal products were made. The calculations show that such formulas give similar values with relative error less than 0.6% at values q4 to 10.0%.
The heat loss due unburnt carbon qu leads to reduction of the specific volume of the dry flue gas and to increase of the sulfur dioxide concentration expected in dry flue gas in 1/(1 – qu/100) times in comparison with full fuel burnout, respectively. To account the unburnt carbon availability (qu > 0), it is proposed to use the dependencies: VGd(qu) = VGd (1 – qu/100) and CSO2(qu) = CSO2 /(1 – qu/100). The developed engineering method of the specific emissions calculation of the dry flue gas at the TPPs and CHPs and sulfur dioxide concentration in it is proposed to use in a range of the fuel ash content Ad from 4.0 to 50.0% and lower heating value of fuel Qi
r from 14.5 to 32.0 MJ/kg.
The calculations of the specific and gross emissions of the dry flue gas at the TPPs of Ukraine and sulfur dioxide concentration in it since 2012–2016 were carried out following the method developed. The information on quality, coal consumption that is supplied at TPP and qu from TPP official statistical reports were used for calculations. The calculations results for the coal-fired TPPs and 5 generation companies of Ukraine for 2012 are shown in Table 4. The values of the gross emissions of the dry flue gas and sulfur dioxide in dry flue gas obtained during the calculations are well coincide with the data represented by the TPPs and generating companies of Ukraine for 2012 (National Emission Reduction Plans (NERP) of the Limited Gross Emissions Calculation Rules).
The general results of the gross emissions’ calculations of the dry flue gas and the sulfur dioxide concentrations in it at TPPs that burn low-reactive coal and at TPPs that burn high-reactive coal since 2012–2016, are shown in Table 5. In last year’s, the volume of the gross emissions of the sulfur oxide at the coal-fired TPPs of Ukraine reached 1000 thousand tons. The gross emission of the sulfur oxide decrease at the coal-fired TPPs of Ukraine up to 800 kilotons (kt) in 2015 is connected with the electricity production loss more than 30%. In recent years, the values of the specific sulfur emissions at the coal-fired TPPs of Ukraine are at the level of the 16–20 g/kW-h of the electricity supplied against 1.2 g/kW-h of the electricity supplied – the today’s average European level (following the data of the renew Energy Strategy of Ukraine till 2030). It is explained by using of coal with average and high sulfur content (see Tables 4, 5) at the TPPs of Ukraine and increasing the share of coal in the fuel balance of TPP.
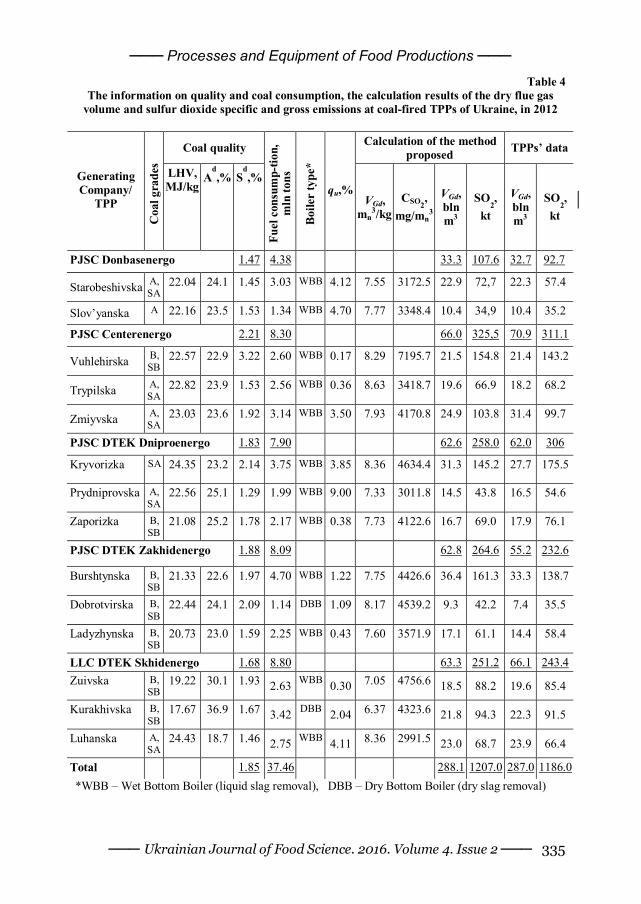
─── Processes and Equipment of Food Productions ───
─── Ukrainian Journal of Food Science. 2016. Volume 4. Issue 2 ─── 335
Table 4 The information on quality and coal consumption, the calculation results of the dry flue gas
volume and sulfur dioxide specific and gross emissions at coal-fired TPPs of Ukraine, in 2012
Coal quality Calculation of the method proposed TPPs’ data
Generating Company/
TPP
Coa
l gra
des
LHV, MJ/kg
Ad,% S
d,%
Fuel
con
sum
p-tio
n,
mln
tons
Boile
r ty
pe*
qu,% VGd,
mn3/kg
CSO2,
mg/mn3
VGd, bln m3
SO2,
kt
VGd, bln m3
SO2,
kt
PJSC Donbasenergo 1.47 4.38 33.3 107.6 32.7 92.7
Starobeshivska А, SA
22.04 24.1 1.45 3.03 WBB 4.12 7.55 3172.5 22.9 72,7 22.3 57.4
Slov’yanska A 22.16 23.5 1.53 1.34 WBB 4.70 7.77 3348.4 10.4 34,9 10.4 35.2
PJSC Centerenergo 2.21 8.30 66.0 325,5 70.9 311.1
Vuhlehirska B, SB
22.57 22.9 3.22 2.60 WBB 0.17 8.29 7195.7 21.5 154.8 21.4 143.2
Trypilska А, SA
22.82 23.9 1.53 2.56 WBB 0.36 8.63 3418.7 19.6 66.9 18.2 68.2
Zmiyvska А, SA
23.03 23.6 1.92 3.14 WBB 3.50 7.93 4170.8 24.9 103.8 31.4 99.7
PJSC DTEK Dniproenergo 1.83 7.90 62.6 258.0 62.0 306
Kryvorizka SA 24.35 23.2 2.14 3.75 WBB 3.85 8.36 4634.4 31.3 145.2 27.7 175.5
Prydniprovska А, SA
22.56 25.1 1.29 1.99 WBB 9.00 7.33 3011.8 14.5 43.8 16.5 54.6
Zaporizka B, SB
21.08 25.2 1.78 2.17 WBB 0.38 7.73 4122.6 16.7 69.0 17.9 76.1
PJSC DTEK Zakhidenergo 1.88 8.09 62.8 264.6 55.2 232.6
Burshtynska B, SB
21.33 22.6 1.97 4.70 WBB 1.22 7.75 4426.6 36.4 161.3 33.3 138.7
Dobrotvirska B, SB
22.44 24.1 2.09 1.14 DBB 1.09 8.17 4539.2 9.3 42.2 7.4 35.5
Ladyzhynska B, SB
20.73 23.0 1.59 2.25 WBB 0.43 7.60 3571.9 17.1 61.1 14.4 58.4
LLC DTEK Skhidenergo 1.68 8.80 63.3 251.2 66.1 243.4 Zuivska B,
SB 19.22 30.1 1.93 2.63 WBB 0.30 7.05 4756.6 18.5 88.2 19.6 85.4
Kurakhivska B, SB
17.67 36.9 1.67 3.42 DBB 2.04 6.37 4323.6 21.8 94.3 22.3 91.5
Luhanska А, SA
24.43 18.7 1.46 2.75 WBB 4.11 8.36 2991.5 23.0 68.7 23.9 66.4
Total 1.85 37.46 288.1 1207.0 287.0 1186.0 *WBB – Wet Bottom Boiler (liquid slag removal), DBB – Dry Bottom Boiler (dry slag removal)
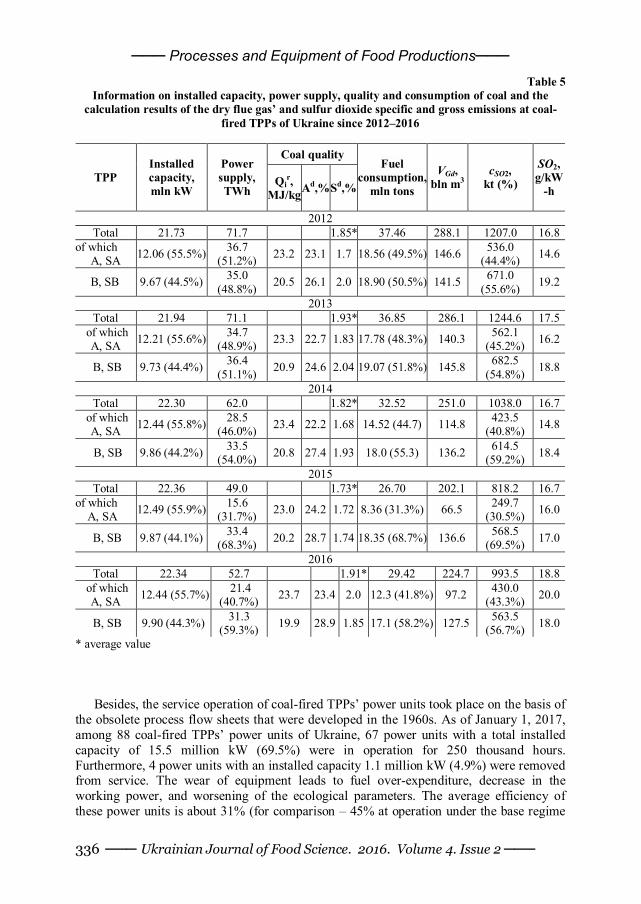
─── Processes and Equipment of Food Productions───
─── Ukrainian Journal of Food Science. 2016. Volume 4. Issue 2 ─── 336
Table 5 Information on installed capacity, power supply, quality and consumption of coal and the
calculation results of the dry flue gas’ and sulfur dioxide specific and gross emissions at coal-fired TPPs of Ukraine since 2012–2016
Coal quality
TPP Installed capacity, mln kW
Power supply, TWh
Qir,
MJ/kg Ad,%Sd,%
Fuel consumption,
mln tons
VGd, bln m3
cSO2, kt (%)
SO2, g/kW
-h
2012 Total 21.73 71.7 1.85* 37.46 288.1 1207.0 16.8
of which А, SA 12.06 (55.5%) 36.7
(51.2%) 23.2 23.1 1.7 18.56 (49.5%) 146.6 536.0 (44.4%) 14.6
B, SB 9.67 (44.5%) 35.0 (48.8%) 20.5 26.1 2.0 18.90 (50.5%) 141.5 671.0
(55.6%) 19.2
2013 Total 21.94 71.1 1.93* 36.85 286.1 1244.6 17.5
of which А, SA 12.21 (55.6%) 34.7
(48.9%) 23.3 22.7 1.83 17.78 (48.3%) 140.3 562.1 (45.2%) 16.2
B, SB 9.73 (44.4%) 36.4 (51.1%) 20.9 24.6 2.04 19.07 (51.8%) 145.8 682.5
(54.8%) 18.8
2014 Total 22.30 62.0 1.82* 32.52 251.0 1038.0 16.7
of which А, SA 12.44 (55.8%) 28.5
(46.0%) 23.4 22.2 1.68 14.52 (44.7) 114.8 423.5 (40.8%) 14.8
B, SB 9.86 (44.2%) 33.5 (54.0%) 20.8 27.4 1.93 18.0 (55.3) 136.2 614.5
(59.2%) 18.4
2015 Total 22.36 49.0 1.73* 26.70 202.1 818.2 16.7
of which А, SA 12.49 (55.9%) 15.6
(31.7%) 23.0 24.2 1.72 8.36 (31.3%) 66.5 249.7 (30.5%) 16.0
B, SB 9.87 (44.1%) 33.4 (68.3%) 20.2 28.7 1.74 18.35 (68.7%) 136.6 568.5
(69.5%) 17.0
2016 Total 22.34 52.7 1.91* 29.42 224.7 993.5 18.8
of which А, SA 12.44 (55.7%) 21.4
(40.7%) 23.7 23.4 2.0 12.3 (41.8%) 97.2 430.0 (43.3%) 20.0
B, SB 9.90 (44.3%) 31.3 (59.3%) 19.9 28.9 1.85 17.1 (58.2%) 127.5 563.5
(56.7%) 18.0
* average value
Besides, the service operation of coal-fired TPPs’ power units took place on the basis of
the obsolete process flow sheets that were developed in the 1960s. As of January 1, 2017, among 88 coal-fired TPPs’ power units of Ukraine, 67 power units with a total installed capacity of 15.5 million kW (69.5%) were in operation for 250 thousand hours. Furthermore, 4 power units with an installed capacity 1.1 million kW (4.9%) were removed from service. The wear of equipment leads to fuel over-expenditure, decrease in the working power, and worsening of the ecological parameters. The average efficiency of these power units is about 31% (for comparison – 45% at operation under the base regime
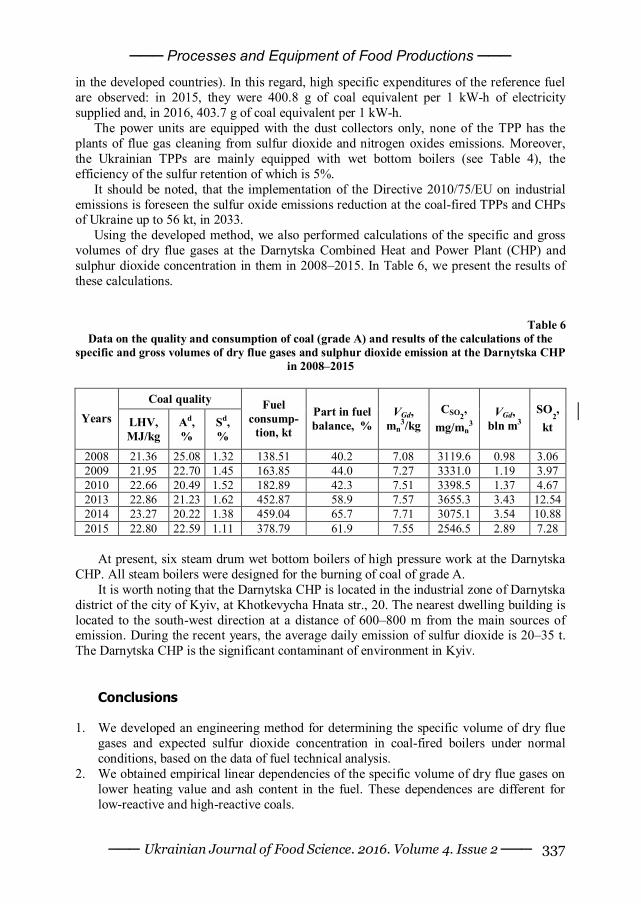
─── Processes and Equipment of Food Productions ───
─── Ukrainian Journal of Food Science. 2016. Volume 4. Issue 2 ─── 337
in the developed countries). In this regard, high specific expenditures of the reference fuel are observed: in 2015, they were 400.8 g of coal equivalent per 1 kW-h of electricity supplied and, in 2016, 403.7 g of coal equivalent per 1 kW-h.
The power units are equipped with the dust collectors only, none of the TPP has the plants of flue gas cleaning from sulfur dioxide and nitrogen oxides emissions. Moreover, the Ukrainian TPPs are mainly equipped with wet bottom boilers (see Table 4), the efficiency of the sulfur retention of which is 5%.
It should be noted, that the implementation of the Directive 2010/75/EU on industrial emissions is foreseen the sulfur oxide emissions reduction at the coal-fired TPPs and CHPs of Ukraine up to 56 kt, in 2033.
Using the developed method, we also performed calculations of the specific and gross volumes of dry flue gases at the Darnytska Combined Heat and Power Plant (CHP) and sulphur dioxide concentration in them in 2008–2015. In Table 6, we present the results of these calculations.
Table 6
Data on the quality and consumption of coal (grade A) and results of the calculations of the specific and gross volumes of dry flue gases and sulphur dioxide emission at the Darnytska CHP
in 2008–2015
Coal quality Years LHV,
MJ/kg Ad, %
Sd, %
Fuel consump-
tion, kt
Part in fuel balance, %
VGd, mn
3/kg CSO2
, mg/mn
3 VGd,
bln m3 SO
2,
kt
2008 21.36 25.08 1.32 138.51 40.2 7.08 3119.6 0.98 3.06 2009 21.95 22.70 1.45 163.85 44.0 7.27 3331.0 1.19 3.97 2010 22.66 20.49 1.52 182.89 42.3 7.51 3398.5 1.37 4.67 2013 22.86 21.23 1.62 452.87 58.9 7.57 3655.3 3.43 12.54 2014 23.27 20.22 1.38 459.04 65.7 7.71 3075.1 3.54 10.88 2015 22.80 22.59 1.11 378.79 61.9 7.55 2546.5 2.89 7.28
At present, six steam drum wet bottom boilers of high pressure work at the Darnytska
CHP. All steam boilers were designed for the burning of coal of grade A. It is worth noting that the Darnytska CHP is located in the industrial zone of Darnytska
district of the city of Kyiv, at Khotkevycha Hnata str., 20. The nearest dwelling building is located to the south-west direction at a distance of 600–800 m from the main sources of emission. During the recent years, the average daily emission of sulfur dioxide is 20–35 t. The Darnytska CHP is the significant contaminant of environment in Kyiv.
Conclusions
1. We developed an engineering method for determining the specific volume of dry flue gases and expected sulfur dioxide concentration in coal-fired boilers under normal conditions, based on the data of fuel technical analysis.
2. We obtained empirical linear dependencies of the specific volume of dry flue gases on lower heating value and ash content in the fuel. These dependences are different for low-reactive and high-reactive coals.
─── Processes and Equipment of Food Productions───
─── Ukrainian Journal of Food Science. 2016. Volume 4. Issue 2 ─── 338
3. Empirical linear dependencies of the expected sulfur dioxide concentrations on the values of sulfur and ash content in the fuel for low-reactive and high-reactive coals were derived.
4. It is shown that, in the presence of unburned carbon the specific volume of dry flue gases decreases by a factor of 1/(1 – qu/100), and sulfur dioxide concentration grow in the same proportion.
5. According to the obtained dependences were calculated the volumes of dry flue gases and gross SO2 emissions at Ukrainian thermal power plants in 2012–2016. The values of specific sulfur dioxide emission in recent years are at the level of 16–20 g/kW-h of electricity supplied, which is 13–15 times higher than the average European level. References
1. Volchyn I., Dunayevska N., Haponych L., Chernyvskyi M., Topal O., Zasyadko Ya. (2013), Prospects for the implementation of clean coal technologies in the energy sector of Ukraine, GNOZIS, Kyiv.
2. Lipov Ju. M., Tret'jakov Ju. M. (2003), Kotel'nye ustanovki i parogeneratory, NIC Reguljarnaja i haoticheskaja dinamika, Moskow.
3. Volchyn I., Haponych L. (2014), Estimate of the sulfur dioxide concentration at thermal power plants fired by Donetsk coal, Power Technology and Engineering, 48(3), pp. 218–221.
4. Stanislaw Hlawiczka, Katarzyna Korszun, Janina Fudala (2016), Acidity of vapor plume from cooling tower mixed with flue gases emitted from coal-fired power plant, Science of The Total Environment, 554–555, pp. 253–258.
5. Kyeongsook Kim, Seugran Yang, Joong Beom Lee, Tae Hyoung Eom, Chong Kul Ryu, Sung-Ho Jo, Young Cheol Park, Chang-Keun Yi (2012), Analysis of K2CO3/Al2O3 CO2 sorbent tested with coal-fired power plant flue gas: Effect of Sox, International Journal of Greenhouse Gas Control, 9, pp. 347–354.
6. Patricia Córdoba (2015), Status of Flue Gas Desulphurisation (FGD) systems from coal-fired power plants: Overview of the physic-chemical control processes of wet limestone FGDs, Fuel, 144, pp. 274–286.
7. Yang Ou, Haibo Zhai, Edward S. Rubin (2016), Life cycle water use of coal- and natural-gas-fired power plants with and without carbon capture and storage, International Journal of Greenhouse Gas Control, 44, pp. 249–261.
8. Paul Breeze (2014), Chapter 3 - Coal-fired Power Plants, Power Generation Technologies (Second Edition), pp. 2–65
9. Paul Breeze (2016), Chapter 9 - Gas-Fired Power Plants and the Environment, Gas-Turbine Power Generation, pp. 83–92
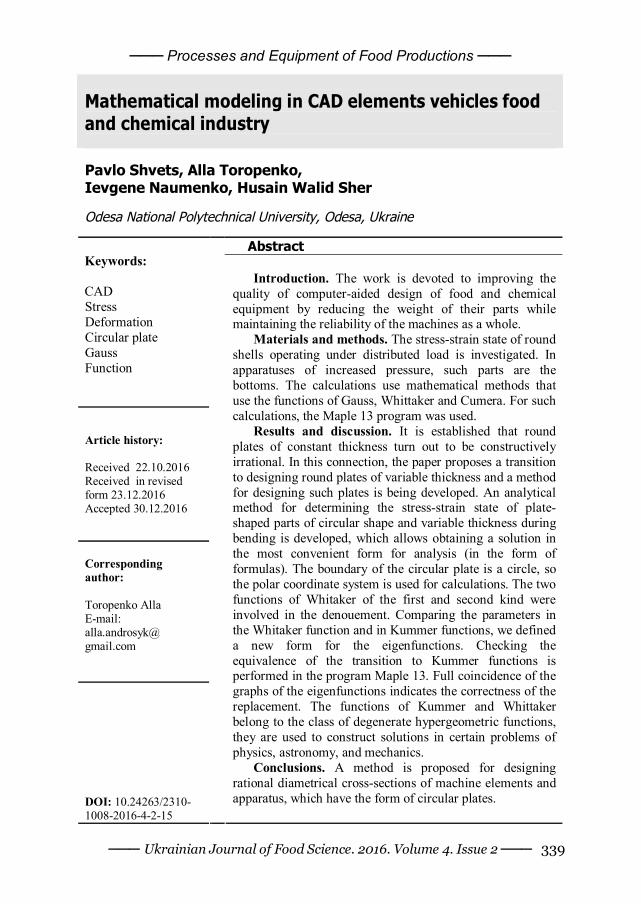
─── Processes and Equipment of Food Productions ───
─── Ukrainian Journal of Food Science. 2016. Volume 4. Issue 2 ─── 339
Mathematical modeling in CAD elements vehicles food and chemical industry Pavlo Shvets, Alla Toropenko, Ievgene Naumenko, Husain Walid Sher Odesa National Polytechnical University, Odesa, Ukraine
Abstract
Keywords: CAD Stress Deformation Circular plate Gauss Function
Article history: Received 22.10.2016 Received in revised form 23.12.2016 Accepted 30.12.2016
Corresponding author: Toropenko Alla E-mail: alla.androsyk@ gmail.com
DOI: 10.24263/2310-1008-2016-4-2-15
Introduction. The work is devoted to improving the
quality of computer-aided design of food and chemical equipment by reducing the weight of their parts while maintaining the reliability of the machines as a whole.
Materials and methods. The stress-strain state of round shells operating under distributed load is investigated. In apparatuses of increased pressure, such parts are the bottoms. The calculations use mathematical methods that use the functions of Gauss, Whittaker and Cumera. For such calculations, the Maple 13 program was used.
Results and discussion. It is established that round plates of constant thickness turn out to be constructively irrational. In this connection, the paper proposes a transition to designing round plates of variable thickness and a method for designing such plates is being developed. An analytical method for determining the stress-strain state of plate-shaped parts of circular shape and variable thickness during bending is developed, which allows obtaining a solution in the most convenient form for analysis (in the form of formulas). The boundary of the circular plate is a circle, so the polar coordinate system is used for calculations. The two functions of Whitaker of the first and second kind were involved in the denouement. Comparing the parameters in the Whitaker function and in Kummer functions, we defined a new form for the eigenfunctions. Checking the equivalence of the transition to Kummer functions is performed in the program Maple 13. Full coincidence of the graphs of the eigenfunctions indicates the correctness of the replacement. The functions of Kummer and Whittaker belong to the class of degenerate hypergeometric functions, they are used to construct solutions in certain problems of physics, astronomy, and mechanics.
Conclusions. A method is proposed for designing rational diametrical cross-sections of machine elements and apparatus, which have the form of circular plates.
─── Processes and Equipment of Food Productions───
─── Ukrainian Journal of Food Science. 2016. Volume 4. Issue 2 ─── 340
Introduction One of the most important technical characteristics of the machines and devices is their
weight. When developing new and improving existing designs, designers are always seeking to reduce material consumption and reduce the weight of products. The best known technical solutions and recommendations for the design details dimensional structures – rods. Beams – core operating bending – made from standard rolled sections (beams, channels, rails, etc.), In which the material is largely removed from the neutral axis, thus providing multiple increase in axial moment of inertia, strength and rigidity. Gear – rods working in torsion – in many cases, are shaped pipes and compared with a solid cross-section of the same area of strength and stiffness characteristics increase several times.
Similar advantages are achieved by weight in the disc-shaped parts. Gears, pulleys, flywheels, wheel vehicles in the middle of the drive are thin, often facilitated holes or spokes (wheel bike). Such designs have less mass and, hence, lower cost, high competitiveness.
Development of machines, apparatus and their parts with a minimum weight is more difficult to design because it requires unconditional providing strength with increasing complexity of such schemes calculated essentially heterogeneous products.
Analytical review The quality of the machines of the same designation estimate the specific gravity,
defined as the quotient of weight G on the main parameter. For example, energy and others. machines such parameter is the value
GgN
where N – the power unit. It is a composite index that takes into account the degree of structural perfection and
use of light alloys and non-metallic materials. For example, modern tanks, the Figure is: Leclerc (France) g = 50 kg / kW, T-84 (Ukraine) g = 52 kg / kW M1A2 Abrams (USA) g = 56,8 kg / kW, T90S (Russia ) g = 63,2 kg / kW.
In the transport engineering quality estimate dimensionless ratio g1 weight design to the mass of the payload. For sea transport g1 = 20 – 30, Track g1 = 10 – 20, for automotive g1 = 3 – 5, for aircraft g1 = 1,2 – 2,5.
Feature of machines and devices food and chemical industries have a huge range of types and dribnoseriynist, and some of them are available in single copies. The main indicator of the quality of vehicles and machinery in the chemical industry is the reliability of their work, ie property vehicles or machines perform their functions, while maintaining their operational performance to set limits for the required period of time or the required operating time. In this regard, designers often dealing with reduction of material last. The textbook [5], for example, states: «The current level of chemical production requires designing and manufacturing machines and equipment quality. Other possible with the optimal combination of these technical and economic parameters: maximum working volume, high productivity simplicity, reliability and safety at work, energy and the lowest metal content».
But there are exceptions: nowadays to store liquid materials received widespread use of vertical cylindrical shell with variable speed wall thickness that decreases in height. For
─── Processes and Equipment of Food Productions ───
─── Ukrainian Journal of Food Science. 2016. Volume 4. Issue 2 ─── 341
small volume tanks, 10 – 20 m3, saving material goes low, 8 – 10%, but the order volume of 10,000 m3 – 35% compared to the reservoir wall with constant thickness [6].
A similar result can be obtained also in the design of machine parts and devices in the shape of plates, including a circular shape (covers, bottoms, aperture devices, etc.). In a circular plate of radius R, which is bent uniformly distributed load q, bending moment turns radially distributed very unevenly. When joints leaning on the circuit in the center of a plate having radial and circumferential moments of equal magnitude
Mr(0)= Mt(0)=0,208qr2, (1)
whereas in circuit
Mr(R)=0; Mt(R)=0,0835qr2. (2)
The value of bending moments from the center to the periphery of the circular plate pivotally obpertoyi, as we see, reduced by 2,5 times.
For the same plate with rigid circuit pattern of change of bending moment is different, but also essential. In the center of bending moments
Mr(0)= Mt(0)=0,0833qr2, (3)
and the circuit
Mr(R)=–0,125qr2; Mt(R)=–0,042qr2. (4)
Here is larger by 1.5 times (in absolute value) is bending moment on the circuit. Besides the two points changes sign, so a value of radial coordinate r = (0,6R ... 0,8R) bending moment is zero at all [1].
From the above analysis shows that the round plate thickness are constant constructive irrational. In this regard, in this work the transition to designing circular plates of variable thickness design method is developed and such plates.
The issue of circular plates with thickness variation studied by some authors find solutions using power series, methods or finite element mesh. Overview on the subject is in monographs [4, 8]. Solutions to some problems such plates are shown in tabular form in the directory. [1] This paper developed an analytical method for determining the stress-strain state of the plate parts round shape and variable thickness when bent, which provides a solution to the most convenient for the analysis of closed form (a formula).
Purpose of the work The aim is to improve the quality of machine parts rivnonapruzhenyh design by
reducing the weight of the respective components while maintaining their reliability through the development and implementation of mathematical models of circular plates of variable thickness, which is under transverse load.
To achieve this, the work was made and solved the following problems: - Analytical review of the conditions of establishment and operation rivnonapruzhenyh
machine parts and methods of computer-aided design; - the basic characteristics of the strain of round plates, used for their mathematical
modeling; - the mathematical model of bending circular plate variable thickness Gaussian
function given in the form of second order differential equation with variable coefficients;
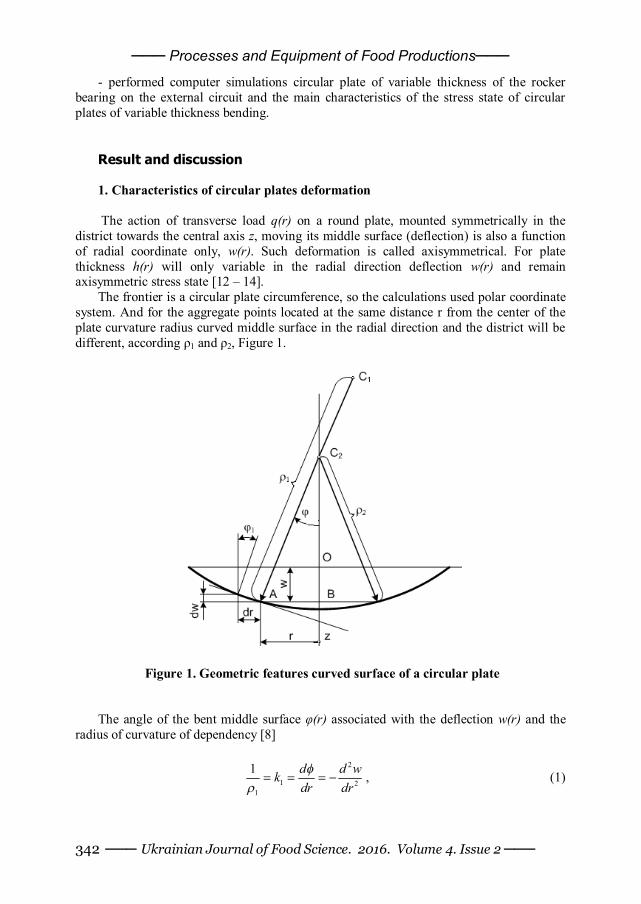
─── Processes and Equipment of Food Productions───
─── Ukrainian Journal of Food Science. 2016. Volume 4. Issue 2 ─── 342
- performed computer simulations circular plate of variable thickness of the rocker bearing on the external circuit and the main characteristics of the stress state of circular plates of variable thickness bending.
Result and discussion 1. Characteristics of circular plates deformation The action of transverse load q(r) on a round plate, mounted symmetrically in the
district towards the central axis z, moving its middle surface (deflection) is also a function of radial coordinate only, w(r). Such deformation is called axisymmetrical. For plate thickness h(r) will only variable in the radial direction deflection w(r) and remain axisymmetric stress state [12 – 14].
The frontier is a circular plate circumference, so the calculations used polar coordinate system. And for the aggregate points located at the same distance r from the center of the plate curvature radius curved middle surface in the radial direction and the district will be different, according ρ1 and ρ2, Figure 1.
Figure 1. Geometric features curved surface of a circular plate The angle of the bent middle surface φ(r) associated with the deflection w(r) and the
radius of curvature of dependency [8]
2
1 21
1 d d wkdr dr
, (1)
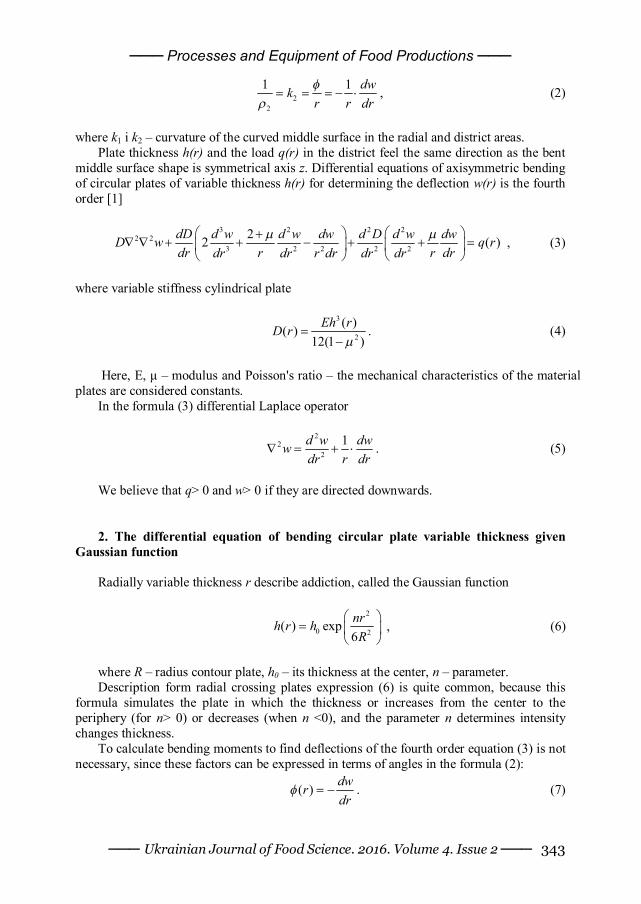
─── Processes and Equipment of Food Productions ───
─── Ukrainian Journal of Food Science. 2016. Volume 4. Issue 2 ─── 343
2
2
1 1 dwkr r dr
, (2)
where k1 і k2 – curvature of the curved middle surface in the radial and district areas.
Plate thickness h(r) and the load q(r) in the district feel the same direction as the bent middle surface shape is symmetrical axis z. Differential equations of axisymmetric bending of circular plates of variable thickness h(r) for determining the deflection w(r) is the fourth order [1]
3 2 2 2
2 23 2 2 2 2
22 ( )dD d w d w dw d D d w dwD w q rdr r r drdr dr r dr dr dr
, (3)
where variable stiffness cylindrical plate
3
2
( )( ) .12(1 )
Eh rD r
(4)
Here, E, μ – modulus and Poisson's ratio – the mechanical characteristics of the material
plates are considered constants. In the formula (3) differential Laplace operator
22
2
1d w dwwr drdr
. (5)
We believe that q> 0 and w> 0 if they are directed downwards. 2. The differential equation of bending circular plate variable thickness given
Gaussian function Radially variable thickness r describe addiction, called the Gaussian function
2
0 2( ) exp6nrh r hR
, (6)
where R – radius contour plate, h0 – its thickness at the center, n – parameter. Description form radial crossing plates expression (6) is quite common, because this
formula simulates the plate in which the thickness or increases from the center to the periphery (for n> 0) or decreases (when n <0), and the parameter n determines intensity changes thickness.
To calculate bending moments to find deflections of the fourth order equation (3) is not necessary, since these factors can be expressed in terms of angles in the formula (2):
( ) dwrdr
. (7)

─── Processes and Equipment of Food Productions───
─── Ukrainian Journal of Food Science. 2016. Volume 4. Issue 2 ─── 344
Substitution in equation (3) deflections at angles according to the dependence (7) allows the lower order differential equation (3) to the second:
0
0
1 ( )2
r q rd d dD dD q r rdrdr dr r dr dr r r
, (8)
Here the importance of the right to a received load q0, evenly distributed across the
surface of the plate. If the solution of equation (8) is received, the deflection can be found by integration of
the expression (7): 0( ) ( )w r r dr C . Continuous integration C0 determined by the condition fixing plate.
In (8) to the dimensionless coordinates, replacing r=x∙R. The formulas for cylindrical rigidity (4) and its derivative thickness (6) have the form
3 32 20 0
2 2exp ; exp2 212(1 ) 12(1 )
Eh Ehnx dD nx nxDdr R
.
(9)
After substituting (9) into (8) and some transformations we obtain the differential equation of 2nd order with variable coefficients
2 2
2 20
1 1 1 ( ) exp2
rd d nxnx n q d pxx dx rdx x
,
(10)
where the dimensionless factor
32 0
30
6(1 )q RpE h
. (11)
Get the solution of equations with variable coefficients, which is also (10), using
elementary functions often can not [1, 2]. So turn to mathematical program Maple 13, where there is a corresponding mathematical apparatus. Using this program replaced the designation function φ(x) → y(x), recorded respective teams and obtained the following results.
2
2
12 22
2 2 2
12
2
1 1( ) ( ) ( ) ( )
1 1( ) ( )
nx
nx
d d dy x n x y x m n y x p x e y xx dxdx x dx
dn x y x m n y x p x ex dx x
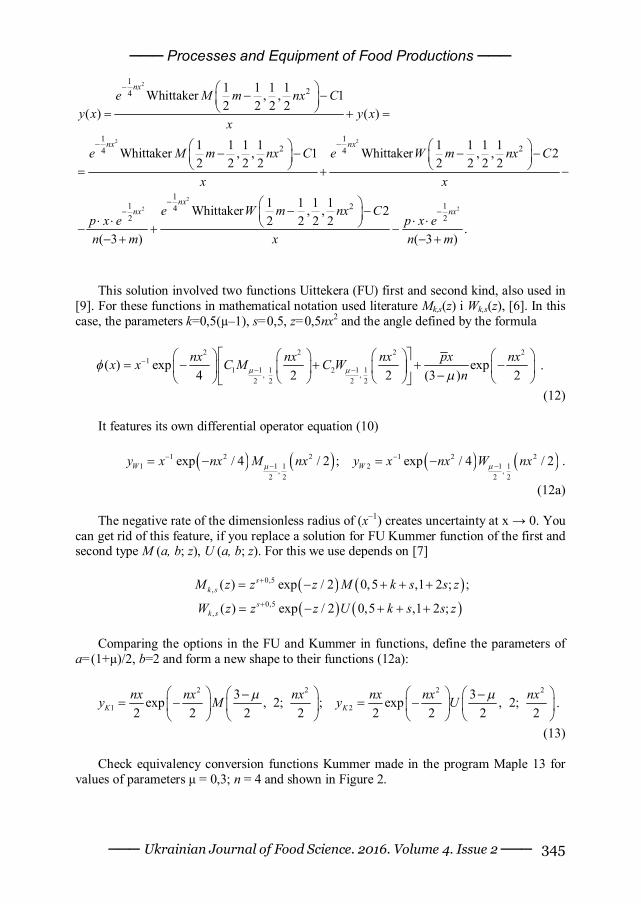
─── Processes and Equipment of Food Productions ───
─── Ukrainian Journal of Food Science. 2016. Volume 4. Issue 2 ─── 345
2
2 2
2
2
124
1 12 24 4
11 242
1 1 1 1Whittaker , , 12 2 2 2( ) ( )
1 1 1 1 1 1 1 1Whittaker , , 1 Whittaker , , 22 2 2 2 2 2 2 2
1 1 1 1Whittaker , ,2 2 2 2
( 3 )
nx
nx nx
nxnx
e M m nx Cy x y x
x
e M m nx C e W m nx C
x x
e W m nx Cp x en m
212
2.
( 3 )
nxp x e
x n m
This solution involved two functions Uittekera (FU) first and second kind, also used in
[9]. For these functions in mathematical notation used literature Mk,s(z) і Wk,s(z), [6]. In this case, the parameters k=0,5(µ–1), s=0,5, z=0,5nx2 and the angle defined by the formula
2 2 2 2
11 1 1 2 1 1, ,
2 2 2 2
( ) exp exp4 2 2 (3 ) 2
nx nx nx px nxx x C M C Wn
.
(12)
It features its own differential operator equation (10)
1 2 2 1 2 21 1 1 2 1 1, ,
2 2 2 2
exp / 4 / 2 ; exp / 4 / 2W Wy x nx M nx y x nx W nx
.
(12а) The negative rate of the dimensionless radius of (х–1) creates uncertainty at x → 0. You
can get rid of this feature, if you replace a solution for FU Kummer function of the first and second type M (a, b; z), U (a, b; z). For this we use depends on [7]
0,5,
0,5,
( ) exp / 2 0,5 ,1 2 ; ;
( ) exp / 2 0,5 ,1 2 ;
sk s
sk s
M z z z M k s s z
W z z z U k s s z
Comparing the options in the FU and Kummer in functions, define the parameters of
a=(1+µ)/2, b=2 and form a new shape to their functions (12a):
2 2 2 2
1 23 3exp , 2; ; exp , 2;
2 2 2 2 2 2 2 2K Knx nx nx nx nx nxy M y U
.
(13)
Check equivalency conversion functions Kummer made in the program Maple 13 for values of parameters μ = 0,3; n = 4 and shown in Figure 2.
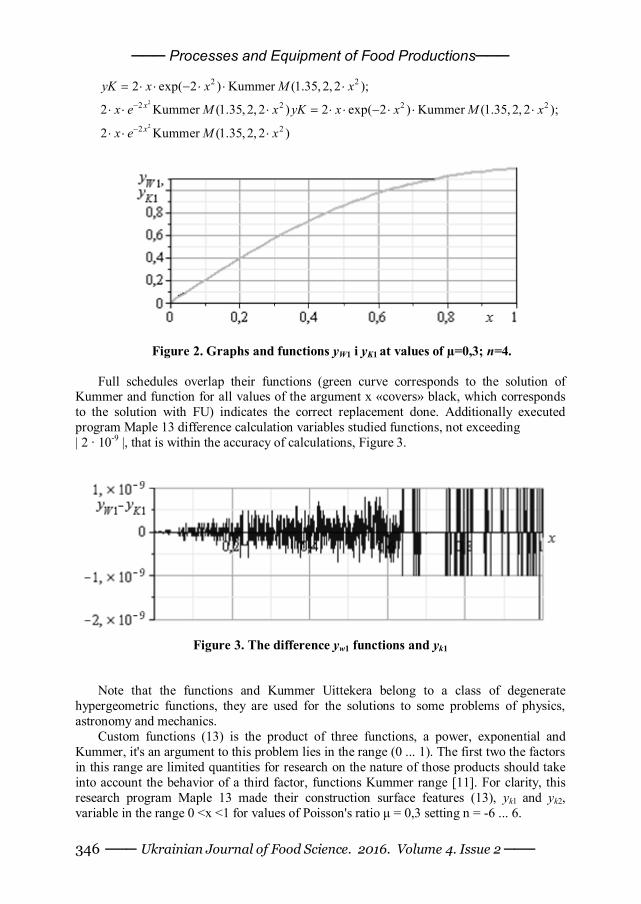
─── Processes and Equipment of Food Productions───
─── Ukrainian Journal of Food Science. 2016. Volume 4. Issue 2 ─── 346
2
2
2 2
2 2 2 2
2 2
2 exp( 2 ) Kummer (1.35, 2, 2 );
2 Kummer (1.35, 2, 2 ) 2 exp( 2 ) Kummer (1.35, 2, 2 );
2 Kummer (1.35, 2, 2 )
x
x
yK x x M x
x e M x yK x x M x
x e M x
Figure 2. Graphs and functions yW1 і yK1 at values of µ=0,3; п=4.
Full schedules overlap their functions (green curve corresponds to the solution of Kummer and function for all values of the argument x «covers» black, which corresponds to the solution with FU) indicates the correct replacement done. Additionally executed program Maple 13 difference calculation variables studied functions, not exceeding | 2 ∙ 10-9 |, that is within the accuracy of calculations, Figure 3.
Figure 3. The difference yw1 functions and yk1
Note that the functions and Kummer Uittekera belong to a class of degenerate hypergeometric functions, they are used for the solutions to some problems of physics, astronomy and mechanics.
Custom functions (13) is the product of three functions, a power, exponential and Kummer, it's an argument to this problem lies in the range (0 ... 1). The first two the factors in this range are limited quantities for research on the nature of those products should take into account the behavior of a third factor, functions Kummer range [11]. For clarity, this research program Maple 13 made their construction surface features (13), yk1 and yk2, variable in the range 0 <x <1 for values of Poisson's ratio μ = 0,3 setting n = -6 ... 6.
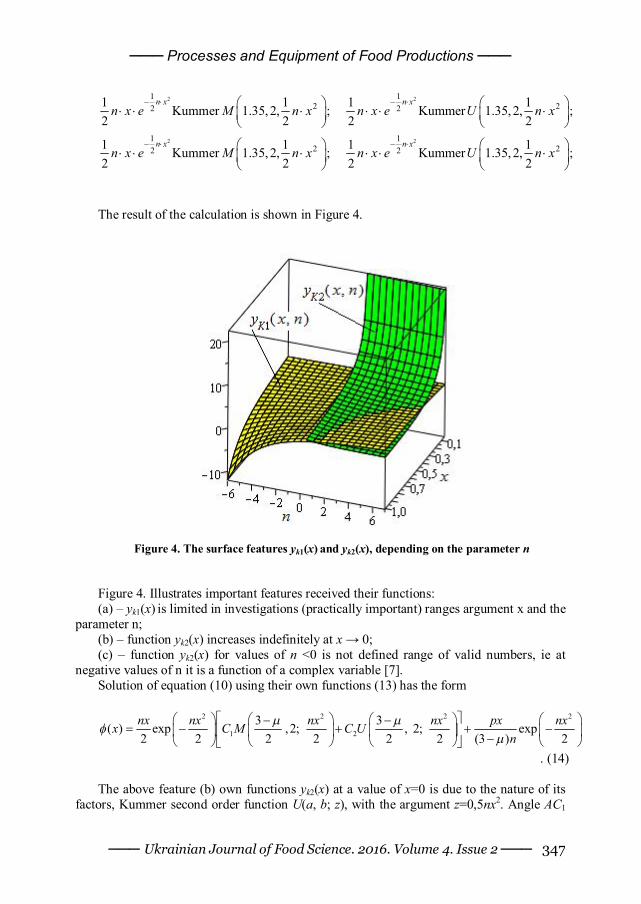
─── Processes and Equipment of Food Productions ───
─── Ukrainian Journal of Food Science. 2016. Volume 4. Issue 2 ─── 347
2 2
2 2
1 12 22 2
1 12 22 2
1 1 1 1Kummer 1.35, 2, ; Kummer 1.35, 2, ;2 2 2 2
1 1 1 1Kummer 1.35, 2, ; Kummer 1.35, 2, ;2 2 2 2
n x n x
n x n x
n x e M n x n x e U n x
n x e M n x n x e U n x
The result of the calculation is shown in Figure 4.
Figure 4. The surface features yk1(x) and yk2(x), depending on the parameter n Figure 4. Illustrates important features received their functions: (a) – yk1(x) is limited in investigations (practically important) ranges argument x and the
parameter n; (b) – function yk2(x) increases indefinitely at x → 0; (c) – function yk2(x) for values of n <0 is not defined range of valid numbers, ie at
negative values of n it is a function of a complex variable [7]. Solution of equation (10) using their own functions (13) has the form
2 2 2 2
1 23 3( ) exp ,2; , 2; exp
2 2 2 2 2 2 (3 ) 2nx nx nx nx px nxx C M C U
n
. (14) The above feature (b) own functions yk2(x) at a value of x=0 is due to the nature of its
factors, Kummer second order function U(a, b; z), with the argument z=0,5nx2. Angle АС1
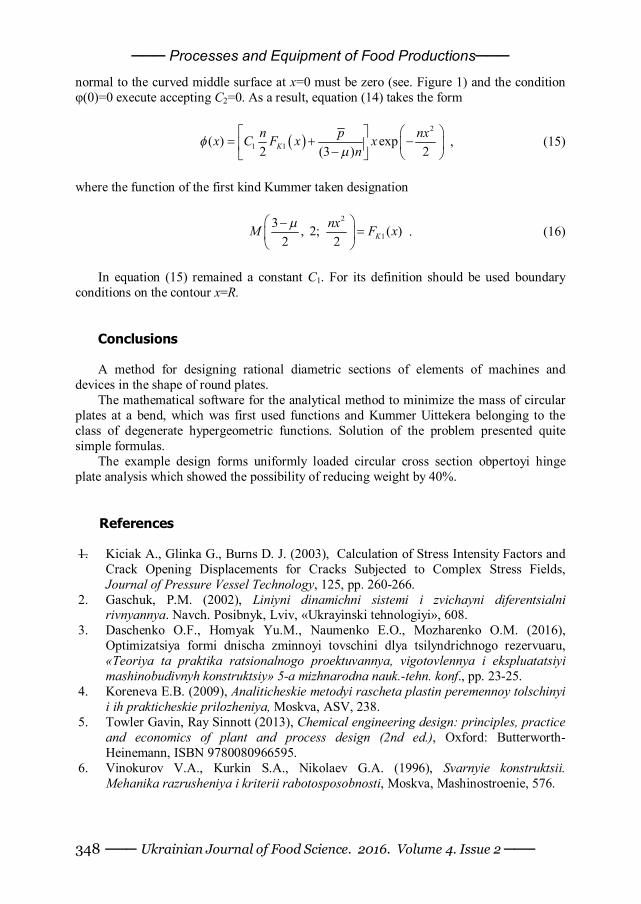
─── Processes and Equipment of Food Productions───
─── Ukrainian Journal of Food Science. 2016. Volume 4. Issue 2 ─── 348
normal to the curved middle surface at x=0 must be zero (see. Figure 1) and the condition φ(0)=0 execute accepting C2=0. As a result, equation (14) takes the form
2
1 1( ) exp2 (3 ) 2Kn p nxx C F x x
n
, (15)
where the function of the first kind Kummer taken designation
2
13 , 2; ( )
2 2 KnxM F x
. (16)
In equation (15) remained a constant C1. For its definition should be used boundary
conditions on the contour x=R. Conclusions A method for designing rational diametric sections of elements of machines and
devices in the shape of round plates. The mathematical software for the analytical method to minimize the mass of circular
plates at a bend, which was first used functions and Kummer Uittekera belonging to the class of degenerate hypergeometric functions. Solution of the problem presented quite simple formulas.
The example design forms uniformly loaded circular cross section obpertoyi hinge plate analysis which showed the possibility of reducing weight by 40%.
References
1. Kiciak A., Glinka G., Burns D. J. (2003), Calculation of Stress Intensity Factors and Crack Opening Displacements for Cracks Subjected to Complex Stress Fields, Journal of Pressure Vessel Technology, 125, pp. 260-266.
2. Gaschuk, P.M. (2002), Liniyni dinamichni sistemi i zvichayni diferentsialni rivnyannya. Navch. Posibnyk, Lviv, «Ukrayinski tehnologiyi», 608.
3. Daschenko O.F., Homyak Yu.M., Naumenko E.O., Mozharenko O.M. (2016), Optimizatsiya formi dnischa zminnoyi tovschini dlya tsilyndrichnogo rezervuaru, «Teoriya ta praktika ratsionalnogo proektuvannya, vigotovlennya i ekspluatatsiyi mashinobudivnyh konstruktsiy» 5-a mizhnarodna nauk.-tehn. konf., pp. 23-25.
4. Koreneva E.B. (2009), Analiticheskie metodyi rascheta plastin peremennoy tolschinyi i ih prakticheskie prilozheniya, Moskva, ASV, 238.
5. Towler Gavin, Ray Sinnott (2013), Chemical engineering design: principles, practice and economics of plant and process design (2nd ed.), Oxford: Butterworth-Heinemann, ISBN 9780080966595.
6. Vinokurov V.A., Kurkin S.A., Nikolaev G.A. (1996), Svarnyie konstruktsii. Mehanika razrusheniya i kriterii rabotosposobnosti, Moskva, Mashinostroenie, 576.
─── Processes and Equipment of Food Productions ───
─── Ukrainian Journal of Food Science. 2016. Volume 4. Issue 2 ─── 349
7. Korn Granino Arthur, Korn Theresa, (2000), Mathematical handbook for scientists and engineers : definitions, theorems, and formulas for reference and review, Courier Dover Publications, p. 169, ISBN 0-486-41147-8.
8. Timoshenko S.P., Voynovskiy-Kriger S. (1966), Plastinki i obolochki. Moskva, Nauka, 636.
9. Homyak Yu.M., Tshigam G.Zh. (2015), Rozvyazok zadachi viginu krugloyi plastini zminnoyi tovschini z vikoristannyam funktsiy Uittekera, Modelirovanie v prikladnyih nauch. issledovaniyah, Odesa, 23, 79–80.
10. Saveleva O.S., Homyak Yu.M., Stanovskaya I.I., Toropenko A.V., Naumenko E.A. (2016), Optimizatsiya ravnonapryazhenyih konstruktsiy tsilindricheskih rezervuarov v SAPR, Vostochno-evropeyskiy zhurnal peredovyih tehnologiy, 6/7(84), pp. 10–16.
11. Daalhuis Adri B. Olde, Olver Frank W.J., Lozier Daniel M., Boisvert Ronald, Clark Charles W. (2010), Confluent hypergeometric function, Handbook of Mathematical Functions, Cambridge University Press.
12. Brar G.S., Hari Y., Williams D.K. (2009), Fourier Series Analysis of a Cylindrical Pressure Vessel Subjected to External Pressure, ASME 2009 Pressure Vessels and Piping Conference, New York.
13. Brar G.S. (2009), Buckling Load Predictions in Pressure Vessels Utilizing Monte Carlo Method, Ph.D. Thesis, University of North Carolina at Charlotte, USA.
14. Elishakoff I., Li Y., Starnes, J.H. (2001), Non-Classical Problems in the Theory of Elastic Stability, Cambridge University Press, Cambridge, UK.
─── Economics and Management ───
─── Ukrainian Journal of Food Science. 2016. Volume 4. Issue 2 ─── 350
Methodology of estimation of system efficiency of personnel management on the enterprises of meat processing industry
Olena Dragan, Alina Berger National University of Food Technologies, Kyiv, Ukraine
Abstract Keywords: Staff Efficiency Enterprise Meat Industry Processing
Article history: Received 21.10.2016 Received in revised form 05.12.2016 Accepted 30.12.2016
Corresponding author: Olena Dragan E-mail: [email protected]
DOI: 10.24263/2310-1008-2016-4-2-16
Introduction. The article is devoted to the question of control system forming by the personnel of meat processing enterprises, and its clarification structure. Determination of integral index of control system efficiency estimation is offered by the personnel of the enterprise.
Materials and research methods. The next methods are used in the research: systems analysis in the questions of structure forming of control system and its application by personnel in practical activity of the enterprise of meat processing industry; analysis and synthesis, analogy and comparison – in methodology of efficiency system estimation of personnel management.
Results and discussions. The problem of forming the effective system of personnel management is one of the most essential for modern management of the enterprise (or organization), as with scientific and practical side of the research. Taking into account the specific of meat processing enterprises, necessity of control system perfection of personnel of the enterprise. The next subsystems of control system of personnel are offered: informatively-legal, analytical, organizational, motivational and controlling.
For the estimation of control system efficiency of personnel of the enterprise is offer methodology that provides: determination of single indexes that characterize this system; choice of standard value of indexes for comparing with actual indexes; calculation of integral index of this system efficiency.
Conclusions. Offered approach of the improvement of control system allow the personnel of meat processing enterprise do corresponding conclusions for the further planning of labour productivity, search of perfection norms of labour and rational use of labour resources productivity, providing stability of skilled employees, increase of motivational suggestions at development of skilled strategy of the enterprise. Methodology of efficiency estimation of control system of the personnel management on the basis of the most widespread economic indicators differs by availability and simplicity.
─── Economics and Management ───
─── Ukrainian Journal of Food Science. 2016. Volume 4. Issue 2 ─── 351
Introduction Strengthening of globalization processes and integration of Ukraine to the world
community pull out modern requirements before personnel management that is related with creating new skilled strategies, providing of skilled and intellectual culture safety, informatization.
The problems of methodology and practice of personnel management are investigated in researchers of such scientists, as H. Aguinis [1], M. Armstrong [2], L. Balabanova [3], A. Baron [1], M. Bukovinska [4], W. Cascio [2], M. Foot [5], C. Hook [5], І. Lozinskiy [6], M. Marchington [7], A. Оsіpоvа [8], L. Stout [9], J. Stredwick [10], A. Wilkinson [6] and other. Doing justice their scientific work of this range of problems, it is necessary to notice that research of control system efficiency of personnel of the enterprise is continuous process, especially in a competition environment. Therefore, it is necessary to make the research of control system efficiency estimation of the personnel of meat processing enterprises for further innovative development.
Materials and methods The next methods are used in the research: systems analysis in the questions of
structure forming of control system and its application by personnel in practical activity of the enterprise of meat processing industry; analysis and synthesis, analogy and comparison is in methodology of efficiency system estimation of personnel management.
For methodology approbation by the efficiency estimation of personnel management the researchers have selected the activity of Public Joint-stock Company “Kremenchugmiaso” during the period from 2001 till 2015, which is the powerful domestic enterprise, certificated after the standards of ISO, that is complemented to ten of most enterprises of meat processing industry of Ukraine. The total amount of employees on the Public joint stock company “Kremenchugmiaso” is 1740 persons, production capacity about 70 tons of sausage products on twenty-four hours, general area of the enterprise is 14 hectares.
Results and discussions In modern terms the control system of the personnel of enterprises of meat processing
industry must take into account its specific and «weak points»: – Application of out-of-date and ineffective organizational structures of enterprises
(meat-processing plants); – Low level of personnel qualification and worker’s property accountability for final
results; – Insufficient level of stimulation for workers that engage in development and
introduction of innovations on the enterprise; – Absence of program development of stress management for the workers of the
enterprise (especially slaughterhouses); – Requirement in the certification of enterprises on standards: ISO 9000 «control of
quality system»; iso 14000 «system of environment control»; ISO 22000 «system of safety foodstuffs providing»;
─── Economics and Management ───
─── Ukrainian Journal of Food Science. 2016. Volume 4. Issue 2 ─── 352
– Requirement in introduction of social standards of OHSAS 18000 “system of labour safety control»; iso 26000 “social responsibility guide», SA 8000 «system of social responsibility control», that provide safety concerns and health of workers, bringing up in the staff good attitude for quality and safe labour;
– Presence of heavy and harmful terms of labour, high level of hand labour (especially in abattoir building);
– Insufficient level of enterprises providing of highly skilled workers; – Complication of establishment of scientifically reasonable norms and actual
account of charges of energy resources on unit of concrete type of products at the wide range of products assortment (over 200 names);
– Application of big amount of quantity and production norms on production and setting of labour norms that gives the possibility for their manipulation.
Generalization of theoretical researches of forming the control system of personnel on the enterprise showed that most authors distinguished its next subsystems: analysis and planning of personnel; hiring and recruiting of personnel; personnel motivations; personnel estimations; management of personnel development; labour conditioning; informative providing of personnel control system; development of management organizational structure; legal providing [8, р.185]. For providing effective control system of personnel on the enterprises it is necessary to apply progressive foreign technologies of personnel management which are described in scientific works [1, 2, 5-7, 10]. The next subsystems of control system of personnel on the enterprise are offered:
Subsystem of the informatively-legal providing: study of labour changes and other legislation in the field of personnel management and labour economy; branch positions; labour market tendencies; wage changes, indemnifications, additional charges, bonuses system and others like that. Preparation of normative documents, instructions, positions and others like that are also needed. Information promotion on the web-site of the enterprise about vacancies, news of labour collective, social projects and charity actions are necessary too.
Analytical subsystem: development of skilled politics and skilled strategy; skilled planning; forecasting of personnel requirements; collaboration with organizations that provide staff for the enterprise; reception account and personnel liberation, moving; organization of effective personnel use; forming of skilled reserve; skilled office work and other.
Organizational subsystem: selection and personnel recruitment; realization of interviews, tests, questionnaire for the display of intellectual level, professionalism, communicativeness and other necessary quantities; personnel evaluation, attestation and rotary of personnel; estimation of knowledge level, practical skills, confirmation of mastery and personality responsibility; estimation of executable work and its results; realization of arrangements, sent to the exposure of accordance with the results of activity, qualities and personality potential of worker to the requirements that is pulled out to executable work; improvement of labour norms; tariffing of labour process; creation of safe terms for employees’ labour; observance of labour psychophysiology, ergonomics, technical aesthetics; establishment of corporate culture norms and others.
Motivational subsystem: development of the systems of motivation; development of personnel participation forms in incomes and capital of the enterprise; development of arrangements of material and non-material personnel stimulation of; organization of studies and in-plant personnel training; management adaptation of workers; organization of the tutorship system; management professional advancement and employees career, providing
─── Economics and Management ───
─── Ukrainian Journal of Food Science. 2016. Volume 4. Issue 2 ─── 353
of social workers defence: organization of feed, medical and home service, rest, social and health arrangements, social security; conflicts and stresses management.
Subsystem of controlling: providing of skilled safety; maintenance of high level of social labour relations; control of functional duties implementation in accordance with vacancy instructions; management of conflicts in production; antistress program development; social-psychological diagnostics; work with complaints; management labour discipline.
At market conditions the meat processing enterprises have a right to develop independently their own organizational structure. Modern requires of forming new subdivision is the department of personnel management on large meat processing plants with over 1000 persons (The public joint stock company “Kremenchugmiaso”, LTD «Globino”, LTD meat processing plant “Yuvileinyi” and others) on the basis of combination of functional duties of human department of the resources, department of labour organization and salary; department of social development, labour department; different laboratories and sectors (laboratories of scientific organization of labour and operations management; laboratory of organization and labour psychophysiology; sector of labour rationalization and invention), and also separate specialists (labour economist, labour norms engineer, engineer of personnel training, psychologist, legal adviser).
The tasks of new management personnel service: forming of effective control system and personnel use; development of skilled politics; labour resources management with taking into account the principles of optimization and economy; development of the effective systems of motivation and personnel stimulation; development management and professional advancement, labour career; antistress program development and prevention of conflicts in production and other.
For evaluation of control system efficiency of personnel of the enterprise, is given the methodology that is conducted for the next principles:
Principle of objectivity envisages the unpreconceived analysis of objective law conformities, tendencies and factors that influence on control system forming of personnel of the enterprise;
Principle of sequence envisages the observance of clear sequence of executions at the estimation of control system efficiency of personnel of the enterprise;
Principle of system envisages consideration of control system of personnel as component of open management system of the enterprise. It realizes the account of external and internal factors environment influence on personnel at the acceptance of administrative decisions in relation with forming of control system by personnel of the enterprise;
Principle of scientific character envisages using the estimation of control system efficiency of personnel of the enterprise of new methodical approaches in relation to the improvement of technologies of management of personnel taking into account front-rank scientific experience;
Principle of practical meaningfulness envisages usage of estimation results of control system efficiency of personnel at the acceptance of practical decisions on all levels of management of the enterprise;
Principle of intercommunication provides accounting of present intercommunications and co-operating with other objects of management of control system forming of personnel of the enterprise;
Principle of complexity envisages realization of estimation of control system efficiency of personnel of the enterprise from taking into account its constituents;
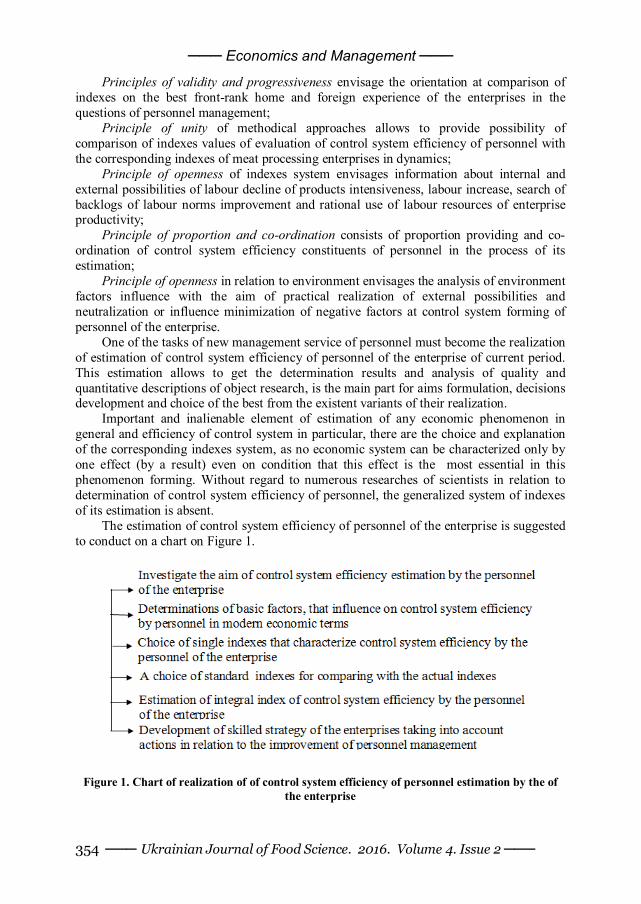
─── Economics and Management ───
─── Ukrainian Journal of Food Science. 2016. Volume 4. Issue 2 ─── 354
Principles of validity and progressiveness envisage the orientation at comparison of indexes on the best front-rank home and foreign experience of the enterprises in the questions of personnel management;
Principle of unity of methodical approaches allows to provide possibility of comparison of indexes values of evaluation of control system efficiency of personnel with the corresponding indexes of meat processing enterprises in dynamics;
Principle of openness of indexes system envisages information about internal and external possibilities of labour decline of products intensiveness, labour increase, search of backlogs of labour norms improvement and rational use of labour resources of enterprise productivity;
Principle of proportion and co-ordination consists of proportion providing and co-ordination of control system efficiency constituents of personnel in the process of its estimation;
Principle of openness in relation to environment envisages the analysis of environment factors influence with the aim of practical realization of external possibilities and neutralization or influence minimization of negative factors at control system forming of personnel of the enterprise.
One of the tasks of new management service of personnel must become the realization of estimation of control system efficiency of personnel of the enterprise of current period. This estimation allows to get the determination results and analysis of quality and quantitative descriptions of object research, is the main part for aims formulation, decisions development and choice of the best from the existent variants of their realization.
Important and inalienable element of estimation of any economic phenomenon in general and efficiency of control system in particular, there are the choice and explanation of the corresponding indexes system, as no economic system can be characterized only by one effect (by a result) even on condition that this effect is the most essential in this phenomenon forming. Without regard to numerous researches of scientists in relation to determination of control system efficiency of personnel, the generalized system of indexes of its estimation is absent.
The estimation of control system efficiency of personnel of the enterprise is suggested to conduct on a chart on Figure 1.
Figure 1. Chart of realization of of control system efficiency of personnel estimation by the of the enterprise
─── Economics and Management ───
─── Ukrainian Journal of Food Science. 2016. Volume 4. Issue 2 ─── 355
Calculation of indexes that characterize control system efficiency of personnel of the enterprise is presented in Table 1.
Table 1
Indexes of control system efficiency of personnel of the enterprise
N Name of indexes Standard value 1 Rates of increase of employee quantity (R em.q) Maximal value 2 Rates of increase of products making for one employee (R p.m.) Maximal value 3 Rates of increase of charges on labour remuneration in
complete charges (R l.r.) Maximal value
4 Rates of increase of labour remuneration fund (R l.r.f.) Maximal value 5 Rates of increase of labour productivity (R l.p.) Maximal value 6 Rates of increase of administrative charges per employee in
administrative level (R admin. level) Minimum value
The choice of standard indexes for comparing with the actual indexes of the
enterprise. The standard values of indexes it is possible to accept: 1. The best values of indexes for the enterprise at elector during 5,10, 15, 20 years; 2. The best values of indexes at elector during 5, 10, 15, 20 years, data from some of
investigated enterprises; 3. The best values of sub-branch level, that is determined by the specialists of the
National association of producers of meat and meat sub-product of Ukraine «Ukrmiaso, which has 70 large and middle enterprises.
The estimation of indexes in accordance with a standard value (max or min) for constituents is determined by formula:
P1 min = R em.q. standard / R em.q. (1)
or
P2 max = Т admin. level / Т admin. level, standard (2)
The next stage is a calculation of integral index of control system efficiency of personnel of the enterprise for years and comparing them with other enterprises.
The integral index of control system efficiency of personnel (IIofCSE) is suggested to determine by formula:
(IIofCSE) (3)
where R of em. q. are rates employee quantity; R of p. m. are rates of increase of products making for one employee; R of l.r. are rates of increase of charges on labour remuneration in complete charges; R of l. r. f. are rates of increase of labour remuneration fund; R of l. p. are rates of increase of labour productivity; R admin.level are rates of increase of administrative charges per employee in administrative level.
Approbation of methodology of control system efficiency estimation of personnel of the enterprise is carried out from data of Public joint-stock company «Kremenchugmiaso” and is presented in table. 2.
─── Economics and Management ───
─── Ukrainian Journal of Food Science. 2016. Volume 4. Issue 2 ─── 356
Table 2 Determination of standard values of control system efficiency estimation of personnel of public
joint-stock company «Kremenchugmiaso”
Indexes of control system efficiency of personnel Years R em.q. R p.m. R l.r. R l.r.f. R l.p. R admin. level
2001 1,05 1,04 1,13 1,43 1,01 1,03 2002 1,14 1,23 1,34 1,55 1,15 2,29 2003 1,39 0,93 1,11 1,69 1,80 1,96 2004 1,0 0,70 1,02 1,28 1,28 0,59 2005 1,0 0,91 1,02 1,45 1,02 1,2 2006 1,28 0,74 0,97 1,60 0,91 1,35 2007 1,07 0,98 1,65 1,38 1,11 0,88 2008 1,13 0,88 0,92 1,29 1,22 0,62 2009 0,94 1,08 0,87 0,92 1,15 1,41 2010 1,05 1,17 0,92 1,24 1,23 0,79 2011 1,01 1,06 1,08 1,22 1,11 1,17 2012 0,97 1,39 0,92 1,04 1,06 1,06 2013 0,99 0,79 1,12 1,09 1,03 1,23 2014 0,98 0,92 0,90 1,05 1,05 1,39 2015 0,90 0,82 1,12 0,86 1,09 0,89
Standard
1,39 max
1,39 max
1,65 max 1,69 max
1,80 max 0,59 min
***It is made by enterprise’s accounting
Table 3
Comparison of actual indexes with standard values of control system efficiency estimation of personnel of public joint-stock company «Kremenchugmiaso”
Indexes of control system efficiency of personnel Years R em.q. R p.m. R l.r. R l.r.f. R l.p. R admin. level
2001 0,75 0,74 0,68 0,85 0,56 0,57 2002 0,82 0,88 0,81 0,92 0,64 0,25 2003 1,0 0,66 0,67 1,00 1,00 0,30 2004 0,71 0,50 0,61 0,76 0,71 1,0 2005 0,71 0,65 0,61 0,86 0,57 0,49 2006 0,92 0,53 0,58 0,95 0,51 0,43 2007 0,76 0,70 1,0 0,82 0,62 0,67 2008 0,81 0,63 0,55 0,76 0,68 0,95 2009 0,67 0,77 0,52 0,54 0,64 0,41 2010 0,75 0,84 0,55 0,73 0,68 0,74 2011 0,72 0,76 0,65 0,72 0,62 0,50 2012 0,69 1,0 0,55 0,62 0,59 0,55 2013 0,71 0,56 0,67 0,64 0,57 0,47 2014 0,70 0,66 0,54 0,62 0,58 0,42 2015 0,64 0,58 0,67 0,51 0,61 0,66
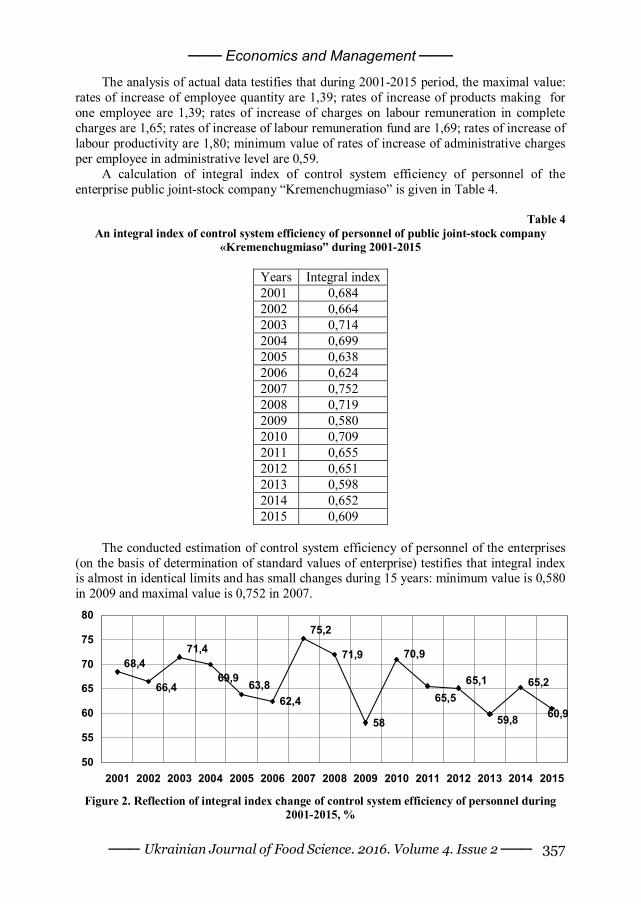
─── Economics and Management ───
─── Ukrainian Journal of Food Science. 2016. Volume 4. Issue 2 ─── 357
The analysis of actual data testifies that during 2001-2015 period, the maximal value: rates of increase of employee quantity are 1,39; rates of increase of products making for one employee are 1,39; rates of increase of charges on labour remuneration in complete charges are 1,65; rates of increase of labour remuneration fund are 1,69; rates of increase of labour productivity are 1,80; minimum value of rates of increase of administrative charges per employee in administrative level are 0,59.
A calculation of integral index of control system efficiency of personnel of the enterprise public joint-stock company “Kremenchugmiaso” is given in Table 4.
Table 4
An integral index of control system efficiency of personnel of public joint-stock company «Kremenchugmiaso” during 2001-2015
Years Integral index 2001 0,684 2002 0,664 2003 0,714 2004 0,699 2005 0,638 2006 0,624 2007 0,752 2008 0,719 2009 0,580 2010 0,709 2011 0,655 2012 0,651 2013 0,598 2014 0,652 2015 0,609
The conducted estimation of control system efficiency of personnel of the enterprises
(on the basis of determination of standard values of enterprise) testifies that integral index is almost in identical limits and has small changes during 15 years: minimum value is 0,580 in 2009 and maximal value is 0,752 in 2007.
62,4
71,9
5860,9
65,2
59,8
65,165,5
70,9
75,2
63,869,9
71,4
66,4
68,4
50
55
60
65
70
75
80
2001 2002 2003 2004 2005 2006 2007 2008 2009 2010 2011 2012 2013 2014 2015
Figure 2. Reflection of integral index change of control system efficiency of personnel during 2001-2015, %
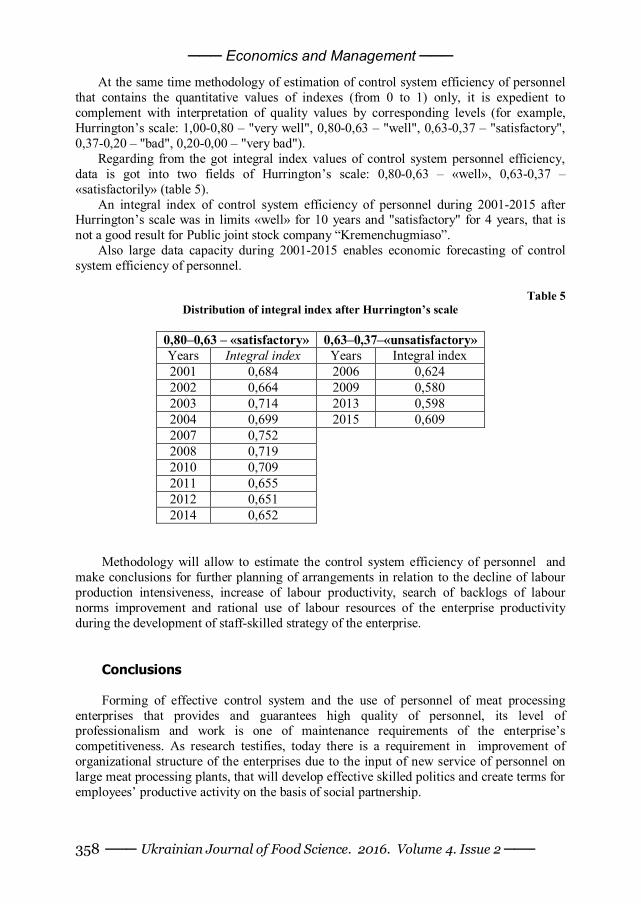
─── Economics and Management ───
─── Ukrainian Journal of Food Science. 2016. Volume 4. Issue 2 ─── 358
At the same time methodology of estimation of control system efficiency of personnel that contains the quantitative values of indexes (from 0 to 1) only, it is expedient to complement with interpretation of quality values by corresponding levels (for example, Hurrington’s scale: 1,00-0,80 – "very well", 0,80-0,63 – "well", 0,63-0,37 – "satisfactory", 0,37-0,20 – "bad", 0,20-0,00 – "very bad").
Regarding from the got integral index values of control system personnel efficiency, data is got into two fields of Hurrington’s scale: 0,80-0,63 – «well», 0,63-0,37 – «satisfactorily» (table 5).
An integral index of control system efficiency of personnel during 2001-2015 after Hurrington’s scale was in limits «well» for 10 years and "satisfactory" for 4 years, that is not a good result for Public joint stock company “Kremenchugmiaso”.
Also large data capacity during 2001-2015 enables economic forecasting of control system efficiency of personnel.
Table 5
Distribution of integral index after Hurrington’s scale
0,80–0,63 – «satisfactory» 0,63–0,37–«unsatisfactory» Years Integral index Years Integral index 2001 0,684 2006 0,624 2002 0,664 2009 0,580 2003 0,714 2013 0,598 2004 0,699 2015 0,609 2007 0,752 2008 0,719 2010 0,709 2011 0,655 2012 0,651 2014 0,652
Methodology will allow to estimate the control system efficiency of personnel and
make conclusions for further planning of arrangements in relation to the decline of labour production intensiveness, increase of labour productivity, search of backlogs of labour norms improvement and rational use of labour resources of the enterprise productivity during the development of staff-skilled strategy of the enterprise.
Conclusions Forming of effective control system and the use of personnel of meat processing
enterprises that provides and guarantees high quality of personnel, its level of professionalism and work is one of maintenance requirements of the enterprise’s competitiveness. As research testifies, today there is a requirement in improvement of organizational structure of the enterprises due to the input of new service of personnel on large meat processing plants, that will develop effective skilled politics and create terms for employees’ productive activity on the basis of social partnership.
─── Economics and Management ───
─── Ukrainian Journal of Food Science. 2016. Volume 4. Issue 2 ─── 359
Offered methodology of estimation of control system efficiency of personnel, that is approved on data of public joint stock company “Kremenchugmiaso”, helps the personnel management department to find «weak points» in this system, and develop the arrangements in relation to its improvement.
Further development of control system of the personnel of meat processing enterprise is not possible without introduction of new technologies of management and the uses of workers, that decide different social labour questions by means of software, application of the collective thinking and other creative approaches.
References
1. Michael Armstrong, Angela Baron (2007), Performance Management. The New Realities (Developing Practice), Hippo Publishing Ltd.
2. Herman Aguinis, Wayne Cascio (2013), Applied Psychology in Human Resource Management, Pearson New International Edition.
3. Balabanova L., Sardak O. (2010), Human Resource Management, Center uchbovoi lіteratury, Donetsk.
4. Bukovinska M. (2013), Human Resource Management, Kondor, Kyiv 5. Caroline Hook, Margaret Foot (2011), Introducing Human Resource Management,
Financial Times Prentice Hall. 6. Mick Marchington, Adrian Wilkinson (2005), Human Resource Management at Work,
People Management and Development, the United Kingdom, London. 7. Larry Stout (2009), Human Resource Management, Dobra knyga, Kyiv. 8. Lozinskiy I., Eliseeva L. (2012), Theoretical basis of hr management system at an
enterprise, The economy and regions, 3, pp. 184−188. 9. Оsipova А. (2012), Analysis of the theoretical foundations of effective personnel
management system, Visnyk Khmelnytsky National University. Economic science, 6, pp. 45–52.
10. John Stredwick (2005), Introduction to Human Resource Management, Butterworth-Heinemann, United Kingdom, Abingdon.
11. Lepak, D. P., Liao, H., Chung, Y., Harden, E. E. (2006), A conceptual review of human resource management systems in strategic human resource management research, Research in personnel and human resources management, Emerald Group Publishing Limited, pp. 217–271.
─── Abstracts ───
─── Ukrainian Journal of Food Science. 2016. Volume 4. Issue 2 ─── 360
Анотації
Харчові технології
Використання концентратів харчових волокон в технології бісквітних напівфабрикатів
Олена Кобець, Оксана Арпуль, Віктор Доценко, Ірина Довгун
Національний університет харчових технологій, Київ, Україна
Вступ. Досліджено вплив концентратів харчових волокон, а саме, клітковини пшеничної, яблучної та какао на білково-протеїназний та вуглеводно-амілазний комплекси пшеничного борошна.
Матеріали та методи. Дослідження впливу харчових волокон на показники якості клейковини тіста здійснювали за загальноприйнятими методиками, структурно-механічних показників – за допомогою альвеогафа, амілографа та фаригографа.
Результати та обговорення. Присутність клітковини сприяє підвищенню водопоглинальної здатності та часу утворення тіста і зменшенню його стійкості. Встановлено, що клітковина підвищує ступінь зв’язування води тістом в середньому на 12,5…23,2%, що пов’язано зі здатністю її полісахаридного комплексу зв’язувати і утримувати воду. Результати дослідження на альвеографі свідчать про те, що внесення клітковини в кількості 15–25% від маси борошна в зрівнянні з контролем підвищує пружність тіста в 1,2–2 рази та зменшує розтяжність в 1,3–3 рази. Обґрунтовано доцільність використання поверхнево-активних речовин в технології бісквітного напівфабрикату, з метою поліпшення якості готових виробів. Визначено, що введення у тісто разом з клітковиною суміші емульгаторів «Grindsted Cake» призводить до підвищення його розтяжності в середньому на 2,6% та еластичності на 2,6…6,8%, що, очевидно, буде позитивно впливати на якість готових виробів.
Висновки. Додавання суміші емульгаторів «Grindsted Cake» призводить до підвищення пористості, питомого об’єму та коефіцієнту підйому готових виробів з додаванням клітковини пшеничної, яблучної та какао, таким чином дозволяючи наблизити показники якості готового напівфабрикату до показників якості контролю, або ж їх перевершити.
Ключові слова: борошно, емульгатор, клейковина, клітковина.
Удосконалення технології паштетів для геродієтичного харчування
Людмила Пешук, Олег Галенко, Ірина Радзієвська, Богун Володимир
Національний університет харчових технологій, Київ, Україна
Вступ. Досліджено технологію виробництва паштетів збалансованих за мікронутрієнтним складом з метою удосконалення та розширення асортименту геродієтичних продуктів.
Матеріали та методи. Проаналізовано потенційну сировину для розробки спеціального продукту для людей похилого віку, пристарілих та довгожителів. Для
─── Abstracts ───
─── Ukrainian Journal of Food Science. 2016. Volume 4. Issue 2 ─── 361
удосконалення рецептур використані методи математичного моделювання з врахуванням хімічного складу сировини та структурно-механічних показників готового продукту.
Результати і обговорення. Розроблений паштет має більш збалансований мікронутрієнтний склад у порівнянні з контрольними зразками. Встановлено, що в контрольному зразку паштетів різко розбалансований вміст Са і Р – 1:9,8 при рекомендованому 2:1. При збільшені вмісту білково-мінерального збагачувача геродієтичного в рецептурі збільшується вміст Са і зменшується вміст Р. При цьому при внесенні 10% білково-мінерального збагачувача геродієтичного до рецептури паштету співвідношення майже ідеальне Са:Р = 1:0,5. Також встановлено, що додавання 5% білково-мінерального збагачувача геродієтичного (рецептура №1) не раціональне оскільки не є оптимальним для геродієтичних продуктів – вміст Са всього 174,1 мг на 100 г продукту або ж 13,7% від добової потреби.
Мікроструктура розробленого паштету включає в свій склад м’язову тканину в вигляді ідентифікуємих фрагментів м’язових волокон розміром до 0,7-0,8 мм. М’язова тканина має характерні для температурного впливу мікроструктурні зміни – помірну деструкцію м’язових волокон, що виражається в набуханні, появі їх розривів та фрагментації. Клітині ядра виявляються у м’язових волокон у вигляді тіней, в сполучній тканині їх збереженість вища.
При заміні частини м'ясної сировини білково-мінеральним збагачувачем геродієтичним пористість структури залишається помірною та відповідає даному виду м'ясного продукту. Внесення ферментованого колагеназою харчовою рубця ВРХ не приводить до не суттєвих змін мікроструктури м’язової та сполучнотканинної структури.
Висновки. Рекомендується використовувати розробку в харчуванні людей похилого віку, пристарілих та довгожителів.
Ключові слова: м'ясо, харчування, геродієтика, паштет, білок, кальцій.
Гістологічні характеристики удосконалених м’ясних посічених напівфабрикатів
Ольга Маслійчук, Марія Паска
Львівський національний університете ветеринарної медицини та біотехнологій імені С.З. Гжицького, Львів, Україна
Вступ. Проведення гістологічних характеристик м’ясних посічених
напівфабрикатів дозволяють виявляти компоненти, диференціювати властивості різних тканинних і клітинних структур, а також щоб здійснювати контроль продукції.
Матеріали та методи. Об’єктами досліджень були удосконалені фарші яловичі з заміною 5%, 10%, 15% м’ясної частки на люпинове борошно та додаванням 0,5% порошку кореня дивосилу, як пряно-ароматичної сировини та контрольний зразок яловичого фаршу. Для мікроскопічного дослідження матеріал розроблених фаршів маркували і фіксували у 10 % нейтральному розчині формаліну. На санному мікротомі виготовляли зрізи, завтовшки від 0,5-1 см, які фарбували гематоксиліном та еозином, ШИК реакція. Світлову мікроскопію і мікрофотографування гістопрепаратів здійснювали за допомогою мікроскопа Leica DM 2500 та фотокамери Leica DFC 450C програмного забезпечення Leica aplitation suite 4.4.
Результати та обговорення. При мікроструктурному дослідженні зразків у фаршах виявили м'язові волокна полігональної і круглої форми, цитоплазма яких рівномірно забарвлена в червонувато-рожевий колір, а їх темно-сині ядра добре
─── Abstracts ───
─── Ukrainian Journal of Food Science. 2016. Volume 4. Issue 2 ─── 362
проглядалися під сарколемою. Це вказує на те, що для фаршу використовувалось свіже охолоджене м'ясо, також серед м'язових волокон проглядались осередки жирової тканини, яка гістологічно характеризується сітчастою структурою. В місцях розташування шматочків сала виявляли вакуолі різної форми і розміру, що й надавало зрізу сітчастого вигляду. Зібраними групами круглі цитоплазми світло фіолетового кольору з ядрами темно-фіолетового кольору розміщеними в центрі клітин полігональної форми представлене люпинове борошно; розсипчастими волокнами коричневого кольору зображено хлібну масу; хвилястими волокнами фіолетового кольору зображено цибулю ріпчасту, темно-коричневими поодинокими точками позначено дивосил.
Висновки. Гістологічні дослідження показали за Шик реакцією вміст у м’ясних розроблених напівфабрикатах м’ясної та рослинної частин. За гематоксиліном та еозином визначили відсотковий склад фаршів.
Ключові слова: гістологія, люпин, борошно, дивосил, м’ясо, котлета, білок.
Удосконалення технології водно-спиртових настоїв для виробництва сиропів
Олег Кузьмін, Яна Ковальчук, Володимир Величко, Наталія Романченко
Національний університет харчових технологій, Київ, Україна
Вступ. Метою роботи є наукове обґрунтування та інноваційні технології водно-спиртових настоїв для виробництва сиропів у кондитерських виробах, для надання їм функціональних та оздоровчих властивостей.
Матеріали і методи. Методи дослідження: редоксметрія – визначення антиокислювальної здатності водно-спиртових настоїв рослинної сировини; рН-метрія; методики визначення органолептичних показників.
Результати. Отримано мінімальне теоретично очікуване значення ОВПмін для рослинних водно-спиртових настоїв, яке має значення від 203,0 мВ (корінь імбиру), до 480,9 мВ (суданська троянда), а фактичний виміряний ОВПфакт – від 82 мВ (листя суниці) до 246 мВ (корінь імбиру). При цьому, мінімальна величина відновної здатності (ЕВ) дорівнює – 42,3 мВ та характерна для корінню імбиру, а найбільше значення 266 мВ має водно-спиртовий настій з плодів калини. Рівень рН для водно-спиртових настоїв має значення від 2,985 (суданська троянда) до 7,605 (корінь імбиру), тобто екстракти мають реакції від кислої до слаболужної.
Виділено групи настоїв за антиокислювальною активністю: настої з низькою активністю – 3 зразки (25 %), серед яких корінь імбиру, плоди яблук, плоди бузини; настої з середньою активністю – 4 зразки (33 %), серед яких найменше значення 133,4 мВ має кориця, а найбільше – 171,8 мВ має листя вишні; настої з високою активністю – 5 зразків (42 %), серед яких горобина – 234,3 мВ, вишня – 247,5 мВ, суданська троянда – 260,4 мВ, калина – 266 мВ та обліпиха – 282,4 мВ.
Висновки. Визначено найбільш перспективні джерела природних антиоксидантів для використання у технології сиропів для просочування в кондитерській промисловості.
Ключові слова: бісквіт, настій, сироп, антиоксидант.
─── Abstracts ───
─── Ukrainian Journal of Food Science. 2016. Volume 4. Issue 2 ─── 363
Експертиза якості майонезу
Наталя Мєдвєдєва Національний університет біоресурсів та природокористування, Київ, Україна
Вступ. Незаперечним фактором успішності торгової марки є якість продукції що
виготовляється. Якість майонезу визначається комплексом показників: органолептичних (смак, запах, колір, консистенція), фізико-хімічних (жирність, крохмаль, кислотність, наявність кислот), мікробіологічних (біфідобактерії, мікроорганізми, дріжджі, плісняві гриби, бактерії).
Матеріали та методи. Дослідження проведені на прикладі зразків українських виробників різних торгових марок. Зразки майонезу оцінювалися за органолептичними, фізико-хімічними, мікробіологічними показниками та проводилась оцінка упаковки й маркування даної продукції. Рівень якості майонезу оцінювали за допомогою дескрипно-профільного методу сенсорного аналізу із застосуванням п’яти бальної системи та залучення групи експертів.
Результати і обговорення. Результати аналізу маркування виявили відсутність індексу Е при указані харчових добавок майонезу виробників торгових марок «Королівський смак» Королівський й «ОЛІС» Провансаль.
Запропоновано дискрептори органолептичних показників (консистенція, смак і запах, колір), маркування й зовнішнього виду упаковки, визначено їх профілювання за п’яти бальною шкалою. За допомогою дескрипторно-профільного методу визначили найбільш конкурентоспроможну й привабливу продукцію для споживача. Найвищу оцінку має продукція «Королівський смак» Королівський й «Торчин» Прованський.
Фізико-хімічні дослідження майонезу показали, що кислотність зразків склала від 0,18% до 0,51%, вміст жиру – 67% на всіх зразках, що відповідає інформації упаковки. Кількість сорбінової кислоти в межах норми – не більше 1000 мг/кг. Крім того у виробника «Оліс» присутній консервант – бензойна кислота, яка не була заявлена, її вміст складає 19,4 мг/кг.
Мікробіологічні дослідження не виявили порушень жодного виробника. Висновки. Отримані результати дослідження майонезу різних виробників за
фізико-хімічними й мікробіологічними показниками свідчать, що їхні значення повністю відповідають вимогам чинних нормативів України.
Keywords: майонез, маркування, якість, органолептика, дескриптори.
Математична модель активізації рідини при виготовленні хліба у домашній хлібопічці
Віталій Бородін, Ганна Циганкова Національний університет харчових технологій, Київ, Україна
Вступ. В рецептурних книгах відмічається, що піноутворення за рахунок
збивання яєць при підготовці інгредієнтів для випікання хліба, покращує якість хліба. В роботі дано обґрунтування цього факту.
Матеріали і методи. Розглянуто хліб-бріошь, виготовлений у домашній хлібопічці. Застосовано методи математичного моделювання для розгляду проблеми активізації рідини при виготовленні хліба у побутовій хлібопічці.
─── Abstracts ───
─── Ukrainian Journal of Food Science. 2016. Volume 4. Issue 2 ─── 364
Результати та обговорення. Під рідиною будемо розуміти будь-яку субстанцію, що розтікається. Якщо в результаті застосування певної технології отримаємо зміни (які можна зафіксувати вимірюванням) в позитивному напрямку деяких характеристик готового продукту, то будемо говорити про активізацію рідини. Наведено приклади активізації рідини.
Побудовано математичну модель, яка показує, що інтенсивність контакту твердої та рідкої фракцій при переводі рідини у піну повинна зростати. Вважається, що піна складається з сукупності сферичних сегментів сфер довільного радіусу R різної висоти h . На висоти сегментів h накладено природне обмеження, що вони рівномірно розподілені на проміжку [ 0, R ]. Для характеристики площі контакту твердої та рідкої фракцій розглядається поняття коефіцієнта купольності. Математичне сподівання коефіцієнтів купольності сферичних сегментів визначає середній коефіцієнт купольності. Доведено, що для запропонованої моделі середній коефіцієнт купольності дорівнює 1,5.
Висновки. Запропонована математична модель піни показує можливість інтенсифікації контакту твердої фракції та рідини у 1,5 рази при переводі рідини у піну.
Ключові слова: хліб, моделювання, піноутворення.
Процеси і обладнання харчових виробництв
Кінетика сушіння зерна пшениці в тонкому шарі
В’ячеслав Михайлик1, Святослав Лементар2,
Роман Якобчук2, Євгеній Скринник2, Роман Семенко2
1- Інститут технічної теплофізики НАН України, Київ, Україна 2- Національний університет харчових технологій, Київ, Україна
Вступ. Досліджено закономірності процесу сушіння зерна пшениці в тонкому
шарі для обґрунтування раціональних режимів теплової обробки зерна в сушильних апаратах конвективного типу.
Матеріали та методи. В дослідженнях було використано зерно пшениці. Щоб надати зерну польової вологості його штучно зволожували. Вологість визначали висушуванням до абсолютно сухої маси. Дослідження процесу сушіння проводили на експериментальному стенді конвективного типу.
Результати і обговорення. Аналіз результатів експериментальних досліджень процесу конвективного сушіння зерна пшениці з різною вологістю показав, що підвищення температури сушильного агента з 80 до 100 ºС збільшує швидкість та зменшує тривалість сушіння зерна в 2,2–2,3 рази, а збільшення швидкості сушильного агента з 1,5 до 2,5 м/с викликає зростання швидкості та скорочення часу сушіння ~20 %
Збільшення товщини шару зерна з 10 до 15 мм за рахунок зростання площі випаровування призводить до збільшення швидкості сушіння в 1,1-1,2 рази в залежності від швидкості повітря.
При конвективному сушінні непорушного шару зерна висотою 10 і більше мм при боковому обдуванні сушильним агентом досягнути однакової вологості зерна в об’ємі зразка за 40…60 хв. практично неможливо.
─── Abstracts ───
─── Ukrainian Journal of Food Science. 2016. Volume 4. Issue 2 ─── 365
Висновки. Встановлено, що використання сушильного агенту з температурою 100 ºС збільшує швидкість сушіння зерна в 2,2–2,3 рази в порівнянні з температурою 80 ºС; збільшення швидкості сушильного агенту з 1,5 до 2,5 м/с забезпечує зростання швидкості сушіння зерна на ~20 %.
Ключові слова: зерно, пшениця, сушіння, шар, вологовміст.
Інженерний метод розрахунку параметрів димових газів вугільних теплових електростанцій на основі характеристик твердого палива
Ігор Вольчин1, Людмила Гапонич2
1 – Інститут вугільних енерготехнологій НАН України, Київ, Україна 2 – Національний університет харчових технологій, Київ, Україна
Вступ. Збільшення частки вугілля в паливному балансі теплових електростанцій
(ТЕС) призвело до зростання валових викидів SO2 до 1 млн. т/ рік. Це вимагає впровадження на вугільних електростанціях технологічних заходів по скороченню викидів оксидів сірки.
Матеріали і методи. За стандартною методикою були виконані розрахунки питомих об’ємів димових газів та концентрацій в них діоксиду сірки за даними 96 сертифікатів на вугільну продукцію з шахт та збагачувальних фабрик Донецького вугільного басейну. Результати. В результаті були отримані емпіричні лінійні залежності питомого об’єму сухого димового газу від теплоти згоряння палива і вмісту золи в паливі та залежності концентрації діоксиду сірки від вмісту сірки і золи в паливі, окремо для низькореакційного і високореакційного вугілля. При наявності втрат теплоти через механічний недопал палива, питомий об’єм сухих димових газів зменшується в (1 – qu/100) раз, а концентрація діоксиду сірки в них збільшується в 1/(1 – qu/100) раз. Створено інженерний метод визначення питомих викидів сухих димових газів на вугільних теплових електростанціях України та очікуваної концентрації діоксиду сірки в них на основі даних технічного аналізу при наявності механічного недопалу палива. Метод розрахунку питомих викидів сухих димових газів на ТЕС і ТЕЦ та очікуваної концентрації в них діоксиду сірки пропонується використовувати в диапазоні зольності палива Ad від 4.0 до 50.0% та теплоти згоряння палива Qi
r від 14.5 до 32.0 МДж/кг. Пропонований інженерний метод був використаний для розрахунку оцінки валових викидів SO2 і обсягів сухих димових газів на вугільних теплових електростанціях України з 2012 року до 2016 року Значення питомих викидів сірки в димових газах в останні роки знаходяться на рівні 16–20 г/кВт-год. відпущеної електроенергії. Висновки. Розроблений метод дозволяє зробити оцінку очікуваних викидів діоксиду сірки в димових газах та обрати необхідну технологію десульфуризації для дотримання вимог екологічного законодавства. Ключові слова: eнергетика, eкологія, теплоелектростанція, дим, газ, викид, діоксид сірки
Математичне моделювання і оптимізація в САПР елементів апаратів харчової
та хімічної промисловості
Павло Швець, Алла Торопенко, Євгенія Науменко, Хусаін Валід Шер
─── Abstracts ───
─── Ukrainian Journal of Food Science. 2016. Volume 4. Issue 2 ─── 366
Одеський національний політехнічний університет, Одеса, Україна
Вступ. Робота присвячена підвищенню якості автоматизованого проектування апаратів харчової та хімічної промисловості за рахунок зменшення маси їх деталей при збереженні надійності апаратів в цілому.
Матеріали та методи. Досліджується напружено-деформований стан круглих оболонок, які працюють під розподіленим навантаженням. В апаратах підвищеного тиску до таких деталей відносяться днища. При розрахунках використані математичні методи, які використовують функції Гауса, Уіттекера та Кумера. Для таких розрахунків використана програма Maple 13.
Результати і обговорення. Встановлено, що круглі пластини постійної товщини виявляються конструктивно нераціональними. У зв'язку з цим у роботі пропонується перехід до конструювання круглих пластин змінної товщини й розроблюється метод проектування таких пластин. Розроблено аналітичний метод визначення напружено-деформованого стану пластинчастих деталей круглої форми та змінної товщини при згинанні, який дозволяє отримати розв’язок в найбільш зручній для аналізу замкненій формі (у вигляді формул). Границею круглої пластини є окружність, тому для розрахунків застосовується полярна система координат. В розв'язку були задіяні дві функції Уіттекера першого й другого роду. Порівнюючи параметри у функції Уіттекера і у функцій Куммера, визначили нову форму для власних функцій. Перевірка еквівалентності переходу до функцій Куммера виконана в програмі Maple 13. Повне співпадіння графіків власних функцій свідчить про коректність виконаної заміни. Функції Куммера і Уіттекера належать до класу вироджених гіпергеометричних функцій, їх використовують для побудови рішень у деяких задачах фізики, астрономії та механіки.
Висновки. Запропоновано спосіб проектування раціональних діаметральних перерізів елементів машин і апаратів, які мають форму круглих пластин.
Ключові слова: напруження, САПР, деформування, кругла пластина, функція, Гаус.
Економіка і управління
Методика оцінки системи управління персоналом підприємства м'ясопереробної галузі
Олена Драган, Аліна Бергер
Національний університет харчових технологій, Київ, Україна
Вступ. Стаття присвячена питанню формування системи управління персоналом підприємств м'ясопереробної галузі, уточненню її структури. Пропонується визначення інтегрального показника оцінки ефективності системи управління персоналом підприємства.
Матеріали і методи дослідження. У роботі застосовуються методи: системного аналізу в питаннях формування структури системи управління персоналом і використання його в практичній діяльності підприємства; аналізу і синтезу, аналогії і порівняння − в методиці оцінки ефективності системи управління персоналом підприємства.
─── Abstracts ───
─── Ukrainian Journal of Food Science. 2016. Volume 4. Issue 2 ─── 367
Результати та обговорення. Проблема формування ефективної системи управління персоналом є однією з найбільш важливою для сучасного управління підприємством (організацією), як з наукової так, і з практичного боку дослідження.
З огляду на специфіку підприємств м'ясопереробної галузі, виникає необхідність вдосконалення системи управління персоналом підприємства. По телевізору можна підсистеми системи управління персоналом: інформаційно-правового забезпечення, аналітична, організаційна, мотиваційна та контролінгу.
Для оцінки ефективності системи управління персоналом підприємства пропонується методика, яка передбачає: визначення одиничних показників, які характеризують дану систему; вибір еталонного значення показників для порівняння з фактичними показниками; розрахунок інтегрального показника ефективності даної системи.
Висновки. Запропоновані підходи до вдосконалення системи управління персоналом підприємства м’ясопереробної галузі дозволяють зробити відповідні висновки для подальшого планування заходів щодо підвищення продуктивності праці, пошуку резервів вдосконалення нормування праці і раціонального використання трудових ресурсів, забезпечення стабільності кадрових показників роботи, збільшення мотиваційних пропозицій при розробці кадрової стратегії підприємства. Методика оцінки ефективності системи управління персоналом підприємства на основі найбільш поширених економічних показників відрізняється доступністю і простотою у використанні.
Ключові слова: персонал, ефективність, підприємство, м’ясо, галузь, переробка.
─── Abstracts ───
─── Ukrainian Journal of Food Science. 2016. Volume 4. Issue 2 ─── 368
Аннотации
Пищевые технологии
Использования концентратов пищевых волокон в технологии бисквитных полуфабрикатов
Елена Кобец, Оксана Арпуль, Виктор Доценко, Ирина Довгун
Национальный университет пищевых технологий, Киев, Украина
Введение. Исследовано влияние концентратов пищевых волокон, а именно, клетчатки пшеничной, яблочной и какао на белково-протеиназный и углеводно-амилазный комплексы пшеничной муки.
Материалы и методы. Исследование влияния ПВ на показатели качества клейковины теста осуществляли по общепринятым методикам, структурно-механических показателей – с помощью альвеогафа, амилографа и фаригографа.
Результаты и обсуждение. Присутствие клетчатки способствует повышению водопоглотительной способности и времени образования теста и уменьшению его устойчивости. Установлено, что клетчатка повышает степень связывания воды тестом в среднем на 12,5...23,2%, что связано со способностью ее полисахаридного комплекса связывать и удерживать воду. Результаты исследования на альвеографе свидетельствуют о том, что внесение клетчатки в количестве 15...25% от массы муки в сравнении с контролем повышает упругость теста в 1,2...2 раза и уменьшает растяжимость в 1,3...3 раза. Обоснована целесообразность использования поверхностно-активных веществ в технологии бисквитного полуфабриката, с целью улучшения качества готовых изделий. Определено, что введение в тесто вместе с клетчаткой смеси эмульгаторов «Grindsted Cake» приводит к повышению его растяжимости в среднем на 2,6% и эластичности на 2,6...6,8%, что, очевидно, будет положительно влиять на качество готовых изделий.
Выводы. Добавление смеси эмульгаторов «Grindsted Cake» приводит к повышению пористости, удельного объема и коэффициента подъема готовых изделий с добавлением клетчатки пшеничной, яблочной и какао, таким образом позволяя приблизить показатели качества готового полуфабриката к показателям качества контроля, или же их превзойти.
Ключевые слова: мука, эмульгатор, клейковина, клетчатка.
Усовершенствование технологии паштетов для геродиетичного питания
Людмила Пешук, Олег Галенко, Ирина Радзиевская, Богун Владимир Национальный университет пищевых технологий, Киев, Украина
Введение. Исследовано технологию производства паштетов збалансированных
за микронутриентным составом с целью усовершенствования и росширения ассортимента геродиетических продуктов.
Материалы и методы. Проанализировано потенциальное сырье для разработки специального продукта для пожилых людей, престарелых и долгожителей. Для усовершенствования рецептур использованы методы математического
─── Abstracts ───
─── Ukrainian Journal of Food Science. 2016. Volume 4. Issue 2 ─── 369
моделирования с учетом химического состава и структурно-механических показателей конечного продукта.
Результаты и обсуждение. Разработанный паштет имеет более сбалансированный микронутриентный состав по сравнению с контрольными образцами. Установлено, что в контрольном образце паштетов резко разбалансирован содержание Са и Р – 1: 9,8 при рекомендуемом 2: 1. При увеличении содержания белково-минерального обогатителя геродиетического в рецептуре увеличивается содержание Са и уменьшается содержание Р. При этом при внесении 10% белково-минерального обогатителя геродиетического рецептуре паштета соотношение почти идеальное Са: Р = 1: 0,5. Также установлено, что добавление 5% белково-минерального обогатителя геродиетического (рецептура №1) не рационально поскольку не является оптимальным для геродиетических продуктов – содержание Са всего 174,1 мг на 100 г продукта или 13,7% от суточной потребности.
Микроструктура разработанного паштета включает в свой состав мышечную ткань в виде идентификуемых фрагментов мышечных волокон размером до 0,7-0,8 мм. Мышечная ткань имеет характерные для температурного воздействия микроструктурные изменения – умеренную деструкцию мышечных волокон, выражается в набухании, появление их разрывов и фрагментации. Клетке ядра оказываются в мышечных волокон в виде теней, в соединительной ткани их сохранность выше.
При замене части мясного сырья белково-минеральным обогатителем геродиетическим пористость структуры остается умеренной и соответствует данному виду мясного продукта. Внесение ферментированного коллагеназой пищевой рубца КРС не приводит к существенным изменениям микроструктуры мышечной и соединительнотканной структуры.
Выводы. Рекомендуется использовать разработку в питании пожилых людей, престарелых и долгожителей.
Ключевые слова: мясо, питание, геродиетика, паштет, белок, кальций.
Гистологические характеристики усовершенствованных мясных секущихся полуфабрикатов
Ольга Маслийчук, Мария Пасха
Львовский национальный Университет ветеринарной медицины и биотехнологий имени С.З. Гжицького, Львов, Украина
ведение. Проведение гистологических характеристик мясных секущихся
полуфабрикатов позволяют выявлять компоненты, дифференцировать свойства различных тканевых и клеточных структур, а также для осуществления контроля продукции.
Материалы и методы. Объектами исследований были усовершенствованные говяжьи фарши с заменой 5%, 10%, 15% мясной доли на люпиновою муку и добавлением 0,5% порошка корня девясила, как пряно-ароматического сырья и контрольный образец говяжьего фарша. Для микроскопического исследования материал разработанных фаршей маркировали и фиксировали в 10% нейтральном растворе формалина. На санном микротоме изготавливали срезы толщиной от 0,5-1 см, которые окрашивали гематоксилином и эозином, ШИК реакцией. Световую микроскопию и микрофотосъемки гистопрепаратов осуществляли с помощью
─── Abstracts ───
─── Ukrainian Journal of Food Science. 2016. Volume 4. Issue 2 ─── 370
микроскопа Leica DM 2500 и фотокамеры Leica DFC 450C программного обеспечения Leica aplitation suite 4.4.
Результаты и обсуждение. При микроструктурном исследовании образцов в фаршах обнаружили мышечные волокна полигональной и круглой формы, цитоплазма которых равномерно окрашена в красновато-розовый цвет, а их темно-синие ядра хорошо просматривались под сарколеммой. Это указывает на то, что для фарша использовалось свежее охлажденное мясо, также среди мышечных волокон просматривались ячейки жировой ткани, которая гистологически характеризуется сетчатой структурой. В местах расположения кусочков сала выявлялись вакуоли различной формы и размера, что и придавало срезу сетчатый вид. Собранными группами круглые цитоплазмы фиолетового цвета с ядрами темно-фиолетового цвета размещенными в центре клеток полигональной формы представлена люпиновая мука; рассыпчатыми волокнами коричневого цвета изображена хлебная масса; волнистыми волокнами фиолетового цвета изображен лук репчатый, темно-коричневыми единичными точками обозначен девясил.
Выводы. Гистологические исследования показали по Шик реакции содержание в мясных разработанных полуфабрикатах мясную и растительные части. По гематоксилину и эозину определили процентный состав фарша. Ключевые слова: гистология, люпин, мука, девясил, мясо, котлета, белок.
Усовершенствование технологии водно-спиртовых настоев для производства сиропов
Олег Кузьмин, Яна Ковальчук, Владимир Величко, Наталья Романченко
Национальный университет пищевых технологий, Киев, Украина
Введение. Целью работы является научное обоснование и инновационные технологии водно-спиртовых настоев для производства сиропов в кондитерских изделиях, для предоставления им функциональных и оздоровительных свойств.
Материалы и методы. Методы исследования: редоксметрія – определение антиокислительной способности водно-спиртовых настоев растительного сырья; рН-метрия; методики определения органолептических показателей.
Результаты. Получено минимальное теоретически ожидаемое значение ОВПмин для растительных водно-спиртовых настоев, которые имеют значения от 203,0 мВ (корень имбиря), до 480,9 мВ (суданская роза), а фактический измеренный ОВПфакт – от 82 мВ (листья земляники) до 246 мВ (корень имбиря). При этом, минимальная величина восстановительной способности (ЕВ) равняется – 42,3 мВ и характерна для корня имбиря, а наибольшее значение 266 мВ имеет водно-спиртовой настой из плодов калины. Уровень рН для водно-спиртовых настоев имеет значение от 2,985 (суданская роза) до 7,605 (корень имбиря), то есть экстракты имеют реакции – от кислой до слабощелочной.
Выделены группы настоев по антиокислительной активности: настои с низкой активностью – 3 образца (25 %), среди которых корень имбиря, плоды яблок, плоды бузины; настои со средней активностью – 4 образца (33 %), среди которых наименьшее значение 133,4 мВ имеет корица, а наибольшее – 171,8 мВ имеют листья вишни; настои с высокой активностью – 5 образцов (42 %), среди которых рябина – 234,3 мВ, вишня – 247,5 мВ, суданская роза – 260,4 мВ, калина – 266 мВ и облепиха – 282,4 мВ.
─── Abstracts ───
─── Ukrainian Journal of Food Science. 2016. Volume 4. Issue 2 ─── 371
Выводы. Определены наиболее перспективные источники естественных антиоксидантов для использования в технологии сиропов для пропитки в кондитерской промышленности.
Ключевые слова: бисквит, настой, сироп, антиоксидант.
Экспертиза качества майонеза
Наталья Медведева
Национальный университет биоресурсов и природопользования, Киев, Украина
Введение. Неоспоримым фактором успешности торговой марки является качество изготавливаемой продукции. Качество майонеза определяется комплексом показателей: органолептических (вкус, запах, цвет, консистенция), физико-химических (жирность, крахмал, кислотность, наличие кислот), микробиологических (бифидобактерии, микроорганизмы, дрожжи, плесневые грибы, бактерии).
Материалы та методы. Исследования проведены на примере образцов украинских производителей различных торговых марок. Образцы майонеза оценивались по органолептическим, физико-химическим, микробиологическим показателям, проводилась оценка упаковки и маркировки данной продукции.
Уровень качества майонеза оценивали с помощью дескрипно-профильного метода сенсорного анализа с применением пяти бальной системы и привлечения группы экспертов.
Результаты и обсуждение. Результаты анализа маркировки обнаружили отсутствие индекса Е при указании пищевых добавок майонеза производителей торговых марок «Королевский вкус» Королевский и «ОЛИС» Провансаль.
Предложены дискрепторы органолептических показателей (консистенция, вкус и запах, цвет), маркировки и внешнего вида упаковки, определены их профилирования по пяти бальной шкале. С помощью дескрипторно-профильного метода определили наиболее конкурентоспособную и привлекательную продукцию для потребителя. Наивысшую оценку имеет продукция «Королевский вкус» Королевский и «Торчин» Прованский.
Физико-химические исследования майонеза показали, что кислотность образцов составила от 0,18% до 0,51%, содержание жира – 67% на всех образцах, что соответствует информации упаковки. Количество сорбиновой кислоты в пределах нормы – не более 1000 мг / кг. Кроме того у производителя «Олис» присутствует консервант – бензойная кислота, которая не была заявлена, ее содержание составляет 19,4 мг / кг.
Микробиологические исследования не выявили нарушений в продукции указанных производителей.
Выводы. Полученные результаты исследования майонеза различных производителей по физико-химическим и микробиологическим показателям свидетельствуют, что их значения полностью соответствуют требованиям действующих нормативов Украины.
Keywords: майонез, маркировка, качество, органолептика, дескрипторы.
─── Abstracts ───
─── Ukrainian Journal of Food Science. 2016. Volume 4. Issue 2 ─── 372
Математическая модель активизации жидкости при изготовлении хлеба в домашней хлебопечке
Виталий Бородин, Анна Цыганкова
Национальный университет пищевых технологий, Киев, Украина
Введение. В книгах рецептов отмечается, что пенообразование за счет взбивания яиц при подготовке ингредиентов для випекания хлеба, улучшает качество хлеба. В работе дано обоснование этого факта.
Материалы и методы. Рассмотрен хлеб-бриошь, изготовленый в домашней хлебопечке. Применяются методы математического моделирования для рассмотрения проблемы активизации жидкости при изготовлении хлеба в бытовой хлебопечке.
Результаты и обсуждение. Под жидкостью будем понимать любую субстанцию, которая растекается. Если в результате применения определенной технологии получим изменения (которые можно зафиксировать измерениями) в позитивном направлении некоторых характеристик готового продукта, то будем говорить об активизации жидкости. Приведены примеры активизации жидкости.
Построена математическая модель, которая показывает, что интенсивность контакта твердой и жидкой фракций при переводе жидкости в пену должна возрастать. Считается, что пена состоит из совокупности сферических сегментов сфер произвольного радиуса R разной высоты h . На высоты сегментов h наложено естественное ограничение, что они равномерно распределены на промежутке [ 0, R ]. Для характеристики площади контакта твердой и жидкой фракций рассматривается понятие коэффициента купольности. Математическое ожидание коєффициентов купольности сферических сегментов определяет средний коєффициент купольности. Доказано, что для предложенной модели пены средний коэффициент купольности равняется 1,5.
Выводы. Предложенная математическая модель пены показывает возможность интенсификации контакта твердой фракции и жидкости в 1,5 раза при переводе жидкости в пену.
Ключевые слова: хлеб, моделирование, пенообразавание.
Процессы и оборудование пищевых производств
Кинетика сушки зерна пшеницы в тонком слое
Вячеслав Михайлик1, Святослав Лементарь2,
Роман Якобчук2, Евгений Скринник2, Роман Семенко2 1 – Институт технической теплофизики НАН Украины, Киев, Украина
2 – Национальный университет пищевых технологий, Киев, Украина Введение. Исследованы закономерности процесса сушки зерна пшеницы в
тонком слое для обоснования рациональных режимов тепловой обработки зерна в сушильных аппаратах конвективного типа.
─── Abstracts ───
─── Ukrainian Journal of Food Science. 2016. Volume 4. Issue 2 ─── 373
Материалы и методы. В исследованиях было использовано зерно пшеницы. Для придания зерну полевой влажности его искусственно увлажняли. Влажность определяли высушиванием до абсолютно сухой массы. Исследование процесса сушки проводили на экспериментальном стенде конвективного типа.
Результаты и обсуждение. Анализ результатов экспериментальных исследований процесса конвективной сушки зерна пшеницы с различной влажностью показал, что повышение температуры сушильного агента с 80 до 100 °С увеличивает скорость и уменьшает продолжительность сушки зерна в 2,2–2,3 раза, а увеличение скорости сушильного агента с 1,5 до 2,5 м/с вызывает рост скорости и сокращения времени сушки ~ 20%.
Увеличение толщины слоя зерна с 10 до 15 мм за счет увеличения площади испарения приводит к увеличению скорости сушки в 1,1–1,2 раза в зависимости от скорости воздуха.
При конвективной сушке неподвижного слоя зерна высотой 10 и более мм при боковом обдуве сушильным агентом достичь одинаковой влажности зерна в объеме образца за 40...60 мин. практически невозможно.
Выводы. Установлено, что использование сушильного агента с температурой 100 °С увеличивает скорость сушки зерна в 2,2–2,3 раза по сравнению с температурой 80 °С; увеличение скорости сушильного агента с 1,5 до 2,5 м/с обеспечивает рост скорости сушки зерна на ~ 20%.
Ключевые слова: зерно, пшеница, сушка, слой, влагосодержание.
Инженерный метод расчета параметров дымовых газов угольных тепловых электростанций на основе характеристик твердого топлива
Игорь Вольчин1, Людмила Гапонич2
1 – Институт угольных энерготехнологий НАН Украины, Киев, Украина 2 – Национальный университет пищевых технологий, Киев, Украина
Введение. Увеличение доли угля в топливном балансе тепловых электростанций (ТЭС) привело к росту валовых выбросов SO2 до 1 млн. т/год. Это требует внедрения на угольных электростанциях технологических мероприятий по сокращению выбросов оксидов серы. Материалы и методы. По стандартной методике были выполнены расчеты удельных объемов дымовых газов и концентраций в них диоксида серы по данным 96 сертификатов на угольную продукцию с шахт и обогатительных фабрик Донецкого угольного бассейна. Результаты. В результате были получены эмпирические линейные зависимости удельного объема сухого дымового газа от теплоты сгорания топлива и содержания золы в топливе и зависимости концентрации диоксида серы от содержания серы и золы в топливе, отдельно для низкореакционных и высокореакционного угля. При наличии потерь теплоты через механический недожог топлива, удельный объем сухих дымовых газов уменьшается в (1 – qu/100) раз, а концентрация диоксида серы в них увеличивается в 1/(1 – qu/100) раз. Создан инженерный метод определения удельных выбросов сухих дымовых газов на угольных тепловых электростанциях Украины и ожидаемой концентрации диоксида серы в них на основе данных технического анализа при наличии
─── Abstracts ───
─── Ukrainian Journal of Food Science. 2016. Volume 4. Issue 2 ─── 374
механического недожога топлива. Метод расчета удельных выбросов сухих дымовых газов на ТЭС и ТЭЦ и ожидаемой концентрации в них диоксида серы предлагается использовать в диапазоне зольности топлива Ad от 4.0 до 50.0% и теплоты сгорания топлива Qi
r от 14.5 до 32.0 МДж/кг. Предлагаемый инженерный метод был использован для расчета оценки валовых выбросов SO2 и объемов сухих дымовых газов на угольных тепловых электростанциях Украины в 2012 – 2016 гг. Величины удельных выбросов серы в дымовых газах в последние годы находятся на уровне 16–20 г/кВт-час. отпущенной электроэнергии. Выводы. Разработанный метод позволяет сделать оценку ожидаемых выбросов диоксида серы в дымовых газах и выбрать необходимую технологию десульфуризации для соблюдения требований экологического законодательства. Ключевые слова: энергетика, экология, теплоэлектростанция, дым, газ, выброс, диоксид серы
Математическое моделирование и оптимизация в САПР элементов аппаратов пищевой и химической промышленности
Павел Швец, Алла Торопенко, Евгения Науменко, Хуссаин Валид Шер
Одесский национальный политехнический університет, Одесса, Украина
Вступ. Работа посвящена повышению качества автоматизированного проектирования аппаратов пищевой и химической промышленности за счет уменьшения массы их деталей при сохранении надежности аппаратов в целом.
Материалы и методы. Исследуется напряженно-деформированное состояние круглых оболочек, работающих под распределенной нагрузкой. В аппаратах повышенного давления к таким деталям относятся днища. При расчетах использованы математические методы, которые используют функции Гаусса, Уайттакер и Кумера. Для таких расчетов использована программа Maple 13.
Результаты и обсуждение. Установлено, что круглые пластины постоянной толщины оказываются конструктивно нерациональными. В связи с этим в работе предлагается переход к конструированию круглых пластин переменной толщины и разрабатывается метод проектирования таких пластин. Разработан аналитический метод определения напряженно-деформированного состояния пластинчатых деталей круглой формы и переменной толщины при сгибании, который позволяет получить решение в наиболее удобной для анализа замкнутой форме (в виде формул). Границей круглой пластины является окружность, поэтому для расчетов применяется полярная система координат. В развязку были задействованы две функции Уайттакер первого и второго рода. Сравнивая параметры в функции Уайттакер и в функций Куммера, определили новую форму для собственных функций. Проверка эквивалентности перехода к функциям Куммера выполнена в программе Maple 13. Полное совпадение графиков собственных функций свидетельствует о корректности выполненной замены. Функции Куммера и Уайттакер принадлежат к классу вырожденных гипергеометрических функций, их используют для построения решений в некоторых задачах физики, астрономии и механики.
Выводы. Предложен способ проектирования рациональных диаметральных сечений элементов машин и аппаратов, которые имеют форму круглых пластин.
Ключевые слова: напряжение, САПР, деформирование, круглая пластина, функция Гаусса.
─── Abstracts ───
─── Ukrainian Journal of Food Science. 2016. Volume 4. Issue 2 ─── 375
Экономика и управление
Методика оценки системы управления персоналом предприятия мясоперерабатывающей отрасли
Елена Драган, Алина Бергер
Национальный университет пищевых технологий, Киев, Украина
Введение. Статья посвящена вопросу формирования системы управления персоналом предприятий мясоперерабатывающей отрасли, уточнению её структуры. Предлагается определение интегрального показателя оценки эффективности системы управления персоналом предприятия.
Материалы и методы исследования. В работе применяются методы: системного анализа в вопросах формирования структуры системы управления персоналом и использования его в практической деятельности предприятия; анализа и синтеза, аналогии и сопоставления − в методике оценки эффективности системы управления персоналом предприятия.
Результаты и обсуждения. Проблема формирования эффективной системы управления персоналом является одной из наиболее важной для современного управления предприятием (организацией), как с научной так, и с практической стороны исследования.
Учитывая специфику предприятий мясоперерабатывающей отрасли, возникает необходимость совершенствования системы управления персоналом предприятия. Предлагаются следующие подсистемы системы управления персоналом: информационно-правового обеспечения, аналитическая, организационная, мотивационная и контроллинга.
Для оценки эффективности системы управления персоналом предприятия предлагается методика, которая предусматривает: определение единичных показателей, которые характеризуют данную систему; выбор эталонного значения показателей для сравнения с фактическими показателями; расчёт интегрального показателя эффективности данной системы.
Выводы. Предложенные подходы к усовершенствованию системы управления персоналом предприятия мясоперерабатывающей отрасли позволяют сделать соответствующие выводы для дальнейшего планирования мероприятий по повышению производительности труда, поиска резервов совершенствования нормирования труда и рационального использования трудовых ресурсов, обеспечению стабильности кадровых показателей работы, увеличению мотивационных предложений при разработке кадровой стратегии предприятия. Методика оценки эффективности системы управления персоналом предприятия на основе наиболее распространенных экономических показателей отличается доступностью и простотой в использовании.
Ключевые слова: персонал, эффективность, предприятие, мясо, отрасль, переработка.
─── Instructions for Authors ───
─── Ukrainian Journal of Food Science. 2016. Volume 4. Issue 2 ─── 376
Instructions for Authors
Dear colleagues!
The Editorial Board of scientific periodical «Ukrainian Journal of Food Science» invites you to publication of your scientific research.
Requirements for article: Language – English Size of the article 8 – 15 pages in Microsoft Word 2003 and earlier versions
with filename extension *.doc All article elements should be in Times New Roman, font size 14, 1 line
intervals, margins on both sides 2 cm. The structure of the article:
1. The title of the article 2. Authors (full name and surname) 3. Institution, where the work performed. 4. Abstract. The structure of the Abstract should correspond to the structure of the article (Introduction, Materials and methods, Results and discussion, Conclusion) 5. Key words. 6. The main body of the article should contain the following obligatory parts:
Introduction Materials and methods Results and discussion Conclusion References If you need you can add another parts and divide them into subparts.
7. The information about the author (Name, surname, scientific degree, place of work, email and contact phone number).
All Figure s should be made in graphic editor, the font size 14. The background of the graphs and charts should be only in white colour. The
colour of the Figure elements (lines, grid, text) – in black colour. Figure s and EXCEL format files with graphs additionally should submit in
separate files. Photos are not appropriate to use.
Extended articles should be sent by email to: [email protected]
─── Instructions for Authors ───
─── Ukrainian Journal of Food Science. 2016. Volume 4. Issue 2 ─── 377
Ukrainian Journal of Food Science публікує оригінальні наукові статті, короткі повідомлення, оглядові статті, новини та огляди літератури.
Тематика публікацій в Ukrainian Journal of Food Science:
Харчова інженерія Харчова хімія Мікробіологія Властивості харчових продуктів Якість та безпека харчових продуктів
Нанотехнології Процеси та обладнання Економіка та управління Автоматизація процесів Упаковка для харчових продуктів Здоров'я
Періодичність журналу 2 номери на рік (червень, грудень). Результати досліджень, представлені в журналі, повинні бути новими, мати
зв'язок з харчовою наукою і представляти інтерес для міжнародного наукового співтовариства.
Ukrainian Journal of Food Science включено до наукометричних баз:
EBSCO (2013), Universal Impact Factor (2014), Google Scholar (2013), Index Copernicus (2014), Directory of Open Access scholarly Resources (ROAD) (2014)
Ukrainian Journal of Food Science включено у перелік наукових фахових видань України з технічних наук, в якому можуть публікуватися результати дисертаційних робіт на здобуття наукових ступенів доктора і кандидата наук (Наказ Міністерства освіти і науки України № 793 від 04.07.2014)
Рецензія рукопису статті. Наукові статті, представлені для публікації в «Ukrainian Journal of Food Science» проходять «подвійне сліпе рецензування» (рецензент не знає, чию статтю рецензує, і, відповідно, автор не знає рецензента) двома вченими, призначеними редакційною колегією: один є членом редколегії, інший – незалежний учений.
Авторське право. Автори статей гарантують, що робота не є порушенням будь-яких існуючих авторських прав, і відшкодовують видавцю порушення даної гарантії. Опубліковані матеріали є правовою власністю видавця «Ukrainian Journal of Food Science», якщо не узгоджено інше.
Політика академічної етики. Редакція «Ukrainian Journal of Food Science» користується правилами академічної етики, викладеними в праці Miguel Roig (2003, 2006) "Avoiding plagiarism, self-plagiarism, and other questionable writing practices. A guide to ethical writing”. Редакція пропонує авторам, рецензентам і читачам дотримуватися вимог, викладених у цьому посібнику, щоб уникнути помилок в оформленні наукових праць.
─── Instructions for Authors ───
─── Ukrainian Journal of Food Science. 2016. Volume 4. Issue 2 ─── 378
Ukrainian Journal of Food Science
Редакційна колегія
Головний редактор: Анатолій Українець, д-р. техн. наук, проф., Національний університет харчових технологій, Україна Члени редакційної колегії: Алєксандр Іванов, д-р. техн. наук, проф., Могильовський державний університет продовольства, Республіка Бєларусь Алєксандр Мамцев, д-р. техн. наук, проф., філія Московського державного університету технології та управління в м. Мелеуз, Республіка Башкортостан, Росія Анатолій Сайганов, д-р. екон. наук, проф., Інститут системних досліджень в АПК НАН Бєларусі Анжей Ковальскі, д-р, проф., Інститут аграрної та харчової економіки – ноціональний дослідний інститут, Польща Антонела Дорохович, д-р. техн. наук, проф., Національний університет харчових технологій, Україна Галина Сімахіна, д-р. техн. наук, проф., Національний університет харчових технологій, Україна Запряна Денкова, д-р, проф., Університет харчових технологій, м. Пловдив, Болгарія Іван Малежик, д-р. техн. наук, проф., Національний університет харчових технологій, Україна Лівіу Гачеу, д-р, проф., Трансільванський університет Брашова, Румунія Микола Сичевський, д-р. екон. наук, проф., Інститут продовольчих ресурсів НААН України Марк Шамцян, канд. техн. наук, доц., Санкт-Петербурзький державний технологічний інститут, Росія Олександр Серьогін, д-р.техн. наук, проф., Національний університет харчових технологій, Україна Наталія Скопенко, д-р. екон.наук, Національний університет харчових технологій, Україна Олександр Шевченко, д-р.техн. наук, проф., Національний університет харчових технологій, Україна Олена Грабовська, д-р. техн. наук, проф., Національний університет харчових технологій, Україна Олена Сологуб, д-р. екон. наук, проф., Національний університет харчових технологій, Україна Станка Дамянова, д-р, Русенський університет, філія в м. Разград, Болгарія Тетяна Мостенська, д-р. екон. наук, проф., Національний університет харчових технологій, Україна Тетяна Пирог, д-р. біол. наук, проф., Національний університет харчових технологій, Україна Олексій Губеня (відповідальний секретар), канд. техн. наук, доц., Національний університет харчових технологій, Україна.
─── Instructions for Authors ───
─── Ukrainian Journal of Food Science. 2016. Volume 4. Issue 2 ─── 379
Вимоги до оформлення статей
Мова статті – англійська. Рекомендований обсяг статті – 8–15 сторінок (для оглядових статей – 20–30
сторінок) формату А4. Стаття виконується в редакторі Microsoft Word 2003 в форматі *.doc. Для всіх (!) елементів статті шрифт – Times New Roman, кегль – 14, інтервал –
1, абзац – 1 см.
Структура статті: 1. Назва статті. 2. Автори статті (ім’я та прізвище повністю, приклад: Денис Озерянко). 3. Установа, в якій виконана робота. 4. Анотація. Рекомендований обсяг анотації – пів сторінки. Анотація повинна відповідати структурі статті та містити розділи Вступ (2–3 рядки), Матеріали і методи (до 5 рядків), Результати та обговорення (пів сторінки), Висновки (2–3 рядки). 5. Ключові слова, 3–5 слів, але не словосполучень (!).
Пункти 1–5 виконати англійською, українською та російською мовами. 6. Основний текст статті. Має включати такі обов’язкові розділи: Вступ Матеріали та методи Результати та обговорення Висновки Література. За необхідності можна додавати інші розділи та розбивати їх на підрозділи. 7. Авторська довідка (Прізвище, ім’я та по батькові, вчений ступінь та звання, місце роботи, електронна адреса або телефон). 8. Контактні дані автора, до якого за необхідності буде звертатись редакція журналу (телефон та електронна адреса).
Розмір тексту на рисунках повинен бути співрозмірним (!) основному тексту статті. Скановані рисунки не приймаються.
Фон графіків, діаграм – лише білий (!). Колір елементів рисунку (лінії, сітка, текст) – лише чорний (не сірий).
Оригінали рисунків (файли графічних редакторів), а також файли формату EXCEL з графіками обовязково подаються в окремих файлах.
Фотографії та кольорові зображення бажано не використовувати. Скорочені назви фізичних величин в тексті та на графіках позначаються
латинськими літерами відповідно до системи СІ. В списку літератури повинні переважати статті та монографії іноземних авторів,
які опубліковані після 2000 року. Детальні інструкції для авторів розміщені на сайті
http://ukrfoodscience.ho.ua
Стаття надсилається за електронною адресою: [email protected]
─── Instructions for Authors ───
─── Ukrainian Journal of Food Science. 2016. Volume 4. Issue 2 ─── 380
Оформлення списку літератури Посилання на статтю
Автори (рік видання), Назва статті, Назва журналу (курсивом), том (номер), сторінки.
Всі елементи після року видання розділяються комами. Приклади:
1. Yannick Fayolle, Sylvie Gillot, Arnaud Cockx, Laetitia Bensimhon, Michel Roustan, Alain Heduit (2010), In situ characterization of local hydrodynamic parameters in closed-loop aeration tanks, Chemical Engineering Journal, 158(2), pp. 207–212.
2. Carlo Tocchi, Ermanno Federici, Laura Fidati, Rodolfo Manzi, Vittorio Vincigurerra, Maurizio Petruccioli (2012), Aerobic treatment of dairy wastewater in an industrial three-reactor plant: Effect of aeration regime on performances and on protozoan and bacterial communities, Water Research, 46(10), pp. 3334–3344. Приклад оформлення статті, оригінал якої українською мовою:
1. Pyroh T.P., Konon A.D., Skochko A.B. (2011), Vykorystannia mikrobnykh poverkhnevo-aktyvnykh rechovyn u biolohii ta medytsyni, Biotekhnolohiia, 4(2), pp. 24–38. За бажання після транслітерованої назви статті або журналу в {фігурних
дужках можна дати переклад англійською мовою}. Посилання на книгу
Автори (рік), Назва книги (курсивом), Видавництво, Місто. Всі елементи після року видання розділяються комами.
Приклади:
1. Harris L. (1991), Money theory, McGraw-Hill Companies, Hardcover 2. Rob Steele (2004), Understanding and measuring the shelf-life of food, CRC Press.
Приклад оформлення статті, оригінал якої українською або російською мовою:
1. Donchenko L.V. (2000), Tekhnologiya pektina i pektinoproduktov, Deli, Moscow 2. Kirianova H.A. (2008), Udoskonalennia tekhnolohii termostabilnykh zheleinykh
nachynok shliakhom ratsionalnoho vykorystannia hidrokoloidiv roslynnoho ta mikrobnoho pokhodzhennia: PhD tethis, NUHT, Kyiv.
3. Zalutskyi I.R., Tsymbaliuk V.M., Shevchenko C. H. (2009), Planuvannia i diahnostyka diialnosti pidpryiemstva, Novyi svit, Lviv. За бажання після транслітерованої назви книги в {фігурних дужках можна
дати переклад англійською мовою}.
─── Instructions for Authors ───
─── Ukrainian Journal of Food Science. 2016. Volume 4. Issue 2 ─── 381
Посилання на електронний ресурс Виконується аналогічно посиланню на книгу або статтю. Після оформлення
даних про публікацію пишуться слова available at: та вказується електронна адреса. Приклад посилання на статтю із електронного видання:
1. Barbara Chmielewska. (2012), Differentiation of the standard of living of families in countries of the European Union, Ukrainian Food Journal, 2(2), pp. 230–241, available at: http://ufj.ho.ua/Archiv/UKRAINIAN%20FOOD%20JOURNAL%202013%20V.2%20Is.2.pdf
2. (2013), Svitovi naukovometrychni bazy, available at: http://www1.nas.gov.ua/publications/q_a/Pages/scopus.aspx
─── Ukrainian Journal of Food Science. 2016. Volume 4. Issue 2 ─── 382
Сontents of Volume 4 Year 2016
Зміст тому 4 2016 рік
Food Technologies Харчові технології Issue 1 N 1
Lyudmyla Peshuk, Oleg Halenko, Anastasia Androsova, Bogun Volodymyr Meat products for the nutrition of people with the overweight of body – pandemic of ХХІ century
6
Людмила Пешук, Олег Галенко, Анастасія Андросовa, Володимир Богун М’ясні продукти для харчування людей з надлишковою вагою тіла – пандемією ХХІ століття
Vanyo Haygarov, Tatyana Yoncheva, Dimitar Dimitrov Study on the content of aromatic components in wine of grape varieties selected at the Institute of Viticulture and Enology – Pleven
17
Ваньо Гейгаров, Татяна Йончева, Дімітар Дімітров Дослідження вмісту ароматичних компонентів у вині із сортів винограду, вирощених в Інституті виноградарства і енології (м. Плевен, Болгарія)
Oksana Kochubei-Lytvynenko, Olga Chernyushok, Dmytro Ryndiuk, Kateryna Shutiuk Justification of sedimentation stability of milk whey after electric spark processing
24
Оксана Кочубей-Литвиненко, Ольга Чернюшок, Дмитро Риндюк, Катерина Шутюк Обґрунтування седиментаційної стійкості молочної сироватки після електроіскрового оброблення
Tijani Akeem, Oke Kehinde Pasting characteristics of wheat and breadfruit flour blends
33
Тіджані Окім, Оке Кегінде Тістоутворювальна здатність сумішей із борошна пшениці та плодів хлібного дерева
Tetiana Lebska, Olena Ochkolias Influence of algae on the change of butter quality indicators
40
Тетяна Kебська, Олена Очколяс Вплив морських водоростей на зміни показників якості вершкового масла
Oleksandra Nemirych, Oksana Petrusha, Oksana Vashekа, Andrii Gavrysh Assessment of quality of vegetable powder by mixed method of heat supply
49
Олександра Нєміріч, Оксана Петруша, Оксана Вашека, Андрій Гавриш Оцінка якості порошку з овочів, отриманих способом змішаного теплопідведення
Tetiana Trakalo, Oleg Shapovalenko, Tetiana Yaniuk, Andrii Sharan Effect of extruding on microbial indicators of feed mixtures
58
Тетяна Тракало, Олег Шаповаленко, Тетяна Янюк, Андрій Шаран Вплив екструдування на мікробіологічні показники кормових сумішей
─── Ukrainian Journal of Food Science. 2016. Volume 4. Issue 2 ─── 383
Grygorii Deinychenko, Olha Yudicheva Сhanges of micronutrient composition of biofortified vegetables at freezing and storage
66
Григорій Дейниченко, Ольга Юдічева Зміни мікронутрієнтного складу біофортифікованих овочів під час заморожування і зберігання
Mariia Ianchyk, Oleksandra Niemirich Definition indicators of quality of the confectionery semi-finished product with powders from banana and carrot
76
Марія Янчик, Олександра Нєміріч Показники якості кондитерських напівфабрикатів з порошком із банану та моркви
Alona Cherstva, Anastasia Lastovetska, Tamara Nosenko Using of enzymes to extract of rapeseed oil by pressing
85
Альона Черства, Анастасія Ластовецька, Тамара Носенко, Тамара Королюк Використання ферментів для вилучення ріпакової олії методом пресування
Tetiana Golikova, Oksana Babich Refinement of technology of macaroni products enriched with whortleberry
94
Тетяна Голікова, Оксана Бабич Удосконалення технології макаронних виробів, збагачених чорницею
Issue 2 N 2 Olena Kobets, Oksana Arpul, Viktor Dotsenko, Iryna Dovgun Use of dietary fibre concentrates in semi-finished biscuits technology
206
Олена Кобець, Оксана Арпуль, Віктор Доценко, Ірина Довгун Використання концентратів харчових волокон в технології бісквітних напівфабрикатів
Abdalbasit A. Mariod, Yousif M.A. Idris, Nuha M. Osman, Maha A. Mohamed, Awad M.A. Sukrab, Marwa Y. Farag, B. Matthaus Three Sudanese sorghum-based fermented foods (kisra, hulu-mur and abreh): Comparison of proximate, nutritional value, microbiological load and acrylamide content
216
Абдалбасіт А. Маріод, Иоусіф М.А. Ідріс, Нуга М. Осман, Мага А. Могамед, Аwад М.А. Сукраб, Марwа I. Фараґ, Б. Маттгаус Три суданських ферментованих продуктів на основі сорго ( кірса, хулу-мур і абрех): порівняння поживної цінності, мікробіологічного навантаження і вміст акриламіду
Liudmyla Peshuk, Oleg Galenko, Iryna Radzievska, Volodymyr Bohun Development of technology of gerontologic food pastes
229
Людмила Пешук, Олег Галенко, Ірина Радзієвська, Володимир Богун Удосконалення технології паштетів для геродієтичного харчування
Olha Masliichuk, Maria Paska Histological characterics of improving meat chopped semis
236
Ольга Маслійчук, Марія Паска Гістологічні характеристики удосконалених м’ясних посічених напівфабрикатів
─── Ukrainian Journal of Food Science. 2016. Volume 4. Issue 2 ─── 384
Joshua Olanrewaju Olaoye, Obafemi Ibitayo Obajemihi, Temiloluwa Charity Metiboba Effects of processing methods and packaging materials on the quality attributes of Suya meat
248
Йошуа Оланреваю Олаоіе, Обафемі Ібітаіо Обаємігі, Темілолува Цгарітіи Метібоба Вплив методів обробки та пакувальних матеріалів на якосні показники суєвого м'яса
Oleg Kuzmin, Yana Kovalchuk, Volodymyr Velychko, Nataliia Romanchenko Improvement technologies of aqueous-alcoholic infusions for the production of syrups
258
Олег Кузьмін, Яна Ковальчук, Володимир Величко, Наталія Романченко Удосконалення технології водно-спиртових настоїв для виробництва сиропів
Olayinka Ramota Karim, Balogun Mutiat Adebanke, Olaide Akinwunmi Akintayo, Wasiu Awoyale Physical, chemical and sensory properties of cassava (Manihot esculenta) – sweet potato (Ipomoea batatas) gari
276
Олаїнка Рамота Карім, Балоґун Мутіат Адебанке, Олаіде Акінвунмі Акінтайо, Васіу Авояле Фізичні, хімічні й органолептичні властивості маніоки – солодкої картоплі
Iuliana Beleuzu Boda, Marius Cristian Boda Observations and results of pathogenic bacteria from untreated freshwater sources
290
Юліана Белеузц Бода, Маріус Крістіан Бода Спостереження і результати патогенних бактерій з необроблених джерел прісної води
Natalya Miedviedieva Mayonnaise quality expertise
299
Наталя Мєдвєдєва Експертиза якості майонезу
Vitaliy Borodin, Ganna Tsygankova Mathematical model of liquid activization while making breads in domestic breadmaker
309
Віталій Бородін, Ганна Циганкова Математична модель активізації рідини при виготовленні хліба у домашній хлібопічці
Processes and equipment
of food productions Процеси та обладнання
харчових виробництв Issue 1 N 1
Zhanna Petrova, Yurii Snezhkіn, Kateryna Slobodianiuk Drying of the composite phytoestrogen materials
104
Жанна Петрова, Юрій Снєжкін, Катерина Слободянюк Сушіння композиційної фітоестрогенної сировини
Alina Sheyina, Victor Goots Cutting speed value during plant material grinding in food industry
111
Аліна Шеїна, Віктор Гуць Значення швидкості різання при подрібненні рослинної сировини в харчовій промисловості
─── Ukrainian Journal of Food Science. 2016. Volume 4. Issue 2 ─── 385
Yuriy Dolomakin Simulation of liquid dough mixing in the machine with the rotor unit
120
Юрій Доломакін Моделювання процесу змішування рідкої опари в апараті з роторним робочим органом
Tetiana Zinchenko, Yana Syvolobova Mathematical modeling of nonlinear regression function at the central compositional design of experiment with any number of factors
131
Тетяна Зінченко, Яна Сиволобова Математичне моделювання нелінійних функцій регресії при центральному композиційному плануванні експерименту з довільною кількістю факторів
Issue 2 N 2 Vyacheslav Mykhailyk, Sviatoslav Lementar, Roman Yakobchuk, Yevhen Skrynnyk, Roman Semenko
Wheat grain drying kinetics in a thin layer
316
В’ячеслав Михайлик, Святослав Лементар, Роман Якобчук, Євгеній Скринник, Роман Семенко Кінетика сушіння зерна пшениці в тонкому шарі
Igor Volchyn, Liudmyla Haponych Engineering method for calculating the parameters of flue gas parameters of coal-fired thermal power plants based on solid fuel characteristics
327
Ігор Вольчин, Людмила Гапонич Інженерний метод розрахунку параметрів димових газів вугільних теплових електростанцій на основі характеристик твердого палива
Pavlo Shvets, Alla Toropenko, Ievgene Naumenko, Husain Walid Sher Mathematical modeling in CAD elements vehicles food and chemical industry
339
Павло Швець, Алла Торопенко, Євгенія Науменко, Хусаін Валід Шер Математичне моделювання і оптимізація в САПР елементів апаратів харчової та хімічної промисловості
Economics and Management Економіка і управління Issue 2 N 2
Olena Dragan, Alina Berger Methodology of estimation of system efficiency of personnel management on the enterprises of meat processing industry
350
Олена Драган, Аліна Бергер Методика оцінки системи управління персоналом підприємства м'ясопереробної галузі
Life safety Безпека життєдіяльності Issue 1 N 1
Oleg Kruzhilko, Olga Bogdanova Method of human factor minimization in expert judgement for occupational risk assessment and decision making
138
Олег Кружилко, Ольга Богданова Метод мінімізації людського фактора в експертних судженнях з оцінки виробничого ризику і прийняття рішень
Nataliya Volodchenkova, Olexandr Hivrich, Marharyta Labzhynska Evaluation of the working items of hotel-restaurant complex stability structures
151
Наталія Володченкова, Олександр Хіврич, Маргарита Лабжинська Оцінювання стійкості конструкцій виробничих об’єктів готельно-ресторанних комплексів
─── Ukrainian Journal of Food Science. 2016. Volume 4. Issue 2 ─── 386
Наукове видання
Ukrainian Journal of Food Science
Volume 4, Issue 2 2016
Том 4, № 2 2016
Рекомендовано Вченою радою Національного університету
харчових технологій Протокол № 7 від 27.12.2016 р.
Адреса редакції:
Національний університет харчових технологій Вул. Володимирська, 68 Київ 01601 Україна
E-mail:
Підп. до друку 30.12.2017 р. Формат 70x100/16. Обл.-вид. арк. 14.35. Ум. друк. арк. 14.96.
Гарнітура Times New Roman. Друк офсетний. Наклад 100 прим. Вид. № 12н/16.
НУХТ 01601 Київ-33, вул. Володимирська, 68
Свідоцтво про державну реєстрацію
друкованого засобу масової інформації КВ 19324–9124Р
видане 23 липня 2012 року.


![Review of Ukrainian Ukrainian experience in Agro-Food ... · 10.83 Processing of tea and coffee 1,0% [ИМЯ КАТЕГОРИИ] [ПРОЦЕНТ] [ИМЯ КАТЕГОРИИ] [ПРОЦЕНТ]](https://img.pdfslide.net/doc/110x75/5fc77314c1566a4fc37107eb/review-of-ukrainian-ukrainian-experience-in-agro-food-1083-processing-of-tea.jpg)