Embed Size (px)
Citation preview
The Pennsylvania State University
The Graduate School
College of Agricultural Sciences
ULTRASONIC CHARACTERIZATION
OF CRYSTAL DISPERSIONS
A Thesis in
Food Science
by
Umut Yucel
© 2010 Umut Yucel
Submitted in Partial Fulfillment of the Requirements
for the Degree of
Master of Science
May 2010
ii
The thesis of Umut Yucel was reviewed and approved* by the following: John Coupland Associate Professor of Food Science Thesis Adviser Ramaswamy Anantheswaran Professor of Food Science John Floros Professor of Food Science Head of the Department of Food Science *Signatures are on file in the Graduate School
iii
ABSTRACT
The aim of this study was to investigate the applicability of ultrasonic techniques to the
characterization of crystal dispersions. Longitudinal ultrasonic waves (2.25 MHz) were
used to follow the changes in dispersions of sugar crystals (i.e., lactose or sucrose) in
different liquid phases (i.e., water or vegetable oil). In general, it was found that the
ultrasonic attenuation measurements were more sensitive to the amount and size of the
dispersed crystals while velocity measurements were more sensitive to the changes in
total concentration (dissolved or undissolved).
Ultrasonic measurements were used to measure the compositions (e.g., concentration) of
lactose solutions and aqueous suspensions of lactose crystals. The ultrasonic velocity in
lactose-water mixtures (i.e., solution or dispersion) was independent of the state of
lactose molecules (i.e., either dissolved or crystallized) and increased almost linearly with
lactose concentration. In contrast to the ultrasonic velocity measurements, ultrasonic
attenuation was relatively unaffected by changes of lactose concentration in solution, but
increased with the amount of dispersed crystals. Similarly in lipid systems, attenuation
was low in oil and increased with dispersed sucrose crystal concentration. Furthermore, it
was also found in lipid systems that sucrose crystal aggregation (induced by adding
water) increased ultrasonic attenuation.
Since ultrasonic attenuation is more sensitive than velocity measurements to the presence
of dispersed particles in a liquid, attenuation measurements were used to follow dynamic
changes in the dispersed phase through dissolution and crystallization of lactose in
aqueous environments.
The dissolution of lactose crystals (d~50 μm) in stirred aqueous solutions was
investigated using continuous on-line ultrasonic attenuation measurements and at discrete
intervals by off-line refractive index measurements. Upon addition of powdered sugar
into water or an under-saturated solution, air pockets between and around the crystal
agglomerates strongly attenuated the acoustic signal, and obscured any changes resulting
iv
from the dissolution process until all air was removed. In order to minimize air
incorporation, water was added to suspensions of lactose crystals in saturated lactose
solution to produce an under-saturated solution and cause crystal dissolution. In this case
the rate constant for lactose dissolution evaluated from on-line attenuation measurements
(~700 μs-1) was in reasonable agreement with off-line measurements and literature
values.
The crystallization of lactose within gelatin gels was also monitored by ultrasonic
attenuation measurements using a modified pulse-echo reflectometer as an immersion
probe, and results were compared to turbidity and isothermal differential scanning
calorimetry measurements. The gel environment prevented crystal sedimentation and
hindered convection flow effects and secondary nucleation. The crystallization rate of
lactose was increased with increasing degree of supersaturation, but relatively unaffected
by gelatin concentration. The kinetic parameters for growth rate and induction time
varied in a similar way with changes in lactose and gelatin concentration for all methods.
Although it is difficult to make conclusions about the relative effects of gelatin-lactose
interactions on lactose crystallization, ultrasonic measurements were able to differentiate
between different crystallization conditions.
Finally, the effects of dispersed crystal (de)aggregation on ultrasonic attenuation were
studied using the model of sucrose crystals dispersed in oil (8-16 wt%). During the
dispersing process, powder agglomerates are broken up and the viscosity of the
suspension decreases (e.g., chocolate conching). It was found that the deagglomeration of
sucrose crystals (i.e., dispersing the sugars in a liquid uniformly) in oil was much slower
than in an aqueous environment due to the hydrophobic nature of the oil and the possible
presence of small amounts of water at the crystal surfaces. Attenuation increased linearly
with concentration, and also with increasing effective particle size. Additionally, when
crystal aggregation was triggered by the addition of small amounts of water (≤1 %), the
ultrasonic noise also increased, which may be due to either uneven distribution of
agglomerates or the inhomogenity of the agglomeration process (i.e., diverse particle size
distribution and morphology). Finally, the stirrer was switched off and the crystals and
v
aggregated crystals were allowed to sediment out of suspension. The subsequent
sedimentation kinetics, as followed at a certain height from the bottom of the container
through the ultrasonic beam path, was used to provide further information about the state
of agglomerated sucrose crystals. It was found that the addition of 1% (vol. water/wt.
sucrose) decreased the total sedimentation time to half that of the water-free samples. In
addition, the agglomeration process was shown to be inhomogeneous yielding uneven
sedimentation profiles, as the degree of inhomogeneity was confirmed by micrometer
measurements.
vi
TABLE OF CONTENTS
LIST OF TABLES ..................................................................................................viii
LIST OF FIGURES ................................................................................................ix
ACKNOWLEDGEMENTS ....................................................................................xii Chapter 1. INTRODUCTION AND LITERATURE REVIEW .............................1 1.1. Crystals in foods ........................................................................................ 1 1.1.1. Introduction ....................................................................................... 1 1.1.2. Theory of crystallization ................................................................... 1 1.1.3. Properties and characterization of crystal dispersions ...................... 5 1.2. Ultrasound .................................................................................................. 13 1.2.1. Properties of the acoustic wave......................................................... 13 1.2.2. Acoustic propagation in homogenous bulk fluids ............................ 15 1.2.3. Acoustic propagation in heterogeneous fluid media ......................... 16 1.3. Ultrasonic characterization of crystal dispersions ..................................... 21
Chapter 2. STATEMENT OF THE PROBLEM ....................................................25
Chapter 3. ULTRASONIC CHARACTERIZATION OF LACTOSE DISSOLUTION .................................................................................... 27 3.1. Abstract ...................................................................................................... 27 3.2. Introduction ................................................................................................ 28 3.3. Methods and materials ............................................................................... 30 3.4. Results and discussion ............................................................................... 34 3.4.1. Characterization of lactose and lactose suspensions ......................... 34 3.4.2. Validation of ultrasonic measurements in the stirred tank apparatus ........................................................................................... 38 3.4.3. Kinetics of mixing and dissolution ................................................... 40 3.4.3.1. Mixing without dissolution ...................................................... 40 3.4.3.2. Mixing and dissolution ............................................................ 41 3.5. Conclusions ................................................................................................ 47 Chapter 4. ULTRASONIC CHARACTERIZATION OF LACTOSE CRYSTALLIZATION IN GELATIN GELS .......................................48 4.1. Abstract ......................................................................................................48 4.2. Introduction ................................................................................................49 4.3. Materials and methods ...............................................................................51 4.4. Results and discussion ...............................................................................54 4.5. Conclusions ................................................................................................66
vii
Chapter 5. ULTRASONIC CHARACTERIZATION OF DISPERSIONS OF SUGAR IN VEGETABLE OIL ....................................................67 5.1. Abstract ......................................................................................................67 5.2. Introduction ................................................................................................68 5.3. Materials and methods ...............................................................................70 5.4. Results and discussion ...............................................................................72 5.4.1. Characterization of crystals...............................................................72 5.4.2. Dispersing the sugar crystals into oil ................................................74 5.4.3. Addition of water ..............................................................................76 5.4.4. Sedimentation ...................................................................................79 5.5. Conclusions ................................................................................................82 Chapter 6. CONCLUSIONS AND RECOMMENDATIONS FOR FUTURE WORK ..................................................................................83 REFERENCES .......................................................................................................89 Appendix A. Supplementary material for Chapter 3 ..............................................96 Appendix B. Supplementary material for Chapter 4 ..............................................97 Appendix C. Supplementary material for Chapter 5 ..............................................99
viii
LIST OF TABLES
Table 3.1. Rate constant for lactose dissolution calculated from ultrasound and refractive index measurements as a function of initial lactose concentration. Data are shown as the mean and standard deviation of three full experimental replicates and samples with different superscripts are significantly different (p<0.05) ..................46 Table 4.1. (a) Maximum rate (rmax) and (b) induction time (ti) for sensor response and percent crystal content change (mean ± standard deviation, n=3). Different letters shows significant difference (p<0.05) within a measurement method (i.e., acoustic, optical, or thermal). ...........................................................................................65 Table 5.1. Normalized solid bed height (NSBH) for 8 wt% sugar in oil dispersion (i.e., 80 g sugar, 920 g oil) as a function of amount of water added. Data are shown as mean ± standard deviation (n=6) and values marked with different letters were significantly different from one another (p<0.05) ...........................................................82
ix
LIST OF FIGURES
Figure 1.1. Nucleation mechanisms (adapted from Garside, 1985) ................................3 Figure 3.1. Diagrams showing (a) the ultrasonic pulse echo reflectometer and (b) the stirred tank configuration of transducers. Both devices measure velocity from the time taken for sound to travel a known distance between two transducers (or reflect and return to the same transducer) and attenuation as the loss of pulse energy after travelling a known distance through the sample .....................................................33 Figure 3.2. (a) Particle size distribution and (b) micrograph of the lactose crystals used ..................................................................................................................................35 Figure 3.3. Ultrasonic (a) velocity and (b) attenuation coefficient of lactose solutions (open symbols) and suspensions (filled symbols). Measurements were conducted using a 2.25 MHz center frequency transducer in a pulse echo reflectometer. Points and error bars are the mean and standard deviation of three experimental replications, respectively. ...........................................................................37 Figure 3.4. Ultrasonic (a) velocity and (b) transducer loss of lactose solutions (open symbols) and suspensions (filled symbols). Measurements were conducted using a pair of 2.25 MHz center frequency transducers in through-transmission mode in a stirred tank configuration. Points and error bars are the mean and standard deviation of three experimental replications, respectively. .............................................................39 Figure 3.5. Kinetic changes in transducer loss (NTPL) on increasing lactose amount by adding lactose powder in a stirred tank configuration. Lactose was added at time = 0. (a) Mixing without dissolution. Powdered lactose (50 g) was added to a lactose suspension (1200 g of a 25% mixture, i.e., a suspension of 1% lactose crystals in a 24% lactose solution) yielding a final composition of 28 wt% (i.e., 4 wt% crystal load) . (b) Simultaneous mixing and dissolution. Powdered lactose (66.0 g) was added to lactose solution (950 g, 23%) yielding a 28% lactose mixture (i.e., 4% suspended lactose). Off-line refractive index measurements at discrete intervals are shown on the right hand axis .......................................................................42 Figure 3.6. Kinetic changes in transducer loss (NTPL) on decreasing lactose concentration in a stirred tank configuration (addition at time = 0). (a) Mixing without dissolution. Saturated lactose solution (400 g) was added to 920 g lactose suspension (32 wt%) decreasing the crystal load to about 6 wt%. (b) Simultaneous mixing and dissolution. Water (373.1 g) was added to lactose suspension (953.5 g, 32 wt% lactose, i.e., 8% crystal suspension) yielding an undersaturated solution (23 wt%). Off-line refractive index measurements at discrete intervals are shown on the right hand axis ..................................................................................................................44 Figure 4.1. Immersable ultrasonic pulse-echo refloctometer ...........................................52
x
Figure 4.2. Micrographs of lactose crystals obtained from a gelatin-gel (43 wt% lactose, 1.5 wt% gelatin) after 24 hours at 25°C(a) 4X (scale bar = 500 μm) and (b) 20X (scale bar = 50 μm) magnifications ..........................................................................54 Figure 4.3. XRD patterns after 24 hour crystallization of gelled (1.5-3 wt% gelatin) lactose (43-46 wt%) solutions at 25°C ............................................................................55 Figure 4.4. Ultrasonic (a) velocity and (b) attenuation measurements (2.25 MHz) on lactose crystallization at 25°C from aqueous solutions of (●) 1.5 wt% gelatin and 43 wt% lactose, (○) 3 wt% gelatin and 43 wt% lactose. (■) 1.5 wt% gelatin and 46 wt% lactose, (□) 3 wt% gelatin and 46 wt% lactose. Data shown are the mean and standard deviation of three separate measurements .........................................................57 Figure 4.5. Corrected absorbance measurements (500 nm) on lactose crystallization at 25°C from aqueous solutions of (●) 1.5 wt% gelatin and 43 wt% lactose, (○) 3 wt% gelatin and 43 wt% lactose. (■) 1.5 wt% gelatin and 46 wt% lactose, (□) 3 wt% gelatin and 46 wt% lactose. Data shown are the mean and standard deviation of three separate measurements .......................................................................................59 Figure 4.6. Ultrasonic attenuation measurements (2.25 MHz) on lactose crystallization at 25°C from the aqueous solution of 1.5 wt% gelatin and 43 wt% lactose. Solid line shows the linear regression (y = 0.1334x – 5.2547). A sample set of data was shown to illustrate calculations of the defined rate parameters ....................60 Figure 4.7. Lactose crystallization as calculated from isothermal DSC at 25°C for aqueous solutions of (a) 1.5 wt% gelatin and 43 wt% lactose, (b) 3 wt% gelatin and 43 wt% lactose. (c) 1.5 wt% gelatin and 46 wt% lactose, (d) 3 wt% gelatin and 46 wt% lactose. All 3 replications for each treatment were shown on the graph. (All graphs, a-d, are plotted together for comparison in Appendix B.3). ..............................62 Figure 5.1. (a) Particle size distribution of sucrose crystals used as measured by light scattering (data point shown are the mean and standard deviation of 5 experimental replications) and (b) micrograph (scale bar 50 μm) of similar crystals used ..................................................................................................................................73 Figure 5.2. Kinetic changes in NPTL upon addition of 80 g sucrose crystals into 920 g corn oil (i.e., 8 wt% dispersion). The sucrose was added at 60 seconds and the total addition time was less than 30 sec. Measurements were made every 0.5 sec. and the line shown is a moving average over three points ..............................................74 Figure 5.3. Steady state and quasi steady state (i.e, 3000 sec after water addition) NPTL for sucrose dispersions in corn oil containing (□) 0 and (■) 1% water (vol. water/wt. sugar) with respect to sugar content, respectively. Points and error bars are the mean and standard deviation of three experimental replications. In each experimental run the plateau value was calculated as the average of 300 measurements made over 150 sec ....................................................................................75
xi
Figure 5.4. NSBH of sugar in corn oil dispersions containing with respect to sucrose content. Points and error bars are the mean and standard deviation of six experimental replications .................................................................................................76 Figure 5.5. (a) Kinetic changes in NPTL upon addition of 1% water (vol.water/wt.sucrose) into 8 wt% sucrose dispersions in corn oil (i.e., 0.8 mL into the dispersion of 80 g sugar in 920 g corn oil), with (b) a zoom for the first 500 sec. Water was added after 50 sec. after the start of the experiment. Measurements were made every 0.5 sec. and the line shown is a moving average over three points ..............78 Figure 5.6. NPTL change due to sedimentation of sucrose particles in corn oil (8 wt%) with water contents of (a) 0, (b) 0.5, and (c) 1% (vol. water/wt. sugar). Measurements were made every 0.5 sec. and the line shown is a moving average over three points. Data from three or four replicate experiments are shown on each plot ...................................................................................................................................80 Figure A.1. Density (□) and refractive index (○) calibrations for lactose solutions. Points and error bars are the mean and standard deviation of three experimental replications, respectively. .................................................................................................96 Figure B.1. Photograph of lactose crystallized from 43 wt% lactose and (left) 1.5 and (right) 3 wt% gelatin solutions after 4-5 hours crystallization started ......................97 Figure B.2. DSC thermogram of 1.5% gelatin-43% lactose at 25°C and corresponding base-line construction ..............................................................................97 Figure B.3. Lactose crystallization as calculated from isothermal DSC at 25°C for aqueous solutions of (···) 1.5 wt% gelatin and 43 wt% lactose, (− −) 3 wt% gelatin and 43 wt% lactose. (─) 1.5 wt% gelatin and 46 wt% lactose, (-·-) 3 wt% gelatin and 46 wt% lactose. All 3 replications for each treatment were shown on the graph .....98 Figure C.1. Change in acoustic intensity with pulser gain in water as used for calibration. The linear regression line (y = 0.4931x + 17.618, R2 = 0.999) was shown on the graph ..........................................................................................................99 Figure C.2. XRD pattern of the confectioner’s sugar sample used .................................99 Figure C.3. Picture showing the effect water addition to 8 wt% sucrose in corn oil dispersions. From left to right: 0, 0.5, and 1% (vol.water/wt.lactose) .............................100
xii
ACKNOWLEDGEMENTS
Completion of this thesis could not be accomplished without many people’s
contributions, help and encouragement. I would like to mention those who deserve my
sincere acknowledgement.
First of all, I would like to express my sincere gratitude to my supervisor Dr. John N.
Coupland for being not only a prosperous guide in my academic career, but additionally a
great mentor. His deep patience and valuable time ensured the completion of this work. I
learnt much from him, but there is still a big deal more to learn.
I would like to thank my committee members, Dr. Ramaswamy Anantheswaran and Dr.
John D. Floros for their valuable time as well as invaluable help and encouragement.
I would like to thank former and present lab-mates for their help and support, or at least
just being there when needed. My special thanks are for Dr. Ibrahim Gulseren and Dr.
Ying Wang for their great help and support in my first years in Penn State. I would also
like to thank all Food Science Department family for creating this positive atmosphere
and making my graduate life a here better one. I would like to thank all my friends in
State College for their precious help whenever I need it, and making State College bigger
place than as it seems. I would like to give my special thanks to my flat-mate, Cem
Topbasi for his invaluable and everlasting help and great company. I must extent my
heartiest thanks to my friends back in Turkey for their most valuable support and being
next to me even there is an ocean in between.
I would like to thank Dr. Valentina Trinetta for her support, patience and heartiest
company.
I would like to give my special thanks and love to my family in Ankara, Turkey. As in all
parts of my life, without their support this work could not be accomplished.
1
Chapter 1
INTRODUCTION AND LITERATURE REVIEW
1.1. Crystals in foods
1.1.1. Introduction
Many foods are dispersions of crystals in a liquid phase. The crystalline structure, which
can change during manufacturing or storage, determines the texture, sensory attributes,
and stability of the product. The formation of crystals within the continuous phase can be
desirable (e.g., fat fractionation, sucrose refining, small ice crystals in ice cream) or
undesirable (e.g., sucrose crystals in hard candy, lactose crystals in ice cream). Crystals
can be formed either from bulk solution (e.g., ice formation in ice cream manufacturing)
or dispersions of seed crystals (e.g., cocoa butter in chocolate tempering process) which
provides more control over the crystal characteristics. In either case, an effective process
and formulation control is essential to optimize product quality.
1.1.2. Theory of crystallization
Thermodynamics
A solution is a homogenous mixture of dissolved solute molecules in a continuous liquid
phase (i.e., solvent). The distribution of solute molecules within the solvent is defined by
the balance of enthalpic and entropic terms, yielding a condition to minimize the Gibbs
free energy of the system.
Beyond a specific concentration (i.e., solubility limit), solute molecules at equilibrium do
not distribute themselves homogenously but instead form a separate phase. The solubility
limit is a function of temperature, as well as formulation determining the phase behavior
of the components in the system. The solubility limit of solids in liquids decreases with
temperature. If a solution is cooled, the solubility limit can go lower than the
2
concentration of the dissolved solute molecules, yielding a super-saturated solution.
Thus, the thermodynamic driving force due to the excess free energy in the system may
drive the solute particles to crystallize out, a specific case of phase separation.
Crystallization, in general, proceeds via two distinct processes: crystal nucleation and
growth (Garside, 1985), rate of which determined by the extent of driving force (i.e.,
degree of super-saturation), but limited by kinetic constraints. There are also additional
processes, such as Ostwald ripening or crystal perfection, leading the crystalline structure
to a lower energy state without further changing the total amount of crystals.
Kinetics
i. Crystal nucleation
Nucleation is the phase separation process leading to the formation of the crystal nuclei.
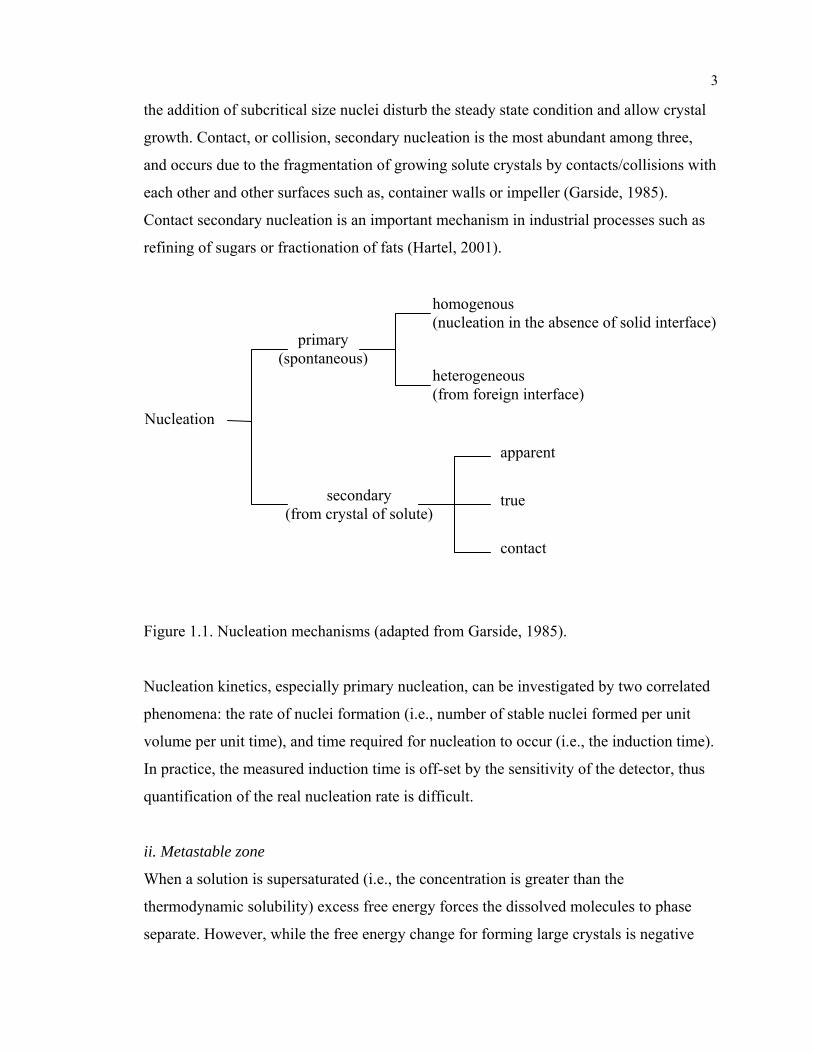
There are two main groups of nucleation mechanisms, primary and secondary (Fig. 1). In
primary, or spontaneous, nucleation, solute molecules first form molecular clusters,
crystal embryos. Only crystal embryos larger than a critical size (proportional to the
logarithm of the degree of supersaturation) are stable and will begin to grow to form
macroscopic crystals (Garside, 1985). In homogeneous nucleation, the formation of
crystal embryos is merely determined by molecular kinetics of solute and in most
practical circumstances is too slow a process to be relevant. In practice, there are often
impurities in the solution, such as dust particles or imperfections at the boundaries, that
may serve as attachment sites for solute molecules, and thus aiding nucleation by
lowering the free energy change required (i.e., heterogeneous nucleation) (Myerson and
Ginde, 2001).
Secondary nucleation is defined as “nucleation which takes place only because of the
prior existence of crystals of the material being crystallized” (Botsaris, 1976). Garside
(1985) classified it as apparent, true, and contact secondary nucleation. Apparent, or
initial, secondary nucleation is due to the fragmentation of the dry crystals when they are
first introduced to the super-saturated solution. The true secondary nucleation occurs
when the super-saturated solution is metastable (i.e., it does not crystallize readily), and
3
the addition of subcritical size nuclei disturb the steady state condition and allow crystal
growth. Contact, or collision, secondary nucleation is the most abundant among three,
and occurs due to the fragmentation of growing solute crystals by contacts/collisions with
each other and other surfaces such as, container walls or impeller (Garside, 1985).
Contact secondary nucleation is an important mechanism in industrial processes such as
refining of sugars or fractionation of fats (Hartel, 2001).
Figure 1.1. Nucleation mechanisms (adapted from Garside, 1985).
Nucleation kinetics, especially primary nucleation, can be investigated by two correlated
phenomena: the rate of nuclei formation (i.e., number of stable nuclei formed per unit
volume per unit time), and time required for nucleation to occur (i.e., the induction time).
In practice, the measured induction time is off-set by the sensitivity of the detector, thus
quantification of the real nucleation rate is difficult.
ii. Metastable zone
When a solution is supersaturated (i.e., the concentration is greater than the
thermodynamic solubility) excess free energy forces the dissolved molecules to phase
separate. However, while the free energy change for forming large crystals is negative
primary (spontaneous)
homogenous (nucleation in the absence of solid interface)
heterogeneous (from foreign interface)
secondary (from crystal of solute)
apparent
true
contact
Nucleation
4
and thus occurs spontaneously, the free energy change to form a small crystal is positive
and can provide a kinetic barrier to crystallization.
If the rate of formation of stable crystal is too slow to be observed in a practical time
scale, the system is defined as metastable. Furthermore, since crystallization requires
diffusion, conformation change and surface incorporation of solute molecules, as well as
the removal of latent heat of crystallization, factors affecting these processes can hinder
or catalyze the nucleation event. Thus, the metastability of a system is generally
determined by the characteristic of the system (e.g., dynamic of the solute molecules, or
viscosity of the solution) and the history of the solution (e.g., cooling rate, concentration
of impurities, or degree of mixing). However, with exceptionally high cooling rates,
molecular mobility of the molecules would be hindered, resulting in very long induction
times, and may result in solid-like samples (i.e., glass-transition).
The metastable zone (width) can be defined as the concentration range at a defined
temperature between the solubility limit and concentration at which nucleation occurs
spontaneously upon further increasing the degree of supersaturation (Hartel, 2001).
Moreover, metastable zone width can further be defined with respect to type of
nucleation, where it is largest for the primary nucleation (Ulrich and Strege, 2002). The
metastable zone can be minimized to a “false-grain zone” by introducing solute crystals
under shear, i.e., secondary nucleation (Hartel, 2001). Knowledge of the metastable zone
is required to adjust operation parameters as desired in an industrial crystallization
processes. For example, according to Omar and Ulrich (1999) the optimum degree of
supersaturation promoting the crystal growth over nucleation is approximately half width
(i.e., mean concentration between the limits defining the metastable zone) of the
metastable zone.
iii. Crystal growth
After stable nuclei are formed, they grow larger by addition of solute molecules, which in
turn decreases the total free energy of the crystal, as long as the solution is super-
saturated and the molecules have enough mobility. Three primary mechanisms are
5
important in controlling the rate of crystal growth: mass transfer processes, surface
incorporation, and heat transfer effects (Hartel, 2001). The growth rate of a crystal plane
(i.e., face) can be different than the others as determined by the surface free energy
change on that plane and results in a characteristic shape for the macroscopic crystal.
The reverse process, dissolution, is the opposite of crystal growth but as it does not
require a nucleation event the rate is only affected by changes in heat/mass transfer at the
crystal surface (Ulrich, 2003).
Although crystal nucleation and growth are separate processes, they can occur
simultaneously. The relative rates of crystal nucleation and growth determine the number
and size of the crystals (i.e., crystal size distribution, CSD). Generally, by increasing the
degree of super-saturation (or super-cooling) the nucleation event is promoted over
crystal growth, yielding a larger number of smaller crystals. Alternatively, crystallization
from solution by using crystal growth templates (i.e., seeded crystallization) allows more
control over crystalline structure, since nucleation event can be restricted to secondary
nucleation by carefully controlling the degree of super-saturation. On the other hand,
there are several other factors that can affect CSD, such as the presence of impurities in
the system, imperfections at the boundaries, degree of the applied shear, and heat and
mass transfer phenomena in the system.
Crystals of similar size and shape in the same environment may grow at different rates
(i.e., growth rate distribution). Although the mechanism is not fully understood, it has
been attributed to the secondary nucleation events (Ulrich, 2003), or to dislocations and
presence of impurities on the surface and the crystal history of the microstructure (Hartel,
2001).
1.1.3. Properties and characterization of crystal dispersions
In general, crystal dispersions can be characterized in terms of the crystal concentration,
size distribution, morphology and micro-structure, as well as the change of these
6
parameters with time. Measurement of bulk properties, such as texture or rheology, of the
system can be used as a quality control tool, and can be related to crystalline structure
and composition. However complete characterization of the system requires
combinations of different techniques, such as microscopy (i.e., optical microscopy or
electron microscopy), optical techniques (i.e., light scattering within the suspension and
optical rotation or refractive index of solution), nuclear magnetic resonance (NMR), x-
ray diffraction (XRD), or thermal analysis (i.e., differential scanning calorimetry, DSC),
each sensitive to different attribute of the crystal dispersion. There is still need for
alternatives, since every technique has its characteristic limitations and drawbacks.
Crystal microstructure
A crystal is defined as a solid structure built from atoms or molecules forming a periodic
repeating pattern in three dimensions (Myerson and Ginde, 2001). The crystal structures
are classified by means of “space lattice” (or point lattice) showing the location of atoms
or molecules by using three spatial dimensions and angles (i.e., Miller indices). The unit
cell defines the shape of the periodic parallel-sided structure of lattice points. There are
14 possible point lattices (i.e., the Bravais lattices) that atoms or molecules are packed
into crystals (Brandon and Kaplan, 2008). Each crystalline material has its characteristic
lattice structure and parameters, consequently resulting in varying bulk properties.
Moreover, phase equilibria and crystal growth conditions can cause different lattice
structures (i.e., polymorphs) for certain atoms (e.g., graphite and diamond polymorphs of
carbon) or molecules (e.g., cocoa butter shows 6 different polymorphs, type I-VI).
The fundamental method to determine the crystal microstructure is the XRD
spectroscopy. Depending on the spacing of crystal planes (i.e., lattice parameters), x-rays
will be diffracted in a specific angle and wavelength dependent manner (i.e., Bragg’s
Law). Each crystalline material has its unique XRD pattern. Although there are many
XRD based measurement techniques, powder XRD is one of the basic and commonly
used techniques to characterize crystalline microstructure in food materials, providing the
material can be formed into micron-size randomly distributed crystal powders. X-ray
techniques typically require such long measurement times during which product should
7
not change its properties. However, XRD measured using synchrotron radiation (i.e., high
energy x-rays) allows more rapid analysis (i.e., within seconds).
DSC in temperature scanning mode can provide indirect information about the crystal
microstructure, as well as the concentration. When the molecules crystallize, latent heat is
released and can be calculated from the DSC curve as an exothermic peak. The opposite
is true for melting where an endothermic peak is observed. Each crystal polymorph has a
characteristic crystallization (or melting) temperature and enthalpy. The area under the
crystallization curve can be used to measure the enthalpy of the process, and together
with phase transition temperature information, the crystalline structure can be inferred.
The sensitivity of this indirect measurement technique relies on the scan rate, which
affects peak resolution and position. DSC and XRD techniques are often used to
complement one another which can be particularly useful for materials showing complex
polymorphic transitions such as lipids (Higami et al., 2003).
Concentration
There are many methods used for monitoring crystal concentration. Some of them require
separation of crystals from the solution (e.g., sedimentation or sieving) and analyzing
separately, while there are other techniques used directly on the crystal and solvent
mixture (e.g., NMR, XRD, DSC, or turbidity).
The solid fat content of fatty products is widely determined by NMR spectroscopy. This
technique is based on the absorption of radio frequency electromagnetic radiation by a
certain nuclei aligned in a magnetic field. The structure and environment of the molecule,
thus the crystal concentration, can be inferred from nuclear relaxation time
measurements. However, NMR methods are often relatively slow and expensive and
cannot make measurements inside metal containers. A related technique, electron
paramagnetic resonance (EPR), relies on the absorption of electromagnetic radiation (i.e.,
microwaves) by unpaired electron(s), however this methods limited to the presence of
EPR active molecules (i.e., free radicals). Gillies et al. (2006) used this technique to study
the changes in ice cream during freezing and melting.
8
The degree of crystallinity can also be measured from a DSC thermogram as areas of the
phase transformation peaks of different crystalline structures. However, this technique is
more suitable for simple model systems, since other thermodynamic changes such as
gelatinization, chemical reactions, or moisture loss may affect the peak properties.
Moreover, construction of a realistic baseline is essential to analyze the thermogram
appropriately.
In a similar manner, the areas of diffraction peaks obtained from the XRD spectroscopy
can also be used to measure the concentration of crystals. However, low crystal
concentrations may be difficult to monitor since the diffraction pattern can be masked by
diffuse background diffraction, unless a high energy source radiation is used (i.e.,
synchrotron radiation). In addition, there are various factors in powder XRD technique
that can lead to discrepancies in the analyses. Since the XRD patterns of crystalline
materials result from the elastically scattered x-rays by electrons, the peak shape and
intensity is, in general, can be determined by utilizing scattering theories. Other than the
experimental factors such as surface roughness and displacement, artifacts of the system
include polarization factor (i.e., dependence of intensity to scattering angle, 2θ), structure
factor (i.e., defined by the lattice parameters), multiplicity factor (i.e., number of
reflections from crystal planes of the same family), Lorentz factor (i.e., geometric
factors), absorption, and temperature factor.
A simple way to measure total crystal concentration is through turbidity measurements
provided that the crystals are uniformly dispersed and system remains optically
transparent. This technique can be used on-line. However there are limitations, common
to other optical methods, and quantification of the total crystal concentration can be
unrealistic (Marangoni, 1998). Firstly at higher concentrations the dispersion can become
optically opaque. Secondly, turbidity is not always directly proportional to concentration
due to multiple scattering and particle size effects. Finally, there may also be additional
intensity losses due to absorption within the particle, which can be a particular problem
for particles larger than λ/20, where λ is the wavelength, and also to refraction of the
incident light, which is especially important for birefringent materials.
9
In addition to the amount of crystals, their size and morphology are needed to be
controlled for an optimized product and process. Knowing the number of crystals present
and their size distribution, crystal concentration can also be calculated.
Size distribution
There are many techniques available for crystalline-particle sizing, each with
characteristic pros and cons, and suitable for specific systems and processes. The first
group of methods relies on mechanical separation principles and varies from simple
sieving to chromatography-like systems as in field flow fractionators. In simple sieving
the crystals are passed through a number of sieves with different mesh sizes, and the
amount retained in each size category can be used to calculate the histogram of crystal
size distribution. Prior to sieving, crystals can be separated from solution either by simple
filtration or sedimentation. The principle of sedimentation devices considers the Stokes
radius of the particles and density difference of the particles and the liquid phase to
separate them in an external force field (i.e., centrifugal or gravimetric). Another
separation technique is electrical sensing zone method (e.g., Coulter Counter apparatus),
which determines the CSD in an electrolyte solution. In this technique, the electrical
impedance change is measured as particles pass through a small orifice, which in turn
displace their own volume of electrolyte. However, these methods are often not suitable
for crystals dispersed in food products, since they might be embedded in a complex
environment (e.g., ice cream), and not readily separable from the bulk.
Optical techniques (i.e., light scattering methods) are the second group of methods to
measure CSD. These methods are fast, sensitive, and nondestructive, but are still subject
to the constraints common for optical methods. Two groups of light scattering techniques
are commonly used: static light scattering and dynamic light scattering (photon
correlation spectroscopy, PCS) (Karpinski and Wey, 2001). A wide range of particle
sizes from submicron (i.e., from 0.1 μm) up to millimeter scale (i.e., 1-2 mm) can be
determined effectively by static light scattering method, which is based on the
dependency of the diffraction angle on the particle radius (Fraunhofer spectra). On the
other hand, PCS measures the changes in the intensity of the scattered light due random
10
Brownian motion of the dispersed particles in the sufficiently transparent continuous
liquid phase. This method is sensitive to smaller particle sizes from couple of nanometers
to about 3 μm. In a similar manner, small angle x-ray scattering (SAXS) or small angle
neutron scattering (SANS) can be used to determine CSD of nano-scale particle
dispersions. Both static and dynamic light scattering methods are not direct
measurements of CSD, but rather use light scattering effects with spherical particle
approximation.
Finally, optical and electron microscopies coupled with image analyzing protocols can
quantify the CSD. However, this approach requires large number of images analyzed
collectively in order to give realistic and statistically valid results. The morphology of the
crystals, as well as their size, can also be analyzed by microscopy.
Shape and aggreagtion
Crystal habit (i.e., morphology of the crystals) is both influenced by the intrinsic factors
of the molecular crystal and external growth conditions. The shape of the crystals is
determined by the relative area of faces formed (i.e., relative growth rates of individual
faces) and is characteristic of the particular formulation, as well as the crystallization
conditions. For example, when lactose crystals were obtained by crystallization from bulk
aqueous solution, with fast crystallization rates, only prisms are formed. However, with
decreasing degree of super-saturation diamond shaped plates, then pyramids and
tomahawk shape were observed (Herrington, 1934). Moreover, the presence of impurities
(i.e., acting as either growth inhibitors or actuators) can also affect the crystal
morphology. Hunziker and Nissen (1927) showed that α-lactose monohydrate crystals
obtained from aqueous solutions have their characteristic “tomahawk shape”, whereas if
the solution contains high concentrations of sucrose, the shape of the lactose crystals
were “short, truncated pyramids with flat rhomboid base and apex”.
Over time the CSD and shape can change, as larger crystals grow at the expense of
smaller ones via a process known as Ostwald ripening. Moreover, upon storage, crystals
may change their polymorphic form or aggregate, provided that the molecular mobility or
11
colloidal mobility is not hindered. In any case, free energy of the crystals will be lowered
as the total amount of crystals remains unchanged. Aggregated crystals can form a
network which will affect the rheological properties of the dispersion. It is generally
expected that the apparent viscosity of the dispersion to increase with degree of
agglomeration. Particle sizing techniques, as well as microscopy, can be used to follow
the aggregation phenomenon.
Monitoring the kinetics of crystal growth and nucleation
Since rates of crystal growth and nucleation affect the properties of crystal dispersion and
consequently the quality and stability of the final food product, it is essential to know and
control the kinetics of change. Although crystal nucleation and growth are separate
events, they can occur simultaneously and affect each other. Consequently, monitoring
and evaluating them individually can be challenging and may require combination of
different techniques.
Techniques sensitive to concentration can further be utilized to follow mass
crystallization kinetics or just the presence of crystals (i.e., induction time). While the
overall rate of mass crystallization can be calculated from the rate of change of sensor
response, the induction time can be inferred from the lag time for significant deviation
from the initial response. Wright et al. (2000) compared different methods used in lipid
crystallization studies, and concluded that the response of different techniques can be
similar in trend but varying in sensitivity. Moreover, the complexity of the crystalline
system, usually the case for foods, negatively affects the sensitivity and resolution of the
used technique. For example, the presence of crystals, thus the induction time might be
investigated by XRD, however the diffuse background will decrease the sensitivity; such
that 5 to 10 % of crystalline material is required in a sugar glass to distinguish XRD
pattern from the background (Hartel, 2001). Such a large lag time makes this technique
unsuitable for nucleation kinetics study. XRD technique can be utilized to evaluate the
total crystallization kinetics, but there are still several factors (from sample surface height
and roughness to precise temperature control) causing the potential for significant error.
12
On the other hand, if the system has enough transparency in the beginning, the induction
time can be evaluated in a precise manner using optical methods, such as turbidity.
DSC in isothermal scan mode can also be used to study crystallization kinetics. In this
technique, a solution is quickly cooled to a super-saturated state and the temperature is
kept constant at that crystallization temperature. The rate of change of crystallinity can be
monitored from the change of area of the exothermic peak with time. This method is
associated with a lag time where the system takes a finite time to cool to the starting
temperature. If the rate of crystallization is rapid enough, so the short induction time
could be in the non-isothermal period, resulting in overestimation of the induction time.
As the crystallization kinetics can be monitored directly by following the CSD (i.e.,
increase in crystal size) over time, it may also be followed indirectly by monitoring the
changes in the solution properties, such as density, refractive index, and optical rotation
measurements. Density of the solution will change approximately linearly with the
concentration of dissolved solute. Refractive index and optical rotation measurements
are commonly used in sugar and dairy industries. The theory of refractive index
measurements uses the fact that light can be refracted when the media is changed,
obeying the Snell’s Law. Refractive index of a solution, as measured by a refractometer,
is a measure of degree of refraction depending on the speed of light in the solution, which
is a function of amount of dissolved solute, relative to air. Optical rotation measurements
can be used as another optical method to measure the concentrations of solutions of
optically active materials (i.e., having circular birefringence). When polarized light
passes through an optically active material, the plane of polarization is rotated. This
rotation can be measured by a polarimeter, and the concentration can be calculated from
the specific optical rotation of solution, the angle by which the plane is rotated per unit
concentration and per unit length (Walstra and Jenness, 1984). The specific optical
rotation not only depends on material but also is different for different stereoisomers
(e.g., at 20°C for α- and β-lactose in water are +89.4° and +35°, respectively, and +55.3°
for the equilibrium mixture) (Holsinger, 1997). Combination of independent
measurements of solution properties and CSD may enable to achieve separate crystal
13
nucleation and growth information, together with more accurate and realistic nucleation
kinetics.
Aside from nucleation, growth or dissolution, kinetic changes in crystal dispersions can
also be due to (de)aggregation of the crystals. For example, in conching step of chocolate
manufacturing, non fat solids (i.e., sugar) and milk powder (containing lactose
molecules) in the case of milk chocolate is uniformly dispersed in cocoa butter and the
degree of agglomeration can be followed indirectly by the amount of energy required to
mix the suspension at a constant speed (Beckett, 2001). A similar process is involved in
the preparation of flavor slurries (i.e., dispersions of sugars, salts and flavors in oil)
whose quality may be affected by distribution and agglomeration of the crystals.
Need for alternative and on-line methods to follow crystallization
All available techniques have their characteristic limitations, and none is readily applied
as an on-line monitoring tool to characterize crystal dispersions. Utilizing alternative
techniques can provide more thorough information. Ultrasound based methods are fast,
inexpensive, noninvasive and can be applied as on-line tools to monitor changes in
crystalline properties of optically opaque systems.
1.2. Ultrasound
1.2.1. Properties of the acoustic wave
Sound is a mechanical wave travelling through a media as spatially and temporally
varying pressure. The specific type of sound propagation where the molecular
displacements (oscillations) are parallel to the direction of wave propagation is called a
longitudinal (or compressional) wave. The simplest way to define an acoustic wave in the
fluid media is by the linear acoustic wave equation (Kinsler et al., 2000):
2
2
22 1
tp
cp
∂∂
=∇ (1.1)
14
where p is the acoustic pressure fluctuation, 2∇ is the Laplacian operator, t is time, and c
is the thermodynamic speed of sound (defined as fBc λρ
==0
, where B is the bulk
modulus and ρ0 is the equilibrium density of the system, f is ultrasonic frequency (Hz)
and λ is wavelength). A simplified general solution can be obtained by assuming a
harmonic plane wave propagating in one direction in a lossless medium (Kinsler et al.,
2000):
)()(),( kxtjkxtj BeAetxp +− += ωω (1.2)
where A and B are constants (i.e., showing the peak magnitude during wave oscillation),
ω is the angular frequency (=2πf ), j =√-1, k is the wave-number (or propagation constant,
k = ω / c = 2π / λ), x is the position of the wave (i.e., the distance it travelled), and the
quantity (ωt – kx) is the phase of the wave.
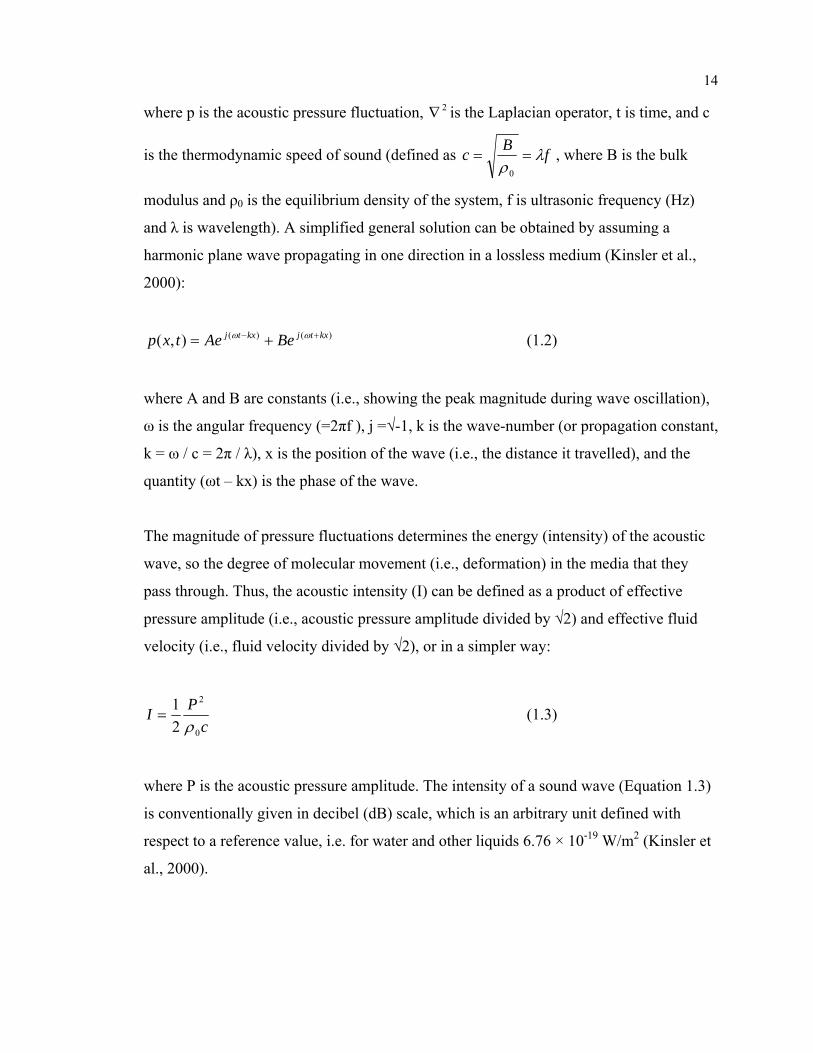
The magnitude of pressure fluctuations determines the energy (intensity) of the acoustic
wave, so the degree of molecular movement (i.e., deformation) in the media that they
pass through. Thus, the acoustic intensity (I) can be defined as a product of effective
pressure amplitude (i.e., acoustic pressure amplitude divided by √2) and effective fluid
velocity (i.e., fluid velocity divided by √2), or in a simpler way:
cPI
0
2
21ρ
= (1.3)
where P is the acoustic pressure amplitude. The intensity of a sound wave (Equation 1.3)
is conventionally given in decibel (dB) scale, which is an arbitrary unit defined with
respect to a reference value, i.e. for water and other liquids 6.76 × 10⁻¹⁹ W/m2 (Kinsler et
al., 2000).
15
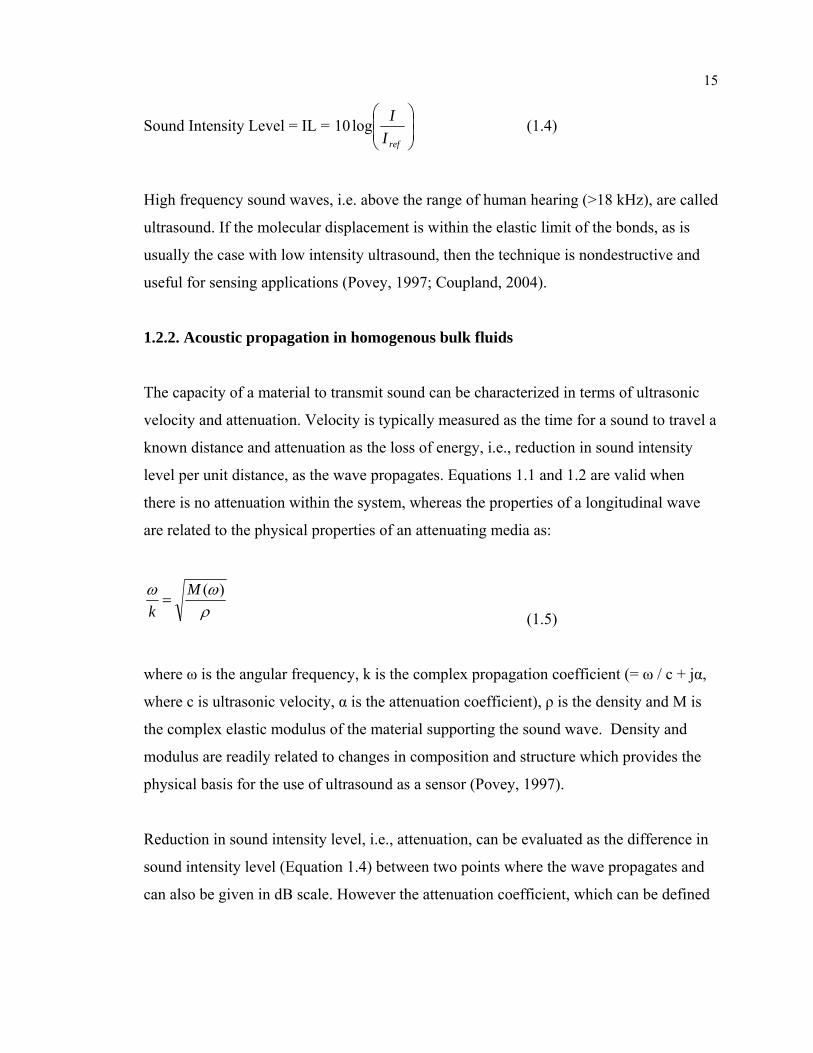
Sound Intensity Level = IL = ⎟⎟⎠
⎞⎜⎜⎝
⎛
refIIlog10 (1.4)
High frequency sound waves, i.e. above the range of human hearing (>18 kHz), are called
ultrasound. If the molecular displacement is within the elastic limit of the bonds, as is
usually the case with low intensity ultrasound, then the technique is nondestructive and
useful for sensing applications (Povey, 1997; Coupland, 2004).
1.2.2. Acoustic propagation in homogenous bulk fluids
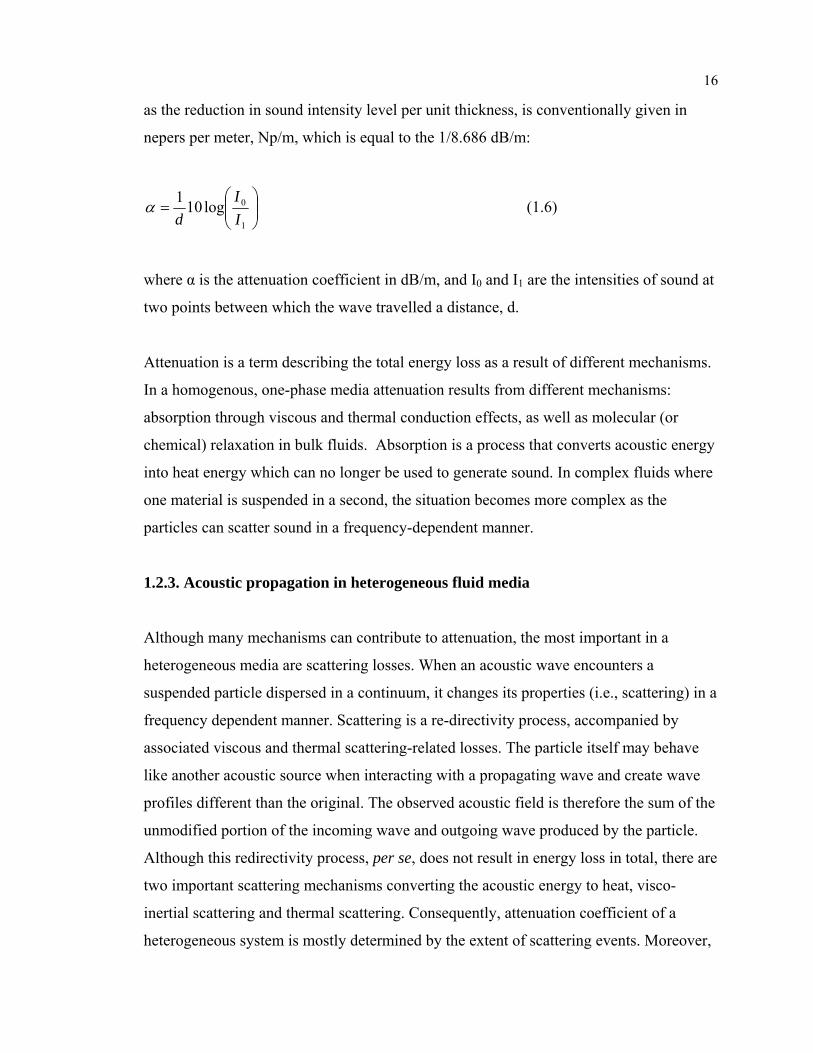
The capacity of a material to transmit sound can be characterized in terms of ultrasonic
velocity and attenuation. Velocity is typically measured as the time for a sound to travel a
known distance and attenuation as the loss of energy, i.e., reduction in sound intensity
level per unit distance, as the wave propagates. Equations 1.1 and 1.2 are valid when
there is no attenuation within the system, whereas the properties of a longitudinal wave
are related to the physical properties of an attenuating media as:
ρωω )(M
k=
(1.5)
where ω is the angular frequency, k is the complex propagation coefficient (= ω / c + jα,
where c is ultrasonic velocity, α is the attenuation coefficient), ρ is the density and M is
the complex elastic modulus of the material supporting the sound wave. Density and
modulus are readily related to changes in composition and structure which provides the
physical basis for the use of ultrasound as a sensor (Povey, 1997).
Reduction in sound intensity level, i.e., attenuation, can be evaluated as the difference in
sound intensity level (Equation 1.4) between two points where the wave propagates and
can also be given in dB scale. However the attenuation coefficient, which can be defined
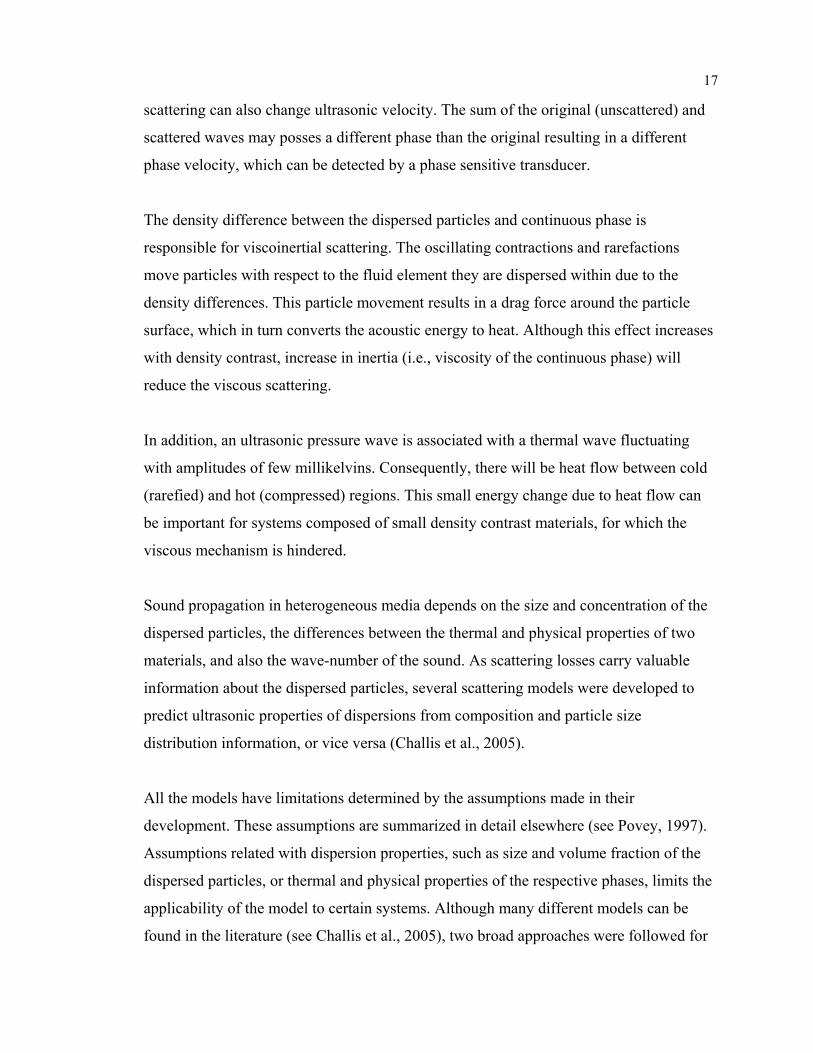
16
as the reduction in sound intensity level per unit thickness, is conventionally given in
nepers per meter, Np/m, which is equal to the 1/8.686 dB/m:
⎟⎟⎠
⎞⎜⎜⎝
⎛=
1
0log101II
dα (1.6)
where α is the attenuation coefficient in dB/m, and I0 and I1 are the intensities of sound at
two points between which the wave travelled a distance, d.
Attenuation is a term describing the total energy loss as a result of different mechanisms.
In a homogenous, one-phase media attenuation results from different mechanisms:
absorption through viscous and thermal conduction effects, as well as molecular (or
chemical) relaxation in bulk fluids. Absorption is a process that converts acoustic energy
into heat energy which can no longer be used to generate sound. In complex fluids where
one material is suspended in a second, the situation becomes more complex as the
particles can scatter sound in a frequency-dependent manner.
1.2.3. Acoustic propagation in heterogeneous fluid media
Although many mechanisms can contribute to attenuation, the most important in a
heterogeneous media are scattering losses. When an acoustic wave encounters a
suspended particle dispersed in a continuum, it changes its properties (i.e., scattering) in a
frequency dependent manner. Scattering is a re-directivity process, accompanied by
associated viscous and thermal scattering-related losses. The particle itself may behave
like another acoustic source when interacting with a propagating wave and create wave
profiles different than the original. The observed acoustic field is therefore the sum of the
unmodified portion of the incoming wave and outgoing wave produced by the particle.
Although this redirectivity process, per se, does not result in energy loss in total, there are
two important scattering mechanisms converting the acoustic energy to heat, visco-
inertial scattering and thermal scattering. Consequently, attenuation coefficient of a
heterogeneous system is mostly determined by the extent of scattering events. Moreover,
17
scattering can also change ultrasonic velocity. The sum of the original (unscattered) and
scattered waves may posses a different phase than the original resulting in a different
phase velocity, which can be detected by a phase sensitive transducer.
The density difference between the dispersed particles and continuous phase is
responsible for viscoinertial scattering. The oscillating contractions and rarefactions
move particles with respect to the fluid element they are dispersed within due to the
density differences. This particle movement results in a drag force around the particle
surface, which in turn converts the acoustic energy to heat. Although this effect increases
with density contrast, increase in inertia (i.e., viscosity of the continuous phase) will
reduce the viscous scattering.
In addition, an ultrasonic pressure wave is associated with a thermal wave fluctuating
with amplitudes of few millikelvins. Consequently, there will be heat flow between cold
(rarefied) and hot (compressed) regions. This small energy change due to heat flow can
be important for systems composed of small density contrast materials, for which the
viscous mechanism is hindered.
Sound propagation in heterogeneous media depends on the size and concentration of the
dispersed particles, the differences between the thermal and physical properties of two
materials, and also the wave-number of the sound. As scattering losses carry valuable
information about the dispersed particles, several scattering models were developed to
predict ultrasonic properties of dispersions from composition and particle size
distribution information, or vice versa (Challis et al., 2005).
All the models have limitations determined by the assumptions made in their
development. These assumptions are summarized in detail elsewhere (see Povey, 1997).
Assumptions related with dispersion properties, such as size and volume fraction of the
dispersed particles, or thermal and physical properties of the respective phases, limits the
applicability of the model to certain systems. Although many different models can be
found in the literature (see Challis et al., 2005), two broad approaches were followed for
18
the theoretical formulation of sound-particle interactions: simultaneous solutions to
linearized equations (i.e., equation of continuity, conservation of momentum, and
equation of state) in derivations or coupled-phase approach. In either case, it is essential
to specify the size of the scattering particles relative to the wavelength of the sound.
Different models are of concern depending on whether the particles at the long
wavelength limit (kr < 1, where k is the wave number and r is the radius of the suspended
particle) or not. For example, systems of 2.25 MHz ultrasound and particles with
diameters up to 100 μm dispersed in aqueous environment can be considered in the long
wavelength limit.
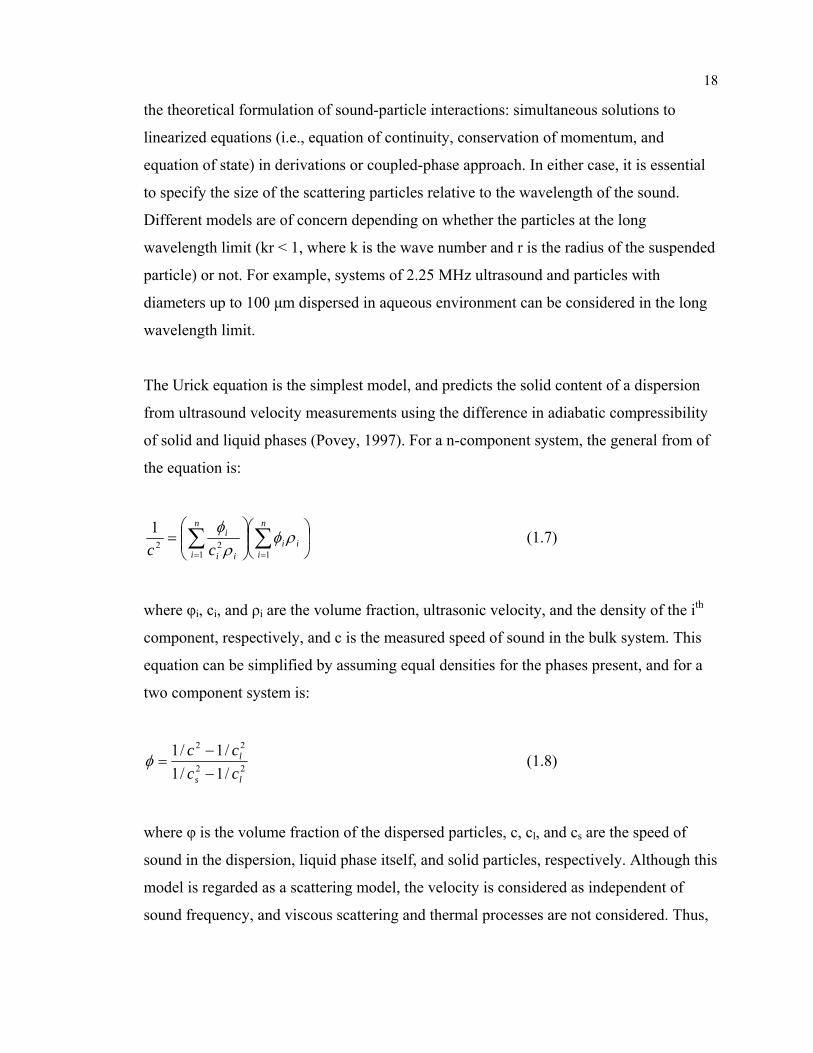
The Urick equation is the simplest model, and predicts the solid content of a dispersion
from ultrasound velocity measurements using the difference in adiabatic compressibility
of solid and liquid phases (Povey, 1997). For a n-component system, the general from of
the equation is:
⎟⎠
⎞⎜⎝
⎛⎟⎟⎠
⎞⎜⎜⎝
⎛= ∑∑
==
n
iii
n
i ii
i
cc 1122
1 ρφρφ
(1.7)
where φi, ci, and ρi are the volume fraction, ultrasonic velocity, and the density of the ith
component, respectively, and c is the measured speed of sound in the bulk system. This
equation can be simplified by assuming equal densities for the phases present, and for a
two component system is:
22
22
/1/1/1/1
ls
l
cccc
−−
=φ (1.8)
where φ is the volume fraction of the dispersed particles, c, cl, and cs are the speed of
sound in the dispersion, liquid phase itself, and solid particles, respectively. Although this
model is regarded as a scattering model, the velocity is considered as independent of
sound frequency, and viscous scattering and thermal processes are not considered. Thus,
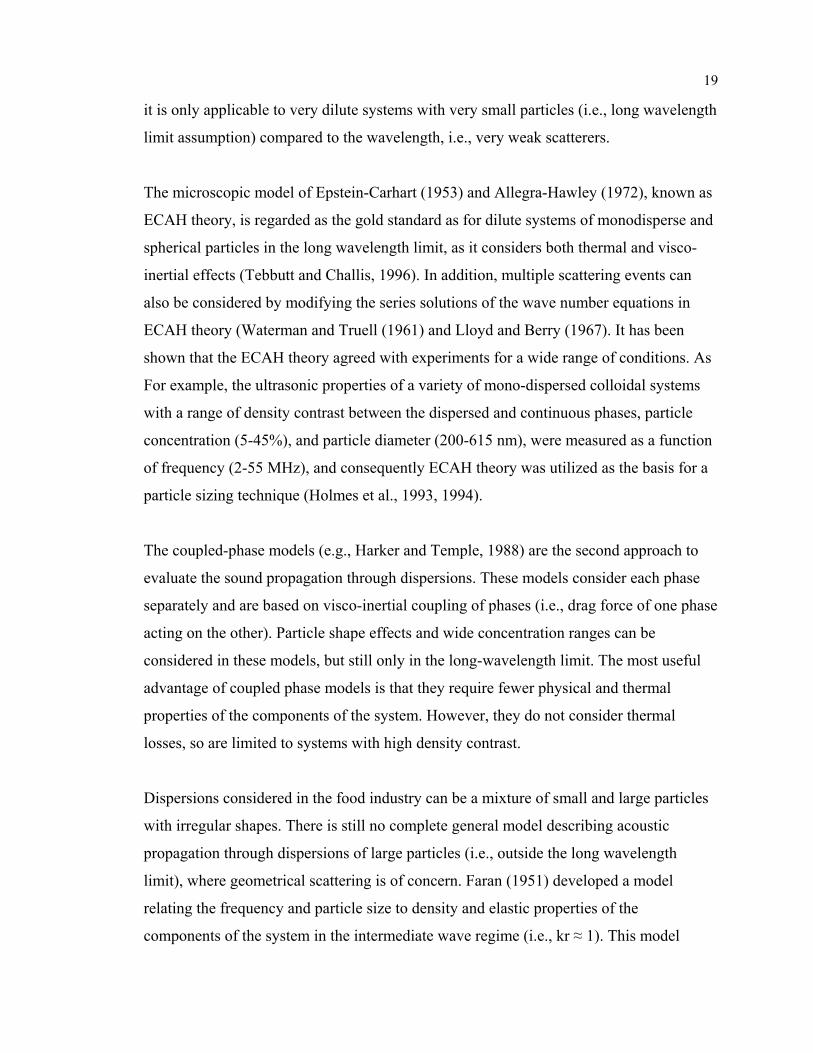
19
it is only applicable to very dilute systems with very small particles (i.e., long wavelength
limit assumption) compared to the wavelength, i.e., very weak scatterers.
The microscopic model of Epstein-Carhart (1953) and Allegra-Hawley (1972), known as
ECAH theory, is regarded as the gold standard as for dilute systems of monodisperse and
spherical particles in the long wavelength limit, as it considers both thermal and visco-
inertial effects (Tebbutt and Challis, 1996). In addition, multiple scattering events can
also be considered by modifying the series solutions of the wave number equations in
ECAH theory (Waterman and Truell (1961) and Lloyd and Berry (1967). It has been
shown that the ECAH theory agreed with experiments for a wide range of conditions. As
For example, the ultrasonic properties of a variety of mono-dispersed colloidal systems
with a range of density contrast between the dispersed and continuous phases, particle
concentration (5-45%), and particle diameter (200-615 nm), were measured as a function
of frequency (2-55 MHz), and consequently ECAH theory was utilized as the basis for a
particle sizing technique (Holmes et al., 1993, 1994).
The coupled-phase models (e.g., Harker and Temple, 1988) are the second approach to
evaluate the sound propagation through dispersions. These models consider each phase
separately and are based on visco-inertial coupling of phases (i.e., drag force of one phase
acting on the other). Particle shape effects and wide concentration ranges can be
considered in these models, but still only in the long-wavelength limit. The most useful
advantage of coupled phase models is that they require fewer physical and thermal
properties of the components of the system. However, they do not consider thermal
losses, so are limited to systems with high density contrast.
Dispersions considered in the food industry can be a mixture of small and large particles
with irregular shapes. There is still no complete general model describing acoustic
propagation through dispersions of large particles (i.e., outside the long wavelength
limit), where geometrical scattering is of concern. Faran (1951) developed a model
relating the frequency and particle size to density and elastic properties of the
components of the system in the intermediate wave regime (i.e., kr ≈ 1). This model
20
utilized the elastic scattering events (i.e., diffraction, refraction, and reflection) as the
dominant scattering mechanism and neglected the visco-inertial and thermal scattering
effects, making the model unsuitable for particles in the long wavelength limit where
these effects dominate. Hay and Mercer (1985) expanded the Faran approach by
including the visco-inertial effect by following a similar approach as in ECAH theory,
and thus this model is a candidate to characterize the complete range of particle sizes.
However, it still lacks the effects of thermal processes and has not been experimentally
validated. An example of the use of a mechanistic model in the large particle size limit is
provided by Richter et al. (2005, 2006). Modified Faran theory was used in combination
with ultrasonic attenuation spectroscopy (3-99 MHz), for size measurement in
homogenous particles and emulsions (i.e., with diverse acoustic contrast), as well as
porous (i.e., non-homogenous) particles in the micrometer range, but at very low
concentrations (i.e., 1%).
All these particle sizing approaches consider the dispersions in the absence of phase
change. The phase transition process itself, other than the changes in physical and
thermal properties of the system, can affect acoustic propagation and cause deviation
from scattering theories. Since pressure fluctuations are associated with temperature
fluctuations, the interactions of ultrasonic waves with crystallizing molecules may be
sufficient to disturb the instantaneous equilibrium as a frequency dependent manner
(Akulichev and Bulanov, 1981, 1983), and absorb ultrasonic energy. If the relaxation
time of the molecules undergoing phase change process equals the period of the sound
wave, then the ultrasonic absorption will be maximum (Blitz, 1967). This effect has been
observed by McClements et al. (1993) who noted that melting transitions in emulsion
droplets can cause changes in ultrasonic attenuation and velocity measurements. More
recently, an excess ultrasonic attenuation as a result of same phenomenon was observed
by Gulseren and Coupland (2007) during the melting of octadecane in water emulsions.
21
1.3. Ultrasonic characterization of crystal dispersions
There are two general approaches to the characterization of crystal dispersions by
ultrasound: spectroscopic analysis of crystal size and concentration within the dispersion
using scattering theories, or measuring the macroscopic properties of the system and
empirically relating them to crystal properties.
Ultrasonic spectroscopy has been used successfully for particle sizing of well-defined
systems in the long wavelength limit, such as emulsions, by means of idealized scattering
theories, and to a less extent for dispersions of large size crystals. There have been efforts
to follow crystallization by ultrasonic techniques, and corresponding CSD change
simultaneously using ECAH theory. For example, the change in the CSD during
crystallization of copper (II) sulphate pentahydrate from bulk (Tebbutt et al., 1999) and
seeded (Marshall et al., 2002) solutions were calculated from ultrasonic spectra using
ECAH theory. However, the results showed some deviation from light scattering
measurements. In a similar process, ultrasonic attenuation spectroscopy (2-160 MHz) was
used to monitor the seeded batch crystallization of potassium sulfate and to calculate the
resulting particle size distribution where mean particle diameter was ranging from 50-100
μm (Hipp et al., 2000).
Particle dynamics, such as flocculation and in result creaming in emulsions, can also be
monitored using ultrasonic techniques. The concentration profile of emulsions droplets
may change spatially and temporally, depending on the effective particle size and
physical properties of the continuous (e.g., viscosity) and dispersed phases (e.g., density
contrast to liquid phase). Pinfield et al. (1994) used ultrasonic measurements and
compared them to concentration profile simulations in a creaming emulsion to follow
depletion flocculation in oil in water emulsions containing a non-ionic surfactant.
Similarly, in another work (Chanamai et al., 2000), ultrasonic properties over a frequency
range of 1-150 MHz, apparent viscosity, and creaming rates of flocculated and
nonflocculated 14% silicone oil-in-water emulsions were combined to collect more
22
realistic information about the floc structure and dynamics, which could not be accessed
by using these techniques individually.
For characterizing the dispersions of large size crystals, often the case in many food
systems, microscopic theories are generally insufficient. Empirical approaches, based on
the bulk properties of system and characteristics of the components of the dispersion, can
be more practical than microscopic scale mechanistic models (i.e., scattering models).
Although Urick equation is classified among the scattering theories, its use is empirical in
practice and considers the concentration measurements in crystal dispersions. Pinfield et
al. (1995) showed that the Urick equation can also be derived as a special case of ECAH
theory. The researchers made an adjustment on Urick equation by utilizing a calibration
chart to be used at high volume fractions of the dispersed phase, and applied it to monitor
the spatial and temporal change of concentration in a creaming emulsion (i.e., 20 wt%
sunflower in oil emulsion with 2 wt% Tween20 and 0.03 wt% xanthan). Singh et al.
(2002) used the Urick equation to determine the solid fat content (SFC) in different fat
systems, anhydrous milk fat, cocoa butter, and their blends with canola oil (0-30 wt%).
They found that the ultrasonic measurements are not in agreement with simultaneous
pulsed NMR measurements. This discrepancy was attributed to the polymorphic
difference of the crystalline fat which they speculated affected the ultrasonic properties.
Saggin and Coupland (2004) followed a similar approach and used the Urick equation to
measure SFC of coating fat in oil dispersions (2.5-12.5 wt%). In a similar manner to
Pinfield et al. (1995), they showed the velocity is linearly related to SFC. Sayan and
Ulrich (2002) correlated measurements of ultrasonic velocity to particle size (250-500
μm) and density of several salt suspensions. They noted a linear relationship between the
density of salt dispersions and ultrasonic velocity with deviations only for larger
particles, which could be attributed to the mixing imperfections.
In addition, ultrasonic attenuation can also be used empirically to follow concentration
change empirically. Bamberger and Greenwood (2004) used ultrasonic attenuation
measurements at a single frequency (i.e., 2.25 MHz center frequency) for real-time in-situ
measurements of concentration of a silicon dioxide-water slurry (i.e., density of the fully
23
mixed slurry is 1270 kg/m3) during a mixing process as a function of height in a stirred
tank. The attenuation measurements were converted to concentration from a pre-prepared
calibration.
Another technique to evaluate dispersion properties is ultrasonic reflectance
measurements. Saggin and Coupland (2002) used measurements of the proportion of an
ultrasonic wave reflecting from the interface between the container and the sample to
characterize sugar (i.e., sucrose and lactose) dissolution. They found the reflected wave
amplitude was sensitive to the dissolved solution composition but not the amount of
undissolved material. They hypothesized that as the reflected signal is sensitive to only
about the first wavelength of material it is reflecting from (~0.3 mm) which is depleted
with respect to the large particles used and not be representative of the bulk. A
complementary technique can be the monitoring of changes in dispersion properties
during a phase change process (i.e., crystallization or dissolution). For example, Omar
and Ulrich (1999) used ultrasonic velocity measurements to monitor supersaturation in an
industrial crystallizer.
Saggin and Coupland (2004) used longitudinal and shear ultrasonic waves simultaneously
for complete characterization of solid fat dispersions. They showed for a wide size range
of crystalline particles that longitudinal ultrasonic properties are linearly related to solid
fat content, whereas only attenuation is affected by crystal morphology and
microstructure. Martini et al. (2005) considered a similar system to that of Saggin and
Coupland (2004) and attempted to simultaneously investigate the effects of crystal size
(i.e., determined by optical microscopy), and concentration (i.e., solid fat content was
determined by pulsed-NMR) during unseeded isothermal crystallization of fats on
ultrasonic parameters. The induction time for crystallization was also measured by
ultrasound, and compared to turbidity measurements. They claimed that size of the solid
fats affects the measured attenuation at only intermediate concentrations (i.e., 5-20%).
However, their control and measurements for the crystal size and morphology were only
based upon microscopic analysis.
24
Other than attenuation due to the scattering effects from individual crystals and the phase
change process itself, some artifacts of the system may affect it. For example, high
ultrasonic attenuation in frozen sucrose solutions (25-50 wt%) was attributed to the
presence of air pockets entrapped within ice, rather than phase change itself, while
ultrasonic velocity linearly changed with ice content (Gulseren and Coupland, 2008). In
another study Holmes et al. (2007) used a model food system (i.e., olive oil, sucrose, and
tripalmitin mixture) to monitor chocolate tempering process. They claimed that scattering
from tripalmitin crystals dispersed in olive oil cannot be evaluated separately in the
presence of high concentrations of sucrose crystals, and similarly the presence of seed
crystals did not increase acoustic attenuation measurably in a frequency range of 1-12
MHz.
25
Chapter 2
STATEMENT OF THE PROBLEM
Many industrial processes depend on formation (via crystallization or dispersion) or
destabilization (via dissolution or aggregation) of suspensions of crystals in liquids.
Ultrasonic sensors, which can readily be applied as on-line (i.e., with minimal lag time
for the sensor response and less labor intensive), non-invasive (i.e., without disturbing the
process), non-destructive (i.e., without affecting the sample), flexible (i.e., allowing the
measurement configuration to be modified according to the need), rapid, and inexpensive
monitoring tools, are potentially useful to characterize these processes (Coupland, 2004).
I hypothesize that changes in ultrasonic sensor response can be used to determine
changes in bulk properties (i.e., composition, particle size distribution) of suspensions of
sugar crystals (i.e., lactose or sucrose) in a continuous liquid phase (i.e., water or
vegetable oil).
There are three related objectives in this study:
1. The first objective was to use ultrasonic measurements to measure the
composition of lactose-water mixtures (i.e., either solution or suspension) at
equilibrium in terms of total lactose concentration and crystal load.
2. The second objective was to follow the kinetic changes in two related processes,
i.e., dissolution and crystallization of lactose.
a. The dissolution of lactose crystals and consequent changes in the system
properties (i.e., crystal load, solution concentration) were monitored
continuously and non-invasively by ultrasonic attenuation measurements
and compared to off-line refractive index measurements. The rate of
dissolution was tuned by varying the degree of under-saturation.
b. The bulk crystallization of lactose from gelatin-lactose systems were
monitored by ultrasonic measurements and compared to turbidity
measurements. Isothermal differential scanning calorimetry (DSC) was
26
also used as a secondary control tool. Induction time and crystallization
rates were compared for varying degrees of super-saturation and gelatin
concentrations.
3. The third objective was to use ultrasonic attenuation measurements to monitor the
mixing of sugar crystals (i.e., sucrose) into a lipid phase (i.e., corn oil), and follow
(de)agglomeration during mixing. The degree of agglomeration was tuned by
varying water concentrations as confirmed by solid bed volume measurements.
Subsequent sedimentation kinetics at the cross-section of beam path was also
monitored continuously by ultrasonic attenuation measurements.
27
Chapter 3
ULTRASONIC CHARACTERIZATION OF LACTOSE DISSOLUTION
3.1. Abstract
The ultrasonic properties (at 2.25 MHz) of lactose solutions and suspension of lactose
crystals (d~50 μm) were measured as a function of concentration (0-40 wt%). Ultrasonic
velocity increased linearly with concentration regardless of the state of dissolution of the
lactose crystals while ultrasonic attenuation was low and concentration-independent
when the lactose was dissolved and increased approximately linearly with the
concentration of suspended crystals. Therefore the amount of lactose present and the
state of dissolution can be determined simultaneously with single ultrasonic sensor. A
sensor based on this principle was applied to a stirred tank and used to measure the time
taken to mix powdered lactose into a solution and the time for the added lactose to
dissolve.
28
3.2. Introduction
Many food preparation processes involve either the dissolution of crystalline ingredients
in a solvent or the reverse process (e.g., dissolution of sugars and minerals, crystallization
of lipids). In both cases the phase transitions are thermodynamically driven but
kinetically limited. Crystallization requires two separate processes, nucleation and
growth, whose rates are affected by the presence of nucleation catalysts and by factors
affecting heat and mass transfer (Garside, 1985). Dissolution is the opposite of growth
but as it does not require a nucleation event the rate is only affected by changes in
heat/mass transfer (Ulrich, 2003). Both dissolution and growth can be slow and rate
limiting to an overall process. Furthermore, because the kinetics of both crystallization
and dissolution are affected by small variations in reaction conditions it is often necessary
to allow more than the minimum process time required to ensure the transition has
proceeded sufficiently. On-line sensors to measure the amount of crystalline vs.
dissolved material would allow greater control of the process and thus increase
efficiency.
Existing methods to measure the dissolution (or crystallization) kinetics of small
molecules typically involve separating the crystal and solution phases and measuring the
amount of solute in either (e.g., by filtering and measuring the solution concentration by
optical rotation or refractive index) (Haase and Nickerson, 1966a, 1966b; Raghavan et
al., 2001; Ziegler et al., 1987). However because these processes require a physical
separation of the crystal from solution phase they are often difficult to apply on-line. It is
also possible to determine the presence of dispersed crystals by light scattering (Mimouni
et al., 2005). Finally, nuclear magnetic resonance (NMR) can measure the environment
of certain nuclei and, from that, infer the balance of phases present. However, NMR
methods are often relatively slow and expensive and cannot make measurements inside
metal containers. Ultrasound may serve as an ideal method which would be rapid and
could be conducted on-line without disturbing the process and give a rapid automat to
probe the bulk properties of the system.
29
Ultrasound is a mechanical wave with frequencies above the range of human hearing
(>20 kHz). When used in sensing application, the frequencies used are typically in the
megahertz range and the wave amplitude is low, so the material deformations are small
and non-destructive (Povey, 1997; Coupland, 2004). The capacity of a material to
transmit sound can be described in terms of ultrasonic velocity (i.e., time to travel unit
distance) and attenuation coefficient (i.e., logarithmic loss of wave energy per unit
distance traveled). Ultrasonic properties are related to the physical properties of the
material as:
ρωω )(M
k=
(3.1)
where ω is the angular frequency (=2πf, where f is the ultrasonic frequency), k is the
complex propagation coefficient (=ω / c + iα, where c is ultrasonic velocity, α is the
attenuation coefficient and i is √-1), ρ is the density and M is the complex elastic
modulus of the material supporting the sound wave. Density and modulus are readily
related to changes in composition and structure which provides the physical basis for the
use of ultrasound as a sensor. In complex fluids where one material is suspended in a
second, the situation becomes more complex as the particles can scatter sound in a
frequency-dependent manner (Povey, 1997). Ultrasonic spectroscopy has been used to
measure the size distribution of emulsions and colloidal dispersions with by means of
well-established scattering theories relating the measured ultrasonic properties with the
physical properties of the suspension (Challis et al., 2005; McClements and Povey, 1989;
Tebbutt and Challis, 1996). This approach has been used to a lesser extent to characterize
crystal dispersions.
Sayan and Ulrich (2002) correlated measurements of ultrasonic velocity to particle size
and density of several salt suspensions while Omar and Ulrich (1999) used ultrasonic
velocity measurements to monitor supersaturation in an industrial crystallizer. Ultrasonic
attenuation spectroscopy was also used to monitor the seeded batch crystallization of
different salt solutions (Hipp et al., 2000) and also for size characterization of
30
homogenous particles and emulsions as well as porous particles in the micrometer range
(Richter et al., 2006). Saggin and Coupland (2002) used measurements of the proportion
of an ultrasonic wave reflecting from the interface between the container and the sample
to characterize sugar dissolution. They found the reflected wave amplitude was sensitive
to the dissolved solution composition but not the amount of undissolved material. They
hypothesized that as the reflected signal is sensitive to only about the first wavelength of
material it is reflecting from (~0.3 mm) it is depleted with respect to the large particles
used and not be representative of the bulk.
The existing methods for tracking crystallization/dissolution processes on-line all have
characteristic limitations. Sensors based on ultrasonic methods have shown some promise
but there has been no attempt to integrate velocity and attenuation measurements with a
goal of simultaneously measuring composition and crystal load as well as monitor the
kinetics of dissolution. The model systems used in this study are solutions and
dispersions of lactose crystals in water. Lactose is a commonly used food ingredient as
well as a tableting material for pharmaceuticals (Raghavan et al., 2001). The presence of
lactose crystals is associated with defects to certain dairy products (e.g., sweetened
condensed milk, ice cream and processed cheese). The kinetics of dissolution of α-lactose
monohydrate crystals follows a two step-process (Hunziker and Nissen, 1926). A small
amount of lactose dissolve almost instantaneously quickly reaching the solubility limit of
the α-polymorph. Further crystal dissolution can only occur as some of the dissolved α-
lactose mutarotates to the β-form. Thus the overall dissolution kinetics is often limited by
the rate of mutarotation.
3.3. Methods and materials
α-Lactose monohydrate (reagent grade) was purchased from Sigma-Aldrich (St. Louis,
MO) and used without modification. The crystals were characterized by optical
microscopy (Olympus BX-41, Hitech Instruments, Edgemont, PA; 20X) equipped with a
SPOT Insight QE camera (SPOT Diagnostic Instruments, Sterling Heights, MI) and by
static light scattering (Horiba LA-920, Irvine, CA assuming a relative refractive index of
31
1.11 with an imaginary part as 0.01) after dispersed in 2-propanol (>99.5%, Sigma
Aldrich) to avoid multiple scattering effects.
Preparation of lactose suspensions. Aqueous lactose solutions and suspensions (0-40
wt% along with 0.01 wt% thermirosal to prevent microbial spoilage) were prepared by
allowing the ingredients to come to equilibrium in water at 37°C for 3-4 days. During the
storage, samples were shaken occasionally, and equilibrium was confirmed by refractive
index measurements. Supersaturated solutions were prepared by heating the mixtures to
65°C for about 10 minutes to allow complete dissolution then cooling back to 37°C. The
supersaturated solutions were stable over the time course of the experiment so it was
possible to compare their ultrasonic properties with those of lactose crystal suspensions in
saturated lactose solutions. All measurements were performed at 37°C. Temperature was
controlled by immersing the sample containers in a stirred waterbath controlled to
±0.01°C and confirmed by thermocouple measurements inside the sample to be within
0.1°C of the target temperature. The one exception to this was when powders or solutions
were added to the mixed tank, there was a small change in temperature despite previously
bringing the added sample to approximately the same temperature. However these
changes were small (<0.5 °C) and the sample returned to within 0.1 °C of the set point
within 1-2 min (as measured by a thermocouple inside the sample.) The temperature
fluctuation could lead to a change of perhaps 1-2 ms-1 in the reported velocity data but
this is insufficient to be seen in the figures or to influence the conclusions drawn.
Solution concentration was measured by refractive index by using a temperature
controlled refractometer (Reichert, Arias 500, NY). In preliminary work I showed that
refractive index (RI) was proportional to lactose solution concentration (C, wt%) (RI =
1.332 + 0.0015C, R2 = 0.999, see Appendix A.1) and this calibration was used as a
reference method to measure dissolution kinetics.
Ultrasonic measurements. Initial ultrasonic characterization of the lactose samples was
performed using a high-precision ultrasonic pulse-echo reflectometer (McClements and
Fairley, 1992) (Figure 3.1a). An electrical spike signal (Panametrics 500 PR, Waltham,
32
MA) was passed to a 2.25 MHz broadband ultrasonic transducer (Panametrics V606),
which converted the energy to ultrasound. Fourier analysis of the ultrasonic signal
showed a bell-shaped frequency composition with a center frequency of 2.2 MHz and a
half-height peak width of 1.6 MHz. The pulse of sound traveled into a Plexiglas delay
line, and was partially reflected at the planar interface with the sample. The reflected part
returned through the delay line to the transducer (echo 1) and the transmitted part traveled
through the sample (~1 cm), was reflected from a brass plate and returned through the
sample and the delay line to the transducer (echo 2). The transducer reconverted the
acoustic signal to an electrical signal, which was stored for analysis with a digital
oscilloscope (LeCroy 9310c, Chestnut Ridge, NY). The time and energy difference
between the echo 1 and echo 2 were used to calculate the speed of sound and attenuation,
respectively.
In other experiments, a thermostated and stirred tank was fitted with ultrasonic sensors to
more closely reproduce processing conditions (Figure 3.1b). The same electrical
components were used although in through-transmission mode with one transducer
generating sound pulses and the second on the other side of the container receiving them.
Data acquisition was automated using LabView (version 7.1, National Instruments,
Austin, TX) to allow collection periods as low as 0.1 s. The sample container in this case
was a cylinder (internal diameter 10.4 cm) agitated with a blade stirrer (5 cm diameter
and 1.3 cm width with 0.6 cm diameter shaft) driven at 500 rpm by a laboratory scale
stirrer (STIR PAK laboratory stirrer, Model 4554, Cole Parmer, Chicago, IL). The cell
was calibrated by measuring the time of flight and power of an acoustic pulse passing
through water (twater, Iwater) respectively then the speed of sound and attenuating properties
of the sample were calculated from similar measurements in the sample (tsample, Isample):
samplewater
watersample t
tcc ×= (3.2)
NPTL = 10 log (Iwater / Imeasured) (3.3)
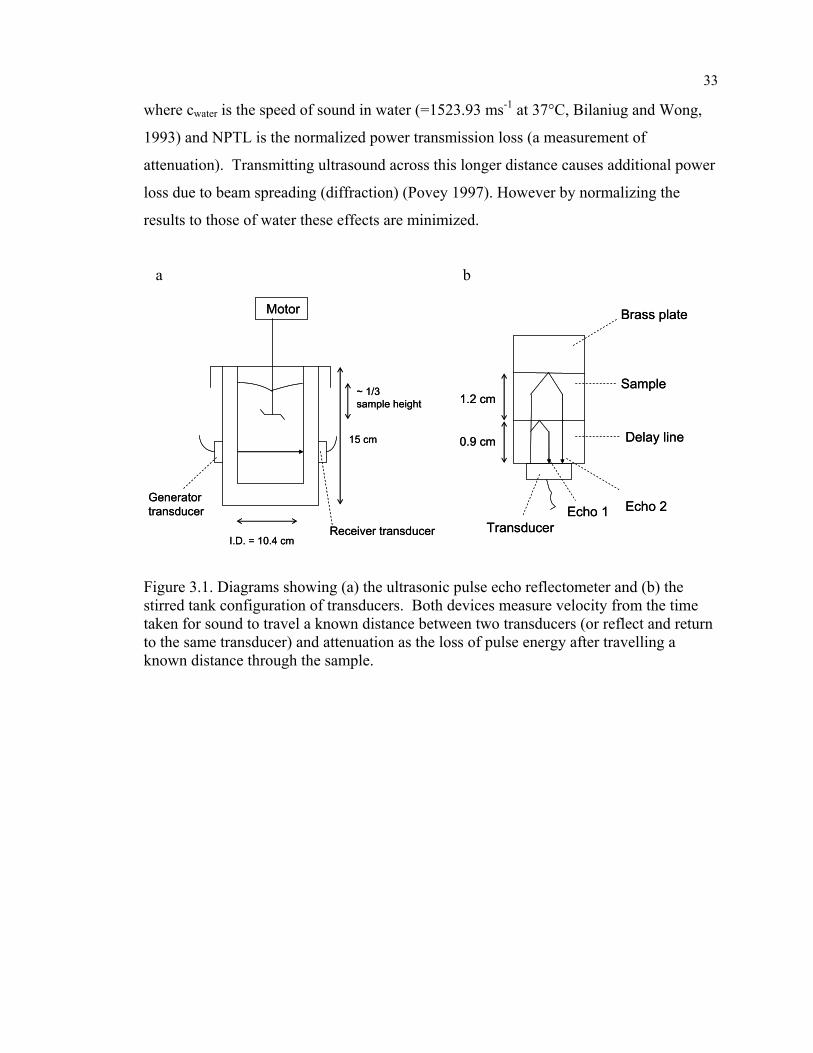
33
where cwater is the speed of sound in water (=1523.93 ms-1 at 37°C, Bilaniug and Wong,
1993) and NPTL is the normalized power transmission loss (a measurement of
attenuation). Transmitting ultrasound across this longer distance causes additional power
loss due to beam spreading (diffraction) (Povey 1997). However by normalizing the
results to those of water these effects are minimized.
a b
Figure 3.1. Diagrams showing (a) the ultrasonic pulse echo reflectometer and (b) the stirred tank configuration of transducers. Both devices measure velocity from the time taken for sound to travel a known distance between two transducers (or reflect and return to the same transducer) and attenuation as the loss of pulse energy after travelling a known distance through the sample.
Motor
Receiver transducer
Generatortransducer
15 cm
I.D. = 10.4 cm
~ 1/3 sample height
Motor
Receiver transducer
Generatortransducer
15 cm
I.D. = 10.4 cm
~ 1/3 sample height
Transducer
Delay line
Sample
Brass plate
Echo 1 Echo 2
0.9 cm
1.2 cm
Transducer
Delay line
Sample
Brass plate
Echo 1 Echo 2
0.9 cm
1.2 cm
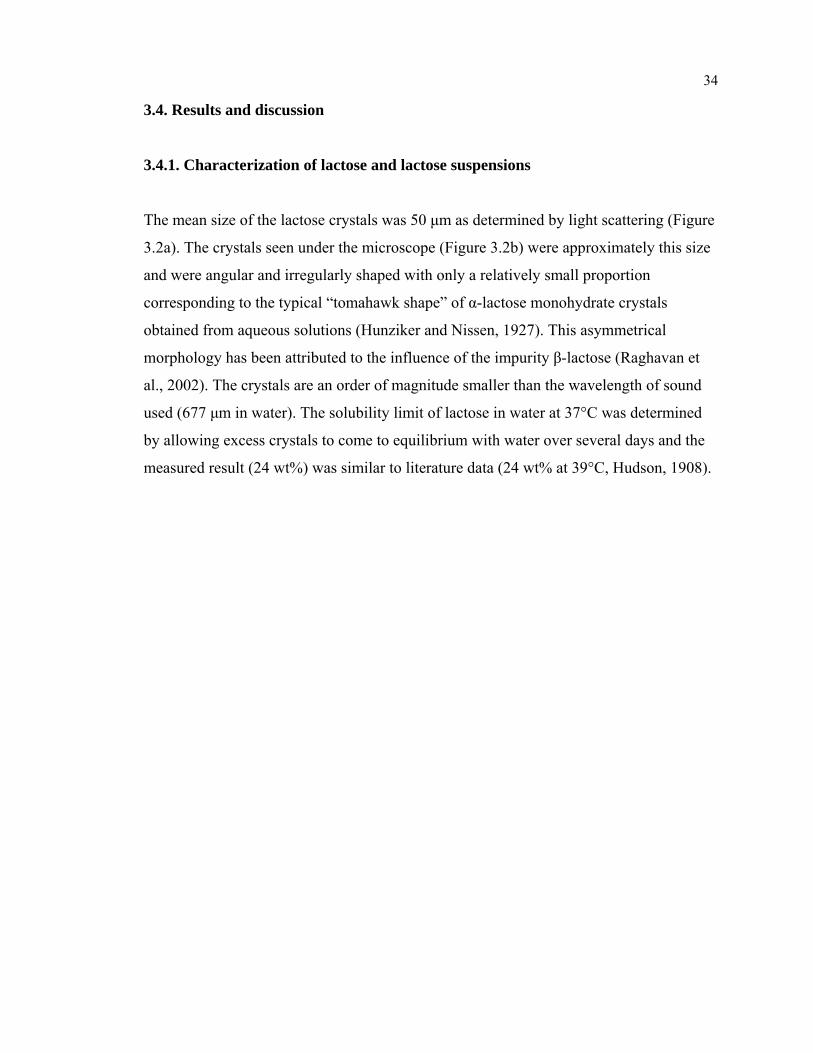
34
3.4. Results and discussion
3.4.1. Characterization of lactose and lactose suspensions
The mean size of the lactose crystals was 50 μm as determined by light scattering (Figure
3.2a). The crystals seen under the microscope (Figure 3.2b) were approximately this size
and were angular and irregularly shaped with only a relatively small proportion
corresponding to the typical “tomahawk shape” of α-lactose monohydrate crystals
obtained from aqueous solutions (Hunziker and Nissen, 1927). This asymmetrical
morphology has been attributed to the influence of the impurity β-lactose (Raghavan et
al., 2002). The crystals are an order of magnitude smaller than the wavelength of sound
used (677 μm in water). The solubility limit of lactose in water at 37°C was determined
by allowing excess crystals to come to equilibrium with water over several days and the
measured result (24 wt%) was similar to literature data (24 wt% at 39°C, Hudson, 1908).
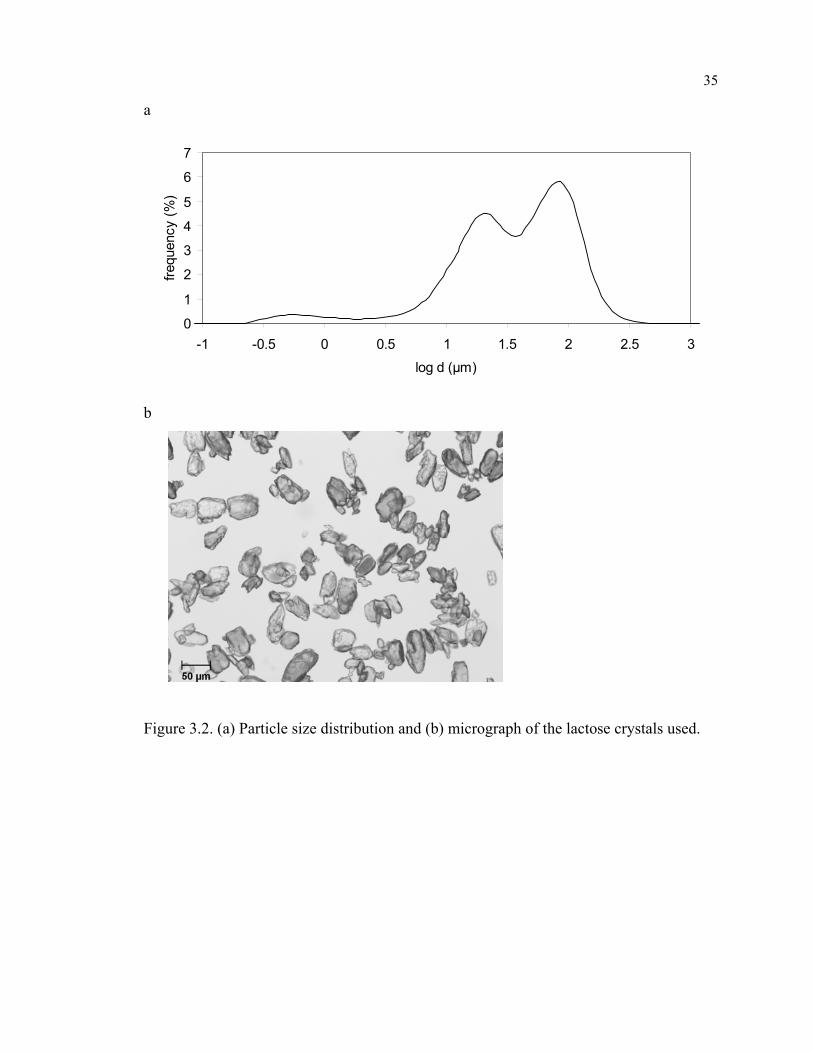
35
a
0
1
2
3
4
5
6
7
-1 -0.5 0 0.5 1 1.5 2 2.5 3
log d (μm)
frequ
ency
(%)
b
Figure 3.2. (a) Particle size distribution and (b) micrograph of the lactose crystals used.
36
The ultrasonic properties of lactose-water mixtures were investigated using the analytical
measurement cell configuration. The ultrasonic velocity increased steadily with
concentration and there was no break in the curve corresponding to the solubility limit
(Figure 3.3a). The ultrasonic velocity in lactose crystal dispersions was compared to
supersaturated solutions of the same composition (prepared by heating the suspensions
until the crystals dissolved then re-cooling to 37°C) and there were no differences.
Therefore, ultrasonic velocity was sensitive to the amount of lactose in the container but
not to its state (i.e., super-saturated solution vs. a mixture of saturated solution and
suspended crystals). Therefore a measurement of ultrasonic velocity could be used to
measure the total amount of lactose present but I would not expect any changes in
velocity during dissolution or crystallization process provided crystals were uniformly
distributed across the beam path. Sayan and Ulrich (2002) also noted a linear response
between the density of salt dispersions and ultrasonic velocity with deviations only for
larger particles. It should be noted that this observation, while valid for this system, is
unlikely to be universal. Fine particles scatter sound in a frequency and particle size
dependant manner (Povey 1997) and it seems likely that other combinations of crystal
size and ultrasonic frequency would give greater or smaller changes in velocity on
dissolution.
The ultrasonic attenuation coefficient was low and effectively independent of
composition for all sub-saturated solutions and also for supersaturated solutions.
However, when crystals were present the attenuation coefficient increased approximately
linearly with crystal load (Figure 3.3b). It should be noted that there was considerable
error in the determination of attenuation coefficient in the crystal suspensions, especially
for higher crystal loads, probably due to difficulties in maintaining adequate mixing.
37
a
1560
1600
1640
1680
1720
15 20 25 30 35 40 45
% lactose (wt/wt)
c (m
/s)
b
0
5
10
15
20
25
30
15 20 25 30 35 40 45
% lactose (wt/wt)
atte
nuat
ion
(Np/
m)
Figure 3.3. Ultrasonic (a) velocity and (b) attenuation coefficient of lactose solutions (open symbols) and suspensions (filled symbols). Measurements were conducted using a 2.25 MHz center frequency transducer in a pulse echo reflectometer. Points and error bars are the mean and standard deviation of three experimental replications, respectively.
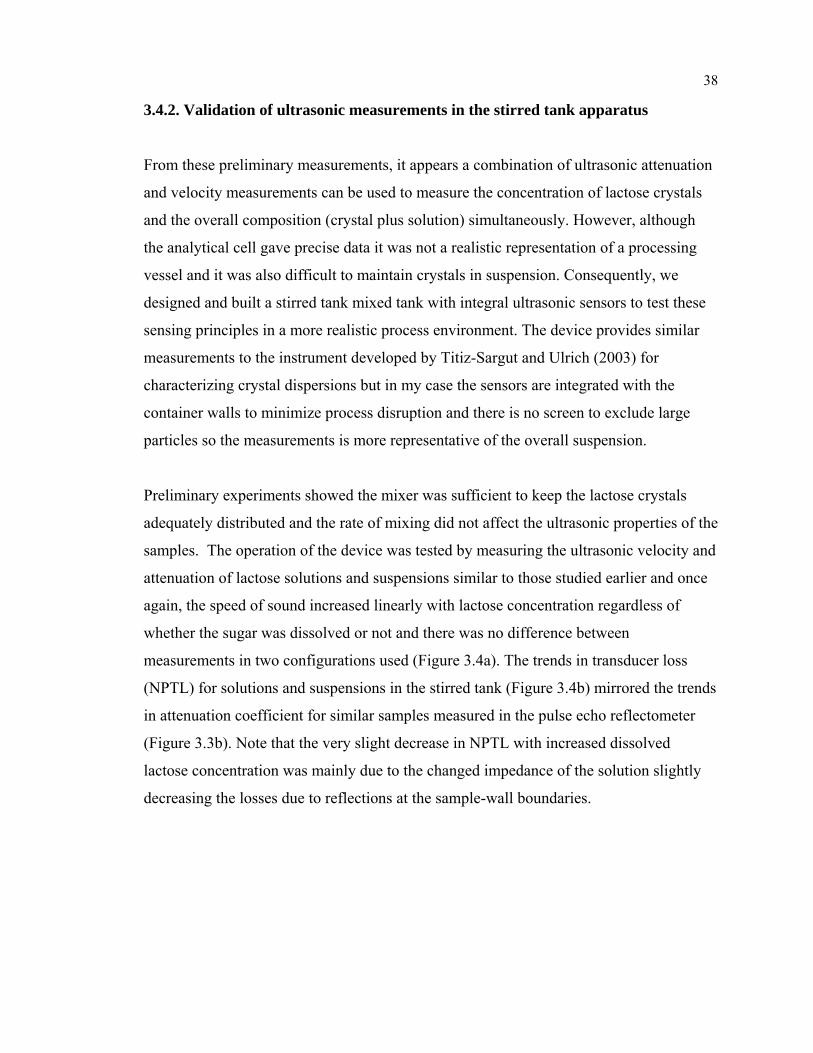
38
3.4.2. Validation of ultrasonic measurements in the stirred tank apparatus
From these preliminary measurements, it appears a combination of ultrasonic attenuation
and velocity measurements can be used to measure the concentration of lactose crystals
and the overall composition (crystal plus solution) simultaneously. However, although
the analytical cell gave precise data it was not a realistic representation of a processing
vessel and it was also difficult to maintain crystals in suspension. Consequently, we
designed and built a stirred tank mixed tank with integral ultrasonic sensors to test these
sensing principles in a more realistic process environment. The device provides similar
measurements to the instrument developed by Titiz-Sargut and Ulrich (2003) for
characterizing crystal dispersions but in my case the sensors are integrated with the
container walls to minimize process disruption and there is no screen to exclude large
particles so the measurements is more representative of the overall suspension.
Preliminary experiments showed the mixer was sufficient to keep the lactose crystals
adequately distributed and the rate of mixing did not affect the ultrasonic properties of the
samples. The operation of the device was tested by measuring the ultrasonic velocity and
attenuation of lactose solutions and suspensions similar to those studied earlier and once
again, the speed of sound increased linearly with lactose concentration regardless of
whether the sugar was dissolved or not and there was no difference between
measurements in two configurations used (Figure 3.4a). The trends in transducer loss
(NPTL) for solutions and suspensions in the stirred tank (Figure 3.4b) mirrored the trends
in attenuation coefficient for similar samples measured in the pulse echo reflectometer
(Figure 3.3b). Note that the very slight decrease in NPTL with increased dissolved
lactose concentration was mainly due to the changed impedance of the solution slightly
decreasing the losses due to reflections at the sample-wall boundaries.
39
a
1480
1520
1560
1600
1640
1680
0 5 10 15 20 25 30 35 40
% lactose (wt/wt)
c (m
/s)
b
-1
0
1
2
3
4
0 5 10 15 20 25 30 35 40
% lactose (wt/wt)
NP
TL
Figure 3.4. Ultrasonic (a) velocity and (b) transducer loss of lactose solutions (open symbols) and suspensions (filled symbols). Measurements were conducted using a pair of 2.25 MHz center frequency transducers in through-transmission mode in a stirred tank configuration. Points and error bars are the mean and standard deviation of three experimental replications, respectively.
40
3.4.3. Kinetics of Mixing and Dissolution
Having established the stirred tank configuration could be used to reliably measure the
ultrasonic properties of defined lactose solutions and suspensions, the next series of
experiments were an attempt to follow the dissolution process ultrasonically. Powdered
lactose (pre-heated to 40°C to minimize temperature changes) was added to lactose
solution at 37°C in the stirred tank and the ultrasonic properties measured at 100 ms
intervals throughout the mixing and dissolution process. Small samples (~2 mL) were
withdrawn at intervals, filtered through a 0.2 μm syringe filter, and the dissolved lactose
concentration determined from a refractive index measurement.
Clearly when powdered lactose is added to water there are (at least) two processes
occurring that could potentially affect the ultrasonic signal: mixing and dissolution. To
separate these effects, I conducted two series of experiments:
3.4.3.1. Mixing without dissolution
In these measurements lactose powder was mixed with a saturated lactose solution so the
changes seen are due to mixing without any possibility of crystal dissolution. In this case
NPTL increased quickly and then returned to a steady state after about 2 minutes which
constituted a mixing time (Figure 3.5a). In other experiments (see below) when liquids
were added to liquids the mixing time was greatly reduced leading us to propose that the
attenuation peak seen here is due to the incorporation and dissipation of air bubbles
entrained within the dry powder rather than inhomogeneities in the crystal suspension
itself. During the mixing time it was not possible to make accurate measurements of the
state of crystal dissolution and so constitutes a “dead time” for the instrument. It does
however provide a useful measure of the time required for mixing to be complete. There
was some variation in ultrasonic velocity immediately after lactose addition as the system
was mixed and contaminated with air bubbles within the powder but then remained
unchanged throughout the dissolution. This was expected as there was no difference in
41
ultrasonic velocity between a lactose solution and crystal suspension of the same
composition and velocity measurements are not reported or discussed further.
3.4.3.2. Mixing and dissolution
In these measurements lactose powder was added to undersaturated lactose solutions to
allow simultaneous mixing and dissolution. NPTL increased immediately upon lactose
powder addition before decreasing initially rapidly then more slowly (Figure 3.5b). After
approximately 3 min the NPTL was almost constant suggesting dissolution was complete
(contrast with the 2 min dead time for the “just mixing” experiment, Figure 3.5a). The
same dissolution process was tracked with offline refractive index measurements (Figure
3.5b) and reached a steady state at about the same time as the ultrasonic sensor. However,
in this case, because the time for mixing was comparable to the time for dissolution it
was not possible to extract any useful information on dissolution kinetics.
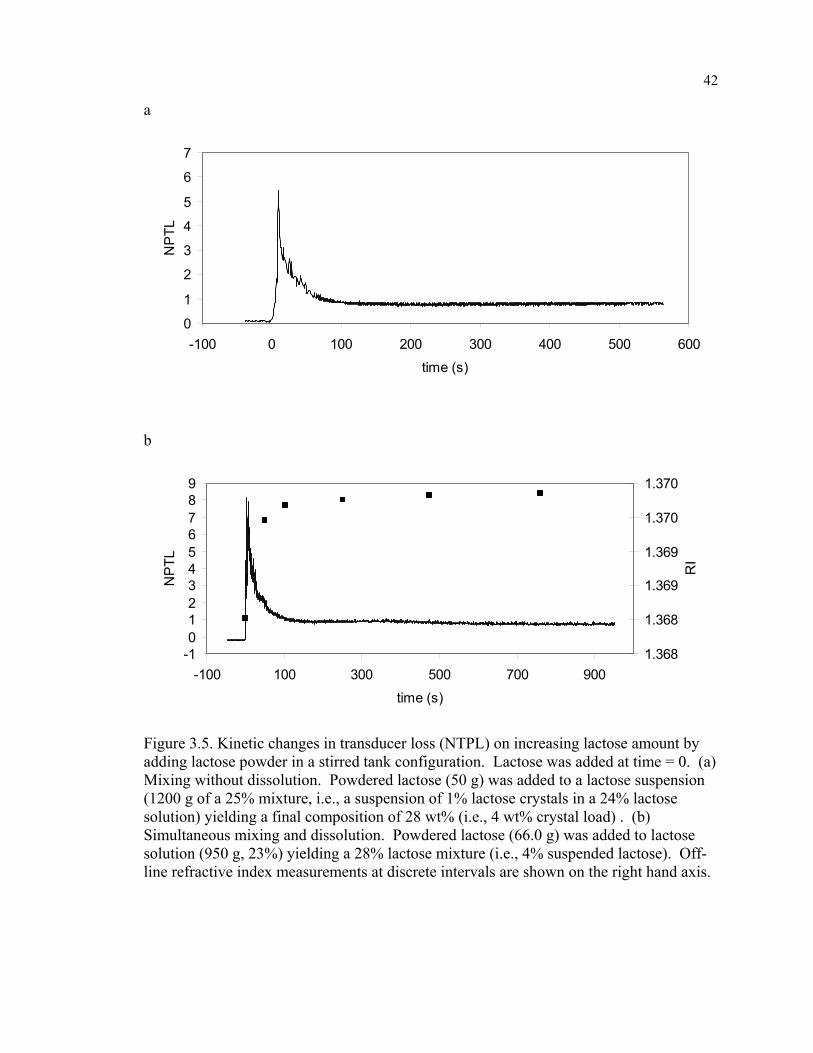
42
a
0
1
2
3
4
5
6
7
-100 0 100 200 300 400 500 600
time (s)
NP
TL
b
-10123456789
-100 100 300 500 700 900
time (s)
NP
TL
1.368
1.368
1.369
1.369
1.370
1.370
RI
Figure 3.5. Kinetic changes in transducer loss (NTPL) on increasing lactose amount by adding lactose powder in a stirred tank configuration. Lactose was added at time = 0. (a) Mixing without dissolution. Powdered lactose (50 g) was added to a lactose suspension (1200 g of a 25% mixture, i.e., a suspension of 1% lactose crystals in a 24% lactose solution) yielding a final composition of 28 wt% (i.e., 4 wt% crystal load) . (b) Simultaneous mixing and dissolution. Powdered lactose (66.0 g) was added to lactose solution (950 g, 23%) yielding a 28% lactose mixture (i.e., 4% suspended lactose). Off-line refractive index measurements at discrete intervals are shown on the right hand axis.
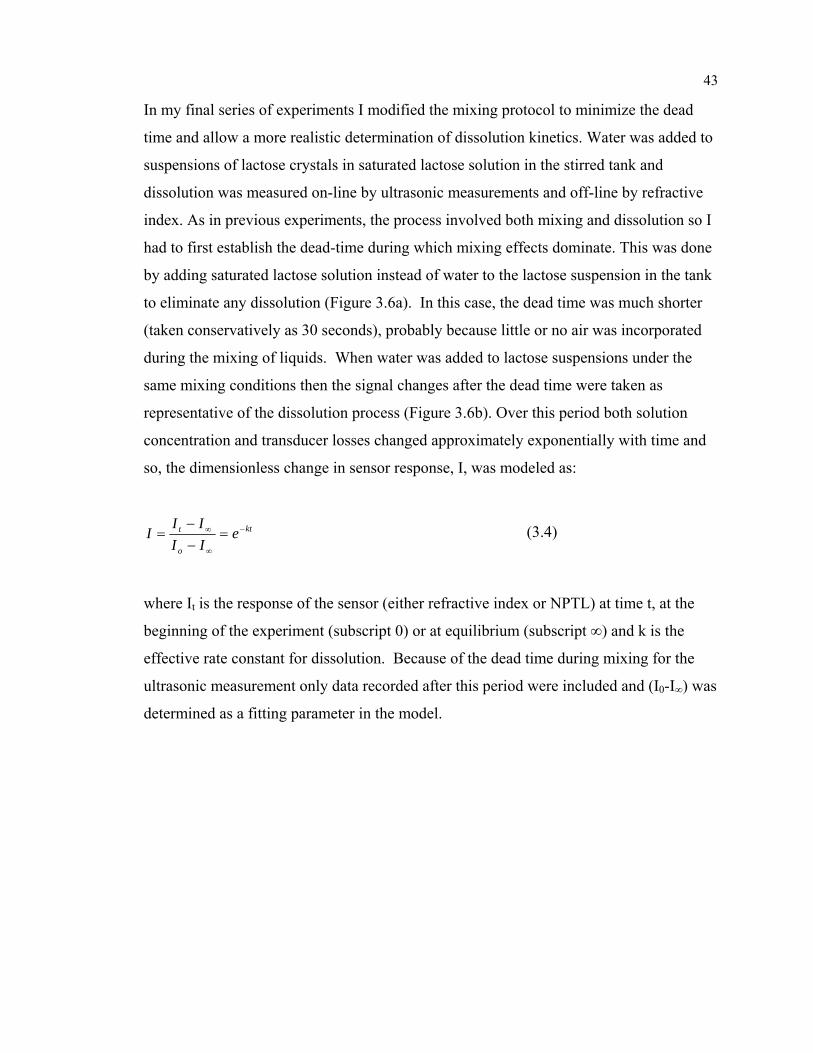
43
In my final series of experiments I modified the mixing protocol to minimize the dead
time and allow a more realistic determination of dissolution kinetics. Water was added to
suspensions of lactose crystals in saturated lactose solution in the stirred tank and
dissolution was measured on-line by ultrasonic measurements and off-line by refractive
index. As in previous experiments, the process involved both mixing and dissolution so I
had to first establish the dead-time during which mixing effects dominate. This was done
by adding saturated lactose solution instead of water to the lactose suspension in the tank
to eliminate any dissolution (Figure 3.6a). In this case, the dead time was much shorter
(taken conservatively as 30 seconds), probably because little or no air was incorporated
during the mixing of liquids. When water was added to lactose suspensions under the
same mixing conditions then the signal changes after the dead time were taken as
representative of the dissolution process (Figure 3.6b). Over this period both solution
concentration and transducer losses changed approximately exponentially with time and
so, the dimensionless change in sensor response, I, was modeled as:
kt
o
t eIIII
I −
∞
∞ =−−
= (3.4)
where It is the response of the sensor (either refractive index or NPTL) at time t, at the
beginning of the experiment (subscript 0) or at equilibrium (subscript ∞) and k is the
effective rate constant for dissolution. Because of the dead time during mixing for the
ultrasonic measurement only data recorded after this period were included and (I0-I∞) was
determined as a fitting parameter in the model.
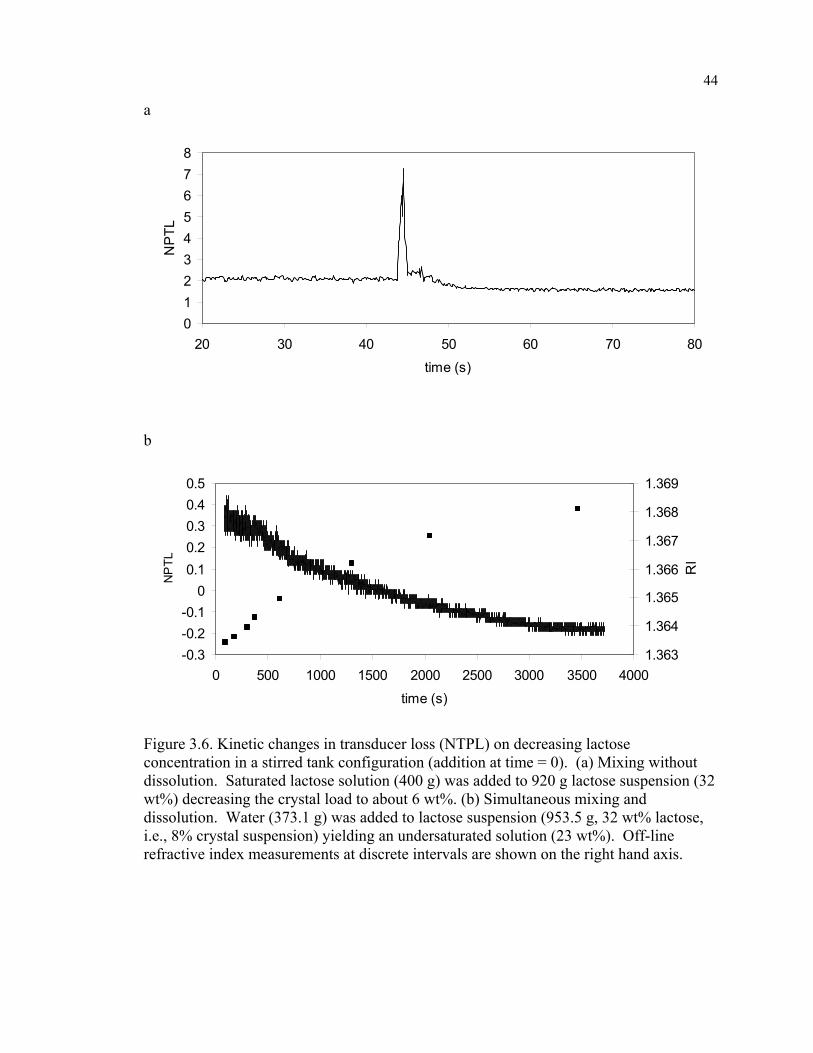
44
a
012345678
20 30 40 50 60 70 80
time (s)
NP
TL
b
-0.3-0.2-0.1
00.10.20.30.40.5
0 500 1000 1500 2000 2500 3000 3500 4000
time (s)
NP
TL
1.363
1.364
1.365
1.366
1.367
1.368
1.369
RI
Figure 3.6. Kinetic changes in transducer loss (NTPL) on decreasing lactose concentration in a stirred tank configuration (addition at time = 0). (a) Mixing without dissolution. Saturated lactose solution (400 g) was added to 920 g lactose suspension (32 wt%) decreasing the crystal load to about 6 wt%. (b) Simultaneous mixing and dissolution. Water (373.1 g) was added to lactose suspension (953.5 g, 32 wt% lactose, i.e., 8% crystal suspension) yielding an undersaturated solution (23 wt%). Off-line refractive index measurements at discrete intervals are shown on the right hand axis.
45
The results from the regression analysis are presented in Table 1 (note that as refractive
index increased during dissolution while NPTL decreased the signs of the calculated rate
constant are different although I hypothesize the process being described is the same).
The model fitted the data well with a standard error was less than 0.001 and a correlation
coefficient greater than 0.99 in each case. The rate constants measured by ultrasound
were all statistically similar to one another regardless of the initial lactose concentration.
This is as expected because although the overall dissolution rate increases with degree of
undersaturation the process, and hence rate constant, remains the same. However, when
dissolution was characterized by refractive index measurements the dissolution rate
decreased with increases in understauration. Although a similar trend was also observed
in ultrasonic measurements, the rate constant did not change significantly. There can be
several reasons causing this difference. For example, lower sampling rates of refractive
index measurements compared to ultrasound may have affected the model efficiency, or
the time lag associated with making an off-line measurement decreased the reliability of
refractive index measurements. On the other hand, ultrasonic measurements can be
affected from the changes in particle size distribution during dissolution, and hence this
may have affected the calculated rate constant for the dissolution process. The calculated
rate constants are in reasonable agreement with values reported in the literature using a
mutarotation method (88 × 10-5 s-1, Haase and Nickerson, 1966a).
The dissolution process was also compared in a monitoring technique-wise manner
(Table 1). Although the rate constants for the two methods were similar, the highest and
lowest initial concentrations resulted in significant difference. In addition to the
limitations of the two techniques, the reason for this difference can be coming from the
dissolution dynamics of lactose. Since the dissolution of lactose is characterized by two
subsequent processes as the instantaneous initial solubility (i.e., determined by the
solubility of α-lactose) and much slower equilibrium solubility (i.e., determined by the
equilibrium mutarotation ratio), the calculated effective rate constant was modified with
changing degree of dilution.
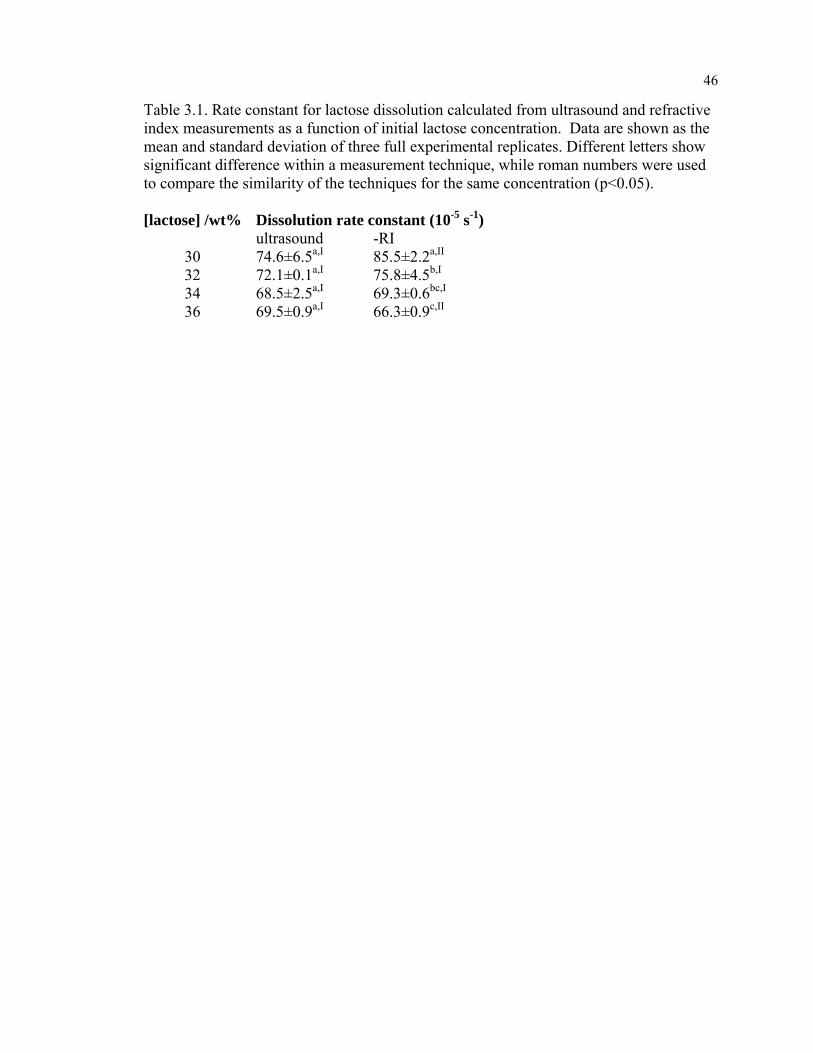
46
Table 3.1. Rate constant for lactose dissolution calculated from ultrasound and refractive index measurements as a function of initial lactose concentration. Data are shown as the mean and standard deviation of three full experimental replicates. Different letters show significant difference within a measurement technique, while roman numbers were used to compare the similarity of the techniques for the same concentration (p<0.05). [lactose] /wt% Dissolution rate constant (10-5 s-1) ultrasound -RI
30 74.6±6.5a,I 85.5±2.2a,II 32 72.1±0.1a,I 75.8±4.5b,I 34 68.5±2.5a,I 69.3±0.6bc,I 36 69.5±0.9a,I 66.3±0.9c,II
47
3.5. Conclusion
The increase in ultrasonic velocity (relative to water) is proportional to the amount of
lactose in the sample regardless of the state (dissolved or crystalline). Ultrasonic
attenuation is low when the lactose is dissolved but increases approximately linearly with
undissolved lactose concentration. Combination of velocity and attenuation
measurements can therefore be used to estimate both the amount and state of the lactose
and thus progression of processes such as dissolution and crystallization. The ultrasonic
method is ideal for application as an on-line sensor as it can be applied non-invasively
and can give robust and rapid results. Furthermore, the high sensitivity of ultrasonic
attenuation to inhomogeneity within the sample makes it a potential method to measure
the progress of a mixing operation (e.g., conching of chocolate).
It should be stressed that the approach pursued here is entirely empirical. It should be
possible to devise a more complete description of the wave-matter interactions using
scattering theory especially as the system is in the long wavelength limit, i.e., the
wavelength of sound (~600 μm) >> particle size (~50 μm). Furthermore, by taking
measurements over a range of ultrasonic frequencies it should be possible to
simultaneously calculate the size of the particles present.
48
Chapter 4
ULTRASONIC CHARACTERIZATION OF LACTOSE CRYSTALLIZATION
IN GELATIN GELS
4.1. Abstract
Since ultrasonic waves are sensitive to the bulk properties (i.e., density and
compressibility) of a homogenous system (e.g., solution), and are often modified by the
characteristics of the different phases in a dispersion, they can be used to follow kinetic
changes in a dispersion, such as crystallization. Ultrasonic velocity and attenuation
measurements (2.25 MHz center frequency) were used to follow bulk crystallization of
lactose from gelatin gels at 25°C, and compared to turbidity (500 nm) and calorimetry
measurements.
Ultrasonic attenuation measurements were shown to be more sensitive to the
crystallization of lactose than ultrasonic velocity measurements. Two rate parameters
were defined to compare the effects of formulation on the kinetics of lactose
crystallization, a maximum rate (rmax) and induction time (ti). All measurement methods
showed similar trends with different formulations. With increasing lactose super-
saturation, rmax increased and ti decreased significantly (p<0.05) while the inhibitory
effects of gelatin on crystallization kinetics were not significant. Although it is difficult
to make conclusions about the relative effects of gelatin-lactose interactions on lactose
crystallization, ultrasonic measurements were able to differentiate between different
crystallization conditions and can be used for further analyses of the thermodynamics and
kinetics of the water-lactose-gelatin system.
49
4.2. Introduction
Lactose is a disaccharide of glucose and galactose with two isomeric forms, α and β, that
interconvert by motarotation and exist at equilibrium in solution. For example, in water
at 20°C, 37.3% α-lactose and 62.7% β-lactose are present at equilibrium (Ganzle et al.,
2008). Temperature changes have only a small effect on the equilibrium ratio of
concentrations of the isomers (Whitaker, 1933), while the rate of mutarotation is
profoundly affected by temperature (Whitaker, 1933; Haase and Nickerson, 1966a).
When a lactose solution is super-saturated at moderate temperatures (below 95°C), α-
lactose monohydrate crystals will be obtained since the α-form is less soluble and
crystallization will continue so long as α-lactose in solution can be replenished by
mutarotation. Haase and Nickerson (1966b) showed that the mutarotation rate is not
limiting to crystallization at moderate temperatures (15-45°C). However at low
temperatures (i.e., refrigeration temperatures) where the mutarotation rate decreased
substantially (Whitaker, 1933), or in the presence of many crystal nuclei which increase
the crystallization rate (Twieg and Nickerson, 1968) the mutarotation rate can be rate
limiting to the overall crystallization process. In a similar manner, it was shown that
surface incorporation of lactose crystals into the crystal lattice rather than molecular
diffusion in the aqueous solution rate is limiting to crystallization (Haase and Nickerson,
1966b; Nickerson and Moore 1974).
Although crystallization rate generally increases with supersaturation, there are many
other factors (e.g., impurities acting as crystallization inhibitors or catalysts) that can
affect overall kinetics, as well as the final crystal morphology and microstructure.
Depending on the crystallization conditions, the shapes of lactose crystals formed can
vary (Ganzle et al., 2008). For example, when the crystallization is fast, only prism-
shaped crystals are formed, and with decreasing degree of super-saturation diamond
shaped plates, then pyramids and finally tomahawk shapes can be observed (Herrington,
1934). Lactose crystallization can be desirable (e.g., during refining from whey), or
undesirable (e.g., in ice cream as it causes sandiness) so monitoring and control of the
process is essential.
50
The crystallization of lactose can be affected by the presence of hydrocolloids including
gelatin. Firstly, a gel environment can prevent any possible convective flow effects,
which can modify heat and mass transfer processes, and can also eliminate secondary
nucleation events due to the fragmentation of pre-existing lactose crystals. Secondly, in
the presence of gelatin molecules may affect the phase equilibrium of the reaction.
Gelatin is sometimes used to inhibit the sandiness defect due to lactose crystallization in
ice cream (Nickerson, 1962). Some early studies (described by Whitaker, 1933, and
Ganzle et al., 2008) showed that high gelatin concentrations (i.e., >1%) delayed lactose
crystallization in ice cream at moderate but not high levels of lactose supersaturation.
In order to follow crystallization in a gel, it is difficult to separate individual crystals from
solution for analysis and the monitoring technique selected needs to differentiate
crystallization from other the changes in the solution phase. The process of crystallization
can be monitored on-line using a variety of techniques including turbidity measurements.
However, ultrasonic methods can be used for in-situ monitoring of crystallization process
more effectively as they are applicable to optically opaque systems.
Acoustic waves propagate as a series of compressions and rarefactions and can change
their properties depending on the nature of the media that they are travelling. Low
intensity (i.e., deformations within the elastic limit of the material) ultrasound (>18 kHz)
can be used to monitor phase change process in optically opaque solutions non-invasively
and can readily be applied on-line (Coupland, 2004). Ultrasonic velocity and attenuation
(i.e., the logarithmic loss of the wave energy with distance) measurements can provide
physico-chemical information about the system (i.e., compressibility and density). When
solid particles are present in a continuum, they will scatter sound in a frequency
dependent manner. This scattering event or collection of different events can be observed
as an additional energy loss (i.e., attenuation change) and a phase change in the measured
wave (i.e., yielding velocity dispersion).
51
There have been attempts to use ultrasonic techniques to follow crystallization process.
For example, the change in crystal size distribution during crystallization of copper (II)
sulphate pentahydrate from bulk (Tebbutt et al., 1999) and seeded (Marshall et al., 2002)
solutions were calculated from ultrasonic spectra using scattering theories. However, the
results showed some deviation from light scattering measurements. Saggin and Coupland
(2004) measured the amount of fat crystallized (i.e., solid fat content) of coating fat in oil
dispersions (2.5-12.5 wt%) using ultrasonic attenuation and velocity measurements.
Omar and Ulrich (1999) used ultrasonic velocity measurements to monitor the degree of
supersaturation of K2SO4 solution in an industrial crystallizer during seeded
crystallization. In Chapter 3, I showed that ultrasonic attenuation measurements were
sensitive to the concentration of lactose crystals dispersed in a lactose solution, whereas
velocity measurement only to the total lactose independent of its state. The objective of
this study is to develop my earlier observations and in this case follow the kinetics of
lactose crystallization.
4.3. Materials and methods:
Solution preparation: Gelatin from bovine skin (type B, 225 bloom) and α-lactose
monohydrate (reagent grade) were obtained from Sigma-Aldrich and used without further
modification. Lactose (43-46 wt%) and gelatin (1.5 and 3 wt%) were added to high purity
water (Nanopure Barnstead, Dubuque, IA), and stirred for about half an hour at room
temperature to allow the gelatin to hydrate. The samples were then heated to 75-80°C and
stirred for a further 15 min to ensure complete dissolution.
Crystallization: Crystallization kinetics was monitored in-situ by ultrasonic
measurements over several hours and the results were compared to off-line turbidity
measurements made in similar samples. For ultrasonic measurements, an immersion
probe configuration (Fig. 4.1) was dipped into a beaker containing 30 mL of the hot
solution and immediately covered with several layers of Parafilm to prevent evaporation.
For turbidity measurements, aliquots of the hot solution was sampled into 3 mL plastic
cuvettes and sealed with plastic caps. The samples were cooled in a waterbath to
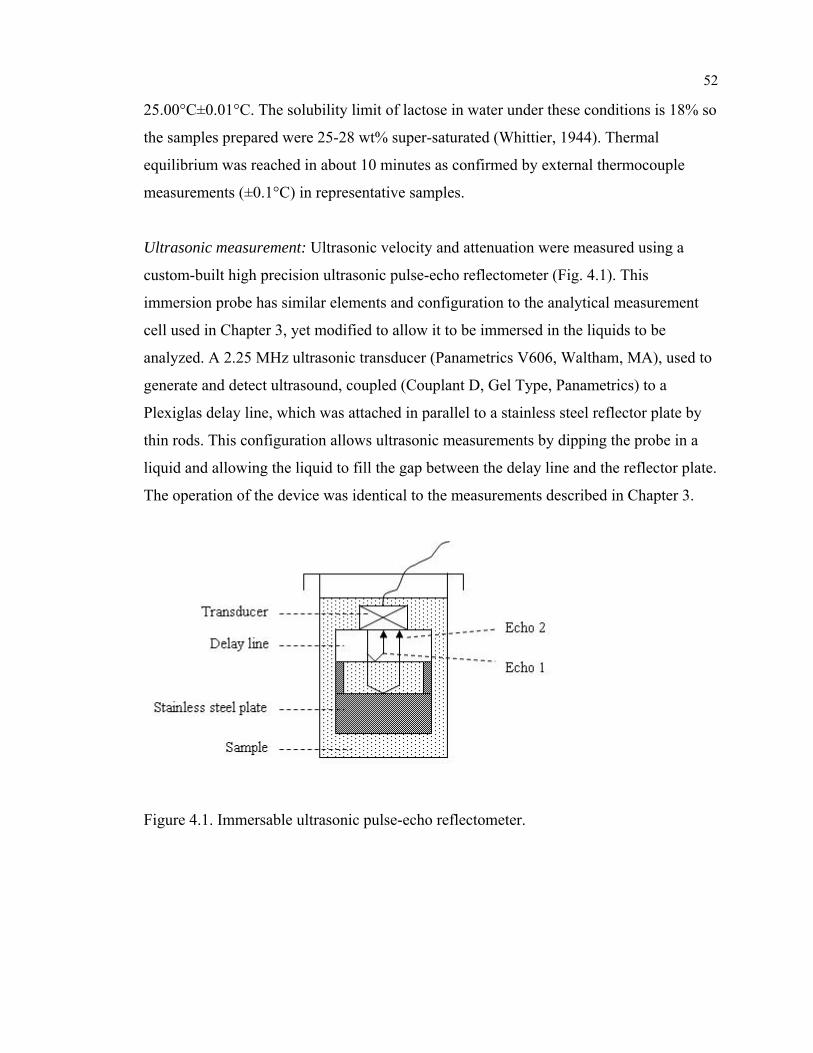
52
25.00°C±0.01°C. The solubility limit of lactose in water under these conditions is 18% so
the samples prepared were 25-28 wt% super-saturated (Whittier, 1944). Thermal
equilibrium was reached in about 10 minutes as confirmed by external thermocouple
measurements (±0.1°C) in representative samples.
Ultrasonic measurement: Ultrasonic velocity and attenuation were measured using a
custom-built high precision ultrasonic pulse-echo reflectometer (Fig. 4.1). This
immersion probe has similar elements and configuration to the analytical measurement
cell used in Chapter 3, yet modified to allow it to be immersed in the liquids to be
analyzed. A 2.25 MHz ultrasonic transducer (Panametrics V606, Waltham, MA), used to
generate and detect ultrasound, coupled (Couplant D, Gel Type, Panametrics) to a
Plexiglas delay line, which was attached in parallel to a stainless steel reflector plate by
thin rods. This configuration allows ultrasonic measurements by dipping the probe in a
liquid and allowing the liquid to fill the gap between the delay line and the reflector plate.
The operation of the device was identical to the measurements described in Chapter 3.
Figure 4.1. Immersable ultrasonic pulse-echo reflectometer.
53
Turbidity measurements: The crystallization kinetics was monitored by turbidity
measurements (Spectronic 20 Genesys spectrophotometer, Spectronic Instruments Inc.,
NY). The cuvettes containing crystallizing solution were removed from the water bath at
intervals and turbidity was monitored at 500 nm as compared to a gelatin blank.
Isothermal DSC: Heat is released during crystallization and can be measured by sensitive
isothermal calorimetry. Samples (0.513 mL) were loaded into a microcalorimeter (VP-
DSC, Northampton, MA) thermostated at 25°C. As soon as the equilibrium temperature
was reached, the heat flux data was recorded with respect to that for the reference
chamber filled with water. The effect of thermal changes in the gelatin component was
minimized by subtracting a similar curve generated with a gelatin solution from the
sample data prior to further analysis. In order to calculate the enthalpy of crystallization,
DSC analysis requires the construction of an appropriate baseline. The baseline
(Appendix B.2) was drawn as a straight line from the beginning of exothermic change
(i.e., a negative change in the heat flow) to the final plateau indicating the end of
crystallization yielding a single exothermic peak. The area under the isothermal DSC
peak is due to the enthalpy released on lactose crystallization and the fraction of the total
area released at any time was taken as the proportion of the lactose crystallizaed at that
time (Foubert et al., 2003):
Crystal characterization: After 24 h, samples were removed for analysis of the crystals
present. A small portion of the sample was gently pressed onto to a glass microscope
slide, covered with a glass cover slip and sealed with a high viscosity immersion oil to
prevent evaporation during analysis. An optical microscope (Olympus BX-41, Hitech
Instruments, Edgemont, PA; 20X) equipped with a SPOT Insight QE camera (SPOT
Diagnostic Instruments, Sterling Heights, MI) was used at 4X and 20X magnifications to
visualize the crystals. Other samples were crushed using a ceramic mortar and pestle, and
then spread onto a glass sample holder, sealed with thin Kapton film to prevent
evaporation and characterized by X-ray diffraction (Rigaku MiniFlex II, Rigaku
Americas Corp., The Woodlands, TX. Anode current 30 mA accelerating voltage 30 kV,
scanning from 2θ=5° to 40° with a step size of 0.02° using CuKα radiation).
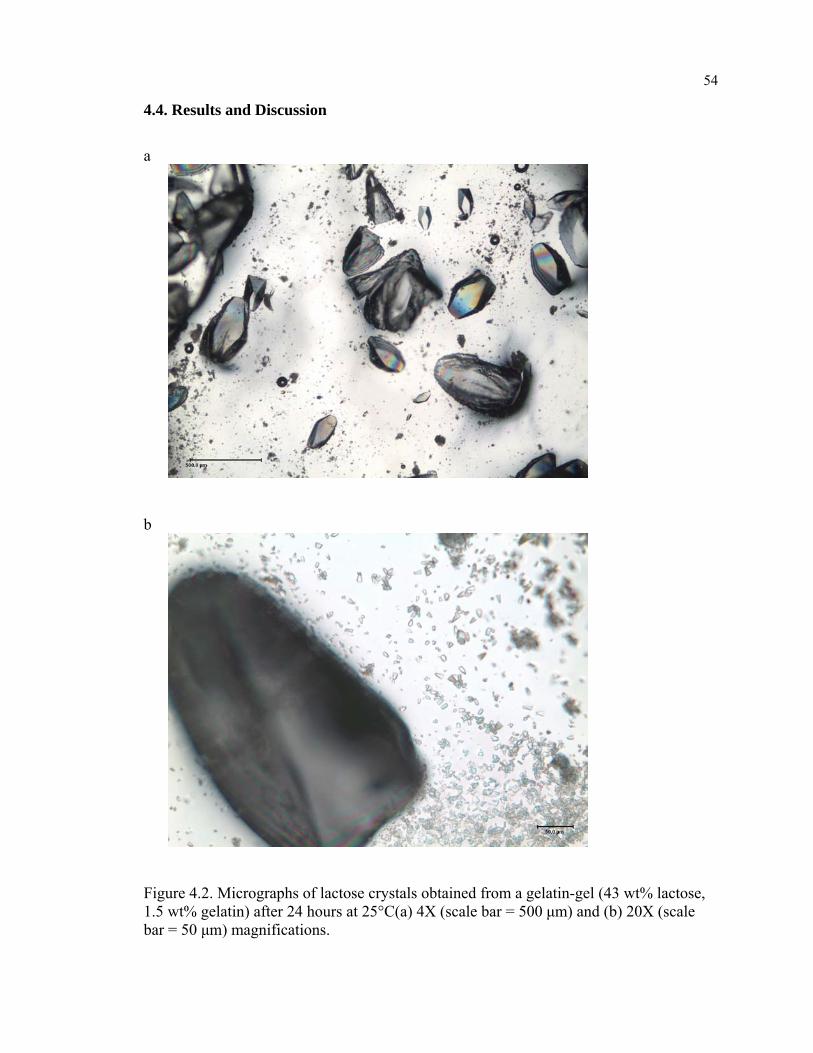
54
4.4. Results and Discussion
a
b
Figure 4.2. Micrographs of lactose crystals obtained from a gelatin-gel (43 wt% lactose, 1.5 wt% gelatin) after 24 hours at 25°C(a) 4X (scale bar = 500 μm) and (b) 20X (scale bar = 50 μm) magnifications.
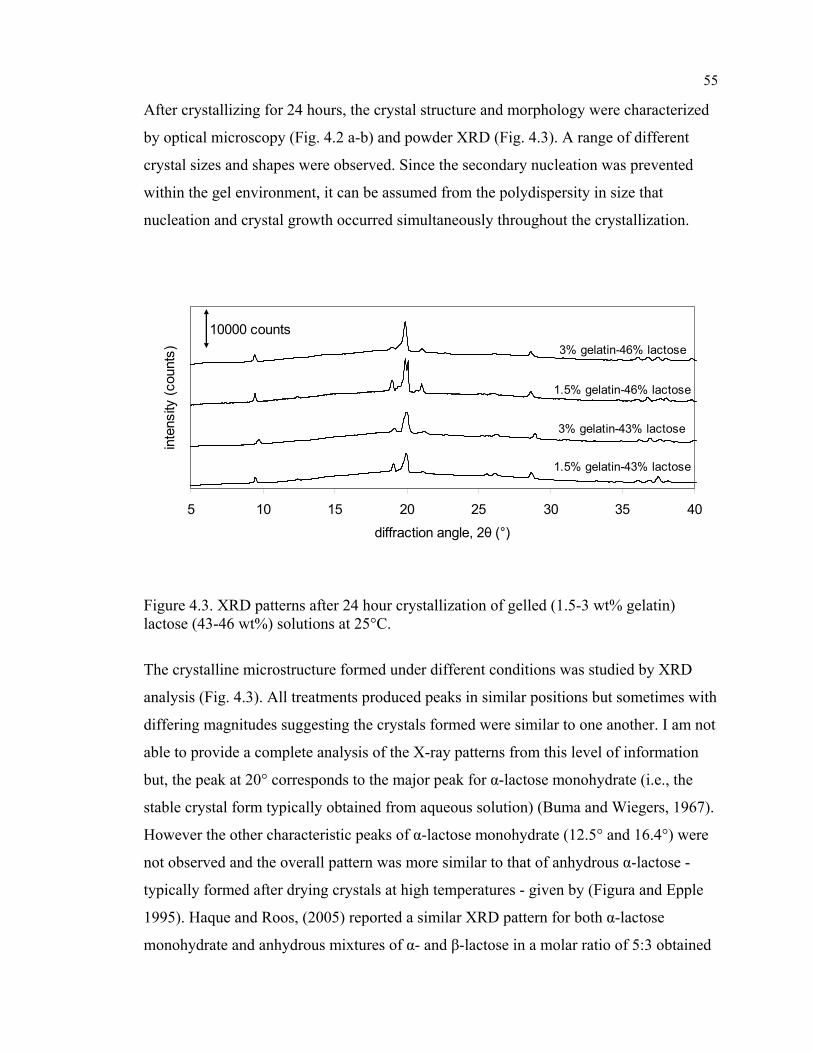
55
After crystallizing for 24 hours, the crystal structure and morphology were characterized
by optical microscopy (Fig. 4.2 a-b) and powder XRD (Fig. 4.3). A range of different
crystal sizes and shapes were observed. Since the secondary nucleation was prevented
within the gel environment, it can be assumed from the polydispersity in size that
nucleation and crystal growth occurred simultaneously throughout the crystallization.
Figure 4.3. XRD patterns after 24 hour crystallization of gelled (1.5-3 wt% gelatin) lactose (43-46 wt%) solutions at 25°C.
The crystalline microstructure formed under different conditions was studied by XRD
analysis (Fig. 4.3). All treatments produced peaks in similar positions but sometimes with
differing magnitudes suggesting the crystals formed were similar to one another. I am not
able to provide a complete analysis of the X-ray patterns from this level of information
but, the peak at 20° corresponds to the major peak for α-lactose monohydrate (i.e., the
stable crystal form typically obtained from aqueous solution) (Buma and Wiegers, 1967).
However the other characteristic peaks of α-lactose monohydrate (12.5° and 16.4°) were
not observed and the overall pattern was more similar to that of anhydrous α-lactose -
typically formed after drying crystals at high temperatures - given by (Figura and Epple
1995). Haque and Roos, (2005) reported a similar XRD pattern for both α-lactose
monohydrate and anhydrous mixtures of α- and β-lactose in a molar ratio of 5:3 obtained
5 10 15 20 25 30 35 40
diffraction angle, 2θ (°)
inte
nsity
(cou
nts)
10000 counts
1.5% gelatin-43% lactose
3% gelatin-43% lactose
3% gelatin-46% lactose
1.5% gelatin-46% lactose
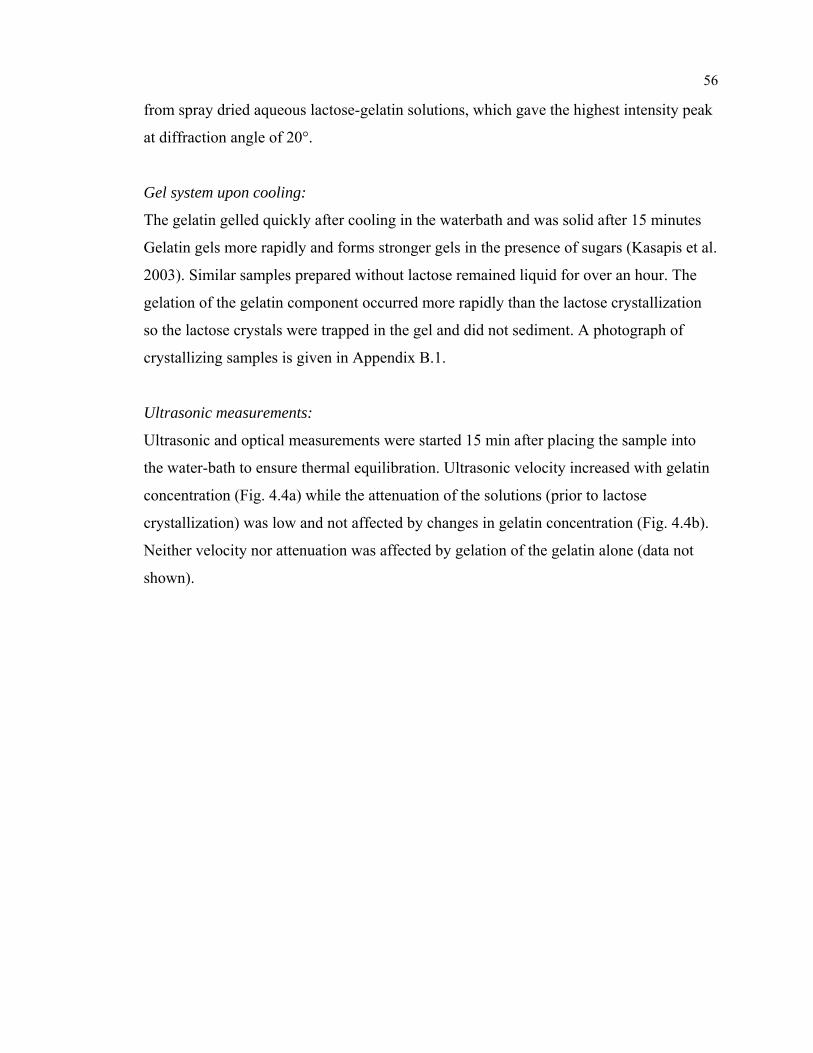
56
from spray dried aqueous lactose-gelatin solutions, which gave the highest intensity peak
at diffraction angle of 20°.
Gel system upon cooling:
The gelatin gelled quickly after cooling in the waterbath and was solid after 15 minutes
Gelatin gels more rapidly and forms stronger gels in the presence of sugars (Kasapis et al.
2003). Similar samples prepared without lactose remained liquid for over an hour. The
gelation of the gelatin component occurred more rapidly than the lactose crystallization
so the lactose crystals were trapped in the gel and did not sediment. A photograph of
crystallizing samples is given in Appendix B.1.
Ultrasonic measurements:
Ultrasonic and optical measurements were started 15 min after placing the sample into
the water-bath to ensure thermal equilibration. Ultrasonic velocity increased with gelatin
concentration (Fig. 4.4a) while the attenuation of the solutions (prior to lactose
crystallization) was low and not affected by changes in gelatin concentration (Fig. 4.4b).
Neither velocity nor attenuation was affected by gelation of the gelatin alone (data not
shown).
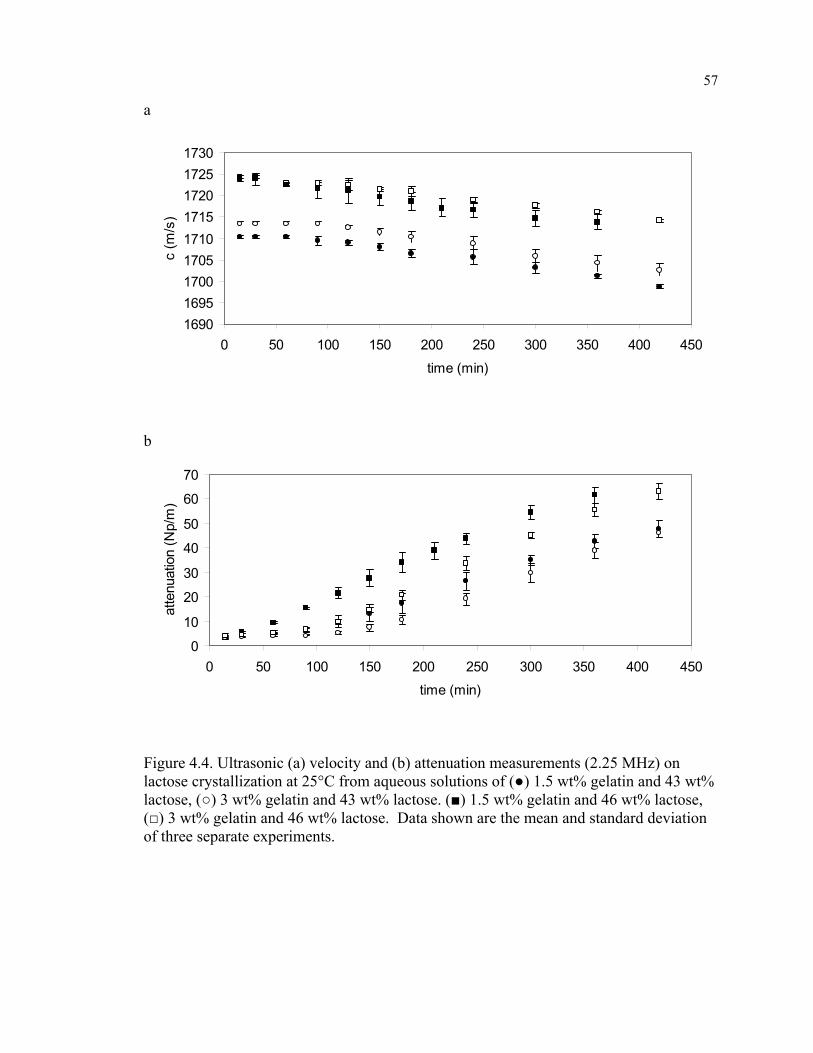
57
a
169016951700170517101715172017251730
0 50 100 150 200 250 300 350 400 450
time (min)
c (m
/s)
b
0
10
20
30
40
50
60
70
0 50 100 150 200 250 300 350 400 450
time (min)
atte
nuat
ion
(Np/
m)
Figure 4.4. Ultrasonic (a) velocity and (b) attenuation measurements (2.25 MHz) on lactose crystallization at 25°C from aqueous solutions of (●) 1.5 wt% gelatin and 43 wt% lactose, (○) 3 wt% gelatin and 43 wt% lactose. (■) 1.5 wt% gelatin and 46 wt% lactose, (□) 3 wt% gelatin and 46 wt% lactose. Data shown are the mean and standard deviation of three separate experiments.
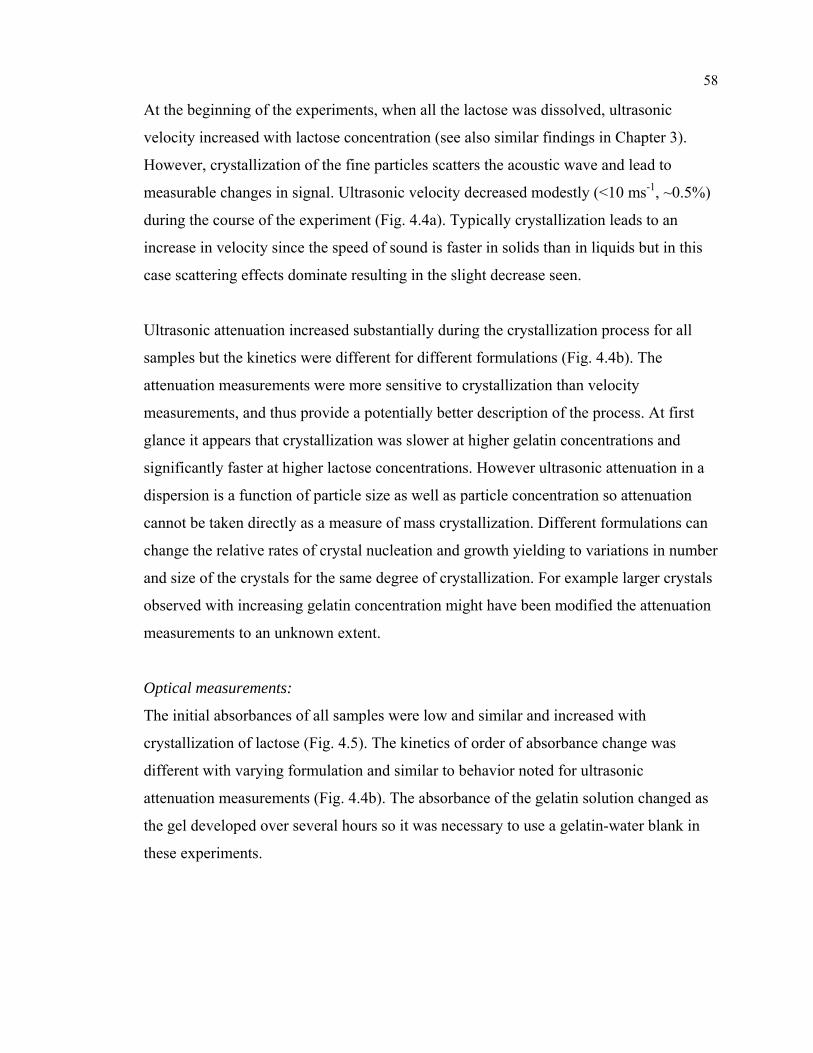
58
At the beginning of the experiments, when all the lactose was dissolved, ultrasonic
velocity increased with lactose concentration (see also similar findings in Chapter 3).
However, crystallization of the fine particles scatters the acoustic wave and lead to
measurable changes in signal. Ultrasonic velocity decreased modestly (<10 ms-1, ~0.5%)
during the course of the experiment (Fig. 4.4a). Typically crystallization leads to an
increase in velocity since the speed of sound is faster in solids than in liquids but in this
case scattering effects dominate resulting in the slight decrease seen.
Ultrasonic attenuation increased substantially during the crystallization process for all
samples but the kinetics were different for different formulations (Fig. 4.4b). The
attenuation measurements were more sensitive to crystallization than velocity
measurements, and thus provide a potentially better description of the process. At first
glance it appears that crystallization was slower at higher gelatin concentrations and
significantly faster at higher lactose concentrations. However ultrasonic attenuation in a
dispersion is a function of particle size as well as particle concentration so attenuation
cannot be taken directly as a measure of mass crystallization. Different formulations can
change the relative rates of crystal nucleation and growth yielding to variations in number
and size of the crystals for the same degree of crystallization. For example larger crystals
observed with increasing gelatin concentration might have been modified the attenuation
measurements to an unknown extent.
Optical measurements:
The initial absorbances of all samples were low and similar and increased with
crystallization of lactose (Fig. 4.5). The kinetics of order of absorbance change was
different with varying formulation and similar to behavior noted for ultrasonic
attenuation measurements (Fig. 4.4b). The absorbance of the gelatin solution changed as
the gel developed over several hours so it was necessary to use a gelatin-water blank in
these experiments.
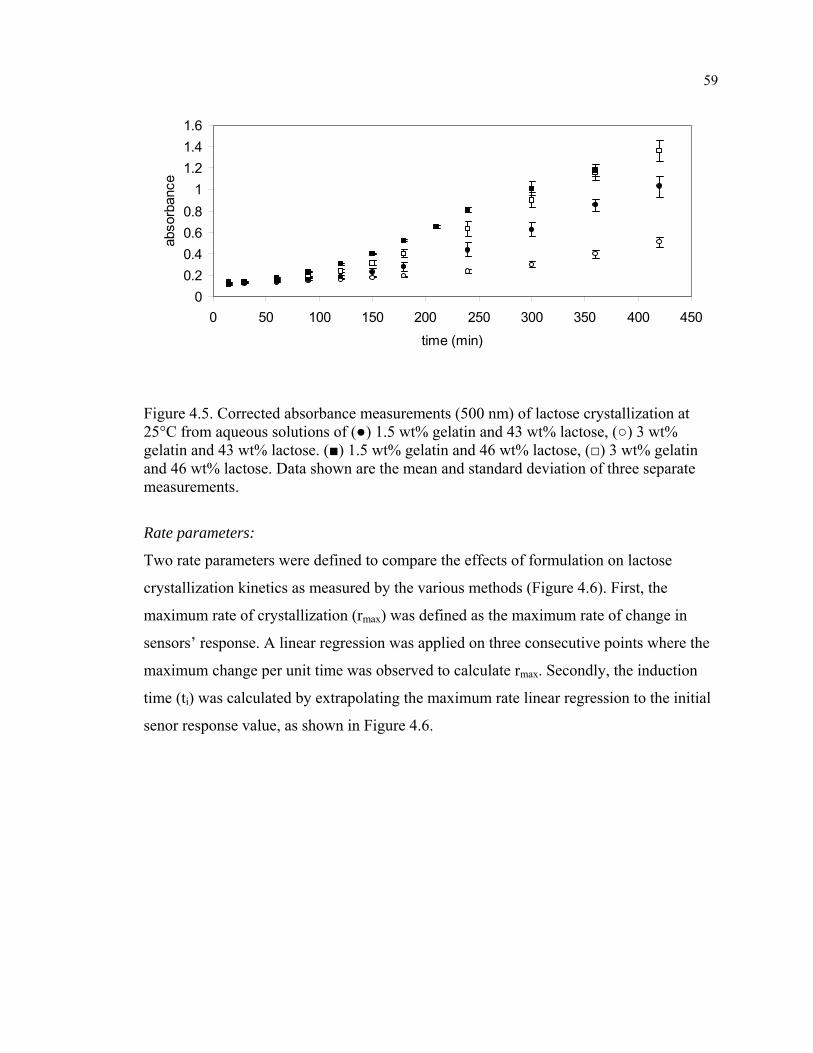
59
00.20.40.60.8
11.21.41.6
0 50 100 150 200 250 300 350 400 450
time (min)
abso
rban
ce
Figure 4.5. Corrected absorbance measurements (500 nm) of lactose crystallization at 25°C from aqueous solutions of (●) 1.5 wt% gelatin and 43 wt% lactose, (○) 3 wt% gelatin and 43 wt% lactose. (■) 1.5 wt% gelatin and 46 wt% lactose, (□) 3 wt% gelatin and 46 wt% lactose. Data shown are the mean and standard deviation of three separate measurements.
Rate parameters:
Two rate parameters were defined to compare the effects of formulation on lactose
crystallization kinetics as measured by the various methods (Figure 4.6). First, the
maximum rate of crystallization (rmax) was defined as the maximum rate of change in
sensors’ response. A linear regression was applied on three consecutive points where the
maximum change per unit time was observed to calculate rmax. Secondly, the induction
time (ti) was calculated by extrapolating the maximum rate linear regression to the initial
senor response value, as shown in Figure 4.6.
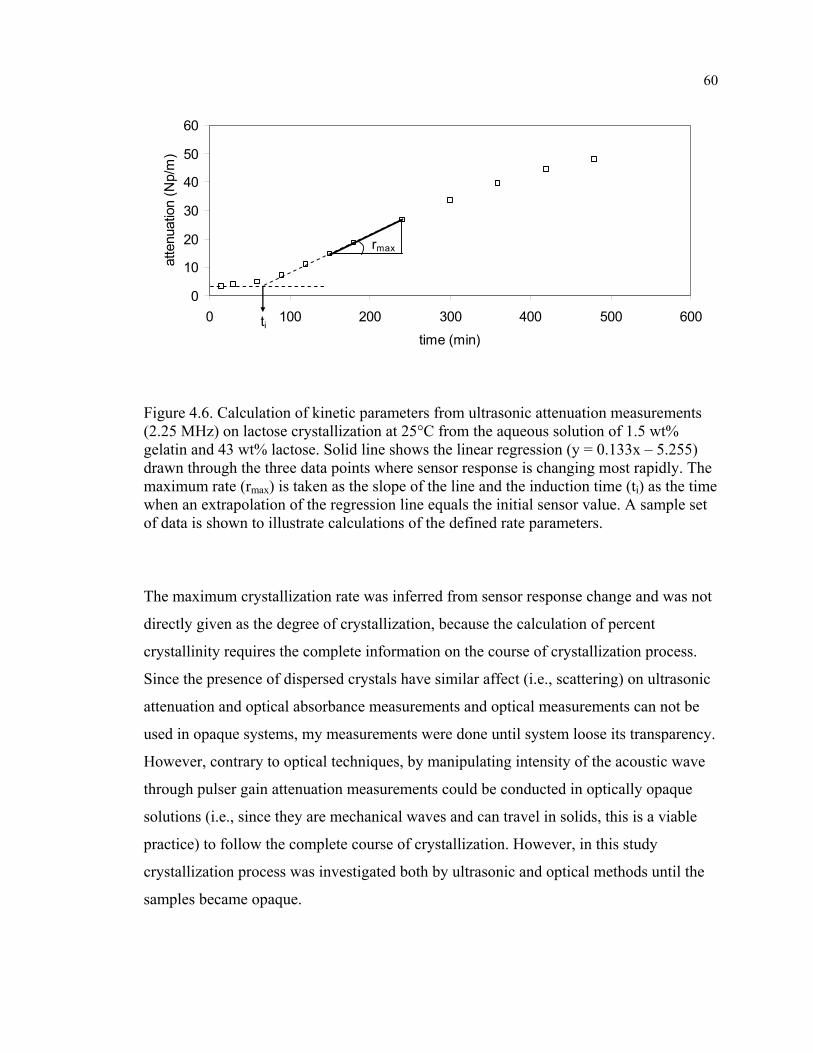
60
0
10
20
30
40
50
60
0 100 200 300 400 500 600time (min)
atte
nuat
ion
(Np/
m)
rmax
ti
Figure 4.6. Calculation of kinetic parameters from ultrasonic attenuation measurements (2.25 MHz) on lactose crystallization at 25°C from the aqueous solution of 1.5 wt% gelatin and 43 wt% lactose. Solid line shows the linear regression (y = 0.133x – 5.255) drawn through the three data points where sensor response is changing most rapidly. The maximum rate (rmax) is taken as the slope of the line and the induction time (ti) as the time when an extrapolation of the regression line equals the initial sensor value. A sample set of data is shown to illustrate calculations of the defined rate parameters.
The maximum crystallization rate was inferred from sensor response change and was not
directly given as the degree of crystallization, because the calculation of percent
crystallinity requires the complete information on the course of crystallization process.
Since the presence of dispersed crystals have similar affect (i.e., scattering) on ultrasonic
attenuation and optical absorbance measurements and optical measurements can not be
used in opaque systems, my measurements were done until system loose its transparency.
However, contrary to optical techniques, by manipulating intensity of the acoustic wave
through pulser gain attenuation measurements could be conducted in optically opaque
solutions (i.e., since they are mechanical waves and can travel in solids, this is a viable
practice) to follow the complete course of crystallization. However, in this study
crystallization process was investigated both by ultrasonic and optical methods until the
samples became opaque.
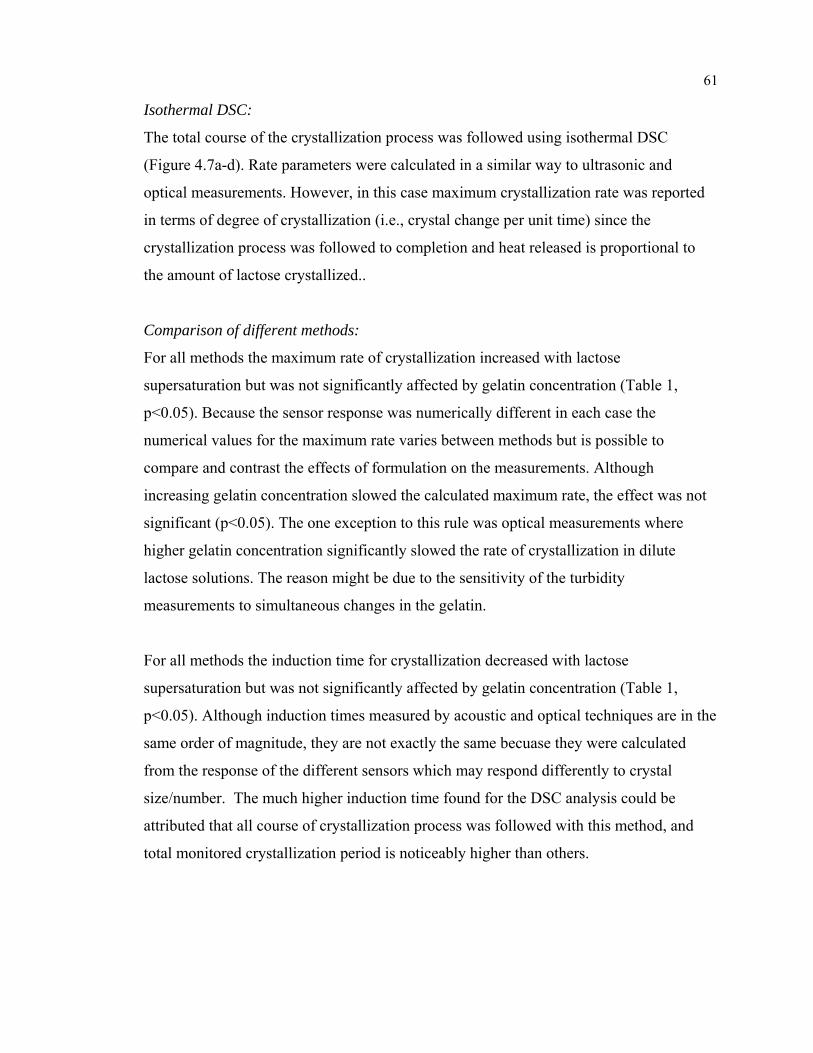
61
Isothermal DSC:
The total course of the crystallization process was followed using isothermal DSC
(Figure 4.7a-d). Rate parameters were calculated in a similar way to ultrasonic and
optical measurements. However, in this case maximum crystallization rate was reported
in terms of degree of crystallization (i.e., crystal change per unit time) since the
crystallization process was followed to completion and heat released is proportional to
the amount of lactose crystallized..
Comparison of different methods:
For all methods the maximum rate of crystallization increased with lactose
supersaturation but was not significantly affected by gelatin concentration (Table 1,
p<0.05). Because the sensor response was numerically different in each case the
numerical values for the maximum rate varies between methods but is possible to
compare and contrast the effects of formulation on the measurements. Although
increasing gelatin concentration slowed the calculated maximum rate, the effect was not
significant (p<0.05). The one exception to this rule was optical measurements where
higher gelatin concentration significantly slowed the rate of crystallization in dilute
lactose solutions. The reason might be due to the sensitivity of the turbidity
measurements to simultaneous changes in the gelatin.
For all methods the induction time for crystallization decreased with lactose
supersaturation but was not significantly affected by gelatin concentration (Table 1,
p<0.05). Although induction times measured by acoustic and optical techniques are in the
same order of magnitude, they are not exactly the same becuase they were calculated
from the response of the different sensors which may respond differently to crystal
size/number. The much higher induction time found for the DSC analysis could be
attributed that all course of crystallization process was followed with this method, and
total monitored crystallization period is noticeably higher than others.
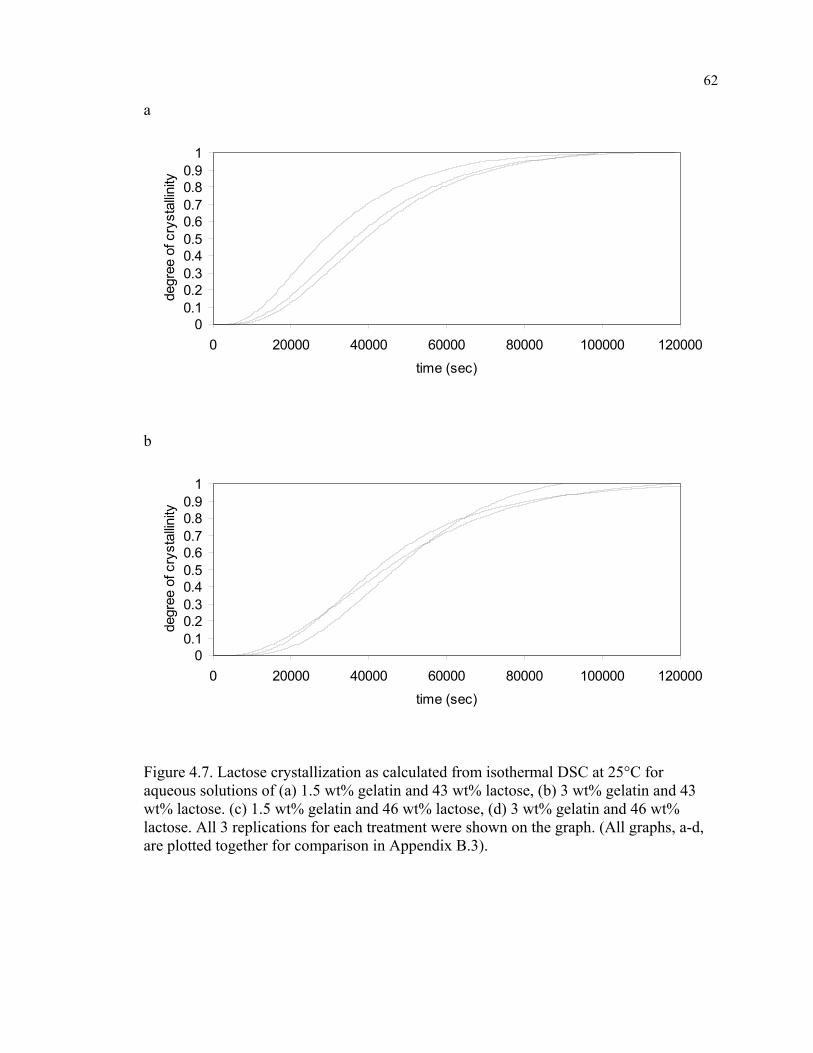
62
a
00.10.20.30.40.50.60.70.80.9
1
0 20000 40000 60000 80000 100000 120000
time (sec)
degr
ee o
f cry
stal
linity
b
00.10.20.30.40.50.60.70.80.9
1
0 20000 40000 60000 80000 100000 120000
time (sec)
degr
ee o
f cry
stal
linity
Figure 4.7. Lactose crystallization as calculated from isothermal DSC at 25°C for aqueous solutions of (a) 1.5 wt% gelatin and 43 wt% lactose, (b) 3 wt% gelatin and 43 wt% lactose. (c) 1.5 wt% gelatin and 46 wt% lactose, (d) 3 wt% gelatin and 46 wt% lactose. All 3 replications for each treatment were shown on the graph. (All graphs, a-d, are plotted together for comparison in Appendix B.3).
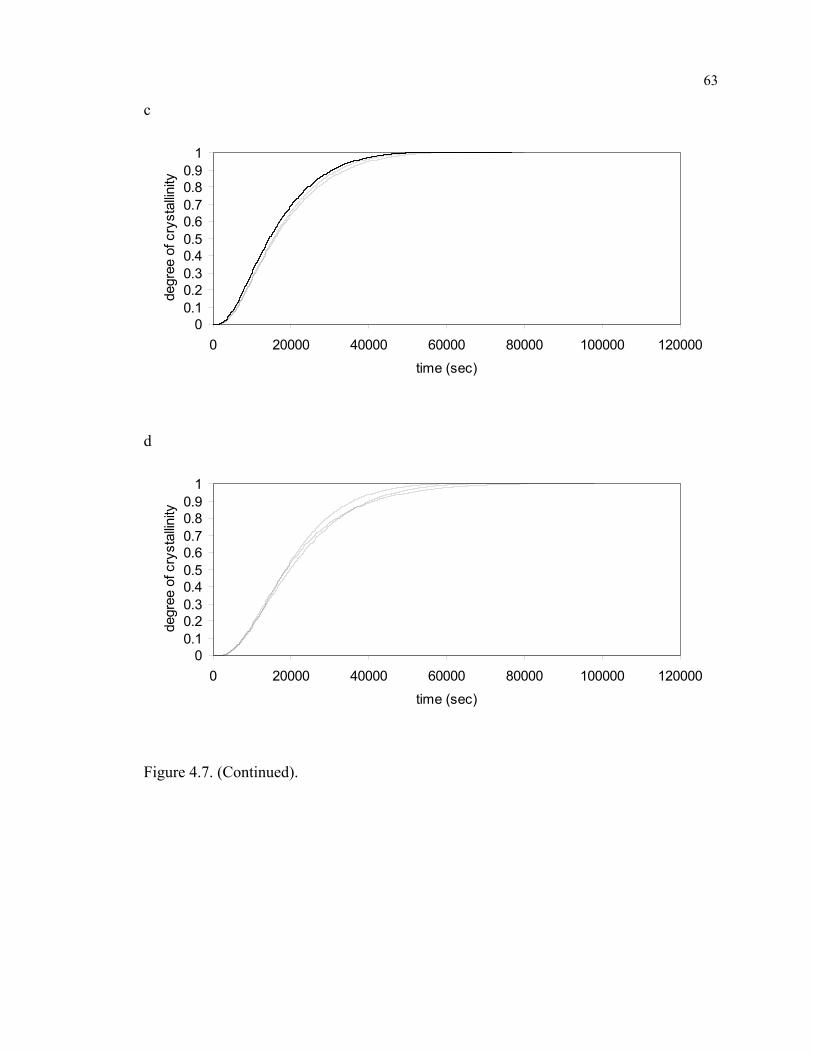
63
c
00.10.20.30.40.50.60.70.80.9
1
0 20000 40000 60000 80000 100000 120000
time (sec)
degr
ee o
f cry
stal
linity
d
00.10.20.30.40.50.60.70.80.9
1
0 20000 40000 60000 80000 100000 120000
time (sec)
degr
ee o
f cry
stal
linity
Figure 4.7. (Continued).
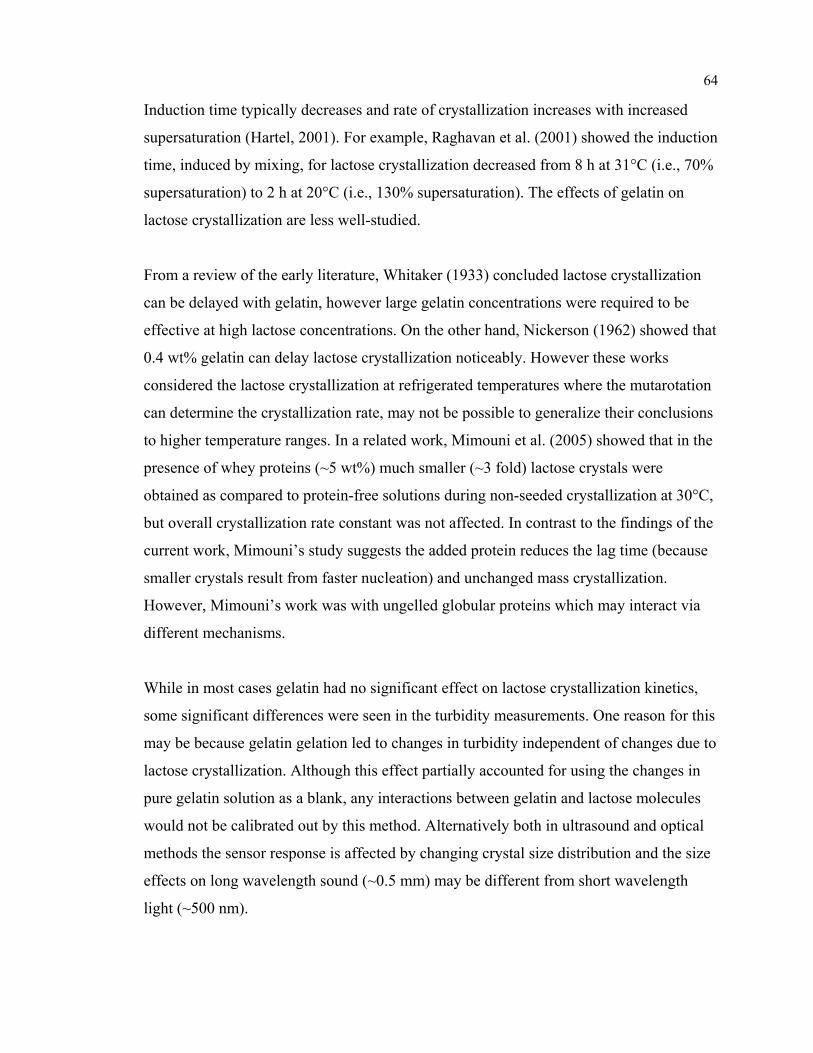
64
Induction time typically decreases and rate of crystallization increases with increased
supersaturation (Hartel, 2001). For example, Raghavan et al. (2001) showed the induction
time, induced by mixing, for lactose crystallization decreased from 8 h at 31°C (i.e., 70%
supersaturation) to 2 h at 20°C (i.e., 130% supersaturation). The effects of gelatin on
lactose crystallization are less well-studied.
From a review of the early literature, Whitaker (1933) concluded lactose crystallization
can be delayed with gelatin, however large gelatin concentrations were required to be
effective at high lactose concentrations. On the other hand, Nickerson (1962) showed that
0.4 wt% gelatin can delay lactose crystallization noticeably. However these works
considered the lactose crystallization at refrigerated temperatures where the mutarotation
can determine the crystallization rate, may not be possible to generalize their conclusions
to higher temperature ranges. In a related work, Mimouni et al. (2005) showed that in the
presence of whey proteins (~5 wt%) much smaller (~3 fold) lactose crystals were
obtained as compared to protein-free solutions during non-seeded crystallization at 30°C,
but overall crystallization rate constant was not affected. In contrast to the findings of the
current work, Mimouni’s study suggests the added protein reduces the lag time (because
smaller crystals result from faster nucleation) and unchanged mass crystallization.
However, Mimouni’s work was with ungelled globular proteins which may interact via
different mechanisms.
While in most cases gelatin had no significant effect on lactose crystallization kinetics,
some significant differences were seen in the turbidity measurements. One reason for this
may be because gelatin gelation led to changes in turbidity independent of changes due to
lactose crystallization. Although this effect partially accounted for using the changes in
pure gelatin solution as a blank, any interactions between gelatin and lactose molecules
would not be calibrated out by this method. Alternatively both in ultrasound and optical
methods the sensor response is affected by changing crystal size distribution and the size
effects on long wavelength sound (~0.5 mm) may be different from short wavelength
light (~500 nm).
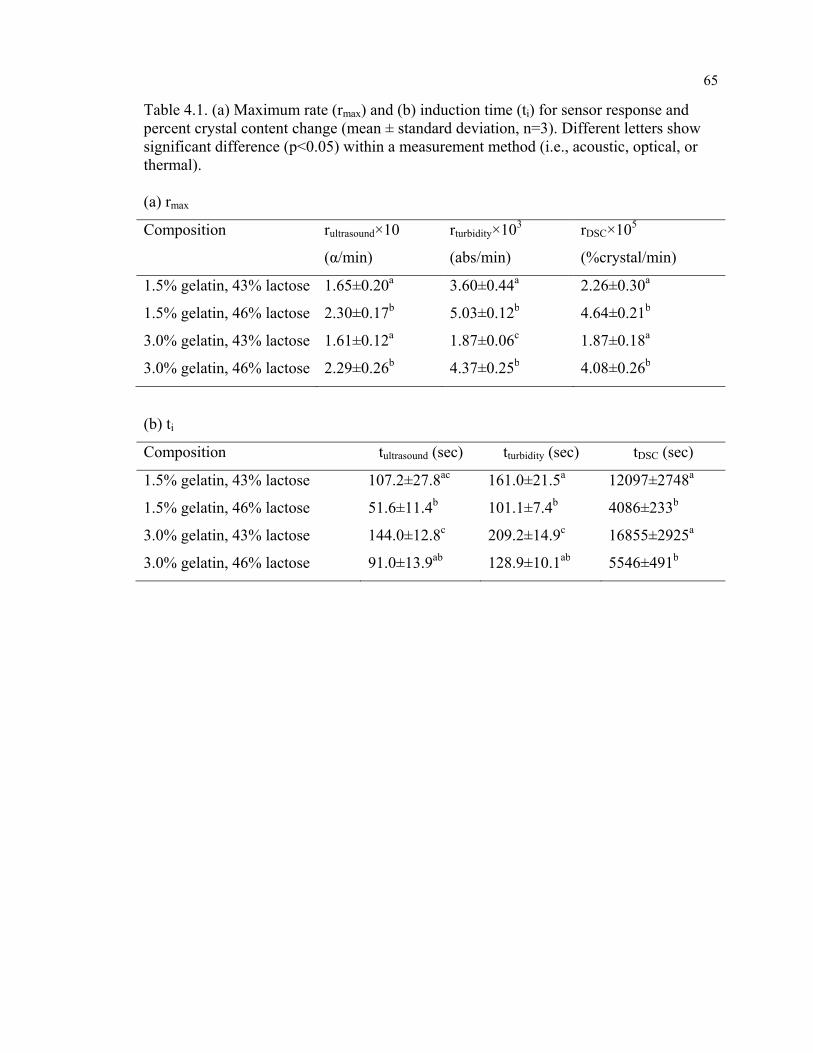
65
Table 4.1. (a) Maximum rate (rmax) and (b) induction time (ti) for sensor response and percent crystal content change (mean ± standard deviation, n=3). Different letters show significant difference (p<0.05) within a measurement method (i.e., acoustic, optical, or thermal). (a) rmax
Composition rultrasound×10
(α/min)
rturbidity×103
(abs/min)
rDSC×105
(%crystal/min)
1.5% gelatin, 43% lactose 1.65±0.20a 3.60±0.44a 2.26±0.30a
1.5% gelatin, 46% lactose 2.30±0.17b 5.03±0.12b 4.64±0.21b
3.0% gelatin, 43% lactose 1.61±0.12a 1.87±0.06c 1.87±0.18a
3.0% gelatin, 46% lactose 2.29±0.26b 4.37±0.25b 4.08±0.26b
(b) ti
Composition tultrasound (sec) tturbidity (sec) tDSC (sec)
1.5% gelatin, 43% lactose 107.2±27.8ac 161.0±21.5a 12097±2748a
1.5% gelatin, 46% lactose 51.6±11.4b 101.1±7.4b 4086±233b
3.0% gelatin, 43% lactose 144.0±12.8c 209.2±14.9c 16855±2925a
3.0% gelatin, 46% lactose 91.0±13.9ab 128.9±10.1ab 5546±491b
66
4.5. Conclusions
In this study, the applicability of in-situ ultrasonic measurements (2.25 MHz center
frequency) to follow bulk crystallization of lactose (43-46 wt%) from gelatin gels (1.5-3
wt%) were investigated, and compared to turbidity (500 nm) and isothermal DSC
measurements. Ultrasonic attenuation was found to be more sensitive to crystallization
than ultrasonic velocity measurements. All measurement methods showed similar trends
on lactose crystallization with changing formulation. In general, the rate of crystallization
increased and induction time decreased with increasing super-saturation, and changing
gelatin concentration did not show significant difference on kinetic parameters. Although
the principles of both ultrasonic attenuation and optical absorbance measurements of
crystal concentration in a dispersion are identical (i.e., both methods rely on the scattering
of harmonic waves), ultrasonic measurements are preferred since they can be applied for
opaque systems. Moreover, since ultrasonic measurements on crystal dispersions are
strongly affected from changes in crystal size, spectral measurements can provide further
information about crystal size as well as concentration.
67
Chapter 5
ULTRASONIC CHARACTERIZATION OF DISPERSIONS OF SUGAR
IN VEGETABLE OIL
5.1. Abstract
Fine sugar crystals were dispersed into vegetable oil (8-16 wt%) in a stirred tank. The
dispersed crystals were agglomerated by the addition of small volumes of water (<1%)
and finally allowed to sediment quiescently. The process was monitored by continuous
ultrasonic attenuation measurements.
Ultrasonic attenuation increased with increasing sucrose crystal concentration and degree
of agglomeration. The agglomeration process was also found to be inhomogeneous as
inferred from sedimentation kinetics and confirmed by micrometer measurements of
crystal agglomerates. In conclusion, ultrasonic attenuation measurements can be used as a
monitoring method to follow dispersing processes in food manufacturing, such as
chocolate conching or flavor slurry preparation.
68
5.2. Introduction
Several food processing operations involve dispersing powders in liquids. During the
mixing process, powder agglomerates are broken up and the viscosity of the suspension
decreases. For example in chocolate conching, a long mixing process at elevated
temperatures is necessary to disperse sugar, cocoa solids, and milk powder in liquid
cocoa butter and convert the product from a paste to a smooth liquid (Beckett, 2009).
Particle dispersion involves three steps: wetting the surface with liquid (e.g., oil in
conching) and displacing air, deagglomerating the wetted clumps, and finally maintaining
particle separation and preventing sedimentation. Clearly, the strength and nature of the
interparticle forces will determine the efficiency and effectiveness of the process. When
hydrophilic particles are dispersed in a non-polar liquid any small amount of water
present will adsorb at the particle surfaces and hold the powder in clumps by forming
water bridges, i.e., strong capillary forces (Johansson and Bergenstahl, 1992a). This is
particularly important in chocolate conching when a small amount for water can rapidly
agglomerate the sucrose particles and increase the suspension viscosity. For example,
Chevalley (1999) showed that the presence of 3-4% water increases the viscosity of
molten chocolate markedly as compared to the typical moisture concentrations of 0.5-
1.5%. Emulsifiers can assist the dispersion of fine particles by adsorbing at the surface
and providing some steric repulsion (Johansson and Bergenstahl, 1992b).
The degree of agglomeration can be followed by measuring the particle size of the
particles directly or inferred from apparent viscosity measurements (Beckett, 2001, 2009)
or from sedimentation measurements (Johansson and Bergenstahl, 1992b). For studies of
agglomerates formed by weak adhesion, sedimentation experiments are more suitable
than rheological measurements as the forces applied to the aggregate during measurement
are less (Johansson and Bergenstahl, 1995). Sediments formed from non-agglomerated
particles tend to be more dense than sediments formed from agglomerated particles
(Mongia and Ziegler, 2000). Moreover, sediment volumes of dispersions of sugar in oil
69
increased 50% with an increase in water concentration from 0 to 1%, (Johansson and
Bergenstahl, 1992c).
Dispersions of crystals at concentrations and sizes commonly used in industry are often
opaque, and so optical methods are unsuitable to study aggregation directly. However,
ultrasound propagates well through most fluids and can be used to characterize
dispersions. Acoustic waves move as a series of compressions and rarefactions in the
material they are passing through. Wave propagation depends on the thermal and
physical properties, such as density and elasticity, of the media so measurement of
acoustic properties is related to material properties. Ultrasound is high frequency (i.e.,
>18 kHz) sound that at low power levels is non destructive and useful for sensing
applications. Ultrasonic velocity and attenuation (i.e., the logarithmic loss of the wave
energy with distance) can both be measured (Chanamai et al., 1998). However,
attenuation measurements are often preferred for dispersion characterization, as it is less
affected by small temperature changes (Povey, 1997).
Ultrasonic attenuation measurements have been used to measure the concentration
(Bamberger and Greenwood 2004), size (Holmes et al., 1993) and degree of
agglomeration (Bryant and McClements, 1999) of fine particle suspensions.
Sedimentation kinetics can also be followed by measuring ultrasonic properties as a
function of height and time during gravitational separation. This method has been
applied to creaming measurements in emulsions (Pinfield et al., 1994; Basaran et al.,
1998) including effects of flocculation (Chanamai et al., 2000). Previously, I
demonstrated the use of ultrasonic attenuation measurements to follow the mixing
kinetics of lactose crystals into a saturated lactose solution (Chapter 3). There was a
large increase in attenuation of the sample immediately upon addition of the powdered
lactose, which decreased during mixing to a steady state value dependent on the solids
loading.
The objective of this study is to demonstrate the use ultrasonic attenuation measurements
for on-line monitoring of mixing of sucrose crystals into oil and the agglomeration
70
process caused by the addition of water. The subsequent sedimentation kinetics
determined by the degree of agglomeration is also to be followed by measuring the
changes in ultrasonic attenuation due to composition change at a certain height. This
model system study has parallels to the processes involved in chocolate conching and to
the simpler process of favor slurry manufacture.
5.3. Materials and methods
Materials. Corn oil and confectioner’s sugar (sucrose) were bought from a local market.
Sugar was stored in a desiccator with Drierite until used. The crystals were characterized
at room temperature by optical microscopy (Olympus BX-41, Hitech Instruments,
Edgemont, PA; 20X) equipped with a SPOT Insight QE camera (SPOT Diagnostic
Instruments, Sterling Heights, MI), static light scattering (Horiba LA-920, Irvine, CA
assuming a relative refractive index of 1.12), and x-ray diffraction (Rigaku MiniFlex II,
Rigaku Americas Corp., The Woodlands, TX). Sugar crystals were dispersed in
isopropanol (≥99.5%, Sigma-Aldrich) prior to the optical analyses.
Mixing. The previously described stirred tank system fitted with ultrasonic sensors was
used for mixing and sedimentation experiments (Chapter 3). A known amount of corn oil
was introduced into the container (a cylinder with an internal diameter of 10.4 cm) and
agitated with a blade impeller (5 cm diameter and 1.3 cm width with 0.6 cm diameter
shaft) located at a position as in the middle of the total sample height and driven at 600-
650 rpm by a laboratory scale stirrer (STIR PAK laboratory stirrer, Model 4554, Cole
Parmer, Chicago, IL). Dry sugar crystals (8-16 wt%) were quickly added (i.e., in less than
30 sec) , and after the crystals were uniformly dispersed within the oil (i.e., no change in
the mean sensor response with time), water was added to induce crystal agglomeration. In
some experiments, the stirrer was stopped after the desired mixing was attained and
subsequent sedimentation kinetics were followed ultrasonically.
71
All experiments were conducted at room temperature. Sample temperature, as monitored
with a k-type thermocouple (0.1°C sensitivity), fluctuated around 22.8°C with a
maximum deviation of 0.4°C. All experiments were performed at least in triplicate.
Ultrasound. The course of mixing process was followed on-line by ultrasonic attenuation
measurements as described in detail in Chapter 3 and summarized as follows. A
controlled electrical signal was generated and collected by a square wave pulser/receiver
(Panametrics 5077 PR, Waltham, MA) and subsequently digitized by an oscilloscope
(LeCroy 9310c, Chestnut Ridge, NY). Ultrasonic transducers (2.25 MHz center
frequency) were located at 2/3rd of the total sample height from the sample surface in
through-transmission mode. Attenuation data was collected automatically by a Lab View
(version 7.1, National Instruments, Austin, TX) virtual instrument. The pulse gain was
increased 03 dB for each 2 wt% increase in sugar concentration to ensure an acquirable
acoustic signal was transmitted between the transducers. The energy of the incident pulse
at each gain was calibrated with respect to the water. However at gains higher than 00 dB
the transmitted wave energy in water was off scale for the oscilloscope, in which case
they were extrapolated from measurements at lower gain values (See Appendix C.1). The
energy loss within the sample was evaluated as a normalized power transmission loss
(NPTL, Chapter 3):
NPTL = 10 log (Iwater / Imeasured) (5.1)
where Iwater and Imeasured are the intensities measured in water and the sample, respectively.
Solid bed density and solid bed height. The packing properties of the dispersed particles
can be used as an indication of the degree of the agglomeration. After the desired mixing
was attained, dispersions were characterized by means of solid bed density (SBD) and
solid bed height measurements. Aliquots (~7 mL) of the dispersion was sampled into a 10
mL glass tube (1 cm diameter), and allowed to settle out over 48 hours. The sediment was
characterized as the ratio of sediment volume to total volume, i.e., normalized solid bed
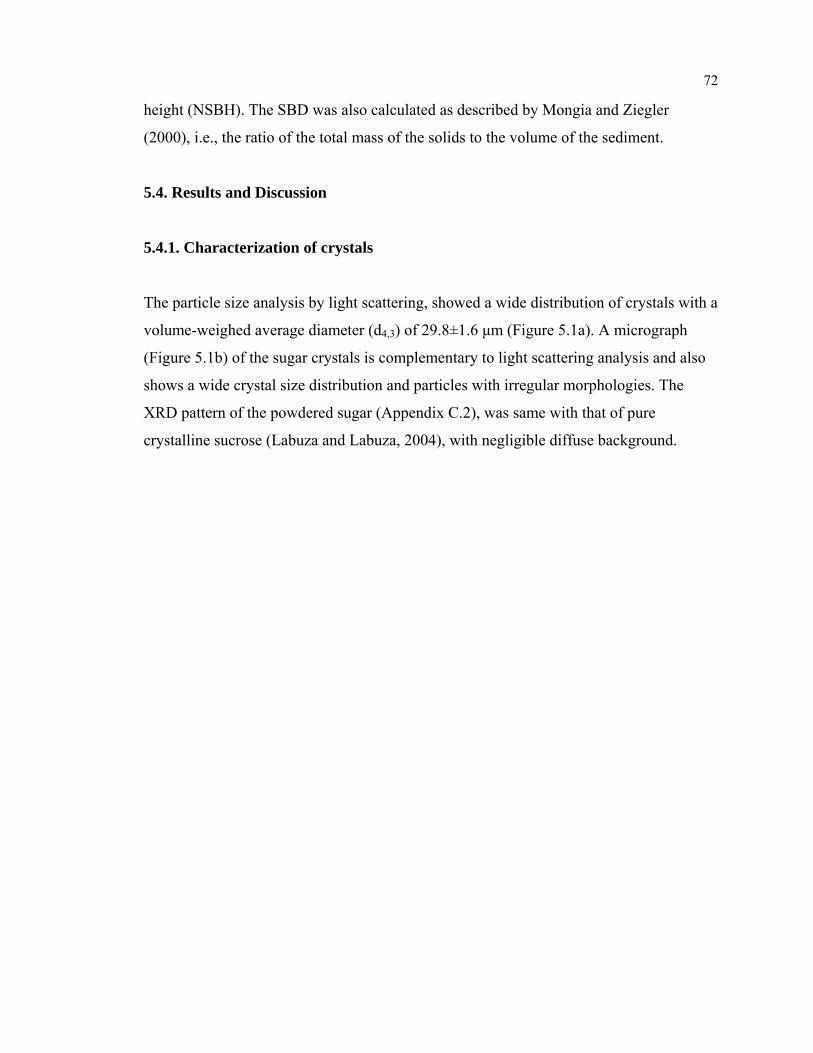
72
height (NSBH). The SBD was also calculated as described by Mongia and Ziegler
(2000), i.e., the ratio of the total mass of the solids to the volume of the sediment.
5.4. Results and Discussion
5.4.1. Characterization of crystals
The particle size analysis by light scattering, showed a wide distribution of crystals with a
volume-weighed average diameter (d4,3) of 29.8±1.6 μm (Figure 5.1a). A micrograph
(Figure 5.1b) of the sugar crystals is complementary to light scattering analysis and also
shows a wide crystal size distribution and particles with irregular morphologies. The
XRD pattern of the powdered sugar (Appendix C.2), was same with that of pure
crystalline sucrose (Labuza and Labuza, 2004), with negligible diffuse background.
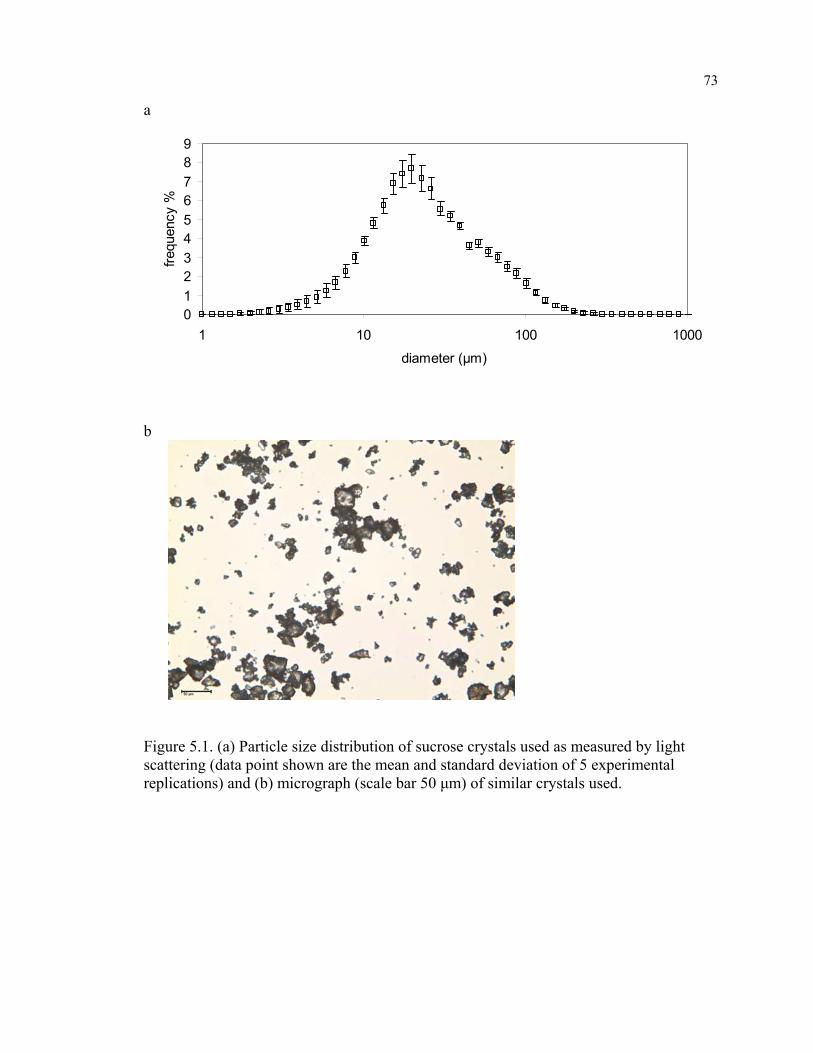
73
a
0123456789
1 10 100 1000diameter (μm)
frequ
ency
%
b
Figure 5.1. (a) Particle size distribution of sucrose crystals used as measured by light scattering (data point shown are the mean and standard deviation of 5 experimental replications) and (b) micrograph (scale bar 50 μm) of similar crystals used.
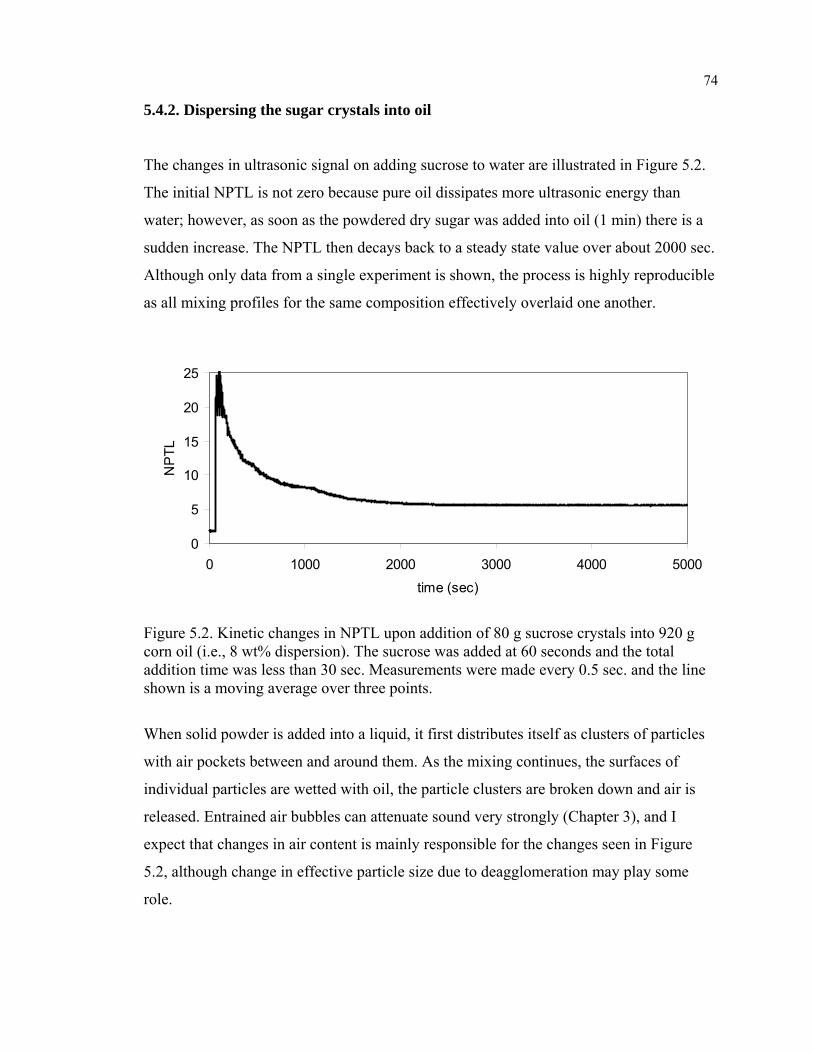
74
5.4.2. Dispersing the sugar crystals into oil
The changes in ultrasonic signal on adding sucrose to water are illustrated in Figure 5.2.
The initial NPTL is not zero because pure oil dissipates more ultrasonic energy than
water; however, as soon as the powdered dry sugar was added into oil (1 min) there is a
sudden increase. The NPTL then decays back to a steady state value over about 2000 sec.
Although only data from a single experiment is shown, the process is highly reproducible
as all mixing profiles for the same composition effectively overlaid one another.
0
5
10
15
20
25
0 1000 2000 3000 4000 5000time (sec)
NPT
L
Figure 5.2. Kinetic changes in NPTL upon addition of 80 g sucrose crystals into 920 g corn oil (i.e., 8 wt% dispersion). The sucrose was added at 60 seconds and the total addition time was less than 30 sec. Measurements were made every 0.5 sec. and the line shown is a moving average over three points.
When solid powder is added into a liquid, it first distributes itself as clusters of particles
with air pockets between and around them. As the mixing continues, the surfaces of
individual particles are wetted with oil, the particle clusters are broken down and air is
released. Entrained air bubbles can attenuate sound very strongly (Chapter 3), and I
expect that changes in air content is mainly responsible for the changes seen in Figure
5.2, although change in effective particle size due to deagglomeration may play some
role.
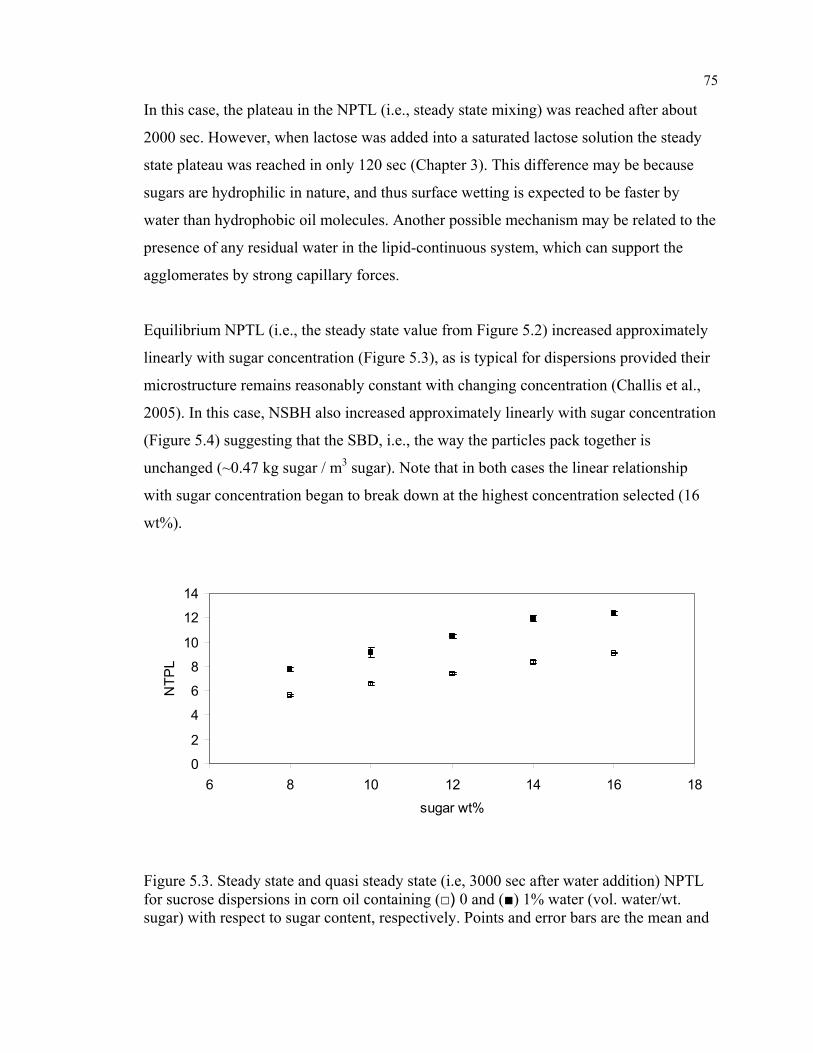
75
In this case, the plateau in the NPTL (i.e., steady state mixing) was reached after about
2000 sec. However, when lactose was added into a saturated lactose solution the steady
state plateau was reached in only 120 sec (Chapter 3). This difference may be because
sugars are hydrophilic in nature, and thus surface wetting is expected to be faster by
water than hydrophobic oil molecules. Another possible mechanism may be related to the
presence of any residual water in the lipid-continuous system, which can support the
agglomerates by strong capillary forces.
Equilibrium NPTL (i.e., the steady state value from Figure 5.2) increased approximately
linearly with sugar concentration (Figure 5.3), as is typical for dispersions provided their
microstructure remains reasonably constant with changing concentration (Challis et al.,
2005). In this case, NSBH also increased approximately linearly with sugar concentration
(Figure 5.4) suggesting that the SBD, i.e., the way the particles pack together is
unchanged (~0.47 kg sugar / m3 sugar). Note that in both cases the linear relationship
with sugar concentration began to break down at the highest concentration selected (16
wt%).
0
2
4
6
8
10
12
14
6 8 10 12 14 16 18sugar wt%
NTP
L
Figure 5.3. Steady state and quasi steady state (i.e, 3000 sec after water addition) NPTL for sucrose dispersions in corn oil containing (□) 0 and (■) 1% water (vol. water/wt. sugar) with respect to sugar content, respectively. Points and error bars are the mean and
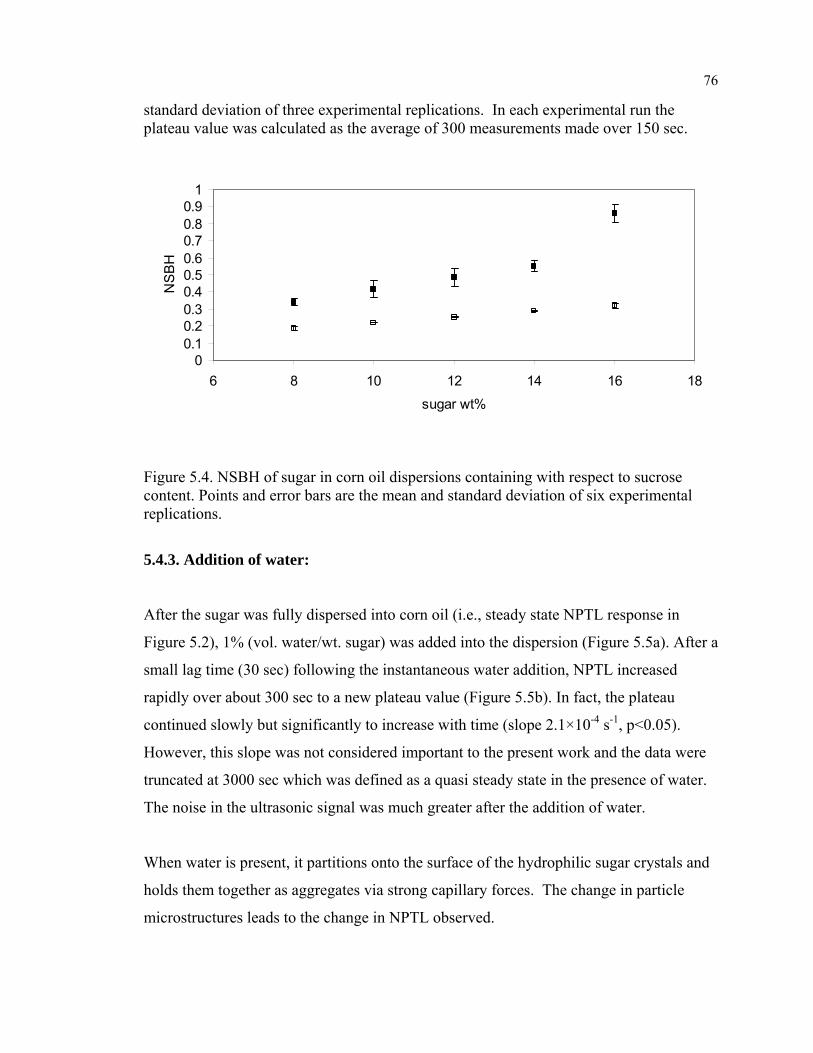
76
standard deviation of three experimental replications. In each experimental run the plateau value was calculated as the average of 300 measurements made over 150 sec.
00.10.20.30.40.50.60.70.80.9
1
6 8 10 12 14 16 18sugar wt%
NSB
H
Figure 5.4. NSBH of sugar in corn oil dispersions containing with respect to sucrose content. Points and error bars are the mean and standard deviation of six experimental replications.
5.4.3. Addition of water:
After the sugar was fully dispersed into corn oil (i.e., steady state NPTL response in
Figure 5.2), 1% (vol. water/wt. sugar) was added into the dispersion (Figure 5.5a). After a
small lag time (30 sec) following the instantaneous water addition, NPTL increased
rapidly over about 300 sec to a new plateau value (Figure 5.5b). In fact, the plateau
continued slowly but significantly to increase with time (slope 2.1×10⁻⁴ s-1, p<0.05).
However, this slope was not considered important to the present work and the data were
truncated at 3000 sec which was defined as a quasi steady state in the presence of water.
The noise in the ultrasonic signal was much greater after the addition of water.
When water is present, it partitions onto the surface of the hydrophilic sugar crystals and
holds them together as aggregates via strong capillary forces. The change in particle
microstructures leads to the change in NPTL observed.
77
Addition of water also led to an increase in the sediment volume because aggregated
particles pack together less efficiently (Appendix C.3). The SBD was about 0.25 (kg
sugar / m3 sugar) for all samples containing added water (except 16%) suggesting the
structure of the aggregates was governed by the amount of water added rather than the
amount of sucrose present (ANOVA analysis, p<0.05). However, changing the amount
of water added while holding the sucrose concentration constant led to a progressive
increase in bed height suggesting the aggregates were larger (Table 5.1). My findings are
similar to those of Johansson and Bergenstahl (1992c) who showed that the volume of a
sucrose crystals (largest particle dimension of 30 μm) sediment in refined soybean oil
increased 50% when the moisture content increased from 0 to 1%.
Both NPTL and NSBH the 16% samples did not exactly follow the linear dependence on
sucrose concentration seen with the more dilute samples. The deviation from linearity
was greater in the presence of water than in the water-free samples.
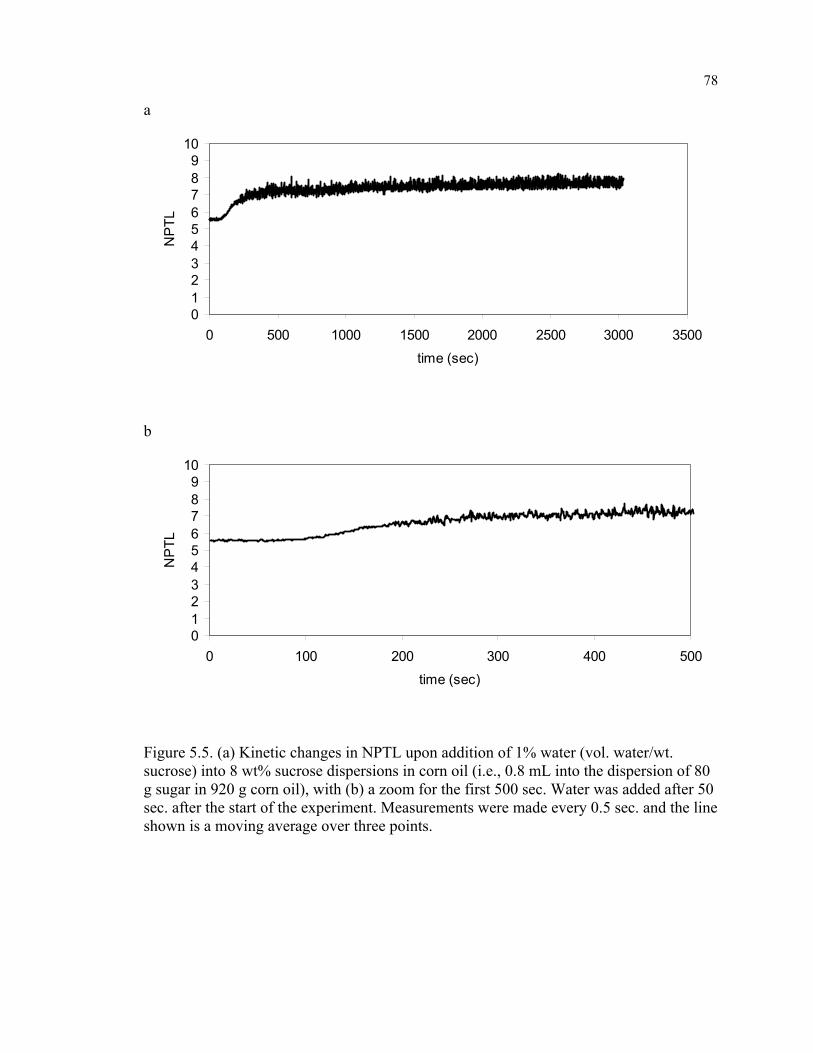
78
a
0123456789
10
0 500 1000 1500 2000 2500 3000 3500time (sec)
NPT
L
b
0123456789
10
0 100 200 300 400 500time (sec)
NPT
L
Figure 5.5. (a) Kinetic changes in NPTL upon addition of 1% water (vol. water/wt. sucrose) into 8 wt% sucrose dispersions in corn oil (i.e., 0.8 mL into the dispersion of 80 g sugar in 920 g corn oil), with (b) a zoom for the first 500 sec. Water was added after 50 sec. after the start of the experiment. Measurements were made every 0.5 sec. and the line shown is a moving average over three points.
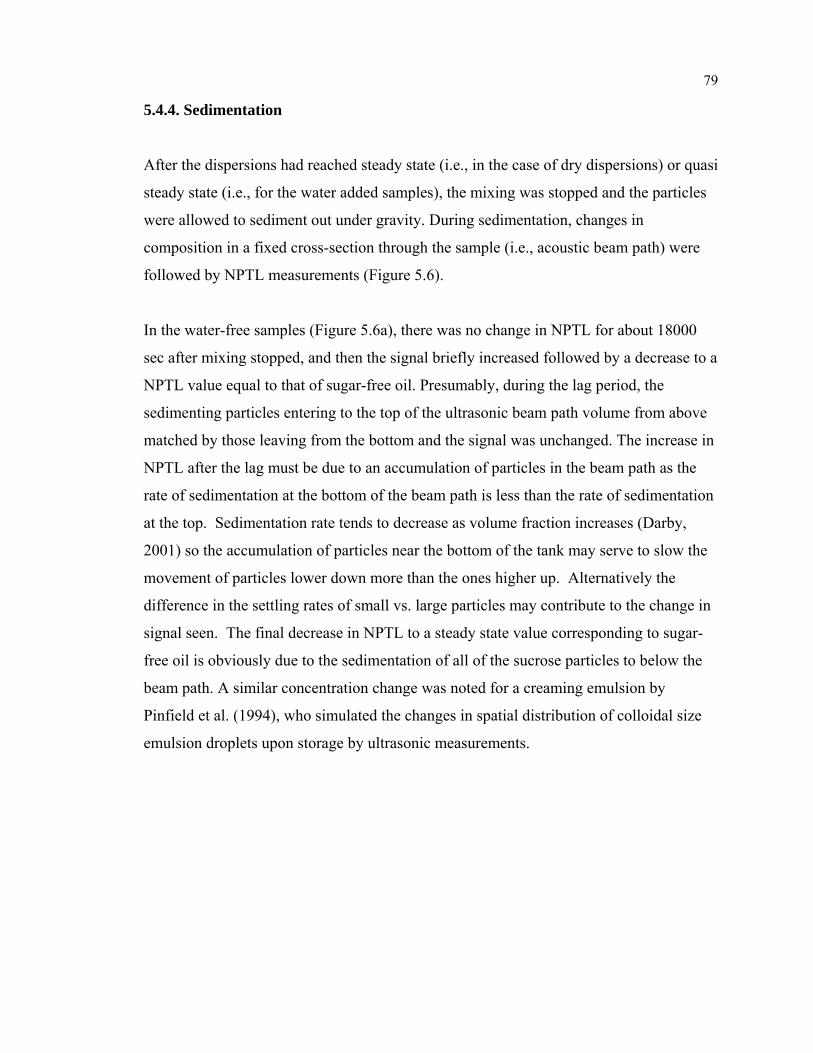
79
5.4.4. Sedimentation
After the dispersions had reached steady state (i.e., in the case of dry dispersions) or quasi
steady state (i.e., for the water added samples), the mixing was stopped and the particles
were allowed to sediment out under gravity. During sedimentation, changes in
composition in a fixed cross-section through the sample (i.e., acoustic beam path) were
followed by NPTL measurements (Figure 5.6).
In the water-free samples (Figure 5.6a), there was no change in NPTL for about 18000
sec after mixing stopped, and then the signal briefly increased followed by a decrease to a
NPTL value equal to that of sugar-free oil. Presumably, during the lag period, the
sedimenting particles entering to the top of the ultrasonic beam path volume from above
matched by those leaving from the bottom and the signal was unchanged. The increase in
NPTL after the lag must be due to an accumulation of particles in the beam path as the
rate of sedimentation at the bottom of the beam path is less than the rate of sedimentation
at the top. Sedimentation rate tends to decrease as volume fraction increases (Darby,
2001) so the accumulation of particles near the bottom of the tank may serve to slow the
movement of particles lower down more than the ones higher up. Alternatively the
difference in the settling rates of small vs. large particles may contribute to the change in
signal seen. The final decrease in NPTL to a steady state value corresponding to sugar-
free oil is obviously due to the sedimentation of all of the sucrose particles to below the
beam path. A similar concentration change was noted for a creaming emulsion by
Pinfield et al. (1994), who simulated the changes in spatial distribution of colloidal size
emulsion droplets upon storage by ultrasonic measurements.
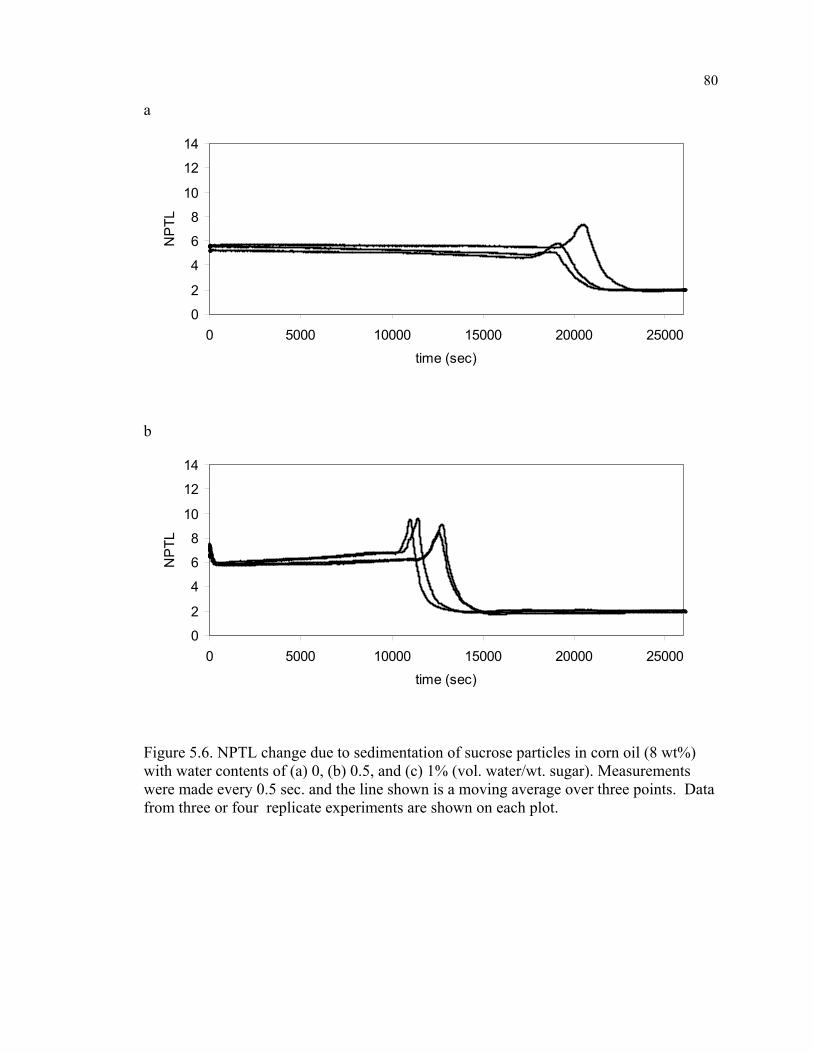
80
a
0
2
4
6
8
10
12
14
0 5000 10000 15000 20000 25000time (sec)
NPT
L
b
0
2
4
6
8
10
12
14
0 5000 10000 15000 20000 25000time (sec)
NPT
L
Figure 5.6. NPTL change due to sedimentation of sucrose particles in corn oil (8 wt%) with water contents of (a) 0, (b) 0.5, and (c) 1% (vol. water/wt. sugar). Measurements were made every 0.5 sec. and the line shown is a moving average over three points. Data from three or four replicate experiments are shown on each plot.
81
c
0
2
4
6
8
10
12
14
0 5000 10000 15000 20000 25000time (sec)
NPT
L
Figure 5.6. (Continued).
The sedimentation profiles of samples containing water (Figures 5.6b and c) were similar
to those of the water-free samples with two important differences. First, the time lag
before changes were seen decreased with increasing water content; and second, there was
an immediate drop in NPTL in the first few minutes after the mixing was stopped.
Adding water led to particle aggregation (see NSBH data for these samples in Table 1)
and large particles sediment more quickly. Increasing the water content from 0 to 1%
decreases the sedimentation time (taken as the time to reach the steady state plateau) from
about 23000 sec to 10000 sec. Assuming the particles movement is governed by Stokes
law this would correspond to about a √2 increase in effective particle size on water
addition assuming the agglomerates were uniform. However, the very rapid initial
decrease in NPTL was probably due to the formation of a few very large aggregates
which sedimented much more quickly. When the samples were analyzed with a
micrometer (i.e., sensitive to the largest particles present), particles in the water-free
samples were too small to be detected (i.e., < 0.1 mm) while the some of the particles at
the bottom of the sediment bed in the water-added samples were in the order of 1.5 mm.
The fact that the water-added samples were much more heterogeneous than the water-free
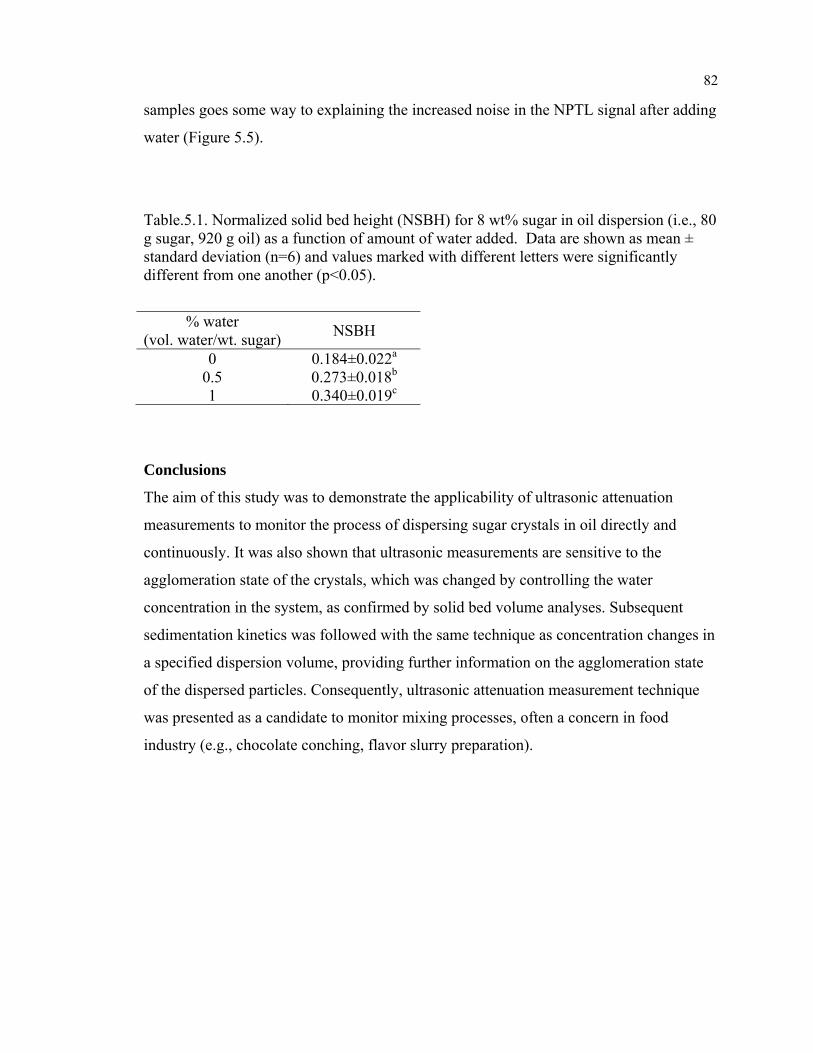
82
samples goes some way to explaining the increased noise in the NPTL signal after adding
water (Figure 5.5).
Table.5.1. Normalized solid bed height (NSBH) for 8 wt% sugar in oil dispersion (i.e., 80 g sugar, 920 g oil) as a function of amount of water added. Data are shown as mean ± standard deviation (n=6) and values marked with different letters were significantly different from one another (p<0.05).
% water (vol. water/wt. sugar) NSBH
0 0.184±0.022a
0.5 0.273±0.018b
1 0.340±0.019c
Conclusions
The aim of this study was to demonstrate the applicability of ultrasonic attenuation
measurements to monitor the process of dispersing sugar crystals in oil directly and
continuously. It was also shown that ultrasonic measurements are sensitive to the
agglomeration state of the crystals, which was changed by controlling the water
concentration in the system, as confirmed by solid bed volume analyses. Subsequent
sedimentation kinetics was followed with the same technique as concentration changes in
a specified dispersion volume, providing further information on the agglomeration state
of the dispersed particles. Consequently, ultrasonic attenuation measurement technique
was presented as a candidate to monitor mixing processes, often a concern in food
industry (e.g., chocolate conching, flavor slurry preparation).
83
Chapter 6
CONCLUSIONS AND RECOMMENDATIONS FOR FUTURE WORK
Ultrasonic waves are sensitive to the bulk properties (i.e., density and compressibility) of
a homogenous system (e.g., solution), and are often modified by the characteristics of the
different phases in a dispersion. Since ultrasonic measurements are rapid (i.e., suitable to
follow kinetic changes with resolutions of less than seconds) and can be used on-line
without disturbing the process or affecting the sample properties, they can help in
improving the efficiency of industrial processes.
The aim of this study was to investigate the applicability of ultrasonic techniques to the
characterization of crystal dispersions. The primary focus of this study was on the
practical aspects of the use of ultrasonic techniques as sensors rather than on modeling
the sound-matter interactions at a microscopic level. The target systems were the
dispersions of crystals of small molecule sugars of varying particle sizes including large
particles, i.e., with dimensions outside the long-wavelength limit. The particles were
dispersed in different liquid continuous phases, i.e., with different hydrophobicities, to
change dispersion properties. Steady state properties, as well as kinetic changes, in the
dispersions were analyzed using ultrasonic attenuation and velocity measurements. The
accomplished goals, as well as outstanding questions are summarized as follows.
On the measurement technique(s):
The experiments were done in two configurations: in an analytical scale high precision
measurement cell, i.e., a pulse-echo reflectometer, and a larger scale stirred tank using
through-transmission ultrasonic measurements. In both cases, the results were
reproducible and similar results were obtained regardless of the configuration. All
ultrasonic measurements were done using a narrow band ultrasonic transducer at a single
center frequency (2.25 MHz center frequency). However, more detailed information
about the dispersion properties, such as particle size distribution, can be obtained using a
range of ultrasonic frequencies.
84
The first goal:
The first goal of this study was to evaluate the applicability of ultrasonic measurements to
measure the compositions of lactose-water mixtures (i.e., solution or dispersion) at steady
state. It was shown that the ultrasonic velocity is linearly related with dissolved lactose
concentration in solution, and changing with crystal content depending on the properties
of the dispersed phase. For example, in Chapter 3 it was found that velocity increased
linearly with total lactose concentration (0-40 wt%) regardless of the state of lactose
molecules, i.e., either dissolved or crystals. In Chapter 4 there were some changes in
velocity during crystallization but these were relatively small (<0.5%) and not useful for
characterizing of the process. In contrast to the ultrasonic velocity measurements,
ultrasonic attenuation was relatively unaffected by changes of lactose concentration in
solution, but increased with dispersed crystal amount. Similarly attenuation was low in
oil and increased with dispersed sucrose crystal concentration (Chapter 5). Furthermore,
aggregation of sucrose crystals in oil (induced by adding water) increased ultrasonic
attenuation.
One application of these findings is to investigate changes in local concentrations of
dispersed crystals during a mixing process. An array of ultrasonic transducers positioned
at different heights, or a pair of transducers moving along the height, of a stirred tank
may give information about the mixing profile and concentration distribution throughout
system. One outstanding question from this part of the work is the behavior of acoustic
waves in real foods, especially confectionery products. For example, ultrasonic
techniques can potentially be used to monitor chocolate tempering on-line, if they are
sensitive to changes in (re)crystallization of cocoa butter in the complex environment of
chocolate paste (i.e., a matrix of cocoa butter, sugar, milk solids, and probably
emulsifiers and some water.
The second goal:
The second goal was to follow the kinetic processes of dissolution (Chapter 3) and
crystallization (Chapter 4) for the lactose-water systems. Since ultrasonic attenuation is
more sensitive to the presence of dispersed particles in a liquid than velocity
85
measurements, continuous automated attenuation measurements were made during these
processes.
Dissolution (Chapter 3):
The dissolution of lactose crystals and consequent changes in the system properties were
monitored in the stirred tank configuration continuously and non-invasively by ultrasonic
attenuation measurements and compared to off-line refractive index measurements. The
rate of dissolution was controlled by varying the degree of under-saturation.
When lactose crystals (d~50 μm) were added into water or an under-saturated lactose
solution, two processes took place consecutively. First the crystal surfaces are wetted
with water molecules, and then the lactose dissolves. However, surface wetting is not
instantaneous but limited by the deagglomeration rate of solid particles, and by the
removal of air between the particle clusters. The air pockets present between and around
the particle clusters attenuated the sound and introduced a dead time (i.e., a period that
the changes due to dissolution were masked by the strong attenuation of air) to the
measurements. In order to reduce the amount of air incorporation, and so the associated
dead time, the dissolution process of α-lactose monohydrate crystals was achieved by
adding water to mixtures of saturated lactose solution and crystals at equilibrium yielding
an under-saturated solution at the end. Hence the subsequent dissolution process was
monitored continuously and on-line from ultrasonic attenuation measurements. The
calculated dissolution rate constant (~700 μs-1) at 37°C was in agreement with literature
data.
It may be possible to extent this method to obtain simultaneous particle size distribution
and concentration data via spectral measurements and an appropriate theoretical model.
However, particle size determination using the existing theories (e.g., ECAH theory)
requires accurate and well defined physical and thermal properties of the components of a
dispersion and is also limited to small size particles (i.e., in the long wavelength limit).
One empirical alternative would be to use, pre-prepared calibration charts to calculate
particle size distribution from ultrasonic measurements.
86
Crystallization (Chapter 4):
The bulk crystallization of lactose from gelatin gels was also monitored by ultrasonic
attenuation measurements using a modified pulse-echo reflectometer as an immersion
probe and compared to turbidity measurements. Isothermal DSC provided useful
information on crystallization kinetics by measuring the enthalpy of crystallization.
Induction time and crystallization rates were compared for varying degrees of super-
saturation (43-46 wt%) and gelatin (1.5-3.0 wt%) concentrations.
The gel environment allowed homogenous distribution of crystals and hindered the
convection flow effects and secondary nucleation. The crystallization rate of lactose
increased with increasing degree of supersaturation, but was not affected by changing
gelatin concentration. Although all measurements able to differentiate changes in
crystallization behavior with changing system composition, ultrasonic measurements are
preferred as on-line monitoring tools over turbidity measurements, which were affected
by the changes in turbidity due to gelatin gelation and cannot be used when the dispersion
becomes opaque due to lactose crystallization.
In the present work, lactose and gelatin concentrations were chosen arbitrarily to provide
a range of suitable crystallization kinetics to assess the ultrasonic sensor. However,
having established ultrasonics as an appropriate methodology, attenuation measurements
could be applied more thoroughly to study the phase behavior of water-lactose-gelatin
system, including optically opaque formulations. Moreover, a more detailed knowledge
on the effects of lactose-gelatin interactions on lactose crystallization, as well as crystal
morphology, could be obtained from ultrasonic measurements utilizing an appropriate
experimental design.
The third goal (Chapter 5):
The third goal of this study was concerned with a model for the conching process in
chocolate manufacture (i.e., dispersions of sucrose crystals in a vegetable oil) (Chapter
5). The dispersion process, i.e., deagglomeration of powdered sugar, was monitored in
the stirred tank configuration using continuous ultrasonic attenuation measurements. The
87
degree of agglomeration was also varied by varying water concentrations and confirmed
with solid bed volume measurements. Furthermore, subsequent sedimentation kinetics
were continuously monitored using the same technique.
In a similar manner to the observations in dissolution section, the sudden increase in
absorbance due to air incorporation upon addition of powdered sugar and subsequent
decrease with deagglomeration of particle clusters (i.e., dead time in the dissolution
analysis) was used to follow the course of dispersing process. It was found that the
deagglomeration of sugar crystals in oil was much slower than in an aqueous
environment (Chapter 3) due to the hydrophobic nature of the oil. Additionally, it was
shown that the ultrasonic attenuation measurements were sensitive to the degree of
agglomeration, per se. When small amounts of water (≤ 1%) were added into the
dispersion, it partitioned onto the surface of the hydrophilic sugar crystals and held them
together as aggregates via strong capillary forces. The degree of agglomeration was
characterized as an increase in the sediment volume because the aggregated particles
pack together less efficiently. The subsequent sedimentation kinetics, as followed at a
certain height from the bottom of the container through the ultrasonic beam path, was
used to provide further information about on the state of agglomerated sucrose crystals.
The sedimentation rates increased with degree of agglomeration (e.g., the total
sedimentation time decreased to half of by 1% water addition) as expected. Moreover, it
was found that the agglomeration process was inhomogeneous as confirmed by
micrometer measurements and resulted in uneven sedimentation profiles.
This approach provides an interesting and novel approach to the characterization of sugar
dispersions in oil which could be explored in a variety of ways. First, the degree of
agglomeration can affect the apparent viscosity of the dispersion. If viscosity was
measured independently, it may be possible to correlate non-invasive, on-line ultrasonic
measurements with invasive, off-line rheological measurements. Controlling the rheology
of some products during food processes, such as chocolate conching or flavor slurry
preparations, is vital as it determines the final product quality. On-line ultrasonic
88
measurements can provide direct control over the rheology of the dispersion and thus
over- (or under-) processing can be minimized.
Mechanistic models developed from equations of fluid dynamics could be used to
simulate the sedimentation kinetics and check the validity of ultrasonic measurements.
Separation processes, such as sedimentation (i.e., a gravitational separation), are a widely
used in food industry, especially in refining operations. By on-line monitoring of the
sedimentation kinetics, which is often difficult due to the opaque nature of the material,
the factors (e.g., particle size distribution, and physicochemical properties of the
respective phases) affecting the kinetics of this process could be better understood.
Moreover, these measurements integrated with mechanistic models can also provide
information about the stability of dispersions to the gravitational force.
89
REFERENCES Akulichev VA, Bulanov VA (1981). Sound propagation in a crystallizing liquid. Soviet Physics-Acoustics, 27 (5), 377-381. Akulichev VA, Bulanov VA (1983). Crystallization nuclei in liquid in s sound field. International Journal of Heat and Mass Transfer, 26 (2), 289-300. Allegra JR, Hawley SA (1972). Attenuation of sound in suspensions and emulsions: Theory and experiments, Journal of Acoustical Society of America, 51 (5), 1545-1564. Bamberger JA, Greenwood MS (2004). Using ultrasonic attenuation to monitor slurry mixing in real time. Ultrasonics, 42, 145-148. Basaran TK, Demetriades K, McClements DJ (1998). Ultrasonic imaging of gravitational separation in emulsions. Colloids and Surfaces A: Physicochemical and Engineering Aspects, 136, 169-181. Beckett ST (2001). Milling, mixing and tempering – an engineering view of chocolate. Proceedings of the Institution of Mechanical Engineers, 215 (E), 1-8. Beckett ST (2009). Conching. In Industrial Chocolate Manufacture and Use. (4th Ed). Edited by Beckett ST, pp. 192-223. John Wiley and Sons, Chichester. Bilaniuk N, Wong GSK (1993). Speed of sound in pure water as a function of temperature. The Journal of Acoustical Society of America, 93 (3), 1609-1612. Blitz J (1967). Fundamentals of Acoustics (2nd Ed.). Butterworths, London. Botsaris GD (1976). Secondary nucleation-a review. In Industrial Crystallization. Edited by Mullin JW, p.3. Plenum Press, New York. Brandon D, Kaplan WD (2008). Microstructural Characterization of Materials (2nd Ed.). John Wiley and Sons, Chippenham. Bryant CM, McClements DJ (1999). Ultrasonic spectrometry study of the influence of temperature on whey protein aggregation. Food Hydrocolloids, 13, 439-444. Buma TJ, Wiegers GA (1967). X-ray powder patterns of lactose and unit cell dimensions of β-lactose. Netherlands Milk and Dairy Journal, 21, 208-213. Challis RE, Povey MJW, Mather ML, Holmes AK (2005). Ultrasound techniques for characterizing colloidal dispersions. Reports on Progress in Physics, 68, 1541-1637.
90
Chanamai R, Coupland JN, McClements DJ (1998). Effect of temperature on the ultrasonic properties of oil in water emulsions. Colloids and Surfaces A: Physicochemical and Engineering Aspects, 139, 241-250. Chanamai R, Herrmann N, McClements DJ (2000). Probing floc structure by ultrasonic spectroscopy, viscometry, and creaming measurements. Langmuir, 16, 5884-5891. Chevalley J (1999). Chocolate flow properties. In Industrial Chocolate Manufacture and Use (3rd Ed.). Edited by Beckett ST, pp. 182-200. Blackwell Science, Oxford. Coupland JN (2004). Low intensity ultrasound. Food Research International, 537-543. Darby R (2001). Chemical Engineering Fluid Mechanics (2nd Ed.). Marcel Dekker Inc., New York. Epstein PS, Carhart RR (1953). The absorption of sound in suspensions and emulsions. I. Water fog in air. Journal of Acoustical Society of America, 25 (3), 553-565. Faran JJ (1951). Sound scattering by solid cylinders and spheres. Journal of Acoustical Society of America, 23, 405-418. Figura LO, Epple M (1995). Anhydrous α-lactose. A study with DSC and TXRD. Journal of Thermal Analysis, 44, 45-53. Foubert I, Dewettinck K, Vanrolleghem PA (2003). Modelling of the crystallization kinetics of fats. Trends in Food Science and Technology, 14, 79-92. Ganzle MG, Haase G, Jelen P (2008). Lactose: Crystallization, hydrolysis and value-added derivatives. International Dairy Journal, 18, 685-694. Garnier S, Petit S, Coquerel (2002). Dehydration mechanism and crystallization behavior of lactose. Journal of Thermal Analysis and Calorimetry, 68, 489-502. Garside J, 1985. Industrial crystallization from solution. Chemical Engineering Science. 40 (1), 3-26. Gillies DG, Greenley KR, Sutcliffe LH (2006). ESR/spin probe study of ice cream. Journal of Agricultural and Food Chemistry, 54 (14), 4934-4947. Gulseren I, Coupland JN (2007). Excess ultrasonic attenuation due to solid-solid and solid-liquid transitions in emulsified octadecane. Crystal Growth & Design, 7 (5), 912-918. Gulseren I, Coupland JN (2008). Ultrasonic properties of partially frozen sucrose solutions. Journal of Food Engineering, 89, 330-335.
91
Haase G, Nickerson TA (1966a). Kinetic reactions of alpha and beta lactose. I. Mutarotation. Journal of Dairy Sciences, 49 (2), 127-132. Haase G, Nickerson TA (1966b). Kinetic reactions of alpha and beta lactose. II. Crystallization. Journal of Dairy Sciences, 49 (7), 757-761. Haque MDK, Roos YH (2005). Crystallization and X-ray diffraction of crystals formed in water-plasticized amorphous spray-dried and freeze-dried lactose/protein mixtures. Journal of Food Science E: Food Engineering and Physical Properties, 70 (5), E359-E366. Harker AH, Temple JAG (1988). Velocity and attenuation of ultrasound in suspensions of particles in fluids. Journal of Physics D-Applied Physics, 21 (11), 1576-1588. Hartel RW (2001). Crystallization in Foods. Aspen Publishers, Inc., Maryland. Hay A, Mercer D (1985). On the theory of sound scattering and viscous absorption in aqueous suspensions at medium and short wavelengths. Journal of Acoustical Society of America, 78, 1761-1771. Herrington BL (1934). Some physico-chemical properties of lactose. II. Factors influencing the crystalline habit of lactose. Journal of Dairy Science, 17 (8), 533-542. Higami M, Ueno S, Segawa T, Iwanami K, Sato K (2003). Simultaneous synchrotron radiation X-ray diffraction - DSC analysis of melting and crystallization behavior of trilauroylglycerol in nanoparticles of oil-in-water emulsion. Journal of the American Oil Chemists Society, 80 (8), 731-739. Hipp AK, Walker B, Mazzotti M, Morbidelli M (2000). In-situ monitoring of batch crystallization by ultrasound spectroscopy. Industrial and Engineering Chemistry Research, 39, 783-789. Holmes AK, Challis RE, Wedlock DJ (1993). A wide bandwidth study of ultrasound velocity and attenuation in suspensions: Comparison of theory with experimental measurements. Journal of Colloid and Interface Science, 156, 261-268. Holmes AK, Challis RE, Wedlock DJ (1994). A wide bandwidth ultrasonic study of suspensions: the variation of velocity and attenuation with particle size. Journal of Colloid and Interface Science, 168, 339-348. Holmes AK, Challis RE, Chen Y, Hibberd DJ, Moates GK (2007). Ultrasonic scattering in chocolate and model systems containing sucrose, tripalmitin and olive oil. IEEE Transactions on Ultrasonics, Ferroelectrics, and Frequency Control, 54 (11), 2357-2366. Holsinger VH (1997). Physical and chemical properties of lactose. In Advanced Dairy Chemistry Vol 3. (2nd Ed.). Edited by Fox PF, pp. 1-31. Chapman and Hall, London.
92
Hudson CS (1908). Further studies on the forms of milk-sugar. Journal of the American Chemical Society, 30 (11), 1767-1783. Hunziker OF, Nissen BH (1926). Lactose solubility and lactose crystal formation. I. Lactose solubility. Journal of Dairy Sciences, 9 (6), 517-537. Hunziker OF, Nissen BH (1927). Lactose solubility and lactose crystal formation. II.Lactose crystal formation. Journal of Dairy Sciences, 10 (2), 139-154. Johansson D, Bergenstahl B (1992a). The influence of food emulsifiers on fat and sugar dispersions in oils. II. Rheology, colloidal forces. Journal of the American Oil Chemists Society, 69 (8), 718-727. Johansson D, Bergenstahl B (1992b). The influence of food emulsifiers on fat and sugar dispersions in oils. I. Adsorption, Sedimentation. Journal of the American Oil Chemists Society, 69 (8), 705-717. Johansson D, Bergenstahl B (1992c). The influence of food emulsifiers on fat and sugar dispersions in oils. III. Water content, purity of oils. Journal of the American Oil Chemists Society, 69 (8), 728-733. Johansson D, Bergenstahl B (1995). Sintering of fat crystal networks in oil during post crystallization processes. Journal of the American Oil Chemists Society, 72, 911-920. Karpinski PH, Wey JS (2001). Precipitation processes. In Handbook of Industrial Crystallization, 2nd Ed. Edited by Myerson AS, pp.141-160. Butterworth-Heinemann, Boston. Kasapis S, Al-Marhoobi IM, Deszczynski M, Mitchell JR, Abeysekera R (2003). Gelatin vs polysaccharide in mixture with sugar. Biomacromolecules, 4, 1142-1149. Kinsler LE, Frey AR, Coppens AB, Sanders JV (2000). Fundamentals of Acoustics (4th Ed.). John Wiley & Sons, Hoboken. Labuza TP, Labuza PS (2004). Influence of temperature and relative humidity on the physical states of cotton candy. Journal of Food Processing Preservation, 28, 274-287. Lloyd P, Berry MV (1967). Wave propagation through an assembly of spheres. IV. Relations between different multiple scattering theories. Proceedings of the Physical Society, 91, 678–688. Marangoni AG (1998). On the use and misuse of the Avrami equation in characterization of the kinetics of fat crystallization. Journal of the American Oil Chemists Society, 75, 1465-1467.
93
Marshall T, Challis RE, Holmes AK, Tebbutt JS (2002). Modeling ultrasonic compression wave absorption during the seeded crystallization of copper (II) sulphate pentahydrate from aqueous solution. IEEE Transactions on Ultrasonics, Ferroelectrics, and Frequency Control, 49 (11), 1583-1591. Martini S, Bertoli C, Herrera ML, Neeson I, Marangoni A (2005). Attenuation of ultrasonic waves: influence of microstructure and solid fat content. Journal of the American Oil Chemists Society, 82(5), 319-328. McClements DJ, Povey MJW (1989). Scattering of ultrasound by emulsion. Journal of Physics D: Applied Physics, 22, 38-47. McClements DJ, Fairley P (1992). Frequency scanning ultrasonic pulse echo reflectometer. Ultrasonics, 30 (6), 403-405. McClements DJ, Povey MJW, Dickinson E (1993). Absorption and velocity dispersion due to crystallization and melting of emulsion droplets. Ultrasonics, 31 (6), 433-437. Mimouni A, Schuck P, Bouhallab S (2005). Kinetics of lactose crystallization and crystal size as monitored by refractometry and laser light scattering: effects of proteins. Lait, 85, 253-260. Mongia G, Ziegler GR (2000). The role of particle size distribution of suspended solids in defining the flow properties of milk chocolate. International Journal of Food Properties, 3(1), 137-147. Myerson AS, Ginde R (2001). Crystals, crystal growth, and nucleation. In Handbook of Industrial Crystallization (2nd Ed). Edited by Myerson AS, pp. 33-65. Butterworth-Heinemann, Boston Nelson RD Jr. (1988). Dispersing powders in liquids. In Handbook of Powder Technology (Vol. 7). Edited by Williams JC and Allen T, pp 245. Elsevier, Amsterdam. Nickerson TA (1962). Lactose crystallization in ice cream. IV. Factors responsible for reduced incidence of sandiness. Journal of Dairy Science, 45 (3), 354-359. Nickerson TA and Moore (1974). Factors influencing lactose crystallization. Journal of Dairy Science, 57 (11), 1315-1319. Omar W, Ulrich J (1999). Application of ultrasonics in the on-line determination of supersaturation. Crystal Research and Technology, 34, 379-389. Pinfield VJ, Dickinson E, Povey MJW (1994). Modeling of concentration profiles and ultrasonic velocity profiles in a creaming emulsion: Importance of scattering effects. Journal of Colloid and Interface Science, 166, 363-374.
94
Pinfield VJ, Povey MJW, Dickinson E (1995). The application of modified forms of the Urick equation to the interpretation of ultrasound velocity in scattering systems. Ultrasonics, 33 (3), 243-251. Povey MJW (1997). Ultrasonic Techniques for Fluid Characterization. Academic Press, San Diego, California. Raghavan SL, Ristic RI, Sheen DB, Sherwood JN (2001). The bulk crystallization of α-lactose monohydrate from aqueous solution. Journal of Pharmaceutical Sciences, 90 (7), 823-832. Raghavan SL, Ristic RI, Sheen DB, & Sherwood JN (2002). Dissolution kinetics of single crystals of α-lactose monohydrate. Journal of Pharmaceutical Sciences, 91 (10), 2166-2174. Richter A, Babick F, Ripperger S. (2005). Polydisperse particle size characterization by ultrasonic attenuation spectroscopy for systems of diverse acoustic contrast in the large particle limit. Journal of Acoustical Society of America, 118 (3), 1394-1405 Richter A, Babick F, Stintz M (2006). Polydisperse particle size characterization by ultrasonic attenuation spectroscopy in the micrometer range. Ultrasonics, 44, e483-e490. Saggin R, Coupland JN (2002). Ultrasonic monitoring of power dissolution. Journal of Food Science, 67 (4), 1473-1477. Saggin RS, Coupland JN (2004). Shear and longitudinal ultrasonic measurements of solid fat dispersions. Journal of the American Oil Chemists Society, 81, 27-32. Sayan P, Ulrich J (2002). The effect of particle size and suspension density on the measurement of ultrasonic velocity in aqueous solutions. Chemical Engineering and Processing, 41, 281-287. Singh AP, McClements DJ, Marangoni AG (2002). Comparison of ultrasonic and pulsed NMR techniques for determination of soldi fat content. Journal of the American Oil Chemists Society, 79 (5), 431-437. Tebbutt JS, Challis RE (1996). Ultrasonic wave propagation in colloidal suspensions and emulsions: a comparison of four models. Ultrasonics, 34, 363-368. Tebbutt JS, Marshall T, Challis RE (1999). Monitoring of copper (II) sulfate pentahydrate crystallization using ultrasound. Langmuir, 15, 3356-3364. Titiz-Sargut S, Ulrich J (2003). Application of a protected ultrasound sensor for determination of the width of the metastable zone. Chemical Engineering and Processing, 42, 841-846.
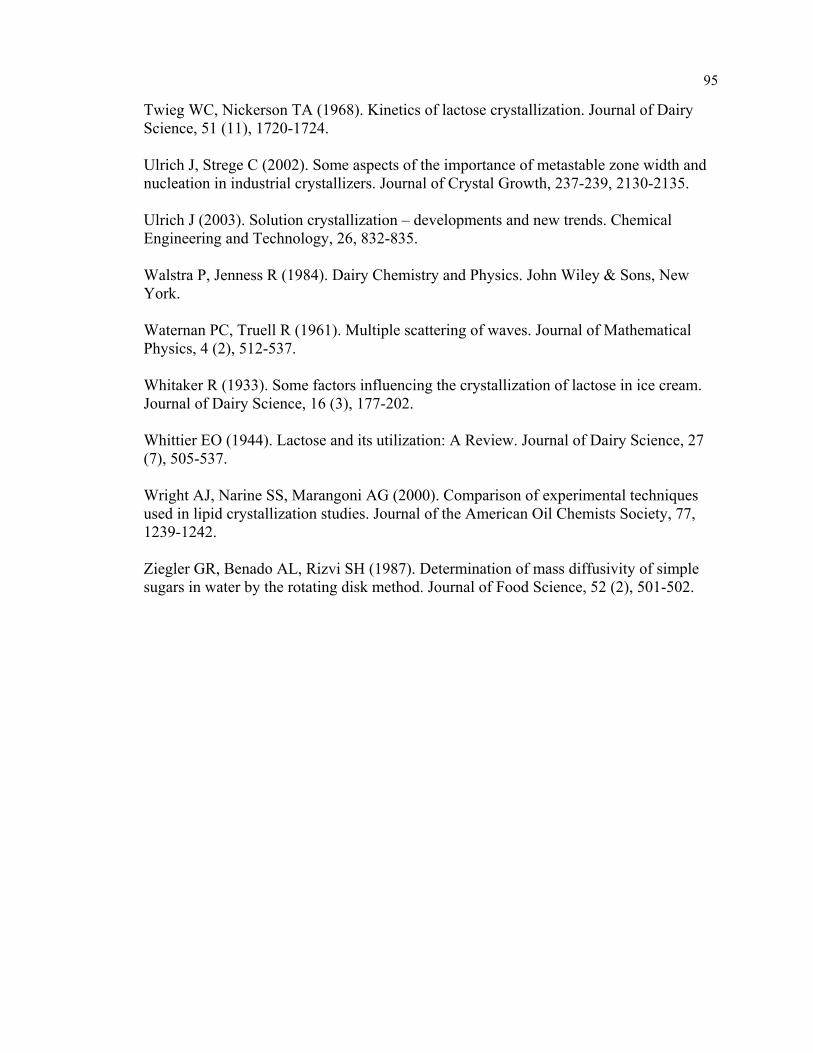
95
Twieg WC, Nickerson TA (1968). Kinetics of lactose crystallization. Journal of Dairy Science, 51 (11), 1720-1724. Ulrich J, Strege C (2002). Some aspects of the importance of metastable zone width and nucleation in industrial crystallizers. Journal of Crystal Growth, 237-239, 2130-2135. Ulrich J (2003). Solution crystallization – developments and new trends. Chemical Engineering and Technology, 26, 832-835. Walstra P, Jenness R (1984). Dairy Chemistry and Physics. John Wiley & Sons, New York. Waternan PC, Truell R (1961). Multiple scattering of waves. Journal of Mathematical Physics, 4 (2), 512-537. Whitaker R (1933). Some factors influencing the crystallization of lactose in ice cream. Journal of Dairy Science, 16 (3), 177-202. Whittier EO (1944). Lactose and its utilization: A Review. Journal of Dairy Science, 27 (7), 505-537. Wright AJ, Narine SS, Marangoni AG (2000). Comparison of experimental techniques used in lipid crystallization studies. Journal of the American Oil Chemists Society, 77, 1239-1242. Ziegler GR, Benado AL, Rizvi SH (1987). Determination of mass diffusivity of simple sugars in water by the rotating disk method. Journal of Food Science, 52 (2), 501-502.
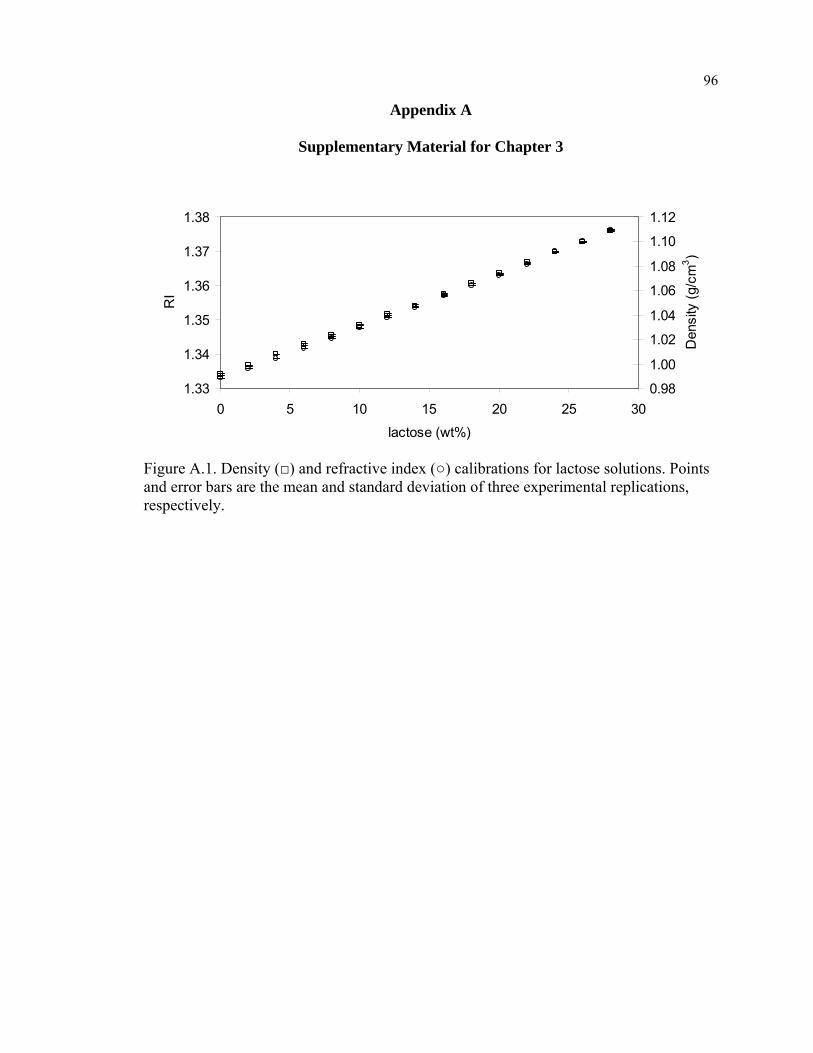
96
Appendix A
Supplementary Material for Chapter 3
1.33
1.34
1.35
1.36
1.37
1.38
0 5 10 15 20 25 30
lactose (wt%)
RI
0.98
1.00
1.02
1.04
1.06
1.08
1.10
1.12
Den
sity
(g/c
m3 )
Figure A.1. Density (□) and refractive index (○) calibrations for lactose solutions. Points and error bars are the mean and standard deviation of three experimental replications, respectively.
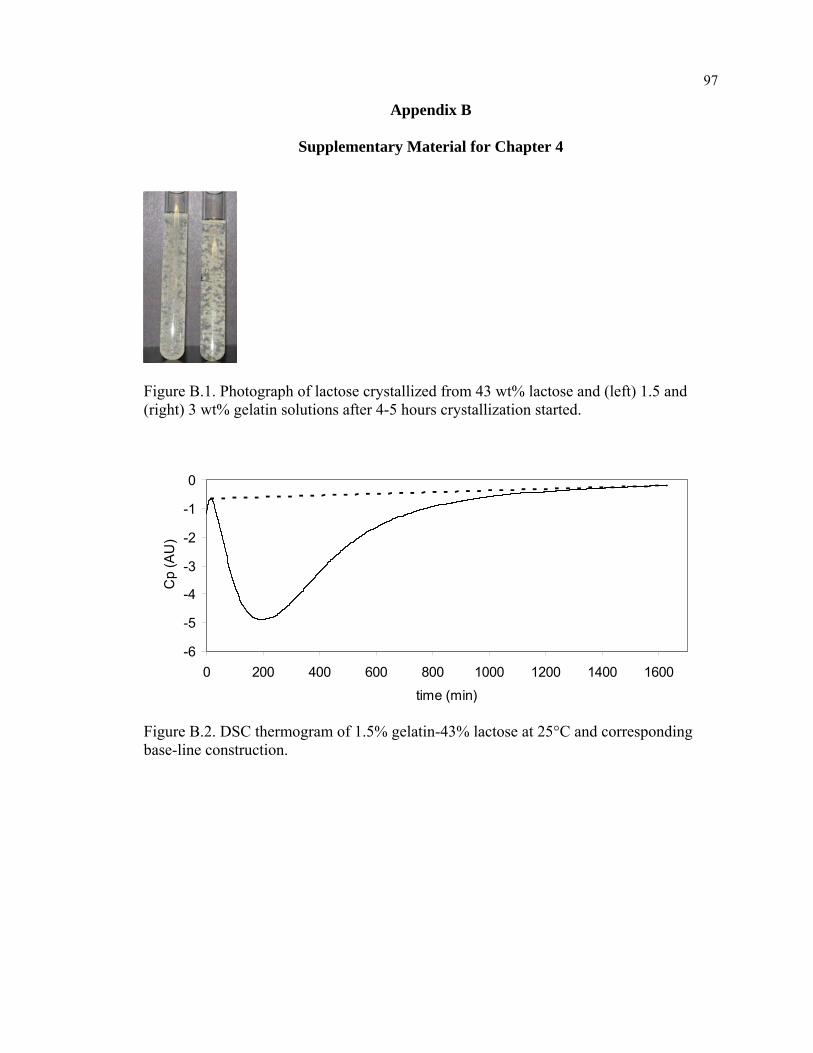
97
Appendix B
Supplementary Material for Chapter 4
Figure B.1. Photograph of lactose crystallized from 43 wt% lactose and (left) 1.5 and (right) 3 wt% gelatin solutions after 4-5 hours crystallization started.
-6
-5
-4
-3
-2
-1
0
0 200 400 600 800 1000 1200 1400 1600
time (min)
Cp
(AU
)
Figure B.2. DSC thermogram of 1.5% gelatin-43% lactose at 25°C and corresponding base-line construction.
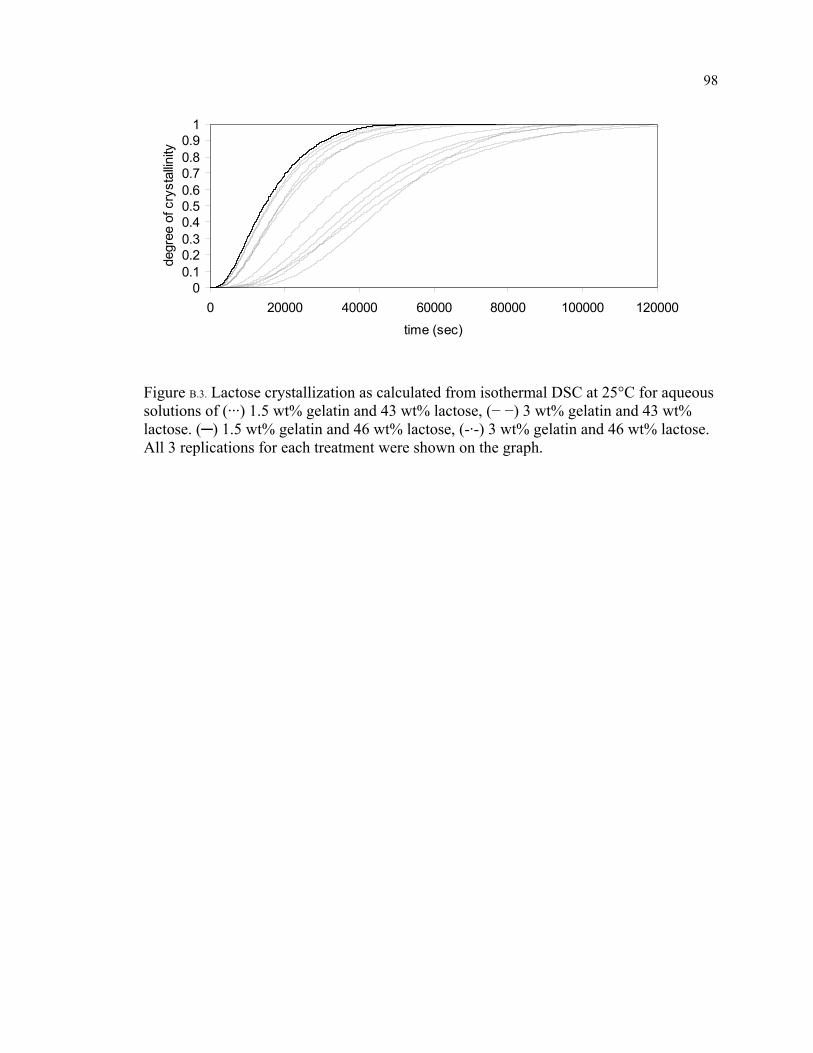
98
00.10.20.30.40.50.60.70.80.9
1
0 20000 40000 60000 80000 100000 120000
time (sec)
degr
ee o
f cry
stal
linity
Figure B.3. Lactose crystallization as calculated from isothermal DSC at 25°C for aqueous solutions of (···) 1.5 wt% gelatin and 43 wt% lactose, (− −) 3 wt% gelatin and 43 wt% lactose. (─) 1.5 wt% gelatin and 46 wt% lactose, (-·-) 3 wt% gelatin and 46 wt% lactose. All 3 replications for each treatment were shown on the graph.
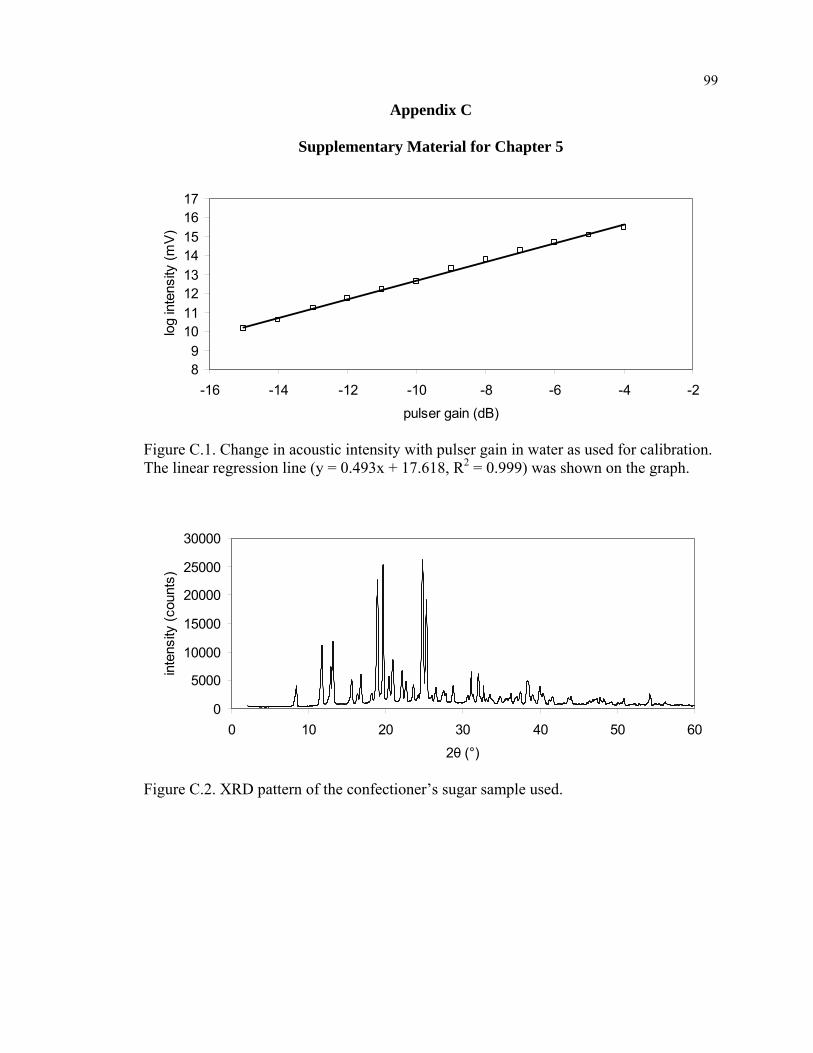
99
Appendix C
Supplementary Material for Chapter 5
89
1011121314151617
-16 -14 -12 -10 -8 -6 -4 -2pulser gain (dB)
log
inte
nsity
(mV)
Figure C.1. Change in acoustic intensity with pulser gain in water as used for calibration. The linear regression line (y = 0.493x + 17.618, R2 = 0.999) was shown on the graph.
0
5000
10000
15000
20000
25000
30000
0 10 20 30 40 50 602θ (°)
inte
nsity
(cou
nts)
Figure C.2. XRD pattern of the confectioner’s sugar sample used.
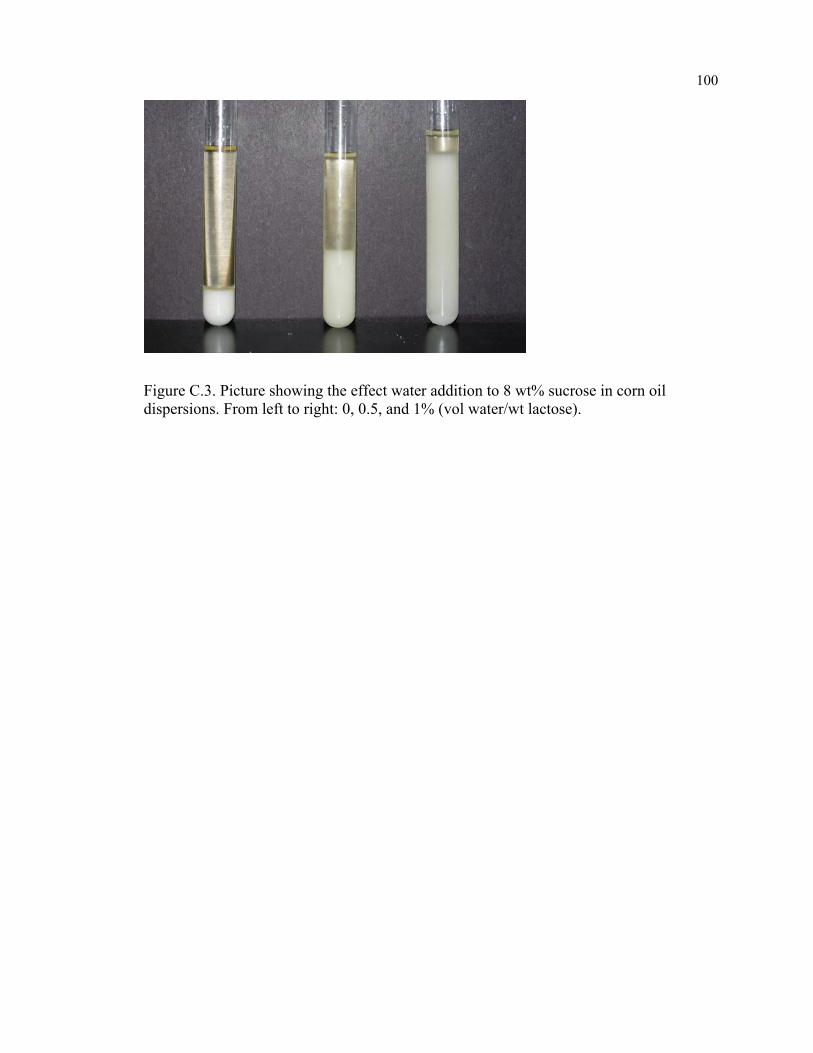
100
Figure C.3. Picture showing the effect water addition to 8 wt% sucrose in corn oil dispersions. From left to right: 0, 0.5, and 1% (vol water/wt lactose).