Embed Size (px)
Citation preview
RSC Advances
PAPER
Ope
n A
cces
s A
rtic
le. P
ublis
hed
on 2
7 M
ay 2
020.
Dow
nloa
ded
on 1
2/9/
2021
11:
23:3
1 A
M.
Thi
s ar
ticle
is li
cens
ed u
nder
a C
reat
ive
Com
mon
s A
ttrib
utio
n 3.
0 U
npor
ted
Lic
ence
.
View Article OnlineView Journal | View Issue
Ultrathin quasi-h
Department of Biological Systems Engineeri
53706, USA. E-mail: [email protected]
† Electronic supplementary informa10.1039/d0ra02750b
‡ These authors contributed equally.
Cite this: RSC Adv., 2020, 10, 20211
Received 25th March 2020Accepted 6th May 2020
DOI: 10.1039/d0ra02750b
rsc.li/rsc-advances
This journal is © The Royal Society o
exagonal gold nanostructures forsensing arsenic in tap water†
Anu Prathap M. Udayan,‡ Batul Kachwala,‡ K. G. Karthikeyanand Sundaram Gunasekaran *
Monodispersed colloidal gold nanoparticles (AuNPs) were synthesized by an easy, cost-effective, and eco-
friendly method. The AuNPs were mostly quasi-hexagonal in shape with sizes ranging from 15 to 18 nm. A
screen-printed electrode modified with AuNPs (AuNPs/SPE) was used as an electrochemical sensor for the
detection of As(III) in water samples. Themechanistic details for the detection of As(III) were investigated and
an electrochemical reaction mechanism was proposed. Under the optimal experimental conditions, the
sensor was highly sensitive to As(III), with a limit of detection of 0.11 mg L�1 (1.51 nM), which is well below
the regulatory limit of 10 mg L�1 established by the United States Environmental Protection Agency and
the World Health Organization. The sensor responses were highly stable, reproducible, and linear over
the As(III) concentration range of 0.075 to 30 mg L�1. The presence of co-existing heavy metal cations
such as lead, copper, and mercury did not interfere with the sensor response to As(III). Furthermore, the
voltammogram peaks for As(III), lead, copper, and mercury were sufficiently separate for their potential
simultaneous measurement, and at very harsh acidic pH it may be possible to detect As(V). The AuNPs/
SPE could detect As(III) in tap water samples at near-neutral pH, presenting potential possibilities for real-
time, practical applications.
1 Introduction
Arsenic (As) is a toxic element, which even at trace levels cancause dangerous health effects, including death.1–3 Contami-nation of drinking water by As has been reported worldwide,threatening the health of 140 million people.4 Hence, the WorldHealth Organization (WHO) and the United States Environ-mental Protection Agency (USEPA) have established that Asconcentration in drinking water must be below 10 mg L�1 (i.e.,10 parts per billion, ppb).5,6 Although As exists in differentforms in nature, in groundwater it exists primarily in twoinorganic forms: pentavalent arsenate (As(V)), and trivalentarsenite (As(III)). Between these two, As(III) is more harmful withtoxicity at least 60 times that of As(V) and other organic arsenictypes.7 Depending on the pH, there are different forms of As(III):AsO3
3� (pH 14), HAsO32�(pH 13), H2AsO3
� (10 < pH < 12) andH3AsO3 (0 < pH < 9) and As(V): [AsO4(H2O)12]
3� (pH > 13),[HAsO4(H2O)6]
2� (7 < pH < 11), [H2AsO4(H2O)2]� (3.5 < pH < 6)
and H3AsO4 (pH < 3.5).8 Persistent exposure to As(III) above theWHO and USEPA threshold value of 10 mg L�1 may causea number of diseases such as skin damage, issues with
ng, University of Wisconsin, Madison, WI
tion (ESI) available. See DOI:
f Chemistry 2020
circulatory systems and different cancers, including those of theskin, the lungs, the bladder and the prostate.9
Several analytical methods have been developed for thedetermination of As.10–12 These methods usually involve expen-sive and large laboratory instruments such as, surface enhancedRaman spectroscopy (SERS), atomic absorption spectroscopy(AAS), ame AAS (FAAS), graphite furnace AAS (GFAAS), andinductively coupled plasma mass spectroscopy (ICPMS).13–15
Consequently, simple, rapid, and onsite analytical methods forultrasensitive determination of As are being actively developed.
Aptamers are considered as appealing tools for detecting thepresence of heavy metals in the environment.16,17 An As-bindingDNA aptamer, Ars-3, has high affinity for As(III).16,17 Colorimetricand SERS methods using Ars-3 have simplied the procedureand improved the selectivity for As(III) detection; however,exposure to As(III) is evident at much lower concentrations thanpreviously thought.16,17 A latest epidemiological study reportedskin cancer cells caused by direct exposure to reduced concen-trations of arsenic (10 mg L�1) via drinking water.16,17
Electrochemical approaches are convenient alternatives tothe conventional analytical methods.18,19 The electrochemicalmethods are simple, inexpensive, user-friendly, and suitable foron-site measurements with minimal off-line preparation.Generally, cathodic and anodic stripping voltammetry (CSV/ASV) are used for the detection of As(III) and As(V).8,20 Thesemethods involve electrochemical deposition of As on an elec-trode for several minutes (i.e., As3++ 3e� / As0) followed by
RSC Adv., 2020, 10, 20211–20221 | 20211
RSC Advances Paper
Ope
n A
cces
s A
rtic
le. P
ublis
hed
on 2
7 M
ay 2
020.
Dow
nloa
ded
on 1
2/9/
2021
11:
23:3
1 A
M.
Thi
s ar
ticle
is li
cens
ed u
nder
a C
reat
ive
Com
mon
s A
ttrib
utio
n 3.
0 U
npor
ted
Lic
ence
.View Article Online
their oxidation back into the solution by a reverse potential scan(i.e., As0 / As3+ + 3e�).21–24 With the introduction of new pulsevoltammetric techniques such as square wave voltammetry(SWV) and differential pulse anodic stripping voltammetry(DPASV), signal-to-noise enhancement through reduction incapacitance background provides considerably better detectionlimits than expensive spectroscopic methods.25
From the analytical point of view, gold electrodes are themost suitable due to their inertness and best interaction with As(i.e., the formation of bimetallic compounds Aux–Asy), whichfavor the preconcentration of trace As, thus enabling lowdetection limits and short analysis time.26–28 Plethora of variousmicro- or even nano-structured gold electrodes for the deter-mination of As has been widely reviewed. Such electrodesinclude gold wires, gold plated microelectrodes, and conven-tional solid electrodes modied with gold nanoparticles(AuNPs) or AuNPs-decorated composites based on reducedgraphene oxide (rGO), exfoliated graphite, magnetic nano-spheres, etc. AuNPs provide important functions for electro-analysis: improved mass transport, sensitivity, electrocatalyticeffects, and ability to adsorb metal ions. The electrochemicalbehavior of Au electrodes has a strong relationship with theircrystallographic orientation. A single-crystal Au (111) electrodewith a well-ordered surface can exhibit well-dened electro-chemical behavior for As(III) detection.29 Gold nanocubes (100),octahedra (111), and also rhombic dodecahedra (110) have beenreported for As detection.29 Au (111) face was found to exhibitthe highest sensitivity compared with Au (100) and (110)surfaces. The electrochemical detection of As(III) utilizinga platform based on Au (111)-like surface by the partial reduc-tive desorption of n-butanethiol (n-BT) was reported.30 A self-assembled monolayer of n-BT was developed, which enabledthe selective blockage of Au (100) and Au (110) by n-BT while theAu (111) domain stayed bare. The electrode was highly sensitiveand selective to As(III) and can detect As(III), even in the presenceof high concentration of Cu(II) with no interference. It wasbelieved that the exposed Au (111) surface domain of the elec-trode played a crucial role in the detection of As(III).30 Althoughthese reported electrodes allow the detection of As at the ppb orsub-ppb levels, they have to deal with complicated fabricationmethods needing instrumentation, extensive morphologicalcontrol, the use of costly reagents or electroplating baths thatresult in high waste loadings, intensive labor and, on the wholeincreased cost.26–28 Also, interferences from various other metalssuch as copper (Cu), mercury (Hg), selenium (Se) that maycoexist with As are considerable, which has not been appro-priately addressed.31 For example, in the CSV evaluation, As(III)is preconcentrated at a negative potential (�0.5 V with silver/silver chloride (Ag/AgCl)) in the presence of Cu(II) or Se(IV) asa CuxAsy intermetallic compound on a mercury (Hg) electrodeprior to stripping.31 Ferreria31 reported interference of Cu(II)during As(III) measurement at Au macroelectrode and at AuNPs-modied electrodes. Copper co-deposits with As during the pre-deposition step and forms an intermetallic compound Cu3As2and also with bulk Cu.31 It has been reported that making use ofAu macroelectrodes, As(0) to As(III) as well as Cu(0) to Cu(II)stripping peaks develop within 100 mV of each other along with
20212 | RSC Adv., 2020, 10, 20211–20221
a third peak arising from the intermetallic compound.31
Deconvolution of As or even Cu peaks can be quite complicatedwhen themetals are both present in similar amounts along withthe Cu stripping peak appearing as a shoulder on the As strip-ping peak.31 If the concentration of Cu(II) is high, then thestripping peak of Cu(II) partially masks the As(III) signal.
Other approaches have explored the addition of complexingagent to the electrolyte or via modication of Au macro-electrodes with cysteine allowing the separation of the As(111)and Cu(11) stripping peaks. On the other hand, metal ions suchas Cu(II), Hg(II), and lead (Pb(II)) compete for sites on the surfaceof Au without forming intermetallic compounds.31 Hence, theanalytical challenge is to develop a platform for sensitivedetection of trace levels of As(III) without interference fromtypically co-existing heavy metals under mild condition.
Herein we report the synthesis of 15� 3 nm colloidal AuNPs,via a facile reduction method, and their use for the rapid andhighly sensitive detection of As(III). Screen-printed electrodes(SPEs) modied with the synthesized AuNPs (AuNPs/SPE)served as As(III) sensor and was tested in both As-spikedbuffer solutions and tap water. The results show that oursensor is highly sensitive, reproducible and stable. Based onthis work, an electrochemical reaction mechanism for As(III)oxidation was proposed. Interference studies, stability andrepeatability measurements were conducted to assess thepracticality of the sensor.
2 Materials and methods2.1 Materials
Screen-printed electrodes were purchased from CH Instru-ments, Inc. (TE100, Bee Cave, TX, USA). The SPE patternincluded 3 mm diameter carbon working electrode, carboncounter electrode, and Ag/AgCl reference electrode. Hydrogentetrachloroaurate(III) trihydrate (HAuCl4$3H2O), sodium citrate,hydrochloric acid (37%), and sodium hydroxide, were suppliedby ACROS Organics. Arsenic trioxide (As2O3) was purchasedfrom Sigma Aldrich. All other reagents were obtained eitherfrom Sigma Aldrich or Fisher Scientic with the highest gradeavailable and were used without further purication. All solu-tions were prepared using deionized (DI) water with a resistivityof 18.2 MU cm at room temperature (Ultrapure Water System,Millipore, and Billerica, MA, USA). A 20 mM primary stocksolution of As(III) was prepared by dissolving As2O3 (solubility inwater at 25 �C is 20 g L�1) in DI water. To produce a standardcalibration curve for As(III), different concentrations (0.001 mM,0.01 mM, and 0.1 mM) of As(III) solutions were prepared bydiluting the primary stock solution using DI water. Tap watersamples were from our laboratory at the University ofWisconsin-Madison, WI, which did not contain any visiblesediments so samples were not ltered prior to use.
2.2 AuNPs synthesis and electrode fabrication
AuNPs were synthesized according the Turkevich method,32
with slight modications (Scheme 1). Two milliliters of 10 mMHAuCl4$3H2O was added to 18 mL DI water under constant
This journal is © The Royal Society of Chemistry 2020
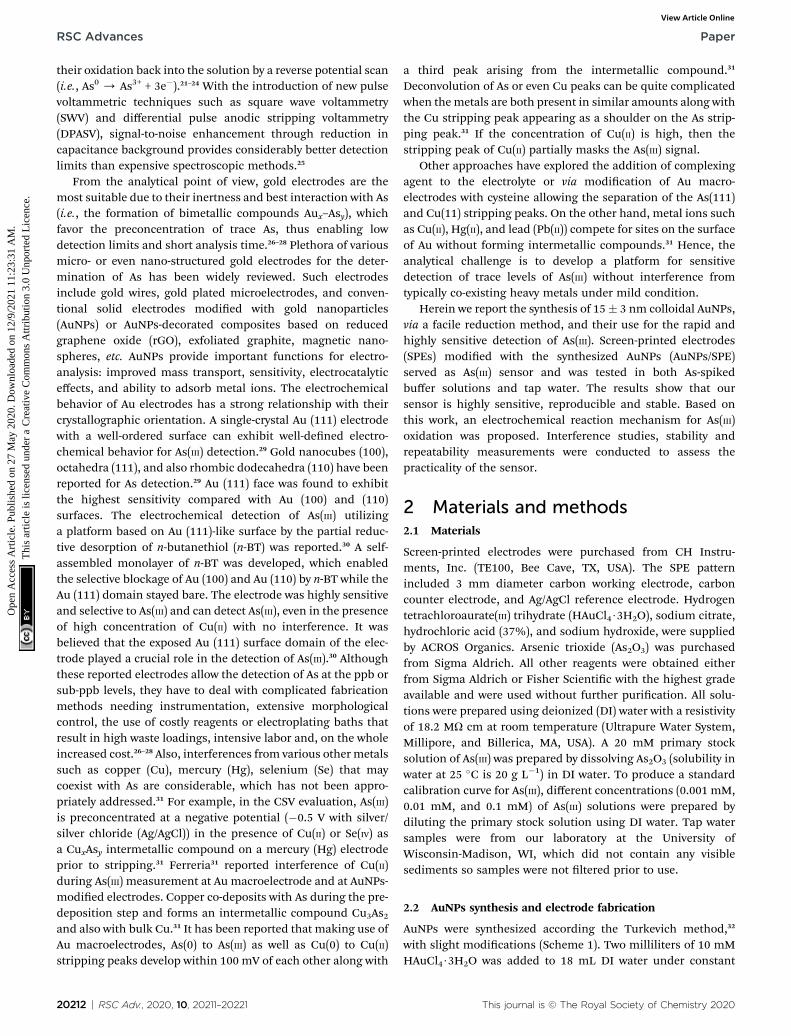
Scheme 1 Steps in synthesis of quasi-hexagonal AuNPs.
Paper RSC Advances
Ope
n A
cces
s A
rtic
le. P
ublis
hed
on 2
7 M
ay 2
020.
Dow
nloa
ded
on 1
2/9/
2021
11:
23:3
1 A
M.
Thi
s ar
ticle
is li
cens
ed u
nder
a C
reat
ive
Com
mon
s A
ttrib
utio
n 3.
0 U
npor
ted
Lic
ence
.View Article Online
stirring and the solution was brought to a boil. To this, 2 mL of1% sodium citrate was added under stirring in an Erlenmeyerask with stopper. The solution turned dark brown within 10 sand then to burgundy in 60 s, which signied the formation ofAuNPs. The solution was cooled to room temperature and wasstored in a refrigerator under dark conditions. The workingelectrode of SPE was modied with AuNPs by drop casting 10 mLof the colloidal AuNPs solution and allowing to air dry at roomtemperature.
2.3 Instrumentation and measurements
X-ray photoelectron spectroscopy (XPS) was performed(Thermo Scientic K Alpha instrument) to analyze thesurface chemical composition and elemental distribution.High resolution transmission electron microscopy (HRTEM)images were obtained with JEOL JEM-2100F to study themorphology of the synthesized AuNPs. UV-vis absorptionspectra were recorded at room temperature on a spectro-photometer (Lambda 25, PerkinElmer). Dynamic light scat-tering (DLS) measurements were performed to determinethe average size of the AuNPs using a Nanoparticle Analyzer(NanoBrook 90Plus, Brookhaven Instruments). Electro-chemical experiments were performed using CHI-660Delectrochemical workstation (CHI Instruments Inc.) in thepresence of 0.1 M phosphate buffered saline (PBS) solution.A micro-pipette (Eppendorf Research plus) was utilized toinject the analyte solution into PBS. To investigate theelectrocatalytic behavior of the AuNPs-modied electrodes,cyclic voltammetry (CV) was performed in 1.0 M H2SO4 andalso in 1.0 M NaOH at 50 mV s�1. The following parameterswere used for performing DPASV: increment, 0.01 V;amplitude, 0.05 V; pulse width, 0.2 s; sampling width,0.005 s; pulse period, 0.5 s; and frequency, 50 Hz. Differentdeposition times of 30, 60, 120, and 180 s were examined
This journal is © The Royal Society of Chemistry 2020
with standard additions of As(III). With the increase ofdeposition time, the peak heights increased linearly. Whilefor the detection of low concentrations of As(III), the depo-sition time can be prolonged; however, for high concentra-tions, short deposition time should be used to avoid thesaturation of the electrode surface. A deposition potential(optimized) of �0.8 V for 180 s was used for the followingexperiments. The assembled sensor setup is shown inScheme S1 (ESI†).
3 Results and discussion3.1 Role of the pH of reaction mixture
The approved mechanism of the Turkevich approach for thesynthesis of AuNPs consists of the initial redox reaction (R1),where Au(III) gets reduced to Au(I) by citrate, which in turn getsoxidized to acetone dicarboxylate (DC2�), the conjugated base ofdicarboxyacetone (DCA). This rst redox step is considered therate-determining step. Consecutively, a disproportionationreaction (R2) occurs, where Au(0) and Au(III) are produced(Scheme S2†).33–36 We have demonstrated that, the pH of themedium inevitably determines the reaction rate of the reduc-tion, which is the rate-limiting step in the AuNPs formation andentails decarboxylation of the citrate. The mechanisms supportthe nding that the more acidic the medium, the faster thereduction rate. The AuNPs formation is quicker at pH ¼ 4.7(�3 min to complete reaction) than at pH¼ 5.6 (�5 min), and atnear neutral pH ¼ 6.5 the reaction is not complete aer morethan 7 min.33–36 This pH effect is related to the hydrolysis of thecitrate and chloroauric species, since HCit2� is the strongestreducing species, whose concentration is maximal at pH 5.6.Similarly, AuCl4
� is the most reactive Au precursor comparedwith its hydrolyzed species at high pH values (AuCl3(OH)�,AuCl2(OH)2
�, AuCl(OH)3� and Au(OH)4
�). As a result, thereaction, especially the nucleation stage, is much faster at pH�3.7–6.5, compared with pH of �6.5–7.7.33–36 In our method,the R1 has a pH range of chloroauric acid solution and mixedsolution to be 3.27 and 3.65, and the pH of the nal solutionbetween 5.2 and 5.4, which enabled faster reaction rate for thereduction of AuNPs compared to conventional Turkevichmethod.
3.2 Characterization of AuNPs
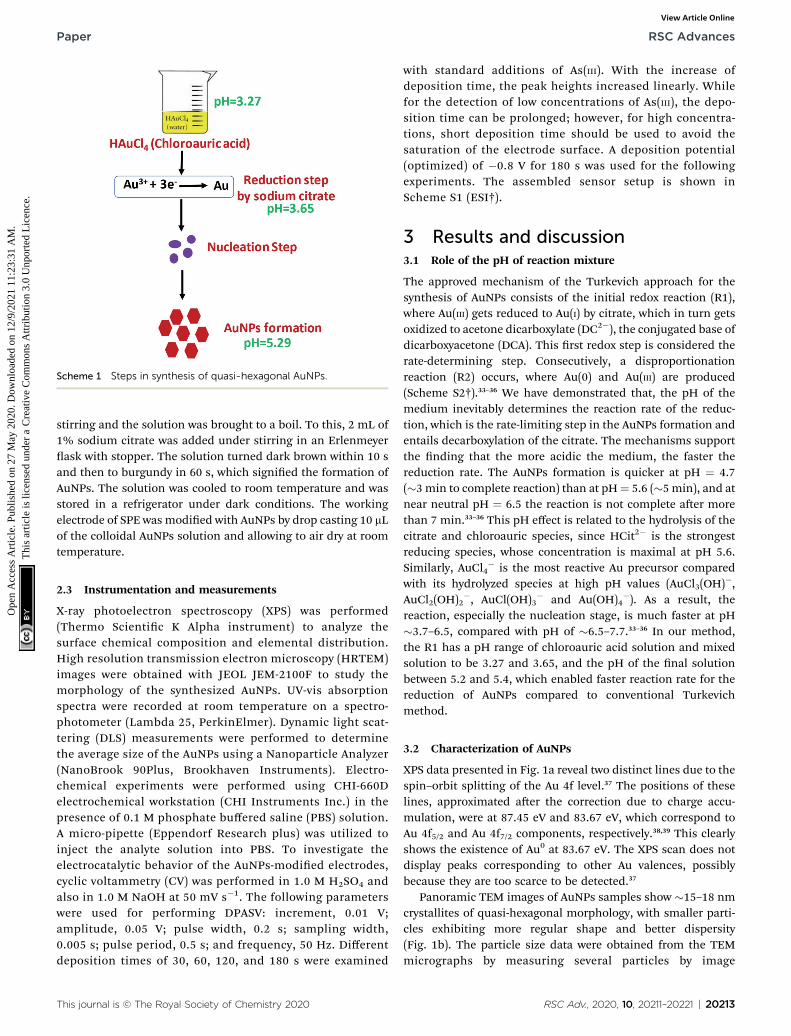
XPS data presented in Fig. 1a reveal two distinct lines due to thespin–orbit splitting of the Au 4f level.37 The positions of theselines, approximated aer the correction due to charge accu-mulation, were at 87.45 eV and 83.67 eV, which correspond toAu 4f5/2 and Au 4f7/2 components, respectively.38,39 This clearlyshows the existence of Au0 at 83.67 eV. The XPS scan does notdisplay peaks corresponding to other Au valences, possiblybecause they are too scarce to be detected.37
Panoramic TEM images of AuNPs samples show �15–18 nmcrystallites of quasi-hexagonal morphology, with smaller parti-cles exhibiting more regular shape and better dispersity(Fig. 1b). The particle size data were obtained from the TEMmicrographs by measuring several particles by image
RSC Adv., 2020, 10, 20211–20221 | 20213
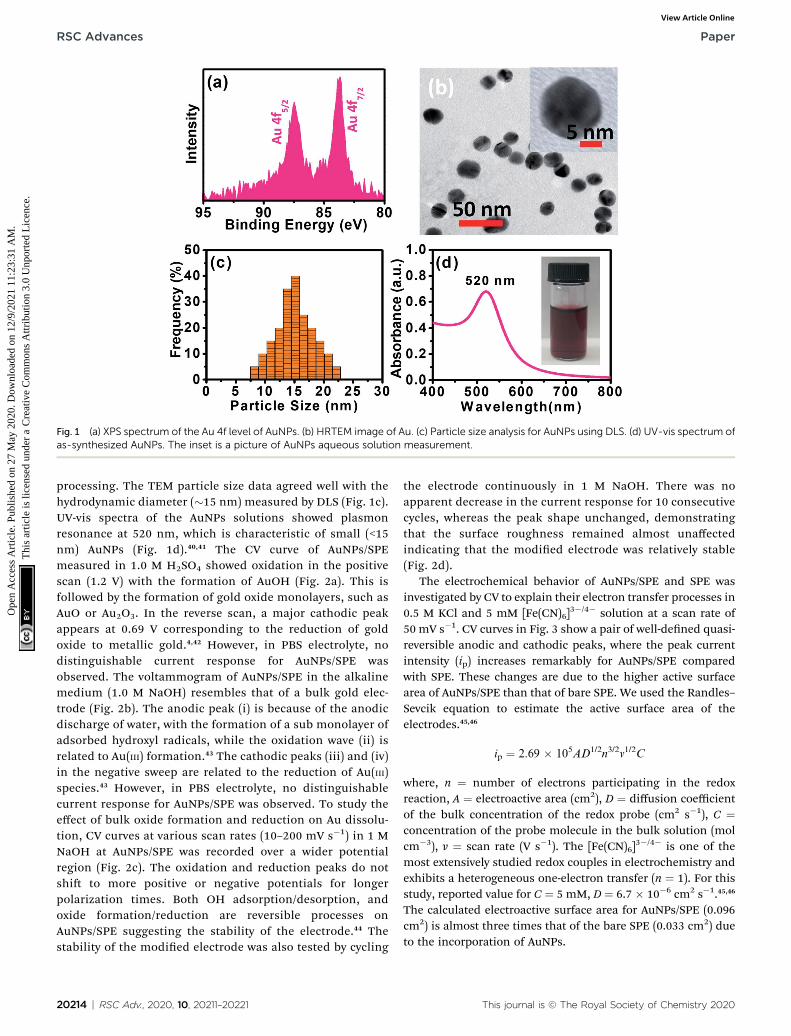
Fig. 1 (a) XPS spectrum of the Au 4f level of AuNPs. (b) HRTEM image of Au. (c) Particle size analysis for AuNPs using DLS. (d) UV-vis spectrum ofas-synthesized AuNPs. The inset is a picture of AuNPs aqueous solution measurement.
RSC Advances Paper
Ope
n A
cces
s A
rtic
le. P
ublis
hed
on 2
7 M
ay 2
020.
Dow
nloa
ded
on 1
2/9/
2021
11:
23:3
1 A
M.
Thi
s ar
ticle
is li
cens
ed u
nder
a C
reat
ive
Com
mon
s A
ttrib
utio
n 3.
0 U
npor
ted
Lic
ence
.View Article Online
processing. The TEM particle size data agreed well with thehydrodynamic diameter (�15 nm) measured by DLS (Fig. 1c).UV-vis spectra of the AuNPs solutions showed plasmonresonance at 520 nm, which is characteristic of small (<15nm) AuNPs (Fig. 1d).40,41 The CV curve of AuNPs/SPEmeasured in 1.0 M H2SO4 showed oxidation in the positivescan (1.2 V) with the formation of AuOH (Fig. 2a). This isfollowed by the formation of gold oxide monolayers, such asAuO or Au2O3. In the reverse scan, a major cathodic peakappears at 0.69 V corresponding to the reduction of goldoxide to metallic gold.4,42 However, in PBS electrolyte, nodistinguishable current response for AuNPs/SPE wasobserved. The voltammogram of AuNPs/SPE in the alkalinemedium (1.0 M NaOH) resembles that of a bulk gold elec-trode (Fig. 2b). The anodic peak (i) is because of the anodicdischarge of water, with the formation of a sub monolayer ofadsorbed hydroxyl radicals, while the oxidation wave (ii) isrelated to Au(III) formation.43 The cathodic peaks (iii) and (iv)in the negative sweep are related to the reduction of Au(III)species.43 However, in PBS electrolyte, no distinguishablecurrent response for AuNPs/SPE was observed. To study theeffect of bulk oxide formation and reduction on Au dissolu-tion, CV curves at various scan rates (10–200 mV s�1) in 1 MNaOH at AuNPs/SPE was recorded over a wider potentialregion (Fig. 2c). The oxidation and reduction peaks do notshi to more positive or negative potentials for longerpolarization times. Both OH adsorption/desorption, andoxide formation/reduction are reversible processes onAuNPs/SPE suggesting the stability of the electrode.44 Thestability of the modied electrode was also tested by cycling
20214 | RSC Adv., 2020, 10, 20211–20221
the electrode continuously in 1 M NaOH. There was noapparent decrease in the current response for 10 consecutivecycles, whereas the peak shape unchanged, demonstratingthat the surface roughness remained almost unaffectedindicating that the modied electrode was relatively stable(Fig. 2d).
The electrochemical behavior of AuNPs/SPE and SPE wasinvestigated by CV to explain their electron transfer processes in0.5 M KCl and 5 mM [Fe(CN)6]
3�/4� solution at a scan rate of50 mV s�1. CV curves in Fig. 3 show a pair of well-dened quasi-reversible anodic and cathodic peaks, where the peak currentintensity (ip) increases remarkably for AuNPs/SPE comparedwith SPE. These changes are due to the higher active surfacearea of AuNPs/SPE than that of bare SPE. We used the Randles–Sevcik equation to estimate the active surface area of theelectrodes.45,46
ip ¼ 2.69 � 105AD1/2n3/2v1/2C
where, n ¼ number of electrons participating in the redoxreaction, A ¼ electroactive area (cm2), D ¼ diffusion coefficientof the bulk concentration of the redox probe (cm2 s�1), C ¼concentration of the probe molecule in the bulk solution (molcm�3), v ¼ scan rate (V s�1). The [Fe(CN)6]
3�/4� is one of themost extensively studied redox couples in electrochemistry andexhibits a heterogeneous one-electron transfer (n ¼ 1). For thisstudy, reported value for C ¼ 5 mM, D ¼ 6.7 � 10�6 cm2 s�1.45,46
The calculated electroactive surface area for AuNPs/SPE (0.096cm2) is almost three times that of the bare SPE (0.033 cm2) dueto the incorporation of AuNPs.
This journal is © The Royal Society of Chemistry 2020
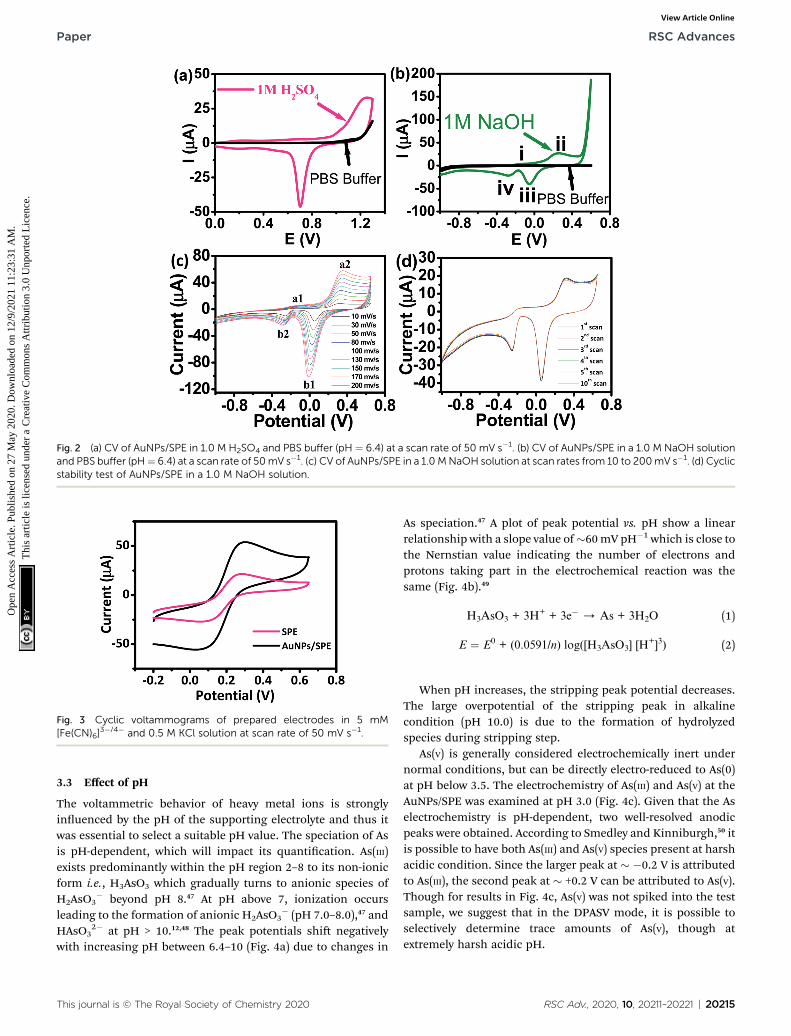
Fig. 2 (a) CV of AuNPs/SPE in 1.0 M H2SO4 and PBS buffer (pH ¼ 6.4) at a scan rate of 50 mV s�1. (b) CV of AuNPs/SPE in a 1.0 M NaOH solutionand PBS buffer (pH¼ 6.4) at a scan rate of 50mV s�1. (c) CV of AuNPs/SPE in a 1.0 MNaOH solution at scan rates from 10 to 200mV s�1. (d) Cyclicstability test of AuNPs/SPE in a 1.0 M NaOH solution.
Fig. 3 Cyclic voltammograms of prepared electrodes in 5 mM[Fe(CN)6]
3�/4� and 0.5 M KCl solution at scan rate of 50 mV s�1.
Paper RSC Advances
Ope
n A
cces
s A
rtic
le. P
ublis
hed
on 2
7 M
ay 2
020.
Dow
nloa
ded
on 1
2/9/
2021
11:
23:3
1 A
M.
Thi
s ar
ticle
is li
cens
ed u
nder
a C
reat
ive
Com
mon
s A
ttrib
utio
n 3.
0 U
npor
ted
Lic
ence
.View Article Online
3.3 Effect of pH
The voltammetric behavior of heavy metal ions is stronglyinuenced by the pH of the supporting electrolyte and thus itwas essential to select a suitable pH value. The speciation of Asis pH-dependent, which will impact its quantication. As(III)exists predominantly within the pH region 2–8 to its non-ionicform i.e., H3AsO3 which gradually turns to anionic species ofH2AsO3
� beyond pH 8.47 At pH above 7, ionization occursleading to the formation of anionic H2AsO3
� (pH 7.0–8.0),47 andHAsO3
2� at pH > 10.12,48 The peak potentials shi negativelywith increasing pH between 6.4–10 (Fig. 4a) due to changes in
This journal is © The Royal Society of Chemistry 2020
As speciation.47 A plot of peak potential vs. pH show a linearrelationship with a slope value of�60mV pH�1 which is close tothe Nernstian value indicating the number of electrons andprotons taking part in the electrochemical reaction was thesame (Fig. 4b).49
H3AsO3 + 3H+ + 3e� / As + 3H2O (1)
E ¼ E0 + (0.0591/n) log([H3AsO3] [H+]3) (2)
When pH increases, the stripping peak potential decreases.The large overpotential of the stripping peak in alkalinecondition (pH 10.0) is due to the formation of hydrolyzedspecies during stripping step.
As(V) is generally considered electrochemically inert undernormal conditions, but can be directly electro-reduced to As(0)at pH below 3.5. The electrochemistry of As(III) and As(V) at theAuNPs/SPE was examined at pH 3.0 (Fig. 4c). Given that the Aselectrochemistry is pH-dependent, two well-resolved anodicpeaks were obtained. According to Smedley and Kinniburgh,50 itis possible to have both As(III) and As(V) species present at harshacidic condition. Since the larger peak at � �0.2 V is attributedto As(III), the second peak at � +0.2 V can be attributed to As(V).Though for results in Fig. 4c, As(V) was not spiked into the testsample, we suggest that in the DPASV mode, it is possible toselectively determine trace amounts of As(V), though atextremely harsh acidic pH.
RSC Adv., 2020, 10, 20211–20221 | 20215
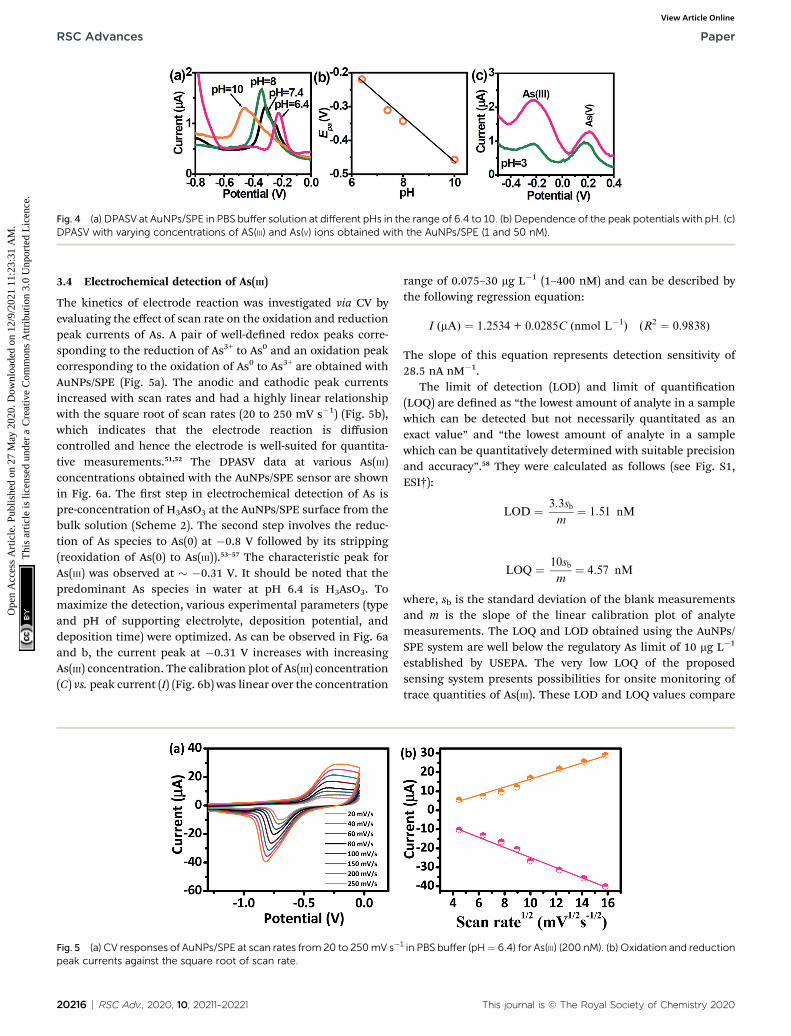
Fig. 4 (a) DPASV at AuNPs/SPE in PBS buffer solution at different pHs in the range of 6.4 to 10. (b) Dependence of the peak potentials with pH. (c)DPASV with varying concentrations of AS(III) and As(V) ions obtained with the AuNPs/SPE (1 and 50 nM).
RSC Advances Paper
Ope
n A
cces
s A
rtic
le. P
ublis
hed
on 2
7 M
ay 2
020.
Dow
nloa
ded
on 1
2/9/
2021
11:
23:3
1 A
M.
Thi
s ar
ticle
is li
cens
ed u
nder
a C
reat
ive
Com
mon
s A
ttrib
utio
n 3.
0 U
npor
ted
Lic
ence
.View Article Online
3.4 Electrochemical detection of As(III)
The kinetics of electrode reaction was investigated via CV byevaluating the effect of scan rate on the oxidation and reductionpeak currents of As. A pair of well-dened redox peaks corre-sponding to the reduction of As3+ to As0 and an oxidation peakcorresponding to the oxidation of As0 to As3+ are obtained withAuNPs/SPE (Fig. 5a). The anodic and cathodic peak currentsincreased with scan rates and had a highly linear relationshipwith the square root of scan rates (20 to 250 mV s�1) (Fig. 5b),which indicates that the electrode reaction is diffusioncontrolled and hence the electrode is well-suited for quantita-tive measurements.51,52 The DPASV data at various As(III)concentrations obtained with the AuNPs/SPE sensor are shownin Fig. 6a. The rst step in electrochemical detection of As ispre-concentration of H3AsO3 at the AuNPs/SPE surface from thebulk solution (Scheme 2). The second step involves the reduc-tion of As species to As(0) at �0.8 V followed by its stripping(reoxidation of As(0) to As(III)).53–57 The characteristic peak forAs(III) was observed at � �0.31 V. It should be noted that thepredominant As species in water at pH 6.4 is H3AsO3. Tomaximize the detection, various experimental parameters (typeand pH of supporting electrolyte, deposition potential, anddeposition time) were optimized. As can be observed in Fig. 6aand b, the current peak at �0.31 V increases with increasingAs(III) concentration. The calibration plot of As(III) concentration(C) vs. peak current (I) (Fig. 6b) was linear over the concentration
Fig. 5 (a) CV responses of AuNPs/SPE at scan rates from 20 to 250mV s�
peak currents against the square root of scan rate.
20216 | RSC Adv., 2020, 10, 20211–20221
range of 0.075–30 mg L�1 (1–400 nM) and can be described bythe following regression equation:
I (mA) ¼ 1.2534 + 0.0285C (nmol L�1) (R2 ¼ 0.9838)
The slope of this equation represents detection sensitivity of28.5 nA nM�1.
The limit of detection (LOD) and limit of quantication(LOQ) are dened as “the lowest amount of analyte in a samplewhich can be detected but not necessarily quantitated as anexact value” and “the lowest amount of analyte in a samplewhich can be quantitatively determined with suitable precisionand accuracy”.58 They were calculated as follows (see Fig. S1,ESI†):
LOD ¼ 3:3sbm
¼ 1:51 nM
LOQ ¼ 10sb
m¼ 4:57 nM
where, sb is the standard deviation of the blank measurementsand m is the slope of the linear calibration plot of analytemeasurements. The LOQ and LOD obtained using the AuNPs/SPE system are well below the regulatory As limit of 10 mg L�1
established by USEPA. The very low LOQ of the proposedsensing system presents possibilities for onsite monitoring oftrace quantities of As(III). These LOD and LOQ values compare
1 in PBS buffer (pH¼ 6.4) for As(III) (200 nM). (b) Oxidation and reduction
This journal is © The Royal Society of Chemistry 2020
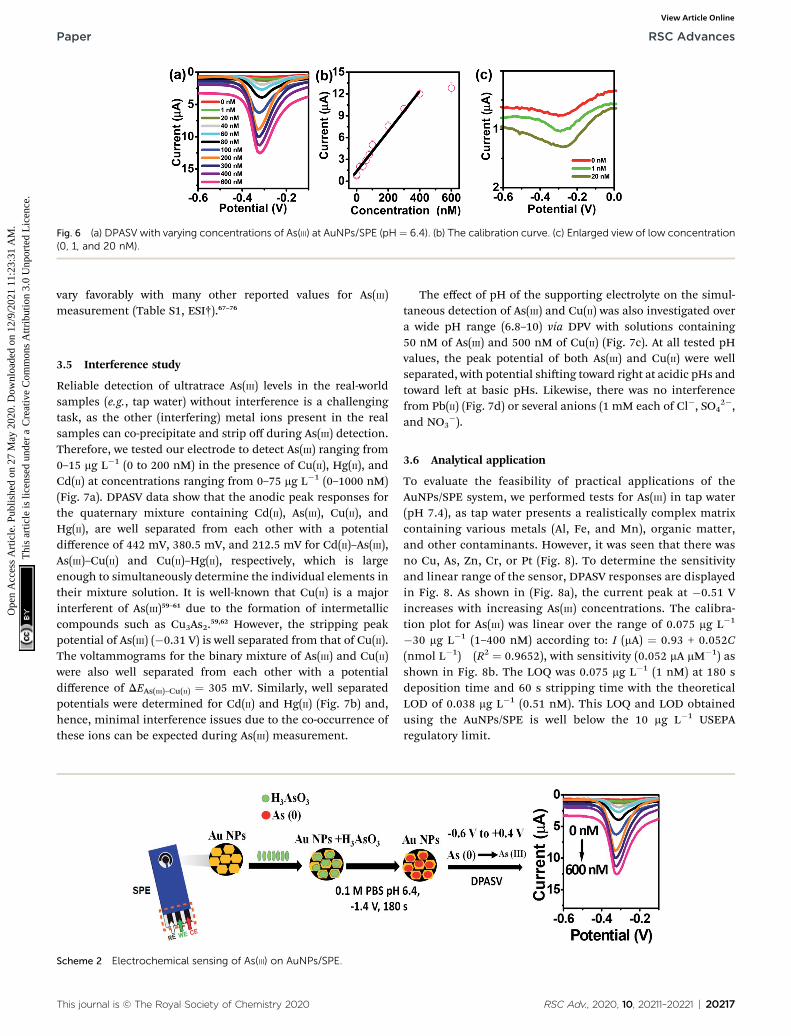
Fig. 6 (a) DPASV with varying concentrations of As(III) at AuNPs/SPE (pH ¼ 6.4). (b) The calibration curve. (c) Enlarged view of low concentration(0, 1, and 20 nM).
Paper RSC Advances
Ope
n A
cces
s A
rtic
le. P
ublis
hed
on 2
7 M
ay 2
020.
Dow
nloa
ded
on 1
2/9/
2021
11:
23:3
1 A
M.
Thi
s ar
ticle
is li
cens
ed u
nder
a C
reat
ive
Com
mon
s A
ttrib
utio
n 3.
0 U
npor
ted
Lic
ence
.View Article Online
vary favorably with many other reported values for As(III)measurement (Table S1, ESI†).67–76
3.5 Interference study
Reliable detection of ultratrace As(III) levels in the real-worldsamples (e.g., tap water) without interference is a challengingtask, as the other (interfering) metal ions present in the realsamples can co-precipitate and strip off during As(III) detection.Therefore, we tested our electrode to detect As(III) ranging from0–15 mg L�1 (0 to 200 nM) in the presence of Cu(II), Hg(II), andCd(II) at concentrations ranging from 0–75 mg L�1 (0–1000 nM)(Fig. 7a). DPASV data show that the anodic peak responses forthe quaternary mixture containing Cd(II), As(III), Cu(II), andHg(II), are well separated from each other with a potentialdifference of 442 mV, 380.5 mV, and 212.5 mV for Cd(II)–As(III),As(III)–Cu(II) and Cu(II)–Hg(II), respectively, which is largeenough to simultaneously determine the individual elements intheir mixture solution. It is well-known that Cu(II) is a majorinterferent of As(III)59–61 due to the formation of intermetalliccompounds such as Cu3As2.59,62 However, the stripping peakpotential of As(III) (�0.31 V) is well separated from that of Cu(II).The voltammograms for the binary mixture of As(III) and Cu(II)were also well separated from each other with a potentialdifference of DEAs(III)–Cu(II) ¼ 305 mV. Similarly, well separatedpotentials were determined for Cd(II) and Hg(II) (Fig. 7b) and,hence, minimal interference issues due to the co-occurrence ofthese ions can be expected during As(III) measurement.
Scheme 2 Electrochemical sensing of As(III) on AuNPs/SPE.
This journal is © The Royal Society of Chemistry 2020
The effect of pH of the supporting electrolyte on the simul-taneous detection of As(III) and Cu(II) was also investigated overa wide pH range (6.8–10) via DPV with solutions containing50 nM of As(III) and 500 nM of Cu(II) (Fig. 7c). At all tested pHvalues, the peak potential of both As(III) and Cu(II) were wellseparated, with potential shiing toward right at acidic pHs andtoward le at basic pHs. Likewise, there was no interferencefrom Pb(II) (Fig. 7d) or several anions (1 mM each of Cl�, SO4
2�,and NO3
�).
3.6 Analytical application
To evaluate the feasibility of practical applications of theAuNPs/SPE system, we performed tests for As(III) in tap water(pH 7.4), as tap water presents a realistically complex matrixcontaining various metals (Al, Fe, and Mn), organic matter,and other contaminants. However, it was seen that there wasno Cu, As, Zn, Cr, or Pt (Fig. 8). To determine the sensitivityand linear range of the sensor, DPASV responses are displayedin Fig. 8. As shown in (Fig. 8a), the current peak at �0.51 Vincreases with increasing As(III) concentrations. The calibra-tion plot for As(III) was linear over the range of 0.075 mg L�1
�30 mg L�1 (1–400 nM) according to: I (mA) ¼ 0.93 + 0.052C(nmol L�1) (R2 ¼ 0.9652), with sensitivity (0.052 mA mM�1) asshown in Fig. 8b. The LOQ was 0.075 mg L�1 (1 nM) at 180 sdeposition time and 60 s stripping time with the theoreticalLOD of 0.038 mg L�1 (0.51 nM). This LOQ and LOD obtainedusing the AuNPs/SPE is well below the 10 mg L�1 USEPAregulatory limit.
RSC Adv., 2020, 10, 20211–20221 | 20217
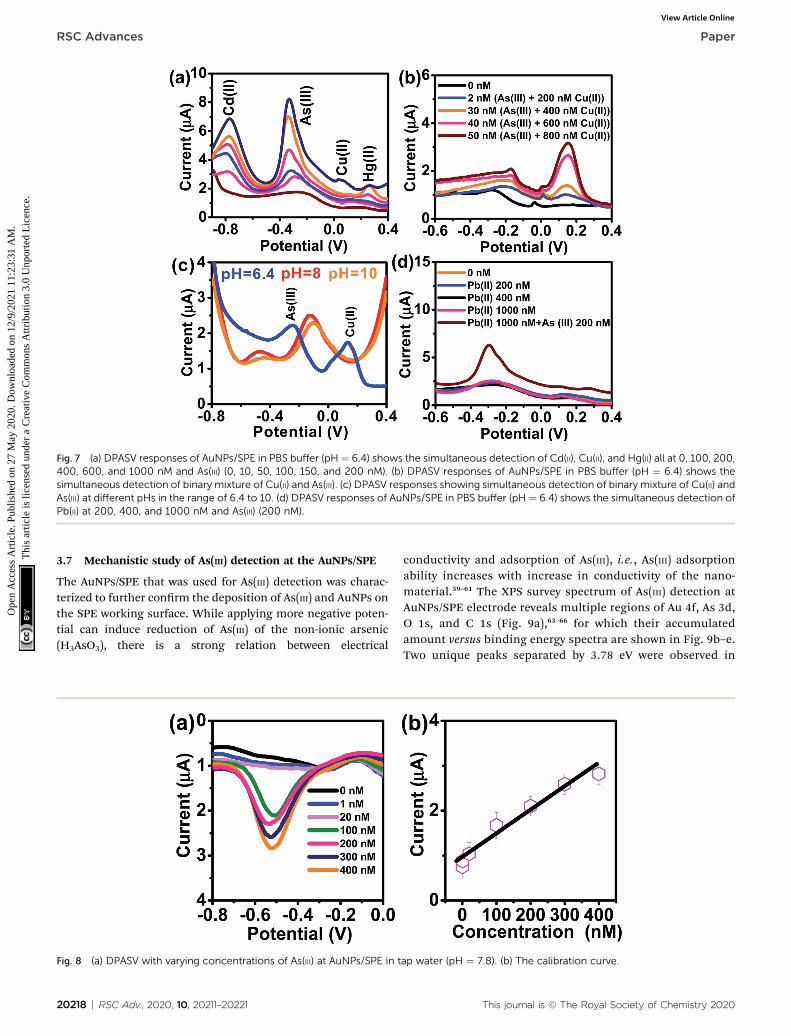
Fig. 7 (a) DPASV responses of AuNPs/SPE in PBS buffer (pH ¼ 6.4) shows the simultaneous detection of Cd(II), Cu(II), and Hg(II) all at 0, 100, 200,400, 600, and 1000 nM and As(III) (0, 10, 50, 100, 150, and 200 nM). (b) DPASV responses of AuNPs/SPE in PBS buffer (pH ¼ 6.4) shows thesimultaneous detection of binary mixture of Cu(II) and As(III). (c) DPASV responses showing simultaneous detection of binary mixture of Cu(II) andAs(III) at different pHs in the range of 6.4 to 10. (d) DPASV responses of AuNPs/SPE in PBS buffer (pH ¼ 6.4) shows the simultaneous detection ofPb(II) at 200, 400, and 1000 nM and As(III) (200 nM).
RSC Advances Paper
Ope
n A
cces
s A
rtic
le. P
ublis
hed
on 2
7 M
ay 2
020.
Dow
nloa
ded
on 1
2/9/
2021
11:
23:3
1 A
M.
Thi
s ar
ticle
is li
cens
ed u
nder
a C
reat
ive
Com
mon
s A
ttrib
utio
n 3.
0 U
npor
ted
Lic
ence
.View Article Online
3.7 Mechanistic study of As(III) detection at the AuNPs/SPE
The AuNPs/SPE that was used for As(III) detection was charac-terized to further conrm the deposition of As(III) and AuNPs onthe SPE working surface. While applying more negative poten-tial can induce reduction of As(III) of the non-ionic arsenic(H3AsO3), there is a strong relation between electrical
Fig. 8 (a) DPASV with varying concentrations of As(III) at AuNPs/SPE in t
20218 | RSC Adv., 2020, 10, 20211–20221
conductivity and adsorption of As(III), i.e., As(III) adsorptionability increases with increase in conductivity of the nano-material.59–61 The XPS survey spectrum of As(III) detection atAuNPs/SPE electrode reveals multiple regions of Au 4f, As 3d,O 1s, and C 1s (Fig. 9a),63–66 for which their accumulatedamount versus binding energy spectra are shown in Fig. 9b–e.Two unique peaks separated by 3.78 eV were observed in
ap water (pH ¼ 7.8). (b) The calibration curve.
This journal is © The Royal Society of Chemistry 2020
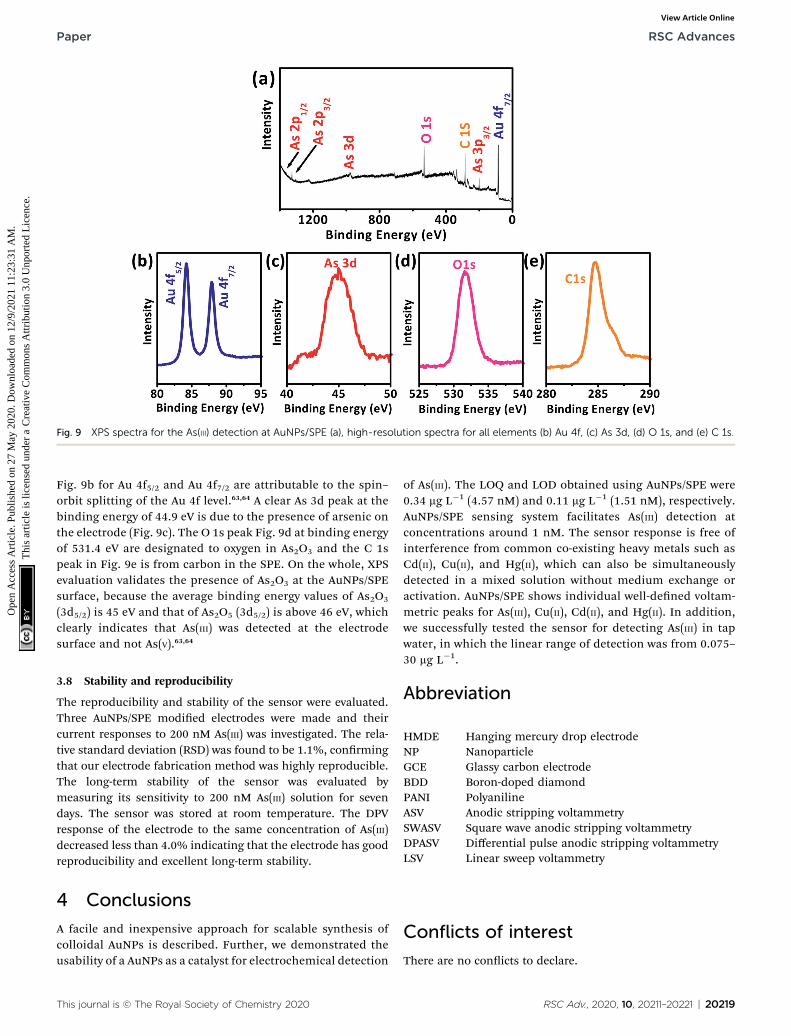
Fig. 9 XPS spectra for the As(III) detection at AuNPs/SPE (a), high-resolution spectra for all elements (b) Au 4f, (c) As 3d, (d) O 1s, and (e) C 1s.
Paper RSC Advances
Ope
n A
cces
s A
rtic
le. P
ublis
hed
on 2
7 M
ay 2
020.
Dow
nloa
ded
on 1
2/9/
2021
11:
23:3
1 A
M.
Thi
s ar
ticle
is li
cens
ed u
nder
a C
reat
ive
Com
mon
s A
ttrib
utio
n 3.
0 U
npor
ted
Lic
ence
.View Article Online
Fig. 9b for Au 4f5/2 and Au 4f7/2 are attributable to the spin–orbit splitting of the Au 4f level.63,64 A clear As 3d peak at thebinding energy of 44.9 eV is due to the presence of arsenic onthe electrode (Fig. 9c). The O 1s peak Fig. 9d at binding energyof 531.4 eV are designated to oxygen in As2O3 and the C 1speak in Fig. 9e is from carbon in the SPE. On the whole, XPSevaluation validates the presence of As2O3 at the AuNPs/SPEsurface, because the average binding energy values of As2O3
(3d5/2) is 45 eV and that of As2O5 (3d5/2) is above 46 eV, whichclearly indicates that As(III) was detected at the electrodesurface and not As(V).63,64
3.8 Stability and reproducibility
The reproducibility and stability of the sensor were evaluated.Three AuNPs/SPE modied electrodes were made and theircurrent responses to 200 nM As(III) was investigated. The rela-tive standard deviation (RSD) was found to be 1.1%, conrmingthat our electrode fabrication method was highly reproducible.The long-term stability of the sensor was evaluated bymeasuring its sensitivity to 200 nM As(III) solution for sevendays. The sensor was stored at room temperature. The DPVresponse of the electrode to the same concentration of As(III)decreased less than 4.0% indicating that the electrode has goodreproducibility and excellent long-term stability.
4 Conclusions
A facile and inexpensive approach for scalable synthesis ofcolloidal AuNPs is described. Further, we demonstrated theusability of a AuNPs as a catalyst for electrochemical detection
This journal is © The Royal Society of Chemistry 2020
of As(III). The LOQ and LOD obtained using AuNPs/SPE were0.34 mg L�1 (4.57 nM) and 0.11 mg L�1 (1.51 nM), respectively.AuNPs/SPE sensing system facilitates As(III) detection atconcentrations around 1 nM. The sensor response is free ofinterference from common co-existing heavy metals such asCd(II), Cu(II), and Hg(II), which can also be simultaneouslydetected in a mixed solution without medium exchange oractivation. AuNPs/SPE shows individual well-dened voltam-metric peaks for As(III), Cu(II), Cd(II), and Hg(II). In addition,we successfully tested the sensor for detecting As(III) in tapwater, in which the linear range of detection was from 0.075–30 mg L�1.
Abbreviation
HMDE
Hanging mercury drop electrode NP Nanoparticle GCE Glassy carbon electrode BDD Boron-doped diamond PANI Polyaniline ASV Anodic stripping voltammetry SWASV Square wave anodic stripping voltammetry DPASV Differential pulse anodic stripping voltammetry LSV Linear sweep voltammetryConflicts of interest
There are no conicts to declare.
RSC Adv., 2020, 10, 20211–20221 | 20219
RSC Advances Paper
Ope
n A
cces
s A
rtic
le. P
ublis
hed
on 2
7 M
ay 2
020.
Dow
nloa
ded
on 1
2/9/
2021
11:
23:3
1 A
M.
Thi
s ar
ticle
is li
cens
ed u
nder
a C
reat
ive
Com
mon
s A
ttrib
utio
n 3.
0 U
npor
ted
Lic
ence
.View Article Online
Acknowledgements
The authors gratefully thank Jiehao Guan for his assistance withXPS measurements and Omer Sadak for his assistance withobtaining HRTEM images.
References
1 S. K. Acharyya, P. Chakraborty, S. Lahiri, B. C. Raymahashay,S. Guha and A. Bhowmik, Nature, 1999, 401, 545.
2 R. Nickson, J. McArthur, W. Burgess, K. M. Ahmed,P. Ravenscro and M. Rahman, Nature, 1998, 395, 338.
3 W. R. Cullen and K. J. Reimer, Chem. Rev., 1989, 89, 713–764.4 F. S. Islam, A. G. Gault, C. Boothman, D. A. Polya,J. M. Charnock, D. Chatterjee and J. R. Lloyd, Nature, 2004,430, 68–71.
5 X. Dai, O. Nekraseova, M. E. Hyde and R. G. Compton, Anal.Chem., 2004, 76, 5924–5929.
6 T. L. Colliver and A. G. Ewing, Encyclopedia of AnalyticalChemistry, 2000, pp. 1–25.
7 J.-M. Zen, P.-Y. Chen and A. S. Kumar, Anal. Chem., 2003, 75,6017–6022.
8 G. Forsberg, J. W. O'Laughlin, R. G. Megargle andS. R. Koirtyihann, Anal. Chem., 1975, 47, 1586–1592.
9 C. R. Lage, A. Nayak and C. H. Kim, Integr. Comp. Biol., 2006,46, 1040–1054.
10 X. Li, C. Liu, F. Li, Y. Li, L. Zhang, C. Liu and Y. Zhou, J.Hazard. Mater., 2010, 173, 675–681.
11 G. Tremiliosi-Filho, L. H. Dall'Antonia and G. Jerkiewicz, J.Electroanal. Chem., 2005, 578, 1–8.
12 R. Sitko, P. Janik, B. Zawisza, E. Talik, E. Margui andI. Queralt, Anal. Chem., 2015, 87, 3535–3542.
13 C. B'Hymer and J. A. Caruso, J. Chromatogr. A, 2004, 1045, 1–13.
14 Q. Liu, H. Peng, X. Lu and X. C. Le, Anal. Chim. Acta, 2015,888, 1–9.
15 S. Musil, A. H. Petursdottir, A. Raab, H. Gunnlaugsdottir,E. Krupp and J. Feldmann, Anal. Chem., 2014, 86, 993–999.
16 M. Kim, H.-J. Um, S. Bang, S.-H. Lee, S.-J. Oh, J.-H. Han,K.-W. Kim, J. Min and Y.-H. Kim, Environ. Sci. Technol.,2009, 43, 9335–9340.
17 Y. Wu, S. Zhan, F. Wang, L. He, W. Zhi and P. Zhou, Chem.Commun., 2012, 48, 4459–4461.
18 M. U. Anu Prathap, C. Ivan Rodrıguez, O. Sadak, J. Guan,V. Setaluri and S. Gunasekaran, Chem. Commun., 2018, 54,710–714.
19 M. U. Anu Prathap, B. Kaur and R. Srivastava, Chem. Rec.,2018, 18, 1–26.
20 Z.-G. Liu and X.-J. Huang, TrAC, Trends Anal. Chem., 2014, 60,25–35.
21 A. Profumo, D. Merli and M. Pesavento, Anal. Chim. Acta,2005, 539, 245–250.
22 M. Zaib, M. M. Athar, A. Saeed and U. Farooq, Biosens.Bioelectron., 2015, 74, 895–908.
23 R. Piech and W. W. Kubiak, J. Electroanal. Chem., 2007, 599,59–64.
20220 | RSC Adv., 2020, 10, 20211–20221
24 Y. Rao, R. H. Li and D. Q. Zhang, Sci. China: Life Sci., 2013,56, 495–502.
25 E. Majid, S. Hrapovic, Y. Liu, K. B. Male and J. H. T. Luong,Anal. Chem., 2006, 78, 762–769.
26 M. Stoytcheva, V. Sharkova and M. Panayotova, Anal. Chim.Acta, 1998, 364, 195–201.
27 S. Cosnier, C. Mousty, X. Cui, X. Yang and S. Dong, Anal.Chem., 2006, 78, 4985–4989.
28 T. Wang, R. D. Milton, S. Abdellaoui, D. P. Hickey andS. D. Minteer, Anal. Chem., 2016, 88, 3243–3248.
29 D.-D. Han, S.-S. Li, Z. Guo, X. Chen, J.-H. Liu and X.-J. Huang,RSC Adv., 2016, 6, 30337–30344.
30 M. R. Rahman, T. Okajima and T. Ohsaka, Anal. Chem., 2010,82, 9169–9176.
31 M. A. Ferreira and A. A. Barros, Anal. Chim. Acta, 2002, 459,151–159.
32 J. Turkevich, P. C. Stevenson and J. Hillier, Discuss. FaradaySoc., 1951, 11, 55–75.
33 B. Bartosewicz, K. Bujno, M. Liszewska, B. Budner,P. Bazarnik, T. Płocinski and B. J. Jankiewicz, ColloidsSurf., A, 2018, 549, 25–33.
34 L. Shi, E. Buhler, F. Boue and F. Carn, J. Colloid Interface Sci.,2017, 492, 191–198.
35 I. Ojea-Jimenez and J. M. Campanera, J. Phys. Chem. C, 2012,116(44), 23682–23691.
36 S. K. Sivaraman, S. Kumar and V. Santhanam, J. ColloidInterface Sci., 2011, 361, 543–547.
37 J. F. Moulder,Handbook of X-ray Photoelectron Spectroscopy: AReference Book of Standard Spectra for Identication andInterpretation of XPS Data, Physical Electronics Division,Perkin-Elmer Corporation, 1992.
38 L. Carlini, C. Fasolato, P. Postorino, I. Fratoddi, I. Venditti,G. Testa and C. Battocchio, Colloids Surf., A, 2017, 532,183–188.
39 M. Yu. Smirnov, A. V. Kalinkin, A. V. Bukhtiyarov,I. P. Prosvirin and V. I. Bukhtiyarov, J. Phys. Chem. C, 2016,120, 10419–10426.
40 A. Zuber, M. Purdey, E. Schartner, C. Forbes, B. van derHoek, D. Giles, A. Abell, T. Monro and H. Ebendorff-Heidepriem, Sens. Actuators, B, 2016, 227, 117–127.
41 W. Haiss, N. T. K. Thanh, J. Aveyard and D. G. Fernig, Anal.Chem., 2007, 79, 4215–4221.
42 A. P. O'Mullane, Nanoscale, 2014, 6, 4012–4026.43 M. U. Anu Prathap, C. A. H. Aguilar, T. Pandiyan and
R. Srivastava, J. Appl. Electrochem., 2013, 43, 939–951.44 S. Cherevko, A. A. Topalov, A. R. Zeradjanin, I. Katsounaros
and K. J. J. Mayrhofer, RSC Adv., 2013, 3, 16516–16527.45 M. U. Anu Prathap, R. Srivastava and B. Satpati, Electrochim.
Acta, 2013, 114, 285–295.46 M. U. Anu Prathap and R. Srivastava, Sens. Actuators, B, 2013,
177, 239–250.47 M. Yang, X. Chen, T.-J. Jiang, Z. Guo, J.-H. Liu and
X.-J. Huang, Anal. Chem., 2016, 88, 9720–9728.48 W. Xu, J. Wang, L. Wang, G. Sheng, J. Liu, H. Yu and
X.-J. Huang, J. Hazard. Mater., 2013, 260, 498–507.49 N. Vishnu, A. S. Kumar, G.-T. Pan and T. C.-K. Yang, Sens.
Actuators, B, 2018, 275, 31–42.
This journal is © The Royal Society of Chemistry 2020
Paper RSC Advances
Ope
n A
cces
s A
rtic
le. P
ublis
hed
on 2
7 M
ay 2
020.
Dow
nloa
ded
on 1
2/9/
2021
11:
23:3
1 A
M.
Thi
s ar
ticle
is li
cens
ed u
nder
a C
reat
ive
Com
mon
s A
ttrib
utio
n 3.
0 U
npor
ted
Lic
ence
.View Article Online
50 P. L. Smedley and D. G. Kinniburgh, Appl. Geochem., 2002,17, 517–568.
51 M. M. Alam, M. A. Rashed, M. M. Rahman, M. M. Rahman,Y. Nagao and M. A. Hasnat, RSC Adv., 2018, 8, 8071–8079.
52 A. Karthika, S. Selvarajan, P. Karuppasamy, A. Suganthi andM. Rajarajan, J. Phys. Chem. Solids, 2019, 127, 11–18.
53 S. Kempahanumakkagari, A. Deep, K.-H. Kim, S. KumarKailasa and H.-O. Yoon, Biosens. Bioelectron., 2017, 95,106–116.
54 C. Zhou, M. Yang, S.-S. Li, T.-J. Jiang, J.-H. Liu, X.-J. Huangand X. Chen, Electrochim. Acta, 2017, 231, 238–246.
55 R. Coneo Rodrıguez, M. M. Bruno and P. C. Angelome, Sens.Actuators, B, 2018, 254, 603–612.
56 S. Dutta, G. Strack and P. Kurup, Sens. Actuators, B, 2019,281, 383–391.
57 P. J. Babu and M. Doble, Opt. Mater., 2018, 84, 339–344.58 ICH, ICH Topic Q 2 (R1) Validation of Analytical Procedures:
Text and Methodology, European Medicines Agency, 1995.59 X. Dai, O. Nekrassova, M. E. Hyde and R. G. Compton, Anal.
Chem., 2004, 76, 5924–5929.60 P. Carrera, P. J. Espinoza-Montero, L. Fernandez, H. Romero
and J. Alvarado, Talanta, 2017, 166, 198–206.61 M. Yang, Z. Guo, L.-N. Li, Y.-Y. Huang, J.-H. Liu, Q. Zhou,
X. Chen and X.-J. Huang, Sens. Actuators, B, 2016, 231, 70–78.62 O. Ordeig, C. E. Banks, J. del Campo, F. X. Munoz and
R. G. Compton, Electroanalysis, 2006, 18, 573–578.
This journal is © The Royal Society of Chemistry 2020
63 Z. Jia, A. O. Simm, X. Dai and R. G. Compton, J. Electroanal.Chem., 2006, 587, 247–253.
64 Z. Zhao, Z. Zhang, C. Li, H. Wu, J. Wang and Y. Lu, J. Mater.Chem. A, 2018, 6, 16164–16169.
65 S. Pourbeyram and S. Asadi, Electroanalysis, 2018, 30, 154–161.
66 I. Svancara, K. Vytras, A. Bobrowski and K. Kalcher, Talanta,2002, 58, 45–55.
67 A. I. Kamenev, A. B. Lyakhov and S. E. Orlov, J. Anal. Chem.,2005, 60, 156–162.
68 Y. Song and G. M. Swain, Anal. Chim. Acta, 2007, 593, 7–12.69 G. Dugo, L. La Pera, V. Lo Turco and G. Di Bella,
Chemosphere, 2005, 61, 1093–1101.70 X. Dai and R. G. Compton, Electroanalysis, 2005, 17, 1325–
1330.71 A. O. Simm, C. E. Banks and R. G. Compton, Electroanalysis,
2005, 17, 1727–1733.72 Y. Song and G. M. Swain, Anal. Chim. Acta, 2007, 593, 7–12.73 X. Dai, G. G. Wildgoose, C. Salter, A. Crossley and
R. G. Compton, Anal. Chem., 2006, 78, 6102–6108.74 H. Xu, L. Zeng, S. Xing, G. Shi, J. Chen, Y. Xian and L. Jin,
Electrochem. Commun., 2008, 10, 1893–1896.75 Y. Lan, H. Luo, X. Ren, Y. Wang and Y. Liu, Microchim. Acta,
2012, 178, 153–161.76 E. A. Zakharova, G. N. Noskova, S. G. Antonova and
A. S. Kabakaev, Int. J. Environ. Anal. Chem., 2014, 94, 1478–1498.
RSC Adv., 2020, 10, 20211–20221 | 20221