Embed Size (px)
Citation preview
Presented by
Umetrics SIMCA-online: Complex
Analytics Applied to PI System™
Data
Lorenz Liesum, Novartis
Petter Möree, Umetrics
© Copyr i g h t 2012 OS Iso f t , LLC .
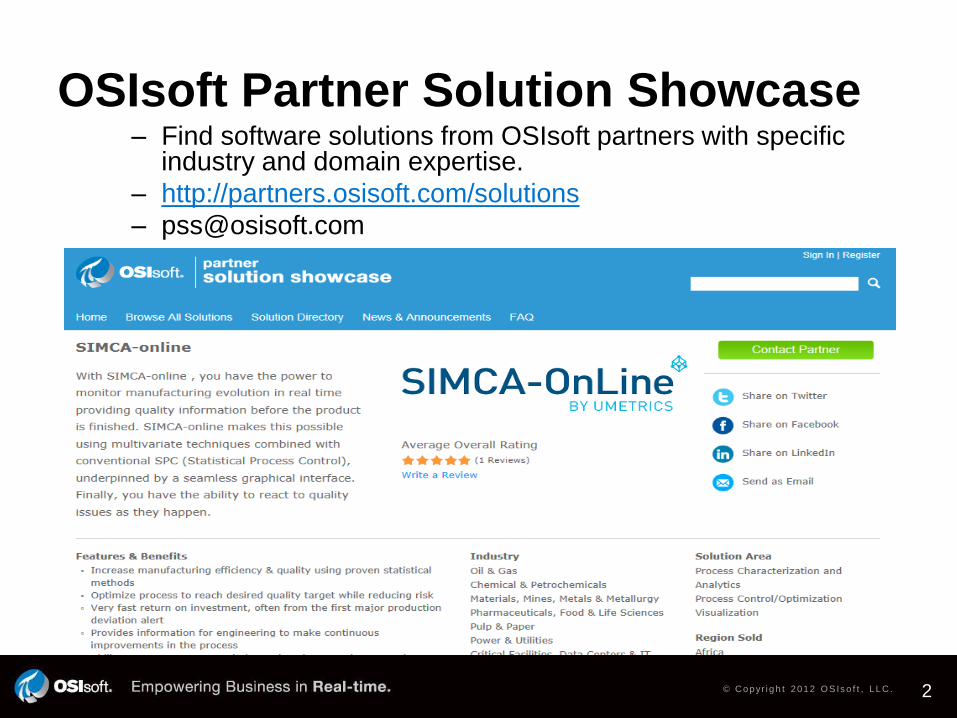
OSIsoft Partner Solution Showcase– Find software solutions from OSIsoft partners with specific
industry and domain expertise.
– http://partners.osisoft.com/solutions
2

© Copyr i g h t 2012 OS Iso f t , LLC .
3
“Our mission is to
maximize the Value our
customers get from
our product and
services”
Novartis provides healthcare
solutions that address the
evolving needs of patients
and societies.
Founded in 1987 to provide
consulting/teaching services
based on multivariate data
analysis and design of
experiments by a group
from the Department of
Organic Chemistry, from
Umeå University, Sweden.
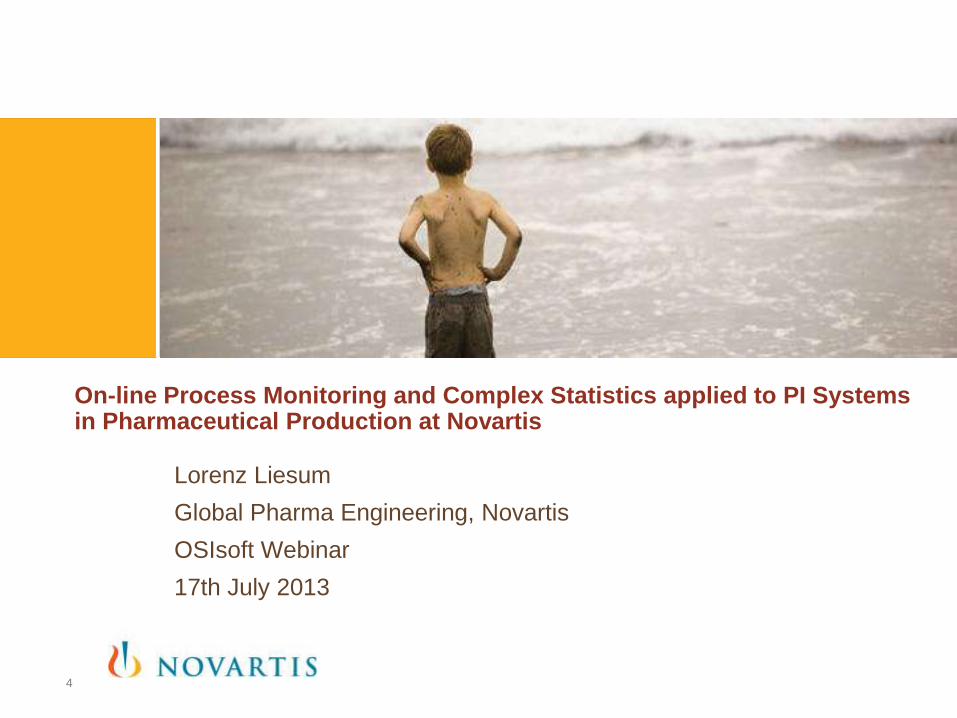
Lorenz Liesum
Global Pharma Engineering, Novartis
OSIsoft Webinar
17th July 2013
On-line Process Monitoring and Complex Statistics applied to PI Systemsin Pharmaceutical Production at Novartis
4
About Novartis
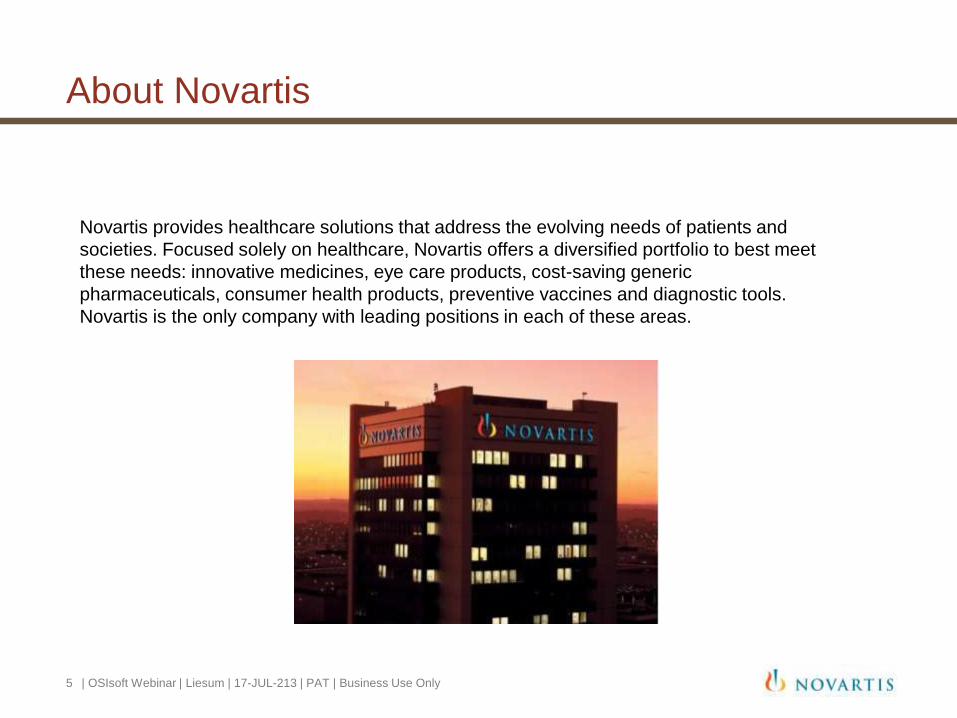
Novartis provides healthcare solutions that address the evolving needs of patients and
societies. Focused solely on healthcare, Novartis offers a diversified portfolio to best meet
these needs: innovative medicines, eye care products, cost-saving generic
pharmaceuticals, consumer health products, preventive vaccines and diagnostic tools.
Novartis is the only company with leading positions in each of these areas.
5 | OSIsoft Webinar | Liesum | 17-JUL-213 | PAT | Business Use Only
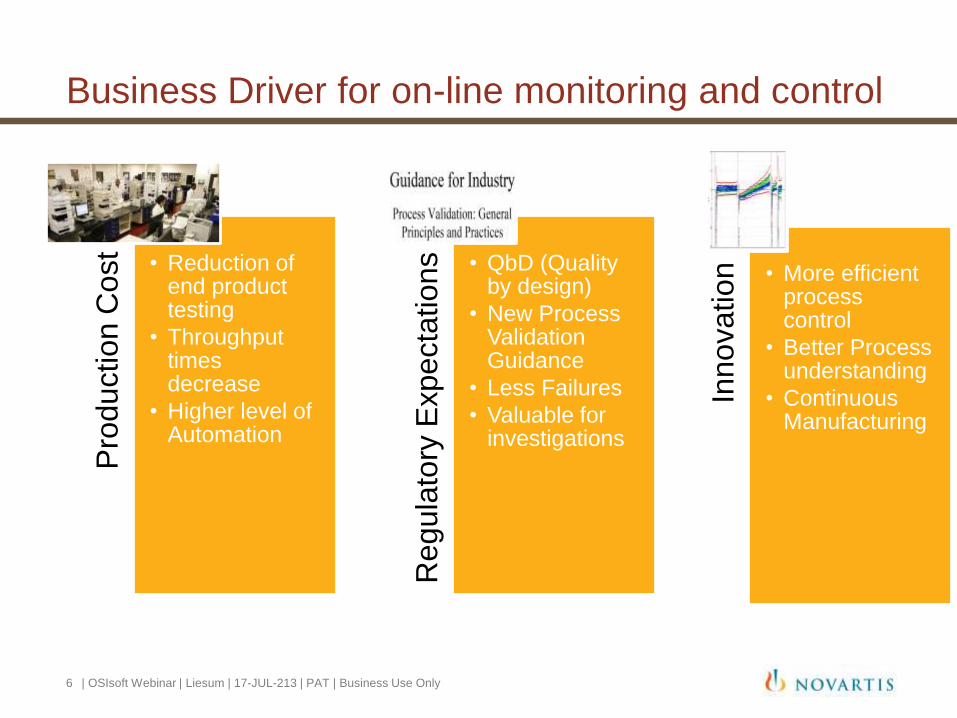
Business Driver for on-line monitoring and controlP
rod
uctio
n C
ost • Reduction of
end product testing
• Throughput times decrease
• Higher level of Automation
Re
gu
lato
ry E
xp
ecta
tio
ns • QbD (Quality
by design)
• New Process Validation Guidance
• Less Failures
• Valuable for investigations
Inn
ova
tio
n • More efficient process control
• Better Process understanding
• Continuous Manufacturing
6 | OSIsoft Webinar | Liesum | 17-JUL-213 | PAT | Business Use Only
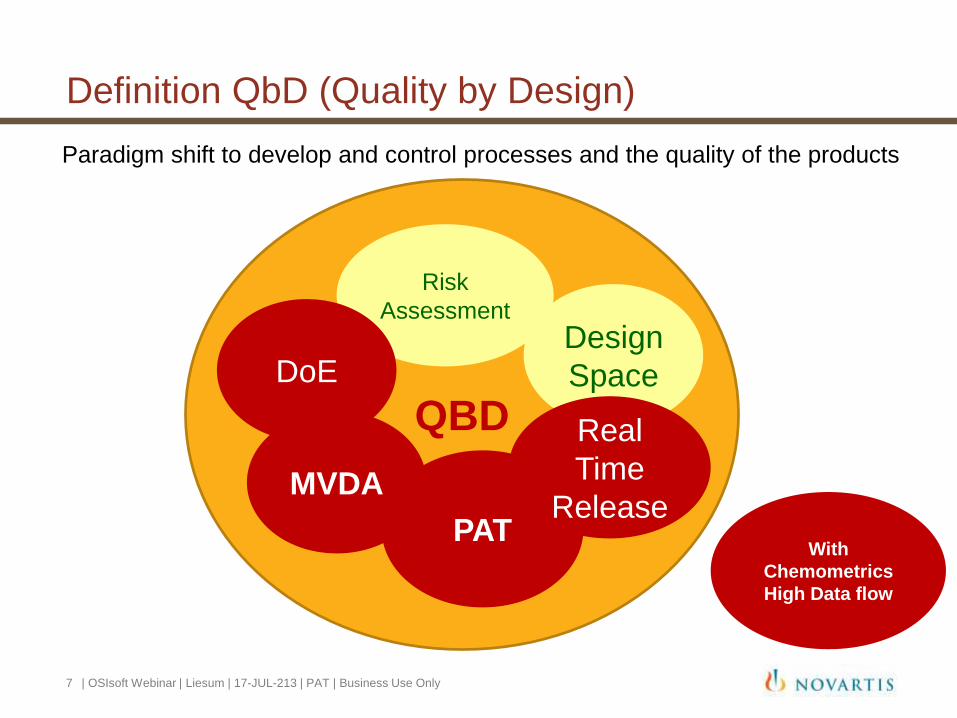
Definition QbD (Quality by Design)
QBD
PAT
Risk
Assessment
MVDA
DoEDesign
Space
Real
Time
Release
Paradigm shift to develop and control processes and the quality of the products
With
Chemometrics
High Data flow
7 | OSIsoft Webinar | Liesum | 17-JUL-213 | PAT | Business Use Only
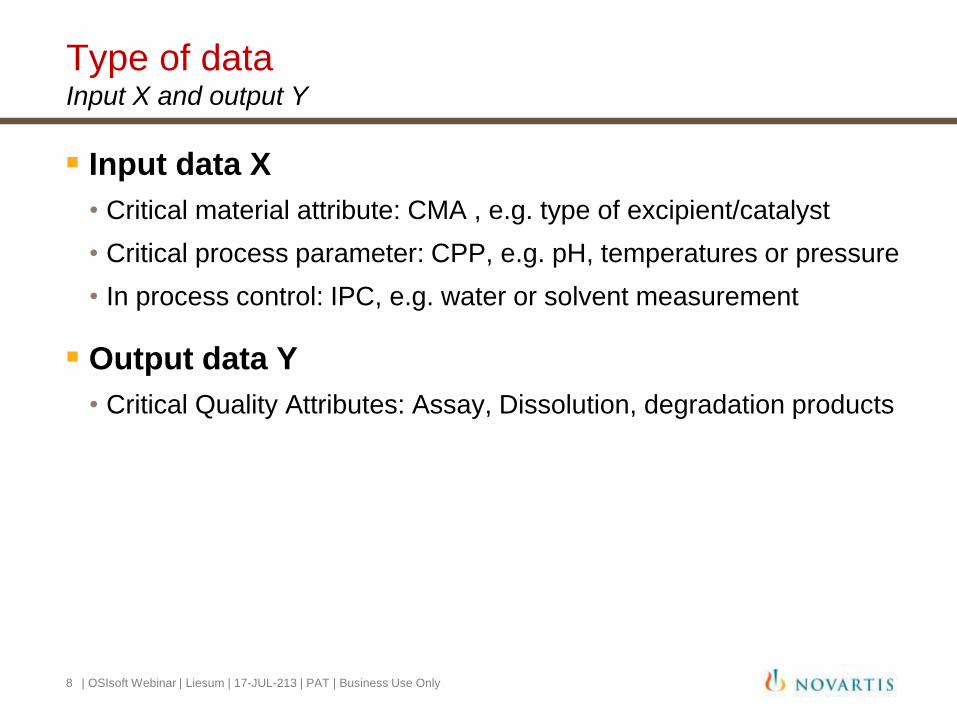
Type of dataInput X and output Y
Input data X
• Critical material attribute: CMA , e.g. type of excipient/catalyst
• Critical process parameter: CPP, e.g. pH, temperatures or pressure
• In process control: IPC, e.g. water or solvent measurement
Output data Y
• Critical Quality Attributes: Assay, Dissolution, degradation products
8 | OSIsoft Webinar | Liesum | 17-JUL-213 | PAT | Business Use Only
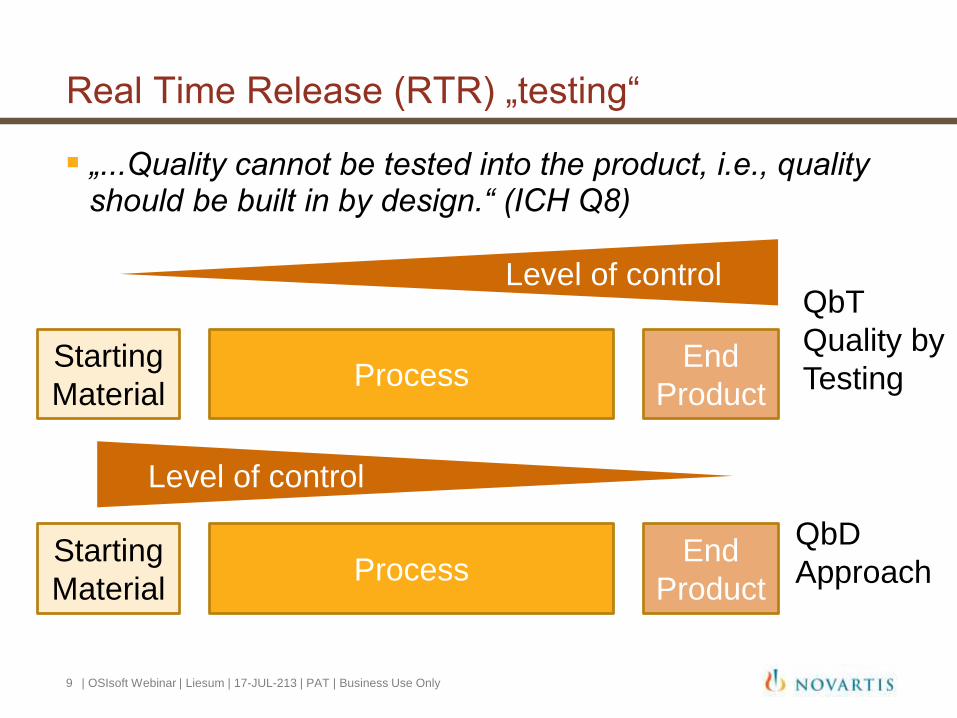
Real Time Release (RTR) „testing“
„...Quality cannot be tested into the product, i.e., quality should be built in by design.“ (ICH Q8)
ProcessStarting
Material
End
Product
ProcessStarting
Material
End
Product
Level of control
Level of control
QbT
Quality by
Testing
QbD
Approach
9 | OSIsoft Webinar | Liesum | 17-JUL-213 | PAT | Business Use Only
-12
-10
-8
-6
-4
-2
0
2
4
6
8
0 10 20 30 40 50 60 70 80 90
t[1]
Num
SPC Analysis
6 7 9 11
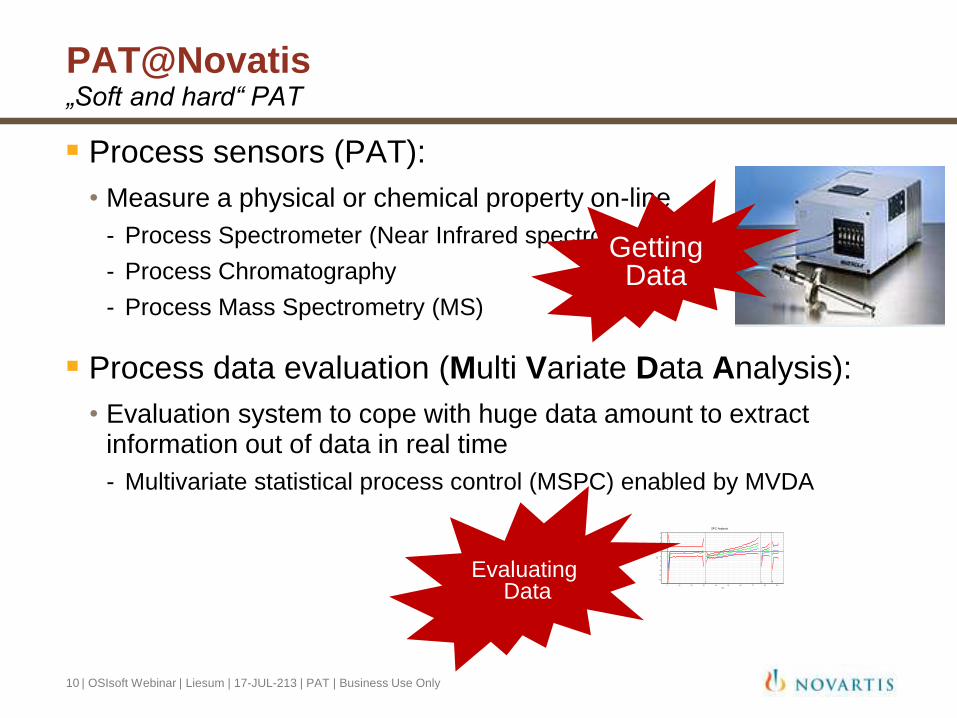
PAT@Novatis „Soft and hard“ PAT
Process sensors (PAT):
• Measure a physical or chemical property on-line
- Process Spectrometer (Near Infrared spectroscopy, NIR)
- Process Chromatography
- Process Mass Spectrometry (MS)
Process data evaluation (Multi Variate Data Analysis):
• Evaluation system to cope with huge data amount to extract information out of data in real time
- Multivariate statistical process control (MSPC) enabled by MVDA
Getting Data
EvaluatingData
10 | OSIsoft Webinar | Liesum | 17-JUL-213 | PAT | Business Use Only
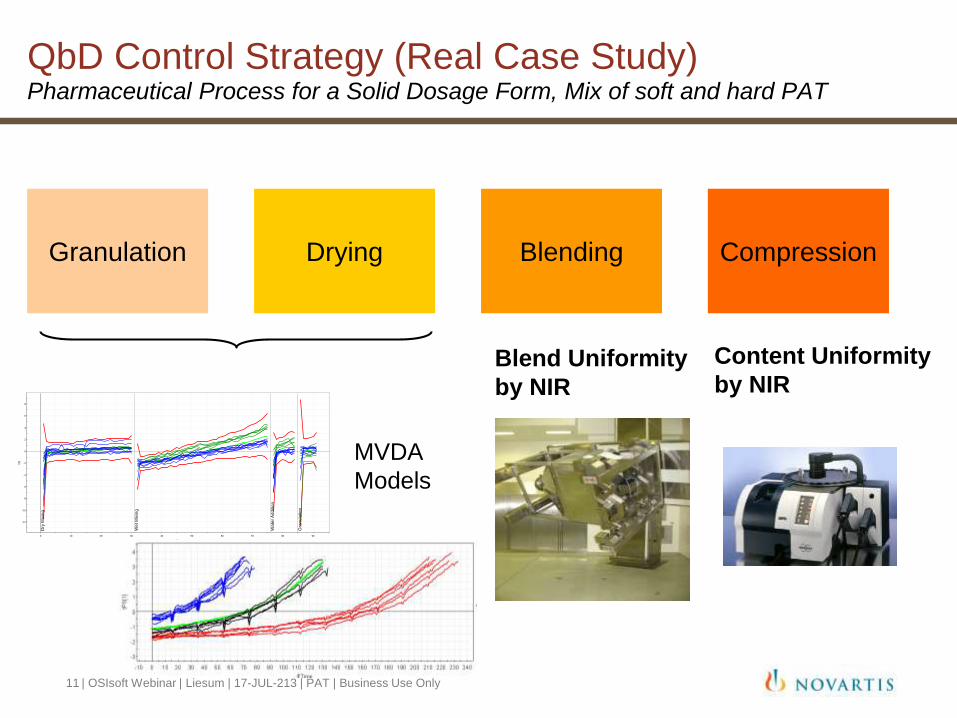
QbD Control Strategy (Real Case Study)Pharmaceutical Process for a Solid Dosage Form, Mix of soft and hard PAT
Granulation Drying Blending Compression
Blend Uniformity
by NIR
Content Uniformity
by NIR
-12
-10
-8
-6
-4
-2
0
2
4
6
8
0 10 20 30 40 50 60 70 80 90
t[1]
Num
Dry
Mix
ing
We
t M
ixin
g
Wa
ter
Ad
ditio
n
Gra
nu
latio
n
SIMCA-P+ 11 - 01.08.2008 16:44:13
MVDA
Models
11 | OSIsoft Webinar | Liesum | 17-JUL-213 | PAT | Business Use Only
In alignment with EMA process validation guideline
12 | OSIsoft Webinar | Liesum | 17-JUL-213 | PAT | Business Use Only
Use of Multivariate Data Analysis (MVDA) for Statistical Process Control (SPC)
-6
-4
-2
0
2
4
6
-12 -11 -10 -9 -8 -7 -6 -5 -4 -3 -2 -1 0 1 2 3 4 5 6 7 8 9 10 11 12
t[2
]
t[1]
R2X[1] = 0.494965 R2X[2] = 0.151559
Ellipse: Hotelling T2 (0.95)
S0010-B
S0011-AS0011-B
S0012-A
S0012-B
S0013-AS0013_BS0014_A
S0014_B
S0015-A
S0015_B
S0016-AS0016-B
S0009A_
S0009B_S0010A_
SIMCA-P+ 11 - 03.08.2008 17:12:10
13 | OSIsoft Webinar | Liesum | 17-JUL-213 | PAT | Business Use Only
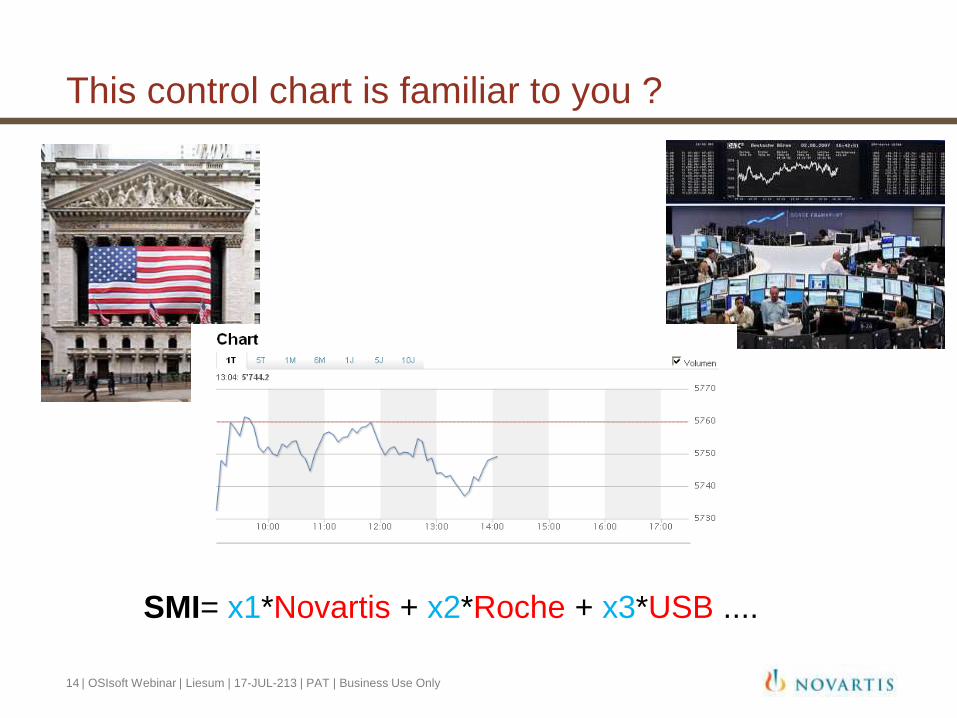
This control chart is familiar to you ?
SMI= x1*Novartis + x2*Roche + x3*USB ....
14 | OSIsoft Webinar | Liesum | 17-JUL-213 | PAT | Business Use Only
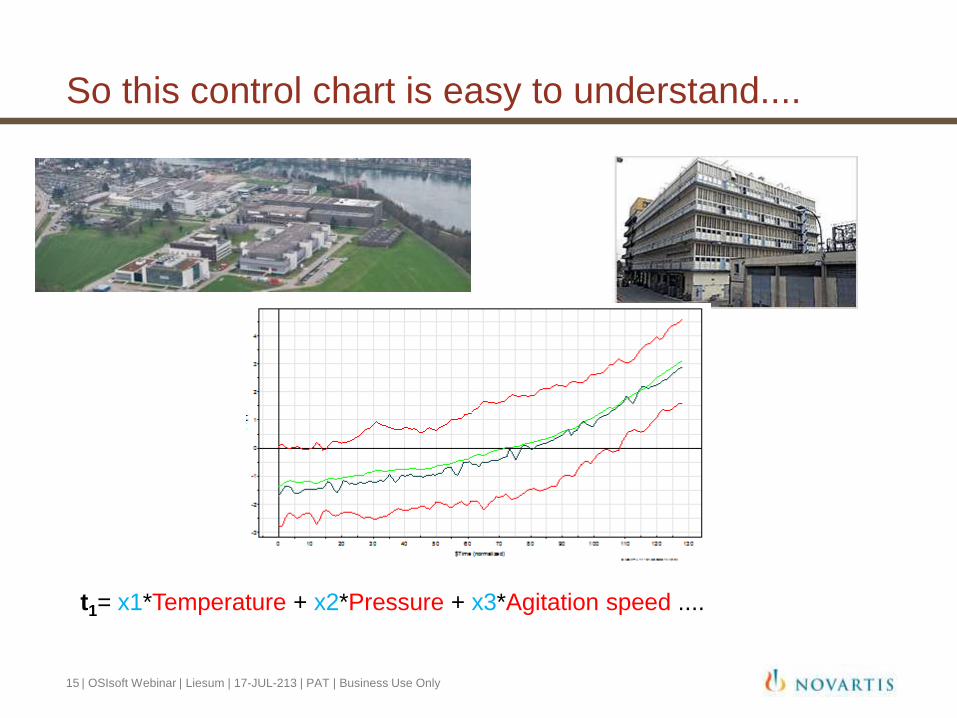
So this control chart is easy to understand....
t1= x1*Temperature + x2*Pressure + x3*Agitation speed ....
15 | OSIsoft Webinar | Liesum | 17-JUL-213 | PAT | Business Use Only
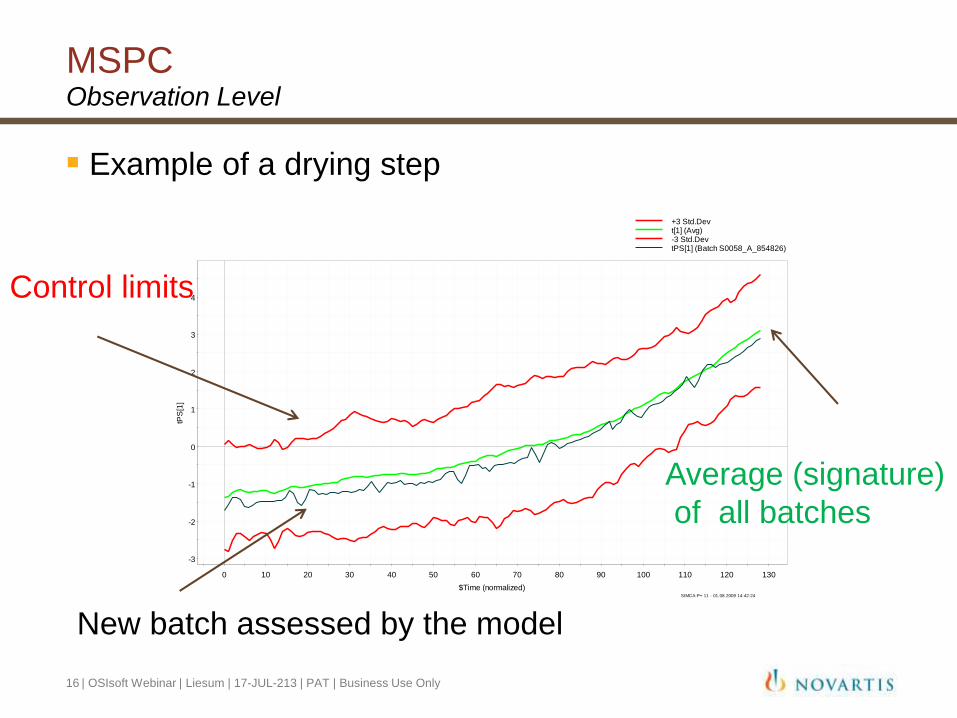
MSPC Observation Level
Example of a drying step
-3
-2
-1
0
1
2
3
4
0 10 20 30 40 50 60 70 80 90 100 110 120 130
tPS
[1]
$Time (normalized)
PO_WST3433_EXJADE_Drying_V01.M3:3Predicted Scores [comp. 1]
+3 Std.Devt[1] (Avg)-3 Std.DevtPS[1] (Batch S0058_A_854826)
SIMCA-P+ 11 - 01.08.2009 14:42:24
Control limits
Average (signature)
of all batches
New batch assessed by the model
16 | OSIsoft Webinar | Liesum | 17-JUL-213 | PAT | Business Use Only
-5
-4
-3
-2
-1
0
1
2
3
4
5
-10 -9 -8 -7 -6 -5 -4 -3 -2 -1 0 1 2 3 4 5 6 7 8 9 10
t[2]
t[1]
BSPC Analysis
R2X[1] = 0.449661 R2X[2] = 0.138447
Ellipse: Hotelling T2 (0.95) SIMCA-P+ 12.0.1 - 2010-04-21 14:30:51 (UTC+1)
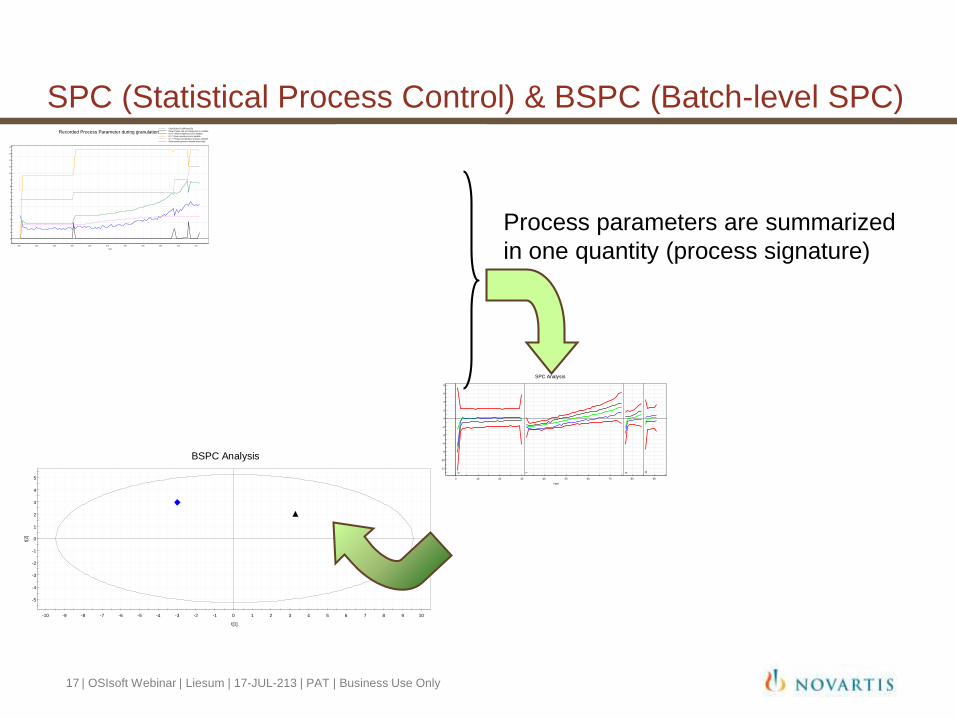
SPC (Statistical Process Control) & BSPC (Batch-level SPC)
-12
-10
-8
-6
-4
-2
0
2
4
6
8
0 10 20 30 40 50 60 70 80 90
t[1]
Num
SPC Analysis
6 7 9 11
Process parameters are summarized
in one quantity (process signature)0
1
2
3
4
5
6
7
8
9
10
11
12
13
14
320 330 340 350 360 370 380 390 400 410 420
Num
Recorded Process Parameter during granulationObsID(Obs ID ($PhaseID))
Mixer Power rate of change precss variable
0.01 * Mixer torqute process variable
0.1 * Mixer speed process variable
0.1 * Product temperature process variable
Mixer power process variavle (electrical)
17 | OSIsoft Webinar | Liesum | 17-JUL-213 | PAT | Business Use Only
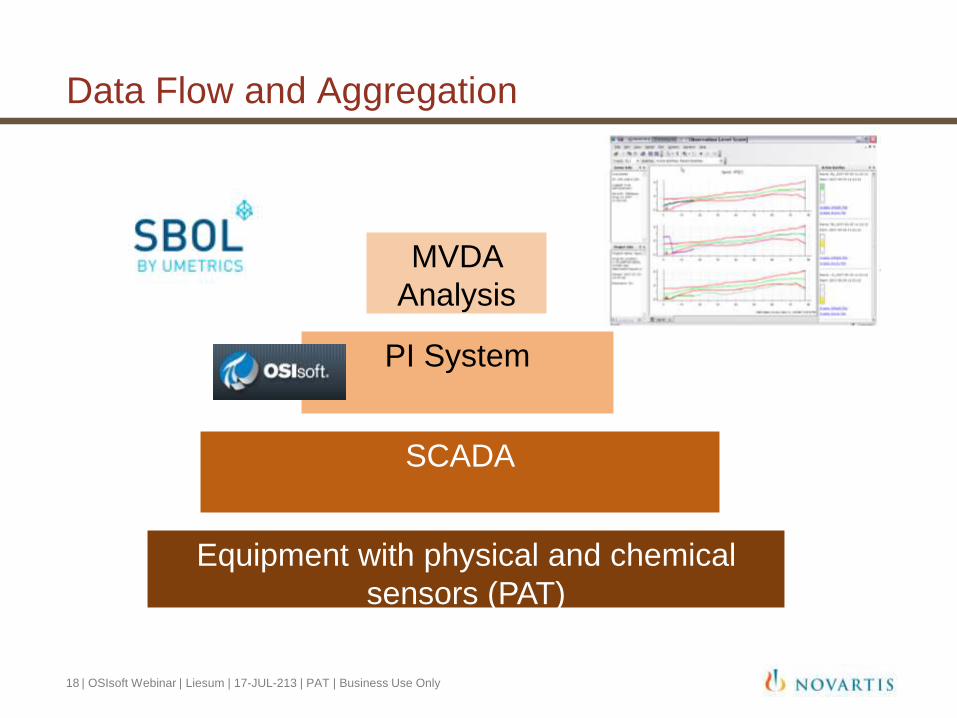
Data Flow and Aggregation
Equipment with physical and chemical
sensors (PAT)
SCADA
PI System
MVDA
Analysis
18 | OSIsoft Webinar | Liesum | 17-JUL-213 | PAT | Business Use Only
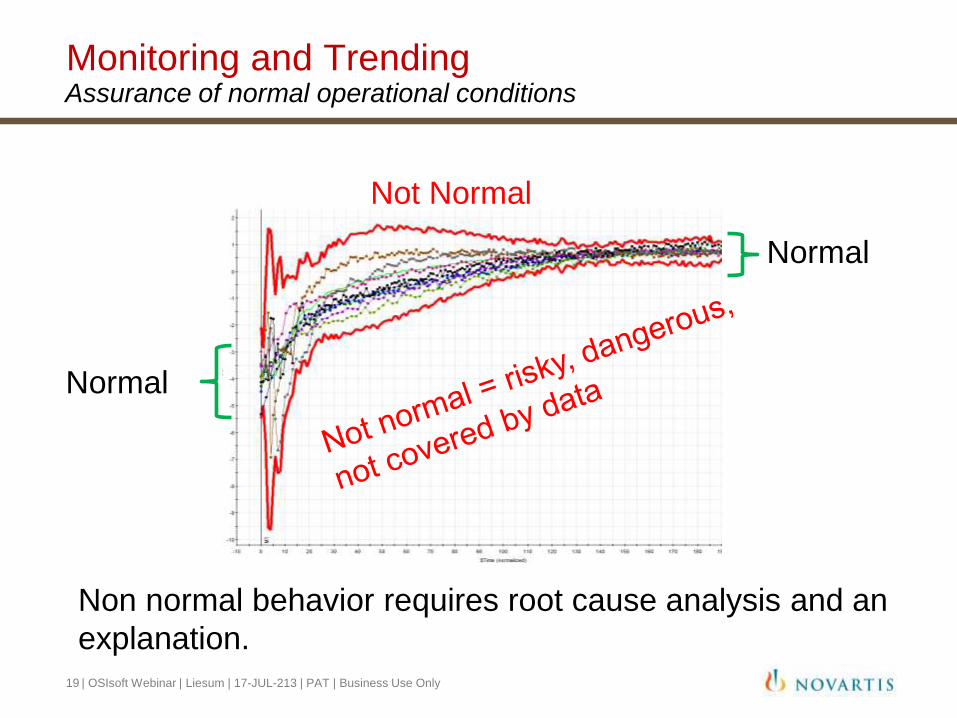
Monitoring and TrendingAssurance of normal operational conditions
Normal
Not Normal
Normal
Non normal behavior requires root cause analysis and an
explanation.
19 | OSIsoft Webinar | Liesum | 17-JUL-213 | PAT | Business Use Only
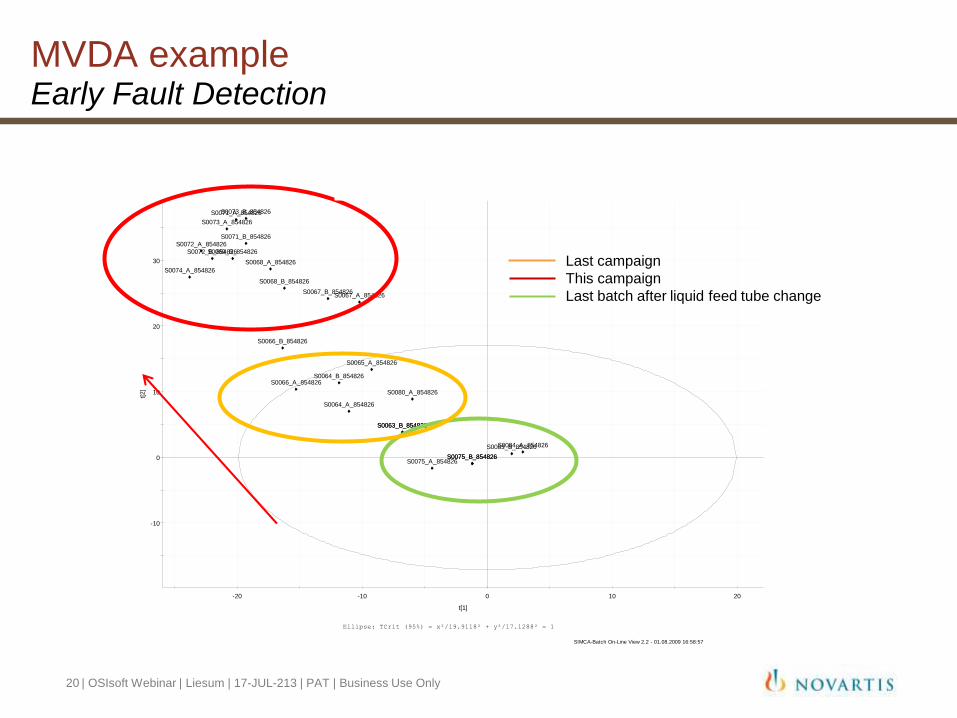
MVDA example Early Fault Detection
-10
0
10
20
30
-20 -10 0 10 20
t[2]
t[1]
PO_WST10332_EXJADE_GRAN_V1 - Batch Level scores: t[1]/t[2]
Ellipse: TCrit (95%) = x²/19.9118² + y²/17.1288² = 1
S0075_B_854826
S0064_A_854826
S0075_A_854826S0075_B_854826
S0063_B_854826
S0068_B_854826
S0072_A_854826
S0069_B_854826S0072_B_854826
S0080_A_854826
S0073_A_854826
S0083_B_854826
S0067_B_854826
S0066_B_854826
S0065_A_854826
S0073_B_854826
S0063_B_854826
S0071_B_854826
S0071_A_854826
S0064_B_854826S0066_A_854826
S0074_A_854826
S0068_A_854826
S0084_A_854826
S0067_A_854826
SIMCA-Batch On-Line View 2.2 - 01.08.2009 16:58:57
Last campaign
This campaign
Last batch after liquid feed tube change
20 | OSIsoft Webinar | Liesum | 17-JUL-213 | PAT | Business Use Only
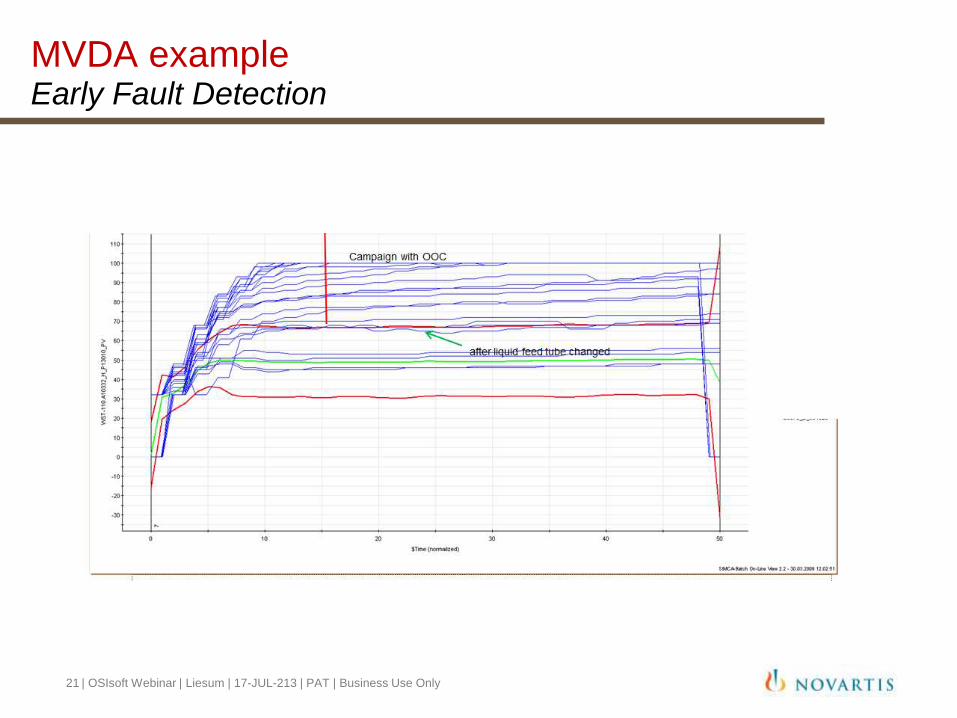
MVDA example Early Fault Detection
21 | OSIsoft Webinar | Liesum | 17-JUL-213 | PAT | Business Use Only
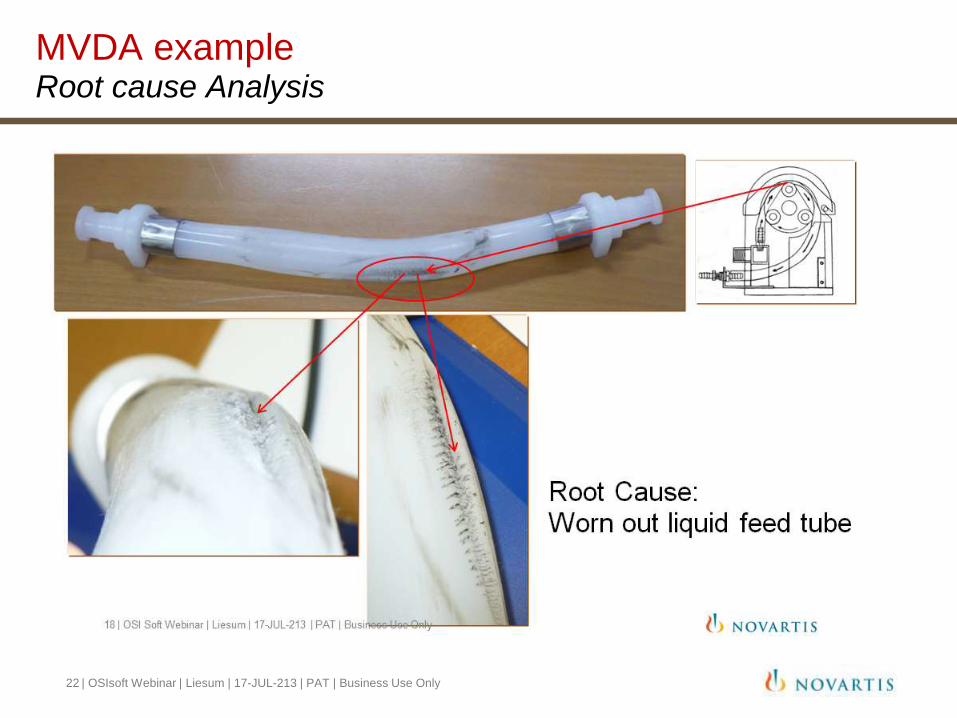
MVDA example Root cause Analysis
22 | OSIsoft Webinar | Liesum | 17-JUL-213 | PAT | Business Use Only
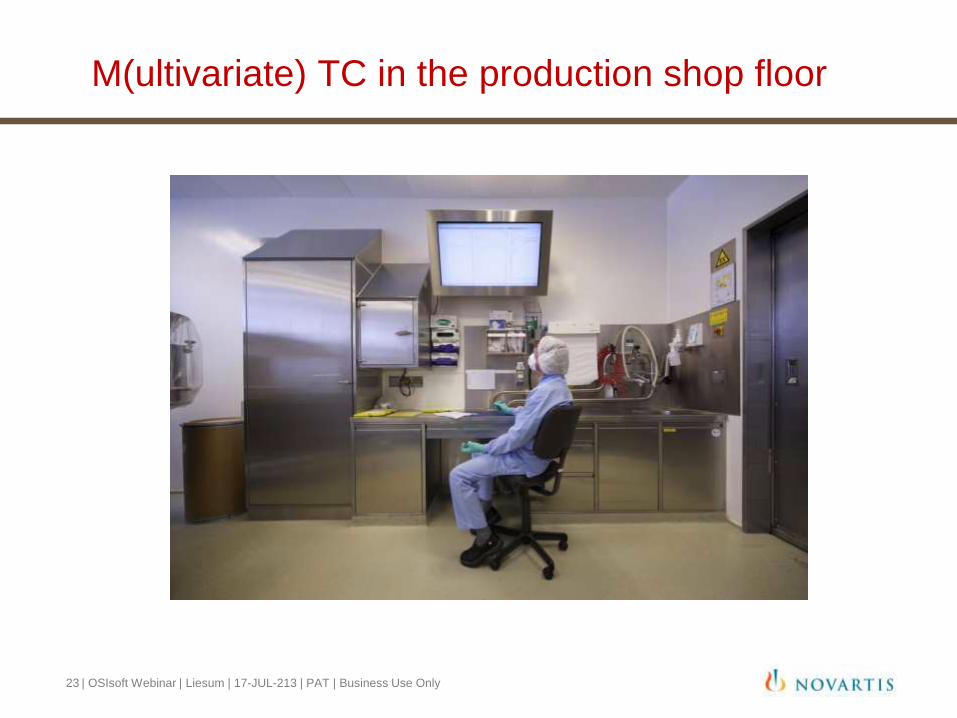
M(ultivariate) TC in the production shop floor
23 | OSIsoft Webinar | Liesum | 17-JUL-213 | PAT | Business Use Only
Case Example for PROCES CONTROLControlling a process using on-line MVDA
Tags from the PI System
• Temperatures:
- Internal Drying Temperature
- Jacket Temperature
- Dryer Vapor Temperature
• Pressures
- Pressure in the dryer
• MS
- Acetone concentration measured by MS in the headspace
Batch data:
• More than 30 historical batches produced at target conditions reflecting normal behavior
24 | OSIsoft Webinar | Liesum | 17-JUL-213 | PAT | Business Use Only
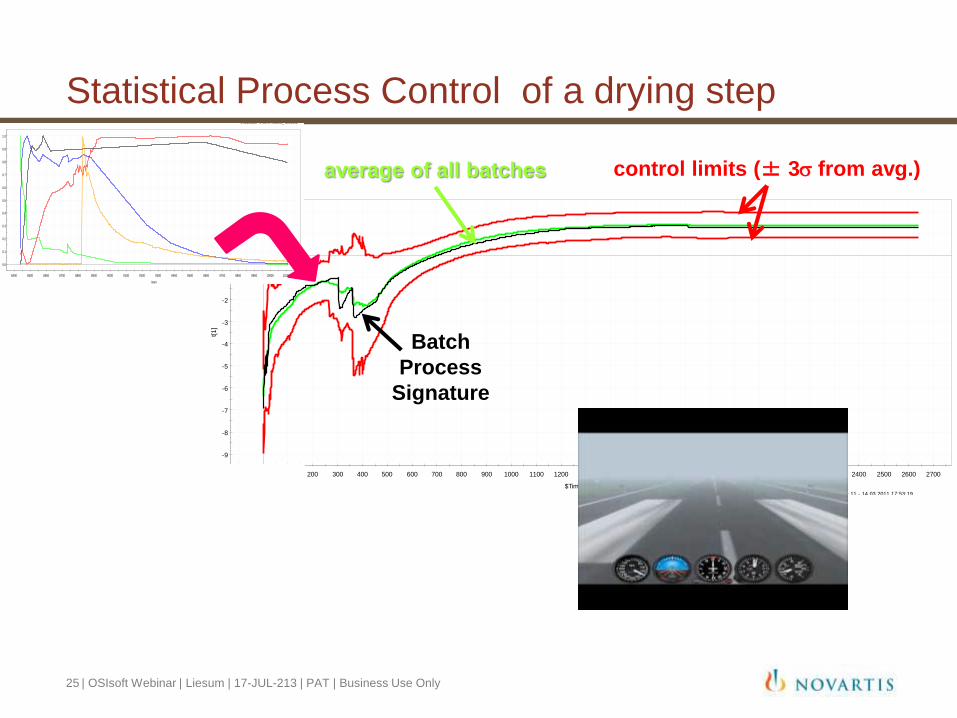
Statistical Process Control of a drying step
-9
-8
-7
-6
-5
-4
-3
-2
-1
0
1
2
-100 0 100 200 300 400 500 600 700 800 900 1000 1100 1200 1300 1400 1500 1600 1700 1800 1900 2000 2100 2200 2300 2400 2500 2600 2700
t[1]
$Time (smoothed)
Model Data Ciclo - Oct 2010 v5.M2:16
Scores [comp. 1] (Aligned)
+3 Std.Dev
t[1] (Avg)
-3 Std.Dev
t[1] (Aligned): 635
SIMCA-P+ 11 - 14.03.2011 17:53:19
0.0
0.1
0.2
0.3
0.4
0.5
0.6
0.7
0.8
0.9
1.0
8400 8500 8600 8700 8800 8900 9000 9100 9200 9300 9400 9500 9600 9700 9800 9900 10000 10100
Num
Variable, Batch: 617, Phase: 16-15.4122 * 543071TT--607 - 15.4122
-2.84936 * 543071TT--600 - 2.84936
0.00281207 * 543071PT--644 + 0.00767695
-1.10938 * 543071TT--602 - 1.10938
0.00826856 * 543071-Acetone_43x10e13
SIMCA-P+ 11 - 09.03.2011 19:17:38
Batch
Process
Signature
average of all batches control limits (± 3s from avg.)
25 | OSIsoft Webinar | Liesum | 17-JUL-213 | PAT | Business Use Only
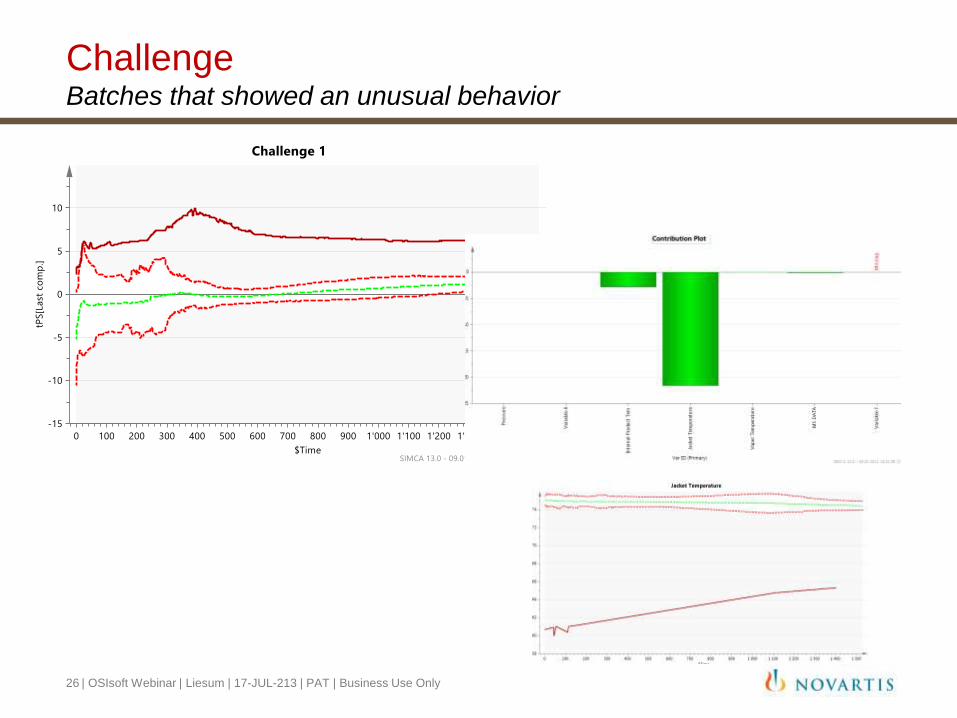
ChallengeBatches that showed an unusual behavior
26 | OSIsoft Webinar | Liesum | 17-JUL-213 | PAT | Business Use Only
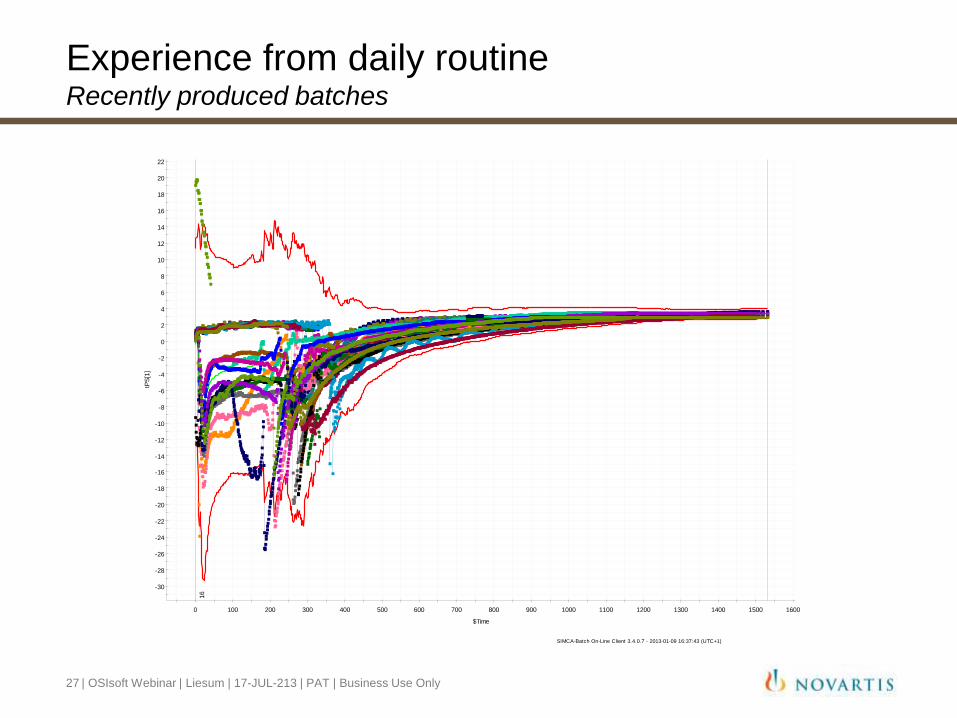
Experience from daily routineRecently produced batches
-30
-28
-26
-24
-22
-20
-18
-16
-14
-12
-10
-8
-6
-4
-2
0
2
4
6
8
10
12
14
16
18
20
22
0 100 200 300 400 500 600 700 800 900 1000 1100 1200 1300 1400 1500 1600
tPS
[1]
$Time
16
SIMCA-Batch On-Line Client 3.4.0.7 - 2013-01-09 16:37:43 (UTC+1)
27 | OSIsoft Webinar | Liesum | 17-JUL-213 | PAT | Business Use Only
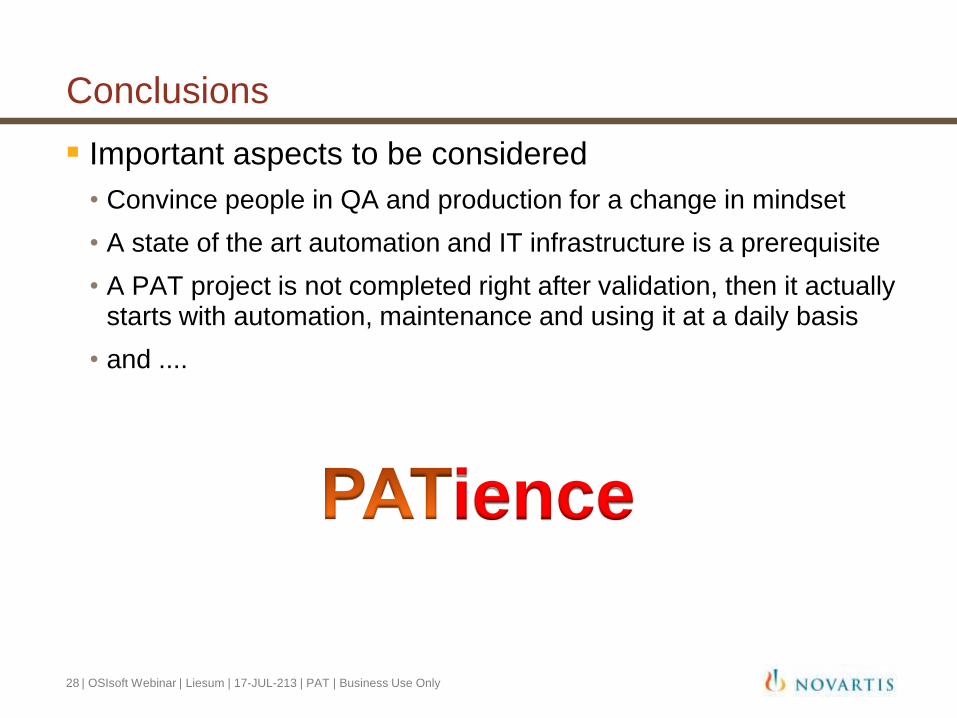
Conclusions
Important aspects to be considered
• Convince people in QA and production for a change in mindset
• A state of the art automation and IT infrastructure is a prerequisite
• A PAT project is not completed right after validation, then it actually starts with automation, maintenance and using it at a daily basis
• and ....
ience
28 | OSIsoft Webinar | Liesum | 17-JUL-213 | PAT | Business Use Only
Thank you for you attention !
29 | OSIsoft Webinar | Liesum | 17-JUL-213 | PAT | Business Use Only
Umetrics
Company Presentation
Petter Mörée
Director Product Management
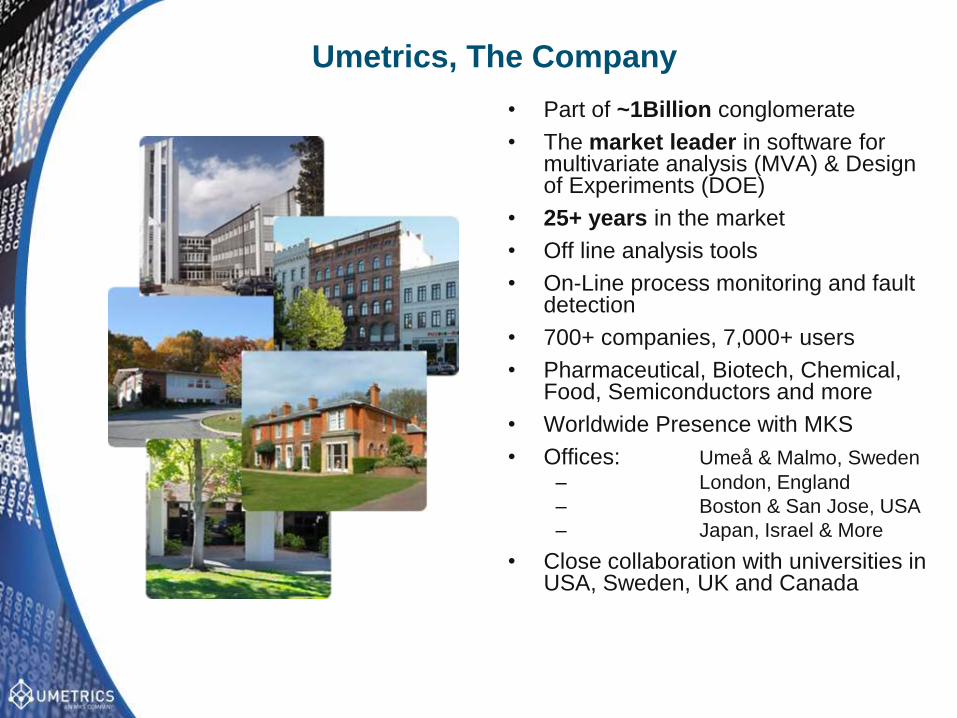
Umetrics, The Company
• Part of ~1Billion conglomerate
• The market leader in software for multivariate analysis (MVA) & Design of Experiments (DOE)
• 25+ years in the market
• Off line analysis tools
• On-Line process monitoring and fault detection
• 700+ companies, 7,000+ users
• Pharmaceutical, Biotech, Chemical, Food, Semiconductors and more
• Worldwide Presence with MKS
• Offices: Umeå & Malmo, Sweden
– London, England
– Boston & San Jose, USA
– Japan, Israel & More
• Close collaboration with universities in USA, Sweden, UK and Canada
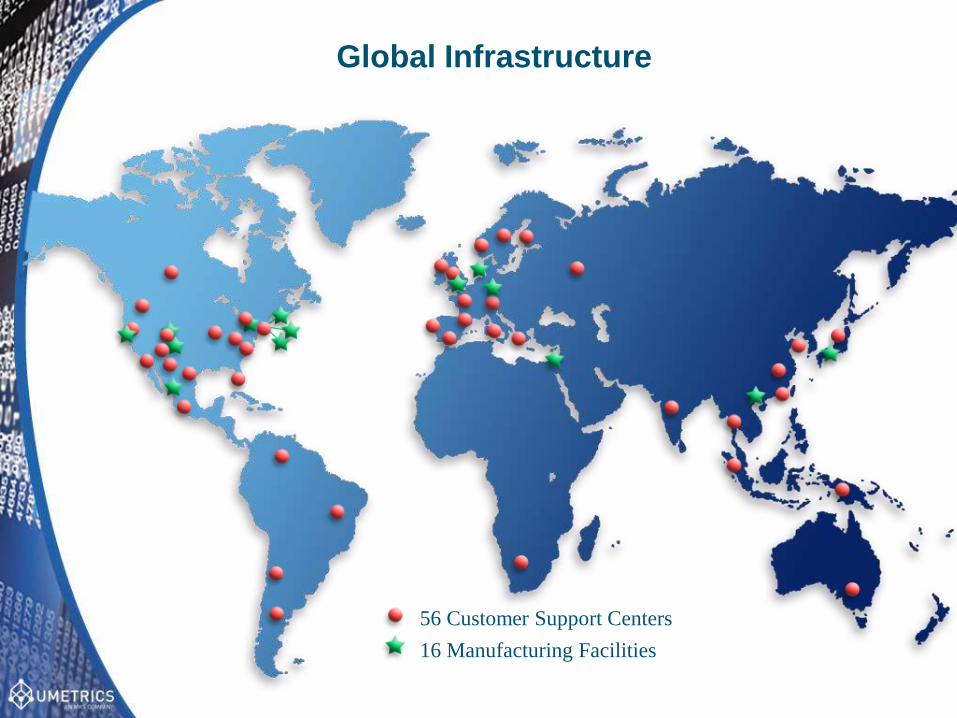
Global Infrastructure
56 Customer Support Centers
16 Manufacturing Facilities
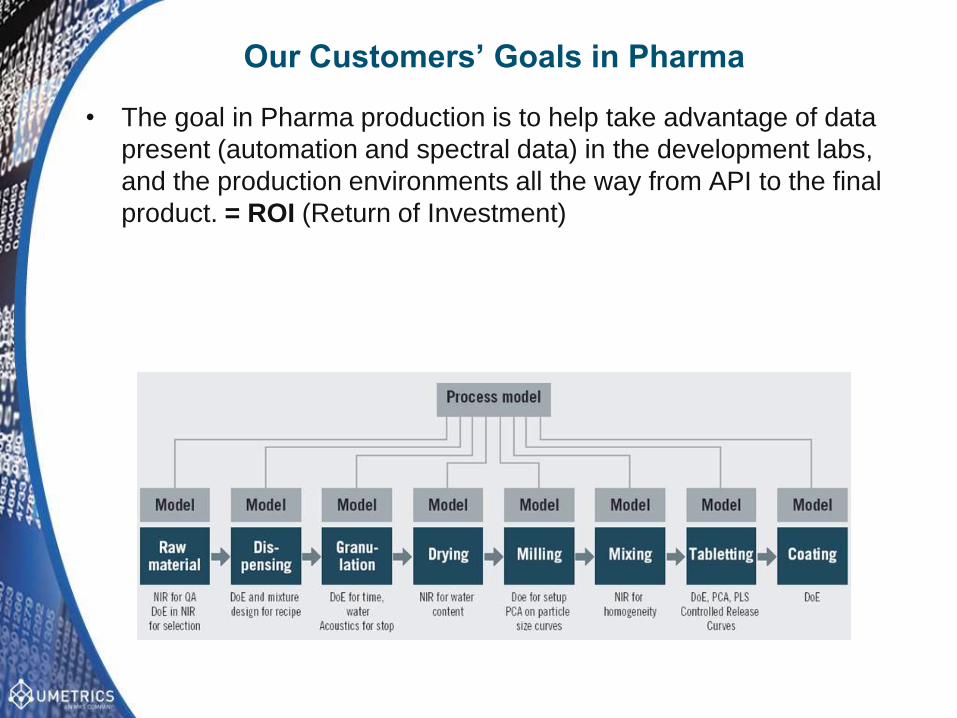
Our Customers’ Goals in Pharma
• The goal in Pharma production is to help take advantage of data
present (automation and spectral data) in the development labs,
and the production environments all the way from API to the final
product. = ROI (Return of Investment)
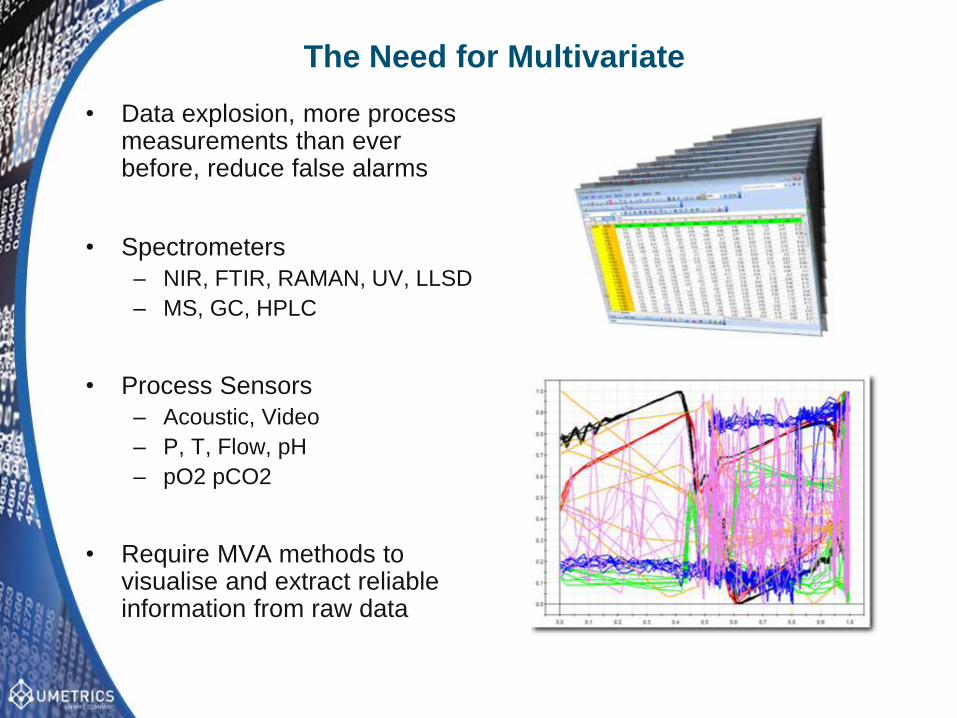
The Need for Multivariate
• Data explosion, more process measurements than ever before, reduce false alarms
• Spectrometers
– NIR, FTIR, RAMAN, UV, LLSD
– MS, GC, HPLC
• Process Sensors
– Acoustic, Video
– P, T, Flow, pH
– pO2 pCO2
• Require MVA methods to visualise and extract reliable information from raw data
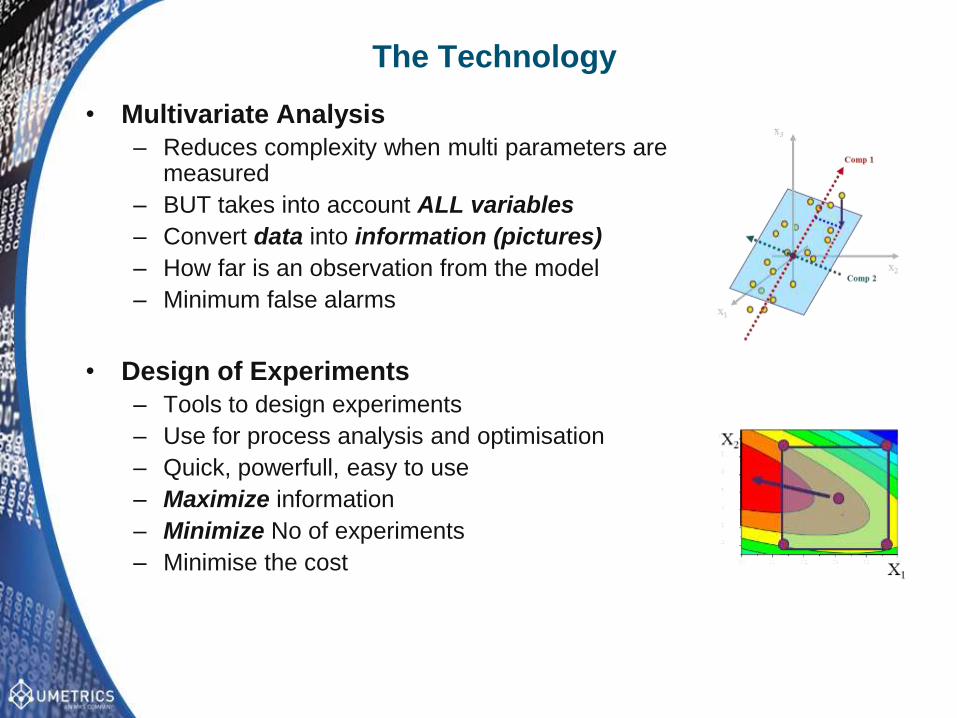
The Technology
• Multivariate Analysis
– Reduces complexity when multi parameters are measured
– BUT takes into account ALL variables
– Convert data into information (pictures)
– How far is an observation from the model
– Minimum false alarms
• Design of Experiments
– Tools to design experiments
– Use for process analysis and optimisation
– Quick, powerfull, easy to use
– Maximize information
– Minimize No of experiments
– Minimise the cost
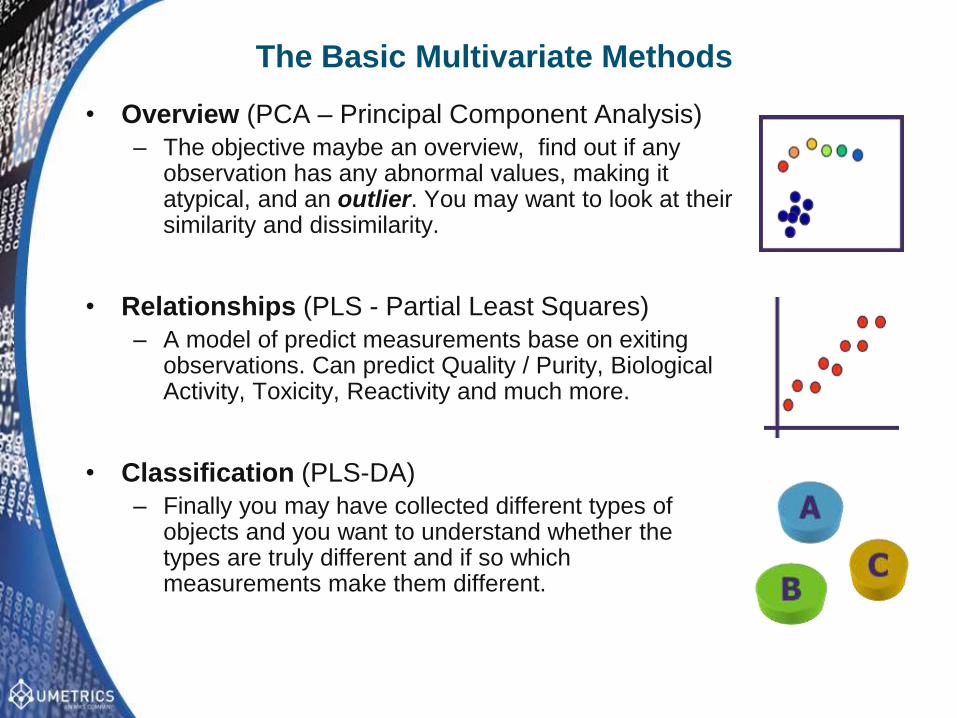
The Basic Multivariate Methods
• Overview (PCA – Principal Component Analysis)
– The objective maybe an overview, find out if any observation has any abnormal values, making it atypical, and an outlier. You may want to look at their similarity and dissimilarity.
• Relationships (PLS - Partial Least Squares)
– A model of predict measurements base on exiting observations. Can predict Quality / Purity, Biological Activity, Toxicity, Reactivity and much more.
• Classification (PLS-DA)
– Finally you may have collected different types of objects and you want to understand whether the types are truly different and if so which measurements make them different.
Services
• Technical support
• Consulting/Feasibility studies
• Training: MVA, DoE, Process Development, Manufacturing,
PAT, Spectral applications etc….
All Umetrics software have
• User-friendly point-and-click interface developed for use by
engineers, scientist and operators
• Been fully tested and validated to ensure quality expected
from Pharma industry
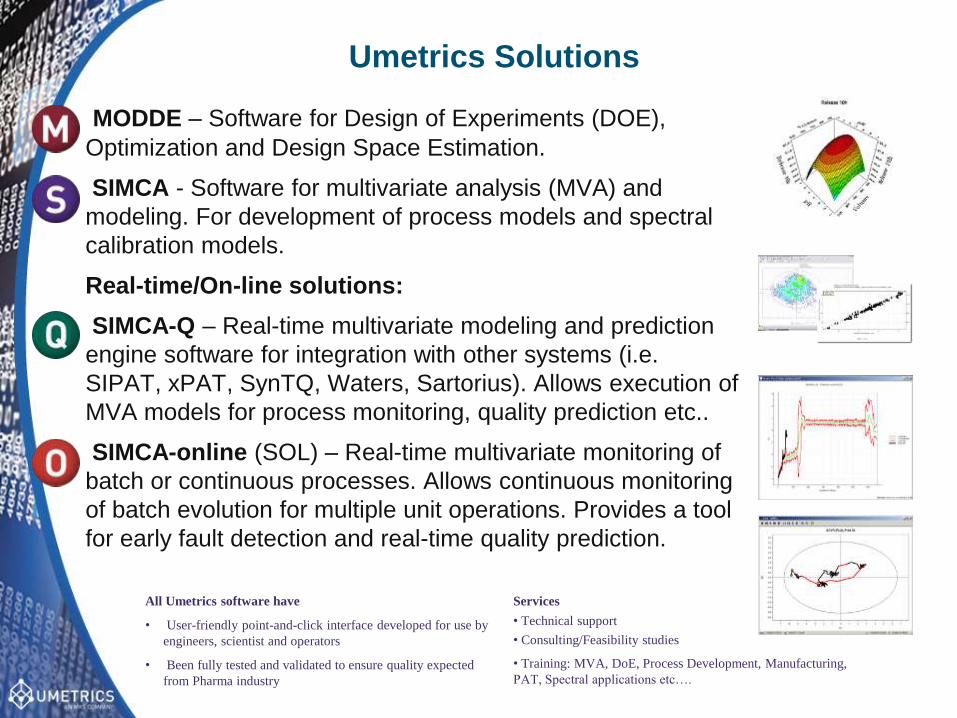
Umetrics Solutions
MODDE – Software for Design of Experiments (DOE),
Optimization and Design Space Estimation.
SIMCA - Software for multivariate analysis (MVA) and
modeling. For development of process models and spectral
calibration models.
Real-time/On-line solutions:
SIMCA-Q – Real-time multivariate modeling and prediction
engine software for integration with other systems (i.e.
SIPAT, xPAT, SynTQ, Waters, Sartorius). Allows execution of
MVA models for process monitoring, quality prediction etc..
SIMCA-online (SOL) – Real-time multivariate monitoring of
batch or continuous processes. Allows continuous monitoring
of batch evolution for multiple unit operations. Provides a tool
for early fault detection and real-time quality prediction.
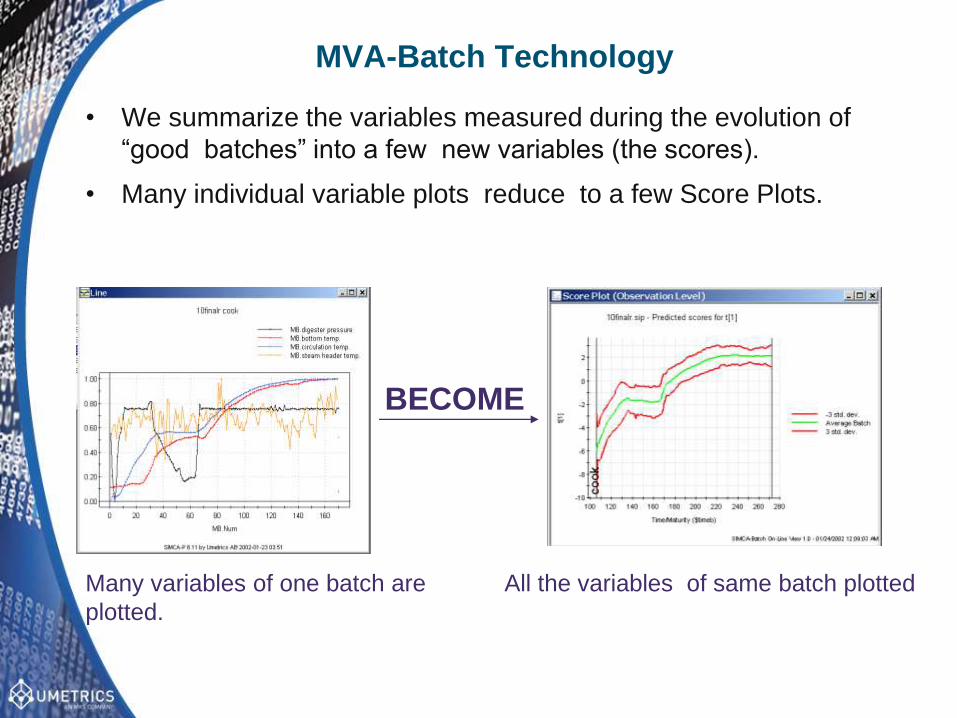
MVA-Batch Technology
• We summarize the variables measured during the evolution of
“good batches” into a few new variables (the scores).
• Many individual variable plots reduce to a few Score Plots.
Many variables of one batch are
plotted.
BECOME
All the variables of same batch plotted
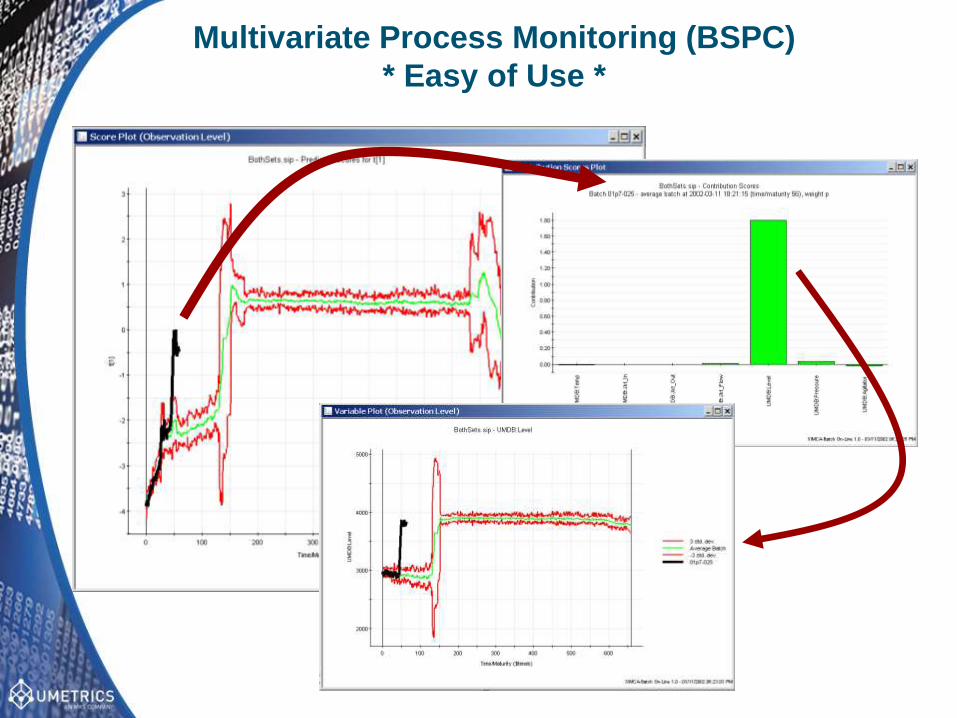
Multivariate Process Monitoring (BSPC)
* Easy of Use *
Overview of Umetrics SolutionSIMCA - offline
• Historical Data Analysis
• Model Building
• Process Characterization
• Process Investigation
Starting material
400 l
2000 l
10000 l
Down
Stream
SIMCA-online (Real Time)
• Monitoring
• Prediction
• Fault Diagnosis
Process
Historians
(PI Server)
SimApi
Spectra
Process
sensors
Instruments
Lab QA LIMS
SimApi
SimApi
Data
In
tegra
tion
Layer
SIMCA process model
DEMO
SIMCA-online 13
41
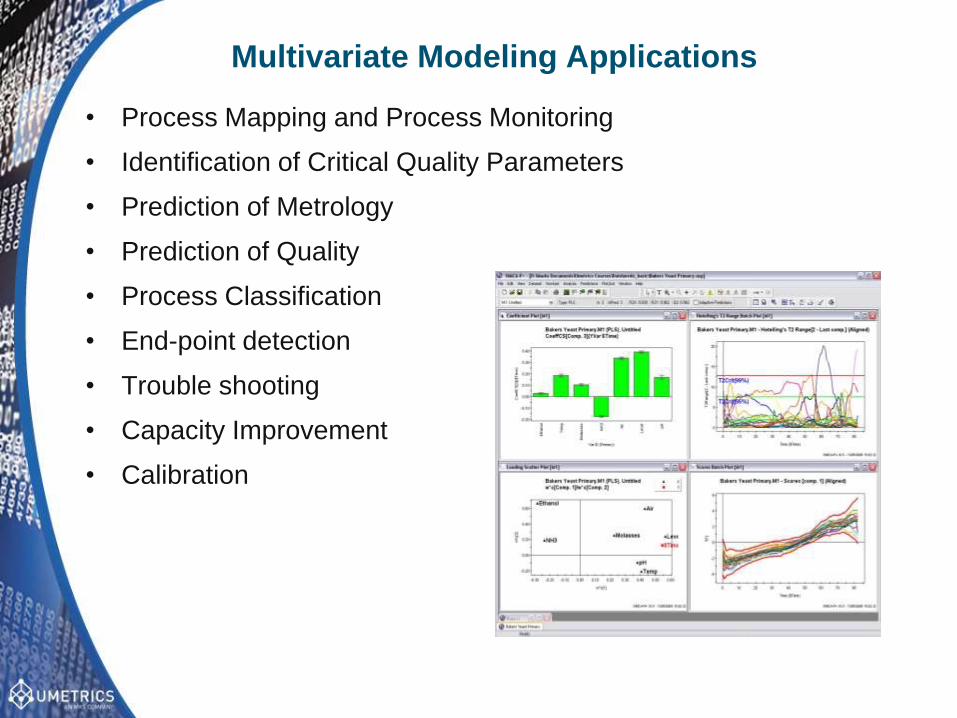
• Process Mapping and Process Monitoring
• Identification of Critical Quality Parameters
• Prediction of Metrology
• Prediction of Quality
• Process Classification
• End-point detection
• Trouble shooting
• Capacity Improvement
• Calibration
Multivariate Modeling Applications
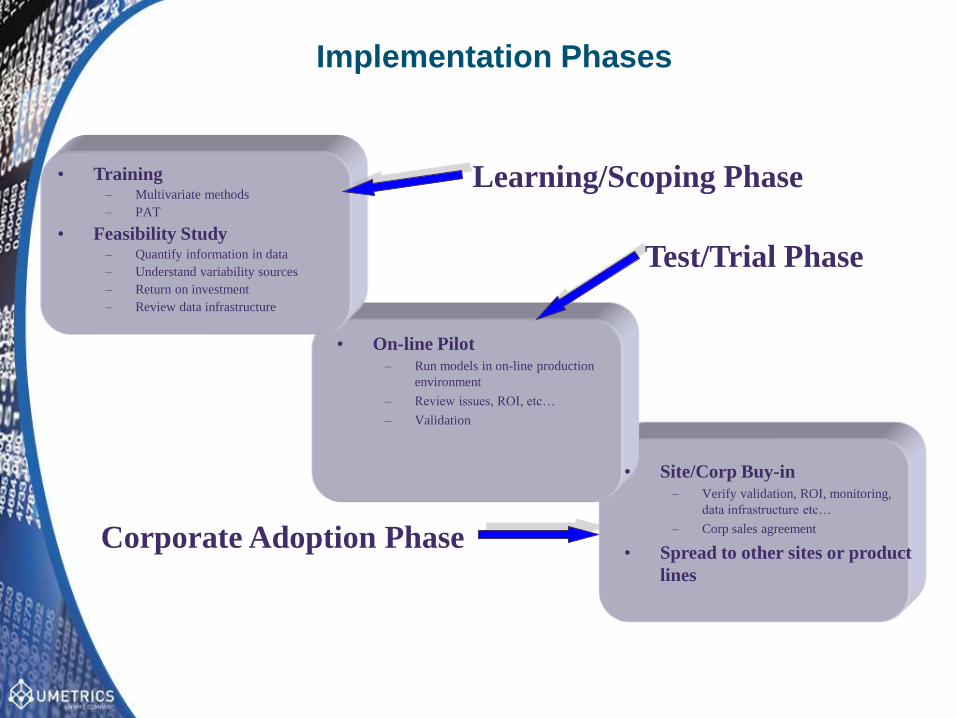
Implementation Phases
• Site/Corp Buy-in– Verify validation, ROI, monitoring,
data infrastructure etc…
– Corp sales agreement
• Spread to other sites or product
lines
• On-line Pilot– Run models in on-line production
environment
– Review issues, ROI, etc…
– Validation
Learning/Scoping Phase
Test/Trial Phase
Corporate Adoption Phase
• Training– Multivariate methods
– PAT
• Feasibility Study– Quantify information in data
– Understand variability sources
– Return on investment
– Review data infrastructure
Umetrics and OSIsoft
SIMCA-online and the PI System set the standard for real-time
multivariate monitoring, prediction and control
• More than 80% of Umetrics install base uses PI System with
SIMCA-online.
– Corporate installations with e.g Novartis, Biogen, Amgen, Merck etc.
• Close partnership between the companies for more than 8 years
• Documentation is available by both companies
• Support has escalated channels via OSIsoft
• Supports batch processes & continuous processes
• Full support for catch-up, re-prediction, export and reporting
45UMETRICS CONFIDENTIAL
Relationships
46UMETRICS CONFIDENTIAL
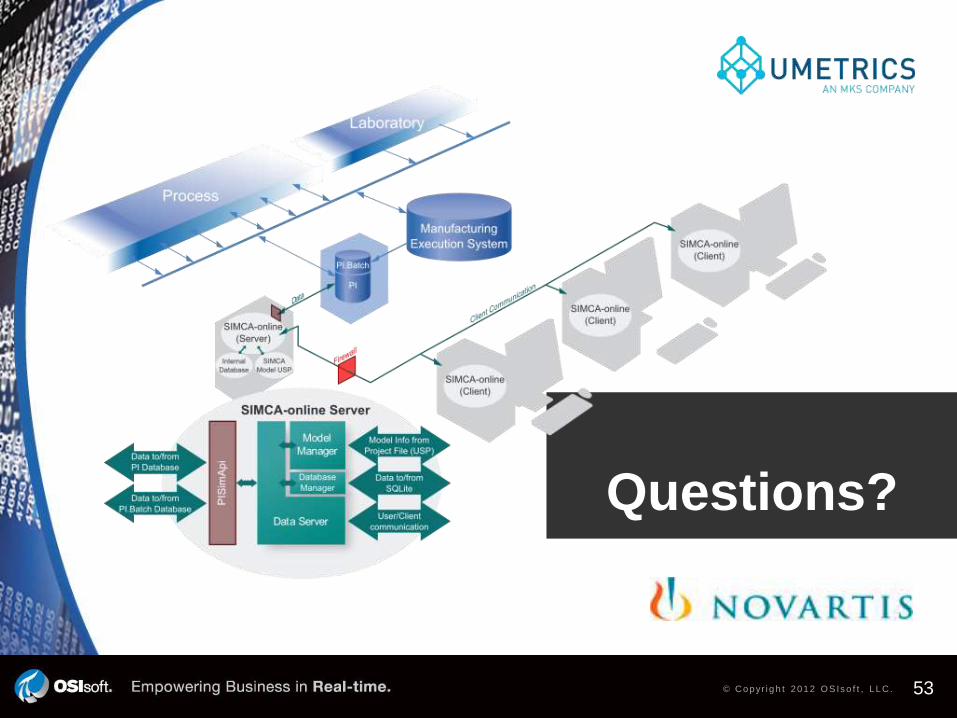
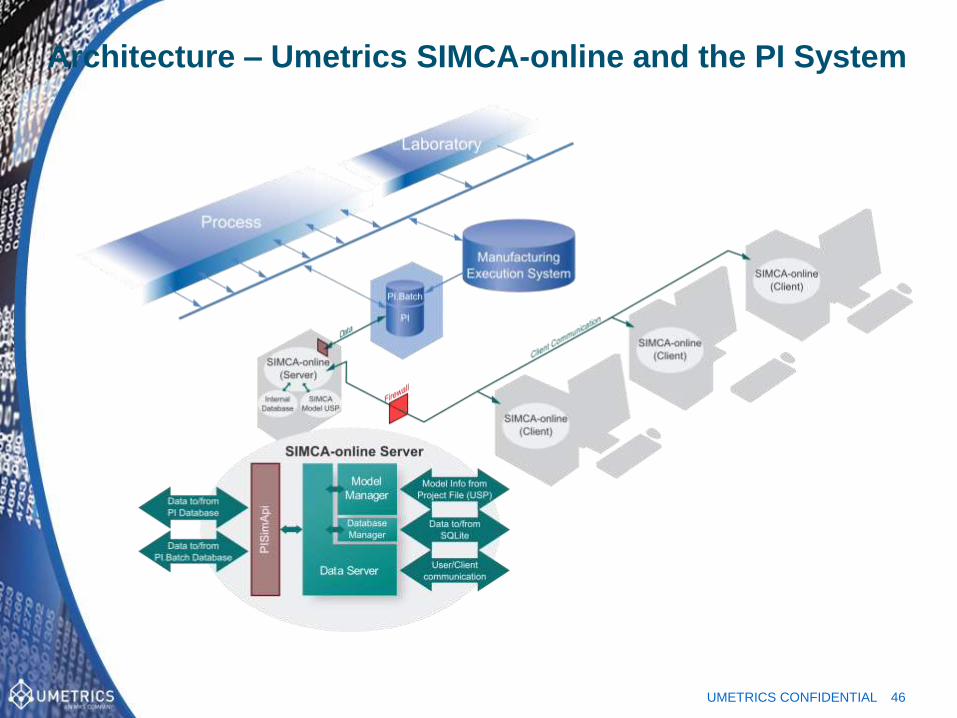
Architecture – Umetrics SIMCA-online and the PI System
47UMETRICS CONFIDENTIAL
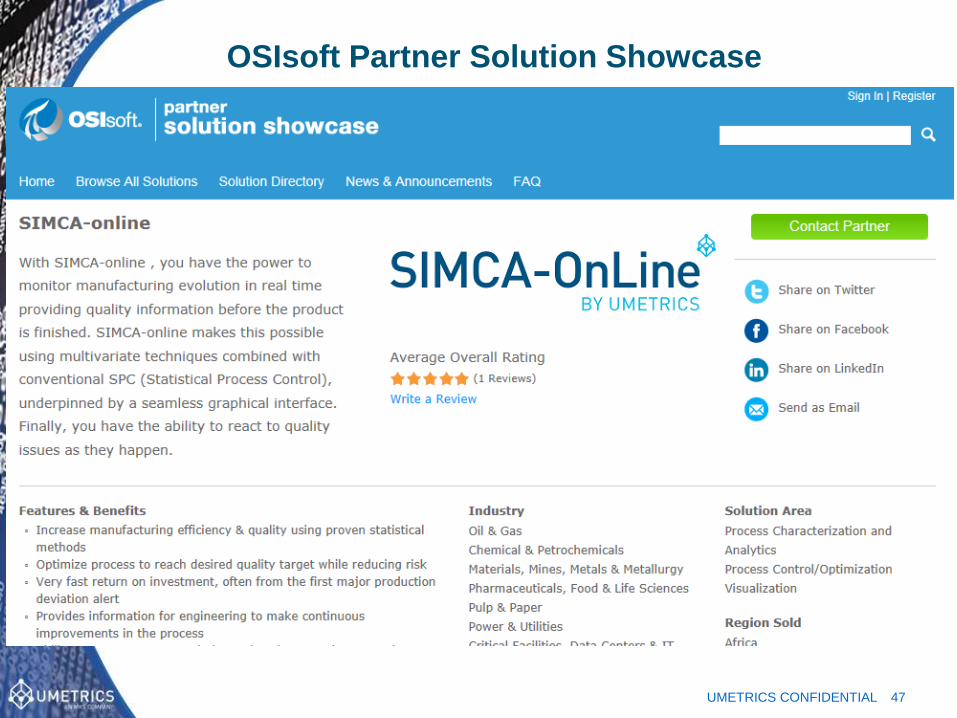
OSIsoft Partner Solution Showcase
48UMETRICS CONFIDENTIAL
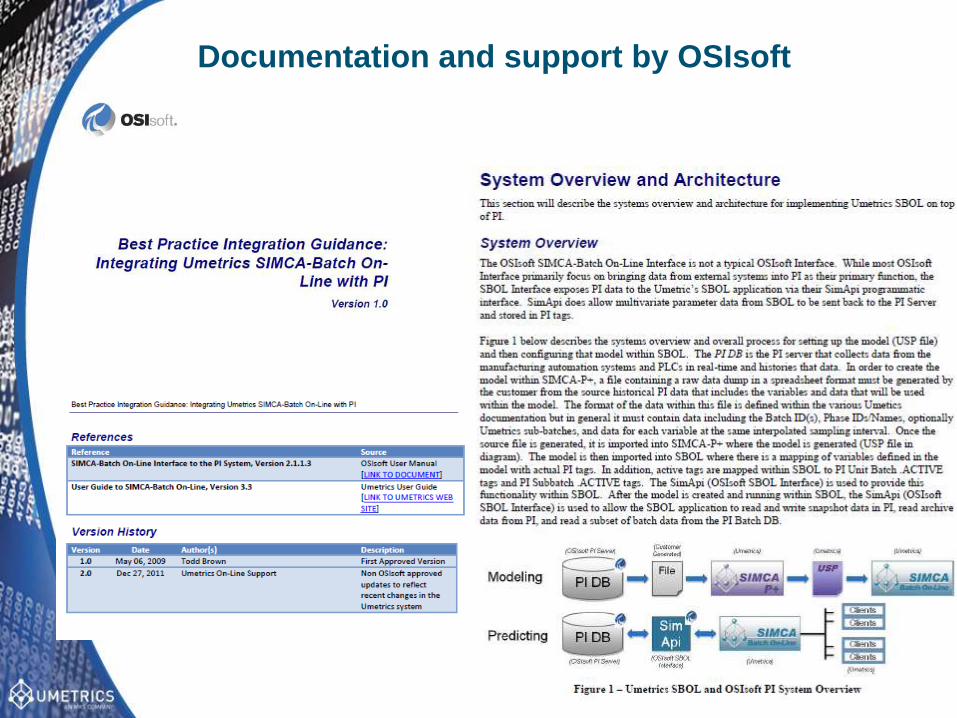
Documentation and support by OSIsoft
Regulatory References
• Umetrics is in close relation with regulatory
• Performed 3 day trainings for inspectors and assessors in MVA,
Batch MVA and DOE.
• Regular review submissions.
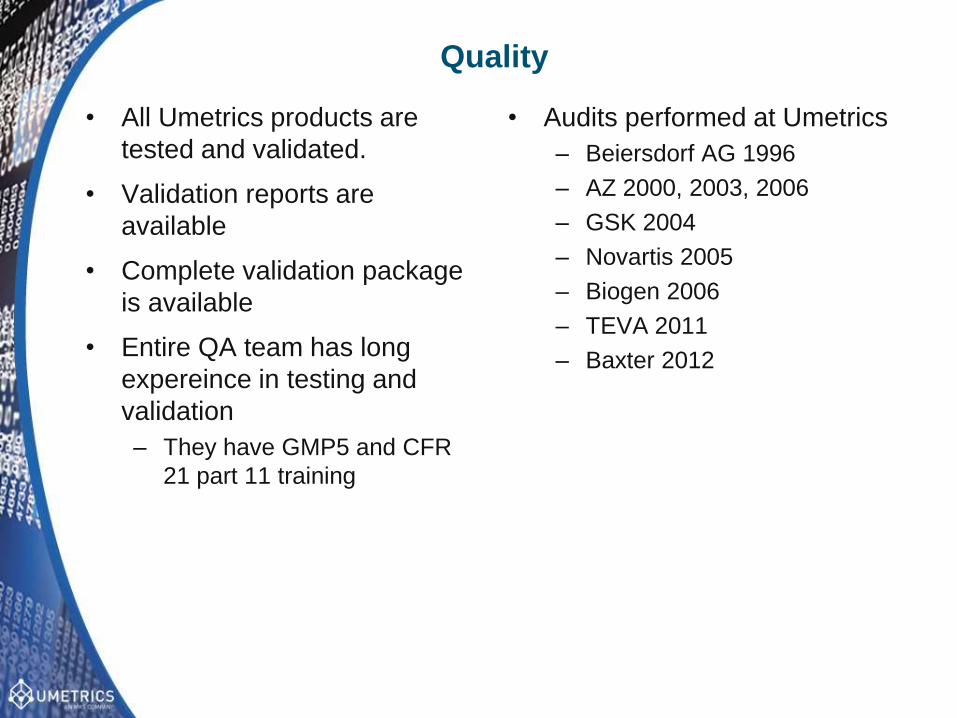
Quality
• All Umetrics products are
tested and validated.
• Validation reports are
available
• Complete validation package
is available
• Entire QA team has long
expereince in testing and
validation
– They have GMP5 and CFR
21 part 11 training
• Audits performed at Umetrics
– Beiersdorf AG 1996
– AZ 2000, 2003, 2006
– GSK 2004
– Novartis 2005
– Biogen 2006
– TEVA 2011
– Baxter 2012

Some of Umetrics Customers
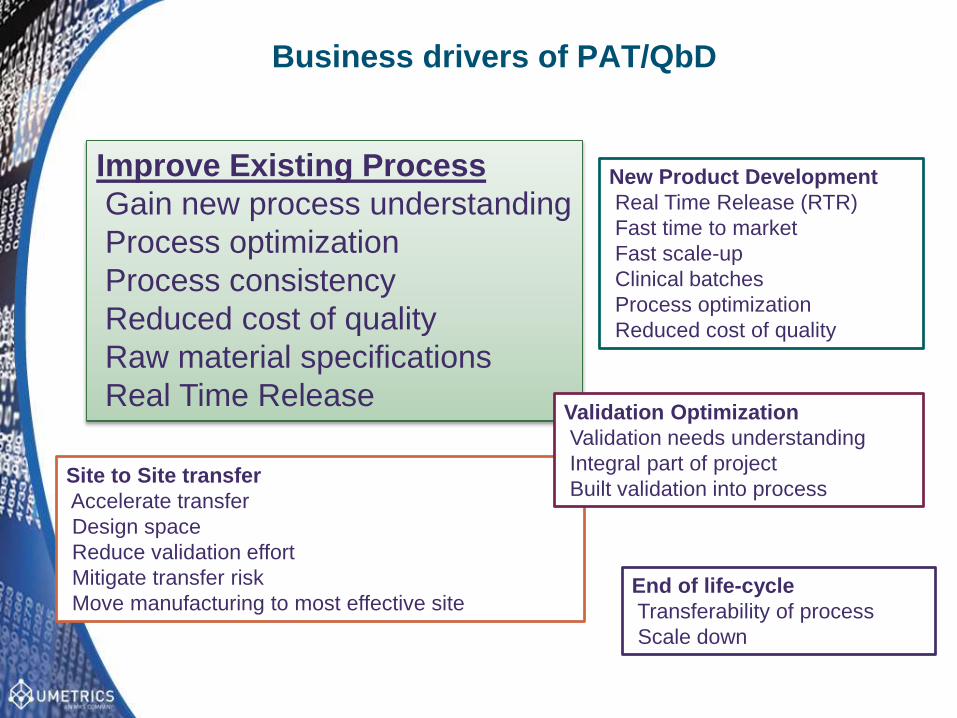
Business drivers of PAT/QbD
Improve Existing Process
Gain new process understanding
Process optimization
Process consistency
Reduced cost of quality
Raw material specifications
Real Time Release
Site to Site transfer
Accelerate transfer
Design space
Reduce validation effort
Mitigate transfer risk
Move manufacturing to most effective site
Validation Optimization
Validation needs understanding
Integral part of project
Built validation into process
New Product Development
Real Time Release (RTR)
Fast time to market
Fast scale-up
Clinical batches
Process optimization
Reduced cost of quality
End of life-cycle
Transferability of process
Scale down
© Copyr i g h t 2012 OS Iso f t , LLC . 54
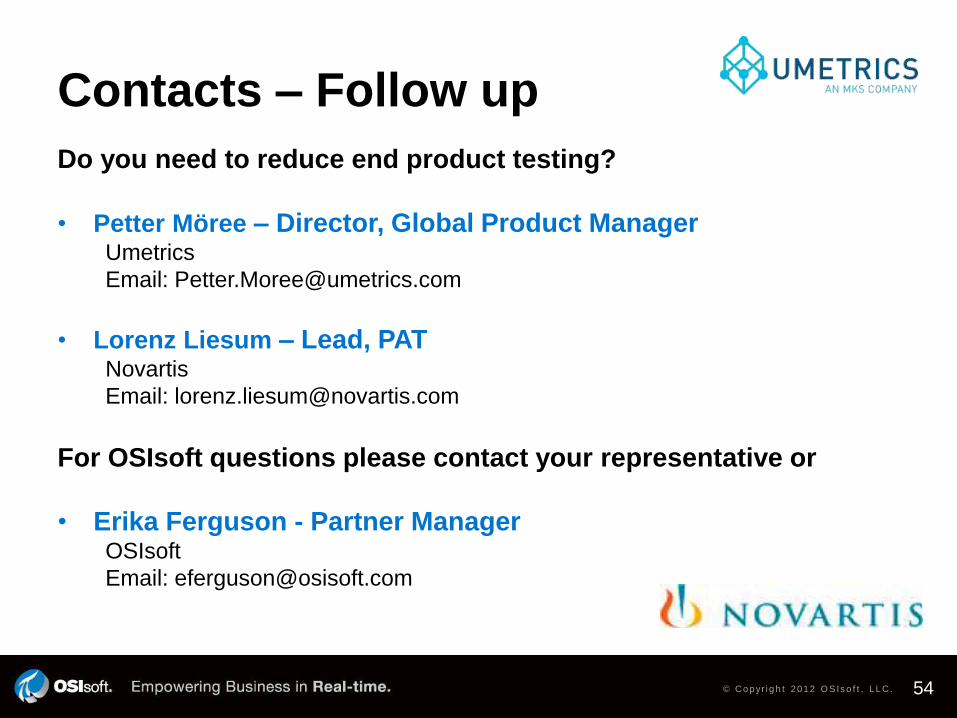
Contacts – Follow up
Do you need to reduce end product testing?
• Petter Möree – Director, Global Product ManagerUmetrics
Email: [email protected]
• Lorenz Liesum – Lead, PATNovartis
Email: [email protected]
For OSIsoft questions please contact your representative or
• Erika Ferguson - Partner ManagerOSIsoft
Email: [email protected]

© Copyr i g h t 2012 OS Iso f t , LLC . 55
Next Webinar – August 7
Title: How Owl Computing Technologie’s Next Generation
of Cyber Defense Solved RasGas’ Urgent Need for
Improved Network Security.
Content: In august 2013, the RasGas office computer
systems were struck by an unknown virus attack that
caused the company to disconnect its plant automation
systems from the corporate network to insure operations
were not disrupted by the virus. The result of disconnecting
the plant and business networks was an interruption of
information flow from the production networks to the
business networks….
Thank you
© Copyright 2012 OSIsoft, LLC.
777 Davis St., San Leandro, CA 94577