Embed Size (px)
Citation preview
EQSTRA UNAUDITED RESULTS FOR THE SIX MONTHS ENDED 31 DECEMBER 20140
2015
UNAUDITED INTERIM RESULTSFOR THE SIX MONTHS ENDED 31 DECEMBER 2014
EQSTRA UNAUDITED RESULTS FOR THE SIX MONTHS ENDED 31 DECEMBER 20141
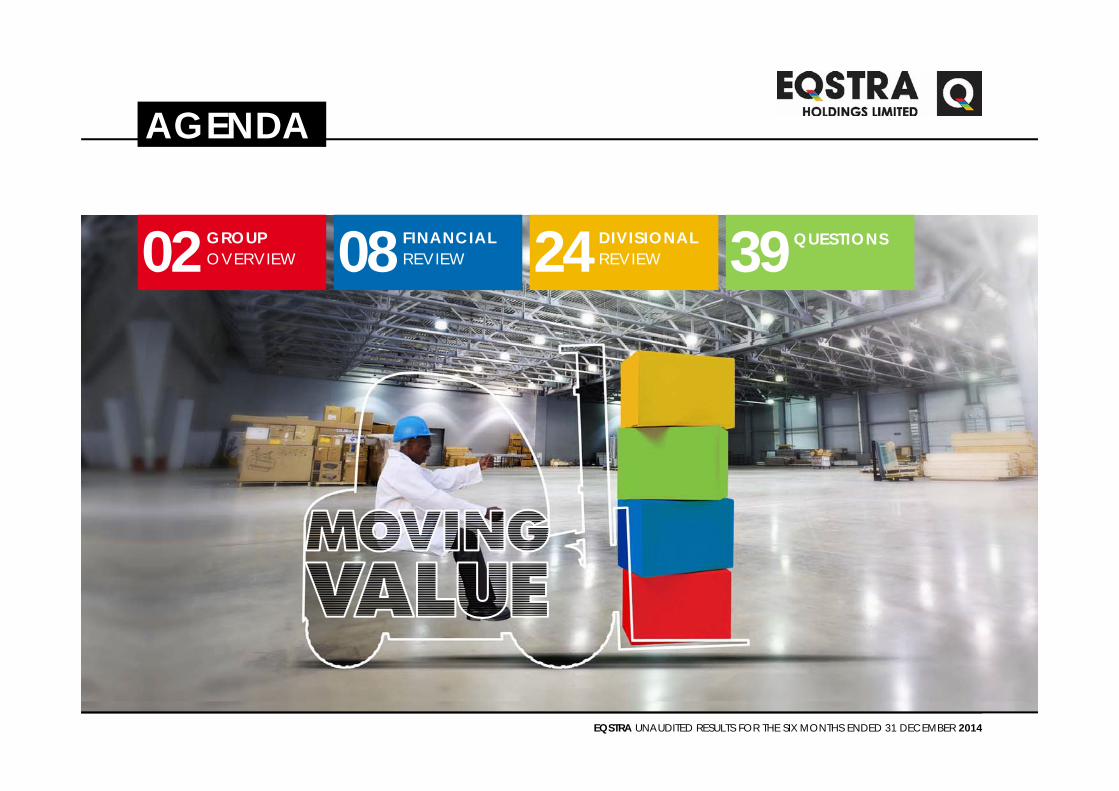
AGENDA
02GROUP OVERVIEW 08FINANCIAL
REVIEW 24DIVISIONALREVIEW 39QUESTIONS
EQSTRA UNAUDITED RESULTS FOR THE SIX MONTHS ENDED 31 DECEMBER 20142
02GROUP OVERVIEW
EQSTRA UNAUDITED RESULTS FOR THE SIX MONTHS ENDED 31 DECEMBER 20143
GROUP OVERVIEW
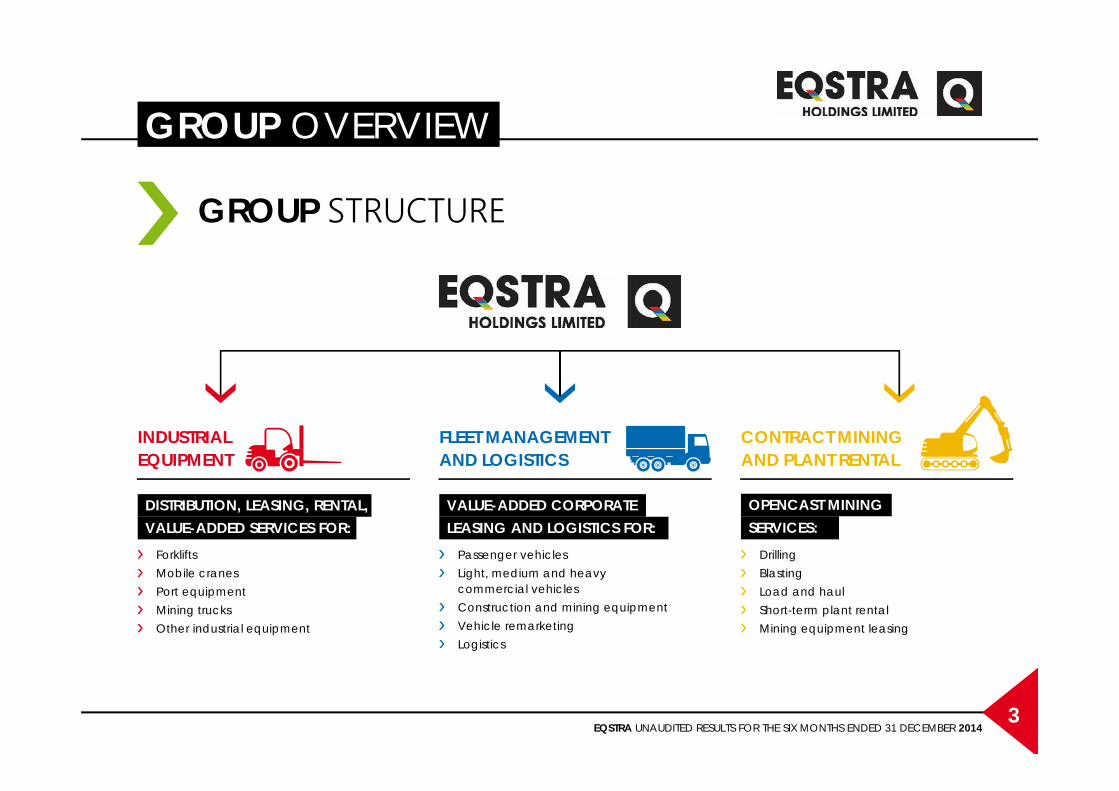
GROUP STRUCTURE
DISTRIBUTION, LEASING, RENTAL,VALUE-ADDED SERVICES FOR:
INDUSTRIALEQUIPMENT
ForkliftsMobile cranesPort equipmentMining trucksOther industrial equipment
VALUE-ADDED CORPORATELEASING AND LOGISTICS FOR:
FLEET MANAGEMENTAND LOGISTICS
Passenger vehiclesLight, medium and heavycommercial vehiclesConstruction and mining equipmentVehicle remarketingLogistics
OPENCAST MININGSERVICES:
CONTRACT MININGAND PLANT RENTAL
DrillingBlastingLoad and haulShort-term plant rentalMining equipment leasing
EQSTRA UNAUDITED RESULTS FOR THE SIX MONTHS ENDED 31 DECEMBER 20144
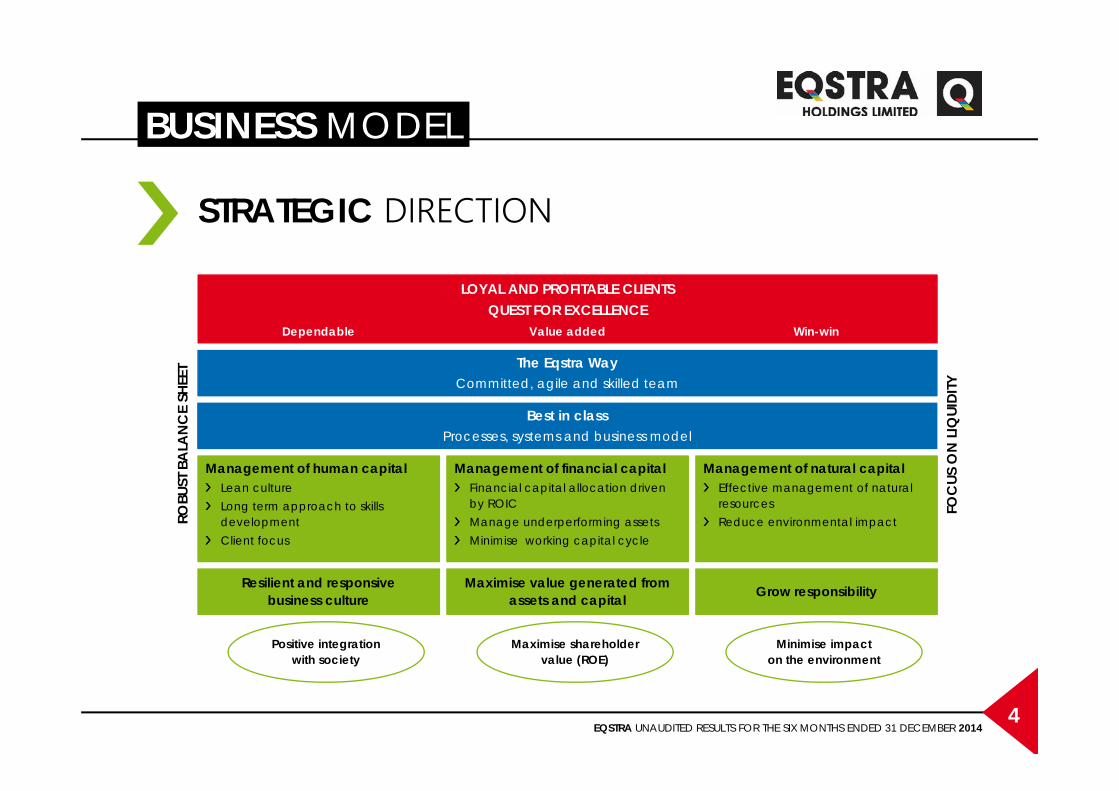
BUSINESS MODEL
STRATEGIC DIRECTION
Management of human capitalLean cultureLong term approach to skills developmentClient focus
Management of financial capitalFinancial capital allocation drivenby ROICManage underperforming assetsMinimise working capital cycle
Management of natural capitalEffective management of natural resourcesReduce environmental impact
LOYAL AND PROFITABLE CLIENTSQUEST FOR EXCELLENCE
The Eqstra WayCommitted, agile and skilled team
Best in classProcesses, systems and business model
Resilient and responsivebusiness culture
Maximise value generated fromassets and capital Grow responsibility
ROBU
ST B
ALA
NC
E SH
EET
FOC
US O
N L
IQUI
DITY
Dependable Value added Win-win
Positive integrationwith society
Maximise shareholder value (ROE)
Minimise impacton the environment
EQSTRA UNAUDITED RESULTS FOR THE SIX MONTHS ENDED 31 DECEMBER 20145
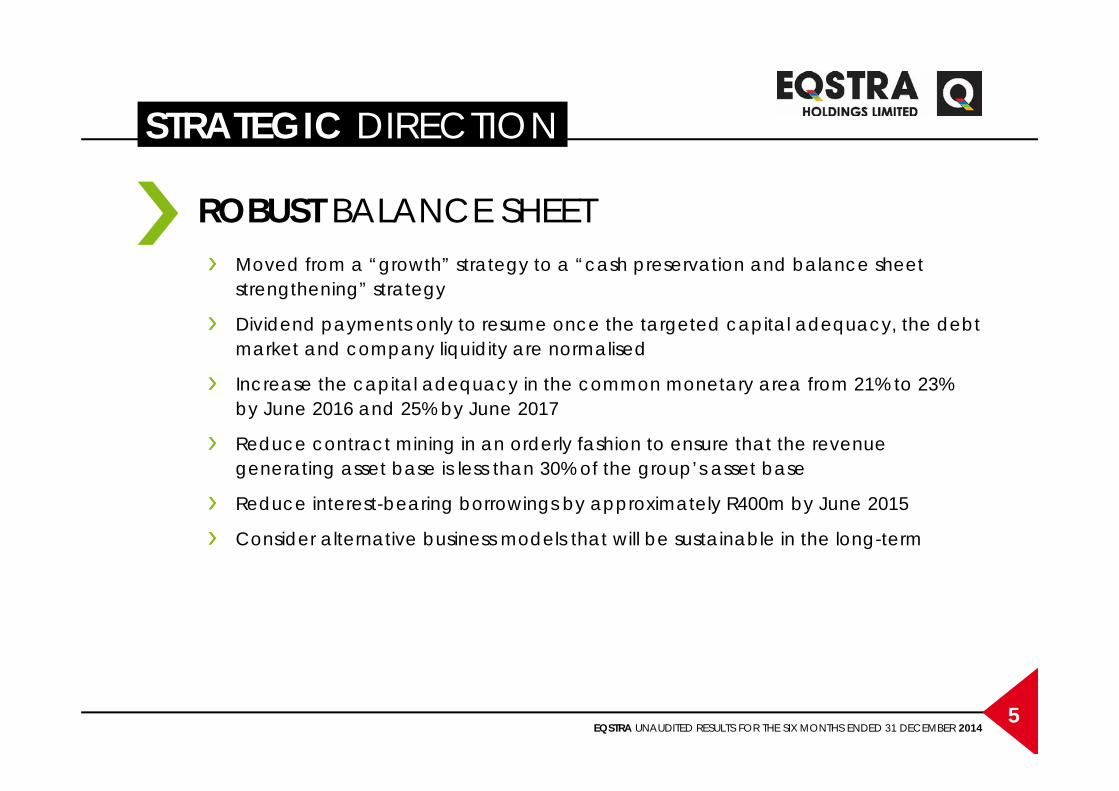
STRATEGIC DIRECTION
Moved from a “growth” strategy to a “cash preservation and balance sheet strengthening” strategy
Dividend payments only to resume once the targeted capital adequacy, the debt market and company liquidity are normalised
Increase the capital adequacy in the common monetary area from 21% to 23%by June 2016 and 25% by June 2017
Reduce contract mining in an orderly fashion to ensure that the revenue generating asset base is less than 30% of the group’s asset base
Reduce interest-bearing borrowings by approximately R400m by June 2015
Consider alternative business models that will be sustainable in the long-term
ROBUST BALANCE SHEET
EQSTRA UNAUDITED RESULTS FOR THE SIX MONTHS ENDED 31 DECEMBER 20146
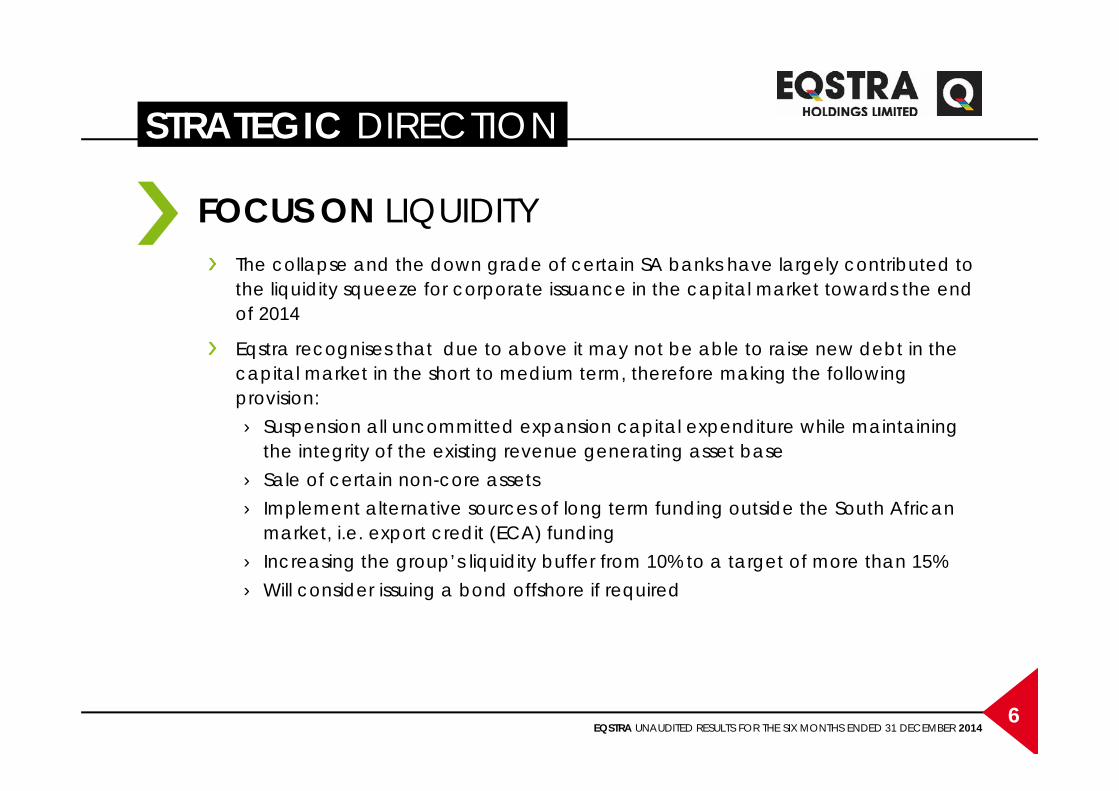
STRATEGIC DIRECTION
The collapse and the down grade of certain SA banks have largely contributed to the liquidity squeeze for corporate issuance in the capital market towards the end of 2014
Eqstra recognises that due to above it may not be able to raise new debt in the capital market in the short to medium term, therefore making the following provision:› Suspension all uncommitted expansion capital expenditure while maintaining
the integrity of the existing revenue generating asset base› Sale of certain non-core assets› Implement alternative sources of long term funding outside the South African
market, i.e. export credit (ECA) funding› Increasing the group’s liquidity buffer from 10% to a target of more than 15%› Will consider issuing a bond offshore if required
FOCUS ON LIQUIDITY
EQSTRA UNAUDITED RESULTS FOR THE SIX MONTHS ENDED 31 DECEMBER 20147
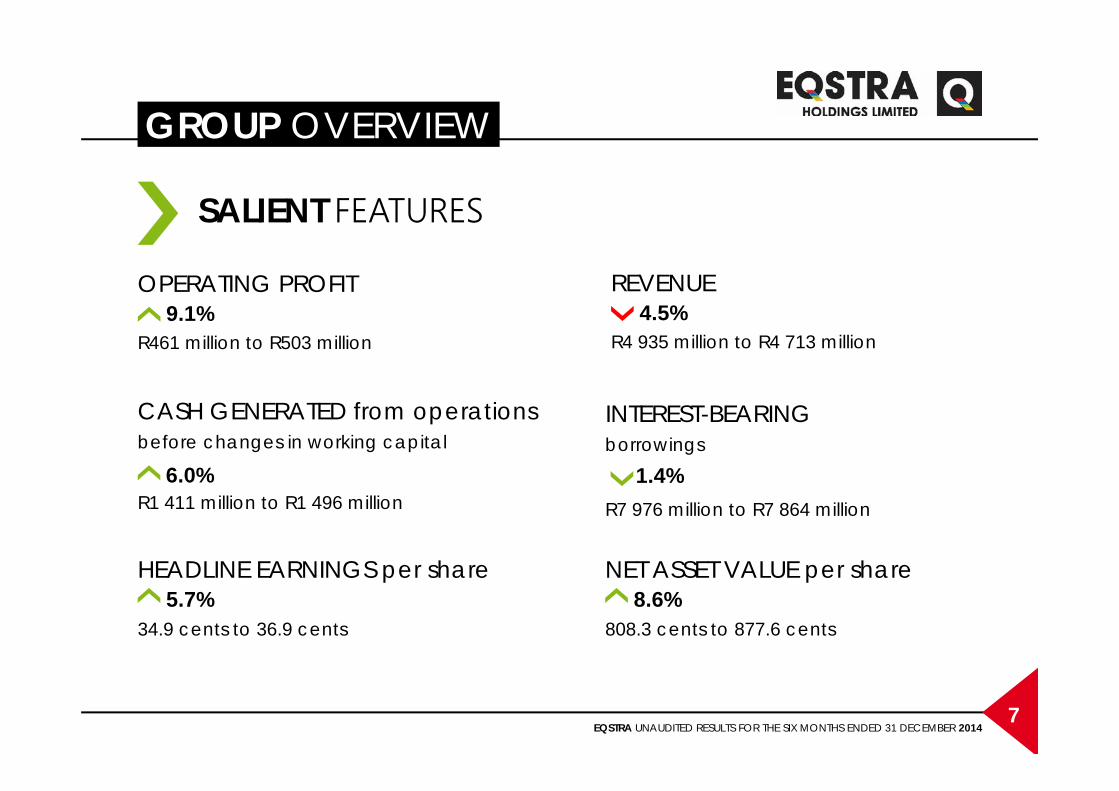
GROUP OVERVIEW
SALIENT FEATURES
OPERATING PROFIT9.1%
R461 million to R503 million
6.0%R1 411 million to R1 496 million
CASH GENERATED from operations before changes in working capital
34.9 cents to 36.9 cents
HEADLINE EARNINGS per share5.7%
REVENUE4.5%
R4 935 million to R4 713 million
1.4%R7 976 million to R7 864 million
808.3 cents to 877.6 cents
NET ASSET VALUE per share 8.6%
INTEREST-BEARING borrowings
EQSTRA UNAUDITED RESULTS FOR THE SIX MONTHS ENDED 31 DECEMBER 20148
08FINANCIAL REVIEW
EQSTRA UNAUDITED RESULTS FOR THE SIX MONTHS ENDED 31 DECEMBER 20149
FINANCIAL REVIEW
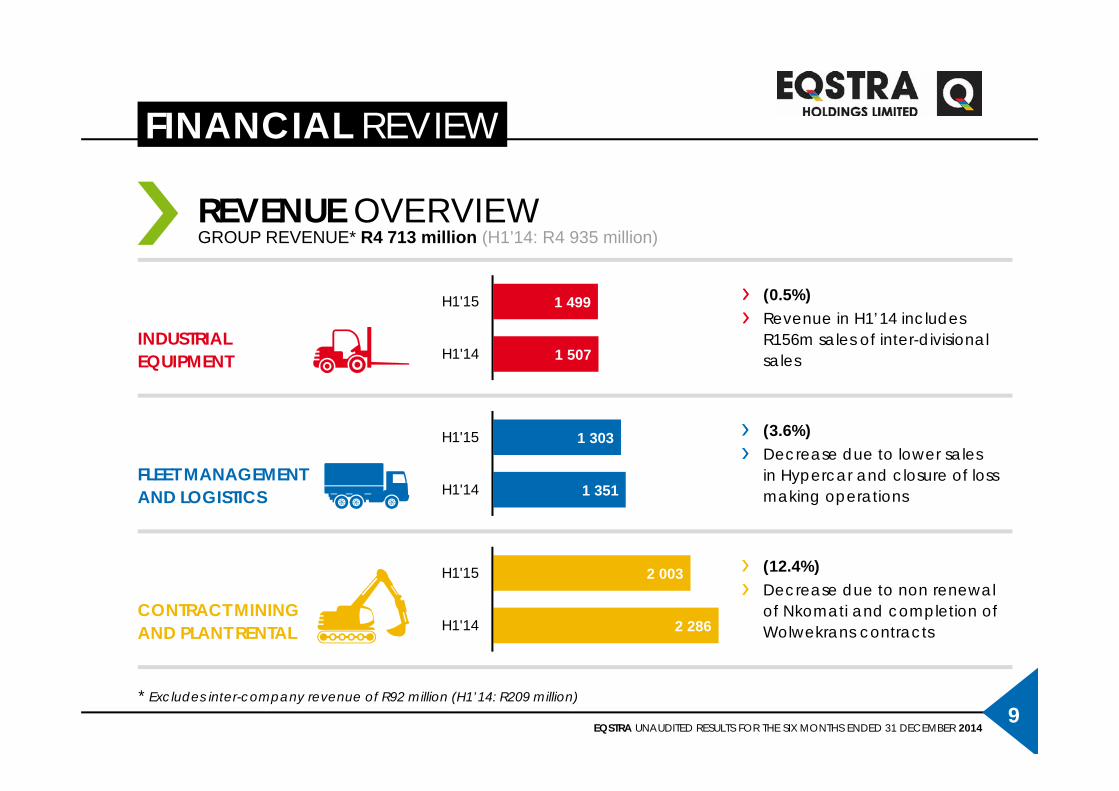
* Excludes inter-company revenue of R92 million (H1’14: R209 million)
REVENUE OVERVIEWGROUP REVENUE* R4 713 million (H1’14: R4 935 million)
INDUSTRIALEQUIPMENT
FLEET MANAGEMENTAND LOGISTICS
CONTRACT MININGAND PLANT RENTAL
1 507
1 499
H1'14
H1'15 (0.5%)Revenue in H1’14 includes R156m sales of inter-divisional sales
1 351
1 303
H1'14
H1'15 (3.6%)Decrease due to lower salesin Hypercar and closure of loss making operations
2 286
2 003
H1'14
H1'15 (12.4%)Decrease due to non renewal of Nkomati and completion of Wolwekrans contracts
EQSTRA UNAUDITED RESULTS FOR THE SIX MONTHS ENDED 31 DECEMBER 201410
FINANCIAL REVIEW
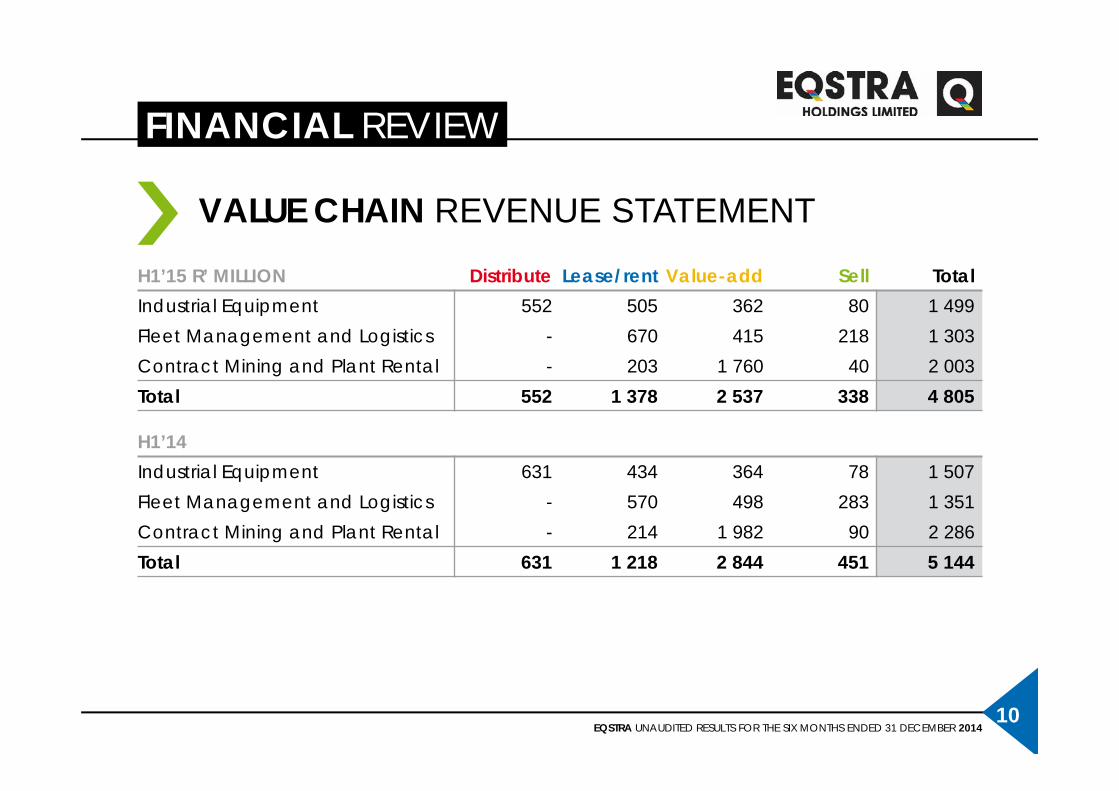
VALUE CHAIN REVENUE STATEMENT
H1’15 R’ MILLION Distribute Lease/rent Value-add Sell TotalIndustrial Equipment 552 505 362 80 1 499Fleet Management and Logistics - 670 415 218 1 303Contract Mining and Plant Rental - 203 1 760 40 2 003Total 552 1 378 2 537 338 4 805
H1’14Industrial Equipment 631 434 364 78 1 507Fleet Management and Logistics - 570 498 283 1 351Contract Mining and Plant Rental - 214 1 982 90 2 286Total 631 1 218 2 844 451 5 144
EQSTRA UNAUDITED RESULTS FOR THE SIX MONTHS ENDED 31 DECEMBER 201411
FINANCIAL REVIEW
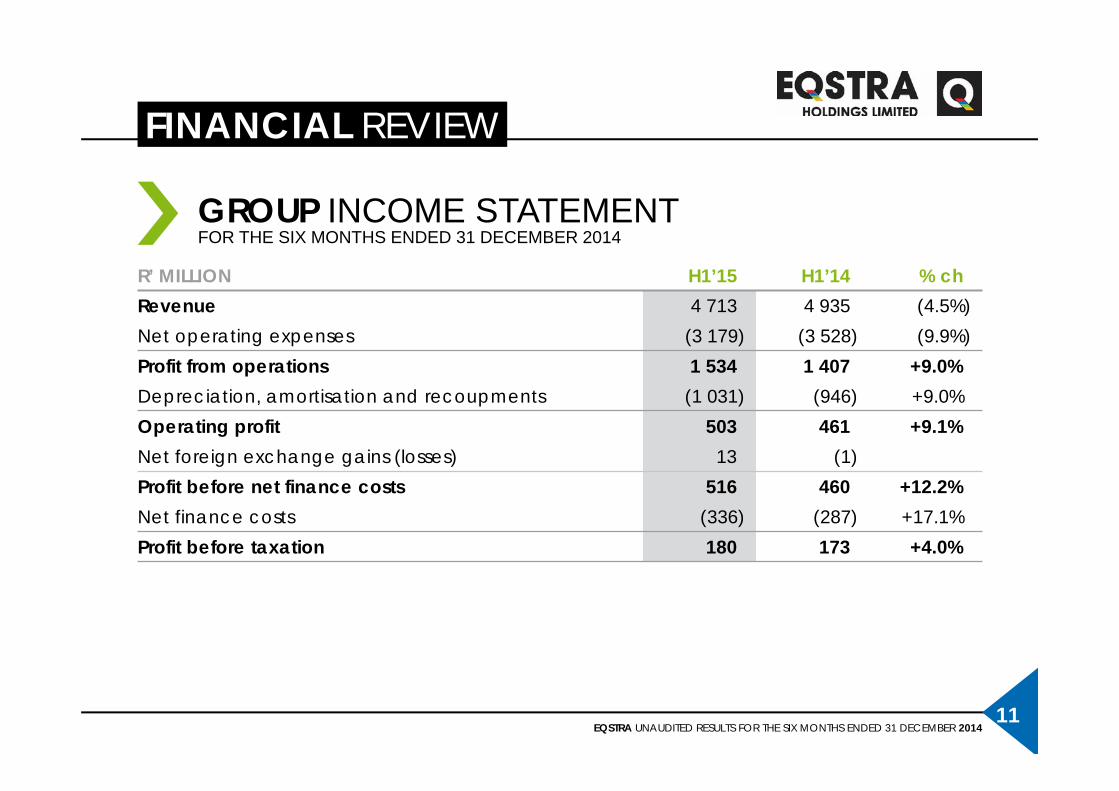
GROUP INCOME STATEMENT
R’ MILLION H1’15 H1’14 % chRevenue 4 713 4 935 (4.5%)Net operating expenses (3 179) (3 528) (9.9%)Profit from operations 1 534 1 407 +9.0%Depreciation, amortisation and recoupments (1 031) (946) +9.0%Operating profit 503 461 +9.1%Net foreign exchange gains (losses) 13 (1)Profit before net finance costs 516 460 +12.2%Net finance costs (336) (287) +17.1%Profit before taxation 180 173 +4.0%
FOR THE SIX MONTHS ENDED 31 DECEMBER 2014
EQSTRA UNAUDITED RESULTS FOR THE SIX MONTHS ENDED 31 DECEMBER 201412
FINANCIAL REVIEW
GROUP INCOME STATEMENT (cont.)
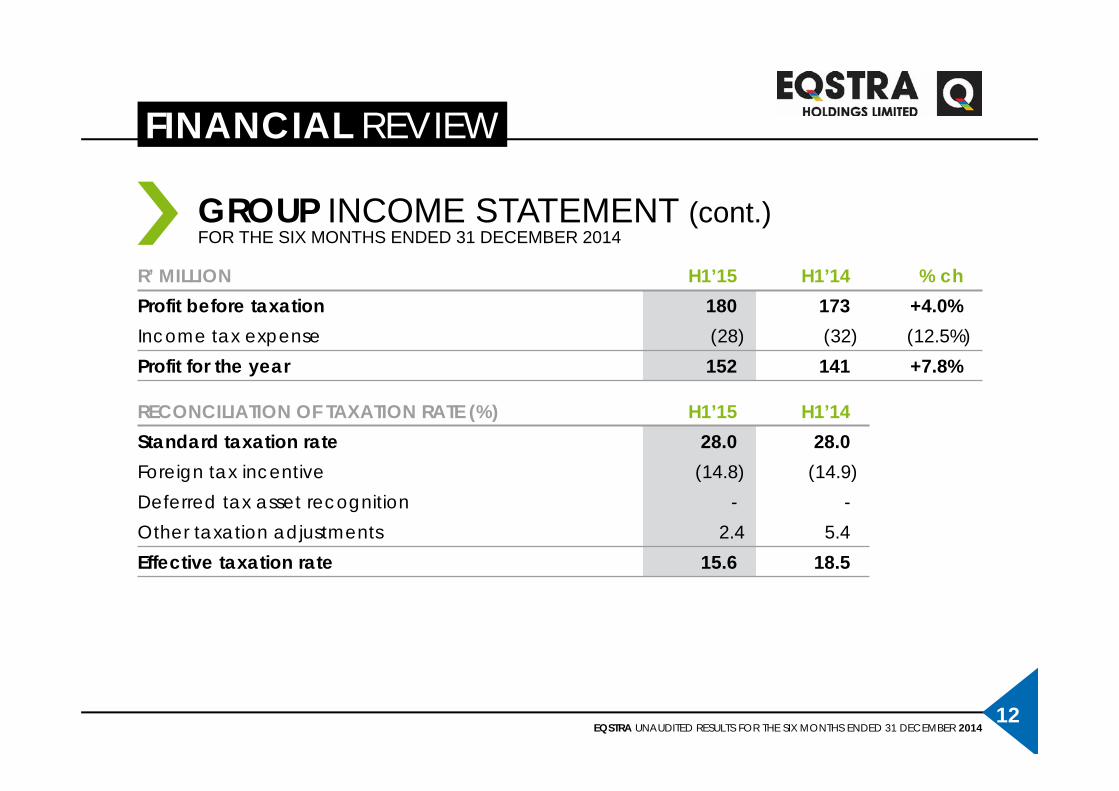
R’ MILLION H1’15 H1’14 % chProfit before taxation 180 173 +4.0%Income tax expense (28) (32) (12.5%)Profit for the year 152 141 +7.8%
RECONCILIATION OF TAXATION RATE (%) H1’15 H1’14Standard taxation rate 28.0 28.0Foreign tax incentive (14.8) (14.9)Deferred tax asset recognition - -Other taxation adjustments 2.4 5.4Effective taxation rate 15.6 18.5
FOR THE SIX MONTHS ENDED 31 DECEMBER 2014
EQSTRA UNAUDITED RESULTS FOR THE SIX MONTHS ENDED 31 DECEMBER 201413
FINANCIAL REVIEW
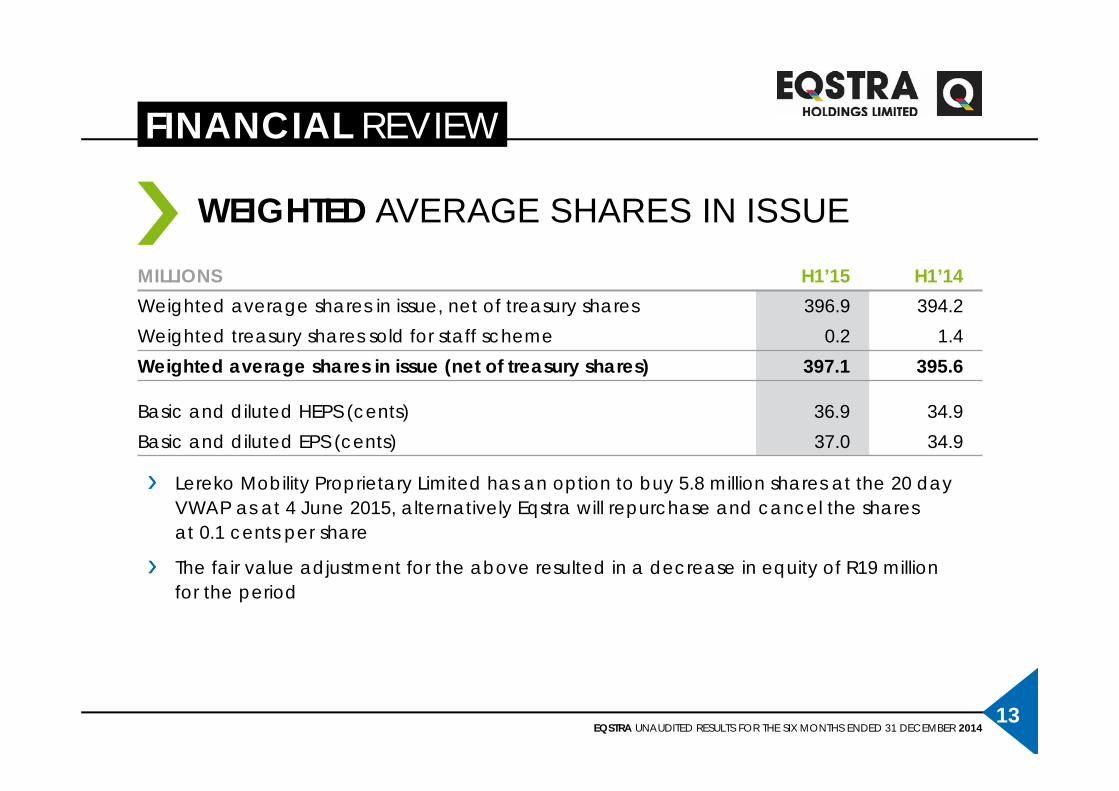
Lereko Mobility Proprietary Limited has an option to buy 5.8 million shares at the 20 day VWAP as at 4 June 2015, alternatively Eqstra will repurchase and cancel the sharesat 0.1 cents per share
The fair value adjustment for the above resulted in a decrease in equity of R19 millionfor the period
WEIGHTED AVERAGE SHARES IN ISSUE
MILLIONS H1’15 H1’14Weighted average shares in issue, net of treasury shares 396.9 394.2Weighted treasury shares sold for staff scheme 0.2 1.4Weighted average shares in issue (net of treasury shares) 397.1 395.6
Basic and diluted HEPS (cents) 36.9 34.9Basic and diluted EPS (cents) 37.0 34.9
EQSTRA UNAUDITED RESULTS FOR THE SIX MONTHS ENDED 31 DECEMBER 201414
FINANCIAL REVIEW
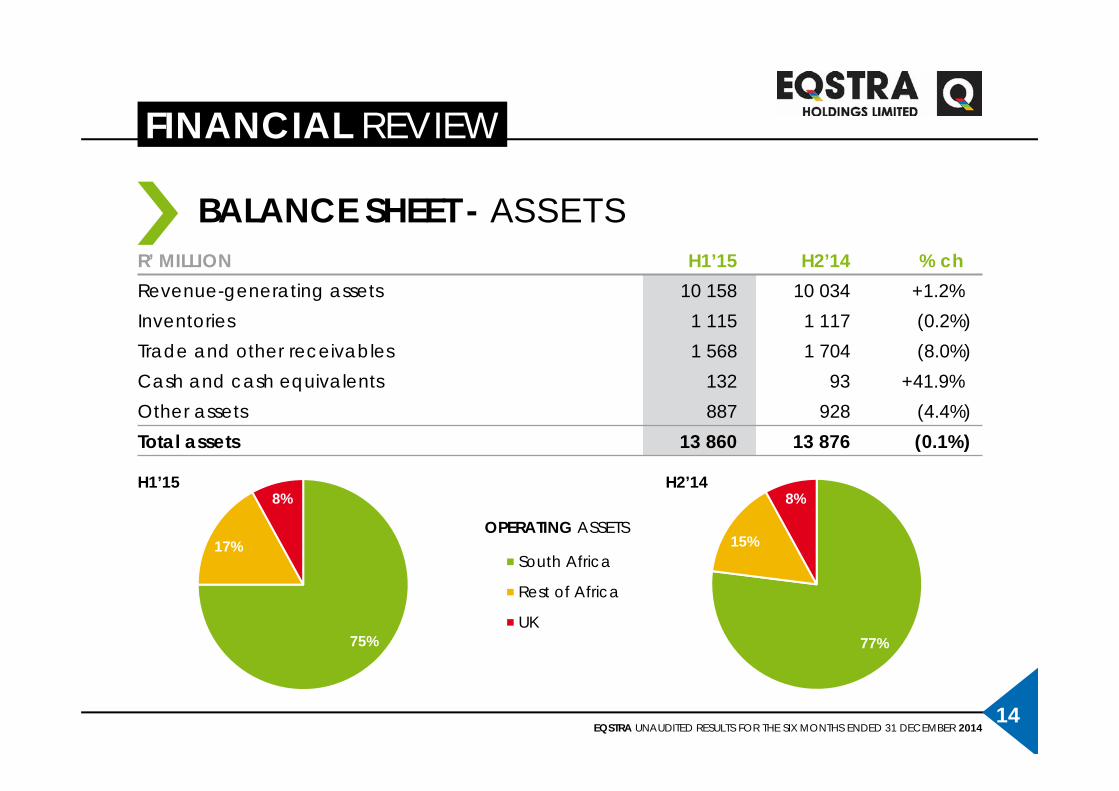
BALANCE SHEET - ASSETSR’ MILLION H1’15 H2’14 % chRevenue-generating assets 10 158 10 034 +1.2%Inventories 1 115 1 117 (0.2%)Trade and other receivables 1 568 1 704 (8.0%)Cash and cash equivalents 132 93 +41.9%Other assets 887 928 (4.4%)Total assets 13 860 13 876 (0.1%)
75%
17%
8%
South Africa
Rest of Africa
UK77%
15%
8%H1’15 H2’14
OPERATING ASSETS
EQSTRA UNAUDITED RESULTS FOR THE SIX MONTHS ENDED 31 DECEMBER 201415
FINANCIAL REVIEW
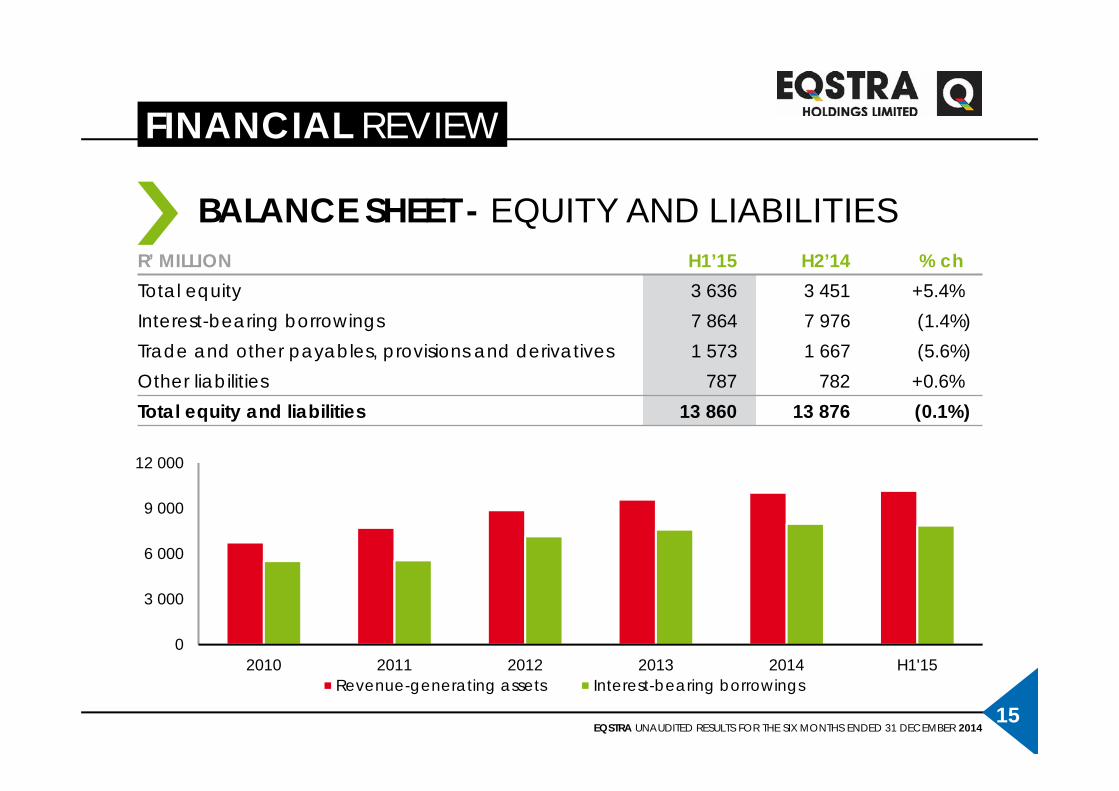
BALANCE SHEET - EQUITY AND LIABILITIESR’ MILLION H1’15 H2’14 % chTotal equity 3 636 3 451 +5.4%Interest-bearing borrowings 7 864 7 976 (1.4%)Trade and other payables, provisions and derivatives 1 573 1 667 (5.6%)Other liabilities 787 782 +0.6%Total equity and liabilities 13 860 13 876 (0.1%)
0
3 000
6 000
9 000
12 000
2010 2011 2012 2013 2014 H1'15Revenue-generating assets Interest-bearing borrowings

EQSTRA UNAUDITED RESULTS FOR THE SIX MONTHS ENDED 31 DECEMBER 201416
FINANCIAL REVIEW
* Includes R292 million (2014: R335 million) of leasing assets transferred to inventory as a non cash flow item
CASH FLOW STATEMENT
R’ MILLION H1’15 H1’14 % chCash generated from operationsbefore working capital movements 1 496 1 411 +6.0%Working capital movements* 409 257 +59.1%Cash generated from operations 1 905 1 668 +14.2%Cash flows from interest and taxation (348) (298) +16.8%Net cash flows from operating activities 1 557 1 370 +13.6%Net cash flows from investing activities (1 356) (1 702) (20.3%)Net cash flows from financing activities (169) 96Net increase (decrease) in cash and cash equivalentsbefore effect of exchange rate 32 (236)
EQSTRA UNAUDITED RESULTS FOR THE SIX MONTHS ENDED 31 DECEMBER 201417
FINANCIAL REVIEW
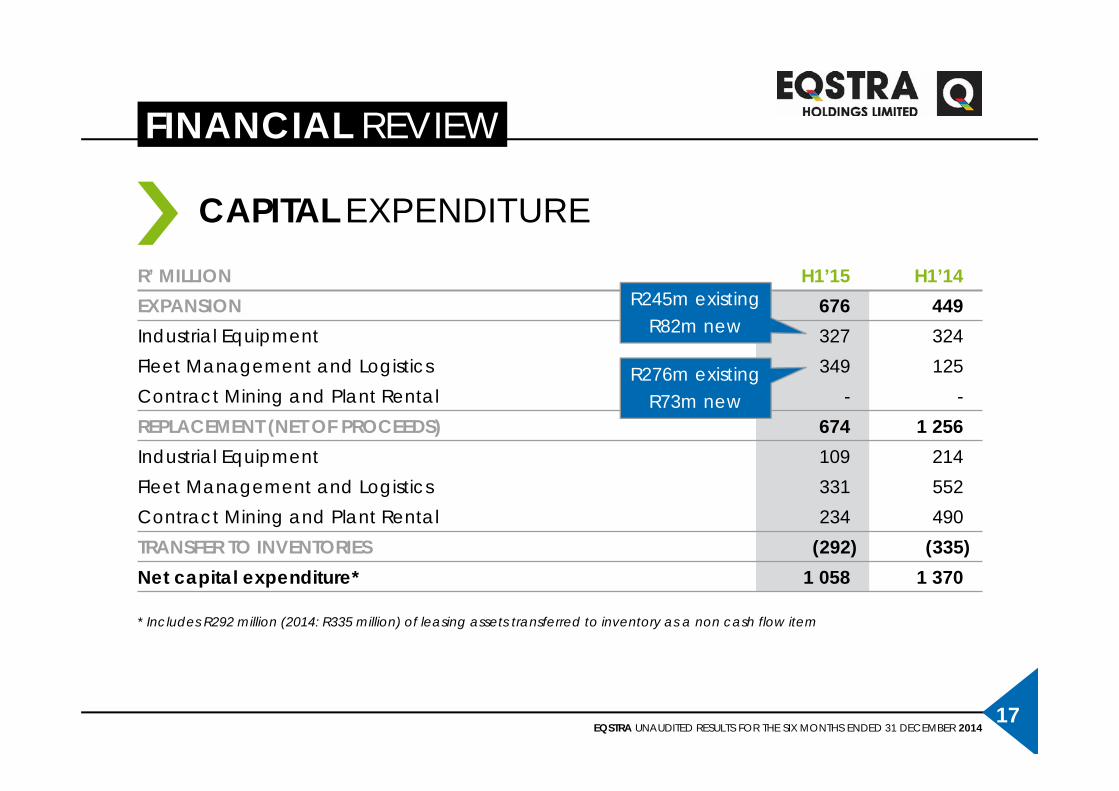
* Includes R292 million (2014: R335 million) of leasing assets transferred to inventory as a non cash flow item
CAPITAL EXPENDITURE
R’ MILLION H1’15 H1’14EXPANSION 676 449Industrial Equipment 327 324Fleet Management and Logistics 349 125Contract Mining and Plant Rental - -REPLACEMENT (NET OF PROCEEDS) 674 1 256Industrial Equipment 109 214Fleet Management and Logistics 331 552Contract Mining and Plant Rental 234 490TRANSFER TO INVENTORIES (292) (335)Net capital expenditure* 1 058 1 370
R245m existingR82m new
R276m existingR73m new
EQSTRA UNAUDITED RESULTS FOR THE SIX MONTHS ENDED 31 DECEMBER 201418
FINANCIAL REVIEW
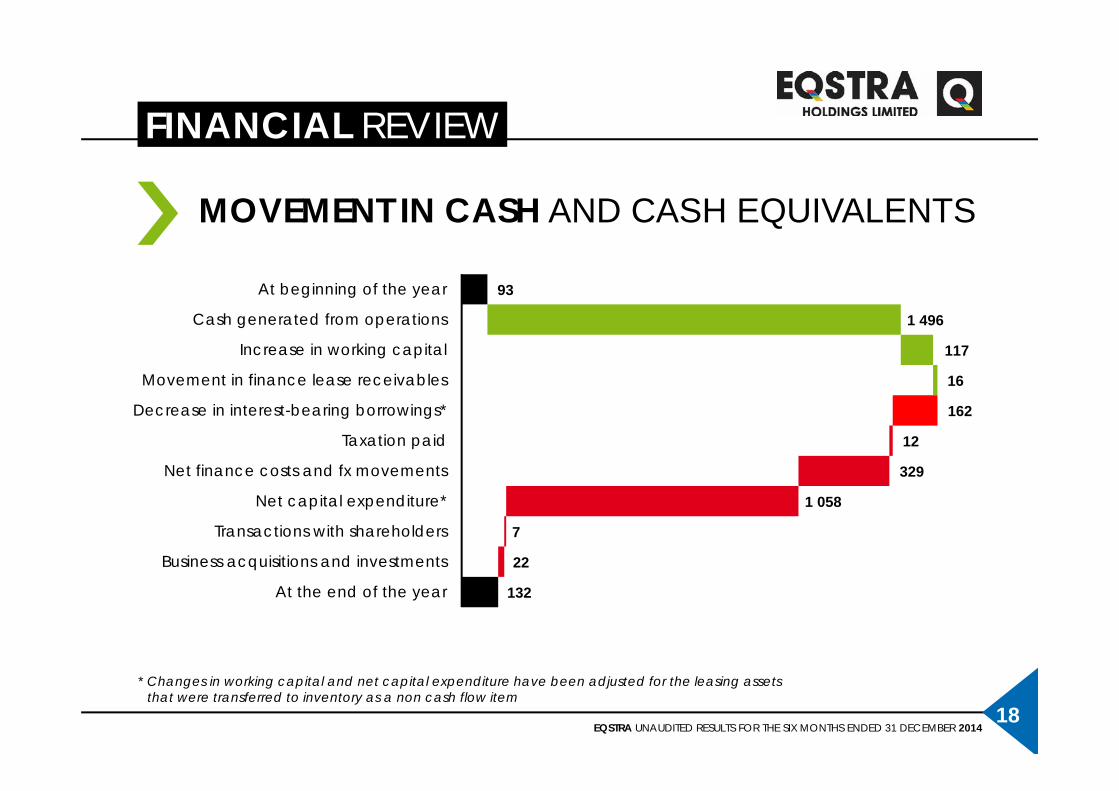
* Changes in working capital and net capital expenditure have been adjusted for the leasing assetsthat were transferred to inventory as a non cash flow item
MOVEMENT IN CASH AND CASH EQUIVALENTS
93
1 496
117
16
162
12
329
1 058
7
22
132
At beginning of the year
Cash generated from operations
Increase in working capital
Movement in finance lease receivables
Decrease in interest-bearing borrowings*
Taxation paid
Net finance costs and fx movements
Net capital expenditure*
Transactions with shareholders
Business acquisitions and investments
At the end of the year
EQSTRA UNAUDITED RESULTS FOR THE SIX MONTHS ENDED 31 DECEMBER 201419
FINANCIAL REVIEW
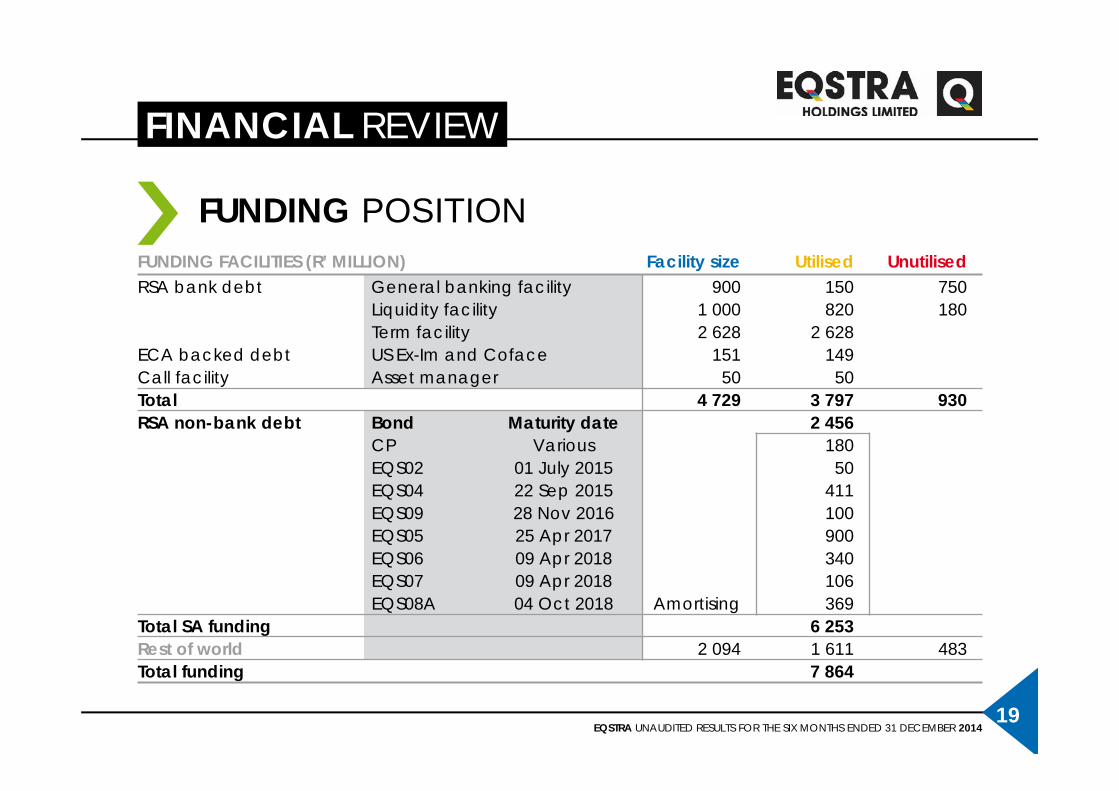
FUNDING POSITION FUNDING FACILITIES (R’ MILLION) Facility size Utilised UnutilisedRSA bank debt General banking facility 900 150 750
Liquidity facility 1 000 820 180Term facility 2 628 2 628
ECA backed debt US Ex-Im and Coface 151 149Call facility Asset manager 50 50Total 4 729 3 797 930RSA non-bank debt Bond Maturity date 2 456
CP Various 180EQS02 01 July 2015 50EQS04 22 Sep 2015 411EQS09 28 Nov 2016 100EQS05 25 Apr 2017 900EQS06 09 Apr 2018 340EQS07 09 Apr 2018 106EQS08A 04 Oct 2018 Amortising 369
Total SA funding 6 253Rest of world 2 094 1 611 483Total funding 7 864
EQSTRA UNAUDITED RESULTS FOR THE SIX MONTHS ENDED 31 DECEMBER 201420
FINANCIAL REVIEW
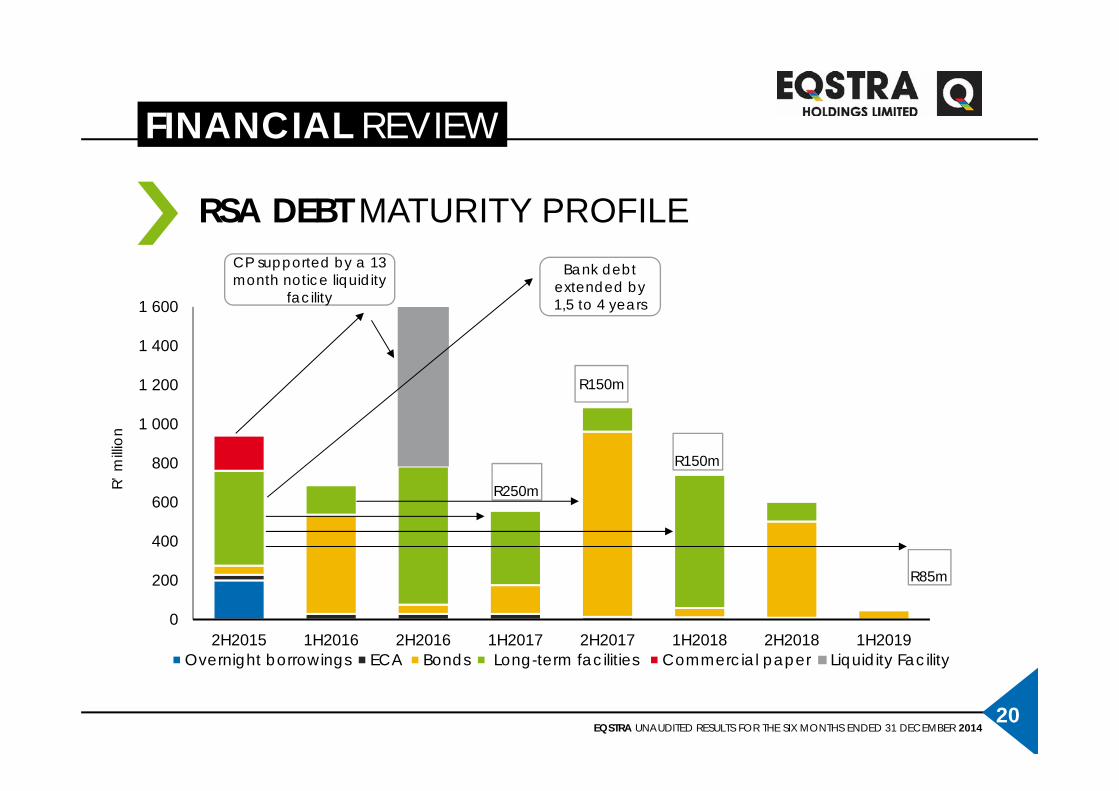
RSA DEBT MATURITY PROFILE
0
200
400
600
800
1 000
1 200
1 400
1 600
2H2015 1H2016 2H2016 1H2017 2H2017 1H2018 2H2018 1H2019
R’ m
illion
Overnight borrowings ECA Bonds Long-term facilities Commercial paper Liquidity Facility
Bank debt extended by 1,5 to 4 years
CP supported by a 13 month notice liquidity
facility
R250m
R150m
R150m
R85m
EQSTRA UNAUDITED RESULTS FOR THE SIX MONTHS ENDED 31 DECEMBER 201421
FINANCIAL REVIEW
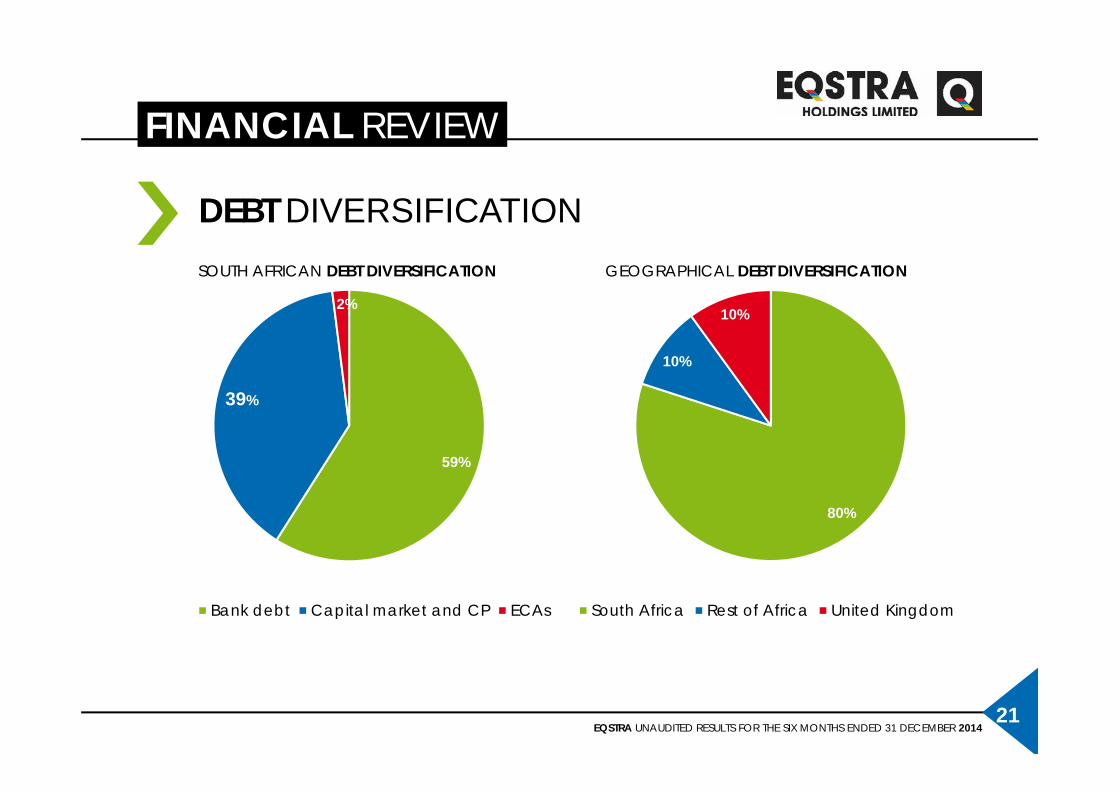
DEBT DIVERSIFICATIONSOUTH AFRICAN DEBT DIVERSIFICATION
80%
10%
10%
South Africa Rest of Africa United Kingdom
GEOGRAPHICAL DEBT DIVERSIFICATION
59%
39%
2%
Bank debt Capital market and CP ECAs
EQSTRA UNAUDITED RESULTS FOR THE SIX MONTHS ENDED 31 DECEMBER 201422
FINANCIAL REVIEW
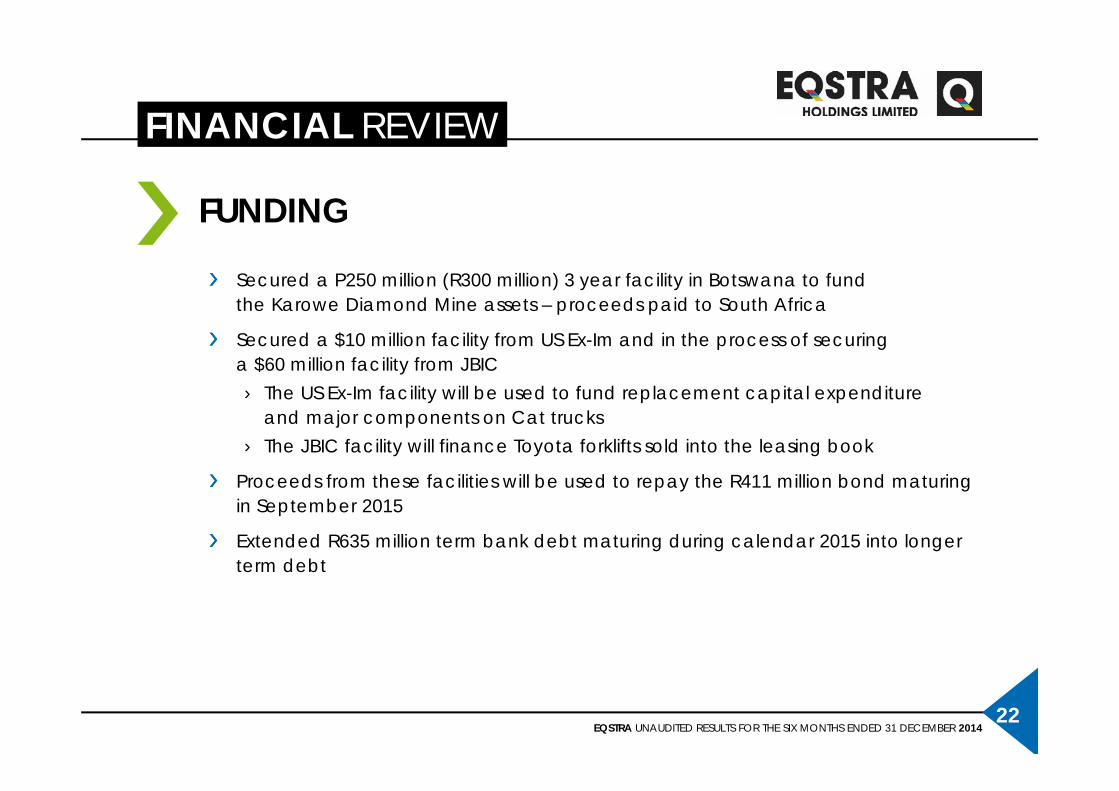
FUNDING
Secured a P250 million (R300 million) 3 year facility in Botswana to fundthe Karowe Diamond Mine assets – proceeds paid to South Africa
Secured a $10 million facility from US Ex-Im and in the process of securinga $60 million facility from JBIC› The US Ex-Im facility will be used to fund replacement capital expenditure
and major components on Cat trucks› The JBIC facility will finance Toyota forklifts sold into the leasing book
Proceeds from these facilities will be used to repay the R411 million bond maturing in September 2015
Extended R635 million term bank debt maturing during calendar 2015 into longer term debt
EQSTRA UNAUDITED RESULTS FOR THE SIX MONTHS ENDED 31 DECEMBER 201423
FINANCIAL REVIEW
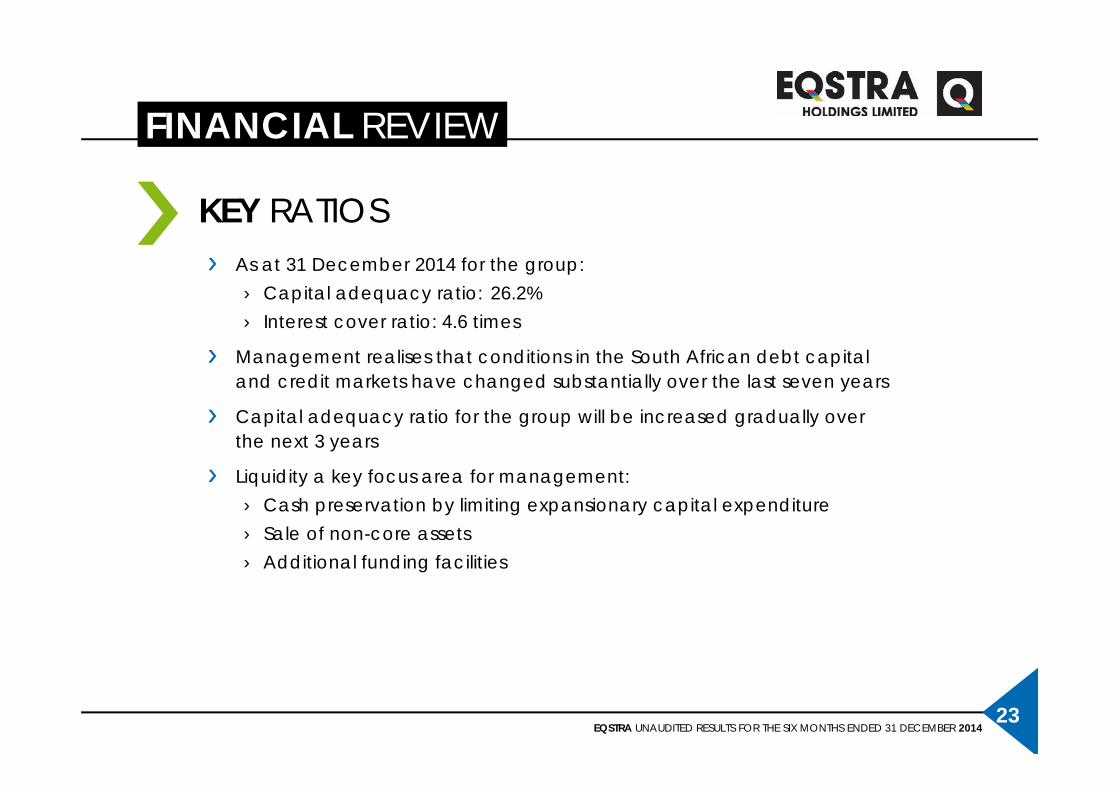
As at 31 December 2014 for the group:› Capital adequacy ratio: 26.2%› Interest cover ratio: 4.6 times
Management realises that conditions in the South African debt capitaland credit markets have changed substantially over the last seven years
Capital adequacy ratio for the group will be increased gradually overthe next 3 years
Liquidity a key focus area for management: › Cash preservation by limiting expansionary capital expenditure› Sale of non-core assets› Additional funding facilities
KEY RATIOS
EQSTRA UNAUDITED RESULTS FOR THE SIX MONTHS ENDED 31 DECEMBER 201424
24DIVISIONAL REVIEW
EQSTRA UNAUDITED RESULTS FOR THE SIX MONTHS ENDED 31 DECEMBER 201425
DIVISIONAL REVIEW
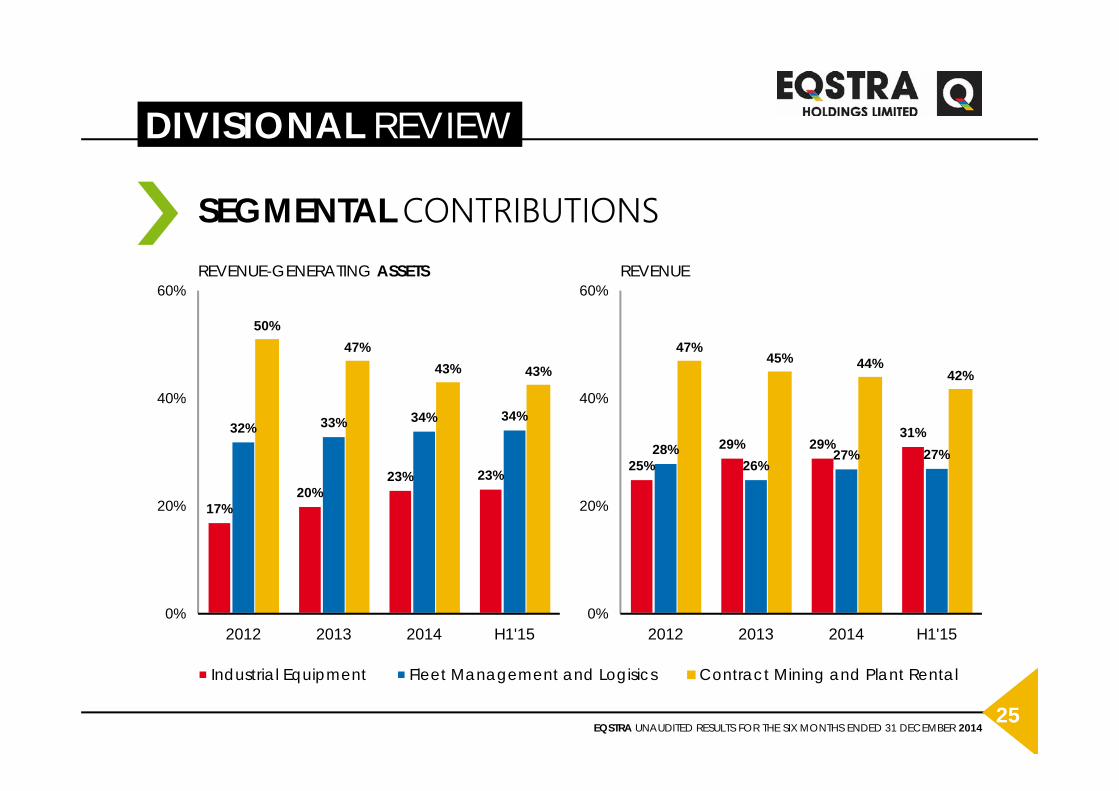
SEGMENTAL CONTRIBUTIONS
17%20%
23% 23%
32% 33% 34% 34%
50%47%
43% 43%
0%
20%
40%
60%
2012 2013 2014 H1'15
Industrial Equipment Fleet Management and Logisics Contract Mining and Plant Rental
REVENUE-GENERATING ASSETS
25%29% 29%
31%28%
26%27% 27%
47%45% 44%
42%
0%
20%
40%
60%
2012 2013 2014 H1'15
REVENUE
EQSTRA UNAUDITED RESULTS FOR THE SIX MONTHS ENDED 31 DECEMBER 201426
DIVISIONAL REVIEW
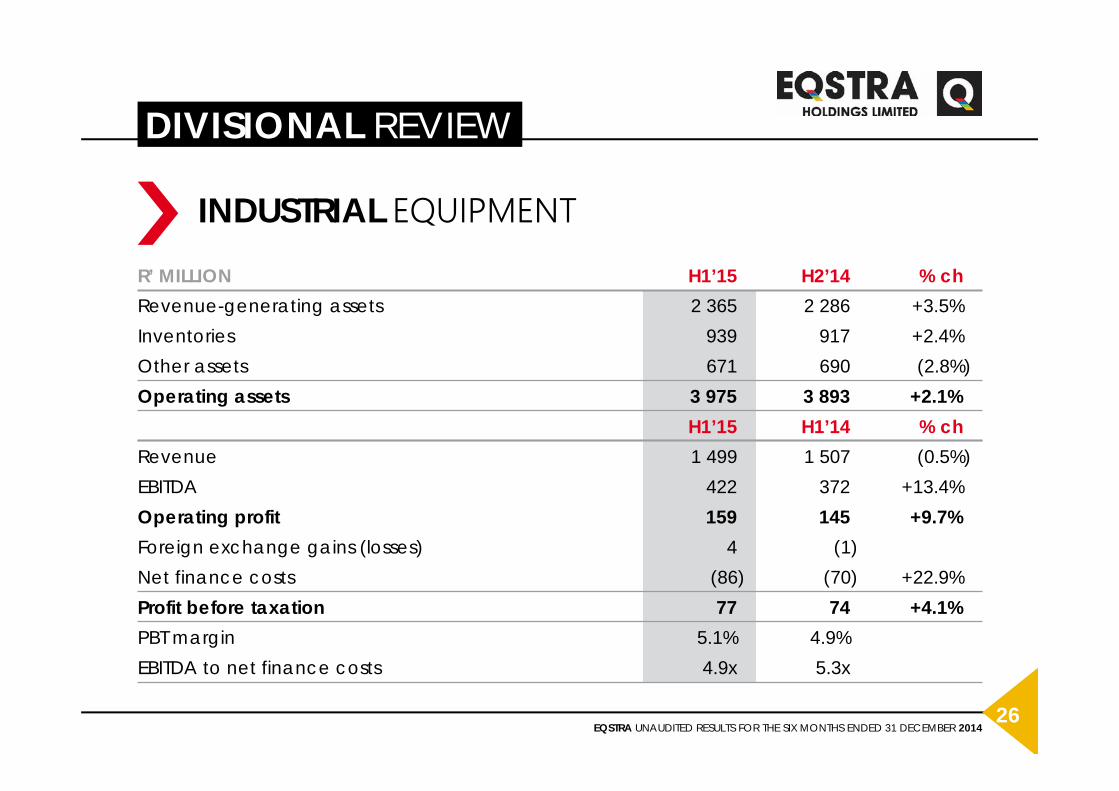
INDUSTRIAL EQUIPMENTR’ MILLION H1’15 H2’14 % chRevenue-generating assets 2 365 2 286 +3.5%Inventories 939 917 +2.4%Other assets 671 690 (2.8%)Operating assets 3 975 3 893 +2.1%
H1’15 H1’14 % chRevenue 1 499 1 507 (0.5%)EBITDA 422 372 +13.4%Operating profit 159 145 +9.7%Foreign exchange gains (losses) 4 (1)Net finance costs (86) (70) +22.9%Profit before taxation 77 74 +4.1%PBT margin 5.1% 4.9%EBITDA to net finance costs 4.9x 5.3x
EQSTRA UNAUDITED RESULTS FOR THE SIX MONTHS ENDED 31 DECEMBER 201427
DIVISIONAL REVIEW
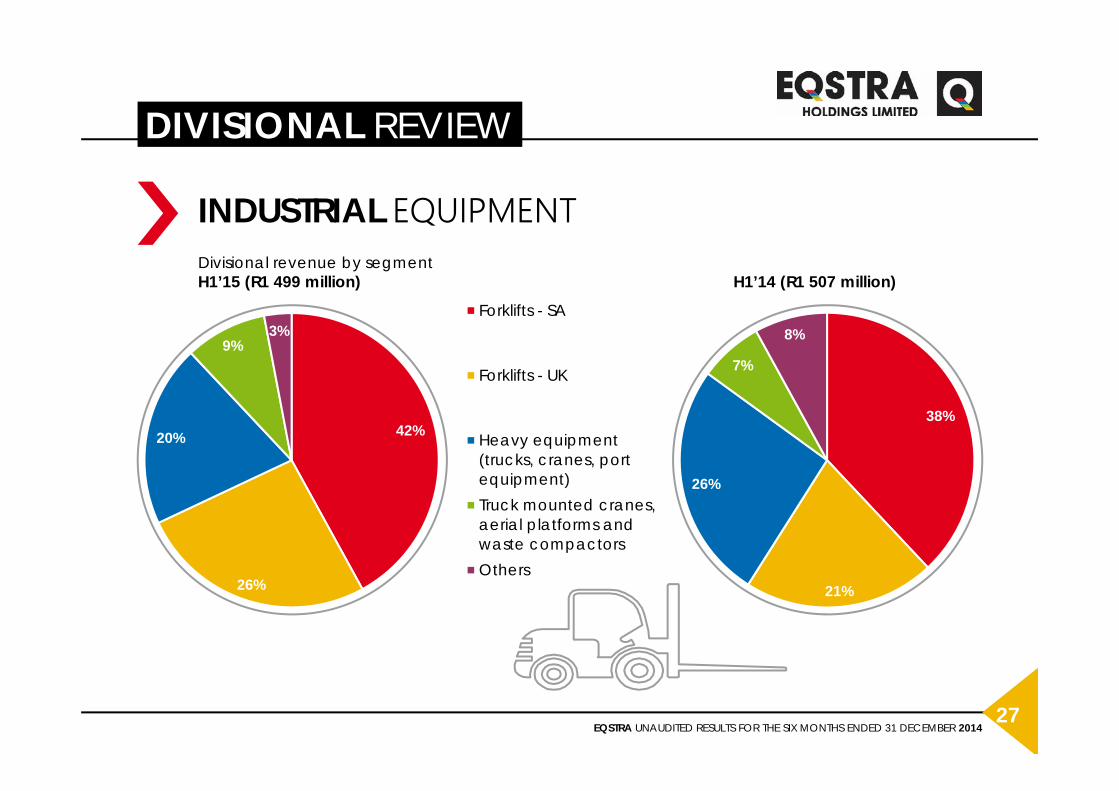
INDUSTRIAL EQUIPMENT
42%
26%
20%
9%3%
38%
21%
26%
7%
8%Forklifts - SA
Forklifts - UK
Heavy equipment(trucks, cranes, portequipment)Truck mounted cranes,aerial platforms andwaste compactorsOthers
Divisional revenue by segment H1’15 (R1 499 million) H1’14 (R1 507 million)
EQSTRA UNAUDITED RESULTS FOR THE SIX MONTHS ENDED 31 DECEMBER 201428
DIVISIONAL REVIEW
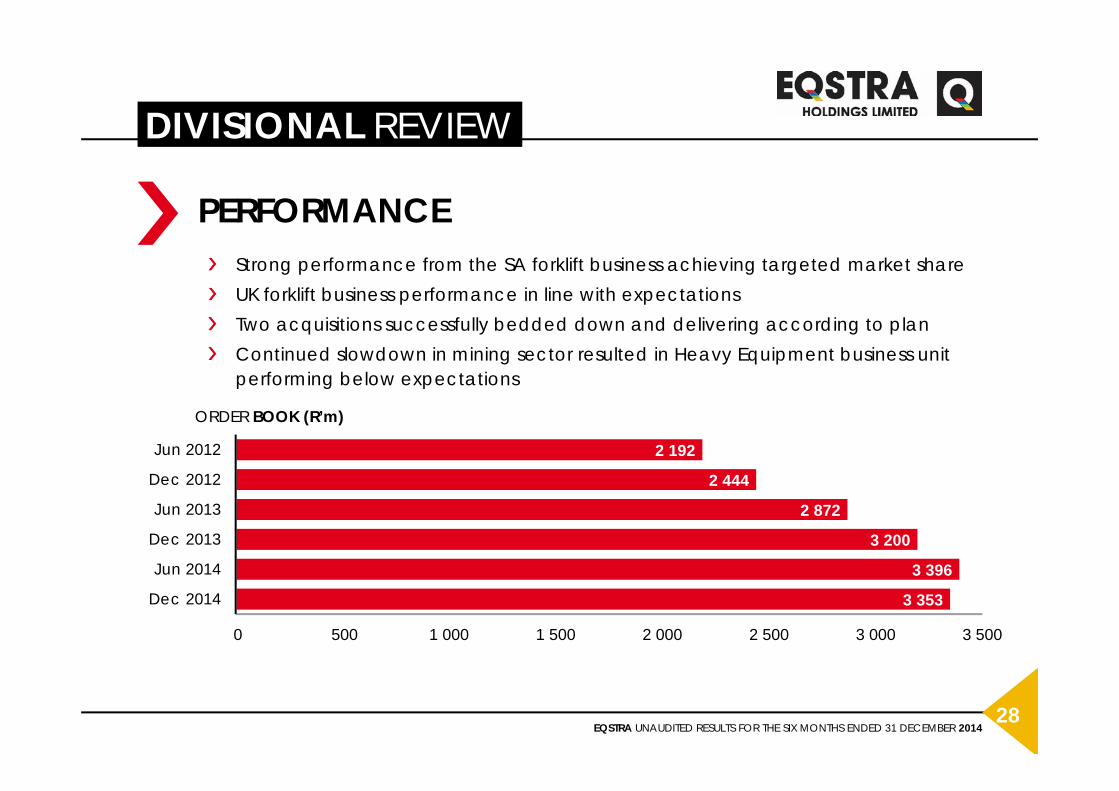
Strong performance from the SA forklift business achieving targeted market share UK forklift business performance in line with expectationsTwo acquisitions successfully bedded down and delivering according to planContinued slowdown in mining sector resulted in Heavy Equipment business unit performing below expectations
PERFORMANCE
3 353
3 396
3 200
2 872
2 444
2 192
0 500 1 000 1 500 2 000 2 500 3 000 3 500
Dec 2014
Jun 2014
Dec 2013
Jun 2013
Dec 2012
Jun 2012
ORDER BOOK (R’m)
EQSTRA UNAUDITED RESULTS FOR THE SIX MONTHS ENDED 31 DECEMBER 201429
DIVISIONAL REVIEW
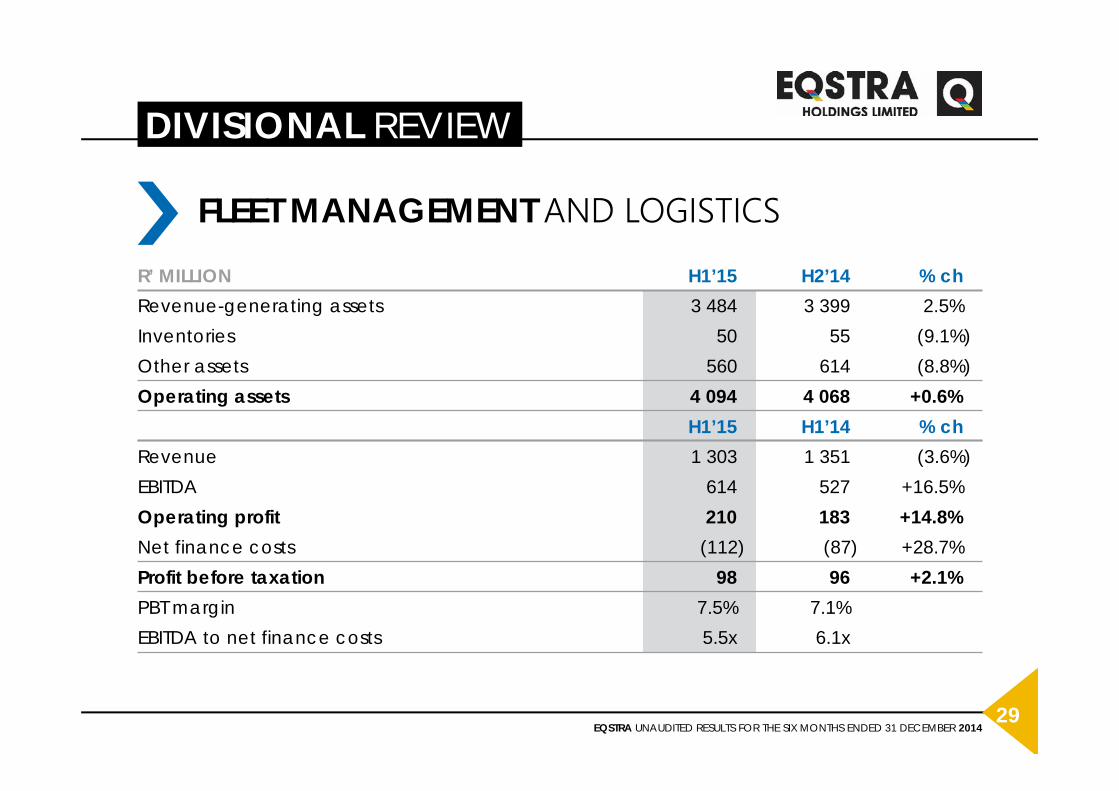
FLEET MANAGEMENT AND LOGISTICSR’ MILLION H1’15 H2’14 % chRevenue-generating assets 3 484 3 399 2.5%Inventories 50 55 (9.1%)Other assets 560 614 (8.8%)Operating assets 4 094 4 068 +0.6%
H1’15 H1’14 % chRevenue 1 303 1 351 (3.6%)EBITDA 614 527 +16.5%Operating profit 210 183 +14.8%Net finance costs (112) (87) +28.7%Profit before taxation 98 96 +2.1%PBT margin 7.5% 7.1%EBITDA to net finance costs 5.5x 6.1x

EQSTRA UNAUDITED RESULTS FOR THE SIX MONTHS ENDED 31 DECEMBER 201430
DIVISIONAL REVIEW
FLEET MANAGEMENT AND LOGISTICS
56%25%
9%
10%Fleet Management -passenger vehiclesFleet Management -commercial vehiclesLogistics
Fleet Management -Rest of Africa
45%
30%
17%
8%
Divisional revenue by segment H1’15 (R1 303 million)
Divisional revenue by segment H1’14 (R1 351 million)
EQSTRA UNAUDITED RESULTS FOR THE SIX MONTHS ENDED 31 DECEMBER 201431
DIVISIONAL REVIEW
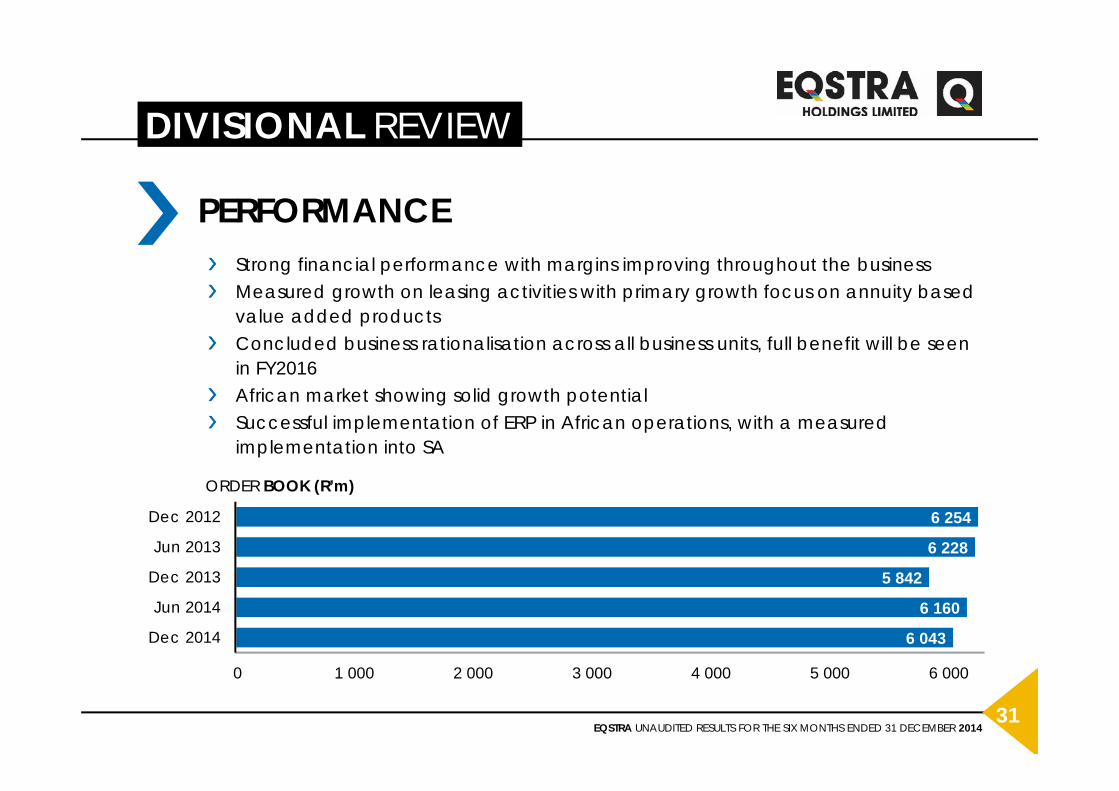
Strong financial performance with margins improving throughout the businessMeasured growth on leasing activities with primary growth focus on annuity based value added products Concluded business rationalisation across all business units, full benefit will be seen in FY2016 African market showing solid growth potentialSuccessful implementation of ERP in African operations, with a measured implementation into SA
PERFORMANCE
6 043
6 160
5 842
6 228
6 254
0 1 000 2 000 3 000 4 000 5 000 6 000
Dec 2014
Jun 2014
Dec 2013
Jun 2013
Dec 2012
ORDER BOOK (R’m)
EQSTRA UNAUDITED RESULTS FOR THE SIX MONTHS ENDED 31 DECEMBER 201432
DIVISIONAL REVIEW
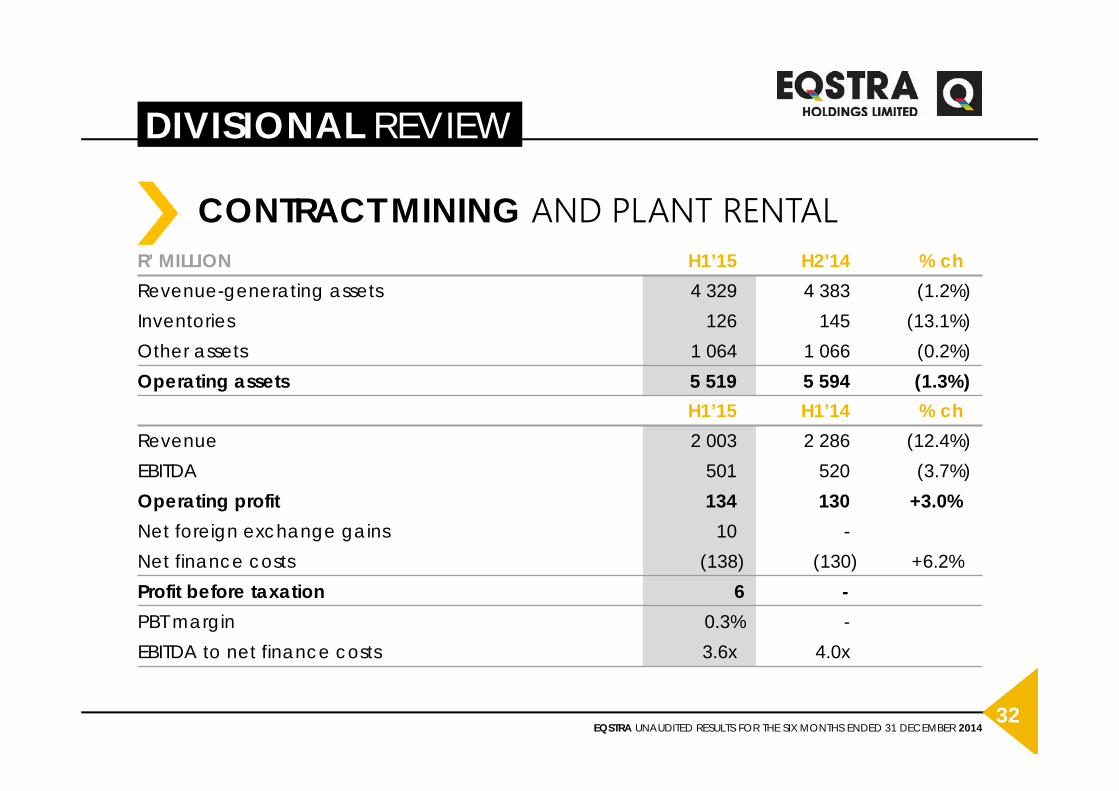
CONTRACT MINING AND PLANT RENTALR’ MILLION H1’15 H2’14 % chRevenue-generating assets 4 329 4 383 (1.2%)Inventories 126 145 (13.1%)Other assets 1 064 1 066 (0.2%)Operating assets 5 519 5 594 (1.3%)
H1’15 H1’14 % chRevenue 2 003 2 286 (12.4%)EBITDA 501 520 (3.7%)Operating profit 134 130 +3.0%Net foreign exchange gains 10 -Net finance costs (138) (130) +6.2%Profit before taxation 6 -PBT margin 0.3% -EBITDA to net finance costs 3.6x 4.0x
EQSTRA UNAUDITED RESULTS FOR THE SIX MONTHS ENDED 31 DECEMBER 201433
DIVISIONAL REVIEW
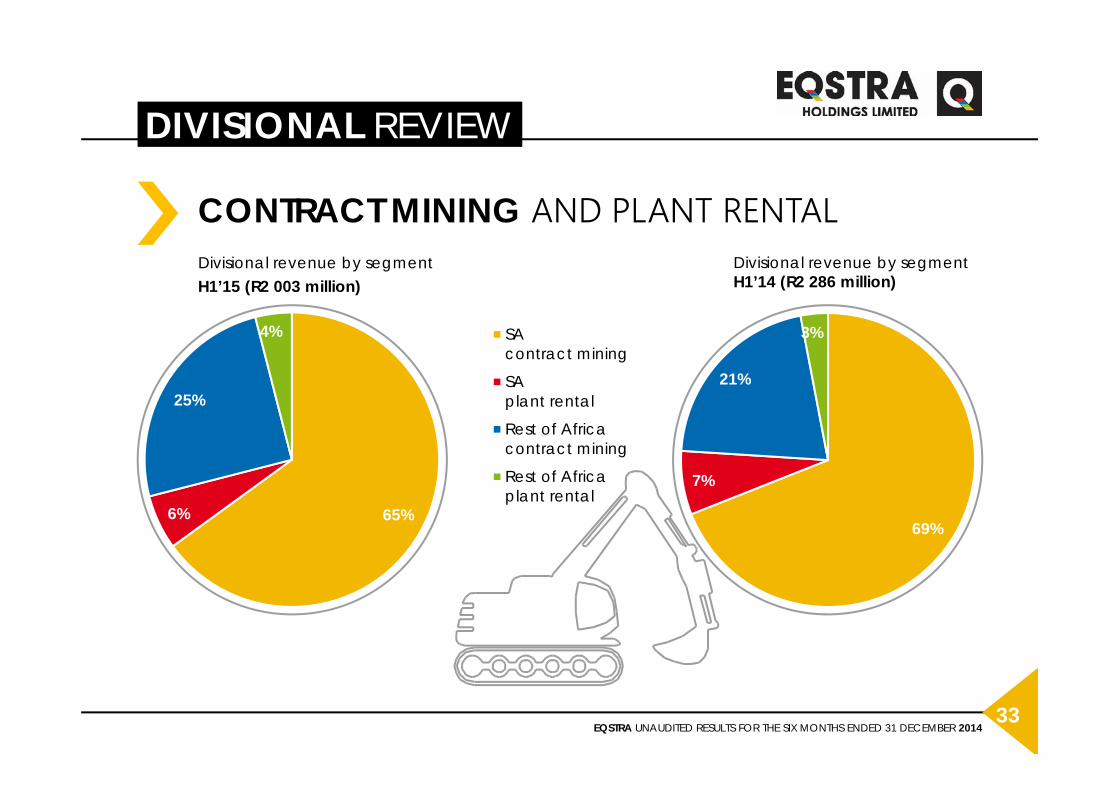
CONTRACT MINING AND PLANT RENTAL
65%6%
25%
4% SAcontract mining
SAplant rental
Rest of Africacontract mining
Rest of Africaplant rental
Divisional revenue by segmentH1’15 (R2 003 million)
69%
7%
21%
3%
Divisional revenue by segmentH1’14 (R2 286 million)

EQSTRA UNAUDITED RESULTS FOR THE SIX MONTHS ENDED 31 DECEMBER 201434
DIVISIONAL REVIEW
New contracts commenced: Aganang (limestone), Karowe (diamonds) and Rockwell (diamonds)
Right sizing of business resulted in R15 million retrenchment and closure costs
Tharisa Minerals contract restructured toonly waste removal and finalising a further5 year extension
Closure of Nkomati finalised
CONTRACT MINING AND PLANT RENTAL
41%
36%
24%
25%
35%
63%
84%
43%
38%
45%
49%
37%
19%
16%
26%
31%
26%
28%
18%
16%
1H15
FY14
FY13
FY12
FY11
FY10
FY09
PGMs Energy Other & plant rental
COMMODITY DIVERSIFICATION
EQSTRA UNAUDITED RESULTS FOR THE SIX MONTHS ENDED 31 DECEMBER 201435
DIVISIONAL REVIEW
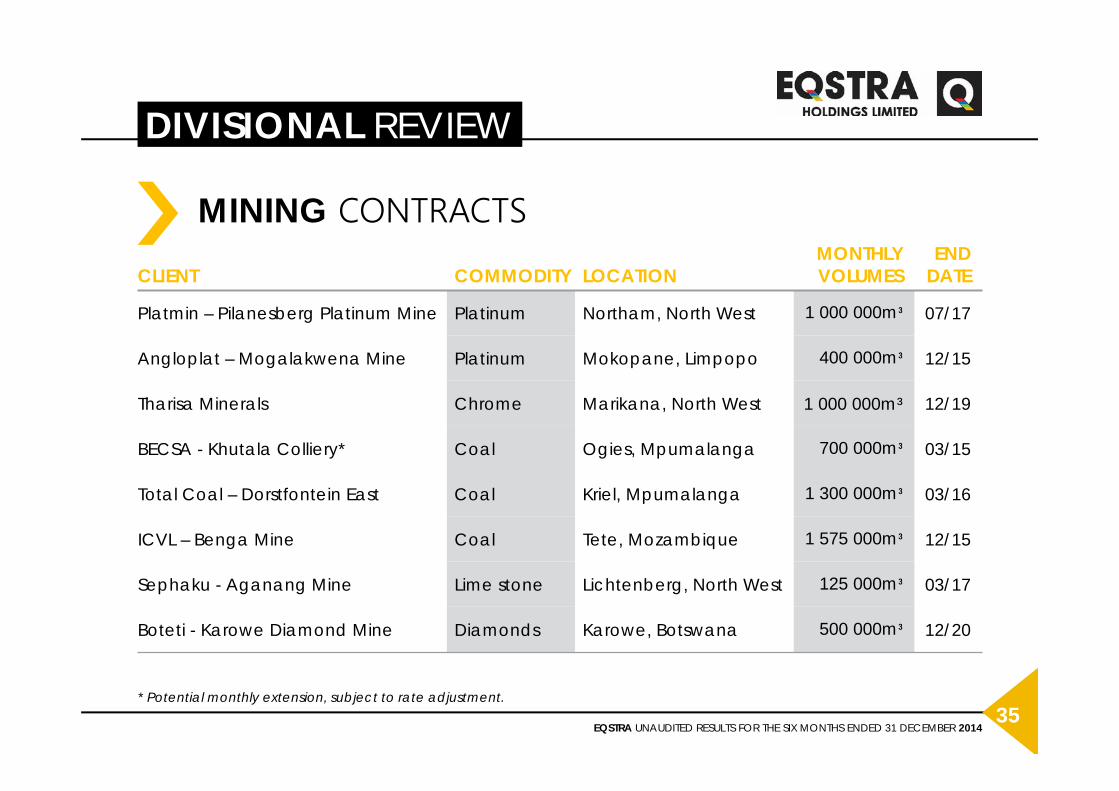
* Potential monthly extension, subject to rate adjustment.
MINING CONTRACTSCLIENT COMMODITY LOCATION
MONTHLY VOLUMES
END DATE
Platmin – Pilanesberg Platinum Mine Platinum Northam, North West 1 000 000m³ 07/17
Angloplat – Mogalakwena Mine Platinum Mokopane, Limpopo 400 000m³ 12/15
Tharisa Minerals Chrome Marikana, North West 1 000 000m³ 12/19
BECSA - Khutala Colliery* Coal Ogies, Mpumalanga 700 000m³ 03/15
Total Coal – Dorstfontein East Coal Kriel, Mpumalanga 1 300 000m³ 03/16
ICVL – Benga Mine Coal Tete, Mozambique 1 575 000m³ 12/15
Sephaku - Aganang Mine Lime stone Lichtenberg, North West 125 000m³ 03/17
Boteti - Karowe Diamond Mine Diamonds Karowe, Botswana 500 000m³ 12/20
EQSTRA UNAUDITED RESULTS FOR THE SIX MONTHS ENDED 31 DECEMBER 201436
DIVISIONAL REVIEW
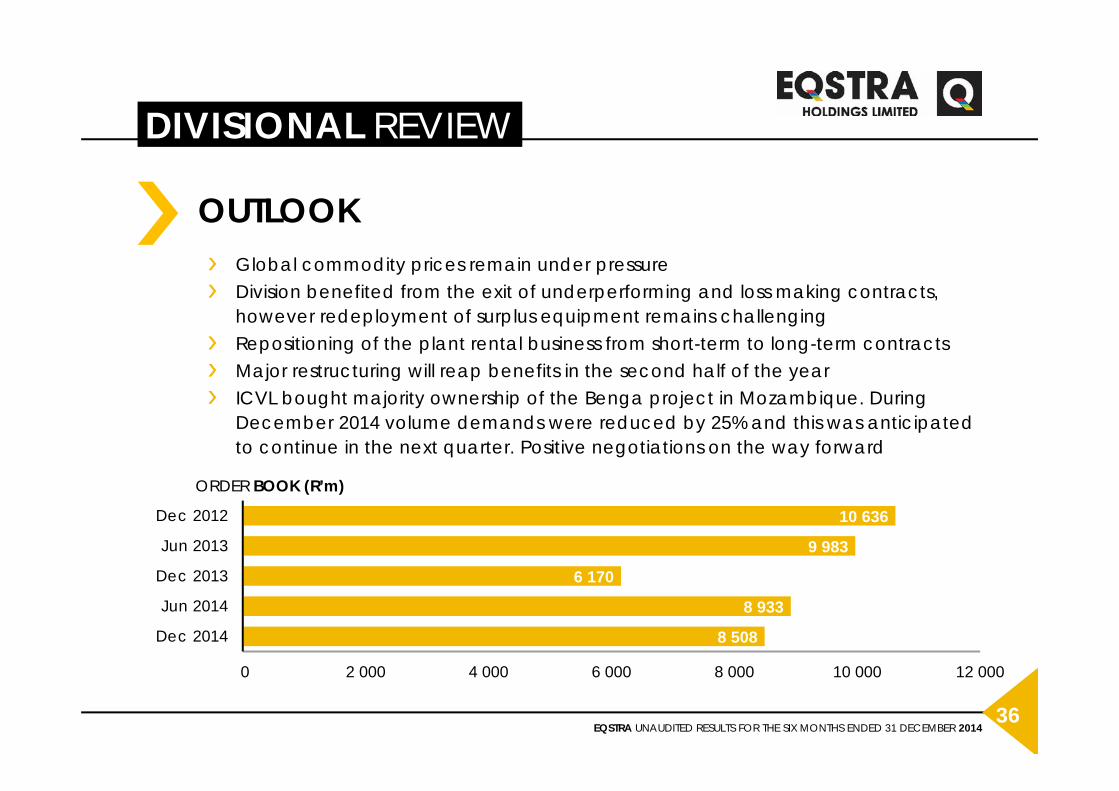
Global commodity prices remain under pressureDivision benefited from the exit of underperforming and loss making contracts, however redeployment of surplus equipment remains challengingRepositioning of the plant rental business from short-term to long-term contractsMajor restructuring will reap benefits in the second half of the yearICVL bought majority ownership of the Benga project in Mozambique. During December 2014 volume demands were reduced by 25% and this was anticipated to continue in the next quarter. Positive negotiations on the way forward
OUTLOOK
8 508
8 933
6 170
9 983
10 636
0 2 000 4 000 6 000 8 000 10 000 12 000
Dec 2014
Jun 2014
Dec 2013
Jun 2013
Dec 2012
ORDER BOOK (R’m)
EQSTRA UNAUDITED RESULTS FOR THE SIX MONTHS ENDED 31 DECEMBER 201437
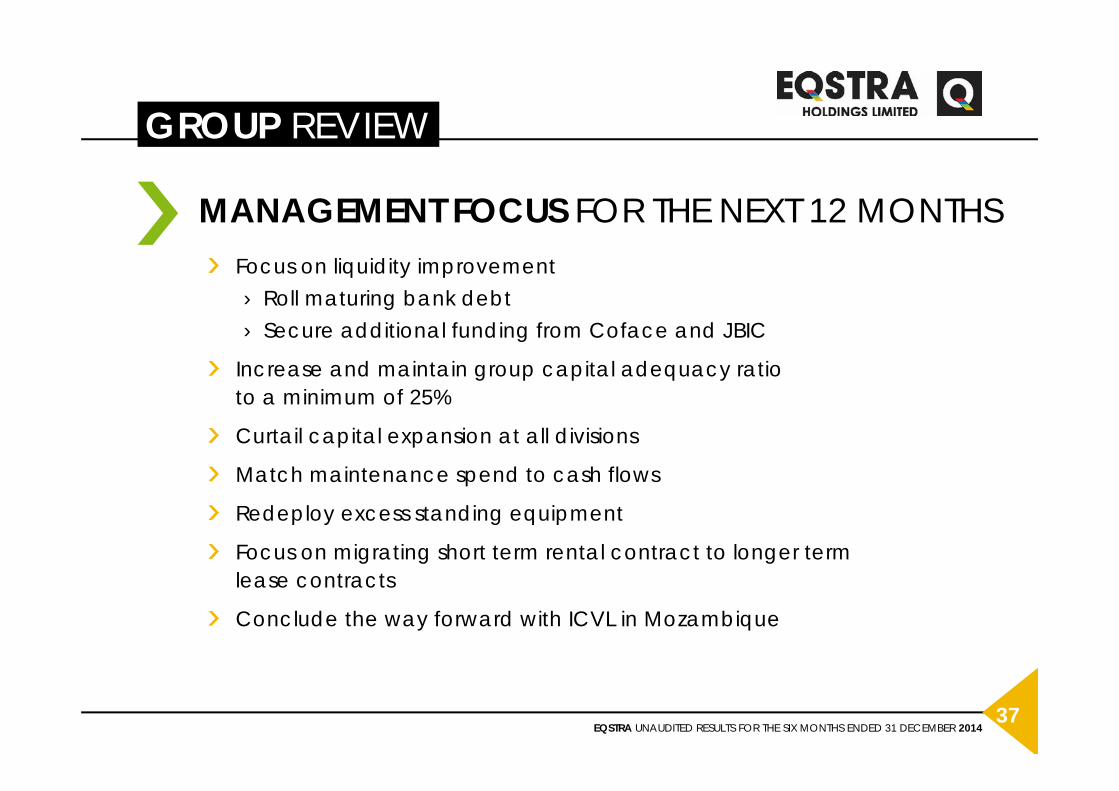
GROUP REVIEW
Focus on liquidity improvement› Roll maturing bank debt› Secure additional funding from Coface and JBIC
Increase and maintain group capital adequacy ratioto a minimum of 25%
Curtail capital expansion at all divisions
Match maintenance spend to cash flows
Redeploy excess standing equipment
Focus on migrating short term rental contract to longer term lease contracts
Conclude the way forward with ICVL in Mozambique
MANAGEMENT FOCUS FOR THE NEXT 12 MONTHS
EQSTRA UNAUDITED RESULTS FOR THE SIX MONTHS ENDED 31 DECEMBER 201438
Industrial Equipment anticipates the SA forklift market to remain challenging with the UK market increasing marginally. Our aim to further balance the product portfolio and grow into sub-Sahara Africa and the UK, with a much stronger basket of products in place. A healthy order book for long-term rental and cash sales is in place to support annuity revenue growth.
Fleet Management and Logistics earnings from leasing activities are set to remain defensive however the ongoing low interest rates will continue to have a negative impact on earnings. We aim to drive value add products with measured expansion on leasing activities until the liquidity outlook improves.
Contract Mining and Plant Rental remains an important part of the asset mix of the group. The re-positioning of the division has already starting to show early signs of recovery under new management. The exit of underperforming contracts and improvement of asset utilisation positions the division adequately through the commodity cycle. Management continues to reduce the exposure to contract mining not exceeding 30% of the group’s revenue-generating assets. We continue to actively participate in the South Africa tender activities, but redeploying surplus assets could however be challenging.
DIVISIONAL REVIEW
OUTLOOK
EQSTRA UNAUDITED RESULTS FOR THE SIX MONTHS ENDED 31 DECEMBER 201439
39QUESTIONS