Embed Size (px)
Citation preview
UNCLASSIFIED
By
Ty Valascho
TARDEC
--- TECHNICAL REPORT ---
No. 21795
Comparison of Energy Loss in Talon
Battery Trays: “Penn State” and
IBAT
U.S. Army
Tank Automotive Research, Development, and Engineering Center
Detroit Arsenal
Warren, Michigan 48397-5000
UNCLASSIFIED: Dist A. Approved for public release
Report Documentation Page Form ApprovedOMB No. 0704-0188
Public reporting burden for the collection of information is estimated to average 1 hour per response, including the time for reviewing instructions, searching existing data sources, gathering andmaintaining the data needed, and completing and reviewing the collection of information. Send comments regarding this burden estimate or any other aspect of this collection of information,including suggestions for reducing this burden, to Washington Headquarters Services, Directorate for Information Operations and Reports, 1215 Jefferson Davis Highway, Suite 1204, ArlingtonVA 22202-4302. Respondents should be aware that notwithstanding any other provision of law, no person shall be subject to a penalty for failing to comply with a collection of information if itdoes not display a currently valid OMB control number.
1. REPORT DATE 26 APR 2011
2. REPORT TYPE N/A
3. DATES COVERED -
4. TITLE AND SUBTITLE Comparison of Energy Loss in Talon Battery Trays: Penn State and IBAT
5a. CONTRACT NUMBER
5b. GRANT NUMBER
5c. PROGRAM ELEMENT NUMBER
6. AUTHOR(S) Ty Valascho
5d. PROJECT NUMBER
5e. TASK NUMBER
5f. WORK UNIT NUMBER
7. PERFORMING ORGANIZATION NAME(S) AND ADDRESS(ES) US Army, Tank Automotive Research Development and EngineeringCommand (TARDEC) Warren, MI 48397
8. PERFORMING ORGANIZATIONREPORT NUMBER 21795
9. SPONSORING/MONITORING AGENCY NAME(S) AND ADDRESS(ES) US Army, Tank Automotive Research Development and EngineeringCommand (TARDEC) Warren, MI 48397
10. SPONSOR/MONITOR’S ACRONYM(S)
11. SPONSOR/MONITOR’S REPORT NUMBER(S) 21795
12. DISTRIBUTION/AVAILABILITY STATEMENT Approved for public release, distribution unlimited
13. SUPPLEMENTARY NOTES The views, opinion, and/or findings contained in this report are those of the authors and should not beconstrued as an Official Department of the Army position, policy, or decision, unless so designated by otherdocuments., The original document contains color images.
14. ABSTRACT Laboratory testing of two battery tray designs for the QinetiQ NA Talon robot: Talon Battery Box and theImproved Battery Adapter Tray (IBAT). State of Charge (SOC) Loss was measured for each design.
15. SUBJECT TERMS Talon, robot, battery tray, loss, State of Charge, IBAT, SOC, Battery Box
16. SECURITY CLASSIFICATION OF: 17. LIMITATION OF ABSTRACT
SAR
18. NUMBEROF PAGES
17
19a. NAME OFRESPONSIBLE PERSON
a. REPORT unclassified
b. ABSTRACT unclassified
c. THIS PAGE unclassified
Standard Form 298 (Rev. 8-98) Prescribed by ANSI Std Z39-18
UNCLASSIFIED
2
REPORT DOCUMENTATION PAGE Form Approved
OMB No. 0704-0188
Public reporting burden for this collection of information is estimated to average 1 hour per response, including the time for reviewing instructions, searching existing data sources, gathering and maintaining the data needed, and completing and reviewing this collection of information. Send comments regarding this burden estimate or any other aspect of this collection of information, including suggestions for reducing this burden to Department of Defense, Washington Headquarters Services, Directorate for Information Operations and Reports (0704-0188), 1215 Jefferson Davis Highway, Suite 1204, Arlington, VA 22202-4302. Respondents should be aware that notwithstanding any other provision of law, no person shall be subject to any penalty for failing to comply with a collection of information if it does not display a currently valid OMB control number. PLEASE DO NOT RETURN YOUR FORM TO THE ABOVE ADDRESS.
1. REPORT DATE (DD-MM-YYYY)
26-04-2011 2. REPORT TYPE
Technical 3. DATES COVERED (From - To)
31/03/2011 – 25/04/2011
4. TITLE AND SUBTITLE
Comparison of Energy Loss in Talon Battery Trays: “Penn State” and
IBAT
5a. CONTRACT NUMBER
5b. GRANT NUMBER 5c. PROGRAM ELEMENT NUMBER
6. AUTHOR(S)
Ty Valascho
5d. PROJECT NUMBER 5e. TASK NUMBER
5f. WORK UNIT NUMBER 7. PERFORMING ORGANIZATION NAME(S) AND ADDRESS(ES)
US Army, Tank Automotive Research Development and Engineering Command (TARDEC) Warren, MI 48397
8. PERFORMING ORGANIZATION REPORT NUMBER
9. SPONSORING / MONITORING AGENCY NAME(S) AND ADDRESS(ES)
US Army, Tank Automotive Research Development and Engineering
Command (TARDEC)
Warren, MI 48397
10. SPONSOR/MONITOR’S ACRONYM(S)
11. SPONSOR/MONITOR’S REPORT
NUMBER(S)
12. DISTRIBUTION / AVAILABILITY STATEMENT
Approved for public release; distribution is unlimited 13. SUPPLEMENTARY NOTES
The views, opinion, and/or findings contained in this report are those of the authors and should not be construed as an Official Department of the Army position, policy, or decision, unless so designated by other documents.
14. ABSTRACT
Laboratory testing of two battery tray designs for the QinetiQ NA Talon robot: Talon Battery Box and the Improved Battery Adapter Tray (IBAT). State of Charge (SOC) Loss was measured for each design.
15. SUBJECT TERMS
Talon, robot, battery tray, loss, State of Charge, IBAT, SOC, Battery Box
16. SECURITY CLASSIFICATION OF:
UNCLAS DIST A 17. LIMITATION OF ABSTRACT
18. NUMBER OF PAGES
19a. NAME OF RESPONSIBLE PERSON
Ty Valascho
a. REPORT
DIST A b. ABSTRACT
DIST A c. THIS PAGE
DIST A A 17
19b. TELEPHONE NUMBER (include area code)
(586) 282-0681
Standard Form 298 (Rev. 8-98) Prescribed by ANSI Std. Z39.18
UNCLASSIFIED
3
Comparison of Energy Loss in Talon Battery Trays: “Penn State” and IBAT
April 26, 2011
Version 1.1
POC: Ty Valascho
US ARMY TARDEC - Ground Vehicle Robotics (GVR)
586.282.0681
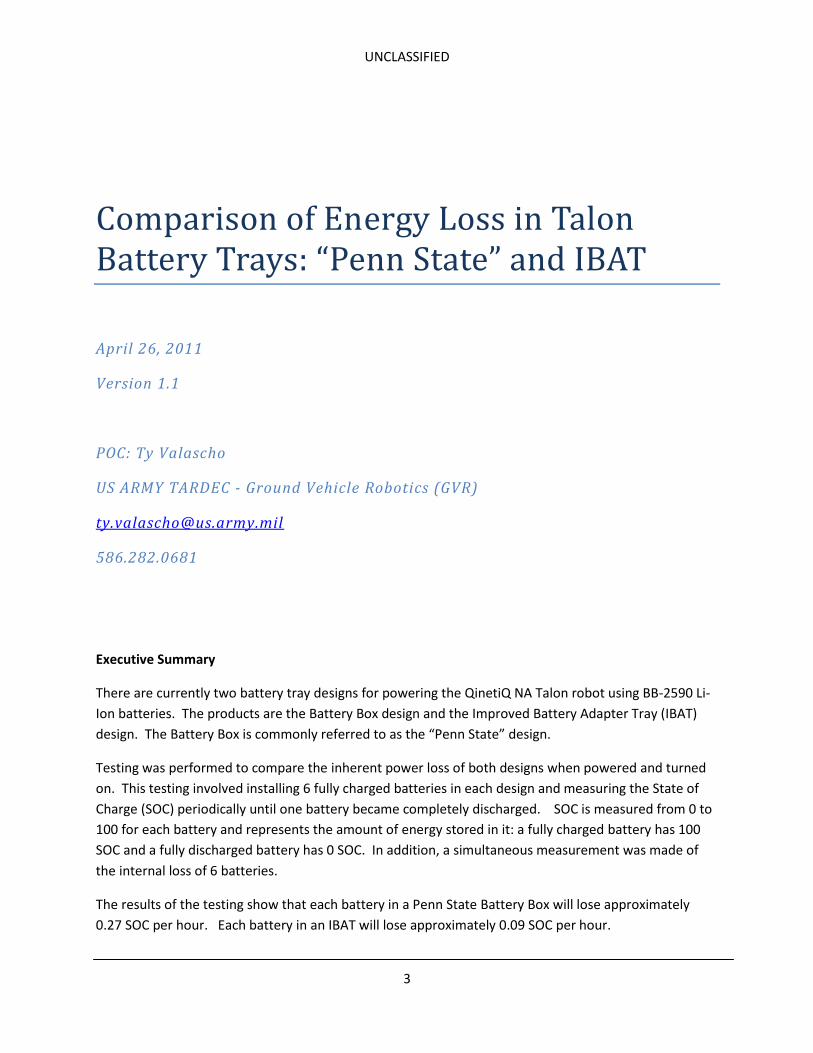
Executive Summary
There are currently two battery tray designs for powering the QinetiQ NA Talon robot using BB-2590 Li-
Ion batteries. The products are the Battery Box design and the Improved Battery Adapter Tray (IBAT)
design. The Battery Box is commonly referred to as the “Penn State” design.
Testing was performed to compare the inherent power loss of both designs when powered and turned
on. This testing involved installing 6 fully charged batteries in each design and measuring the State of
Charge (SOC) periodically until one battery became completely discharged. SOC is measured from 0 to
100 for each battery and represents the amount of energy stored in it: a fully charged battery has 100
SOC and a fully discharged battery has 0 SOC. In addition, a simultaneous measurement was made of
the internal loss of 6 batteries.
The results of the testing show that each battery in a Penn State Battery Box will lose approximately
0.27 SOC per hour. Each battery in an IBAT will lose approximately 0.09 SOC per hour.
UNCLASSIFIED
4
Contents Introduction .................................................................................................................................................. 5
Background ............................................................................................................................................... 5
Energy Loss ................................................................................................................................................ 7
State of Charge (SOC) ................................................................................................................................ 7
Measurement of SOC ................................................................................................................................ 7
Methodology ................................................................................................................................................. 8
Test Configuration ..................................................................................................................................... 8
Battery Numbers ....................................................................................................................................... 9
Results ......................................................................................................................................................... 10
Appendix A .................................................................................................................................................. 13
Test A ...................................................................................................................................................... 13
Test B ....................................................................................................................................................... 14
Test C ....................................................................................................................................................... 15
Appendix B .................................................................................................................................................. 17
UNCLASSIFIED
5
Introduction Power consumption on small Unmanned Ground Vehicles is of paramount concern as mission lengths
increase. To increase energy density, save money, and ease logistical concerns the Army has been
moving from proprietary batteries to the standard BB-2590 batteries on small UGVs. A device called a
battery tray is required to do this on the TALON robot, a product of QinetiQ North America.
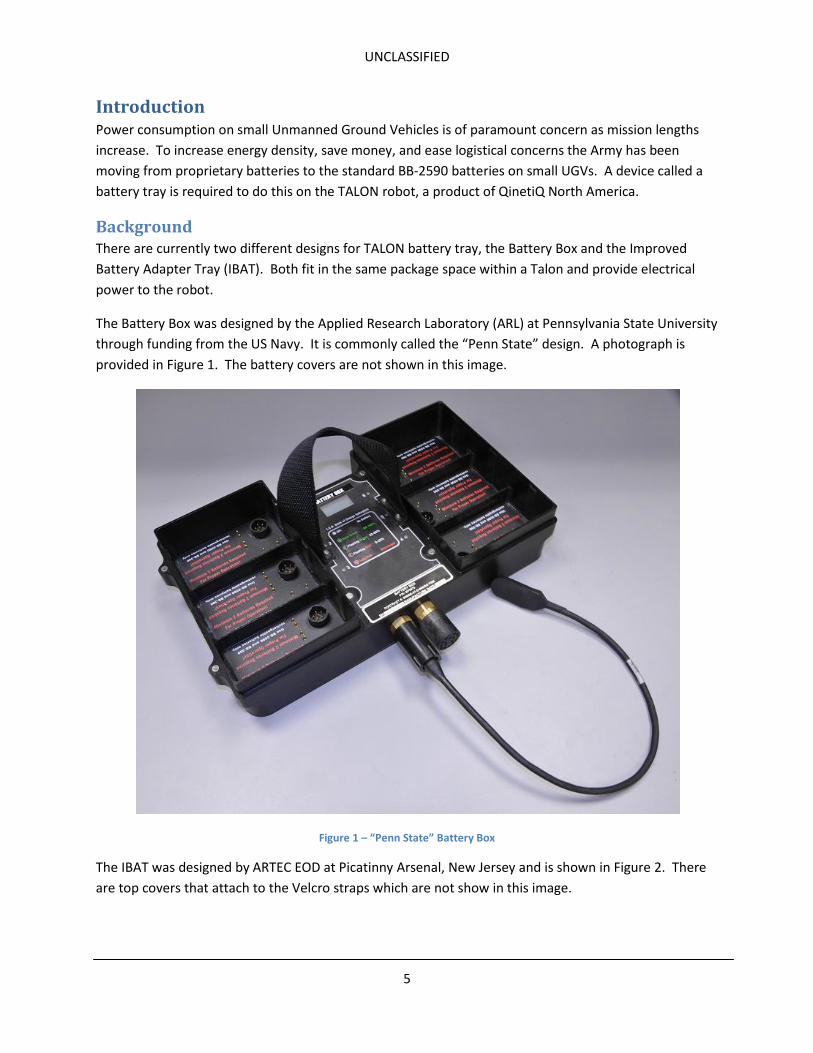
Background There are currently two different designs for TALON battery tray, the Battery Box and the Improved
Battery Adapter Tray (IBAT). Both fit in the same package space within a Talon and provide electrical
power to the robot.
The Battery Box was designed by the Applied Research Laboratory (ARL) at Pennsylvania State University
through funding from the US Navy. It is commonly called the “Penn State” design. A photograph is
provided in Figure 1. The battery covers are not shown in this image.
Figure 1 – “Penn State” Battery Box
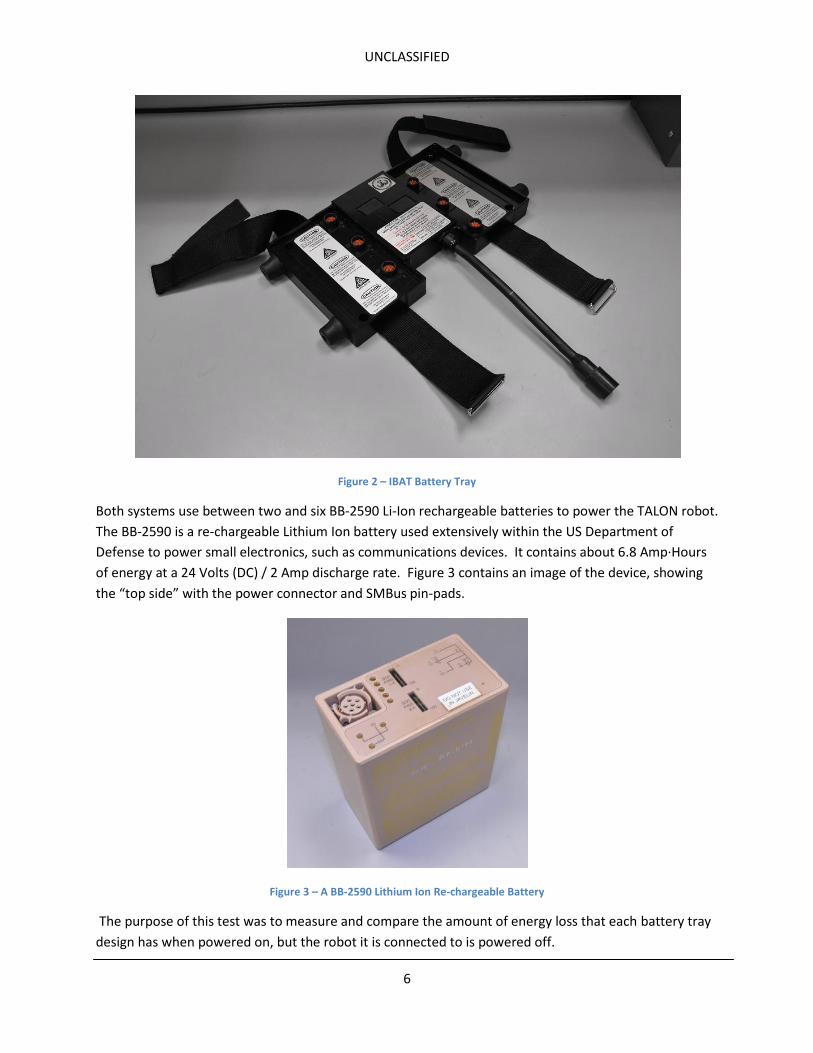
The IBAT was designed by ARTEC EOD at Picatinny Arsenal, New Jersey and is shown in Figure 2. There
are top covers that attach to the Velcro straps which are not show in this image.
UNCLASSIFIED
6
Figure 2 – IBAT Battery Tray
Both systems use between two and six BB-2590 Li-Ion rechargeable batteries to power the TALON robot.
The BB-2590 is a re-chargeable Lithium Ion battery used extensively within the US Department of
Defense to power small electronics, such as communications devices. It contains about 6.8 Amp∙Hours
of energy at a 24 Volts (DC) / 2 Amp discharge rate. Figure 3 contains an image of the device, showing
the “top side” with the power connector and SMBus pin-pads.
Figure 3 – A BB-2590 Lithium Ion Re-chargeable Battery
The purpose of this test was to measure and compare the amount of energy loss that each battery tray
design has when powered on, but the robot it is connected to is powered off.
UNCLASSIFIED
7
The amount of loss measured this way indicates how long the batteries can be left in a stowed position
between missions without recharging or replacing the batteries.
Energy Loss When a battery tray is powered on, it is using some energy to keep the internal electronics and external
displays powered. Energy is being consumed even when the robot it is connected to is off and not
consuming power. This consumed energy is the energy loss – commonly shortened to just “loss” – of
the system and represents the slow but steady drip of power that is reducing the available energy in the
batteries all the time.
All electrical systems have some loss, including cell phones and laptops. Sleep modes – such as when
the hard drive or display is powered down when not in use - are ways that loss is commonly reduced in
consumer electronics. Currently fielded robots have no sleep mode – they are either completely on or
completely off.
State of Charge (SOC) To measure and compare the loss, the concept of State of Charge (SOC) must be explained. SOC is a
percentage of available energy left in a battery. When the battery is fully charged, it has 100 SOC.
When the battery is completely discharged, it has 0 SOC.
Measurement of SOC SOC cannot be measured directly. It can be calculated, however, and this can be done a number of
different ways. Most methods for calculating SOC, such as “Coulomb counting” utilize a mathematical
model of the battery and the measurement of voltage and current over time.
The BB-2590 battery itself keeps track of its SOC, which can be queried over the SMBus interface on the
battery. The Penn State design reads and displays the SOC of each battery installed. This measurement
and display was utilized for this testing.
UNCLASSIFIED
8
Methodology To measure the loss in a battery tray, 6 fully charged batteries were used for each tray design. The SOC
of each battery was measured before the test, and then installed in the tray. Each tray was left powered
on, but not connected to a robot. The SOC of every battery was measured periodically until one of the
batteries reached zero SOC.
Test Configuration All tests were performed indoors at 25⁰ C. Three preliminary tests were also conducted, and the results
are provided in Note that these values are for the tray and are with respect to the total SOC of the tray,
which can have a value between 0 and 600.
Each battery in the tray is going to lose roughly 1/6 of this value per hour of use, in addition to whatever
the robot is consuming. If the values are then normalized on a “per battery” basis, the results are
Penn State Battery Box 0.27 Individual Battery SOC loss per hour
IBAT Battery Tray: 0.09 Individual Battery SOC loss per hour
UNCLASSIFIED
9
Appendix A. The results from the 3 preliminary tests were found to be consistent with the final test.
The testing consisted of three test configurations: 6 batteries in an IBAT, 6 batteries in a Penn State
battery box, and 6 batteries unconnected to a tray. The purpose of the six “No Tray” batteries was to
measure the internal loss of the batteries themselves.
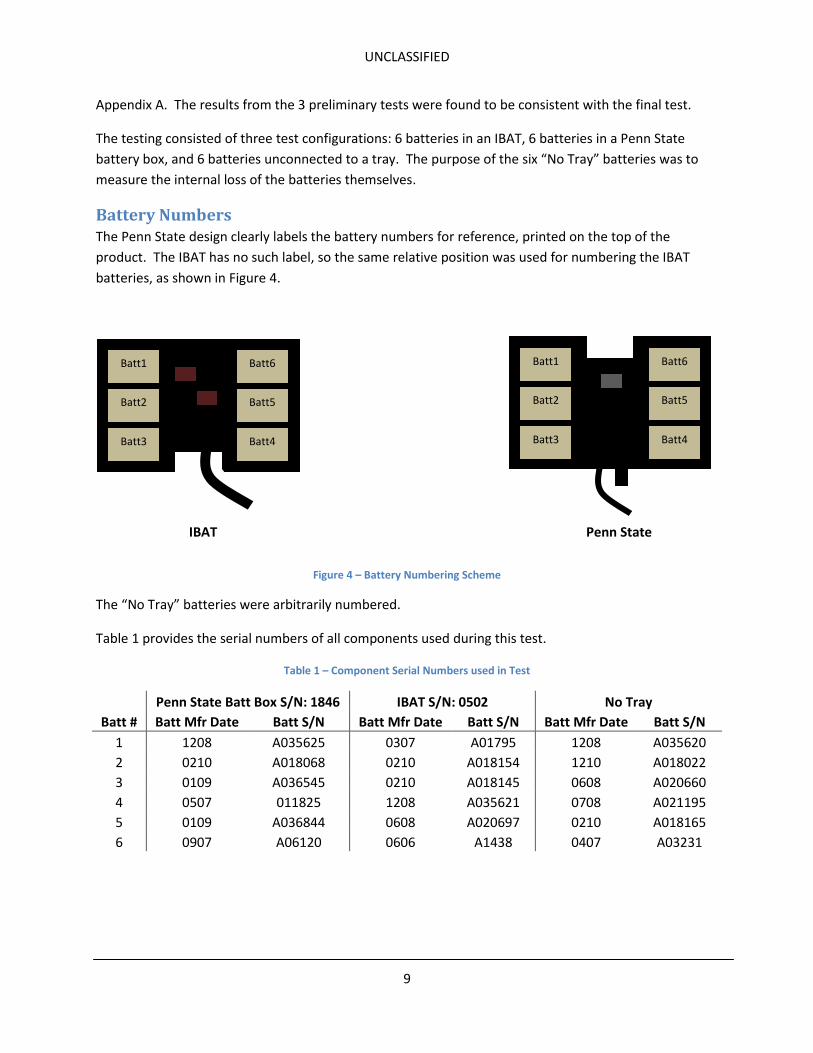
Battery Numbers The Penn State design clearly labels the battery numbers for reference, printed on the top of the
product. The IBAT has no such label, so the same relative position was used for numbering the IBAT
batteries, as shown in Figure 4.
Figure 4 – Battery Numbering Scheme
The “No Tray” batteries were arbitrarily numbered.
Table 1 provides the serial numbers of all components used during this test.
Table 1 – Component Serial Numbers used in Test
Penn State Batt Box S/N: 1846 IBAT S/N: 0502 No Tray
Batt # Batt Mfr Date Batt S/N Batt Mfr Date Batt S/N Batt Mfr Date Batt S/N
1 1208 A035625 0307 A01795 1208 A035620
2 0210 A018068 0210 A018154 1210 A018022
3 0109 A036545 0210 A018145 0608 A020660
4 0507 011825 1208 A035621 0708 A021195
5 0109 A036844 0608 A020697 0210 A018165
6 0907 A06120 0606 A1438 0407 A03231
IBAT
Batt1
Batt2
Batt3
Batt6
Batt5
Batt4
Penn State
Batt1
Batt2
Batt3
Batt6
Batt5
Batt4
UNCLASSIFIED
10
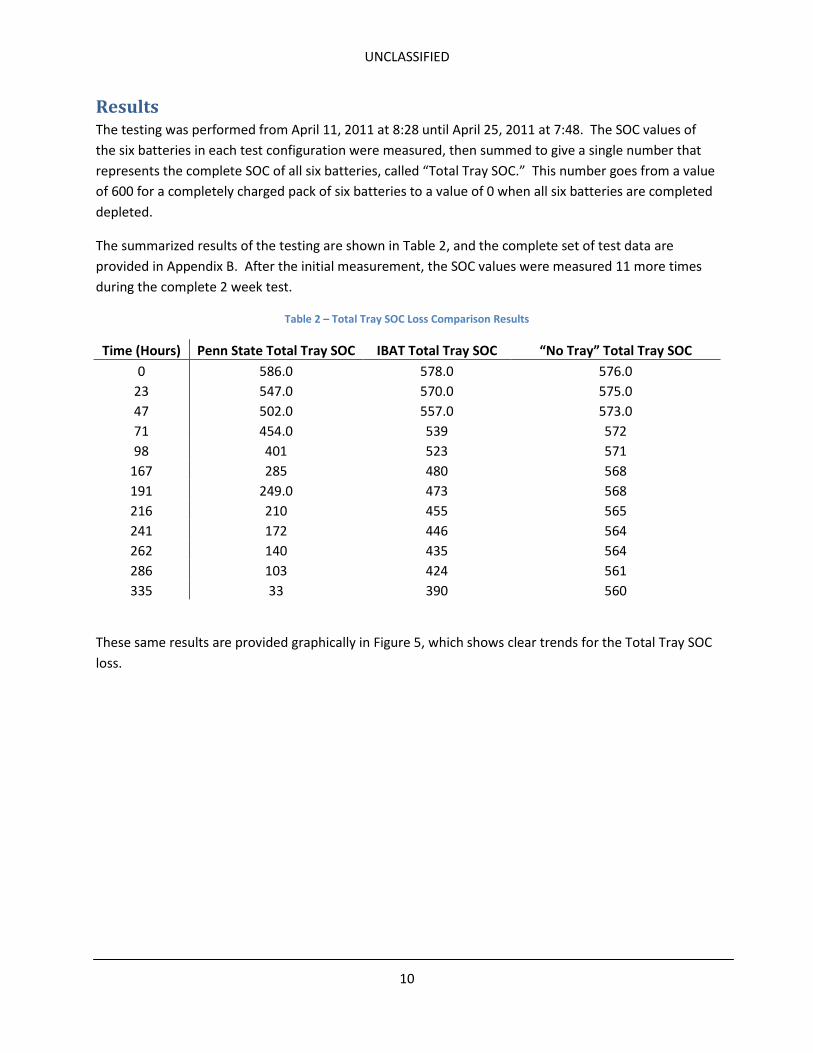
Results The testing was performed from April 11, 2011 at 8:28 until April 25, 2011 at 7:48. The SOC values of
the six batteries in each test configuration were measured, then summed to give a single number that
represents the complete SOC of all six batteries, called “Total Tray SOC.” This number goes from a value
of 600 for a completely charged pack of six batteries to a value of 0 when all six batteries are completed
depleted.
The summarized results of the testing are shown in Table 2, and the complete set of test data are
provided in Appendix B. After the initial measurement, the SOC values were measured 11 more times
during the complete 2 week test.
Table 2 – Total Tray SOC Loss Comparison Results
Time (Hours) Penn State Total Tray SOC IBAT Total Tray SOC “No Tray” Total Tray SOC
0 586.0 578.0 576.0
23 547.0 570.0 575.0
47 502.0 557.0 573.0
71 454.0 539 572
98 401 523 571
167 285 480 568
191 249.0 473 568
216 210 455 565
241 172 446 564
262 140 435 564
286 103 424 561
335 33 390 560
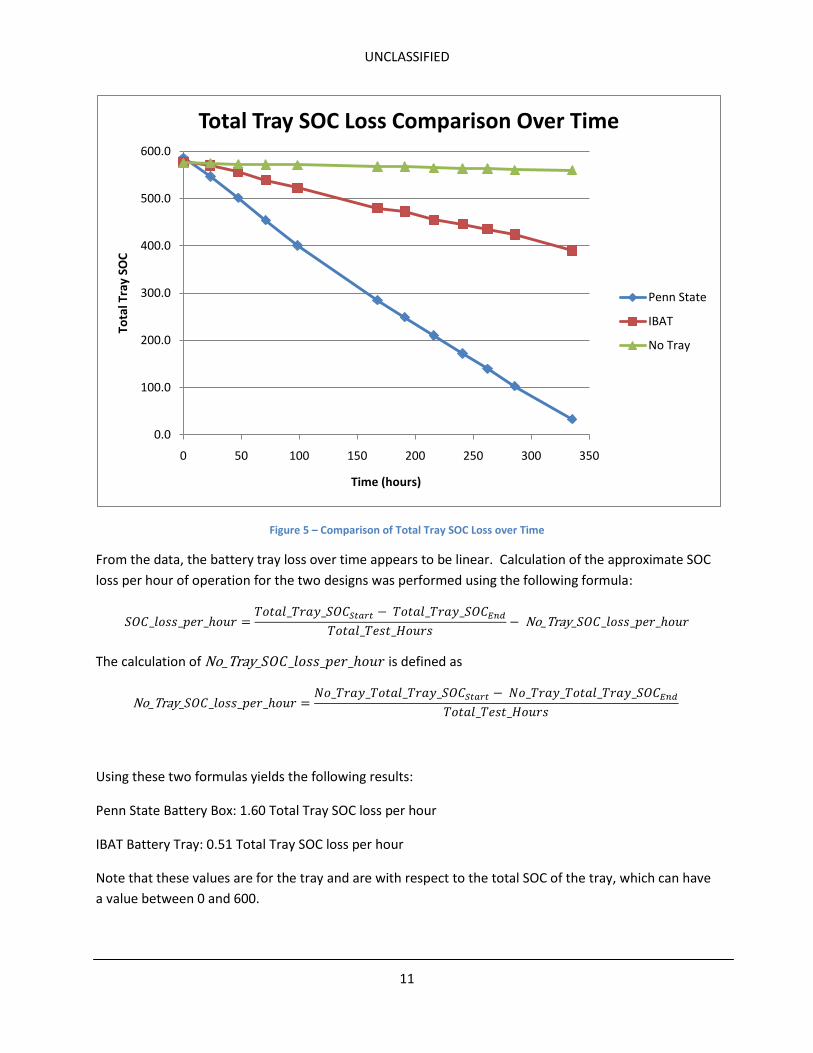
These same results are provided graphically in Figure 5, which shows clear trends for the Total Tray SOC
loss.
UNCLASSIFIED
11
Figure 5 – Comparison of Total Tray SOC Loss over Time
From the data, the battery tray loss over time appears to be linear. Calculation of the approximate SOC
loss per hour of operation for the two designs was performed using the following formula:
The calculation of is defined as
Using these two formulas yields the following results:
Penn State Battery Box: 1.60 Total Tray SOC loss per hour
IBAT Battery Tray: 0.51 Total Tray SOC loss per hour
Note that these values are for the tray and are with respect to the total SOC of the tray, which can have
a value between 0 and 600.
0.0
100.0
200.0
300.0
400.0
500.0
600.0
0 50 100 150 200 250 300 350
Tota
l Tra
y SO
C
Time (hours)
Total Tray SOC Loss Comparison Over Time
Penn State
IBAT
No Tray

UNCLASSIFIED
12
Each battery in the tray is going to lose roughly 1/6 of this value per hour of use, in addition to whatever
the robot is consuming. If the values are then normalized on a “per battery” basis, the results are
Penn State Battery Box 0.27 Individual Battery SOC loss per hour
IBAT Battery Tray: 0.09 Individual Battery SOC loss per hour
UNCLASSIFIED
13
Appendix A
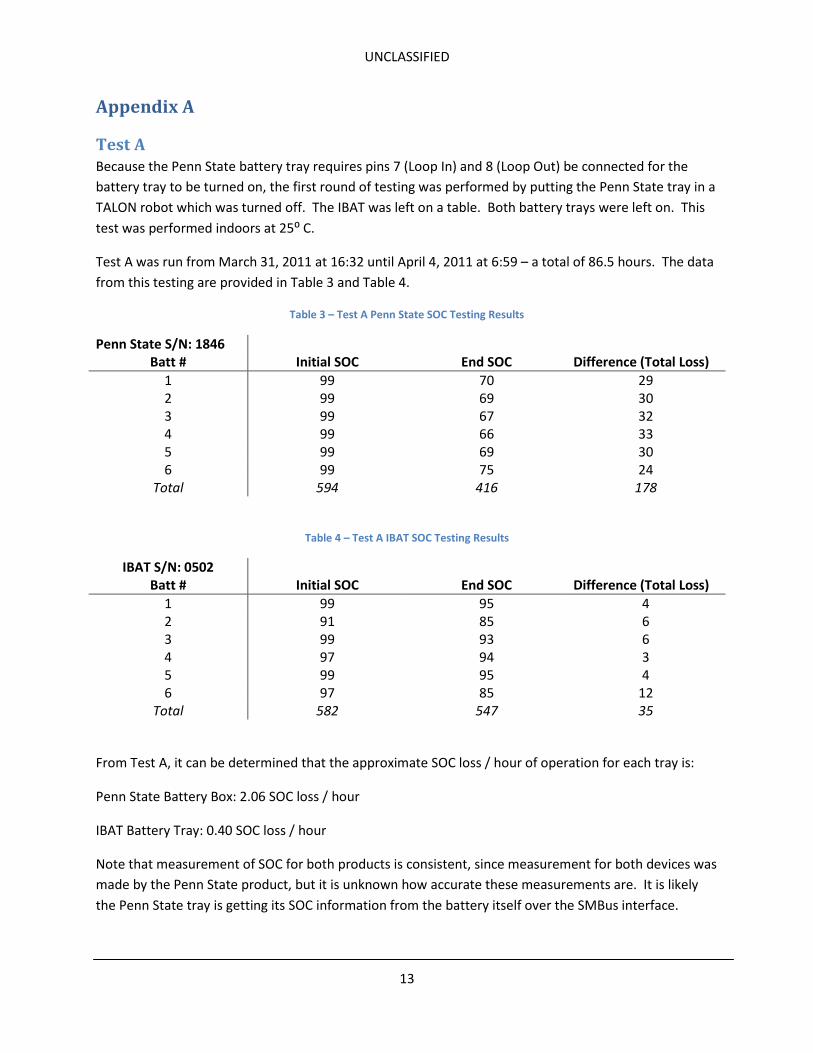
Test A Because the Penn State battery tray requires pins 7 (Loop In) and 8 (Loop Out) be connected for the
battery tray to be turned on, the first round of testing was performed by putting the Penn State tray in a
TALON robot which was turned off. The IBAT was left on a table. Both battery trays were left on. This
test was performed indoors at 25⁰ C.
Test A was run from March 31, 2011 at 16:32 until April 4, 2011 at 6:59 – a total of 86.5 hours. The data
from this testing are provided in Table 3 and Table 4.
Table 3 – Test A Penn State SOC Testing Results
Penn State S/N: 1846 Batt # Initial SOC End SOC Difference (Total Loss)
1 99 70 29 2 99 69 30 3 99 67 32 4 99 66 33 5 99 69 30 6 99 75 24
Total 594 416 178
Table 4 – Test A IBAT SOC Testing Results
IBAT S/N: 0502 Batt # Initial SOC End SOC Difference (Total Loss)
1 99 95 4 2 91 85 6 3 99 93 6 4 97 94 3 5 99 95 4 6 97 85 12
Total 582 547 35
From Test A, it can be determined that the approximate SOC loss / hour of operation for each tray is:
Penn State Battery Box: 2.06 SOC loss / hour
IBAT Battery Tray: 0.40 SOC loss / hour
Note that measurement of SOC for both products is consistent, since measurement for both devices was
made by the Penn State product, but it is unknown how accurate these measurements are. It is likely
the Penn State tray is getting its SOC information from the battery itself over the SMBus interface.
UNCLASSIFIED
14
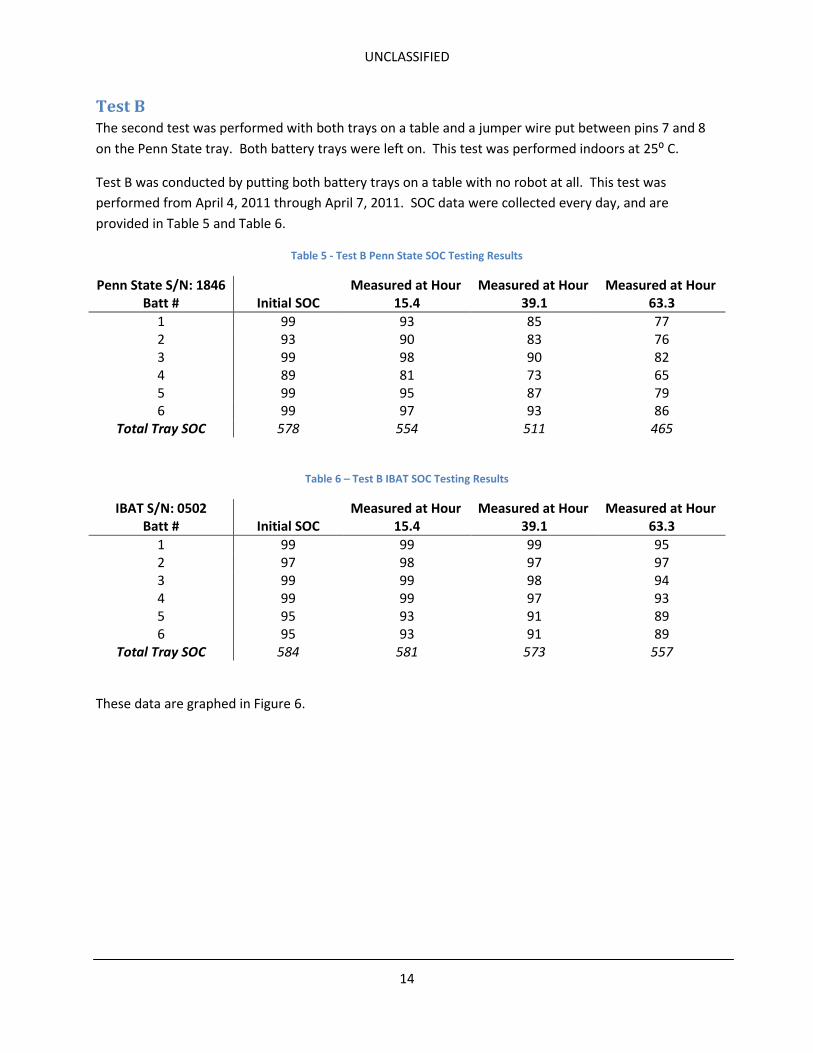
Test B The second test was performed with both trays on a table and a jumper wire put between pins 7 and 8
on the Penn State tray. Both battery trays were left on. This test was performed indoors at 25⁰ C.
Test B was conducted by putting both battery trays on a table with no robot at all. This test was
performed from April 4, 2011 through April 7, 2011. SOC data were collected every day, and are
provided in Table 5 and Table 6.
Table 5 - Test B Penn State SOC Testing Results
Penn State S/N: 1846 Measured at Hour Measured at Hour Measured at Hour Batt # Initial SOC 15.4 39.1 63.3
1 99 93 85 77 2 93 90 83 76 3 99 98 90 82 4 89 81 73 65 5 99 95 87 79 6 99 97 93 86
Total Tray SOC 578 554 511 465
Table 6 – Test B IBAT SOC Testing Results
IBAT S/N: 0502 Measured at Hour Measured at Hour Measured at Hour Batt # Initial SOC 15.4 39.1 63.3
1 99 99 99 95 2 97 98 97 97 3 99 99 98 94 4 99 99 97 93 5 95 93 91 89 6 95 93 91 89
Total Tray SOC 584 581 573 557
These data are graphed in Figure 6.
UNCLASSIFIED
15
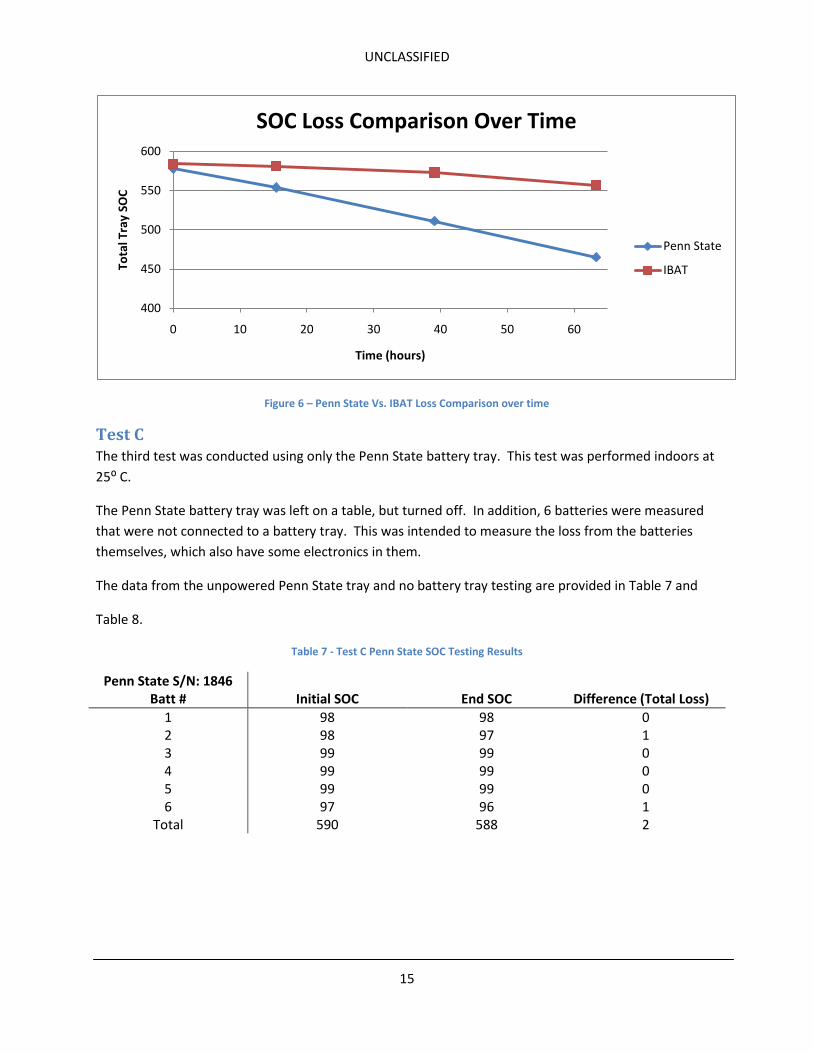
Figure 6 – Penn State Vs. IBAT Loss Comparison over time
Test C The third test was conducted using only the Penn State battery tray. This test was performed indoors at
25⁰ C.
The Penn State battery tray was left on a table, but turned off. In addition, 6 batteries were measured
that were not connected to a battery tray. This was intended to measure the loss from the batteries
themselves, which also have some electronics in them.
The data from the unpowered Penn State tray and no battery tray testing are provided in Table 7 and
Table 8.
Table 7 - Test C Penn State SOC Testing Results
Penn State S/N: 1846 Batt # Initial SOC End SOC Difference (Total Loss)
1 98 98 0 2 98 97 1 3 99 99 0 4 99 99 0 5 99 99 0 6 97 96 1
Total 590 588 2
400
450
500
550
600
0 10 20 30 40 50 60
Tota
l Tra
y SO
C
Time (hours)
SOC Loss Comparison Over Time
Penn State
IBAT
UNCLASSIFIED
16
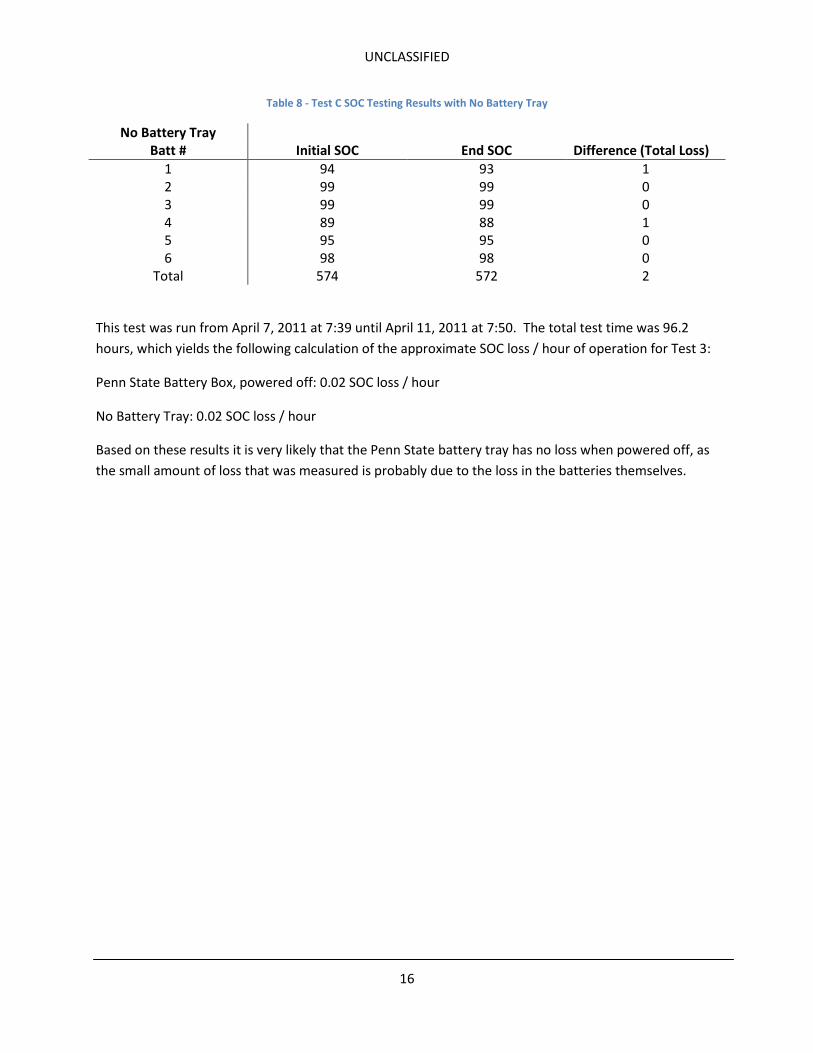
Table 8 - Test C SOC Testing Results with No Battery Tray
No Battery Tray Batt # Initial SOC End SOC Difference (Total Loss)
1 94 93 1 2 99 99 0 3 99 99 0 4 89 88 1 5 95 95 0 6 98 98 0
Total 574 572 2
This test was run from April 7, 2011 at 7:39 until April 11, 2011 at 7:50. The total test time was 96.2
hours, which yields the following calculation of the approximate SOC loss / hour of operation for Test 3:
Penn State Battery Box, powered off: 0.02 SOC loss / hour
No Battery Tray: 0.02 SOC loss / hour
Based on these results it is very likely that the Penn State battery tray has no loss when powered off, as
the small amount of loss that was measured is probably due to the loss in the batteries themselves.
UNCLASSIFIED
17
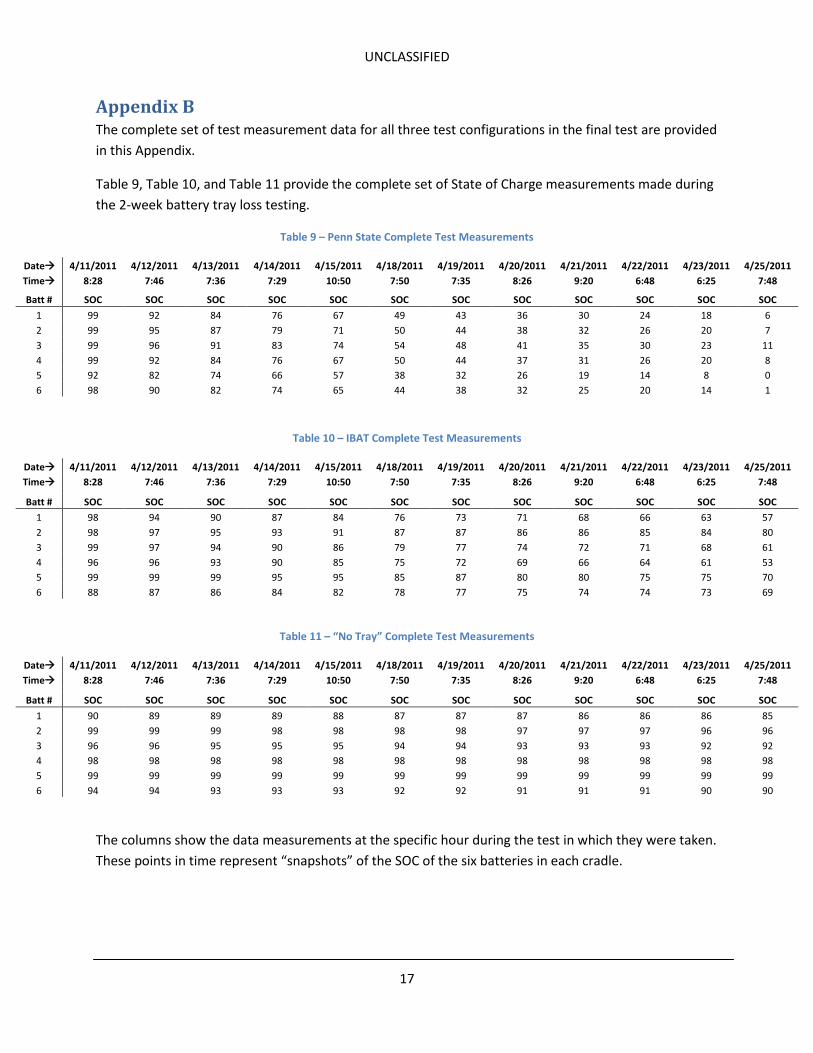
Appendix B The complete set of test measurement data for all three test configurations in the final test are provided
in this Appendix.
Table 9, Table 10, and Table 11 provide the complete set of State of Charge measurements made during
the 2-week battery tray loss testing.
Table 9 – Penn State Complete Test Measurements
Date 4/11/2011 4/12/2011 4/13/2011 4/14/2011 4/15/2011 4/18/2011 4/19/2011 4/20/2011 4/21/2011 4/22/2011 4/23/2011 4/25/2011
Time 8:28 7:46 7:36 7:29 10:50 7:50 7:35 8:26 9:20 6:48 6:25 7:48
Batt # SOC SOC SOC SOC SOC SOC SOC SOC SOC SOC SOC SOC
1 99 92 84 76 67 49 43 36 30 24 18 6
2 99 95 87 79 71 50 44 38 32 26 20 7
3 99 96 91 83 74 54 48 41 35 30 23 11
4 99 92 84 76 67 50 44 37 31 26 20 8
5 92 82 74 66 57 38 32 26 19 14 8 0
6 98 90 82 74 65 44 38 32 25 20 14 1
Table 10 – IBAT Complete Test Measurements
Date 4/11/2011 4/12/2011 4/13/2011 4/14/2011 4/15/2011 4/18/2011 4/19/2011 4/20/2011 4/21/2011 4/22/2011 4/23/2011 4/25/2011
Time 8:28 7:46 7:36 7:29 10:50 7:50 7:35 8:26 9:20 6:48 6:25 7:48
Batt # SOC SOC SOC SOC SOC SOC SOC SOC SOC SOC SOC SOC
1 98 94 90 87 84 76 73 71 68 66 63 57
2 98 97 95 93 91 87 87 86 86 85 84 80
3 99 97 94 90 86 79 77 74 72 71 68 61
4 96 96 93 90 85 75 72 69 66 64 61 53
5 99 99 99 95 95 85 87 80 80 75 75 70
6 88 87 86 84 82 78 77 75 74 74 73 69
Table 11 – “No Tray” Complete Test Measurements
Date 4/11/2011 4/12/2011 4/13/2011 4/14/2011 4/15/2011 4/18/2011 4/19/2011 4/20/2011 4/21/2011 4/22/2011 4/23/2011 4/25/2011
Time 8:28 7:46 7:36 7:29 10:50 7:50 7:35 8:26 9:20 6:48 6:25 7:48
Batt # SOC SOC SOC SOC SOC SOC SOC SOC SOC SOC SOC SOC
1 90 89 89 89 88 87 87 87 86 86 86 85
2 99 99 99 98 98 98 98 97 97 97 96 96
3 96 96 95 95 95 94 94 93 93 93 92 92
4 98 98 98 98 98 98 98 98 98 98 98 98
5 99 99 99 99 99 99 99 99 99 99 99 99
6 94 94 93 93 93 92 92 91 91 91 90 90
The columns show the data measurements at the specific hour during the test in which they were taken.
These points in time represent “snapshots” of the SOC of the six batteries in each cradle.