Embed Size (px)
Citation preview
Underemployment Survey
Conducted for work2future 2011
Underemployment Survey Conducted for work2future
i
TABLE OF CONTENTS Table of Contents ............................................................................................................. i List of Figures.................................................................................................................. ii Summary of Findings ...................................................................................................... 1
Workforce Development Conclusions and Recommendations ..................................... 7 Results of the Underemployment Survey ...................................................................... 10
Perception of Economy and Employment Opportunities ............................................ 10 Employment Status .................................................................................................... 11
Employed Workers ........................................................................................................ 14 Job Satisfaction ......................................................................................................... 14 Looking for A Different Job ........................................................................................ 15 Held a Position with Higher Pay in the Last Five Years .............................................. 17
Underutilized ................................................................................................................. 18 Utilization of Training and Education Courses for Employment ..................................... 19 Appendix A: Toplines .................................................................................................. A-1
Underemployment Survey Conducted for work2future
ii
LIST OF FIGURES Figure 1 Underemployment Estimate for July 2011 ......................................................... 2 Figure 2 Annual Average U6 Unemployment Rate .......................................................... 5 Figure 3 Perception of Economy and Employment Opportunities .................................. 10 Figure 4 Employment Status ......................................................................................... 11 Figure 5 Unemployment Profile (n=112) ........................................................................ 12 Figure 6 Unemployed Looking for Work in Last Four Weeks (n=45) .............................. 13 Figure 7 Job Satisfaction (n=288) .................................................................................. 14 Figure 8 Employed and Looking for a Job Elsewhere (n=288) ....................................... 15 Figure 9 Employed and Looking: Primary Reason Looking for another Job (n=84) ....... 16 Figure 10 Employed in a Position with Better Pay in the Last Five Years (n=288) ......... 17 Figure 11 Feel Overqualified for Current Position .......................................................... 18 Figure 12 Reasons Feel Overqualified (n=143) ............................................................. 18 Figure 13 Training and Education Courses (n=400) ...................................................... 19
Underemployment Survey Conducted for work2future
1
SUMMARY OF FINDINGS Introduction
BW Research Partnership, Inc. (BW Research) and Green LMI partnered with work2future to conduct an underemployment survey of Santa Clara residents 18 to 64 years of age. The primary research objectives of the study were to:
• Measure the impact of underemployment in San Jose and Santa Clara County;
• Assess residents’ perceptions regarding the area's economy and the opportunities for employment;
• Evaluate residents’ employment profile, including job satisfaction and underemployment; and
• Identify residents’ utilization of training and educational courses for purposes of current or future employment.
The survey was conducted among 400 Santa Clara County residents 18 to 64 years of age, who were not full-time students, by telephone and web from May 5 through 16, 2011 and averaged 12 minutes in length. The web portion of the project was conducted through a nationally respected Internet panel provider and the telephone portion utilized both traditional landline and cellular phones. The demographic profile of respondents to the survey, according to age, ethnicity and gender, was representative of Santa Clara County's 18 to 64 year old population with the exclusion of full-time students factored into the assessment.
Underemployment Survey Conducted for work2future
2
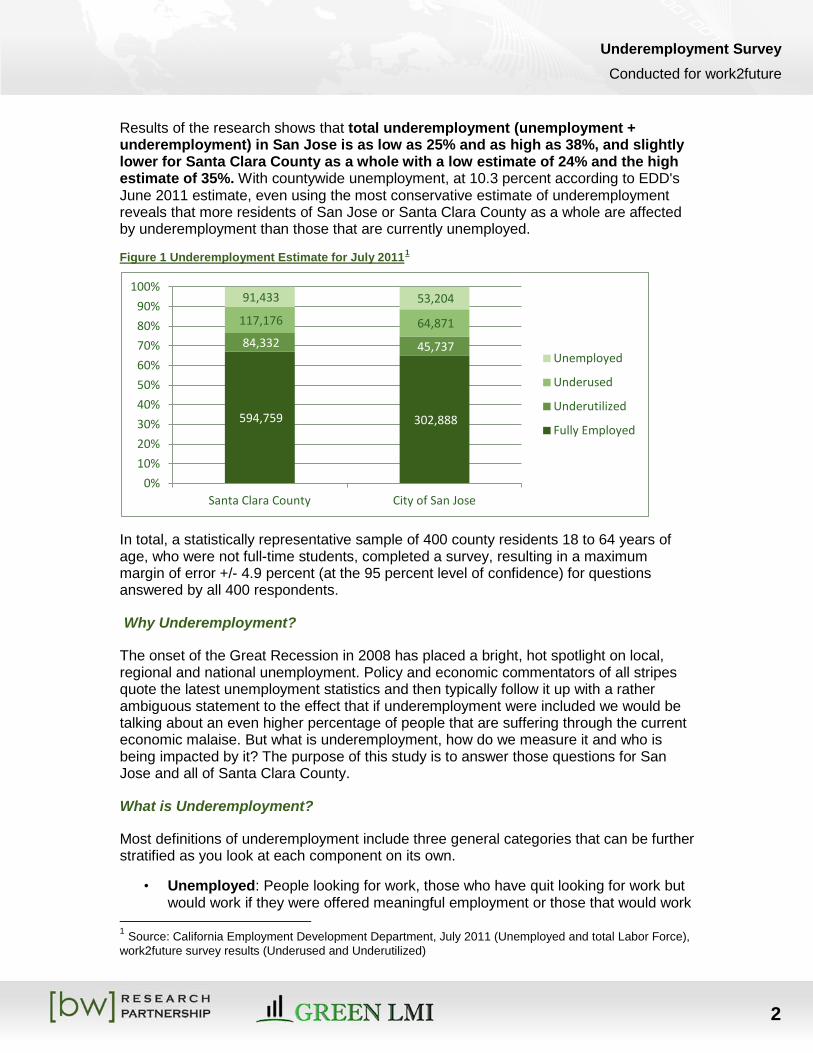
Results of the research shows that total underemployment (unemployment + underemployment) in San Jose is as low as 25% and as high as 38%, and slightly lower for Santa Clara County as a whole with a low estimate of 24% and the high estimate of 35%. With countywide unemployment, at 10.3 percent according to EDD's June 2011 estimate, even using the most conservative estimate of underemployment reveals that more residents of San Jose or Santa Clara County as a whole are affected by underemployment than those that are currently unemployed.
Figure 1 Underemployment Estimate for July 20111
In total, a statistically representative sample of 400 county residents 18 to 64 years of age, who were not full-time students, completed a survey, resulting in a maximum margin of error +/- 4.9 percent (at the 95 percent level of confidence) for questions answered by all 400 respondents.
Why Underemployment?
The onset of the Great Recession in 2008 has placed a bright, hot spotlight on local, regional and national unemployment. Policy and economic commentators of all stripes quote the latest unemployment statistics and then typically follow it up with a rather ambiguous statement to the effect that if underemployment were included we would be talking about an even higher percentage of people that are suffering through the current economic malaise. But what is underemployment, how do we measure it and who is being impacted by it? The purpose of this study is to answer those questions for San Jose and all of Santa Clara County.
What is Underemployment?
Most definitions of underemployment include three general categories that can be further stratified as you look at each component on its own.
• Unemployed: People looking for work, those who have quit looking for work but would work if they were offered meaningful employment or those that would work
1 Source: California Employment Development Department, July 2011 (Unemployed and total Labor Force), work2future survey results (Underused and Underutilized)
594,759 302,888
84,332 45,737
117,176 64,871
91,433 53,204
0% 10% 20% 30% 40% 50% 60% 70% 80% 90%
100%
Santa Clara County City of San Jose
Unemployed
Underused
Underutilized
Fully Employed
Underemployment Survey Conducted for work2future
3
but are unable to work because there are barriers to working, such as finding adequate child-care or transportation to work. Many of the typical estimates of unemployment do not include discouraged or displaced workers, those individuals who could be working but are not currently looking for work or have other barriers to working.
• Underused: Part-time jobholders or holders of multiple jobs who want to work in one full-time paying job. This group is also called part-time workers for economic reasons and includes those workers who are engaged in part-time or temporary employment but would prefer full-time permanent employment.
• Underutilized: Those workers who are in jobs that are not fully utilizing the skills, training, experience and education that they have acquired. This is the hardest of the three categories to measure and generally relies on survey respondents to provide their own assessment of their skills and the work they are doing currently.
How Can We Measure Underemployment?
Measures of underemployment are more amorphous than unemployment. Most standardized measures of underemployment only include the unemployed and the underused. Yet, even though individuals who are underutilized are not counted in most standard measures of underemployment, most labor economists argue they are an important part of understanding underemployment.
Two of the more prominent measures of underemployment include:
• BLS's U6: This is the Bureau of Labor Statistics broadest measure of unemployment and it includes the unemployed (both those actively looking and discouraged job-seekers) and part-time workers for economic reasons. May 2011’s estimate for the US is 15.8%.
• Gallup's measure of underemployment: Uses a simple measure of all people that are unemployed + all people working part-time that would prefer to be working full-time but cannot find full-time employment. May 2011’s estimate for the US is 19.2%.
Both of these measures provide a broad estimate of both unemployed and underused workers but do not incorporate any estimate of underutilized workers. It is also worth noting that neither of these measures of underemployment is estimated consistently for any geographic area smaller than at the state level.
Underemployment Survey Conducted for work2future
4
What are the current estimates of Underemployment in Santa Clara County
The results of the survey allowed us to estimate underemployment among the three general categories that were previously identified. As you consider the results of the estimates, please recognize that the estimates below are additive in the order in which they are presented, meaning 1) the “underused” estimates (San Jose and the overall county, including San Jose) include both the unemployed and workers who are, strictly speaking, underused; and 2) the interval estimates of underutilized workers include both the unemployed and the underused, as well as those who would fall just into the underutilized category.
• Unemployment: 13.4% (San Jose) and 11.3% (Santa Clara County) — This estimate of unemployment is relatively consistent with the EDD's U3 measure of unemployment, whereby discouraged and displaced job-seekers are not included in the estimate. Many economists and labor market experts have argued that U3 considerably understates unemployment because it does not factor in those workers that have grown too discouraged with the current job market to even look for a job. Methodologically, we were encouraged to see that our datasets measured Santa Clara County's U3 unemployment so closely with the EDD's estimate for June 2011 (EDD's June 2011 estimate of U3 for Santa Clara County: 10.3%, only 1% different than our estimate based on the survey results.). San Jose's June 2011 U3 estimate from EDD was 11.4%, within two percentage points of the estimate provided by the survey results.
Underemployment Survey Conducted for work2future
5
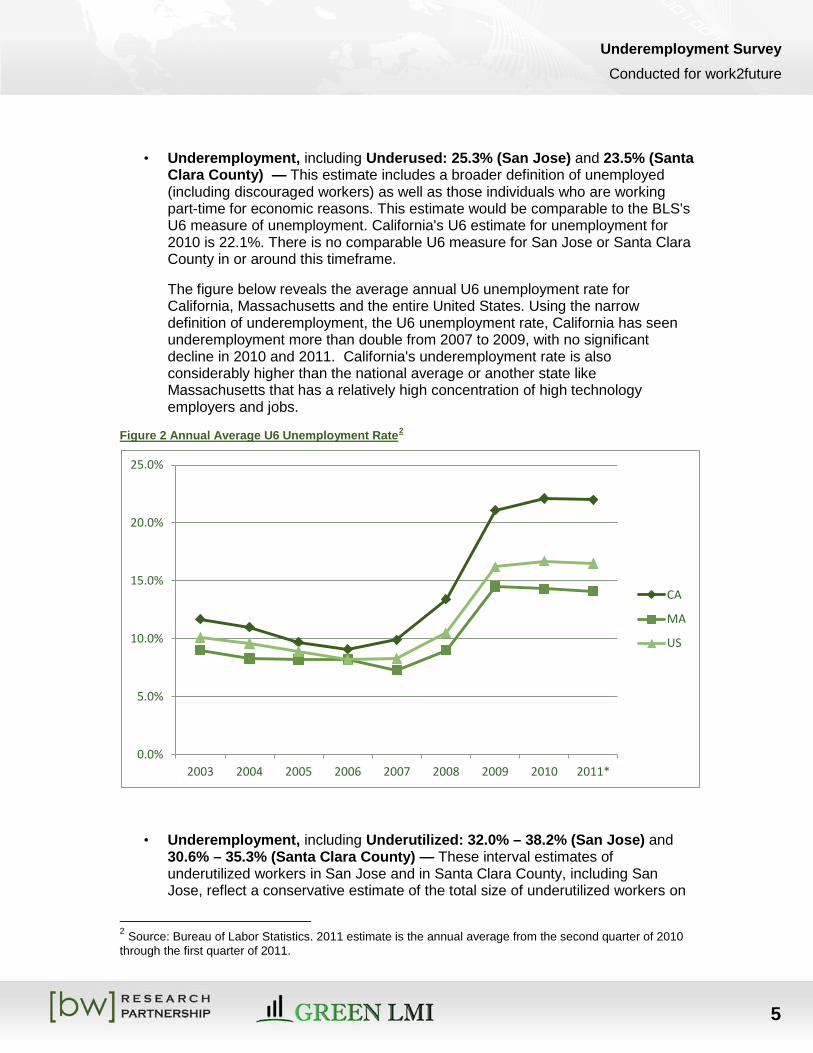
• Underemployment, including Underused: 25.3% (San Jose) and 23.5% (Santa Clara County) — This estimate includes a broader definition of unemployed (including discouraged workers) as well as those individuals who are working part-time for economic reasons. This estimate would be comparable to the BLS's U6 measure of unemployment. California's U6 estimate for unemployment for 2010 is 22.1%. There is no comparable U6 measure for San Jose or Santa Clara County in or around this timeframe.
The figure below reveals the average annual U6 unemployment rate for California, Massachusetts and the entire United States. Using the narrow definition of underemployment, the U6 unemployment rate, California has seen underemployment more than double from 2007 to 2009, with no significant decline in 2010 and 2011. California's underemployment rate is also considerably higher than the national average or another state like Massachusetts that has a relatively high concentration of high technology employers and jobs.
Figure 2 Annual Average U6 Unemployment Rate2
• Underemployment, including Underutilized: 32.0% – 38.2% (San Jose) and 30.6% – 35.3% (Santa Clara County) — These interval estimates of underutilized workers in San Jose and in Santa Clara County, including San Jose, reflect a conservative estimate of the total size of underutilized workers on
2 Source: Bureau of Labor Statistics. 2011 estimate is the annual average from the second quarter of 2010 through the first quarter of 2011.
0.0%
5.0%
10.0%
15.0%
20.0%
25.0%
2003 2004 2005 2006 2007 2008 2009 2010 2011*
CA
MA
US
Underemployment Survey Conducted for work2future
6
the low end and what we believe is the most accurate measure of underutilized workers on the high end. The conservative estimate of underutilized only included those individuals who had made more money in the last five years and the respondent identified at least one specific area that they were overqualified for in their current employment. The less conservative estimate of underemployment did require the respondent to identify at least one specific area they were overqualified for in their current position, but did not require the respondent to indicate that they had made more money in another position in the last five years.
Who are the underemployed in San Jose and Santa Clara County?
The underemployed in San Jose and in Santa Clara County, overall, do not fit one broad demographic profile but instead span a broad range of ages, ethnicities, educational backgrounds and levels of household income. However, each of the underemployed categories does reveal some characteristics that qualifying members are more likely to have. Below is a description of each of those profiles.
Unemployed job seekers are more likely to come from a low-income household ($25K or less), have a relatively low level of education (High School Degree or less), rent their current residence, identify themselves as white or Caucasian, and are either 18 to 24 or 55 to 64 years old.
Underused workers are more likely to come from a low-income household ($25K or less), have a somewhat higher level of education than unemployed workers (have some college or an AA degree), identify themselves as Hispanic or Latino, and are 18 to 24 years old.
Underutilized workers are more likely to be 45 to 54 years old and have a 4-year college degree. This group is also more likely to have children under 19 living at home and have an annual household income above $75,000.
The diversity of age groups, household income levels and educational backgrounds that are affected by underemployment in San Jose and the County illustrates the widespread impact that underemployment is having on the local workforce.
Underemployment Survey Conducted for work2future
7
WORKFORCE DEVELOPMENT CONCLUSIONS AND RECOMMENDATIONS
The following workforce development conclusions and recommendations are based on the findings of the underemployment research.
Conclusion #1: Strictly speaking, underemployment alone (underused and underutilized, without unemployed) impacts considerably more people than does unemployment per se in San Jose and Santa Clara County.
Even if we use a broader definition of unemployment than that used by the Bureau of Labor Statistics (BLS) in their U3 measurement, underemployment impacts approximately two to three times as many people as does unemployment per se in Santa Clara County. Given the magnitude of underemployment in San Jose and Santa Clara County, strategies should be focused not just on getting people back to work, but on getting people back to fully productive employment.
The following conclusion discusses the more relevant connections between underemployment and one of Silicon Valley's more important industry clusters that was recently examined by work2future, the emerging green economy.
Conclusion #2: Underutilized workers with industry experience in energy, manufacturing or technology are more likely than other unemployed or underemployed workers to find employment in Silicon Valley's emerging green industries.
Underutilized workers, compared to unemployed or underused workers, are more likely to have two things that Silicon Valley's emerging green employers are looking for, 1) industry experience that is connected to the technologies they are involved with (energy, manufacturing and software) and 2) the skills and educational background that are required for the occupational opportunities found in the emerging green industry cluster. Underutilized workers were most likely to be working in technology or professional or business services industry and are more likely to have the skills and training needed for occupations in the emerging green economy such as a project manager, sales representative or quality control engineer in comparison to those unemployed and underused workers who have less experience working in related industries or occupations.
Recommendation: work2future's job-seeking customers should be evaluated and categorized in three basic categories that builds off of what we have learned about unemployed, underused and underutilized workers in San Jose and the County, in general.
As part of the individual evaluation process, job-seeking customers would need to identify the industries and general occupational categories in which they want to find employment. Job counselors would assist in identifying those industries and/or occupations based on the overall employment opportunities that are available.
Underemployment Survey Conducted for work2future
8
The three categories would be based on the individual's level of preparedness for employment in the desired industries and/or general occupational categories:
Initial job seekers are those customers that have little to no work experience and have not developed enough identifiable job skills for entry-level employment. Individuals in this category would focus on developing foundational job skills that support entry-level employment. As an example, this could include younger job seekers whose only work experience is in food service and they are looking for employment opportunities in healthcare.
Underused job seekers are those customers that may have some entry-level work experience or have some identifiable job skills for entry-level employment. Individuals in this category would get more specific training and skills development to further refine and develop the experience and skills that they have already begun to develop. Strategies for this type of job seeker would include looking for entry-level employment that provides greater opportunities for career advancement. As an example, this could include someone who is currently working in the construction industry as a general laborer and would like to become a project manager.
Underutilized job seekers are those customers that have industry work experience and identifiable job skills beyond just entry-level employment. Individuals in this category would get transitional training and industry experience that takes their current skills and experience and better positions them for new and/or growing employment opportunities. As an example, this could include a project manager who is currently or previously working in hardware manufacturing and wants to find employment in the energy efficiency industry.
There are three clear advantages to delineating customers into these three general categories based on their work experience and the identifiable skills developed through training, work and education. First, it provides a more specific focus to the training or experience that would be most appropriate for work2future customers. Second, it allows work2future to identify more effectively which job opportunities are most appropriate for a given work2future customer. Third, it allows work2future to quantify and more accurately describe its job-seeking customers.
This recommendation has several implications for work2future operations that should be incorporated into any planning of next steps for the organization. These operational implications include;
• Develop a more robust protocol for identifying and connecting experienced and skilled job seekers to emerging green employers. Recent research by work2future of Silicon Valley's emerging green industries revealed that employers in this sector are typically looking for experienced and skilled workers that have some relevant work history in energy, technology and/or specific aspects of manufacturing. An initial assessment process that delineates work2future customers into different categories should also include relevant work history in given industries and technologies that would allow easy identification for appropriate candidates in the emerging green industries.
Underemployment Survey Conducted for work2future
9
• Integrate the use of assessment tools with the early identification of appropriate training and workforce development opportunities. The initial assessment process should include three components, an evaluation of current skills and abilities, an inventory of relevant education and experience with given industries, technologies and occupations and lastly some indication of the career pathways and areas of interest for the job seeker. These three components should provide work2future the information it needs to identify potential training opportunities and work experience options that will allow the job seeker to began moving along the most appropriate career pathways.
• Expand the use of technology to incorporate the initial assessment with the most appropriate online training and the ability to target workforce demand (employers) with available workforce supply (job seekers) through interactive and dynamic GIS tools such as EconoVue. The effective connectivity of different technology applications is critical to ensuring that job-seekers can move as quickly as they are motivated to, to gather the appropriate feedback on where they are what they need to do to move along their chosen career path.
• Lastly provide a more targeted method in connecting the appropriate job seeker with an employer who is looking for specific skills, abilities and experience. Ultimately the recommended approach is based on the objective of providing a more targeted approach to job seekers in developing their skills and finding the right employment opportunities. For employers, the recommended approach should assist in finding a select group of the most qualified job seekers for the employer to consider, rather than a large number of job seekers who may or may not be qualified for the type of worker they are seeking.
For additional detail on the research findings and a complete assessment of the survey results, please proceed to the body of the report beginning on the next page.
Underemployment Survey Conducted for work2future
10
RESULTS OF THE UNDEREMPLOYMENT SURVEY The following figures and descriptions provide the results of the underemployment survey completed with Santa Clara County residents between the ages of 18 and 64 who are not currently full-time students.
PERCEPTION OF ECONOMY AND EMPLOYMENT OPPORTUNITIES
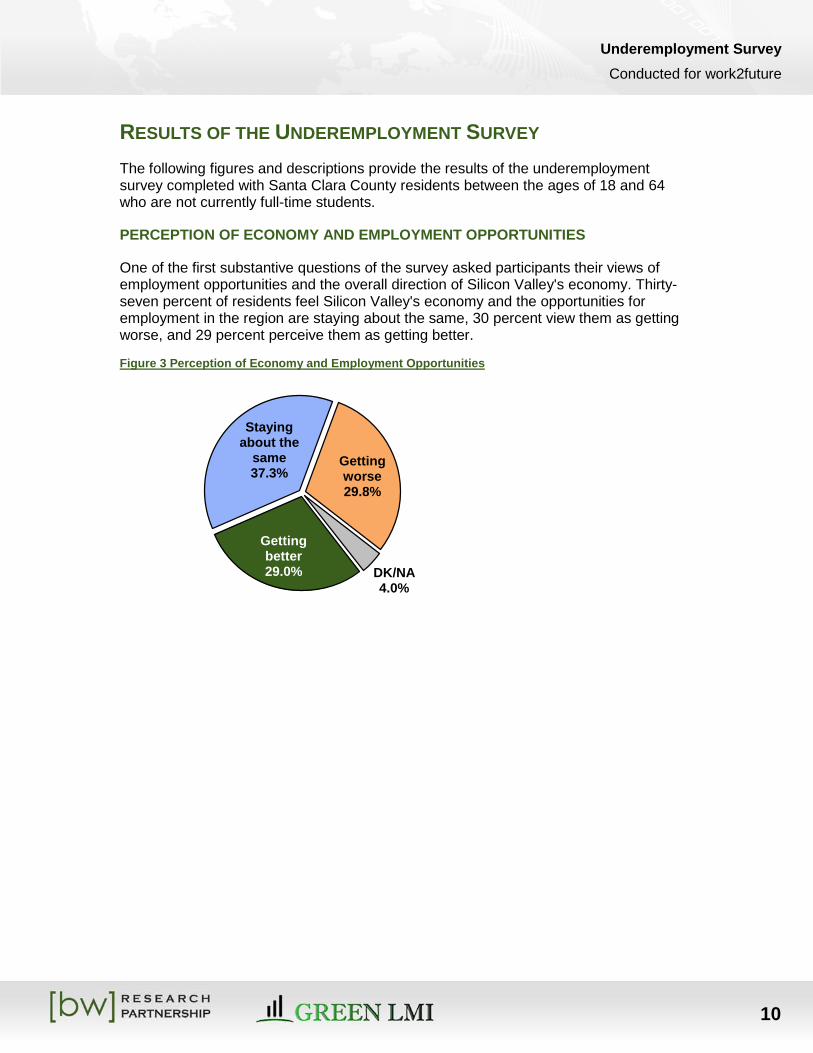
One of the first substantive questions of the survey asked participants their views of employment opportunities and the overall direction of Silicon Valley's economy. Thirty-seven percent of residents feel Silicon Valley's economy and the opportunities for employment in the region are staying about the same, 30 percent view them as getting worse, and 29 percent perceive them as getting better.
Figure 3 Perception of Economy and Employment Opportunities
Getting better 29.0%
Staying about the
same 37.3%
Getting worse 29.8%
DK/NA 4.0%
Underemployment Survey Conducted for work2future
11
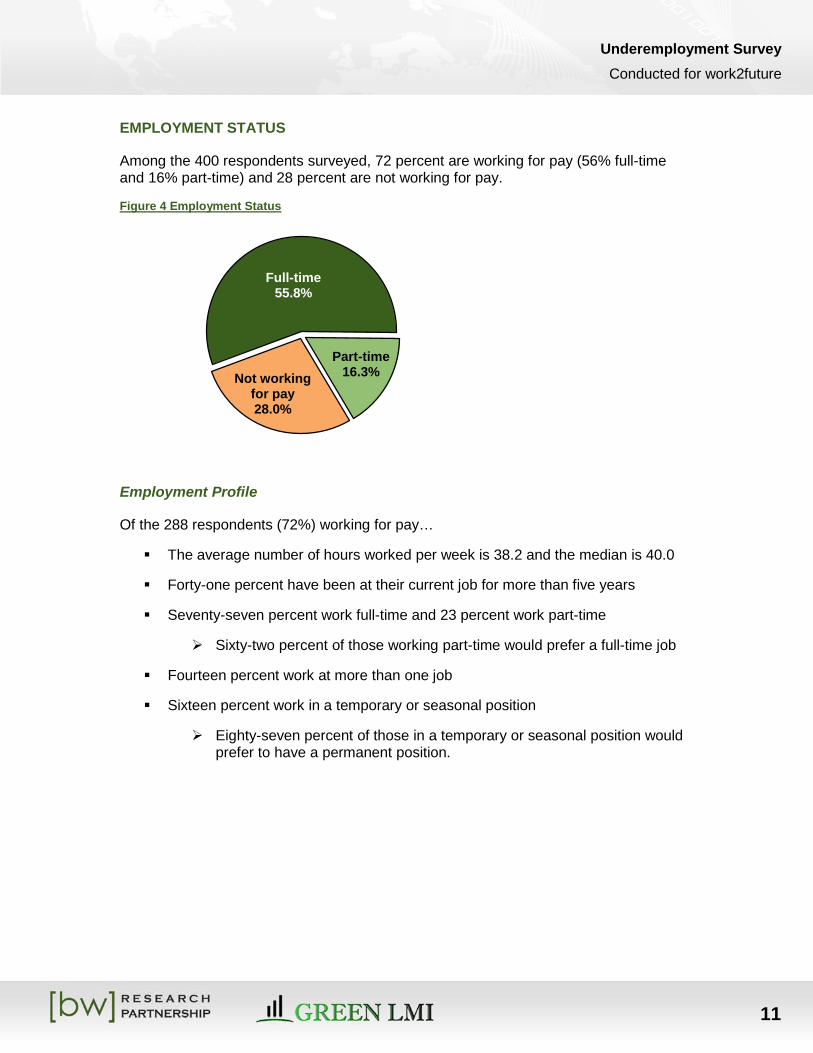
EMPLOYMENT STATUS
Among the 400 respondents surveyed, 72 percent are working for pay (56% full-time and 16% part-time) and 28 percent are not working for pay.
Figure 4 Employment Status
Employment Profile
Of the 288 respondents (72%) working for pay…
The average number of hours worked per week is 38.2 and the median is 40.0
Forty-one percent have been at their current job for more than five years
Seventy-seven percent work full-time and 23 percent work part-time
Sixty-two percent of those working part-time would prefer a full-time job
Fourteen percent work at more than one job
Sixteen percent work in a temporary or seasonal position
Eighty-seven percent of those in a temporary or seasonal position would prefer to have a permanent position.
Full-time 55.8%
Part-time 16.3% Not working
for pay 28.0%
Underemployment Survey Conducted for work2future
12
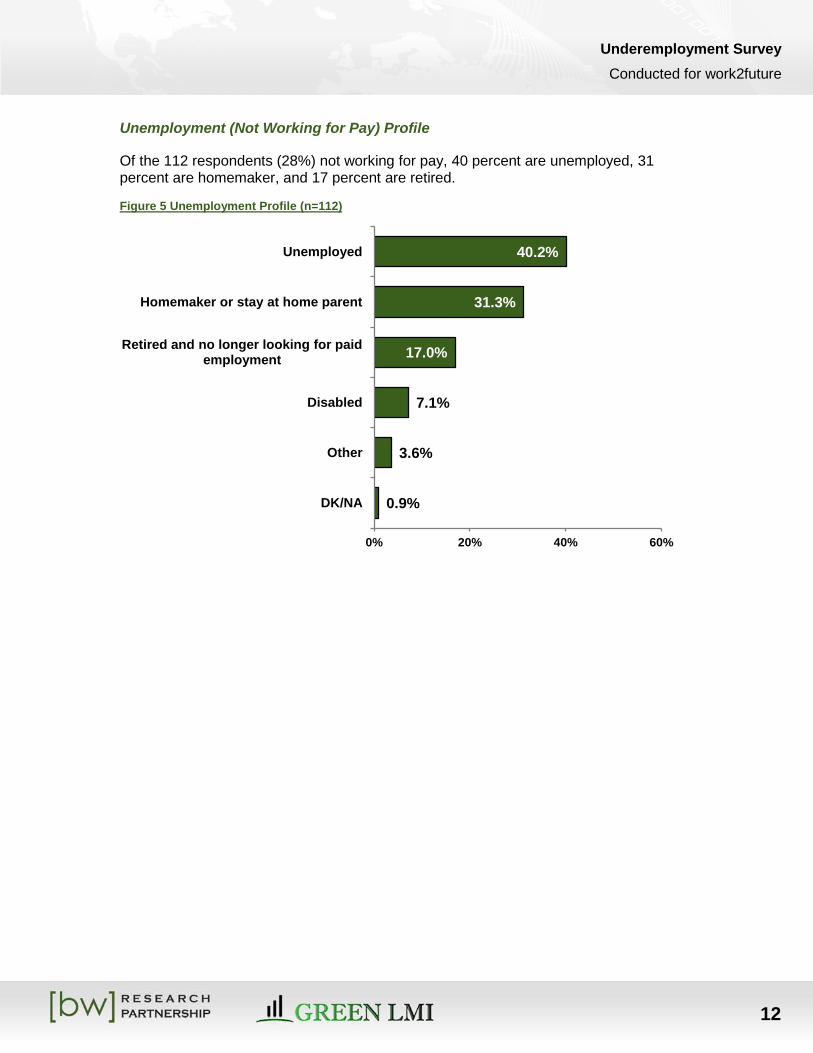
Unemployment (Not Working for Pay) Profile
Of the 112 respondents (28%) not working for pay, 40 percent are unemployed, 31 percent are homemaker, and 17 percent are retired.
Figure 5 Unemployment Profile (n=112)
0.9%
3.6%
7.1%
17.0%
31.3%
40.2%
0% 20% 40% 60%
DK/NA
Other
Disabled
Retired and no longer looking for paid employment
Homemaker or stay at home parent
Unemployed
Underemployment Survey Conducted for work2future
13
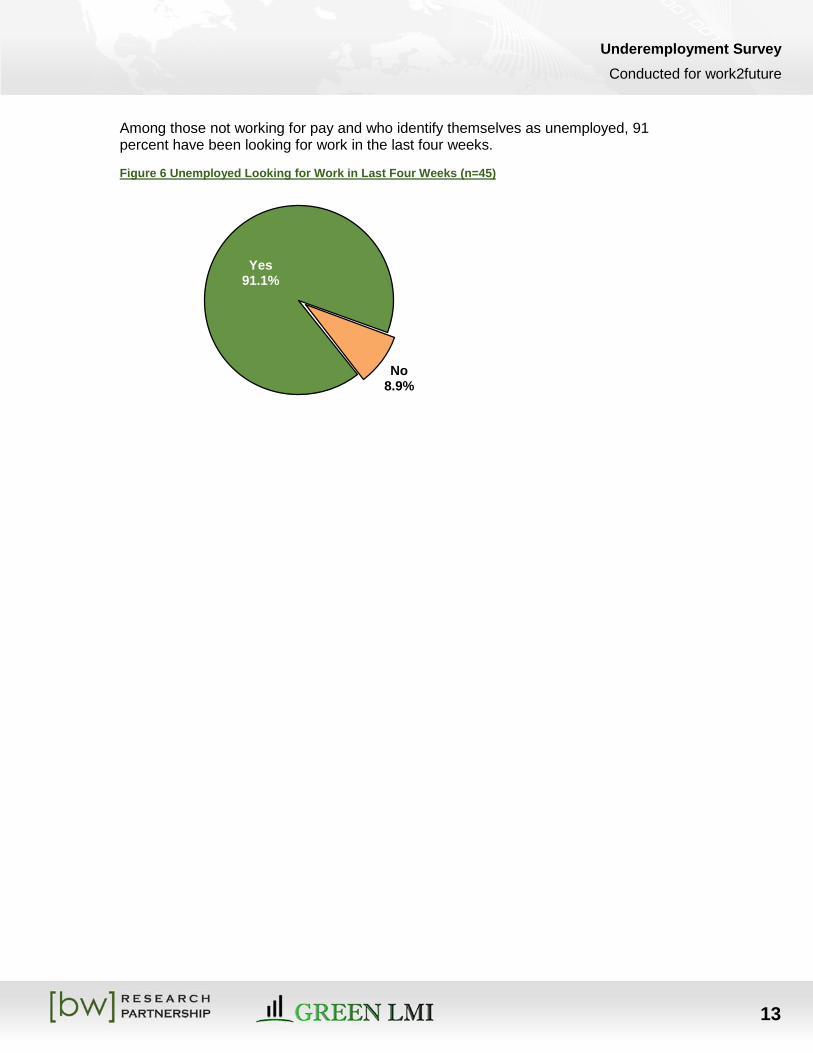
Among those not working for pay and who identify themselves as unemployed, 91 percent have been looking for work in the last four weeks.
Figure 6 Unemployed Looking for Work in Last Four Weeks (n=45)
Yes 91.1%
No 8.9%
Underemployment Survey Conducted for work2future
14
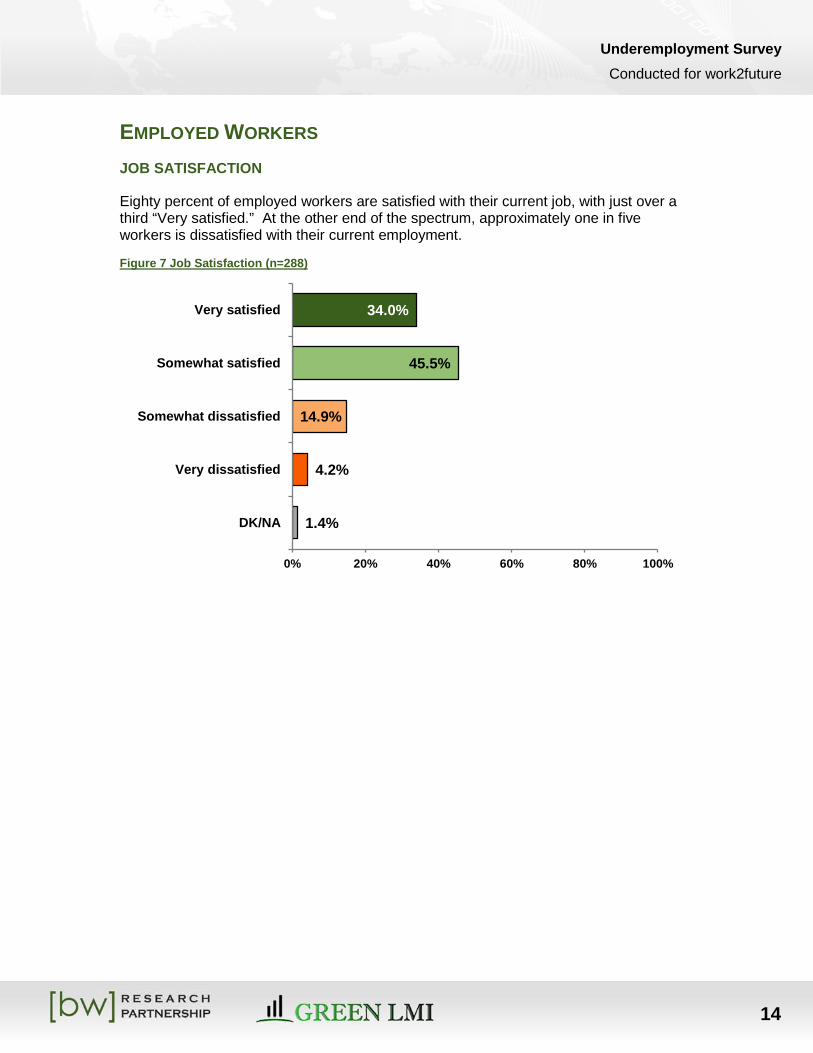
EMPLOYED WORKERS JOB SATISFACTION
Eighty percent of employed workers are satisfied with their current job, with just over a third “Very satisfied.” At the other end of the spectrum, approximately one in five workers is dissatisfied with their current employment.
Figure 7 Job Satisfaction (n=288)
1.4%
4.2%
14.9%
45.5%
34.0%
0% 20% 40% 60% 80% 100%
DK/NA
Very dissatisfied
Somewhat dissatisfied
Somewhat satisfied
Very satisfied
Underemployment Survey Conducted for work2future
15
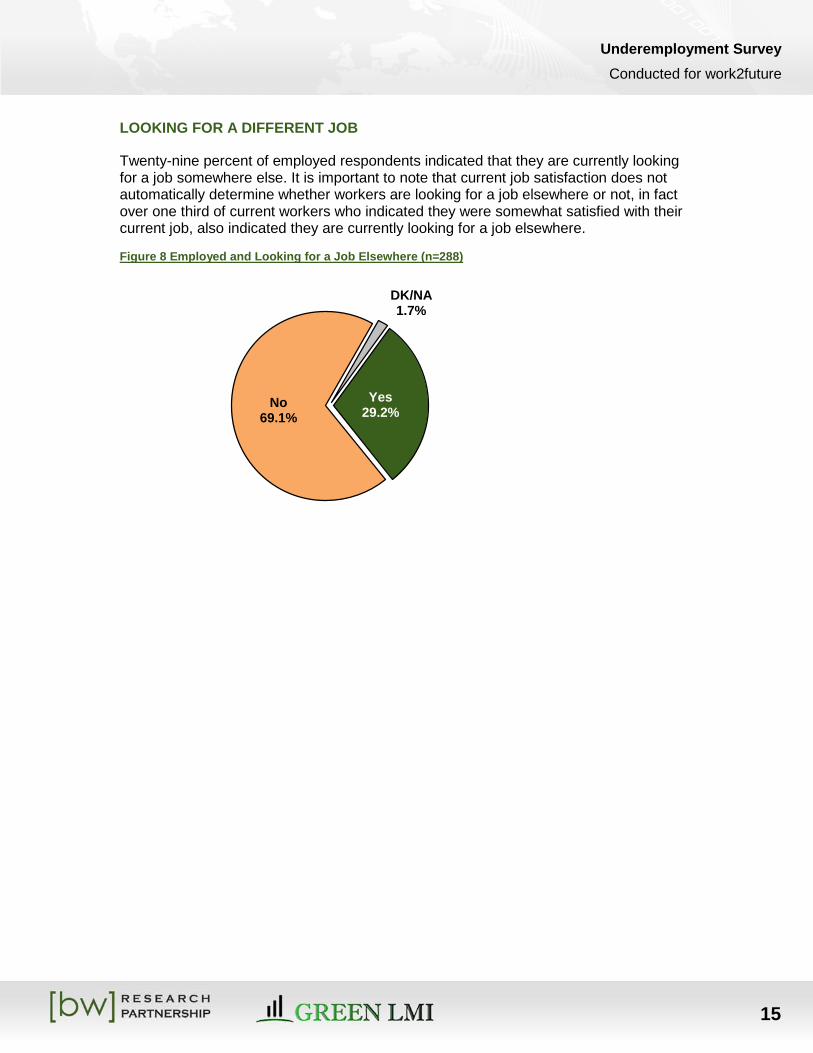
LOOKING FOR A DIFFERENT JOB
Twenty-nine percent of employed respondents indicated that they are currently looking for a job somewhere else. It is important to note that current job satisfaction does not automatically determine whether workers are looking for a job elsewhere or not, in fact over one third of current workers who indicated they were somewhat satisfied with their current job, also indicated they are currently looking for a job elsewhere.
Figure 8 Employed and Looking for a Job Elsewhere (n=288)
Yes 29.2%
No 69.1%
DK/NA 1.7%
Underemployment Survey Conducted for work2future
16
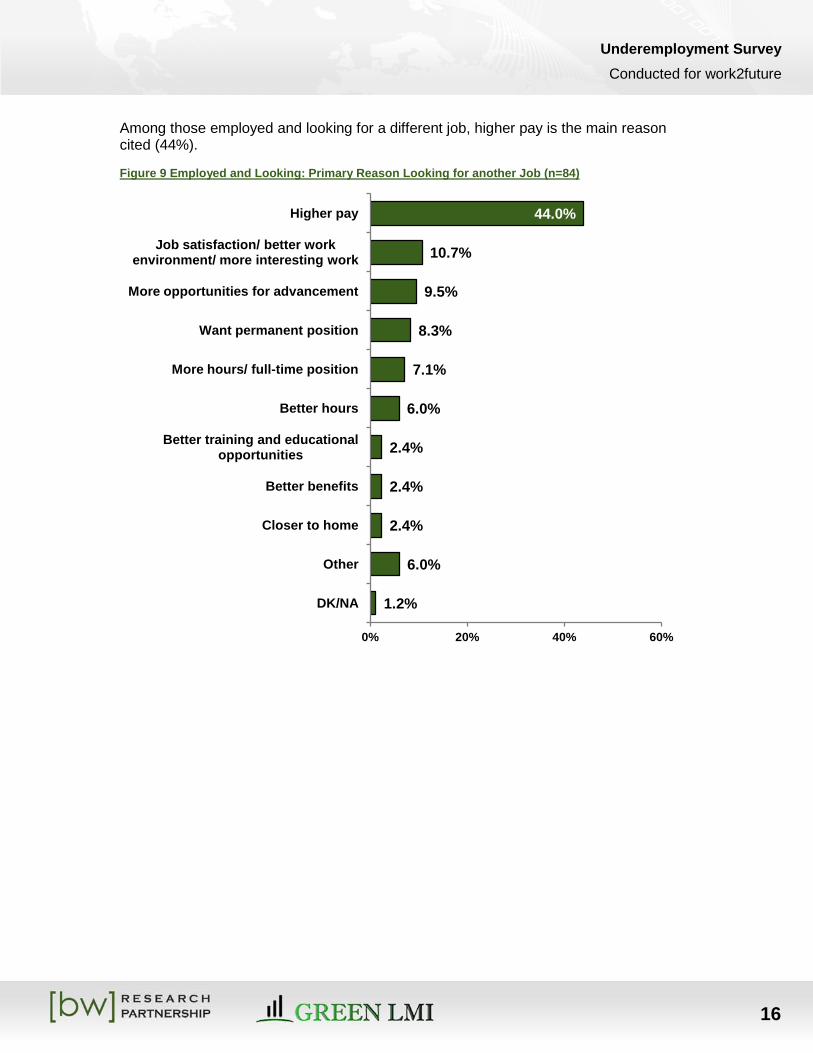
Among those employed and looking for a different job, higher pay is the main reason cited (44%).
Figure 9 Employed and Looking: Primary Reason Looking for another Job (n=84)
1.2%
6.0%
2.4%
2.4%
2.4%
6.0%
7.1%
8.3%
9.5%
10.7%
44.0%
0% 20% 40% 60%
DK/NA
Other
Closer to home
Better benefits
Better training and educational opportunities
Better hours
More hours/ full-time position
Want permanent position
More opportunities for advancement
Job satisfaction/ better work environment/ more interesting work
Higher pay
Underemployment Survey Conducted for work2future
17
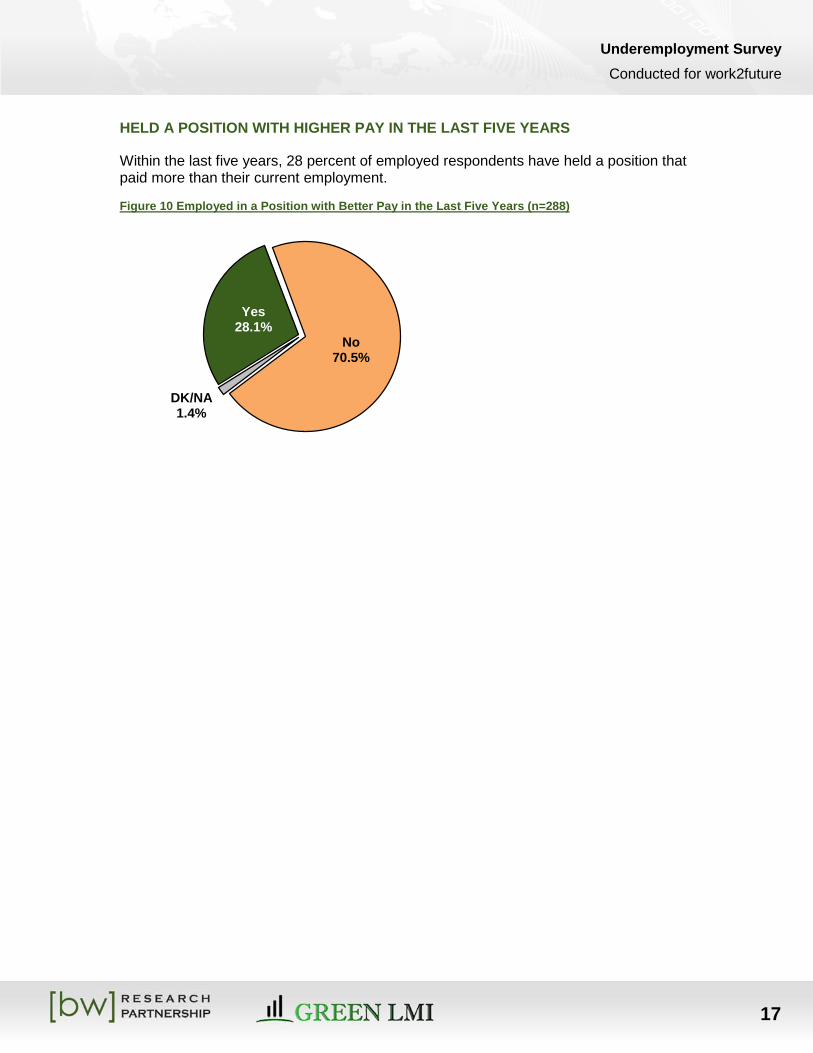
HELD A POSITION WITH HIGHER PAY IN THE LAST FIVE YEARS
Within the last five years, 28 percent of employed respondents have held a position that paid more than their current employment.
Figure 10 Employed in a Position with Better Pay in the Last Five Years (n=288)
Yes 28.1%
No 70.5%
DK/NA 1.4%
Underemployment Survey Conducted for work2future
18
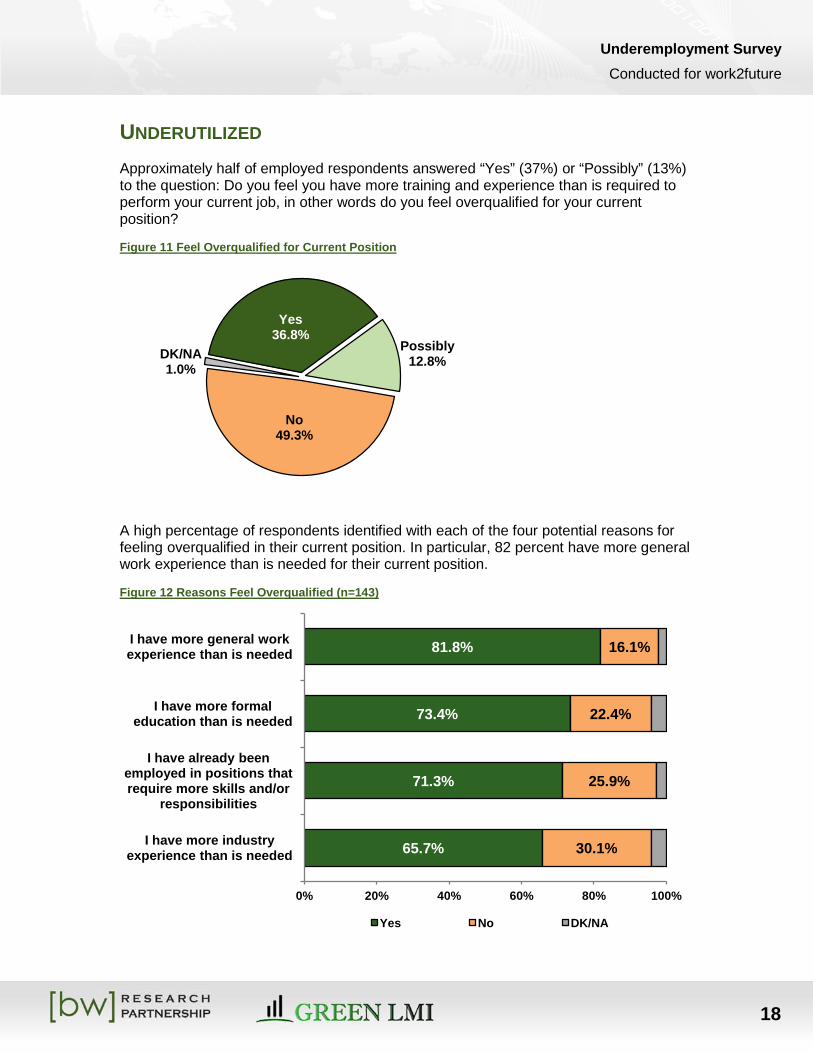
UNDERUTILIZED Approximately half of employed respondents answered “Yes” (37%) or “Possibly” (13%) to the question: Do you feel you have more training and experience than is required to perform your current job, in other words do you feel overqualified for your current position?
Figure 11 Feel Overqualified for Current Position
A high percentage of respondents identified with each of the four potential reasons for feeling overqualified in their current position. In particular, 82 percent have more general work experience than is needed for their current position.
Figure 12 Reasons Feel Overqualified (n=143)
Yes 36.8%
Possibly 12.8%
No 49.3%
DK/NA 1.0%
65.7%
71.3%
73.4%
81.8%
30.1%
25.9%
22.4%
16.1%
0% 20% 40% 60% 80% 100%
I have more industry experience than is needed
I have already been employed in positions that require more skills and/or
responsibilities
I have more formal education than is needed
I have more general work experience than is needed
Yes No DK/NA
Underemployment Survey Conducted for work2future
19
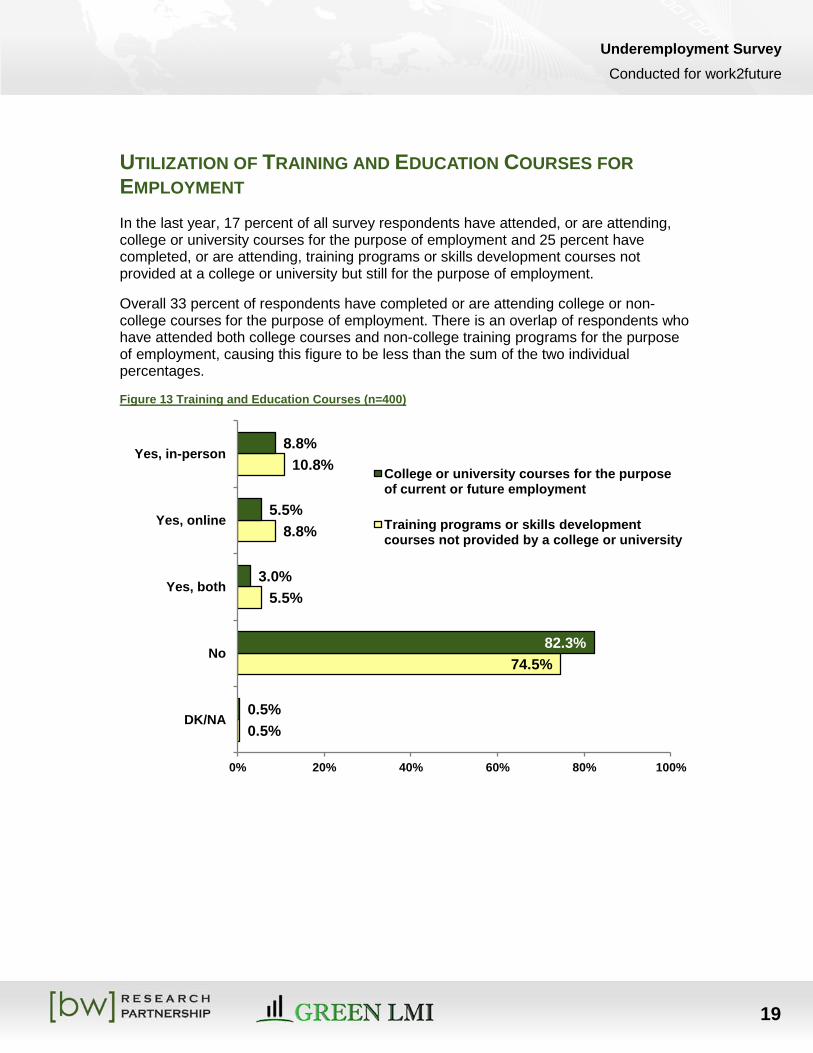
UTILIZATION OF TRAINING AND EDUCATION COURSES FOR EMPLOYMENT In the last year, 17 percent of all survey respondents have attended, or are attending, college or university courses for the purpose of employment and 25 percent have completed, or are attending, training programs or skills development courses not provided at a college or university but still for the purpose of employment.
Overall 33 percent of respondents have completed or are attending college or non-college courses for the purpose of employment. There is an overlap of respondents who have attended both college courses and non-college training programs for the purpose of employment, causing this figure to be less than the sum of the two individual percentages.
Figure 13 Training and Education Courses (n=400)
0.5%
74.5%
5.5%
8.8%
10.8%
0.5%
82.3%
3.0%
5.5%
8.8%
0% 20% 40% 60% 80% 100%
DK/NA
No
Yes, both
Yes, online
Yes, in-person College or university courses for the purpose of current or future employment
Training programs or skills development courses not provided by a college or university
Underemployment Survey Conducted for work2future
A-1
APPENDIX A: TOPLINES Resident Survey (n=400)
May 2011
Toplines
`````````````````````````````````````````````````````````````````````````````````````````````````````````````````````````````````
Introduction:
Hello, my name is ______ and I’m calling on behalf of the City of San Jose which is conducting a study of Santa Clara County residents. The City has hired BW Research, an independent research agency, to conduct a survey concerning issues in your community and we would like to get your opinions.
(If needed): This should just take a few minutes of your time.
(If needed): I assure you that we are an independent research agency and that all of your responses will remain strictly confidential.
For statistical reasons, I would like to speak to the youngest adult male currently at home that is at least 18 years of age. (Or youngest female depending on statistics of previous completed interviews)
(IF THERE IS NO MALE/FEMALE AT LEAST 18 AVAILABLE, THEN ASK:) Ok, then I’d like to speak to the youngest adult female/male currently at home that is at least 18 years of age. (IF THERE IS NO MALE/FEMALE AT LEAST 18 AVAILABLE, ASK FOR CALLBACK TIME)
(If needed): This is a study about issues of importance in your community – it is a survey only and we are not selling anything.
(If needed): This survey should only take a few minutes of your time.
(If respondent indicates that he/she is a city employee, council member, or elected official, thank him/ her for his/ her time and end the interview.)
(If the individual mentions the national do not call list, respond according to American Marketing Association guidelines): “Most types of opinion and marketing research studies are exempt under the law that congress recently passed. That law was passed to regulate the activities of the telemarketing industry. This is a legitimate research call. Your opinions count!”)
`````````````````````````````````````````````````````````````````````````````````````````````````````````````````````````````````
PLEASE NOTE TRADITIONAL ROUNDING RULES APPLIED NOT ALL PERCENTAGES WILL EQUAL EXACTLY 100%
Underemployment Survey Conducted for work2future
A-2
Screener Questions
A. Before we begin, I want to confirm that you live within our study area. What is your home zip code? (If respondent gives the PO Box zip codes, prompt them to give their home zip code for survey purposes).
100% Note qualifying zip codes (continue) Respondent Zip Codes on File
0% Other [Specify:_____] [Thank and terminate]
0% Don’t know/ refused [Thank and terminate]
If live in zip code 94303 or 95033 ask, “Do you live in Santa Clara County?” and terminate if the answer is no. 57% City of San Jose
44% Other
B. Are you a full-time student?
0% Yes [Thank and terminate]
100% No (continue)
0% Don’t know/ refused [Thank and terminate]
C. In what year were you born? Note qualifying 1992 to 1947 (continue) IF 1993 "Are you at least 18 years old" (if no, terminate) IF 1946 "Are you 64 or 65 years old" (if 65, terminate) Don’t know/ refused [Thank and terminate] 7% 18 to 24 years
26% 25 to 34 years
27% 35 to 44 years
24% 45 to 54 years
17% 55 to 64 years
`````````````````````````````````````````````````````````````````````````````````````````````````````````````````````````````````
Underemployment Survey Conducted for work2future
A-3
I. Introduction
1. To begin, how long have you lived in Santa Clara County?
2% Less than 1 year
11% 1 to 4 years
12% 5 to 9 years
13% 10 to 14 years
62% 15 years or more
0% (Don't Read) DK/NA
2. Do you feel Silicon Valley's economy and the opportunities for employment in the region are getting better, getting worse or staying about the same?
29% Getting better
30% Getting worse
37% Staying about the same
4% (Don't Read) DK/NA Next, I would like to ask you about work in the region. 3. Are you currently working, either part-time or full-time for pay? 56% Yes, full-time
16% Yes, part-time
28% No
Underemployment Survey Conducted for work2future
A-4
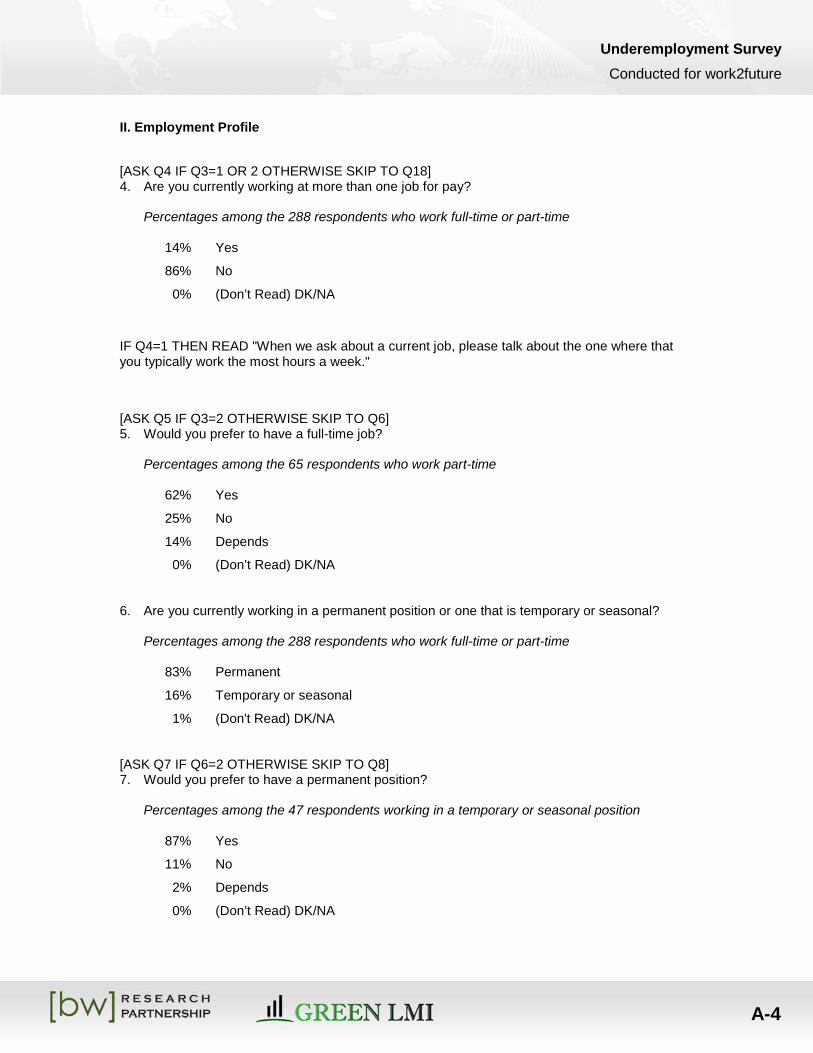
II. Employment Profile
[ASK Q4 IF Q3=1 OR 2 OTHERWISE SKIP TO Q18] 4. Are you currently working at more than one job for pay?
Percentages among the 288 respondents who work full-time or part-time 14% Yes
86% No
0% (Don’t Read) DK/NA
IF Q4=1 THEN READ "When we ask about a current job, please talk about the one where that you typically work the most hours a week."
[ASK Q5 IF Q3=2 OTHERWISE SKIP TO Q6] 5. Would you prefer to have a full-time job?
Percentages among the 65 respondents who work part-time 62% Yes
25% No
14% Depends
0% (Don’t Read) DK/NA
6. Are you currently working in a permanent position or one that is temporary or seasonal?
Percentages among the 288 respondents who work full-time or part-time
83% Permanent
16% Temporary or seasonal
1% (Don't Read) DK/NA
[ASK Q7 IF Q6=2 OTHERWISE SKIP TO Q8] 7. Would you prefer to have a permanent position?
Percentages among the 47 respondents working in a temporary or seasonal position
87% Yes
11% No
2% Depends
0% (Don’t Read) DK/NA
Underemployment Survey Conducted for work2future
A-5
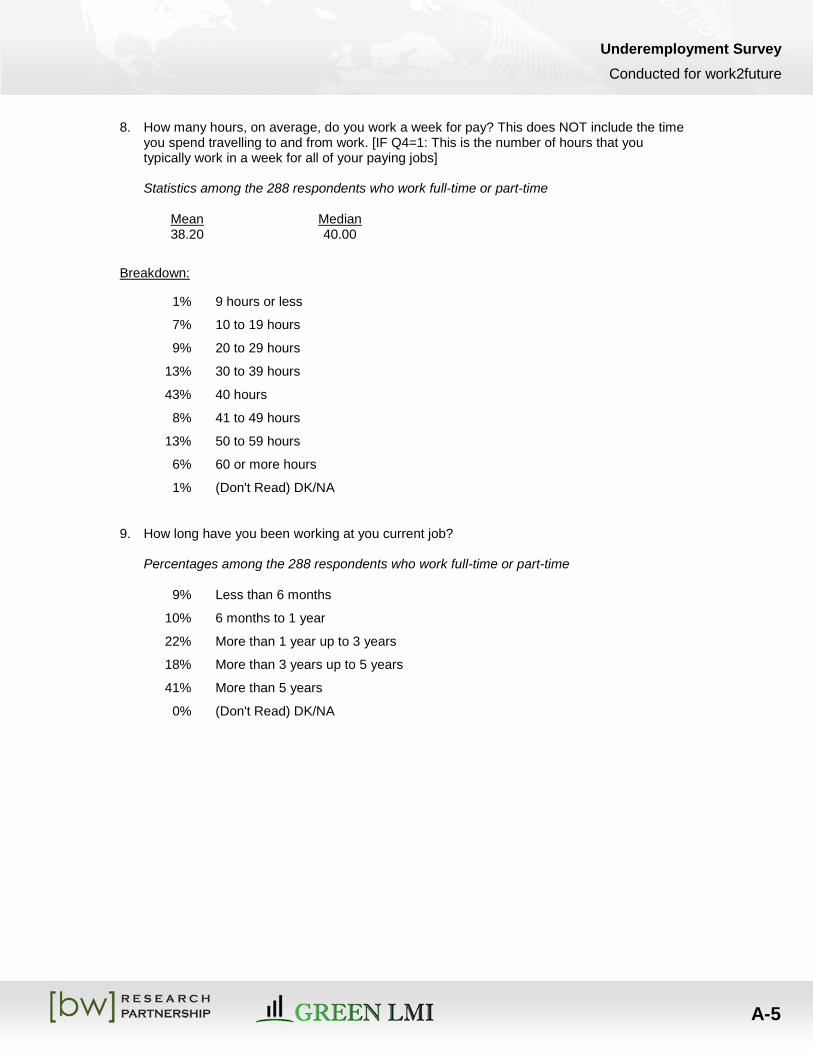
8. How many hours, on average, do you work a week for pay? This does NOT include the time you spend travelling to and from work. [IF Q4=1: This is the number of hours that you typically work in a week for all of your paying jobs]
Statistics among the 288 respondents who work full-time or part-time
Mean 38.20
Median 40.00
Breakdown:
1% 9 hours or less
7% 10 to 19 hours
9% 20 to 29 hours
13% 30 to 39 hours
43% 40 hours
8% 41 to 49 hours
13% 50 to 59 hours
6% 60 or more hours
1% (Don't Read) DK/NA
9. How long have you been working at you current job? Percentages among the 288 respondents who work full-time or part-time
9% Less than 6 months
10% 6 months to 1 year
22% More than 1 year up to 3 years
18% More than 3 years up to 5 years
41% More than 5 years
0% (Don't Read) DK/NA
Underemployment Survey Conducted for work2future
A-6
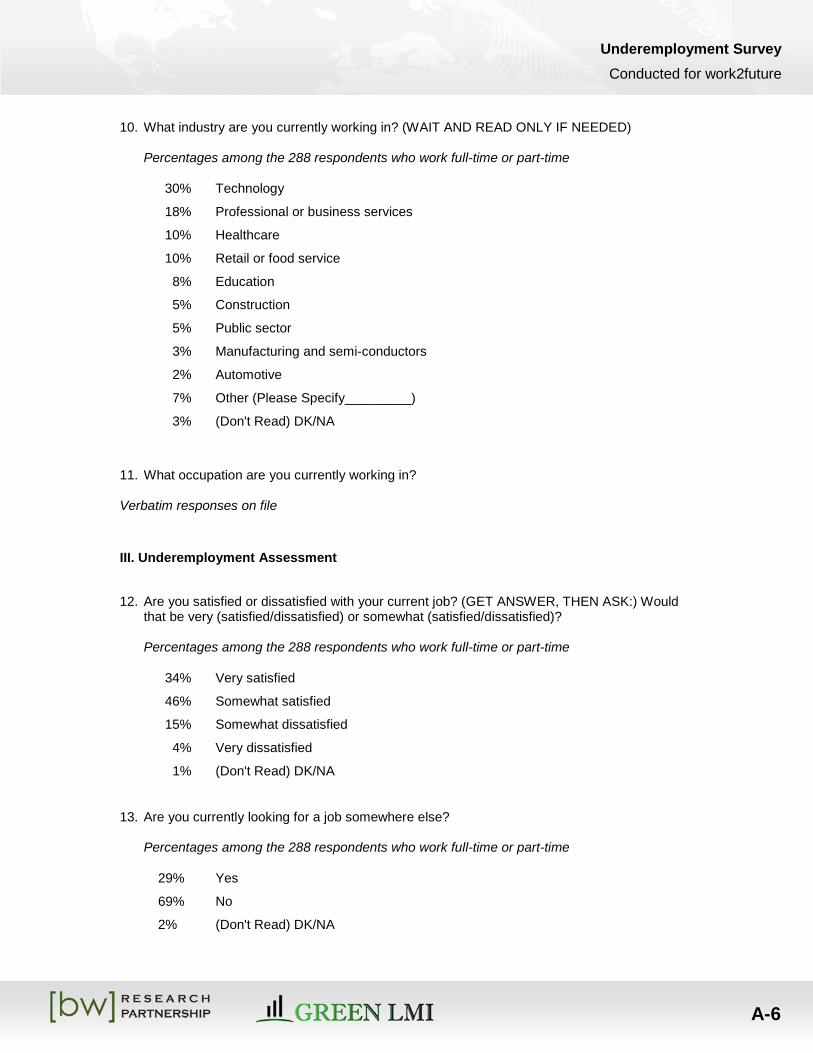
10. What industry are you currently working in? (WAIT AND READ ONLY IF NEEDED) Percentages among the 288 respondents who work full-time or part-time
30% Technology
18% Professional or business services
10% Healthcare
10% Retail or food service
8% Education
5% Construction
5% Public sector
3% Manufacturing and semi-conductors
2% Automotive
7% Other (Please Specify_________)
3% (Don't Read) DK/NA
11. What occupation are you currently working in? Verbatim responses on file
III. Underemployment Assessment
12. Are you satisfied or dissatisfied with your current job? (GET ANSWER, THEN ASK:) Would
that be very (satisfied/dissatisfied) or somewhat (satisfied/dissatisfied)? Percentages among the 288 respondents who work full-time or part-time
34% Very satisfied
46% Somewhat satisfied
15% Somewhat dissatisfied
4% Very dissatisfied
1% (Don't Read) DK/NA 13. Are you currently looking for a job somewhere else?
Percentages among the 288 respondents who work full-time or part-time
29% Yes
69% No
2% (Don't Read) DK/NA
Underemployment Survey Conducted for work2future
A-7
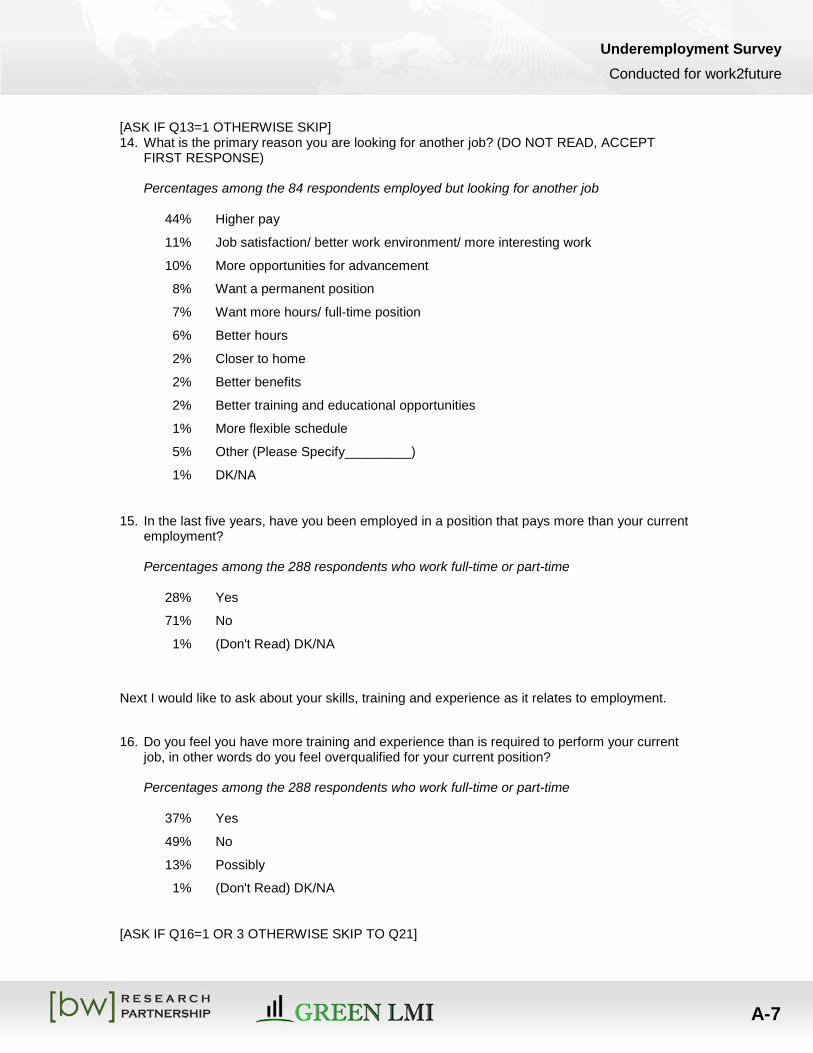
[ASK IF Q13=1 OTHERWISE SKIP] 14. What is the primary reason you are looking for another job? (DO NOT READ, ACCEPT
FIRST RESPONSE)
Percentages among the 84 respondents employed but looking for another job 44% Higher pay
11% Job satisfaction/ better work environment/ more interesting work
10% More opportunities for advancement
8% Want a permanent position
7% Want more hours/ full-time position
6% Better hours
2% Closer to home
2% Better benefits
2% Better training and educational opportunities
1% More flexible schedule
5% Other (Please Specify_________)
1% DK/NA
15. In the last five years, have you been employed in a position that pays more than your current employment? Percentages among the 288 respondents who work full-time or part-time
28% Yes
71% No
1% (Don't Read) DK/NA
Next I would like to ask about your skills, training and experience as it relates to employment.
16. Do you feel you have more training and experience than is required to perform your current
job, in other words do you feel overqualified for your current position? Percentages among the 288 respondents who work full-time or part-time
37% Yes
49% No
13% Possibly
1% (Don't Read) DK/NA [ASK IF Q16=1 OR 3 OTHERWISE SKIP TO Q21]
Underemployment Survey Conducted for work2future
A-8
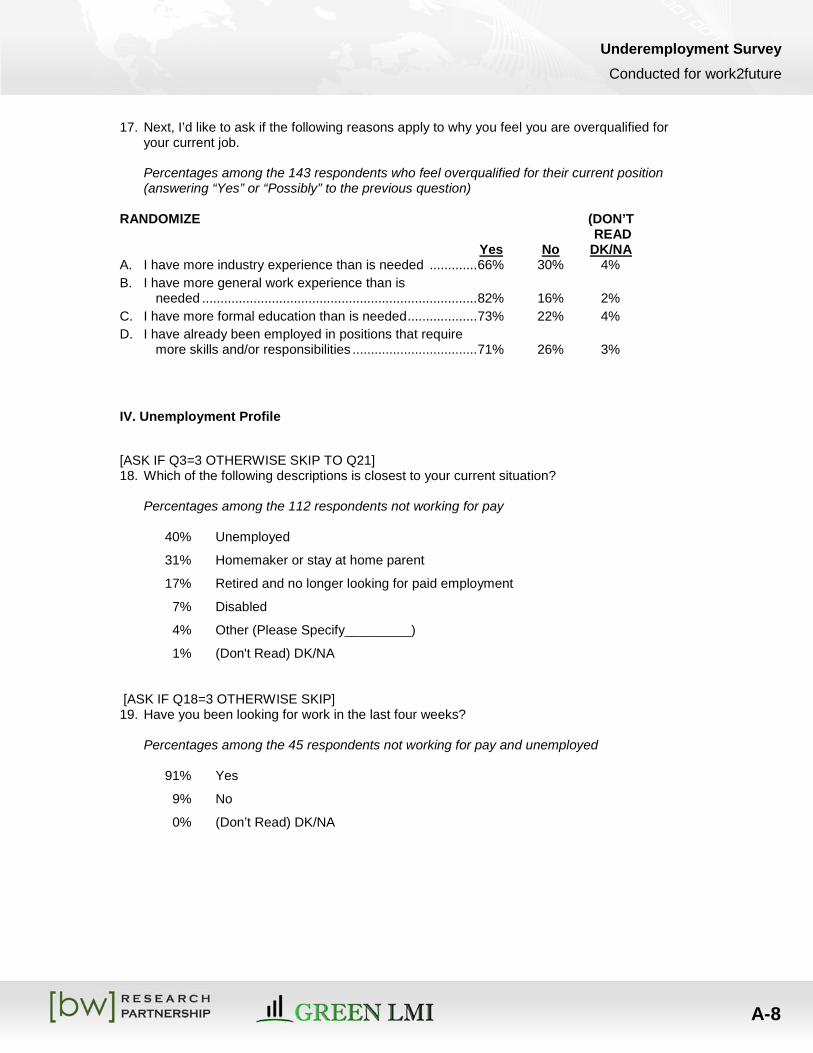
17. Next, I’d like to ask if the following reasons apply to why you feel you are overqualified for your current job. Percentages among the 143 respondents who feel overqualified for their current position (answering “Yes” or “Possibly” to the previous question)
RANDOMIZE (DON’T READ Yes No A. I have more industry experience than is needed ............. 66% 30% 4%
DK/NA
B. I have more general work experience than is needed ........................................................................... 82% 16% 2%
C. I have more formal education than is needed ................... 73% 22% 4% D. I have already been employed in positions that require more skills and/or responsibilities .................................. 71% 26% 3%
IV. Unemployment Profile
[ASK IF Q3=3 OTHERWISE SKIP TO Q21] 18. Which of the following descriptions is closest to your current situation?
Percentages among the 112 respondents not working for pay 40% Unemployed
31% Homemaker or stay at home parent
17% Retired and no longer looking for paid employment
7% Disabled
4% Other (Please Specify_________)
1% (Don't Read) DK/NA
[ASK IF Q18=3 OTHERWISE SKIP] 19. Have you been looking for work in the last four weeks?
Percentages among the 45 respondents not working for pay and unemployed 91% Yes
9% No
0% (Don’t Read) DK/NA
Underemployment Survey Conducted for work2future
A-9
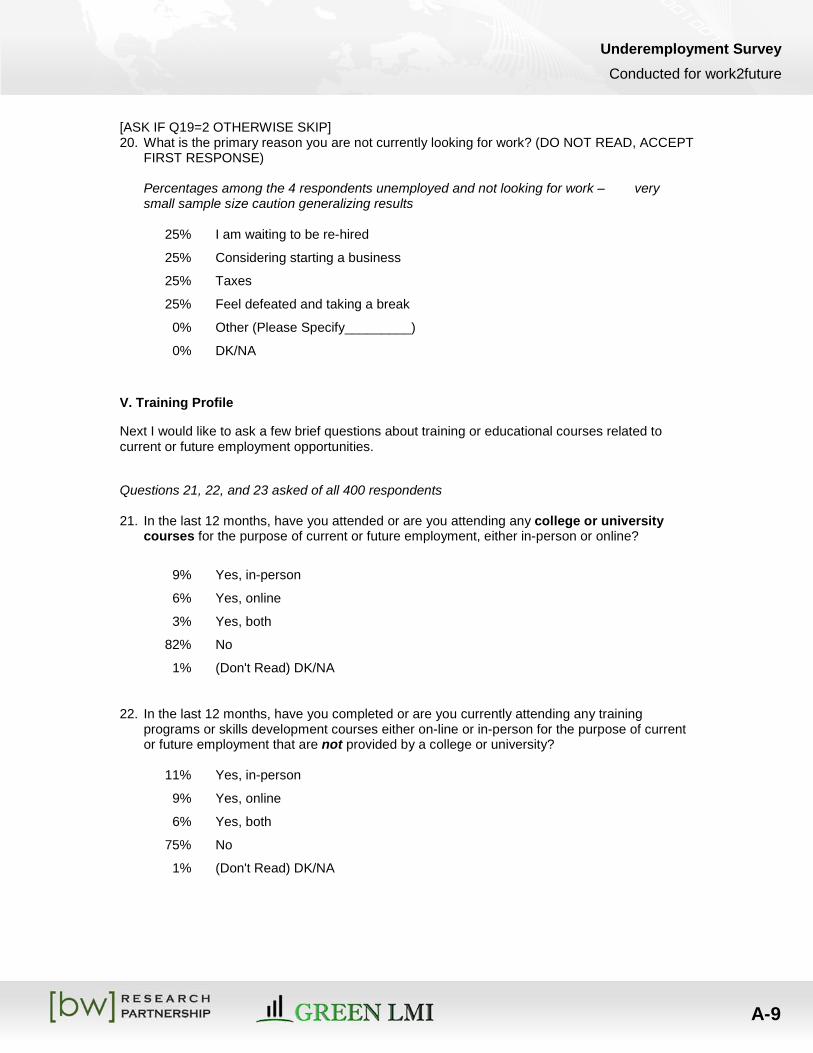
[ASK IF Q19=2 OTHERWISE SKIP] 20. What is the primary reason you are not currently looking for work? (DO NOT READ, ACCEPT
FIRST RESPONSE)
Percentages among the 4 respondents unemployed and not looking for work – very small sample size caution generalizing results
25% I am waiting to be re-hired
25% Considering starting a business
25% Taxes
25% Feel defeated and taking a break
0% Other (Please Specify_________)
0% DK/NA
V. Training Profile
Next I would like to ask a few brief questions about training or educational courses related to current or future employment opportunities.
Questions 21, 22, and 23 asked of all 400 respondents 21. In the last 12 months, have you attended or are you attending any college or university
courses for the purpose of current or future employment, either in-person or online?
9% Yes, in-person
6% Yes, online
3% Yes, both
82% No
1% (Don't Read) DK/NA 22. In the last 12 months, have you completed or are you currently attending any training
programs or skills development courses either on-line or in-person for the purpose of current or future employment that are not provided by a college or university?
11% Yes, in-person
9% Yes, online
6% Yes, both
75% No
1% (Don't Read) DK/NA
Underemployment Survey Conducted for work2future
A-10
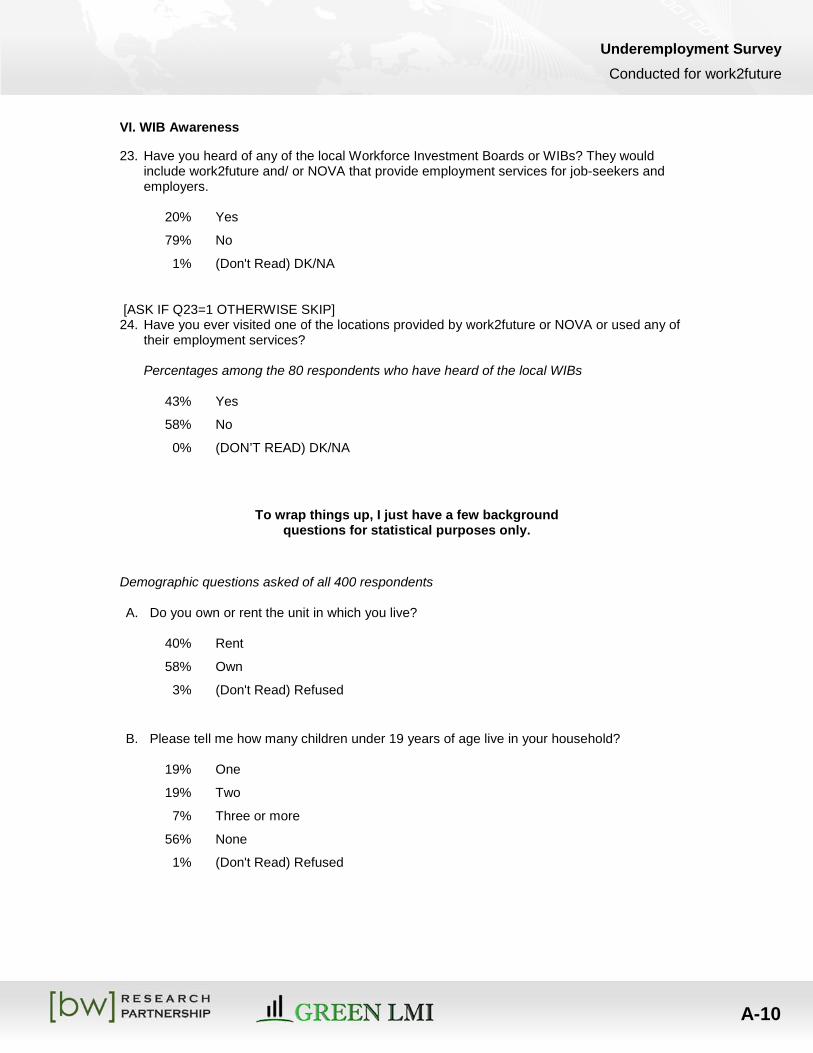
VI. WIB Awareness
23. Have you heard of any of the local Workforce Investment Boards or WIBs? They would include work2future and/ or NOVA that provide employment services for job-seekers and employers.
20% Yes
79% No
1% (Don't Read) DK/NA
[ASK IF Q23=1 OTHERWISE SKIP] 24. Have you ever visited one of the locations provided by work2future or NOVA or used any of
their employment services?
Percentages among the 80 respondents who have heard of the local WIBs
43% Yes
58% No
0% (DON’T READ) DK/NA
To wrap things up, I just have a few background
questions for statistical purposes only.
Demographic questions asked of all 400 respondents
A. Do you own or rent the unit in which you live? 40% Rent
58% Own
3% (Don't Read) Refused
B. Please tell me how many children under 19 years of age live in your household? 19% One
19% Two
7% Three or more
56% None
1% (Don't Read) Refused
Underemployment Survey Conducted for work2future
A-11
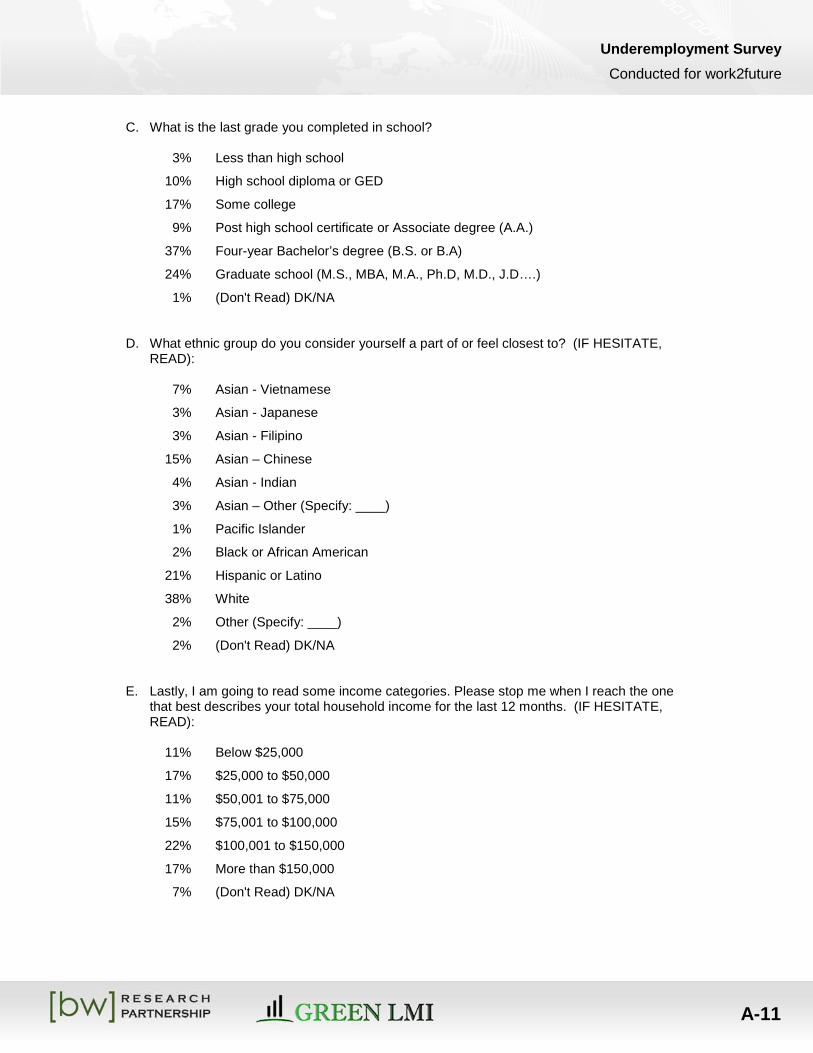
C. What is the last grade you completed in school?
3% Less than high school
10% High school diploma or GED
17% Some college
9% Post high school certificate or Associate degree (A.A.)
37% Four-year Bachelor’s degree (B.S. or B.A)
24% Graduate school (M.S., MBA, M.A., Ph.D, M.D., J.D….)
1% (Don't Read) DK/NA
D. What ethnic group do you consider yourself a part of or feel closest to? (IF HESITATE, READ):
7% Asian - Vietnamese
3% Asian - Japanese
3% Asian - Filipino
15% Asian – Chinese
4% Asian - Indian
3% Asian – Other (Specify: ____)
1% Pacific Islander
2% Black or African American
21% Hispanic or Latino
38% White
2% Other (Specify: ____)
2% (Don't Read) DK/NA E. Lastly, I am going to read some income categories. Please stop me when I reach the one
that best describes your total household income for the last 12 months. (IF HESITATE, READ):
11% Below $25,000
17% $25,000 to $50,000
11% $50,001 to $75,000
15% $75,001 to $100,000
22% $100,001 to $150,000
17% More than $150,000
7% (Don't Read) DK/NA
Underemployment Survey Conducted for work2future
A-12
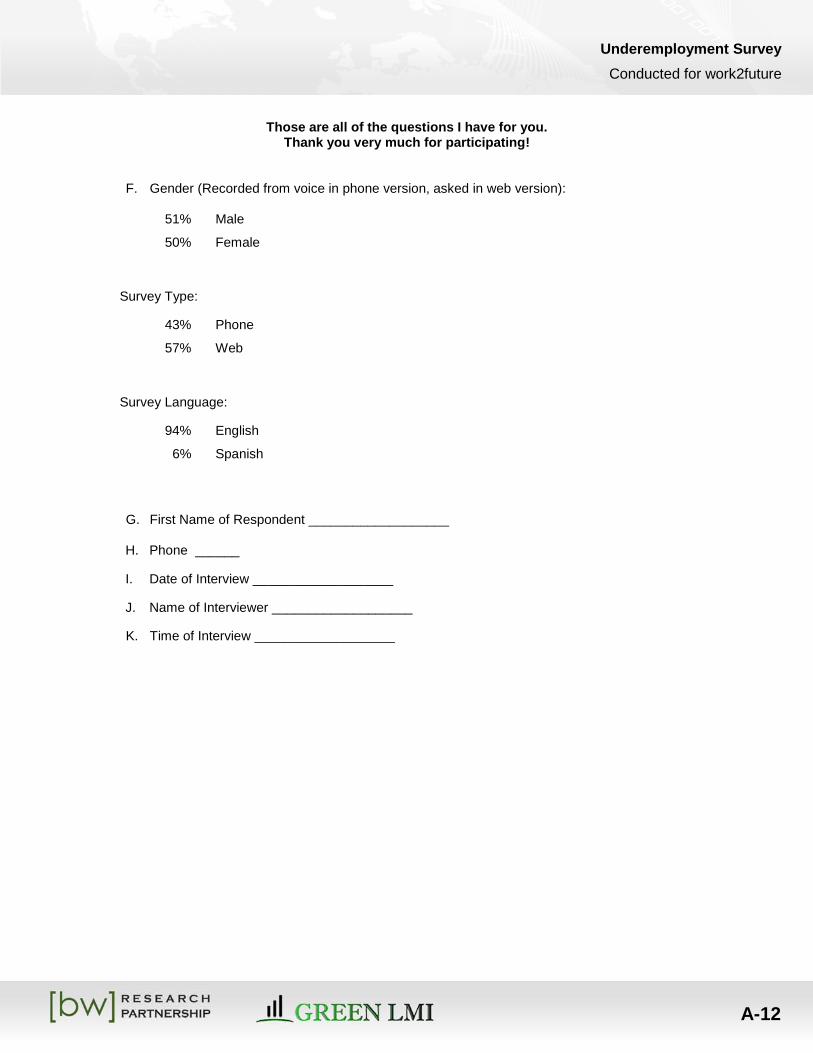
Those are all of the questions I have for you. Thank you very much for participating!
F. Gender (Recorded from voice in phone version, asked in web version):
51% Male
50% Female
Survey Type:
43% Phone
57% Web
Survey Language:
94% English
6% Spanish
G. First Name of Respondent ___________________
H. Phone ______
I. Date of Interview ___________________
J. Name of Interviewer ___________________
K. Time of Interview ___________________