Embed Size (px)
Citation preview
T H E S T A T E O F F O O D I N S E C U R I T Y I N T H E W O R L D 2 0 1 38
Undernourishment around the world in 2013Progress continues…
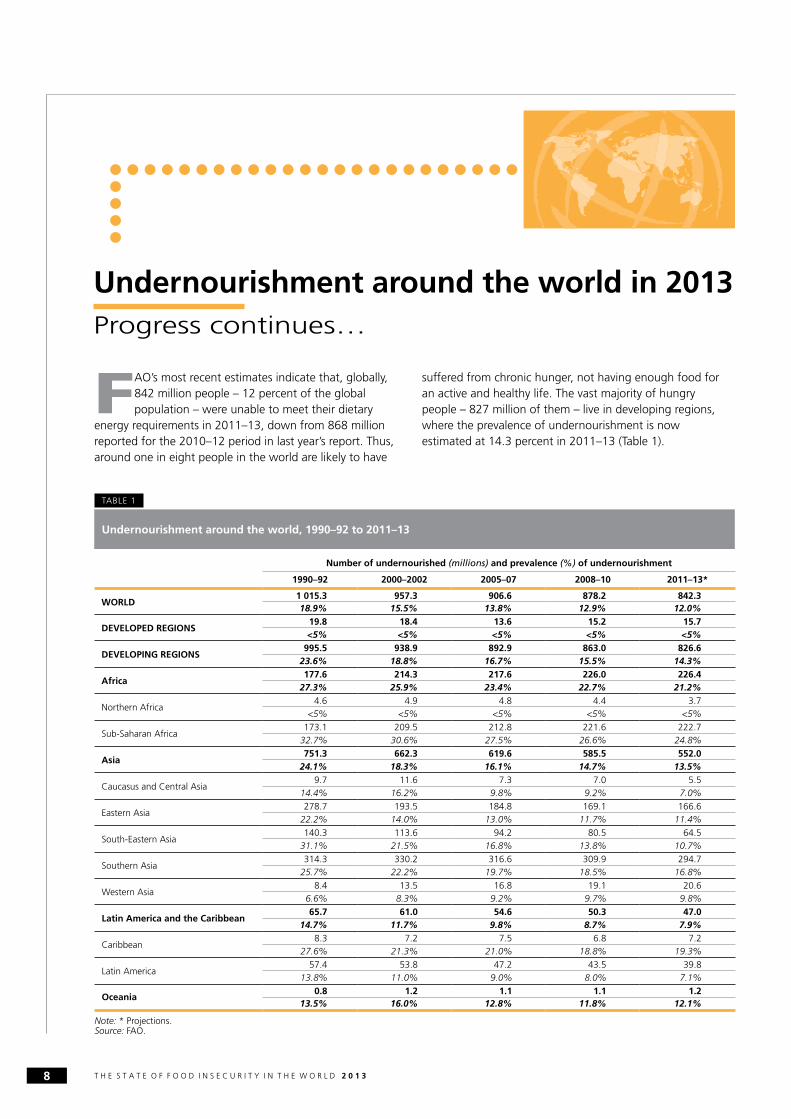
FAO’s most recent estimates indicate that, globally, 842 million people – 12 percent of the global population – were unable to meet their dietary
energy requirements in 2011–13, down from 868 million reported for the 2010–12 period in last year’s report. Thus, around one in eight people in the world are likely to have
suffered from chronic hunger, not having enough food for an active and healthy life. The vast majority of hungry people – 827 million of them – live in developing regions, where the prevalence of undernourishment is now estimated at 14.3 percent in 2011–13 (Table 1).
TABLE 1
Undernourishment around the world, 1990–92 to 2011–13
Number of undernourished (millions) and prevalence (%) of undernourishment
1990–92 2000–2002 2005–07 2008–10 2011–13*
WORLD1 015.3 957.3 906.6 878.2 842.318.9% 15.5% 13.8% 12.9% 12.0%
DEVELOPED REGIONS19.8 18.4 13.6 15.2 15.7<5% <5% <5% <5% <5%
DEVELOPING REGIONS995.5 938.9 892.9 863.0 826.6
23.6% 18.8% 16.7% 15.5% 14.3%
Africa177.6 214.3 217.6 226.0 226.4
27.3% 25.9% 23.4% 22.7% 21.2%
Northern Africa4.6 4.9 4.8 4.4 3.7
<5% <5% <5% <5% <5%
Sub-Saharan Africa173.1 209.5 212.8 221.6 222.7
32.7% 30.6% 27.5% 26.6% 24.8%
Asia751.3 662.3 619.6 585.5 552.0
24.1% 18.3% 16.1% 14.7% 13.5%
Caucasus and Central Asia9.7 11.6 7.3 7.0 5.5
14.4% 16.2% 9.8% 9.2% 7.0%
Eastern Asia278.7 193.5 184.8 169.1 166.6
22.2% 14.0% 13.0% 11.7% 11.4%
South-Eastern Asia140.3 113.6 94.2 80.5 64.5
31.1% 21.5% 16.8% 13.8% 10.7%
Southern Asia314.3 330.2 316.6 309.9 294.7
25.7% 22.2% 19.7% 18.5% 16.8%
Western Asia8.4 13.5 16.8 19.1 20.6
6.6% 8.3% 9.2% 9.7% 9.8%
Latin America and the Caribbean65.7 61.0 54.6 50.3 47.0
14.7% 11.7% 9.8% 8.7% 7.9%
Caribbean8.3 7.2 7.5 6.8 7.2
27.6% 21.3% 21.0% 18.8% 19.3%
Latin America57.4 53.8 47.2 43.5 39.8
13.8% 11.0% 9.0% 8.0% 7.1%
Oceania0.8 1.2 1.1 1.1 1.2
13.5% 16.0% 12.8% 11.8% 12.1%
Note: * Projections.Source: FAO.
T H E S T A T E O F F O O D I N S E C U R I T Y I N T H E W O R L D 2 0 1 3 9
Undernourishment around the world in 2013
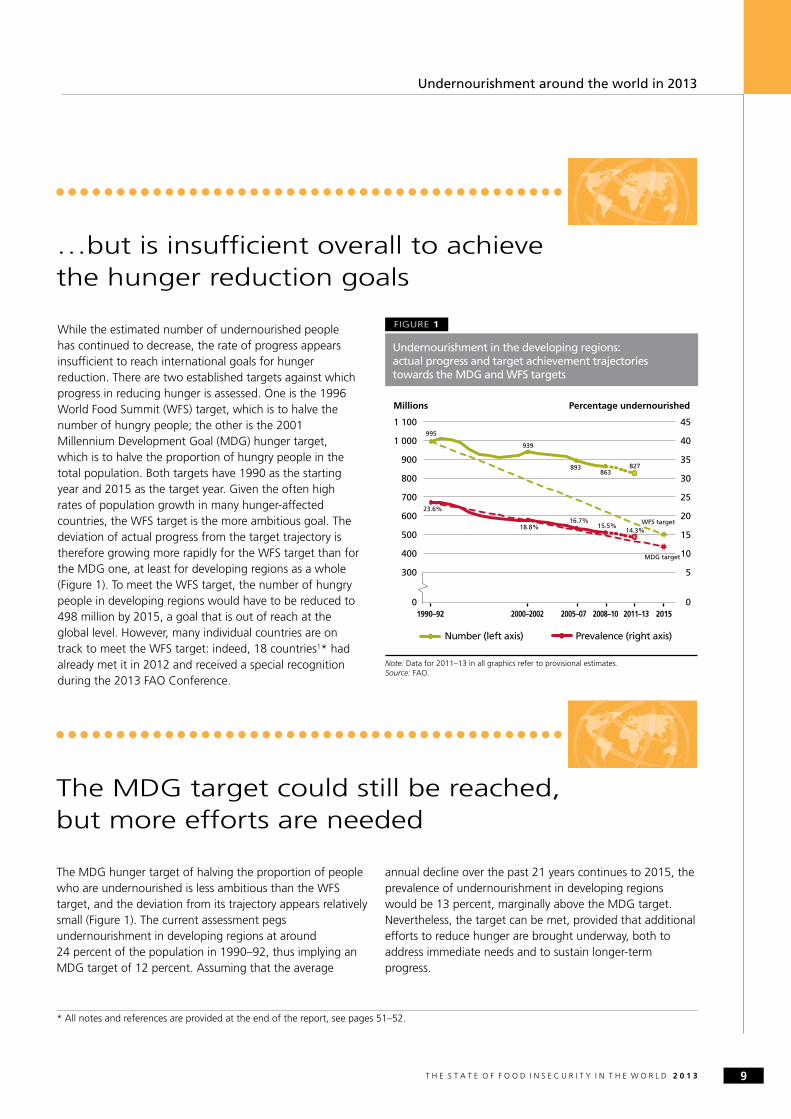
While the estimated number of undernourished people has continued to decrease, the rate of progress appears insufficient to reach international goals for hunger reduction. There are two established targets against which progress in reducing hunger is assessed. One is the 1996 World Food Summit (WFS) target, which is to halve the number of hungry people; the other is the 2001 Millennium Development Goal (MDG) hunger target, which is to halve the proportion of hungry people in the total population. Both targets have 1990 as the starting year and 2015 as the target year. Given the often high rates of population growth in many hunger-affected countries, the WFS target is the more ambitious goal. The deviation of actual progress from the target trajectory is therefore growing more rapidly for the WFS target than for the MDG one, at least for developing regions as a whole (Figure 1). To meet the WFS target, the number of hungry people in developing regions would have to be reduced to 498 million by 2015, a goal that is out of reach at the global level. However, many individual countries are on track to meet the WFS target: indeed, 18 countries1* had already met it in 2012 and received a special recognition during the 2013 FAO Conference.
…but is insufficient overall to achieve the hunger reduction goals
The MDG hunger target of halving the proportion of people who are undernourished is less ambitious than the WFS target, and the deviation from its trajectory appears relatively small (Figure 1). The current assessment pegs undernourishment in developing regions at around 24 percent of the population in 1990–92, thus implying an MDG target of 12 percent. Assuming that the average
The MDG target could still be reached, but more efforts are needed
annual decline over the past 21 years continues to 2015, the prevalence of undernourishment in developing regions would be 13 percent, marginally above the MDG target. Nevertheless, the target can be met, provided that additional efforts to reduce hunger are brought underway, both to address immediate needs and to sustain longer-term progress.
FIGURE 1
Undernourishment in the developing regions: actual progress and target achievement trajectories towards the MDG and WFS targets
Millions
1 100
1 000
900
800
700
600
500
400
300
0
Note: Data for 2011–13 in all graphics refer to provisional estimates.Source: FAO.
Percentage undernourished
45
40
35
30
25
20
15
10
5
01990–92 2000–2002 2005–07 2011–13 20152008–10
939
893 863
827
995
MDG target
23.6%
18.8% 16.7%
15.5% 14.3%
WFS target
Number (left axis) Prevalence (right axis)
* All notes and references are provided at the end of the report, see pages 51–52.
T H E S T A T E O F F O O D I N S E C U R I T Y I N T H E W O R L D 2 0 1310
Undernourishment around the world in 2013
As the target year is fast approaching, there is a need for programmes that deliver quick results. Measures to improve access to food through safety nets and similar interventions can do this. They also promise to have longer-lasting positive effects on food availability by raising local demand, thus stimulating food production. Such programmes include, inter alia, cash transfers and cash-and-voucher schemes. Initial results of these programmes suggest that they can lead not only to higher consumption, but also to increased investments in agricultural assets, including farm implements and livestock, and more food from own production. There is also evidence that such programmes can create significant income multiplier effects through trade and production linkages. Over the longer term, they can generate positive feedback whereby demand created through safety nets stimulates smallholder food production and thus helps both poor consumers and producers. These programmes lie at the heart of the twin-track approach to reducing hunger,
stimulating food demand, which, in turn, provides incentives to increase production and more income-generating opportunities for smallholder production.
To sustain their longer-term viability, demand-enhancing efforts need to be supplemented by effective supply-side measures. This is particularly important when hunger reduction programmes aim to reach large rural populations in the absence of adequate physical and institutional infrastructure. The 2012 edition of The State of Food and Agriculture made a powerful case for investing in agriculture to reduce poverty and hunger. It showed that investing in agriculture contributes strongly to increasing food security, which in turn helps promote economic diversification and growth. Increased agricultural productivity generates higher incomes and creates income-generating opportunities for otherwise destitute population groups, offering a recognized way to escape the poverty trap in many rural areas.
Large differences in hunger persist across regions
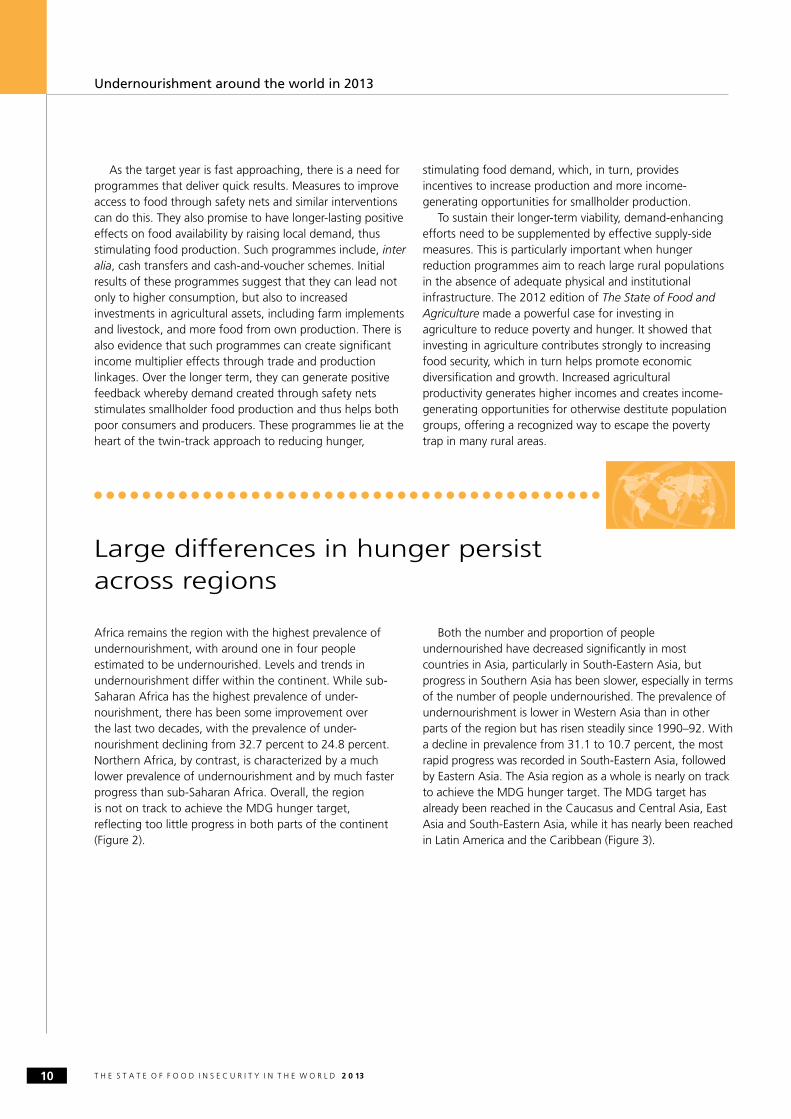
Africa remains the region with the highest prevalence of undernourishment, with around one in four people estimated to be undernourished. Levels and trends in undernourishment differ within the continent. While sub-Saharan Africa has the highest prevalence of under-nourishment, there has been some improvement over the last two decades, with the prevalence of under-nourishment declining from 32.7 percent to 24.8 percent. Northern Africa, by contrast, is characterized by a much lower prevalence of undernourishment and by much faster progress than sub-Saharan Africa. Overall, the region is not on track to achieve the MDG hunger target, reflecting too little progress in both parts of the continent (Figure 2).
Both the number and proportion of people undernourished have decreased significantly in most countries in Asia, particularly in South-Eastern Asia, but progress in Southern Asia has been slower, especially in terms of the number of people undernourished. The prevalence of undernourishment is lower in Western Asia than in other parts of the region but has risen steadily since 1990–92. With a decline in prevalence from 31.1 to 10.7 percent, the most rapid progress was recorded in South-Eastern Asia, followed by Eastern Asia. The Asia region as a whole is nearly on track to achieve the MDG hunger target. The MDG target has already been reached in the Caucasus and Central Asia, East Asia and South-Eastern Asia, while it has nearly been reached in Latin America and the Caribbean (Figure 3).
T H E S T A T E O F F O O D I N S E C U R I T Y I N T H E W O R L D 2 0 1 3 11
Undernourishment around the world in 2013
FIGURE 2
Regions differ markedly in progress towards achieving the MDG and WFS hunger targets
Number (left axis) Prevalence (right axis)
61
55 50
47
66
MDG target
14.7%
11.7%
9.8%
8.7% 7.9%
0
4
8
12
16
20
15
30
45
60
75
Latin America and the Caribbean
WFS target
Millions Percentage undernourished
214 218 226
226
178
MDG target
27.3% 25.9% 23.4%
22.7% 21.2%
0
10
20
30
40
50
0
50
100
150
200
250
1990–92 2000–2002 2005–07 2008–10 2011–13 2015
Africa
WFS target
Millions Percentage undernourished
1.2 1.1 1.1 1.2 0.8 MDG target
13.5%
16.0%
12.8% 11.8% 12.1%
0
8
12
16
20
0.7
1.4
2.1
2.8
3.5
Oceania
WFS target
Millions Percentage undernourished
4
1990–92 2000–2002 2005–07 2008–10 2011–13 2015 1990–92 2000–2002 2005–07 2008–10 2011–13 2015
Source: FAO.
662 620
586
552
751
MDG target
24.1%
18.3%
16.1% 14.7%
13.5%
10
15
20
25
30
35
40
0
150
300
450
600
750
900
1990–92 2000–2002 2005–07 2008–10 2011–13 2015
Asia
WFS target
Millions Percentage undernourished
2011–13 1990–92
<5
7.0
7.1
9.8
10.7
11.4
12.1
16.8
19.3
24.8
<5
14.4
13.8
6.6
31.1
22.2
13.5
25.7
27.6
32.7
0 5 10 15 20 25 30 35
Northern Africa
Caucasus and Central Asia
Latin America
Western Asia
South-Eastern Asia
Eastern Asia
Oceania
Southern Asia
Caribbean
Sub-Saharan Africa
Percentage
FIGURE 3
Undernourishment trends: progress made in almost all regions, but at very different rates
Source: FAO.
T H E S T A T E O F F O O D I N S E C U R I T Y I N T H E W O R L D 2 0 13
Undernourishment around the world in 2013
12
Progress in reducing hunger reflects country and regional specificities in terms of economic conditions, infrastructure, the organization of food production, the presence of social provisions and political and institutional stability. In Western Asia, the worsening undernourishment trend appears to be mostly related to food price inflation and political instability. In Northern Africa, where progress has been slow, the same factors are relevant. Lack of natural resources, especially good-quality cropland and renewable water resources, also limit the regions’ food production potential. Meeting the food needs of these regions’ rapidly growing populations has been possible only through importing large quantities of cereals. Some of these cereal imports are financed by petroleum exports; simply put, these regions export hydrocarbons and import carbohydrates to ensure their food security. Both food and energy are made more affordable domestically through large, untargeted subsidies.
The regions’ dependency on food imports and oil exports make them susceptible to price swings on world commodity markets. The most precarious food security situations arise in
countries where proceeds from hydrocarbon exports have slowed or stalled, food subsidies are circumscribed by growing fiscal deficits or civil unrest has disrupted domestic food chains.
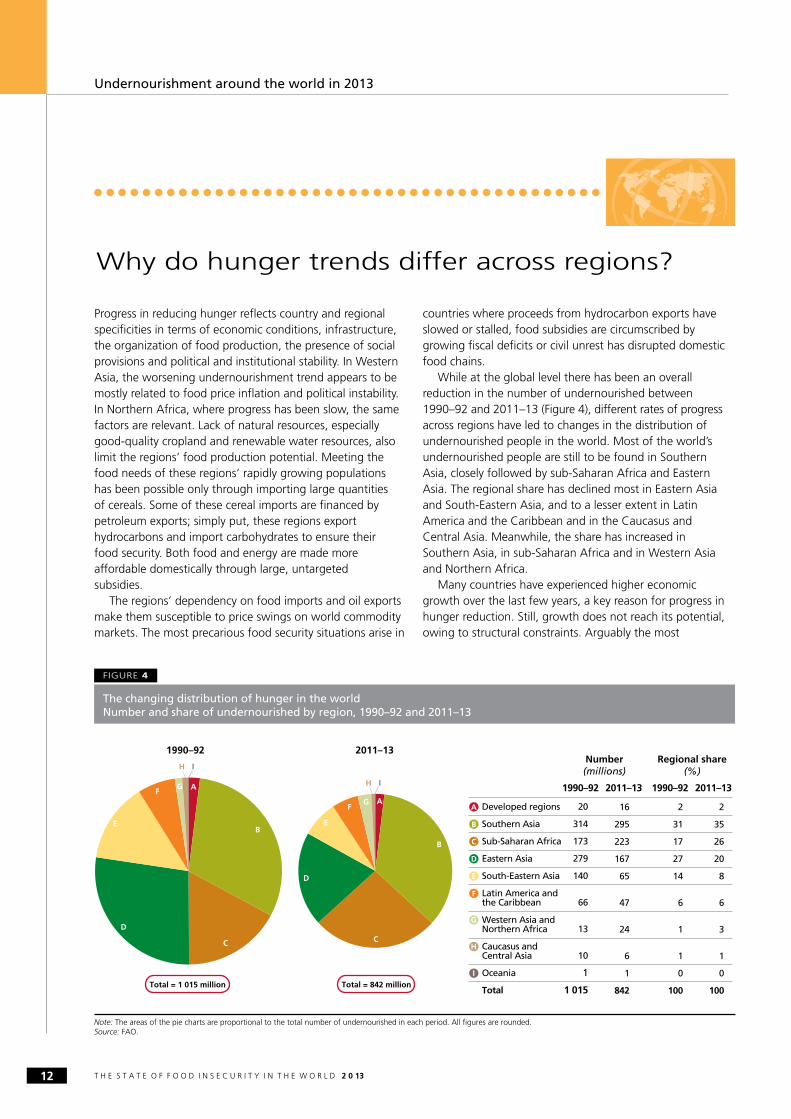
While at the global level there has been an overall reduction in the number of undernourished between 1990–92 and 2011–13 (Figure 4), different rates of progress across regions have led to changes in the distribution of undernourished people in the world. Most of the world’s undernourished people are still to be found in Southern Asia, closely followed by sub-Saharan Africa and Eastern Asia. The regional share has declined most in Eastern Asia and South-Eastern Asia, and to a lesser extent in Latin America and the Caribbean and in the Caucasus and Central Asia. Meanwhile, the share has increased in Southern Asia, in sub-Saharan Africa and in Western Asia and Northern Africa.
Many countries have experienced higher economic growth over the last few years, a key reason for progress in hunger reduction. Still, growth does not reach its potential, owing to structural constraints. Arguably the most
Why do hunger trends differ across regions?
Note: The areas of the pie charts are proportional to the total number of undernourished in each period. All figures are rounded.Source: FAO.
FIGURE 4
The changing distribution of hunger in the worldNumber and share of undernourished by region, 1990–92 and 2011–13
Total = 1 015 million
Developed regions 20
Southern Asia 314
Sub-Saharan Africa 173
Eastern Asia 279
South-Eastern Asia 140
Latin America and the Caribbean 66
Western Asia and Northern Africa 13
Caucasus and Central Asia 10
Oceania 1
Total 1 015Total = 842 million
1990–92 2011–13
16
295
223
167
65
47
24
6
1
842
A
B
C
D
E
F
Number(millions)
A
B
C
D
E
F G
1990–92
A
B
C
D
E
F G
2011–13
H I
H I 1990–92 2011–13
Regional share(%)
G
H
I
2
31
17
27
14
6
1
1
0
100
2
35
26
20
8
6
3
1
0
100
T H E S T A T E O F F O O D I N S E C U R I T Y I N T H E W O R L D 2 0 1 3 13
Undernourishment around the world in 2013
important is the often woefully inadequate infrastructure that plagues vast areas of rural Africa. Much improved communication and broader access to information technology may, to some extent, have helped overcome traditional infrastructure constraints, and promoted market integration. Also encouraging is the pick-up in agricultural productivity growth, buttressed by increased public investment, incentives generated by higher food prices and renewed interest of private investors in agriculture. In some countries, remittance inflows from migrants have helped spur domestic growth. Remittances have increased small-scale investment, which was particularly beneficial to growth where food production and distribution still rely on small-scale and local networks. This holds in particular for sub-Saharan African countries, where a combination of higher crop yields and increased livestock production have led to a reduction of undernourishment.
Many countries in Eastern Asia have benefited from continuous and often rapid economic growth. In general,
they were less affected by the economic slow-downs that engulfed many other developing countries in the past decade and member countries of the Organisation for Economic Co-operation and Development (OECD) in the late 2000s. Countries in South-Eastern Asia have shown considerable inflows of remittances from the West and some oil-rich countries in Western Asia. These transfers have often driven small-scale investment in sectors such as agriculture and construction. Robust income growth, in conjunction with relatively high income responsiveness on the demand side and policies to increase agricultural productivity, has helped reduce the undernourishment burden in these regions.
Similar factors seem to explain the good progress recorded by most countries in Latin America and the Caribbean. Economic growth, political and institutional stability, incentives to raise agricultural productivity and overall economic development have been the main sources of progress.
What was the impact of price volatility observed over recent years?
The evolution of the prevalence of undernourishment estimates capture trends in chronic hunger. Because of the characteristics of the data on which it is based, the prevalence of undernourishment indicator does not reflect acute, short-term changes in malnutrition resulting from short-term changes in the economic environment. The large swings in primary food prices observed since 2008, often measured by the FAO Food Price Index (FPI), are a prominent example of such short-term shocks. Price and income swings affect the food security of poor and hungry people more than the steady trend in the prevalence of under-nourishment suggests. But recent data on global and regional food consumer price indices (food CPIs) suggest that food price hikes at the primary commodity level generally have little effect on consumer prices and that the swings in consumer prices were much more muted than those faced by agricultural producers or recorded in international trade.
Overall, the new data on food prices at the consumer level give rise to two basic findings.
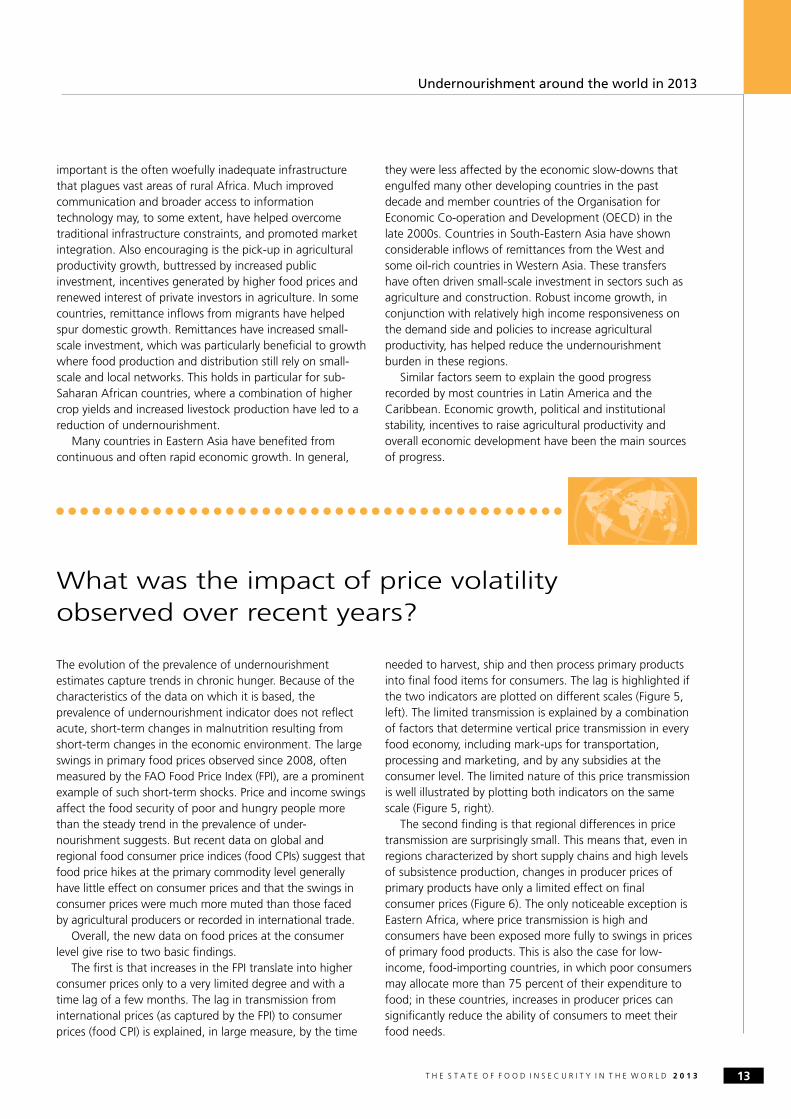
The first is that increases in the FPI translate into higher consumer prices only to a very limited degree and with a time lag of a few months. The lag in transmission from international prices (as captured by the FPI) to consumer prices (food CPI) is explained, in large measure, by the time
needed to harvest, ship and then process primary products into final food items for consumers. The lag is highlighted if the two indicators are plotted on different scales (Figure 5, left). The limited transmission is explained by a combination of factors that determine vertical price transmission in every food economy, including mark-ups for transportation, processing and marketing, and by any subsidies at the consumer level. The limited nature of this price transmission is well illustrated by plotting both indicators on the same scale (Figure 5, right).
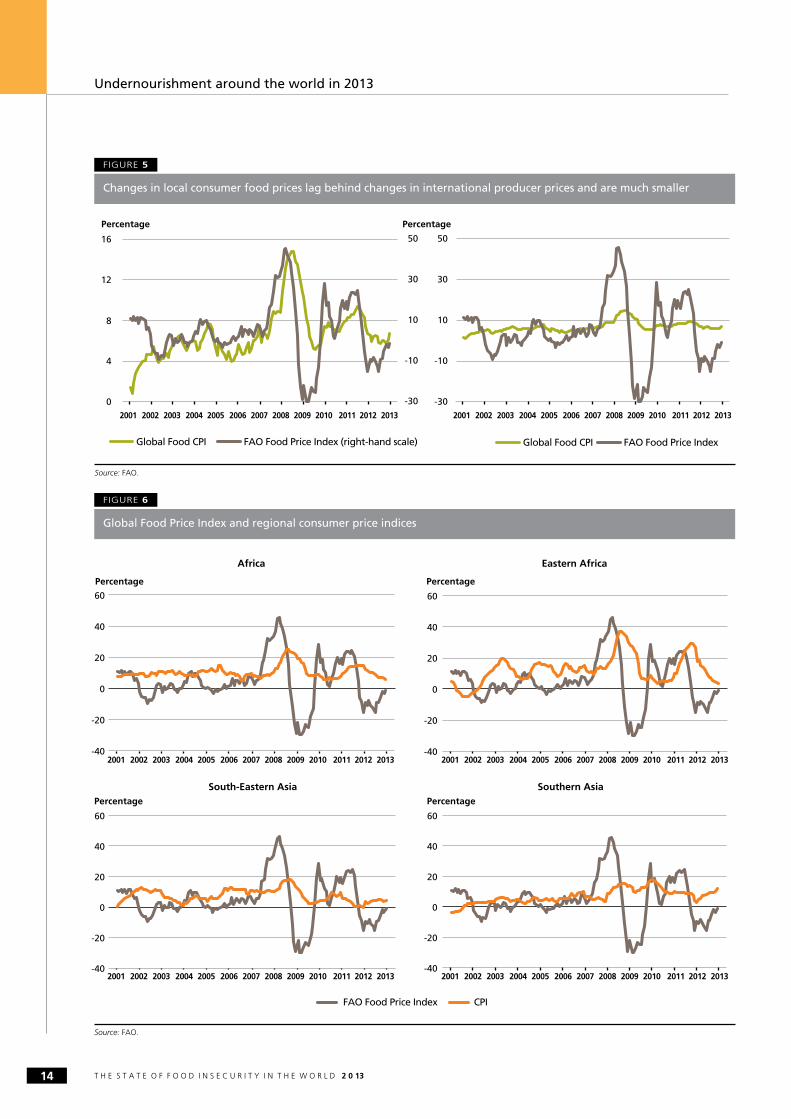
The second finding is that regional differences in price transmission are surprisingly small. This means that, even in regions characterized by short supply chains and high levels of subsistence production, changes in producer prices of primary products have only a limited effect on final consumer prices (Figure 6). The only noticeable exception is Eastern Africa, where price transmission is high and consumers have been exposed more fully to swings in prices of primary food products. This is also the case for low-income, food-importing countries, in which poor consumers may allocate more than 75 percent of their expenditure to food; in these countries, increases in producer prices can significantly reduce the ability of consumers to meet their food needs.
T H E S T A T E O F F O O D I N S E C U R I T Y I N T H E W O R L D 2 0 13
Undernourishment around the world in 2013
14
FIGURE 5
Changes in local consumer food prices lag behind changes in international producer prices and are much smaller
-30
-10
10
30
50
0
4
8
12
16
Global Food CPI FAO Food Price Index (right-hand scale)
-30
-10
10
30
50
Global Food CPI FAO Food Price Index
Percentage
Source: FAO.
Percentage
2001 2002 2003 2004 2005 2006 2007 2008 2009 2010 2011 2012 20132001 2002 2003 2004 2005 2006 2007 2008 2009 2010 2011 2012 2013
FIGURE 6
Global Food Price Index and regional consumer price indices
-40
-20
0
20
40
60
2001 2002 2003 2004 2005 2006 2007 2008 2009 2010 2011 2012 2013
Africa
Percentage
-40
-20
0
20
40
60
Eastern Africa
Percentage
-40
-20
0
20
40
60
South-Eastern AsiaPercentage
-40
-20
0
20
40
60
Southern AsiaPercentage
2001 2002 2003 2004 2005 2006 2007 2008 2009 2010 2011 2012 2013
2001 2002 2003 2004 2005 2006 2007 2008 2009 2010 2011 2012 2013 2001 2002 2003 2004 2005 2006 2007 2008 2009 2010 2011 2012 2013
Source: FAO.
FAO Food Price Index CPI
T H E S T A T E O F F O O D I N S E C U R I T Y I N T H E W O R L D 2 0 1 3 15
Undernourishment around the world in 2013
In addition, the impact of price swings on under-nourishment can be reduced by consumers switching between food items. When prices rise, consumers often shift from more expensive and more nutritious foodstuffs to less-expensive but often also less-nutritious foods. While this allows consumers to maintain their dietary energy intake, it heightens the risk of other forms of malnutrition, such as micronutrient deficiencies. Consuming less nutritious food can have adverse long-term effects on food utilization, resulting in undernutrition (see Annex 3: Glossary of selected terms used in this report for definitions of these terms).
People’s health and productivity can also be impaired. These changes, however, are unlikely to be captured by the prevalence of undernourishment indicator: almost unchanged prevalence of undernourishment can mask changes in other forms of malnutrition. This underlines the complexity of food security, and the need for a comprehensive approach to its measurement. The next section will discuss such an approach, and present a suite of indicators that captures more fully the various causes or determinants of food security, as well as its manifestations or outcomes.
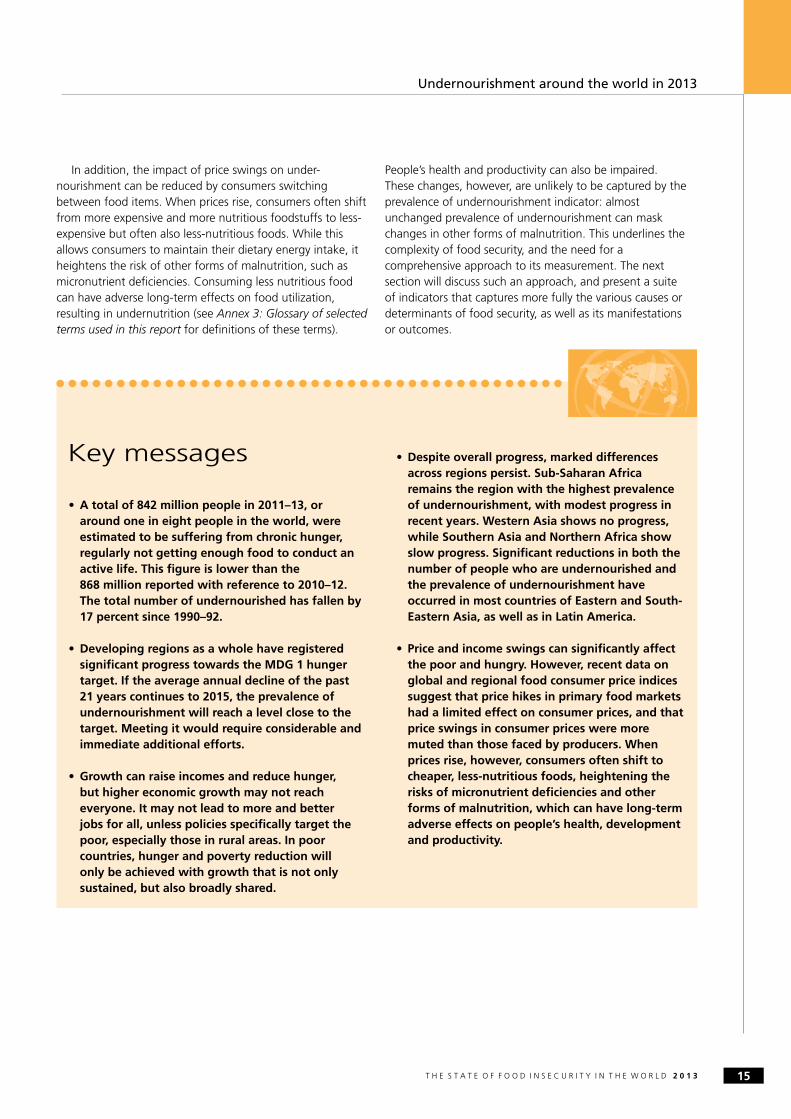
•A total of 842 million people in 2011–13, or around one in eight people in the world, were estimated to be suffering from chronic hunger, regularly not getting enough food to conduct an active life. This figure is lower than the 868 million reported with reference to 2010–12. The total number of undernourished has fallen by 17 percent since 1990–92.
•Developing regions as a whole have registered significant progress towards the MDG 1 hunger target. If the average annual decline of the past 21 years continues to 2015, the prevalence of undernourishment will reach a level close to the target. Meeting it would require considerable and immediate additional efforts.
•Growth can raise incomes and reduce hunger, but higher economic growth may not reach everyone. It may not lead to more and better jobs for all, unless policies specifically target the poor, especially those in rural areas. In poor countries, hunger and poverty reduction will only be achieved with growth that is not only sustained, but also broadly shared.
•Despite overall progress, marked differences across regions persist. Sub-Saharan Africa remains the region with the highest prevalence of undernourishment, with modest progress in recent years. Western Asia shows no progress, while Southern Asia and Northern Africa show slow progress. Significant reductions in both the number of people who are undernourished and the prevalence of undernourishment have occurred in most countries of Eastern and South- Eastern Asia, as well as in Latin America.
• Price and income swings can significantly affect the poor and hungry. However, recent data on global and regional food consumer price indices suggest that price hikes in primary food markets had a limited effect on consumer prices, and that price swings in consumer prices were more muted than those faced by producers. When prices rise, however, consumers often shift to cheaper, less-nutritious foods, heightening the risks of micronutrient deficiencies and other forms of malnutrition, which can have long-term adverse effects on people’s health, development and productivity.
Key messages
T H E S T A T E O F F O O D I N S E C U R I T Y I N T H E W O R L D 2 0 1 316
Measuring different dimensions of food security
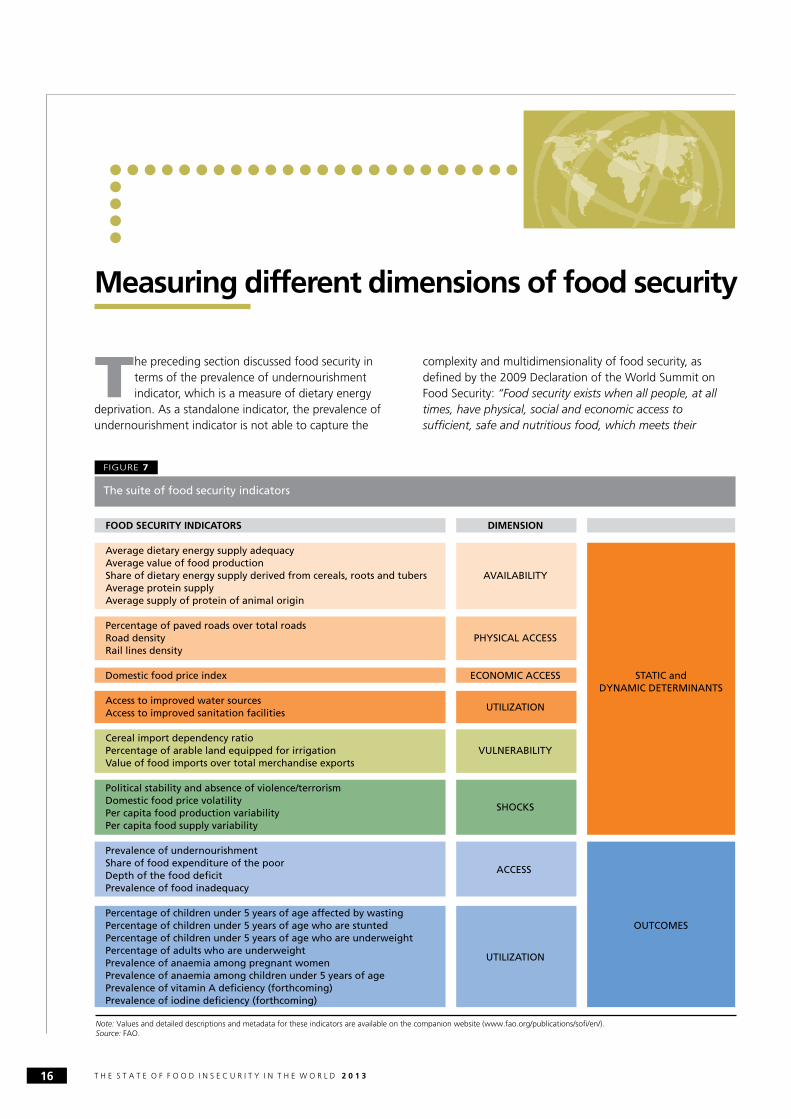
The preceding section discussed food security in terms of the prevalence of undernourishment indicator, which is a measure of dietary energy
deprivation. As a standalone indicator, the prevalence of undernourishment indicator is not able to capture the
complexity and multidimensionality of food security, as defined by the 2009 Declaration of the World Summit on Food Security: “Food security exists when all people, at all times, have physical, social and economic access to sufficient, safe and nutritious food, which meets their
FIGURE 7
The suite of food security indicators
Note: Values and detailed descriptions and metadata for these indicators are available on the companion website (www.fao.org/publications/sofi/en/).Source: FAO.
FOOD SECURITY INDICATORS DIMENSION
Average dietary energy supply adequacy Average value of food production Share of dietary energy supply derived from cereals, roots and tubers AVAILABILITY Average protein supply Average supply of protein of animal origin Percentage of paved roads over total roads Road density PHYSICAL ACCESS Rail lines density Domestic food price index ECONOMIC ACCESS STATIC and DYNAMIC DETERMINANTSAccess to improved water sources
UTILIZATION
Access to improved sanitation facilities
Cereal import dependency ratio Percentage of arable land equipped for irrigation VULNERABILITY Value of food imports over total merchandise exports Political stability and absence of violence/terrorism Domestic food price volatility
SHOCKS
Per capita food production variability Per capita food supply variability Prevalence of undernourishment Share of food expenditure of the poor
ACCESS
Depth of the food deficit Prevalence of food inadequacy Percentage of children under 5 years of age affected by wasting Percentage of children under 5 years of age who are stunted OUTCOMES Percentage of children under 5 years of age who are underweight Percentage of adults who are underweight
UTILIZATIONPrevalence of anaemia among pregnant women Prevalence of anaemia among children under 5 years of agePrevalence of vitamin A deficiency (forthcoming)Prevalence of iodine deficiency (forthcoming)
T H E S T A T E O F F O O D I N S E C U R I T Y I N T H E W O R L D 2 0 1 3 17
Measuring different dimensions of food security
dietary needs and food preferences for an active and healthy life.”2
Based on this definition, four food security dimensions can be identified: food availability, economic and physical access to food, food utilization and stability (vulnerability and shocks) over time. Each food security dimension is described by specific indicators. Figure 7 provides an
overview of the suite of indicators and their organization into the four dimensions of food security.
Measuring the complexity of food security is part of a broader debate that currently takes place in the preparation process of the post-2015 development agenda. These broader measurement challenges, as well as the processes under way and the new proposals for food security monitoring, are summarized in Box 1.
Beyond the MDGsA new global development agenda for the period beyond 2015 is currently being shaped. One major international forum driving this process is the 30-member Open Working Group on Sustainable Development Goals, established by the General Assembly of the United Nations (UN) on 22 January 2013. The Group will deliver a proposal to be considered by the General Assembly in September 2014. Meanwhile, the High-Level Panel of Eminent Persons on the Post-2015 Development Agenda, appointed in July 2012 by the UN Secretary-General, delivered its report on the post-2015 development agenda on 30 May 2013.1 The UN system has been contributing to the definition of the post-2015 agenda through the UN System Task Team on the Post-2015 UN Development Agenda.
One lesson that has emerged from the current discussions of the development agenda is the need to improve monitoring. Good monitoring requires a combination of approaches, and the ability to produce regular updates of indicators. The new monitoring system should combine monitoring of human development – “people-focused” metrics – and of the resource base, its use and related stresses – “planet-focused” indicators. A link between these two sets of metrics should be embedded in the design of the new monitoring system at the outset. Data can be collected through a combination of periodic in-depth surveys and lighter, flexible and more frequent experience-based surveys (in which respondents self-report on their experiences).
The three Rome-based agencies (FAO, IFAD and WFP) are well positioned to contribute to the post-2015 development agenda. Their work programmes are largely inspired by the Zero Hunger Challenge proposed by the UN Secretary-General. As emphasized in the recent report of the High-Level Panel (p. 30), this has five targets:
• end hunger and protect the right of everyone to access sufficient, safe, affordable, and nutritious food;
• reduce stunting by x%, wasting by y%, and anaemia by z% for all children under five;
• increase agricultural productivity by x%, with a focus on sustainably increasing smallholder yields and access to irrigation;
• adopt sustainable agricultural and ocean and freshwater fishery practices and rebuild designated fish stocks to sustainable levels; and
• reduce postharvest loss and food waste by x%.The Panel emphasized sustainability as a necessary
basis for efforts aimed at building lasting prosperity for youth. The Panel also advocates a “data revolution” for sustainable development, noting the potential of open and accessible data to contribute to sustainable development and the need to use non-traditional data sources (e.g. crowd sourcing). The report also stresses the need to disaggregate data by gender, location, income, ethnicity, disability and other categories.
Increased demands on the global statistical system The need for improved monitoring poses enormous challenges to the global statistical system. Data sources and survey instruments currently employed in global and national monitoring cannot provide real-time data and finely disaggregated data. The capacity of many developing countries to monitor several MDG indicators is still weak and often dependent on the support or initiatives of international organizations. The post-2015 development agenda will put a lot of additional demands on the statistical systems of developing countries.
FAO’s Voices of the Hungry projectThe report of the High-level Panel recommends a food- and nutrition-specific sustainable development goal, with five targets. The first target calls for ending
A monitoring framework for the post-2015 development agenda
BOX 1
(Cont.)
T H E S T A T E O F F O O D I N S E C U R I T Y I N T H E W O R L D 2 0 1 318
Measuring different dimensions of food security
■ Food availability: much improved, but progress is uneven across regions and over time
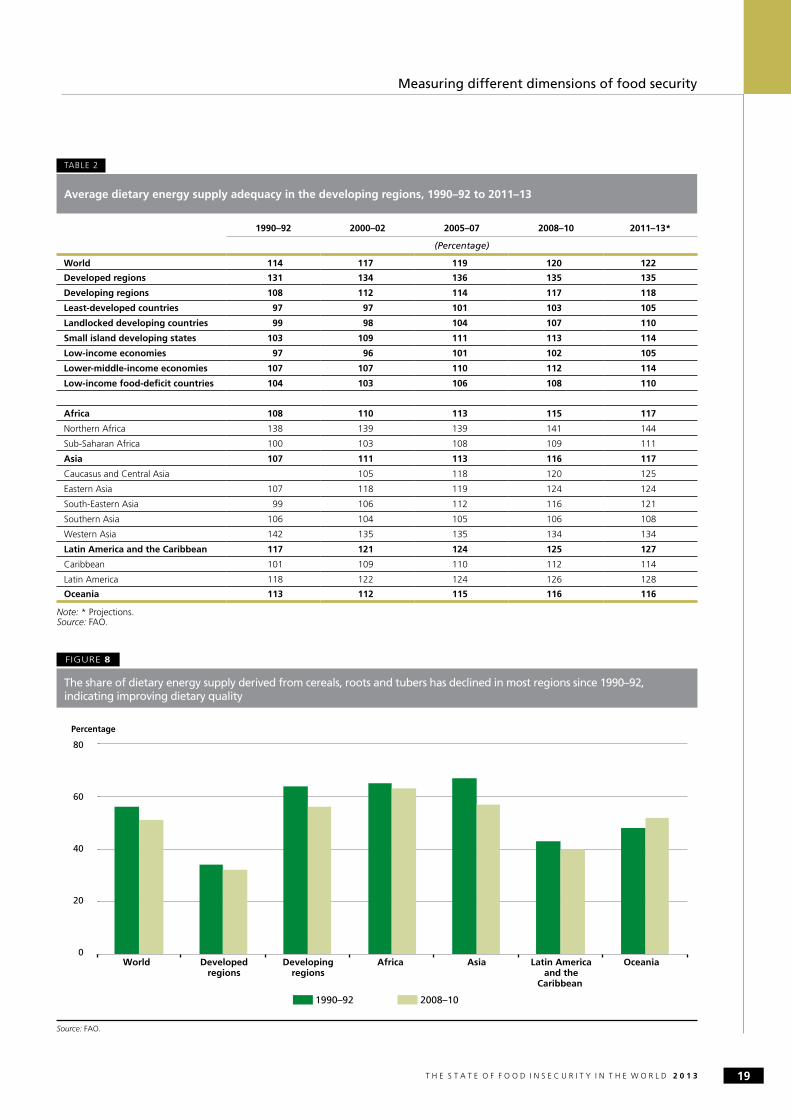
Food availability plays a prominent role in food security. Supplying enough food to a given population is a necessary, albeit not a sufficient, condition to ensure that people have adequate access to food. Over the last two decades, food supplies have grown faster than the population in developing countries, resulting in rising food availability per person. Dietary energy supplies have also risen faster than average dietary energy requirements, resulting in higher levels of energy adequacy in most developing regions, bar Western Asia (Table 2). Average dietary energy supply adequacy – dietary energy supply as a percentage of the average dietary energy requirement – has risen by almost 10 percent over the last two decades in developing regions as a whole. This improvement is consistent with the reduction in undernourishment from about 24 percent to 14 percent of total population between 1990–92 and 2011–13.
The quality of diets has also improved. This is reflected, for instance, in the decline in the share of dietary energy derived from cereals and roots and tubers in most regions since 1990–92 (Figure 8). Overall, the diets of developing regions have seen a number of improvements over the last two decades. For example, per capita availability of fruits
and vegetables, livestock products and vegetable oils increased by 90, 70 and 32 percent, respectively, since 1990–92. This has translated into generally improved diets, including a 20 percent increase in protein availability per person. Only Africa and Southern Asia did not benefit fully from these improvements; diets in these regions remain imbalanced and heavily dependent on cereals and roots and tubers.
Major contributions to food availability come not only from agriculture, but also from fisheries, aquaculture and forest products. It is estimated that between 15 and 20 percent of all animal protein consumed is derived from aquatic animals, which are highly nutritious and serve as a valuable supplement to diets lacking essential vitamins and minerals. Forests provide a wide range of highly nutritious foods, in the form of leaves, seeds, nuts, honey, fruits, mushrooms, insects and wild animals. In Burkina Faso, for example, tree foods constitute an important share of rural diets. It has been reported that 100 grams of a fruit from the baobab tree correspond to 100 percent of a child’s recommended daily allowance of iron and potassium, 92 percent of the recommended daily allowance of copper and 40 percent of the recommended daily allowance of calcium. An estimated 2.4 billion people, or about one-third of the population in developing regions, depend on fuelwood for cooking, sterilizing water and preserving food.
hunger. FAO’s Voices of the Hungry project will provide an innovative monitoring tool in this area.
The Voices of the Hungry project aims to establish a new global standard for measuring food insecurity using a food insecurity experience scale. The approach is based on eight questions designed to establish the respondent’s positions on a food insecurity experience scale (mild, moderate and severely food-insecure). The project will strengthen FAO’s capacity for monitoring global food security, by collecting data globally and annually through the Gallup World Poll. Information is gathered at the individual level, hence allowing disparities in food access based on gender and other characteristics to be observed. FAO has already started working closely
with four countries of the Renewed Partnership for a Unified Approach to End Hunger in Africa: Angola, Ethiopia, Malawi and the Niger.
With the Voices of the Hungry project, FAO will set a baseline for measuring progress in reducing food insecurity in all countries of the world by 2015.
1 United Nations. 2013. A new global partnership: Eradicate poverty and transform economies through sustainable development. The report of the High-Level Panel of Eminent Persons on the Post-2015 Development Agenda. New York, USA.
BOX 1 (Cont.)
Food security and its four dimensions
T H E S T A T E O F F O O D I N S E C U R I T Y I N T H E W O R L D 2 0 1 3
Measuring different dimensions of food security
19
TABLE 2
Average dietary energy supply adequacy in the developing regions, 1990–92 to 2011–13
1990–92 2000–02 2005–07 2008–10 2011–13*
(Percentage)
World 114 117 119 120 122
Developed regions 131 134 136 135 135
Developing regions 108 112 114 117 118
Least-developed countries 97 97 101 103 105
Landlocked developing countries 99 98 104 107 110
Small island developing states 103 109 111 113 114
Low-income economies 97 96 101 102 105
Lower-middle-income economies 107 107 110 112 114
Low-income food-deficit countries 104 103 106 108 110
Africa 108 110 113 115 117
Northern Africa 138 139 139 141 144
Sub-Saharan Africa 100 103 108 109 111
Asia 107 111 113 116 117
Caucasus and Central Asia 105 118 120 125
Eastern Asia 107 118 119 124 124
South-Eastern Asia 99 106 112 116 121
Southern Asia 106 104 105 106 108
Western Asia 142 135 135 134 134
Latin America and the Caribbean 117 121 124 125 127
Caribbean 101 109 110 112 114
Latin America 118 122 124 126 128
Oceania 113 112 115 116 116
Note: * Projections.Source: FAO.
Source: FAO.
FIGURE 8
The share of dietary energy supply derived from cereals, roots and tubers has declined in most regions since 1990–92, indicating improving dietary quality
1990–92 2008–10
80
60
40
20
0World Developed
regionsDeveloping
regionsAfrica Asia Latin America
and theCaribbean
Oceania
Percentage
T H E S T A T E O F F O O D I N S E C U R I T Y I N T H E W O R L D 2 0 1 320
Measuring different dimensions of food security
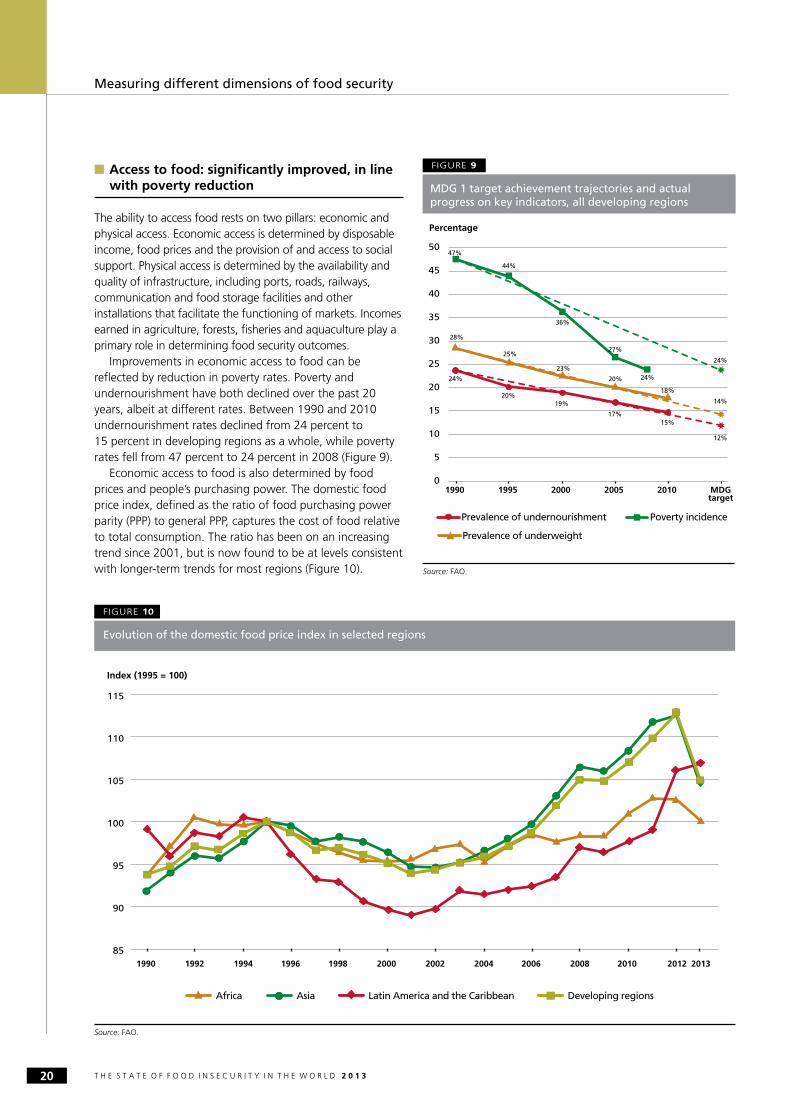
■ Access to food: significantly improved, in line with poverty reduction
The ability to access food rests on two pillars: economic and physical access. Economic access is determined by disposable income, food prices and the provision of and access to social support. Physical access is determined by the availability and quality of infrastructure, including ports, roads, railways, communication and food storage facilities and other installations that facilitate the functioning of markets. Incomes earned in agriculture, forests, fisheries and aquaculture play a primary role in determining food security outcomes.
Improvements in economic access to food can be reflected by reduction in poverty rates. Poverty and undernourishment have both declined over the past 20 years, albeit at different rates. Between 1990 and 2010 undernourishment rates declined from 24 percent to 15 percent in developing regions as a whole, while poverty rates fell from 47 percent to 24 percent in 2008 (Figure 9).
Economic access to food is also determined by food prices and people’s purchasing power. The domestic food price index, defined as the ratio of food purchasing power parity (PPP) to general PPP, captures the cost of food relative to total consumption. The ratio has been on an increasing trend since 2001, but is now found to be at levels consistent with longer-term trends for most regions (Figure 10).
FIGURE 10
Evolution of the domestic food price index in selected regions
Source: FAO.
85
90
95
100
105
110
115
1990 1992 1994 1996 1998 2000 2002 2004 2006 2008 2010 2012
Africa Asia Latin America and the Caribbean Developing regions
Index (1995 = 100)
2013
FIGURE 9
MDG 1 target achievement trajectories and actual progress on key indicators, all developing regions
Source: FAO.
24%
20% 19%
17% 15%
12%
44%
36%
27%
24%
47%
24% 25%
23%
20%
18%
28%
14%
0
5
10
15
20
25
30
35
40
45
50
1990 1995 2000 2005 2010 MDG target
Prevalence of undernourishment Poverty incidence
Prevalence of underweight
Percentage
T H E S T A T E O F F O O D I N S E C U R I T Y I N T H E W O R L D 2 0 1 3
Measuring different dimensions of food security
21
to 20 percent in 2010. Progress has been much slower in Africa, where prevalence rates declined from 23 percent in 1990 to 18 percent in 2010 (Figure 11).
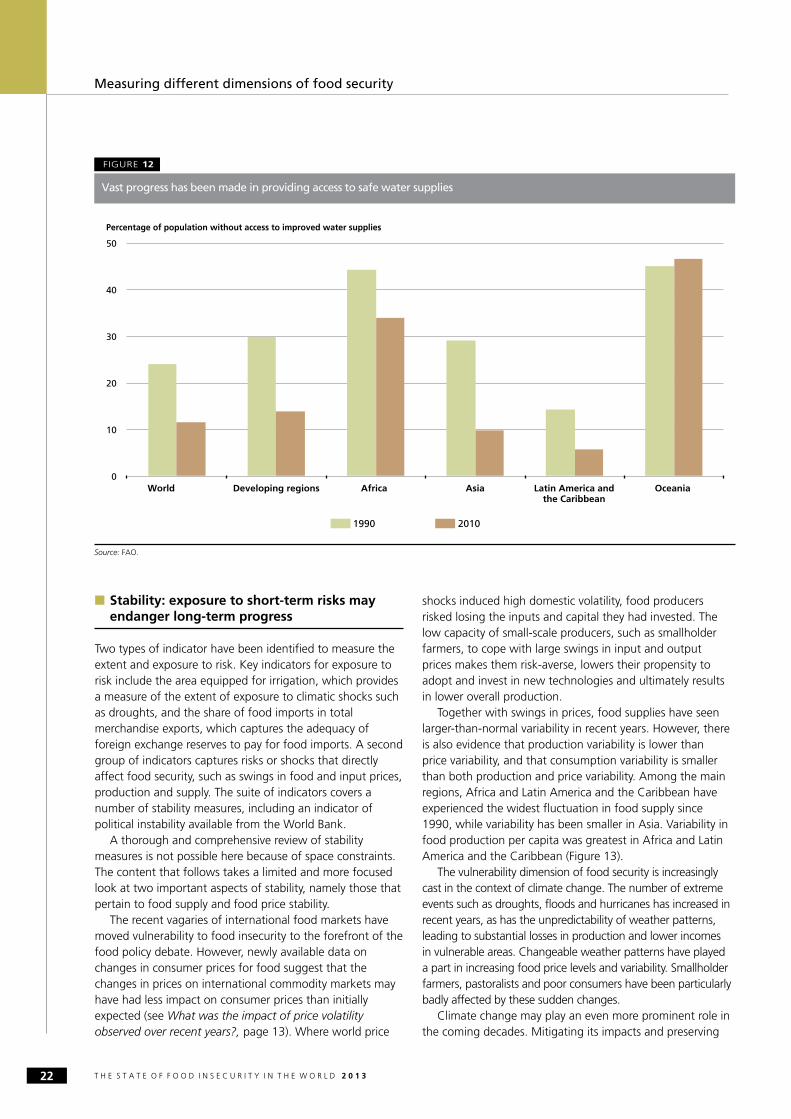
Food utilization is also influenced by the way in which food is handled, prepared and stored. Good health is a prerequisite for the human body to absorb nutrients effectively, and hygienic food helps maintain a healthy body. Access to clean water is crucial to preparation of clean, healthy food and maintaining a healthy body.
The last 20 years have seen significant progress in this area. By 2010, the share of the world’s population without access to adequate drinking water has fallen to 12 percent from 24 percent in 1990; thus, the MDG target of halving the proportion of the population without sustainable access to safe drinking water and basic sanitation has already been reached at the global level. Again, however, progress has been uneven across regions and limited in sub-Saharan Africa (Figure 12). The most recent data available suggest that only 61 percent of the population in sub-Saharan Africa has access to improved water supply, compared with 90 percent in Northern Africa, Latin America and most of Asia. Similar disparities are found within countries and, in particular, between urban and rural areas.
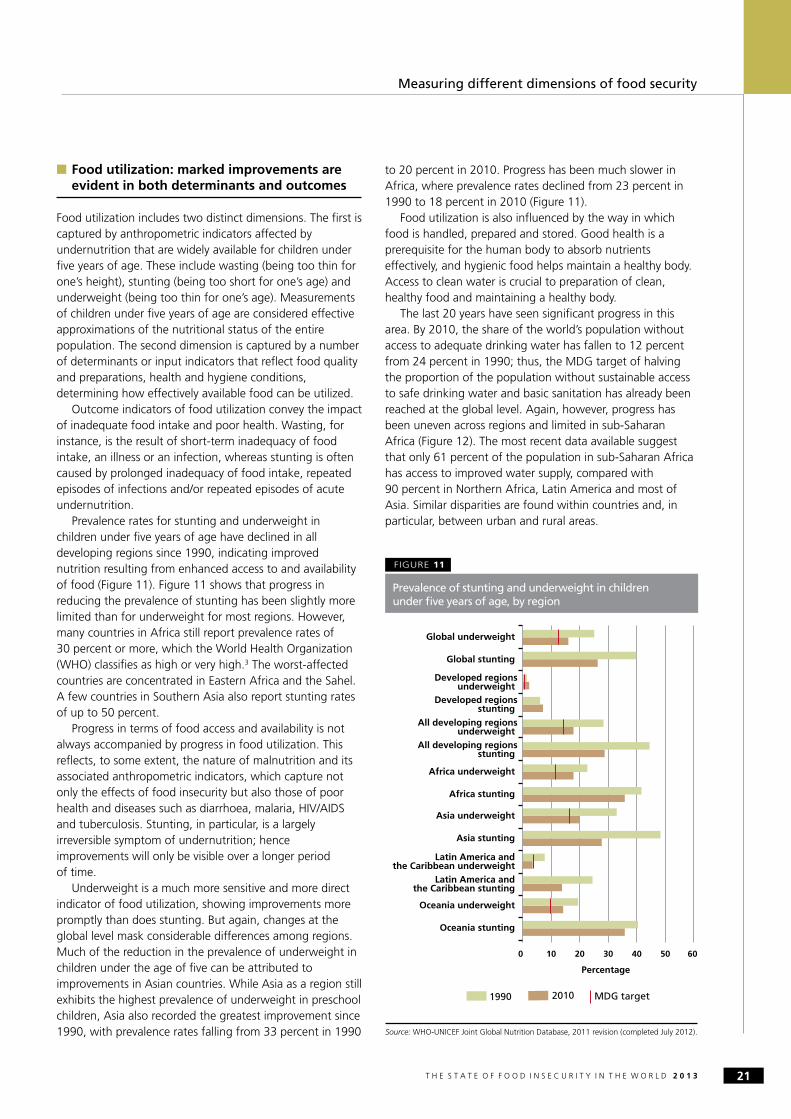
■ Food utilization: marked improvements are evident in both determinants and outcomes
Food utilization includes two distinct dimensions. The first is captured by anthropometric indicators affected by undernutrition that are widely available for children under five years of age. These include wasting (being too thin for one’s height), stunting (being too short for one’s age) and underweight (being too thin for one’s age). Measurements of children under five years of age are considered effective approximations of the nutritional status of the entire population. The second dimension is captured by a number of determinants or input indicators that reflect food quality and preparations, health and hygiene conditions, determining how effectively available food can be utilized.
Outcome indicators of food utilization convey the impact of inadequate food intake and poor health. Wasting, for instance, is the result of short-term inadequacy of food intake, an illness or an infection, whereas stunting is often caused by prolonged inadequacy of food intake, repeated episodes of infections and/or repeated episodes of acute undernutrition.
Prevalence rates for stunting and underweight in children under five years of age have declined in all developing regions since 1990, indicating improved nutrition resulting from enhanced access to and availability of food (Figure 11). Figure 11 shows that progress in reducing the prevalence of stunting has been slightly more limited than for underweight for most regions. However, many countries in Africa still report prevalence rates of 30 percent or more, which the World Health Organization (WHO) classifies as high or very high.3 The worst-affected countries are concentrated in Eastern Africa and the Sahel. A few countries in Southern Asia also report stunting rates of up to 50 percent.
Progress in terms of food access and availability is not always accompanied by progress in food utilization. This reflects, to some extent, the nature of malnutrition and its associated anthropometric indicators, which capture not only the effects of food insecurity but also those of poor health and diseases such as diarrhoea, malaria, HIV/AIDS and tuberculosis. Stunting, in particular, is a largely irreversible symptom of undernutrition; hence improvements will only be visible over a longer period of time.
Underweight is a much more sensitive and more direct indicator of food utilization, showing improvements more promptly than does stunting. But again, changes at the global level mask considerable differences among regions. Much of the reduction in the prevalence of underweight in children under the age of five can be attributed to improvements in Asian countries. While Asia as a region still exhibits the highest prevalence of underweight in preschool children, Asia also recorded the greatest improvement since 1990, with prevalence rates falling from 33 percent in 1990
FIGURE 11
Prevalence of stunting and underweight in children under five years of age, by region
Source: WHO-UNICEF Joint Global Nutrition Database, 2011 revision (completed July 2012).
20101990
Percentage
0 10 20 30 40 50 60
Africa stunting
Africa underweight
Asia stunting
Asia underweight
Latin America and the Caribbean stunting
Latin America and the Caribbean underweight
Oceania stunting
Oceania underweight
All developing regionsstunting
All developing regionsunderweight
Developed regionsstunting
Developed regionsunderweight
Global stunting
Global underweight
MDG target
T H E S T A T E O F F O O D I N S E C U R I T Y I N T H E W O R L D 2 0 1 322
Measuring different dimensions of food security
shocks induced high domestic volatility, food producers risked losing the inputs and capital they had invested. The low capacity of small-scale producers, such as smallholder farmers, to cope with large swings in input and output prices makes them risk-averse, lowers their propensity to adopt and invest in new technologies and ultimately results in lower overall production.
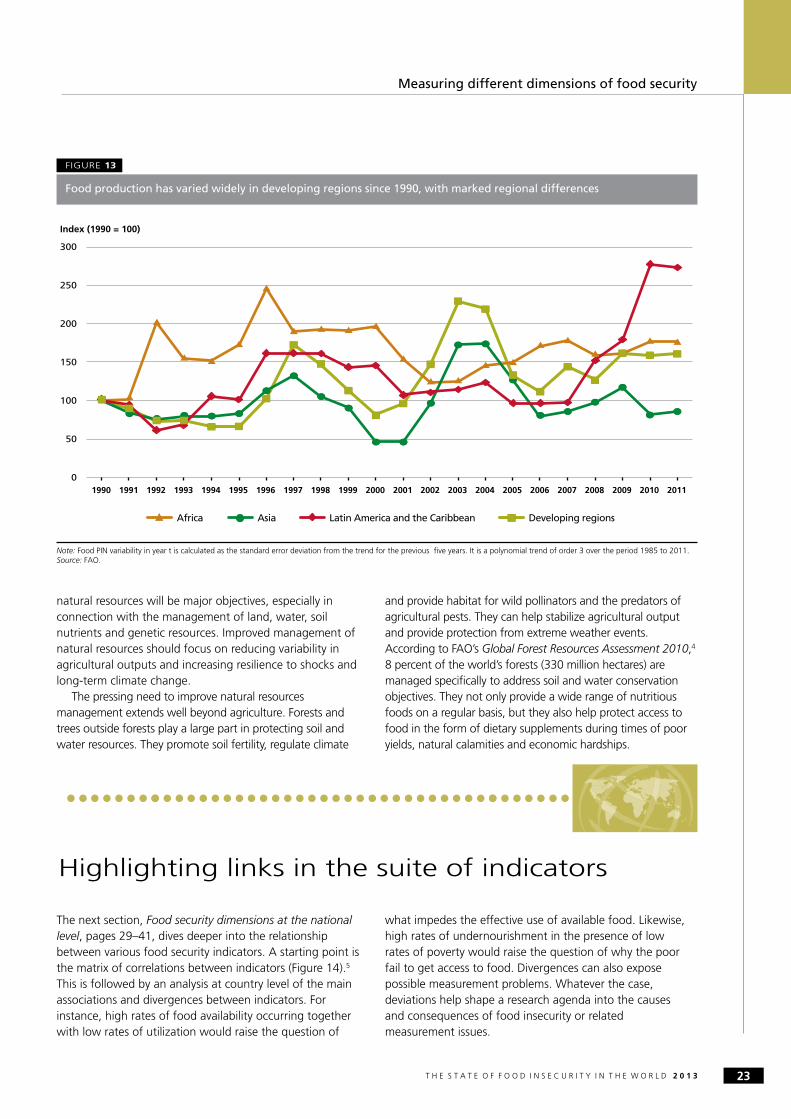
Together with swings in prices, food supplies have seen larger-than-normal variability in recent years. However, there is also evidence that production variability is lower than price variability, and that consumption variability is smaller than both production and price variability. Among the main regions, Africa and Latin America and the Caribbean have experienced the widest fluctuation in food supply since 1990, while variability has been smaller in Asia. Variability in food production per capita was greatest in Africa and Latin America and the Caribbean (Figure 13).
The vulnerability dimension of food security is increasingly cast in the context of climate change. The number of extreme events such as droughts, floods and hurricanes has increased in recent years, as has the unpredictability of weather patterns, leading to substantial losses in production and lower incomes in vulnerable areas. Changeable weather patterns have played a part in increasing food price levels and variability. Smallholder farmers, pastoralists and poor consumers have been particularly badly affected by these sudden changes.
Climate change may play an even more prominent role in the coming decades. Mitigating its impacts and preserving
■ Stability: exposure to short-term risks may endanger long-term progress
Two types of indicator have been identified to measure the extent and exposure to risk. Key indicators for exposure to risk include the area equipped for irrigation, which provides a measure of the extent of exposure to climatic shocks such as droughts, and the share of food imports in total merchandise exports, which captures the adequacy of foreign exchange reserves to pay for food imports. A second group of indicators captures risks or shocks that directly affect food security, such as swings in food and input prices, production and supply. The suite of indicators covers a number of stability measures, including an indicator of political instability available from the World Bank.
A thorough and comprehensive review of stability measures is not possible here because of space constraints. The content that follows takes a limited and more focused look at two important aspects of stability, namely those that pertain to food supply and food price stability.
The recent vagaries of international food markets have moved vulnerability to food insecurity to the forefront of the food policy debate. However, newly available data on changes in consumer prices for food suggest that the changes in prices on international commodity markets may have had less impact on consumer prices than initially expected (see What was the impact of price volatility observed over recent years?, page 13). Where world price
Source: FAO.
FIGURE 12
Vast progress has been made in providing access to safe water supplies
1990 2010
0
10
20
30
40
50
World Developing regions Africa Asia Latin America and the Caribbean
Oceania
Percentage of population without access to improved water supplies
T H E S T A T E O F F O O D I N S E C U R I T Y I N T H E W O R L D 2 0 1 3
Measuring different dimensions of food security
23
natural resources will be major objectives, especially in connection with the management of land, water, soil nutrients and genetic resources. Improved management of natural resources should focus on reducing variability in agricultural outputs and increasing resilience to shocks and long-term climate change.
The pressing need to improve natural resources management extends well beyond agriculture. Forests and trees outside forests play a large part in protecting soil and water resources. They promote soil fertility, regulate climate
and provide habitat for wild pollinators and the predators of agricultural pests. They can help stabilize agricultural output and provide protection from extreme weather events. According to FAO’s Global Forest Resources Assessment 2010,4 8 percent of the world’s forests (330 million hectares) are managed specifically to address soil and water conservation objectives. They not only provide a wide range of nutritious foods on a regular basis, but they also help protect access to food in the form of dietary supplements during times of poor yields, natural calamities and economic hardships.
FIGURE 13
Food production has varied widely in developing regions since 1990, with marked regional differences
Note: Food PIN variability in year t is calculated as the standard error deviation from the trend for the previous five years. It is a polynomial trend of order 3 over the period 1985 to 2011. Source: FAO.
Africa Asia Latin America and the Caribbean Developing regions
Index (1990 = 100)
0
50
100
150
200
250
300
1990 1991 1992 1993 1994 1995 1996 1997 1998 1999 2000 2001 2002 2003 2004 2005 2006 2007 2008 2009 2010 2011
Highlighting links in the suite of indicators
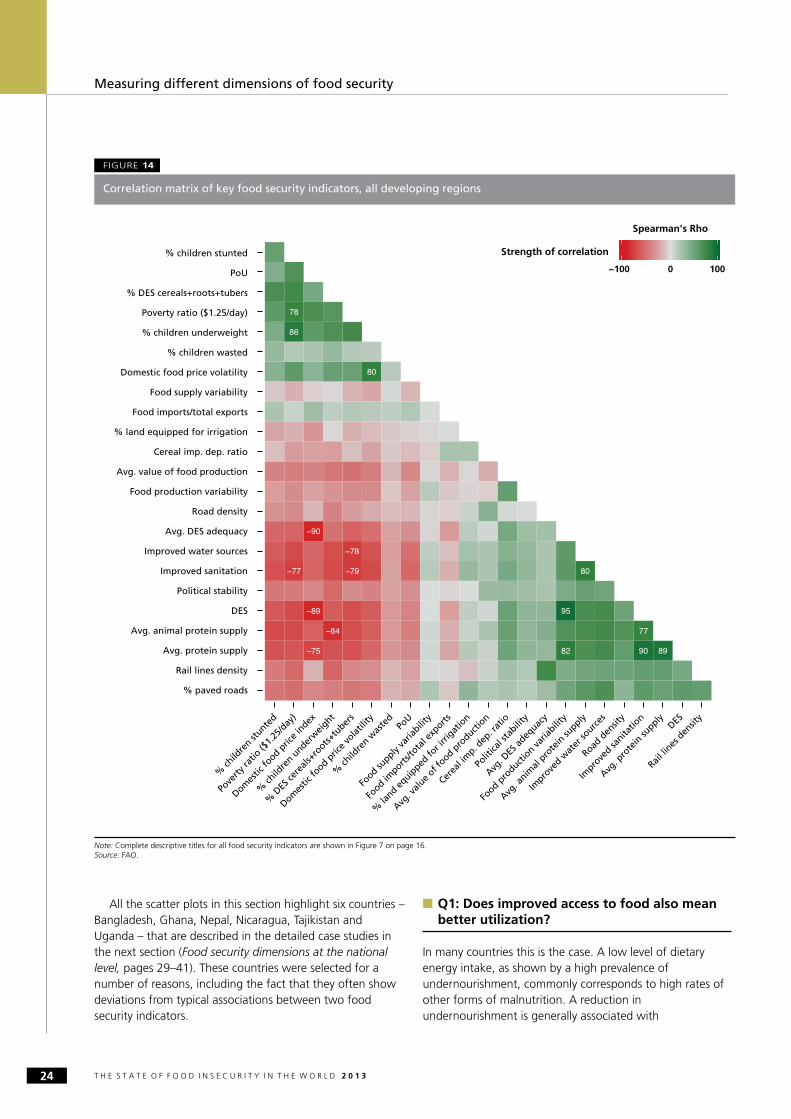
The next section, Food security dimensions at the national level, pages 29–41, dives deeper into the relationship between various food security indicators. A starting point is the matrix of correlations between indicators (Figure 14).5 This is followed by an analysis at country level of the main associations and divergences between indicators. For instance, high rates of food availability occurring together with low rates of utilization would raise the question of
what impedes the effective use of available food. Likewise, high rates of undernourishment in the presence of low rates of poverty would raise the question of why the poor fail to get access to food. Divergences can also expose possible measurement problems. Whatever the case, deviations help shape a research agenda into the causes and consequences of food insecurity or related measurement issues.
T H E S T A T E O F F O O D I N S E C U R I T Y I N T H E W O R L D 2 0 1 324
Measuring different dimensions of food security
All the scatter plots in this section highlight six countries – Bangladesh, Ghana, Nepal, Nicaragua, Tajikistan and Uganda – that are described in the detailed case studies in the next section (Food security dimensions at the national level, pages 29–41). These countries were selected for a number of reasons, including the fact that they often show deviations from typical associations between two food security indicators.
■ Q1: Does improved access to food also mean better utilization?
In many countries this is the case. A low level of dietary energy intake, as shown by a high prevalence of undernourishment, commonly corresponds to high rates of other forms of malnutrition. A reduction in undernourishment is generally associated with
FIGURE 14
Correlation matrix of key food security indicators, all developing regions
Note: Complete descriptive titles for all food security indicators are shown in Figure 7 on page 16.Source: FAO.
−77
86
78
−90
−75
−89
−84
−78
−79
80
82
95
80
90
77
89
% children stunted
PoU
% DES cereals+roots+tubers
Poverty ratio ($1.25/day)
% children underweight
% children wasted
Domestic food price volatility
Food supply variability
Food imports/total exports
% land equipped for irrigation
Cereal imp. dep. ratio
Avg. value of food production
Food production variability
Road density
Avg. DES adequacy
Improved water sources
Improved sanitation
Political stability
DES
Avg. animal protein supply
Avg. protein supply
Rail lines density
% paved roads
Domes
tic fo
od pric
e index
% ch
ildre
n stunte
dPo
U
% D
ES ce
reals
+roots+
tuber
s
Pove
rty ra
tio ($
1.25/d
ay)
% ch
ildre
n under
weight
Domes
tic fo
od pric
e volat
ility
% ch
ildre
n was
ted
Food su
pply va
riabilit
y
Food im
ports/to
tal e
xports
% la
nd equip
ped fo
r irri
gatio
n
Cerea
l imp. d
ep. r
atio
Avg. v
alue o
f food p
roducti
on
Food p
roducti
on varia
bility
Road d
ensit
y
Avg. D
ES ad
equac
y
Impro
ved w
ater
source
s
Impro
ved sa
nitatio
n
Polit
ical s
tabilit
yDES
Avg. a
nimal
prote
in su
pply
Avg. p
rote
in su
pply
Rail lin
es d
ensit
y
−100 0 100
Strength of correlation
Spearman's Rho
T H E S T A T E O F F O O D I N S E C U R I T Y I N T H E W O R L D 2 0 1 3
Measuring different dimensions of food security
25
■ Q2: Does high food availability imply lower undernourishment?
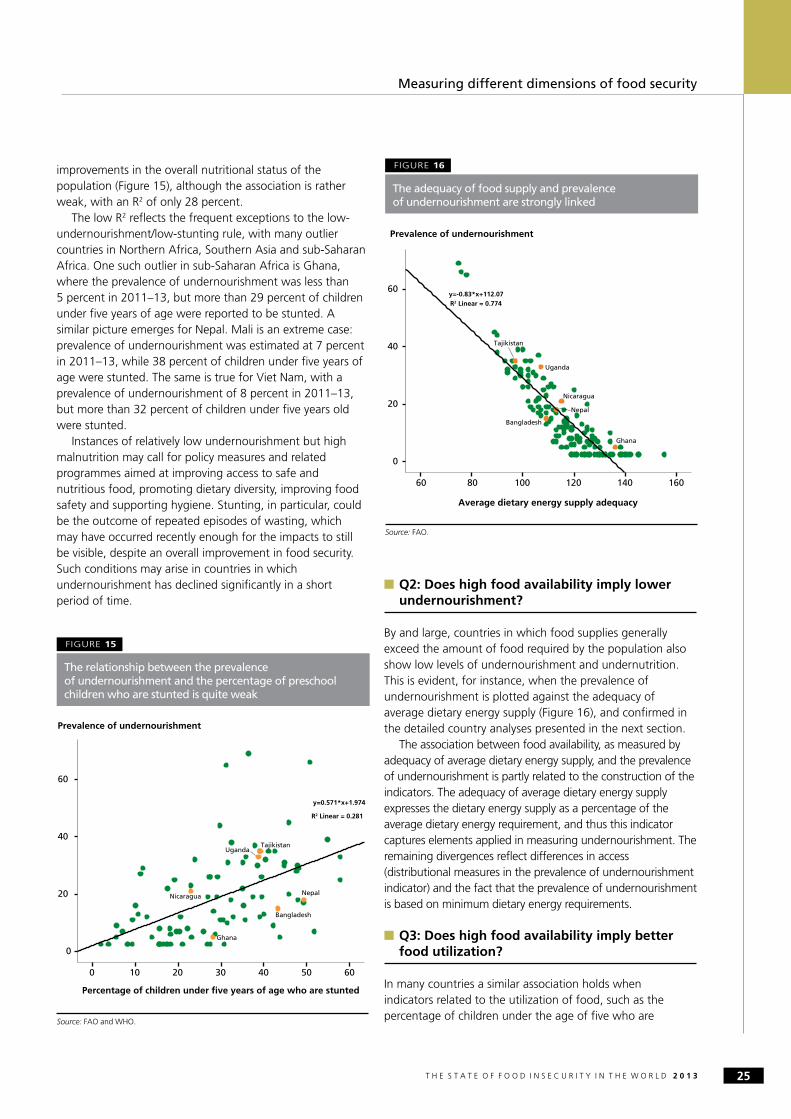
By and large, countries in which food supplies generally exceed the amount of food required by the population also show low levels of undernourishment and undernutrition. This is evident, for instance, when the prevalence of undernourishment is plotted against the adequacy of average dietary energy supply (Figure 16), and confirmed in the detailed country analyses presented in the next section.
The association between food availability, as measured by adequacy of average dietary energy supply, and the prevalence of undernourishment is partly related to the construction of the indicators. The adequacy of average dietary energy supply expresses the dietary energy supply as a percentage of the average dietary energy requirement, and thus this indicator captures elements applied in measuring undernourishment. The remaining divergences reflect differences in access (distributional measures in the prevalence of undernourishment indicator) and the fact that the prevalence of undernourishment is based on minimum dietary energy requirements.
■ Q3: Does high food availability imply better food utilization?
In many countries a similar association holds when indicators related to the utilization of food, such as the percentage of children under the age of five who are
improvements in the overall nutritional status of the population (Figure 15), although the association is rather weak, with an R2 of only 28 percent.
The low R2 reflects the frequent exceptions to the low-undernourishment/low-stunting rule, with many outlier countries in Northern Africa, Southern Asia and sub-Saharan Africa. One such outlier in sub-Saharan Africa is Ghana, where the prevalence of undernourishment was less than 5 percent in 2011–13, but more than 29 percent of children under five years of age were reported to be stunted. A similar picture emerges for Nepal. Mali is an extreme case: prevalence of undernourishment was estimated at 7 percent in 2011–13, while 38 percent of children under five years of age were stunted. The same is true for Viet Nam, with a prevalence of undernourishment of 8 percent in 2011–13, but more than 32 percent of children under five years old were stunted.
Instances of relatively low undernourishment but high malnutrition may call for policy measures and related programmes aimed at improving access to safe and nutritious food, promoting dietary diversity, improving food safety and supporting hygiene. Stunting, in particular, could be the outcome of repeated episodes of wasting, which may have occurred recently enough for the impacts to still be visible, despite an overall improvement in food security. Such conditions may arise in countries in which undernourishment has declined significantly in a short period of time.
Source: FAO and WHO.
FIGURE 15
The relationship between the prevalence of undernourishment and the percentage of preschool children who are stunted is quite weak
Percentage of children under five years of age who are stunted
6050403020100
60
40
20
0
Uganda
Nicaragua Nepal
Ghana
Tajikistan
Bangladesh
R2 Linear = 0.281
y=0.571*x+1.974
Prevalence of undernourishment
Source: FAO.
FIGURE 16
The adequacy of food supply and prevalence of undernourishment are strongly linked
Average dietary energy supply adequacy
1601401201008060
Prevalence of undernourishment
60
40
20
0
Uganda
Tajikistan
Nicaragua
Nepal
Ghana
Bangladesh
R2 Linear = 0.774y=-0.83*x+112.07
T H E S T A T E O F F O O D I N S E C U R I T Y I N T H E W O R L D 2 0 1 326
Measuring different dimensions of food security
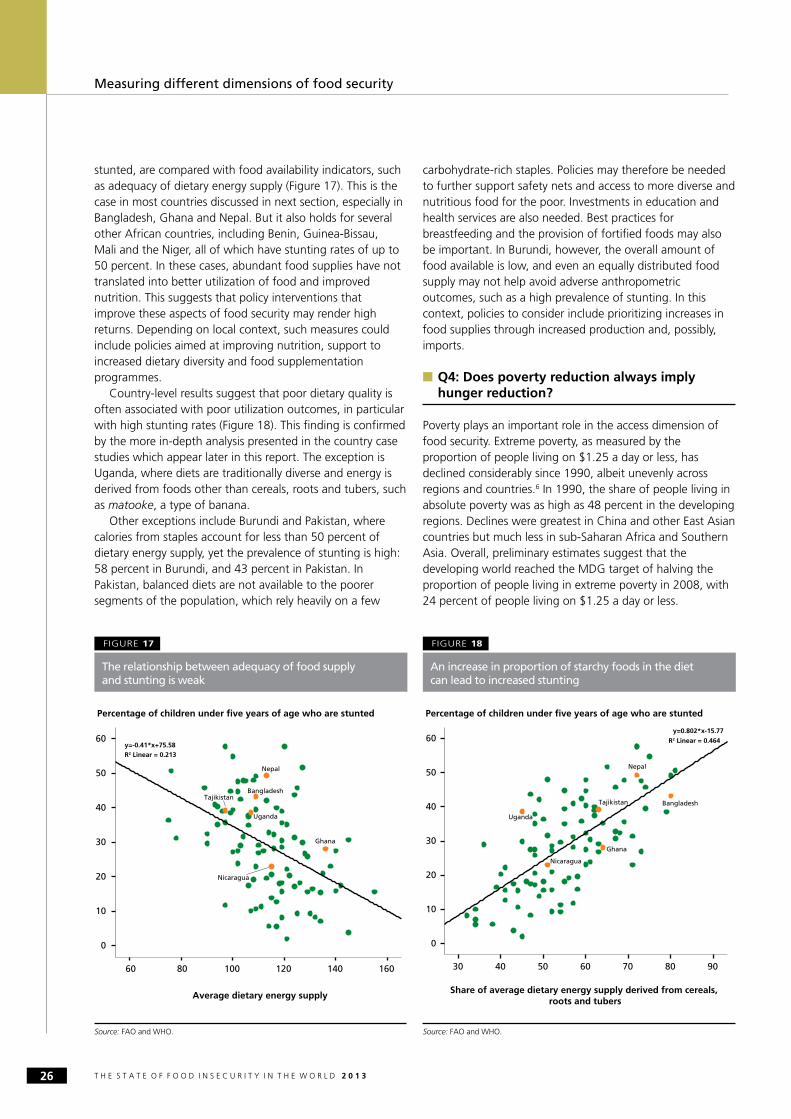
stunted, are compared with food availability indicators, such as adequacy of dietary energy supply (Figure 17). This is the case in most countries discussed in next section, especially in Bangladesh, Ghana and Nepal. But it also holds for several other African countries, including Benin, Guinea-Bissau, Mali and the Niger, all of which have stunting rates of up to 50 percent. In these cases, abundant food supplies have not translated into better utilization of food and improved nutrition. This suggests that policy interventions that improve these aspects of food security may render high returns. Depending on local context, such measures could include policies aimed at improving nutrition, support to increased dietary diversity and food supplementation programmes.
Country-level results suggest that poor dietary quality is often associated with poor utilization outcomes, in particular with high stunting rates (Figure 18). This finding is confirmed by the more in-depth analysis presented in the country case studies which appear later in this report. The exception is Uganda, where diets are traditionally diverse and energy is derived from foods other than cereals, roots and tubers, such as matooke, a type of banana.
Other exceptions include Burundi and Pakistan, where calories from staples account for less than 50 percent of dietary energy supply, yet the prevalence of stunting is high: 58 percent in Burundi, and 43 percent in Pakistan. In Pakistan, balanced diets are not available to the poorer segments of the population, which rely heavily on a few
carbohydrate-rich staples. Policies may therefore be needed to further support safety nets and access to more diverse and nutritious food for the poor. Investments in education and health services are also needed. Best practices for breastfeeding and the provision of fortified foods may also be important. In Burundi, however, the overall amount of food available is low, and even an equally distributed food supply may not help avoid adverse anthropometric outcomes, such as a high prevalence of stunting. In this context, policies to consider include prioritizing increases in food supplies through increased production and, possibly, imports.
■ Q4: Does poverty reduction always imply hunger reduction?
Poverty plays an important role in the access dimension of food security. Extreme poverty, as measured by the proportion of people living on $1.25 a day or less, has declined considerably since 1990, albeit unevenly across regions and countries.6 In 1990, the share of people living in absolute poverty was as high as 48 percent in the developing regions. Declines were greatest in China and other East Asian countries but much less in sub-Saharan Africa and Southern Asia. Overall, preliminary estimates suggest that the developing world reached the MDG target of halving the proportion of people living in extreme poverty in 2008, with 24 percent of people living on $1.25 a day or less.
Source: FAO and WHO.
FIGURE 17
The relationship between adequacy of food supply and stunting is weak
Average dietary energy supply
1601401201008060
Percentage of children under five years of age who are stunted
60
50
40
30
20
10
0
Tajikistan
Nicaragua
Ghana
Uganda
Nepal
Bangladesh
R2 Linear = 0.213y=-0.41*x+75.58
Source: FAO and WHO.
FIGURE 18
An increase in proportion of starchy foods in the diet can lead to increased stunting
Percentage of children under five years of age who are stunted
Share of average dietary energy supply derived from cereals, roots and tubers
90807060504030
60
50
40
30
20
10
0
Tajikistan
Nepal
Bangladesh
Uganda
Nicaragua
Ghana
R2 Linear = 0.464 y=0.802*x-15.77
T H E S T A T E O F F O O D I N S E C U R I T Y I N T H E W O R L D 2 0 1 3
Measuring different dimensions of food security
27
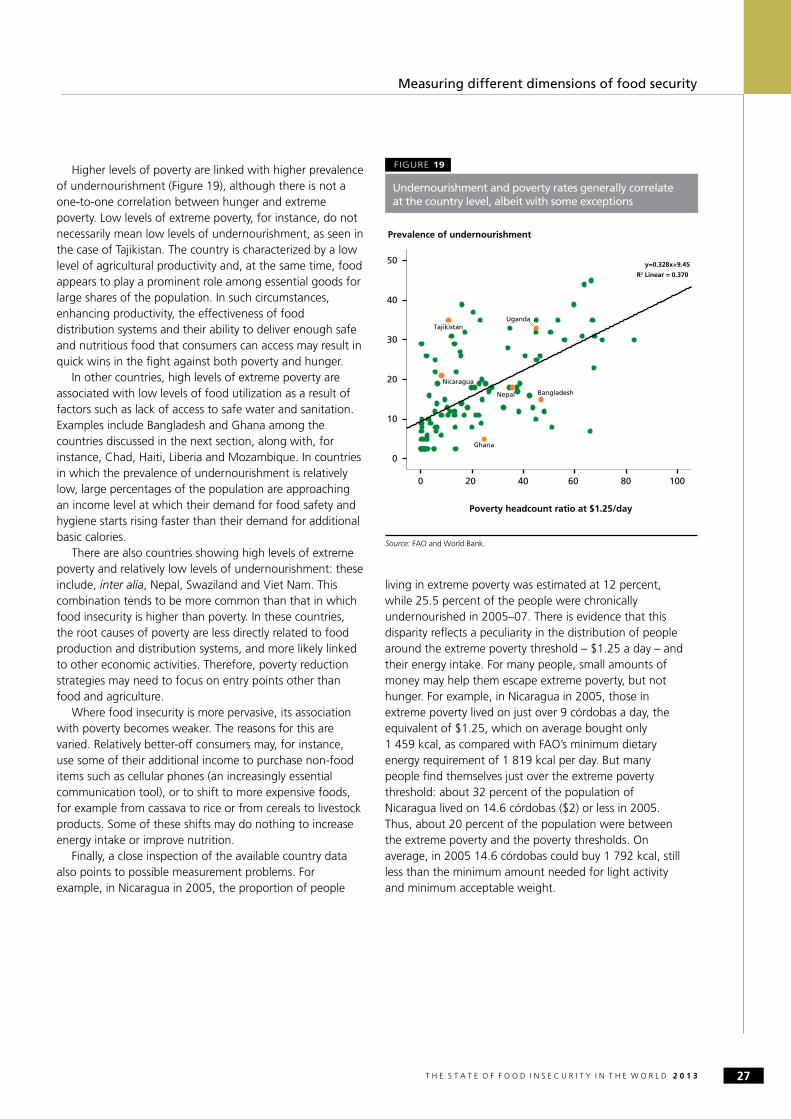
Higher levels of poverty are linked with higher prevalence of undernourishment (Figure 19), although there is not a one-to-one correlation between hunger and extreme poverty. Low levels of extreme poverty, for instance, do not necessarily mean low levels of undernourishment, as seen in the case of Tajikistan. The country is characterized by a low level of agricultural productivity and, at the same time, food appears to play a prominent role among essential goods for large shares of the population. In such circumstances, enhancing productivity, the effectiveness of food distribution systems and their ability to deliver enough safe and nutritious food that consumers can access may result in quick wins in the fight against both poverty and hunger.
In other countries, high levels of extreme poverty are associated with low levels of food utilization as a result of factors such as lack of access to safe water and sanitation. Examples include Bangladesh and Ghana among the countries discussed in the next section, along with, for instance, Chad, Haiti, Liberia and Mozambique. In countries in which the prevalence of undernourishment is relatively low, large percentages of the population are approaching an income level at which their demand for food safety and hygiene starts rising faster than their demand for additional basic calories.
There are also countries showing high levels of extreme poverty and relatively low levels of undernourishment: these include, inter alia, Nepal, Swaziland and Viet Nam. This combination tends to be more common than that in which food insecurity is higher than poverty. In these countries, the root causes of poverty are less directly related to food production and distribution systems, and more likely linked to other economic activities. Therefore, poverty reduction strategies may need to focus on entry points other than food and agriculture.
Where food insecurity is more pervasive, its association with poverty becomes weaker. The reasons for this are varied. Relatively better-off consumers may, for instance, use some of their additional income to purchase non-food items such as cellular phones (an increasingly essential communication tool), or to shift to more expensive foods, for example from cassava to rice or from cereals to livestock products. Some of these shifts may do nothing to increase energy intake or improve nutrition.
Finally, a close inspection of the available country data also points to possible measurement problems. For example, in Nicaragua in 2005, the proportion of people
living in extreme poverty was estimated at 12 percent, while 25.5 percent of the people were chronically undernourished in 2005–07. There is evidence that this disparity reflects a peculiarity in the distribution of people around the extreme poverty threshold – $1.25 a day – and their energy intake. For many people, small amounts of money may help them escape extreme poverty, but not hunger. For example, in Nicaragua in 2005, those in extreme poverty lived on just over 9 córdobas a day, the equivalent of $1.25, which on average bought only 1 459 kcal, as compared with FAO’s minimum dietary energy requirement of 1 819 kcal per day. But many people find themselves just over the extreme poverty threshold: about 32 percent of the population of Nicaragua lived on 14.6 córdobas ($2) or less in 2005. Thus, about 20 percent of the population were between the extreme poverty and the poverty thresholds. On average, in 2005 14.6 córdobas could buy 1 792 kcal, still less than the minimum amount needed for light activity and minimum acceptable weight.
Source: FAO and World Bank.
FIGURE 19
Undernourishment and poverty rates generally correlate at the country level, albeit with some exceptions
Poverty headcount ratio at $1.25/day
Prevalence of undernourishment
100806040200
50
40
30
20
10
0
Ghana
BangladeshNepal
Nicaragua
UgandaTajikistan
R2 Linear = 0.370
y=0.328x+9.45
T H E S T A T E O F F O O D I N S E C U R I T Y I N T H E W O R L D 2 0 1 328
Measuring different dimensions of food security
• Food security is a complex condition. Its dimensions – availability, access, utilization and stability – are better understood when presented through a suite of indicators.
• Over the last 20 years, food availability in developing regions has risen faster than the average dietary energy requirements, while the quality of diets has improved. Better economic access to food is reflected by changes in poverty rates, which have fallen along with undernourishment over this period, albeit at different speeds. The recent vagaries of international food markets have moved vulnerability to the forefront of discussions of food insecurity. The impact of price variability and spikes on consumers may have been more limited than initially expected, while food producers faced high risks.
• Hunger tends to be widespread in countries with high poverty levels. Hunger is likely to be more severe than poverty, especially when both are at elevated levels. As food is one of the
most income-responsive of all basic necessities, boosting incomes and providing social safety nets reduce hunger. Where undernourishment is less prevalent than poverty, interventions to improve food utilization are required.
• Ample food availability does not necessarily enable better food access and utilization. When poor access and utilization occur, despite sufficient food availability, social protection, as well as improvements in food distribution and supplementation programmes, should be prioritized.
• Undernourishment and undernutrition can coexist. However, in some countries, undernutrition rates, as indicated by the proportion of stunted children, are considerably higher than the prevalence of undernourishment, as indicated by inadequacy of dietary energy supply. In these countries, nutrition-enhancing interventions are crucial to improve the nutritional aspects of food security. Improvements require a range of food security and nutrition-enhancing interventions in agriculture, health, hygiene, water supply and education, particularly targeting women.
Key messages