Embed Size (px)
Citation preview
IOSR Journal Of Environmental Science, Toxicology And Food Technology (IOSR-JESTFT)
e-ISSN: 2319-2402,p- ISSN: 2319-2399.Volume 8, Issue 2 Ver. I (Mar-Apr. 2014), PP 14-24
www.iosrjournals.org
www.iosrjournals.org 14 | Page
Understanding Extreme Climatic Events for Economic
Development in Kenya
Julius M. Huho1 and Rose C. Kosonei
2
1Karatina University, Department of Tourism and Hospitality Management, P.0. Box 1957 Karatina, KENYA
2Maseno University, Department of Environmental Studies, P.O. box 333 Maseno, KENYA
Abstract: Kenya is an agri-based economy that heavily relies on rainfall performance. Unfortunately, changes
in rainfall patterns have threatened the agricultural sector since it is largely rain-fed. The frequent occurrence
and increased severity of climatic extremes, particularly droughts and floods, have led to slow economic
development in the affected areas. However, the impacts on the economy vary from one hydrometeorological
disaster to the other depending on their characteristics. From the case studies of Laikipia and Bunyala sub-
counties in Kenya, the study established an increasing trend in both the frequency and magnitude of floods and
droughts. Prolonged and severe flood and drought events had adverse impacts on economic development
through (a) decrease in agricultural production, (b) poor prices for livestock and agricultural produce and (c)
destruction of the immediate environment which in turn exacerbate the impacts. An inverse relationship between
economic development and the magnitude of the disaster was established. The consequence have been increased
poverty levels in the areas due to slow economic development.
Keywords: Extreme climatic events, Floods, droughts, Bunyala, Laikipia North
I. Introduction While agriculture accounts for only 3.2% of the world’s Gross Domestic Product (GDP), it accounts
for 30 – 40% of the Africa’s total GDP. It is the main driver of Africa’s economy providing a source of
livelihood to 65% of the population. Despite its critical role in economic development, over 90% of agriculture
in Africa is small-scale and largely rain-fed. For instance, more than 95% of the farmed land in the Sub-Saharan
Africa is rain-fed (Wani, et al., 2009) making it susceptible to climate vagaries. With two-thirds of Africa
having semi-arid to arid climates, extreme climatic events, notably droughts and unusually heavy rainfall that
cause floods are common phenomena. Droughts occur when there is deficiency in precipitation over extended
periods of time causing human suffering to about 60% of the world’s population (Ngaira, 2004). Since 1960s
each drought episode in Africa has been more severe than the previous one (Wang’ati, 1996) causing
humanitarian crisis in the continent. According to Ayoti (2008) droughts accounted for 20% of all the natural
disasters that occurred between 1970 and 2006 affecting over 80% of the population in Africa. The droughts of
1970 and 1980 decades pushed the Sahara desert south destroying farmland in Nigeria, Niger and Mali
(Alleyne, 2009). Severe food shortages were experienced in Niger, Sudan, Ethiopia, Kenya and Mozambique
while additional 17 other African countries experienced inadequate food supplies (Farmer and Wigley, 1985).
One of the worst humanitarian crisis caused by an extreme drought occurred in 2011 in the Horn of Africa
(HOA) where over 13 million people were in dire need of humanitarian assistance (Action Aid, 2011).
On the other hand, floods occur when total precipitation exceeds evapo-transipration, surface run off
and infiltration of water into the ground creating water surplus inundating the earth’s surface. Unlike droughts
which have slow onset and may persists for long, floods are short lived but more disastrous. Between 1947 and
1980 floods ranked third in severity after tropical cyclone and earthquakes leading to loss of lives (Houghton,
1977). Unfortunately, flood hazards have been increasing in magnitude with number of people affected
increasing much more rapidly than those suffering from droughts worldwide (Drought Management Centre
(DMC), 2004).Increase in magnitude and frequency of the floods have been observed in Poland, Japan,
Germany and Kenya (Pinter, 2010). There have been remarkable floods in the last half of the twentieth century
(Ngaira, 1999). The period between 1980 and 1985 experienced more than 160 major floods in Asia causing
damage estimated at US$ 2 billion (Houghton, 1997). In South America, North America, south Asia and Africa
floods and mudslides make regular news. In North America, for example, floods and mudslides are the leading
cause of deaths from natural disasters. The number of deaths associated with floods increased from 5.2 million
per year in 1960s to 15.4 million per year in 1970s in South America. In India, the number of lives lost was
fourteen times greater in 1980s compared to 1950s (Clerke, 1991; Cohen and Miller, 2001). In economic terms,
floods are the most expensive natural disaster. In Australia, for example, directs costs associated with floods
averaged at US $370 million per year between 1967 and 2005
(http://www.chiefscientist.qld.gov.au/publications/understanding-floods/consequences.aspx, 2013).
Understanding Extreme Climatic Events For Economic Development In Kenya
www.iosrjournals.org 15 | Page
Climate extremes in Kenya
Over 80% of the Kenya landmass falls under arid and semi-arid climates where droughts and floods are
the main characteristics of rainfall. This makes Kenya prone to climate vagaries. Evidence of climate change has
become more pronounced in through the alternating cycles of droughts and floods. Such cycles have been
experienced in Kenya in 2004, 2006 and 2009 where droughts were interposed with floods (Kenya Red Cross
Society [KRCS], 2012). As a result, climate related disasters accounts for over 70% of all disasters in Kenya.
Droughts and floods are not new phenomena in Kenya with their characteristics -intensity, duration and
spatial extent - varying from one event to the other. The frequency of occurrence and severity of floods and
droughts have been increasing over time. For instance, the frequency of drought increased from once in every 10
years in 1970s, to once in every 5 years in 1980s, once in every 2-3 years in 1990s and every year since 2000
(Howden, 2009). The regular occurrence of floods and droughts has continuously undermined economic
development in the affected areas exacerbating poverty levels. The alternating cycles of droughts and floods do
not only destroy the livelihood sources but also severely undermined the resilience of the people living in the
affected areas (KRCS, 2012). In some arid and semi-arid counties, pastoralists have lost more than half of their
livestock to droughts in the past ten years with over 60% of the inhabitants living below the poverty line
(Grünewald et al, 2006). Today, famine relief due to climate extremes is a regular feature in some parts of the
arid and semi-arid counties such as Machakos, Laikipia, Turkana and Isiolo Counties.
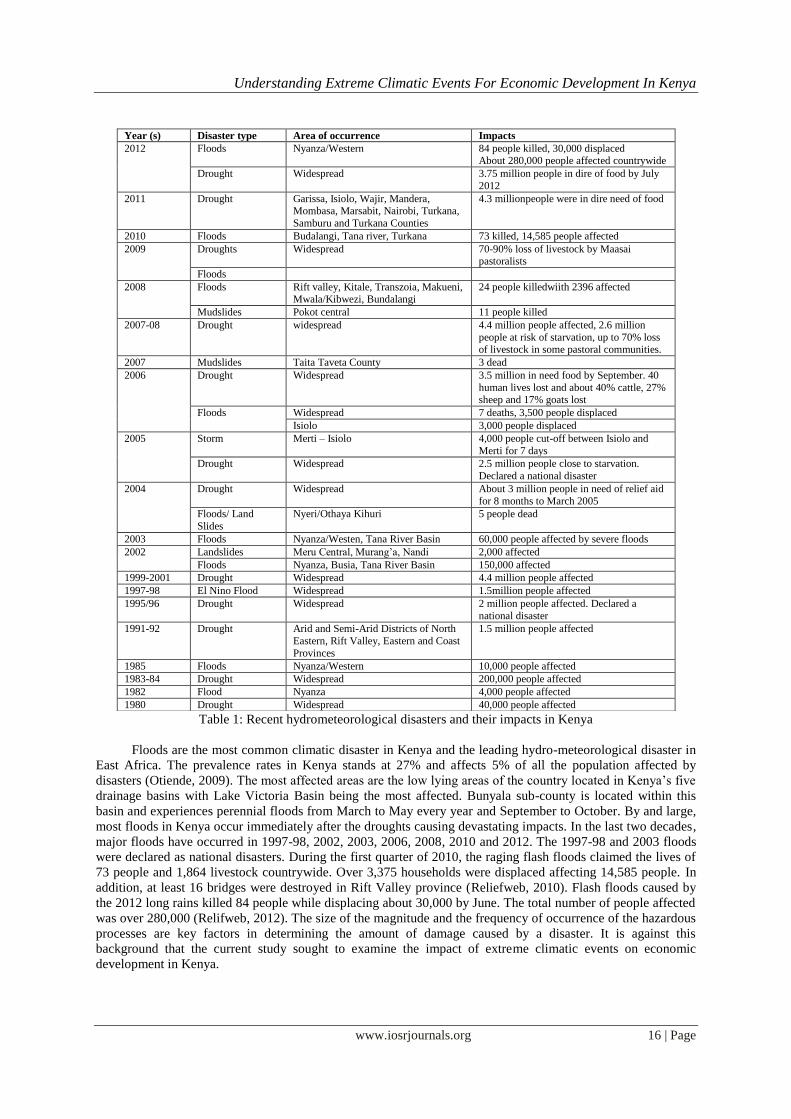
The effects of droughts and floods have been devastating in Kenya (Table 1). Whereas floods inundates
large parts of arable land destroying crops, killing livestock and destroying property, droughts cause deficiency
in rainfall leading to decline in water levels affecting agricultural activities. The worst drought in the last one
hundred years occurred in 1999-2001 killing approximately 60-70% of livestock in the arid and semi-arid areas,
caused massive crop failures, drying up of water resources, severe environmental degradation and loss of goods
and services. Maize yields dropped from 2.5 to 0.5 tonnes/ Ha in Narok County while Kajiado County registered
livestock mortality of more than 50% for cattle and 20% for shoats. Some individual pastoralists lost their entire
herds. In total, about US $ 340 million was spent in providing humanitarian assistance to the 4.5 million people
affected by this drought (UNEP and GoK, 2006). The 1983-84 drought severely affected both pastoralists and
crop farmers. Maize and wheat yields dropped by 50% and 70% respectively, potato production dropped by
more than 70% while pastoralists lost up to 70% of their livestock prompting the importation of the yellow
maize by the Kenya Government (Cohen and Lewis, 1987). In the arid Wajir, West Pokot and Mandera
Counties, the 1991-92 extreme drought led to 100% loss of livestock by about 70% of the pastoralists. Maize
production in Baringo County decreased by 88% during the 1988-92 drought (Ngaira, 2005; Ngaira, 1999).
Northeastern parts of Kenya bore the burden of the 2005-06 drought where 30-40% (and up to 70% in some
communities) of livestock was lost. Pressure on resources caused not only mass migration but triggered conflicts
and destitution (Grünewald et al, 2006). The 2011 drought caused a humanitarian crisis in the country forcing
the government to declare it a national disaster. By May 2011, about 3.2 million people were in dire need of
relief assistance while the malnutrition rate had reached an emergency level in arid and semi-arid areas. By July
2011, the humanitarian crisis in the Kenya’s arid regions led to what was dabbed as "Horn of Africa Drought
Crisis" (KRCS, 2012).
Understanding Extreme Climatic Events For Economic Development In Kenya
www.iosrjournals.org 16 | Page
Table 1: Recent hydrometeorological disasters and their impacts in Kenya
Floods are the most common climatic disaster in Kenya and the leading hydro-meteorological disaster in
East Africa. The prevalence rates in Kenya stands at 27% and affects 5% of all the population affected by
disasters (Otiende, 2009). The most affected areas are the low lying areas of the country located in Kenya’s five
drainage basins with Lake Victoria Basin being the most affected. Bunyala sub-county is located within this
basin and experiences perennial floods from March to May every year and September to October. By and large,
most floods in Kenya occur immediately after the droughts causing devastating impacts. In the last two decades,
major floods have occurred in 1997-98, 2002, 2003, 2006, 2008, 2010 and 2012. The 1997-98 and 2003 floods
were declared as national disasters. During the first quarter of 2010, the raging flash floods claimed the lives of
73 people and 1,864 livestock countrywide. Over 3,375 households were displaced affecting 14,585 people. In
addition, at least 16 bridges were destroyed in Rift Valley province (Reliefweb, 2010). Flash floods caused by
the 2012 long rains killed 84 people while displacing about 30,000 by June. The total number of people affected
was over 280,000 (Relifweb, 2012). The size of the magnitude and the frequency of occurrence of the hazardous
processes are key factors in determining the amount of damage caused by a disaster. It is against this
background that the current study sought to examine the impact of extreme climatic events on economic
development in Kenya.
Year (s) Disaster type Area of occurrence Impacts
2012 Floods Nyanza/Western 84 people killed, 30,000 displaced About 280,000 people affected countrywide
Drought Widespread 3.75 million people in dire of food by July
2012
2011 Drought Garissa, Isiolo, Wajir, Mandera, Mombasa, Marsabit, Nairobi, Turkana,
Samburu and Turkana Counties
4.3 millionpeople were in dire need of food
2010 Floods Budalangi, Tana river, Turkana 73 killed, 14,585 people affected
2009 Droughts Widespread 70-90% loss of livestock by Maasai pastoralists
Floods
2008 Floods Rift valley, Kitale, Transzoia, Makueni, Mwala/Kibwezi, Bundalangi
24 people killedwiith 2396 affected
Mudslides Pokot central 11 people killed
2007-08 Drought widespread 4.4 million people affected, 2.6 million
people at risk of starvation, up to 70% loss of livestock in some pastoral communities.
2007 Mudslides Taita Taveta County 3 dead
2006 Drought Widespread 3.5 million in need food by September. 40
human lives lost and about 40% cattle, 27% sheep and 17% goats lost
Floods Widespread 7 deaths, 3,500 people displaced
Isiolo 3,000 people displaced
2005 Storm Merti – Isiolo 4,000 people cut-off between Isiolo and
Merti for 7 days
Drought Widespread 2.5 million people close to starvation.
Declared a national disaster
2004 Drought Widespread About 3 million people in need of relief aid
for 8 months to March 2005
Floods/ Land
Slides
Nyeri/Othaya Kihuri 5 people dead
2003 Floods Nyanza/Westen, Tana River Basin 60,000 people affected by severe floods
2002 Landslides Meru Central, Murang’a, Nandi 2,000 affected
Floods Nyanza, Busia, Tana River Basin 150,000 affected
1999-2001 Drought Widespread 4.4 million people affected
1997-98 El Nino Flood Widespread 1.5million people affected
1995/96 Drought Widespread 2 million people affected. Declared a
national disaster
1991-92 Drought Arid and Semi-Arid Districts of North
Eastern, Rift Valley, Eastern and Coast
Provinces
1.5 million people affected
1985 Floods Nyanza/Western 10,000 people affected
1983-84 Drought Widespread 200,000 people affected
1982 Flood Nyanza 4,000 people affected
1980 Drought Widespread 40,000 people affected
Understanding Extreme Climatic Events For Economic Development In Kenya
www.iosrjournals.org 17 | Page
II. Objectives of the study The study sought to examine drought and flood characteristics and their associated impacts on the
major economic activities in Laikipia North and Bunyala sub-counties of Kenya. Specifically the study aimed
at:
(i) Establishing drought and flood characteristics in Laikipia North and Bunyala sub-counties
respectively
(ii) Examining the impacts of droughts and floods on economic activitiesin the study areas
Study area and methodology
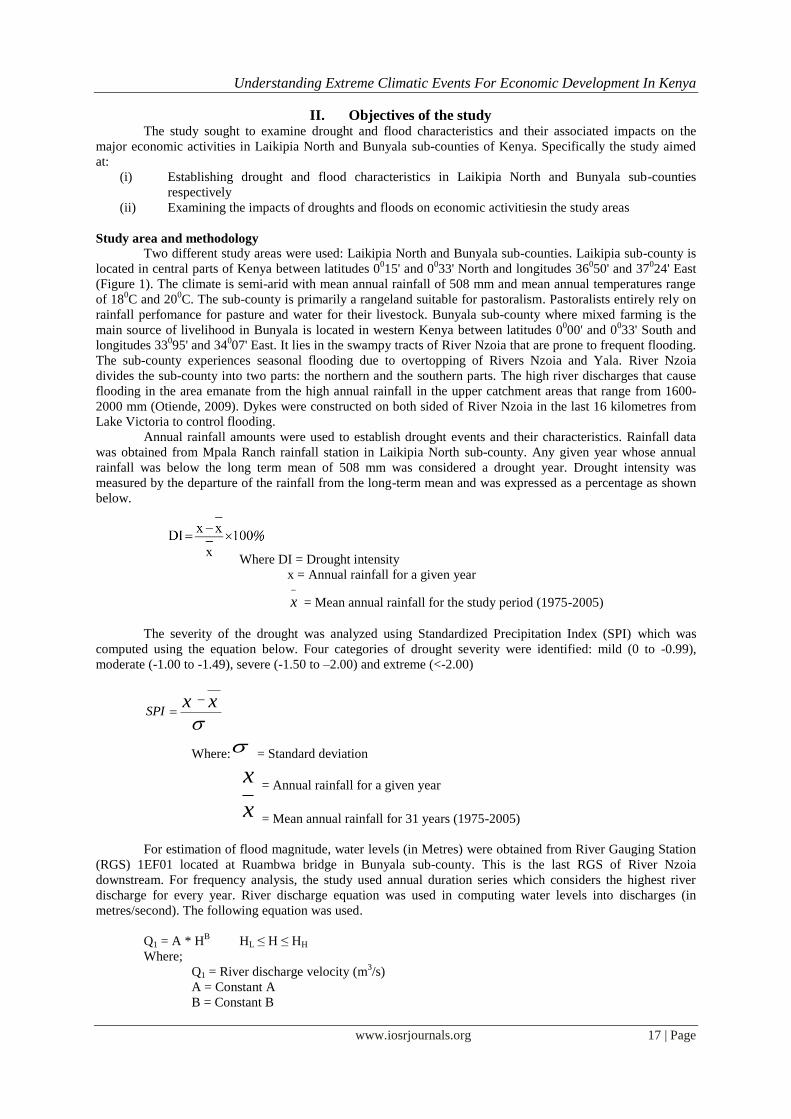
Two different study areas were used: Laikipia North and Bunyala sub-counties. Laikipia sub-county is
located in central parts of Kenya between latitudes 0015' and 0
033' North and longitudes 36
050' and 37
024' East
(Figure 1). The climate is semi-arid with mean annual rainfall of 508 mm and mean annual temperatures range
of 180C and 20
0C. The sub-county is primarily a rangeland suitable for pastoralism. Pastoralists entirely rely on
rainfall perfomance for pasture and water for their livestock. Bunyala sub-county where mixed farming is the
main source of livelihood in Bunyala is located in western Kenya between latitudes 0000' and 0
033' South and
longitudes 33095' and 34
007' East. It lies in the swampy tracts of River Nzoia that are prone to frequent flooding.
The sub-county experiences seasonal flooding due to overtopping of Rivers Nzoia and Yala. River Nzoia
divides the sub-county into two parts: the northern and the southern parts. The high river discharges that cause
flooding in the area emanate from the high annual rainfall in the upper catchment areas that range from 1600-
2000 mm (Otiende, 2009). Dykes were constructed on both sided of River Nzoia in the last 16 kilometres from
Lake Victoria to control flooding.
Annual rainfall amounts were used to establish drought events and their characteristics. Rainfall data
was obtained from Mpala Ranch rainfall station in Laikipia North sub-county. Any given year whose annual
rainfall was below the long term mean of 508 mm was considered a drought year. Drought intensity was
measured by the departure of the rainfall from the long-term mean and was expressed as a percentage as shown
below.
Where DI = Drought intensity
x = Annual rainfall for a given year
x = Mean annual rainfall for the study period (1975-2005)
The severity of the drought was analyzed using Standardized Precipitation Index (SPI) which was
computed using the equation below. Four categories of drought severity were identified: mild (0 to -0.99),
moderate (-1.00 to -1.49), severe (-1.50 to –2.00) and extreme (<-2.00)
xx
SPI
Where: = Standard deviation
x
= Annual rainfall for a given year
x
= Mean annual rainfall for 31 years (1975-2005)
For estimation of flood magnitude, water levels (in Metres) were obtained from River Gauging Station
(RGS) 1EF01 located at Ruambwa bridge in Bunyala sub-county. This is the last RGS of River Nzoia
downstream. For frequency analysis, the study used annual duration series which considers the highest river
discharge for every year. River discharge equation was used in computing water levels into discharges (in
metres/second). The following equation was used.
Q1 = A * HB HL ≤ H ≤ HH
Where;
Q1 = River discharge velocity (m3/s)
A = Constant A
B = Constant B
Understanding Extreme Climatic Events For Economic Development In Kenya
www.iosrjournals.org 18 | Page
H = Water levels
HL = Lowest water levels
HH= Highest water levels
From the equation any discharge of 245.70 cubic metres/ second and above at RGS 1EF01 was
considered as a high flow and would cause flooding in the sub-county. The frequency of reoccurrence for a
given flood magnitude was computed using the recurrence interval equation as shown below.
Where, T = recurrence interval
n = number of years for the period studied
r = rank order of flood magnitudes from the highest to the least
Figure 1: Location of the study areas
III. Results And Discussion Droughts and their impacts in Laikipia North sub-county
The climate of Laikipia North sub-county is influenced by the dry northeast monsoon from the Arabian
continent and the Harmattan air mass from the Sahara desert (Ojany and Ogendo, 1973) and the lee effect of
Mount Kenya. These factors cause dry climatic conditions that pose major challenges to economic development
in the area. For a period of 38 years, 1975 and 2012, the sub-county experienced 22 years of drought, i.e. in
1976, 1980, 1982-85, 1987, 1991-96, 1999-2000, 2002, 2005, 2007-2008 and 2009-2011. More than 75% of the
droughts that occurred in the sub-county were of large spatial extent i.e. they occurred concurrently with
droughts in other parts of Kenya. Such droughts included: the 1980, 1982, 1983, 1984, 1985, 1987, 1991, 1992,
1993, 1994, 1996, 1999, 2000 2005, 2006, 2009 and 2011 droughts. The concurrence of such droughts has been
associated with the El Niño Southern Oscillation (ENSO) phenomenon (Wang’ati, 1996; WWF, 2006) which
cause below normal rainfall in Kenya (Anyamba, et al. 2001). The severity of the impacts caused by such
droughts has in many occasions prompted the Government of Kenya to declare them as national disasters.
Bunyala sub-
county
Understanding Extreme Climatic Events For Economic Development In Kenya
www.iosrjournals.org 19 | Page
Droughts which have been declared as national disasters include the 1984, 1991-92, 1994, 1999-2000, 2005,
2009-2010 and 2011.
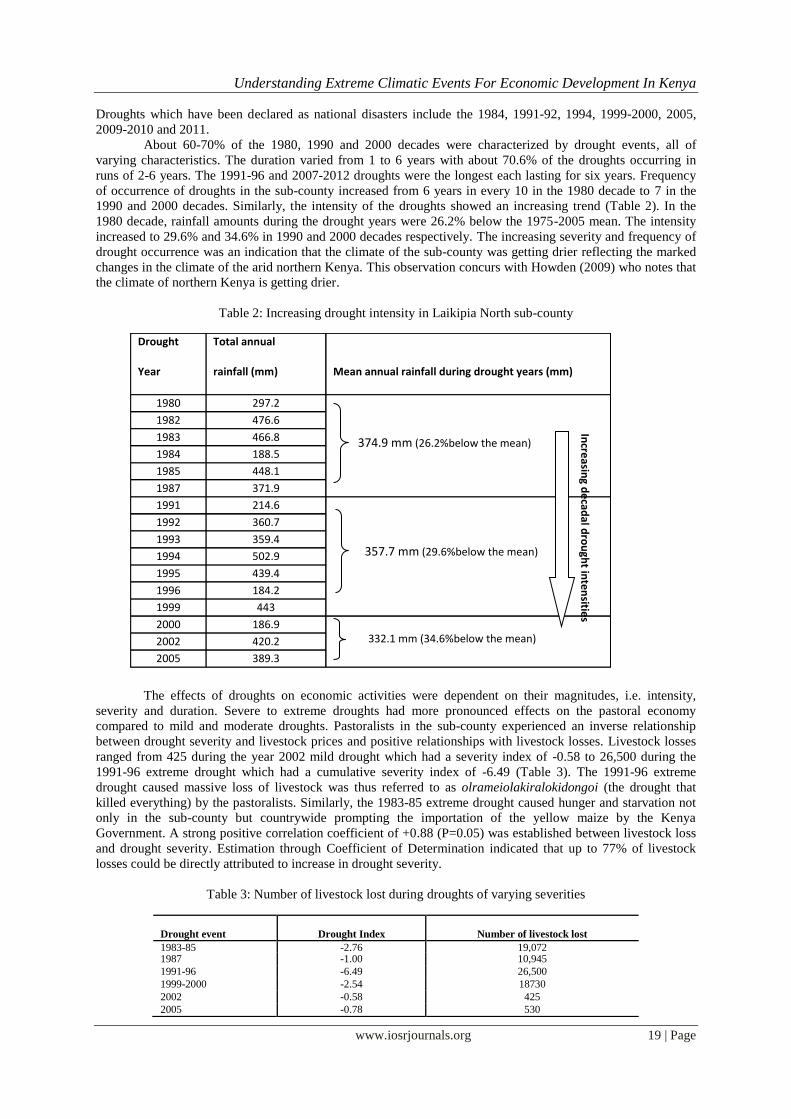
About 60-70% of the 1980, 1990 and 2000 decades were characterized by drought events, all of
varying characteristics. The duration varied from 1 to 6 years with about 70.6% of the droughts occurring in
runs of 2-6 years. The 1991-96 and 2007-2012 droughts were the longest each lasting for six years. Frequency
of occurrence of droughts in the sub-county increased from 6 years in every 10 in the 1980 decade to 7 in the
1990 and 2000 decades. Similarly, the intensity of the droughts showed an increasing trend (Table 2). In the
1980 decade, rainfall amounts during the drought years were 26.2% below the 1975-2005 mean. The intensity
increased to 29.6% and 34.6% in 1990 and 2000 decades respectively. The increasing severity and frequency of
drought occurrence was an indication that the climate of the sub-county was getting drier reflecting the marked
changes in the climate of the arid northern Kenya. This observation concurs with Howden (2009) who notes that
the climate of northern Kenya is getting drier.
Table 2: Increasing drought intensity in Laikipia North sub-county
The effects of droughts on economic activities were dependent on their magnitudes, i.e. intensity,
severity and duration. Severe to extreme droughts had more pronounced effects on the pastoral economy
compared to mild and moderate droughts. Pastoralists in the sub-county experienced an inverse relationship
between drought severity and livestock prices and positive relationships with livestock losses. Livestock losses
ranged from 425 during the year 2002 mild drought which had a severity index of -0.58 to 26,500 during the
1991-96 extreme drought which had a cumulative severity index of -6.49 (Table 3). The 1991-96 extreme
drought caused massive loss of livestock was thus referred to as olrameiolakiralokidongoi (the drought that
killed everything) by the pastoralists. Similarly, the 1983-85 extreme drought caused hunger and starvation not
only in the sub-county but countrywide prompting the importation of the yellow maize by the Kenya
Government. A strong positive correlation coefficient of +0.88 (P=0.05) was established between livestock loss
and drought severity. Estimation through Coefficient of Determination indicated that up to 77% of livestock
losses could be directly attributed to increase in drought severity.
Table 3: Number of livestock lost during droughts of varying severities
Drought event Drought Index Number of livestock lost
1983-85 -2.76 19,072 1987 -1.00 10,945
1991-96 -6.49 26,500
1999-2000 -2.54 18730
2002 -0.58 425
2005 -0.78 530
Drought
Year
Total annual
rainfall (mm) Mean annual rainfall during drought years (mm)
1980 297.2
1982 476.6
1983 466.8
1984 188.5
1985 448.1
1987 371.9
1991 214.6
1992 360.7
1993 359.4
1994 502.9
1995 439.4
1996 184.2
1999 443
2000 186.9
2002 420.2
2005 389.3
Incre
asing d
ecad
al dro
ugh
t inte
nsitie
s
374.9 mm (26.2%below the mean)
357.7 mm (29.6%below the mean)
332.1 mm (34.6%below the mean)
Understanding Extreme Climatic Events For Economic Development In Kenya
www.iosrjournals.org 20 | Page
Livestock prices varied depending on the availability of pasture and water. High prices were fetched
during wet periods but deteriorated with increasing drought severity. Inadequate pasture and lack of water
during droughts led to increased livestock diseases, poor body conditions and low meat and milk productivity
causing low demand for livestock and livestock products. Cattle prices dropped from Kenya Shillings (KShs)
11,000 during the 1992 mild drought to KShs 6,000 during the 1996 extreme drought while sheep and goats
(shoats) prices dropped from KShs 1,425 to KShs 600 over the same period (Table 4). Negative correlation
coefficients of -0.83 for cattle and -0.63 for shoats (P=0.05) were established. About 68.9% and 39.7% decline
in cattle and shoat prices were directly associated with increase in drought severity.
Table 4: Livestock prices during drought of varying severities
During droughts events, shortage of water and pasture sparked conflicts amongst the Maasai
pastoralists living in Laikipia North sub-county and the Samburu and the Kalenjin pastoralists from the
neighbouring Samburu and Baringo Counties as they scrambled for these meager resources. The aftermath was
loss of livestock, human displacement and loss of property and poor market prices. Pastoralists dependent on
each other for livestock market and therefore peaceful coexistence remained critical in determining market
prices. With increasing drought frequency and severity the future of the pastoral economy in the area looks
blink.
Floods and their effects in Bunyala sub-county
The low lying areas of Bunyala sub-county were affected by floods every rainy season. Floods
occurred as a result of overtopping of River Nzoia and increased water levels in Yala swamps, the latter
affecting the southernmost parts of the sub-county. Being located on the flood plains of River Nzoia, high river
discharge triggered by heavy rainfall in the upper catchment areas (Elgon Downs, Kitale, Eldoret and Bungoma
regions) of the river caused flooding in the sub-county. According to Pinter (2010) land-use change, climate
shifts, and engineering activities and structures along the rivers are main causes of increase in frequency,
duration and magnitude of the floods. This is true for Bunyala sub-county as increased river discharge has been
caused by conversion of forested areas into agricultural land, poor engineering works of the dykes which have
contributed to frequent breakages of the dykes at the meandering points and increased rainfall intensity in the
upper catchment areas of Rivers Nzoia and Yala (Action Aid, 2003).
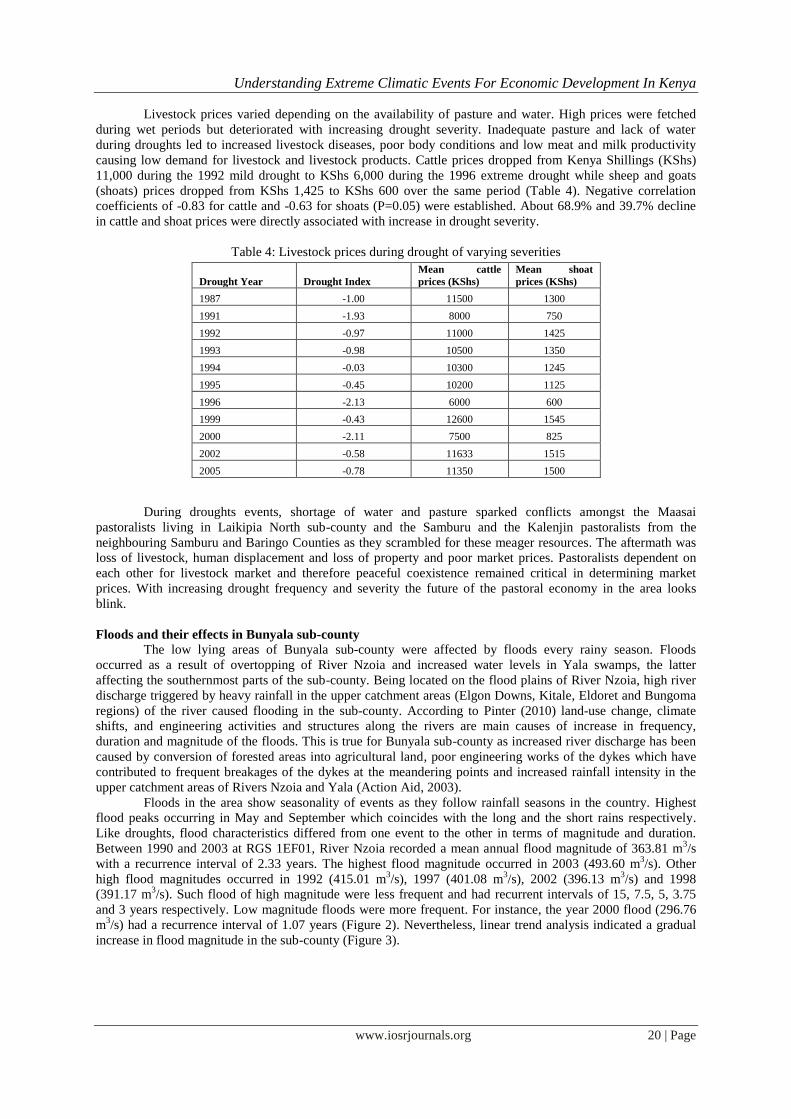
Floods in the area show seasonality of events as they follow rainfall seasons in the country. Highest
flood peaks occurring in May and September which coincides with the long and the short rains respectively.
Like droughts, flood characteristics differed from one event to the other in terms of magnitude and duration.
Between 1990 and 2003 at RGS 1EF01, River Nzoia recorded a mean annual flood magnitude of 363.81 m3/s
with a recurrence interval of 2.33 years. The highest flood magnitude occurred in 2003 (493.60 m3/s). Other
high flood magnitudes occurred in 1992 (415.01 m3/s), 1997 (401.08 m
3/s), 2002 (396.13 m
3/s) and 1998
(391.17 m3/s). Such flood of high magnitude were less frequent and had recurrent intervals of 15, 7.5, 5, 3.75
and 3 years respectively. Low magnitude floods were more frequent. For instance, the year 2000 flood (296.76
m3/s) had a recurrence interval of 1.07 years (Figure 2). Nevertheless, linear trend analysis indicated a gradual
increase in flood magnitude in the sub-county (Figure 3).
Drought Year Drought Index
Mean cattle
prices (KShs)
Mean shoat
prices (KShs)
1987 -1.00 11500 1300
1991 -1.93 8000 750
1992 -0.97 11000 1425
1993 -0.98 10500 1350
1994 -0.03 10300 1245
1995 -0.45 10200 1125
1996 -2.13 6000 600
1999 -0.43 12600 1545
2000 -2.11 7500 825
2002 -0.58 11633 1515
2005 -0.78 11350 1500
Understanding Extreme Climatic Events For Economic Development In Kenya
www.iosrjournals.org 21 | Page
Figure 2: Flood recurrence intervals (1990-2003)
Figure 3: Flood magnitude trend at RGS 1EF01 (1990-2003)
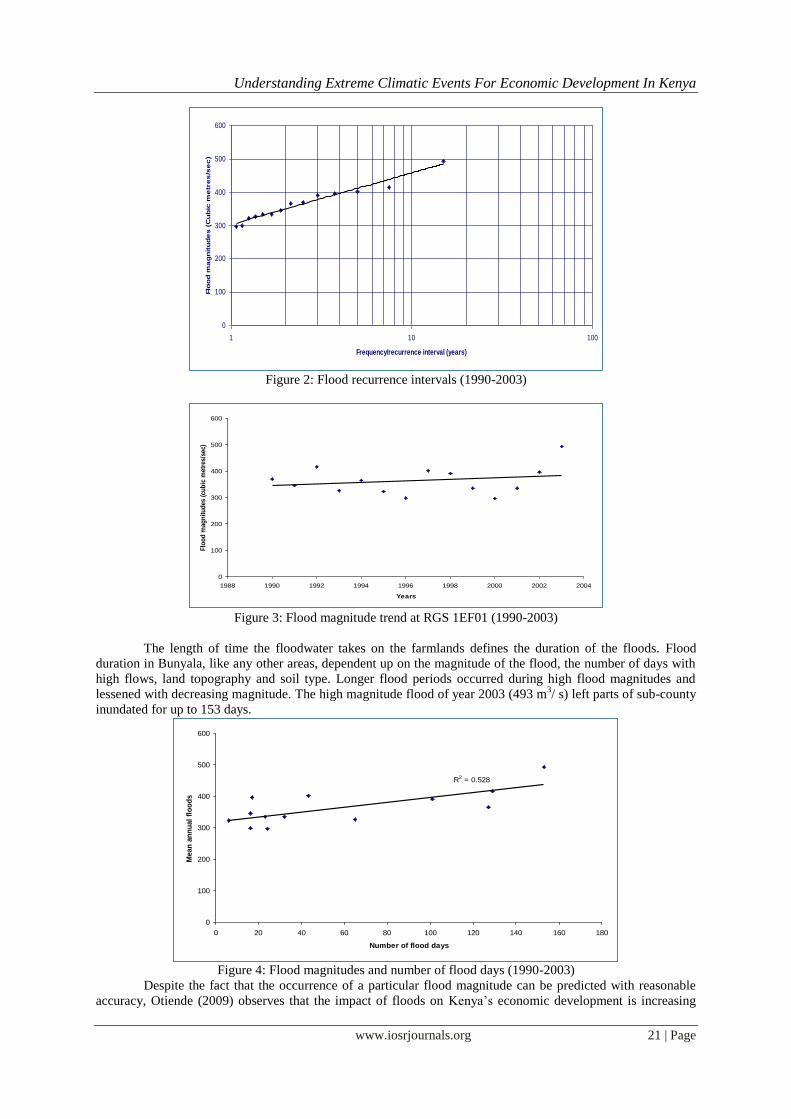
The length of time the floodwater takes on the farmlands defines the duration of the floods. Flood
duration in Bunyala, like any other areas, dependent up on the magnitude of the flood, the number of days with
high flows, land topography and soil type. Longer flood periods occurred during high flood magnitudes and
lessened with decreasing magnitude. The high magnitude flood of year 2003 (493 m3/ s) left parts of sub-county
inundated for up to 153 days.
Figure 4: Flood magnitudes and number of flood days (1990-2003)
Despite the fact that the occurrence of a particular flood magnitude can be predicted with reasonable
accuracy, Otiende (2009) observes that the impact of floods on Kenya’s economic development is increasing
0
100
200
300
400
500
600
1 10 100
Frequency/recurrence interval (years)
Flo
od
ma
gn
itu
de
s (
Cu
bic
me
tre
s/s
ec
)
0
100
200
300
400
500
600
1988 1990 1992 1994 1996 1998 2000 2002 2004
Years
Flo
od
mag
nit
ud
es (
cub
ic m
etre
s/se
c)
R2 = 0.528
0
100
200
300
400
500
600
0 20 40 60 80 100 120 140 160 180
Number of flood days
Mean
an
nu
al
flo
od
s
Understanding Extreme Climatic Events For Economic Development In Kenya
www.iosrjournals.org 22 | Page
and now a major concern for the government. Destruction of property and infrastructure alongside the
displacement of people caused by floods pose the major threat to economic development in Bunyala sub-county.
The consequences had been reduction in family income, decline in production in agricultural sector, business
enterprises, inflation and unemployment. Relief and reconstruction efforts often compete with development
programs for available funds. Like droughts, the amount of flood damage depended on the size of the
magnitude. Analysis of maize, sorghum, beans and cassava yields revealed negative correlations between the
yields and flood magnitudes. Crop yields decreased with increase in flood magnitude. Strong negative
correlation coefficient of -0.8 (P=0.05) was established for maize crop. The high vulnerability to flooding of
was caused by the inability of maize crop to withstand water logged soils and the longer growing periods. Weak
negative correlations coefficients of -0.3, -0.2 and -0.1 were established for sorghum, beans and cassava
respectively. Bean crops were less affected by floods since they are quick maturing crops. Together with the
early planting practice (early March), bean crops escaped flooding which occurred in April and peaked in May.
Sorghum withstands waterlogged soils thus more resistant to floods. However, as floods magnitude increased so
did the effects on the sorghum yields.
Effects of floods on livestock were minimal due to the ability of animals to move on safer grounds.
However, the number of livestock loss increased as flood magnitude increased. Increase in pests and diseases
was rampant during flooding periods as floods provided conducive environment for multiplication of liver
flukes and breeding of tsetse flies. As a consequent, the rate of liver fluke and Trypanasomiasis infections
escalated during flooding periods. The situation hampered the development of daily cattle industry in the area
(GOK, 2002). Other challenges posed by floods included drowning of animals, shortage of pasture due to
inundation and lack of market for livestock and livestock products. For instance, during the 1997-98 floods a pig
was sold at KShs 500 down from KShs1000 in 1996. The number of cattle and sheep lost was higher compared
to that of goats and chicken. Being grazers, inundation of pastures led to inadequate foliage and increase in liver
fluke infections. Whereas cattle and sheep numbers showed negative relationships (r = -0.3 and -0.2
respectively), goat and chicken showed positive relationships (r = +0.2) with flood magnitudes. Time series
analysis showed a gradual increase in the number of chicken and goats in the sub-county (Table 5). Low capital
investment required in the purchase and rearing of chicken after the floods led to increase in their numbers over
time. Similarly, the adaptability of goats to harsh dry climatic conditions on the safer higher ground and the
browsing habit led to increase in their numbers.
Table 5: Number of livestock in Bunyala sub-county between 1991 and 2003 (GoK, 2004)
Fishing, which was the second major income earning activity in the sub-county, was equally affected
by floods. Fish production declined with increasing flood magnitude. Minimum catch were common during
flooding periods due to the following: (i) migration of fish from littoral to pelagic waters that was occasioned by
high contamination of littoral waters by farm chemicals and increased turbidity and, (ii) submersion of the main
fish landing beaches which included Musoma, Mukoma and Osieko by the rising waters of Yala Swamp. This
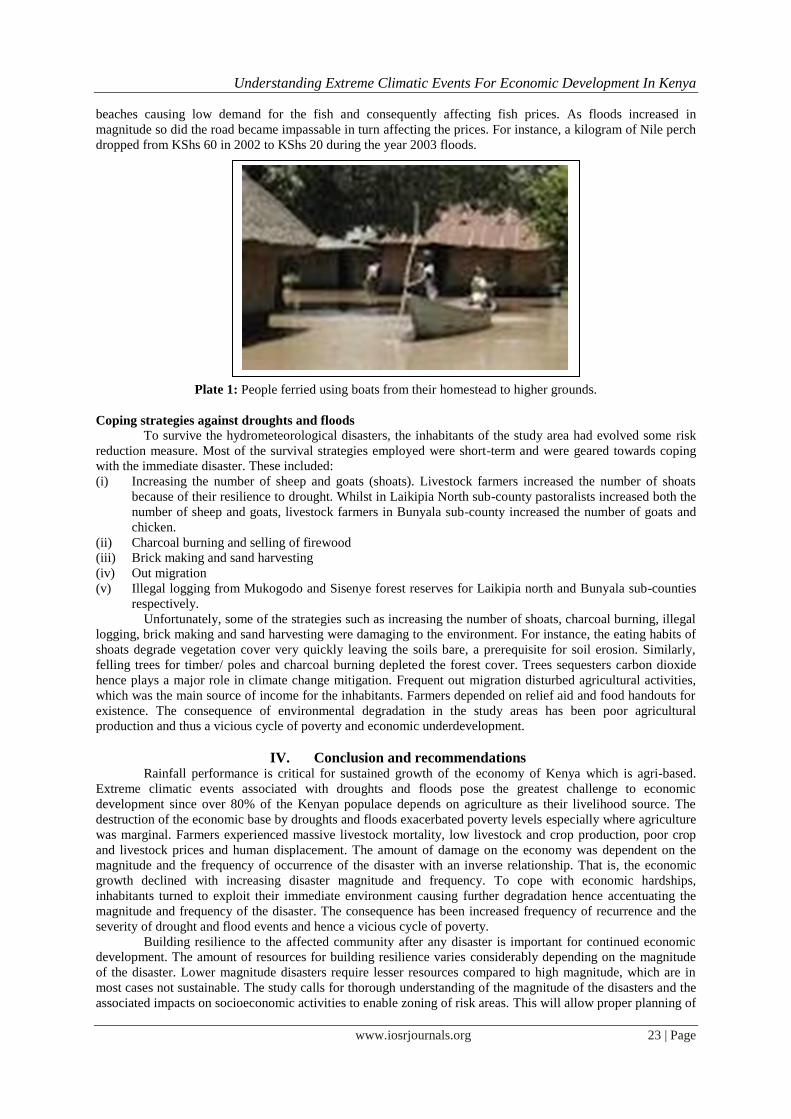
forced some fishermen to stop their fishing activities and engage in boat transport (Plate 1). This observation
confirms Grove (1989) who notes that year-to-year variations in fish production in Africa are dependent on the
size of the seasonal floods. A weak negative correlation of -0.2 was established between fish production and
flood magnitudes. Dilapidated road conditions during floods hindered buyers from accessing the fish landing
Year Flood magnitude
(m3/s)
Number of animals
Cattle Sheep Goats Chicken
1991 346.00 21,840 7,660 12,776 39,230
1992 415.01 25,380 7,780 13,345 44,375
1993 326.58 26,800 7,890 14,050 66,585
1994 365.56 30,380 8,200 13,400 52,720
1995 322.71 30,500 8,850 11,000 37,000
1996 298.67 30,000 9,300 11,600 25,140
1997 401.08 26,000 12,000 18,000 90,000
1998 391.17 22,000 6,000 15,000 56,000
1999 334.33 17,350 4,500 13,400 68,940
2000 296.76 13,400 3,400 10,030 82,640
2001 335.30 9,823 2,704 9,483 77,941
2002 396.13 10,321 3,248 12,572 79,685
2003 493.60 9,400 2,840 10,200 68,000
Understanding Extreme Climatic Events For Economic Development In Kenya
www.iosrjournals.org 23 | Page
beaches causing low demand for the fish and consequently affecting fish prices. As floods increased in
magnitude so did the road became impassable in turn affecting the prices. For instance, a kilogram of Nile perch
dropped from KShs 60 in 2002 to KShs 20 during the year 2003 floods.
Plate 1: People ferried using boats from their homestead to higher grounds.
Coping strategies against droughts and floods
To survive the hydrometeorological disasters, the inhabitants of the study area had evolved some risk
reduction measure. Most of the survival strategies employed were short-term and were geared towards coping
with the immediate disaster. These included:
(i) Increasing the number of sheep and goats (shoats). Livestock farmers increased the number of shoats
because of their resilience to drought. Whilst in Laikipia North sub-county pastoralists increased both the
number of sheep and goats, livestock farmers in Bunyala sub-county increased the number of goats and
chicken.
(ii) Charcoal burning and selling of firewood
(iii) Brick making and sand harvesting
(iv) Out migration
(v) Illegal logging from Mukogodo and Sisenye forest reserves for Laikipia north and Bunyala sub-counties
respectively.
Unfortunately, some of the strategies such as increasing the number of shoats, charcoal burning, illegal
logging, brick making and sand harvesting were damaging to the environment. For instance, the eating habits of
shoats degrade vegetation cover very quickly leaving the soils bare, a prerequisite for soil erosion. Similarly,
felling trees for timber/ poles and charcoal burning depleted the forest cover. Trees sequesters carbon dioxide
hence plays a major role in climate change mitigation. Frequent out migration disturbed agricultural activities,
which was the main source of income for the inhabitants. Farmers depended on relief aid and food handouts for
existence. The consequence of environmental degradation in the study areas has been poor agricultural
production and thus a vicious cycle of poverty and economic underdevelopment.
IV. Conclusion and recommendations Rainfall performance is critical for sustained growth of the economy of Kenya which is agri-based.
Extreme climatic events associated with droughts and floods pose the greatest challenge to economic
development since over 80% of the Kenyan populace depends on agriculture as their livelihood source. The
destruction of the economic base by droughts and floods exacerbated poverty levels especially where agriculture
was marginal. Farmers experienced massive livestock mortality, low livestock and crop production, poor crop
and livestock prices and human displacement. The amount of damage on the economy was dependent on the
magnitude and the frequency of occurrence of the disaster with an inverse relationship. That is, the economic
growth declined with increasing disaster magnitude and frequency. To cope with economic hardships,
inhabitants turned to exploit their immediate environment causing further degradation hence accentuating the
magnitude and frequency of the disaster. The consequence has been increased frequency of recurrence and the
severity of drought and flood events and hence a vicious cycle of poverty.
Building resilience to the affected community after any disaster is important for continued economic
development. The amount of resources for building resilience varies considerably depending on the magnitude
of the disaster. Lower magnitude disasters require lesser resources compared to high magnitude, which are in
most cases not sustainable. The study calls for thorough understanding of the magnitude of the disasters and the
associated impacts on socioeconomic activities to enable zoning of risk areas. This will allow proper planning of
Understanding Extreme Climatic Events For Economic Development In Kenya
www.iosrjournals.org 24 | Page
relief measures and emergency assistance and establishment of disaster mitigation measures. Early warning
systems should be developed and implemented to reduce the losses accruing for the disasters while at the same
time communities should be encouraged to use indigenous knowledge to cope the disasters as this is not only
cost effective but also sustainable.
Reference [1]. Action Aid (2012) East Africa drought. Available online at: http://www.actionaid.org/what-we-do/emergencies-conflict/current-
emergencies/east-africa-drought [2]. Alleyne, R. (2009) Catastrophic Droughts in Africa are the Norm, Claim Scientists. In The Telegraph. Available
at:http://www.telegraph.co.uk/earth/ environment/climatechange/5165168/
[3]. Anyamba, A. Linthicum, K. J. and Tucker, C. J. (2001) Climate-disease connections: Rift Valley Fever in Kenya. Cad. Saúde Pública vol.17 suppl. Rio de Janeiro 2001. doi: 10.1590/S0102-311X2001000700022
[4]. Ayoti O. (2008) Kenya has no policy on drought, Minister confesses. Available:
http://desertificationwordpress.Com/2008/05/29/kenya-has-no-policy-on-drought-google-africa-sciencenews-service/ [5]. Clarke R. (1991) Water: The international crisis. Earthscan Publication, London.
[6]. Cohen, J. M. and Lewis, D. B. (1987) Role of government in combating food shortage: Lessons from Kenya 1984-85. In Glantz, M.
H. (ed) Drought and hunger in Africa. Cambridge University Press, Cambridge. Pp 269-296. [7]. Cohen, S. and Miller K.A. (2001) Climate Change 2001: Impacts, Adaptation, and Vulnerability. Contribution of Working Group II
to the Third Assessment Report of the Intergovernmental Panel on Climate Change. Cambridge: Cambridge University Press.
[8]. Drought Management Centre (2004) Natural hazards: cause and effects. Disaster management Centre, Wisconsin. [9]. Farmer, G. and Wigley, T. M. L. (1985) Climate trends for tropical Africa: A research report for the Overseas Development
Administration. Climatic research unit. University of East Anglia, Norwich GoK (2002) Busia District Development Plan 2002-
2008. Government printers, Nairobi [10]. GoK (2009) National policy for disaster management in Kenya. Ministry of State for Special Programmes, Government printers.
Nairobi [11]. Grünewald, F., Robins, K., Odicoh, A. and Nicholson, N. (2009) Kenya. RTE mission final report
[12]. Houghton J. (1997) Global Warming: The Complete Briefing. Cambridge University Press, Cambridge.
[13]. Howden, D. (2009) The great drought in East Africa; No rainfall for three years. Available at: http://www.infiniteunknown.net/2009/10/03/the-great-drought-in-east-africa-no-rainfall-for-three-years/ gov/fews/africa/index.php
[14]. http://www.chiefscientist.qld.gov.au/publications/understanding-floods/consequences.aspx (2013) What are the consequences of
floods? Downloaded on 15/4/2013. [15]. IRIN (2013) Kenya: Early warning volunteers try to prevent flood misery. Retrieved
fromhttp://www.irinnews.org/report/95351/KENYA-Early-warning-volunteers-try-to-prevent-flood-misery
[16]. KRCS (2012) DROUGHT 2011: How Kenya responded. Retrieved from:
https://www.kenyaredcross.org/PDF/K4K/Drought%202011%20:%20How%20Kenya%20Responded.pdf
[17]. Ojany, R. B. and Ogendo, F. B. (1973) Kenya: A Study in physical and human Geography.Longman group, Nairobi.
[18]. Otiende, B. (2009) The Economic impacts of climate change in Kenya: Riparian flood impacts and cost of adaptation. Available online at: http://static.weadapt.org/knowledge-base/files/758/4e25a4b8c8bf61C-kenya-riparian-floods-case-study.pdf
[19]. Ngaira, J. K. (1999) Environmental impact of rainfall variability in the semi arid areas: a case study of Baringo district, Kenya.
Unpublished PhD thesis, Moi University. [20]. Ngaira, J. K. (2004) Basic facts in contemporary climatology. Lake publishers and enterprises, Kisumu.
[21]. Ngaira, J. K. (2005) Hydrometeorological disasters and their impact on development: The Kenya experience. In Maseno journal of
education, arts and sciences. Vol 5 no 1, Maseno. [22]. Pinter, N. (2010) Fluvial geomorphology and flood hydrology. Southern Illinois University Carbondale.
[23]. Reliefweb (2012) Retrieved from:http://reliefweb.int/disaster/ff-2012-000062-ken
[24]. Reliefweb (2010) Floods affect thousands in Kenya. Retrieved from: http://reliefweb.int/report/kenya/floods-affect-thousands-kenya-06-apr-2010
[25]. UNEP & GOK (2006). Kenya drought: Impacts on agriculture, livestock and wildlife. UNEP, Nairobi.
[26]. Wang’ati, F. J. (1996) Impact of climate variation and sustainable development in the Sudano-Sahelian region. In Ribot, J. C., Magalhaes, A. R. and Panagides, S. S. (eds) Climate variability, climate change and social vulnerability in the Tropics. Cambridge
University Press, Cambridge pg 71-91.
[27]. Wani, S. P., Sreedevi, T. K., Rockstrom, J. and Ramakrishna, Y. S. (2009) Rainfed agriculture: past trends and future prospects. In
Wani, S. P., Rockstrom, J. and Oweis, T. (eds) Rainfed agriculture: Unlocking the potential. CAB international, London, pp 1-36
[28]. WWF (2006) Climate change impacts on east Africa: A review of the scientific literature. WorldWide Fund (WWF), Switzerland.


![Hill Cutting in Sylhet City: A Case Study - IOSR Journalsiosrjournals.org/iosr-jestft/papers/vol6-issue4/B0640612.pdfHill Cutting in Sylhet City: A Case Study ... Code(BNBC 1993).[2]](https://img.pdfslide.net/doc/110x75/5abcf4027f8b9a321b8ea972/hill-cutting-in-sylhet-city-a-case-study-iosr-cutting-in-sylhet-city-a-case.jpg)