Embed Size (px)
Citation preview
Understanding the Gender Gap In STEM Fields Entrepreneurship
by
Margaret E. Blume-Kohout MBK Analytics, LLC
Albuquerque, NM 87109-3367
for
Under contract no. SBAHQ-13-M-0203
Release Date: October 2014
The statements, findings, conclusions, and recommendations found in this study are those of the authors and do not necessarily reflect the views of the Office of Advocacy, the United
States Small Business Administration, or the United States government.
Contents
Executive Summary ............................................................................................................ 1
Acknowledgements ............................................................................................................. 4
Introduction ......................................................................................................................... 5
How do Men and Women Differ in Entrepreneurship? ............................................... 6
About This Report ....................................................................................................... 7
STEM Fields Graduate Enrollment .................................................................................... 9
Enrollment Gaps: Trends in STEM Postsecondary Education .................................. 10
STEM Fields Differ in Relative Commercial Orientation ......................................... 13
Enrollment Gaps, Part II: Within-Field Differences in Research Focus and Intensity Across PhD-Granting Programs ................................................................................ 15
Mentoring Gaps: Differences in Female Faculty Representation across PhD Programs .................................................................................................................... 22
Faculty Research, Consulting and Patenting Activities .................................................... 26
Data Sources .............................................................................................................. 28
Gender Gaps in Faculty Research Focus and Patenting Activities ............................ 31
Gender Gaps in Faculty Engagement with Industry .................................................. 35
Gender Gaps in Academic Faculty’s Institutional Environments ............................. 36
Women in STEM: Innovation and Entrepreneurial Ventures ........................................... 38
What Explains the Gender Gap in STEM PhDs’ Patenting? ..................................... 46
What Explains the Gender Gap in STEM PhDs’ Entrepreneurship? ........................ 49
Seeking Satisfaction: Gender Gaps in Career Preferences? ...................................... 56
Conclusions ....................................................................................................................... 68
References .........................................................................................................................73
i
Figures
Figure 1. Percent of U.S. STEM Fields Doctorates Awarded to Women, by Field and Year, 2003-2012 ............................................................................................. 11
Figure 2. Employment Sector of STEM PhDs, by Field of Degree ................................. 12
Figure 3. U.S. Universities' R&D Expenditures by Funding Source and Field ................ 14
Figure 4. Percentages of Graduate Students Funded by External Private Sector Sources, by Gender and Field ........................................................................................ 17
Figure 5. Share of Total Female Faculty, by Field and Median Program Ranking .......... 23
Figure 6. Percentage Female Faculty, by Field and Median Program Ranking ............... 23
Figure 7. Comparison of Percent Female Faculty and Percent of R&D Expenditures Funded by Industry, Computer Science Departments .................................... 24
Figure 8. University Patents by Broad Technology Category and Application Year, 1980-2007................................................................................................................. 31
Figure 9. Percent of STEM Faculty Members Holding One or More Patents or Invented Software Programs, by Field and Gender, 2004 ............................................. 32
Figure 10. Differences in Research versus Teaching Focus Among Academic Scientists, by Field and Gender ........................................................................................ 34
Figure 11. Entrepreneurial Venturing by Gender and PhD Field ..................................... 40
Figure 12. Gender Differences in Stated Reasons for Changing Employment ................ 58
Figure 13. Health Insurance Coverage and Satisfaction with Job Benefits, by Gender and Employment Type ........................................................................................... 66
ii
Tables
Table 1. Completed PhDs by Field and Gender, 2012 ..................................................... 11
Table 2. Predictors of Female Graduate Student Enrollment Within STEM Fields ......... 20
Table 3. Number of Employees at Firms Founded Less Than 5 Years Ago .................... 39
Table 4. Descriptive Statistics for Survey of Doctorate Recipients Analytic Dataset ...... 45
Table 5. Decomposing the Gender Gap in Patenting among STEM PhDs ...................... 46
Table 6. Decomposing the Gender Gap in STEM Entrepreneurship................................ 51
Table 7. Demographic, Institutional, and Occupational Predictors of STEM PhDs’ Participation in Entrepreneurial Ventures ....................................................... 53
Table 8. Differences in Probability of Participation in Entrepreneurship versus Regular Employment, by Stated Importance of Job Attributes .................................... 63
iii
Executive Summary
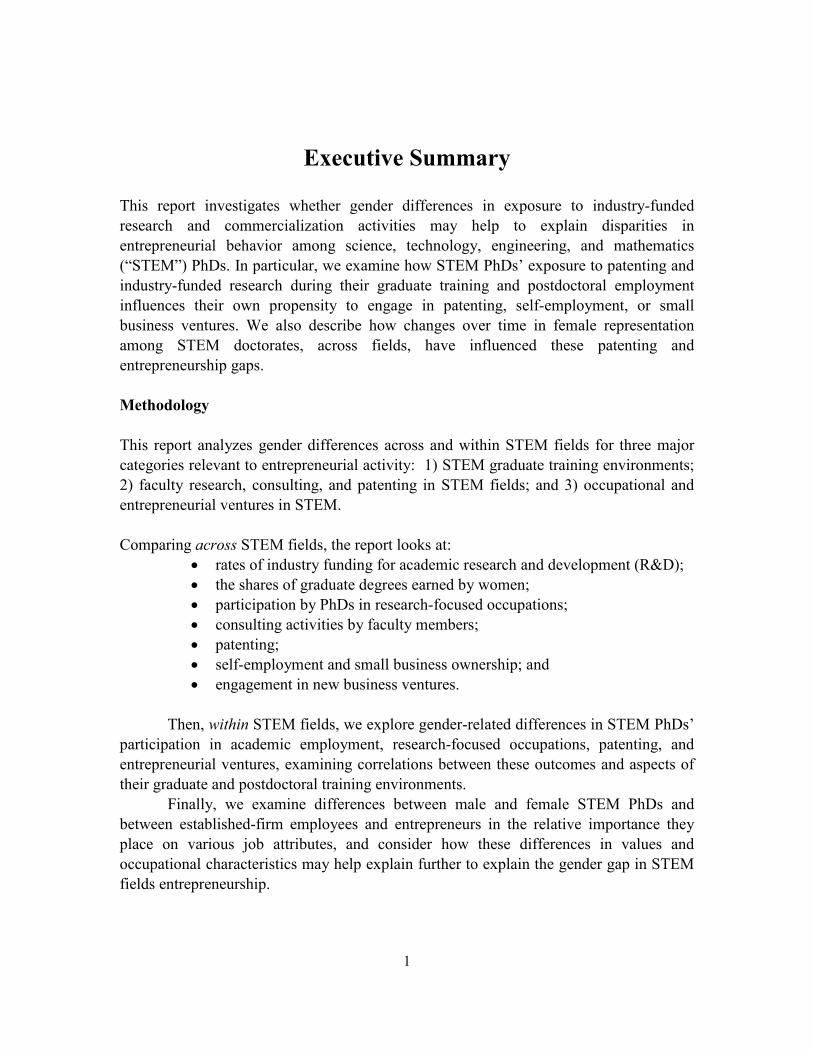
This report investigates whether gender differences in exposure to industry-funded research and commercialization activities may help to explain disparities in entrepreneurial behavior among science, technology, engineering, and mathematics (“STEM”) PhDs. In particular, we examine how STEM PhDs’ exposure to patenting and industry-funded research during their graduate training and postdoctoral employment influences their own propensity to engage in patenting, self-employment, or small business ventures. We also describe how changes over time in female representation among STEM doctorates, across fields, have influenced these patenting and entrepreneurship gaps. Methodology This report analyzes gender differences across and within STEM fields for three major categories relevant to entrepreneurial activity: 1) STEM graduate training environments; 2) faculty research, consulting, and patenting in STEM fields; and 3) occupational and entrepreneurial ventures in STEM. Comparing across STEM fields, the report looks at:
• rates of industry funding for academic research and development (R&D); • the shares of graduate degrees earned by women; • participation by PhDs in research-focused occupations; • consulting activities by faculty members; • patenting; • self-employment and small business ownership; and • engagement in new business ventures.
Then, within STEM fields, we explore gender-related differences in STEM PhDs’
participation in academic employment, research-focused occupations, patenting, and entrepreneurial ventures, examining correlations between these outcomes and aspects of their graduate and postdoctoral training environments.
Finally, we examine differences between male and female STEM PhDs and between established-firm employees and entrepreneurs in the relative importance they place on various job attributes, and consider how these differences in values and occupational characteristics may help explain further to explain the gender gap in STEM fields entrepreneurship.
1
Descriptive statistics and their graphical representations are accompanied by results from multivariate econometric estimations, to better distill and describe the correlates of STEM PhDs’ entrepreneurial behaviors. Data Data for these analyses are primarily derived from several nationally-representative surveys conducted by the U.S. National Science Foundation (NSF) and the U.S. Department of Education, which collect data from individuals who earned PhDs from U.S. institutions, from their graduate departments and programs, and from the PhD-granting institutions that house those programs. Additional data sources include National Research Council (NRC) doctoral program rankings, and patent records from the U.S. Patent and Trademark Office (USPTO).
Key Findings/Observations
The evidence presented here suggests that the gender gap in STEM fields’ entrepreneurship cannot be addressed with a single, monolithic strategy. The underlying issues we observe—and therefore also implications for policy—vary widely across individual STEM fields and disciplines, including gender differences in graduate training environments, employment sector and typical work activities, professional seniority, and the impact of patenting activity on subsequent entrepreneurship.
Gaps in Enrollment. In some fields, female PhDs’ rate of small business ownership approaches that of male PhDs, and the apparent gap in entrepreneurship is mainly attributable to the lower share of women earning PhDs in that field.
Gaps in Female Faculty Mentorship. In other fields, there persists a strong split between typical “male” and “female” work activities—even among individuals who hold PhDs in the same field—such that women more often work in academia than industry, and women faculty members disproportionately work in less research-intensive departments and occupations, often serving as adjunct instructors, lecturers, or teaching faculty.
Gaps in Seniority/Experience. In still other fields, the gender gap in patenting appears to be closing, with research-focused female PhDs present but still concentrated in postdocs and junior faculty positions. Since most fields see higher rates of entrepreneurship and related activities as time since PhD increases, the gender gap in STEM entrepreneurship for these fields may also continue to close as these women gain seniority.
Funding and Training Gaps. In addition to these key differences across fields, we also observe important differences between male and female STEM PhDs in the relative influence or impact of research funding sources in their graduate and postdoctoral training environments, as well as in the role of patenting in spurring subsequent entrepreneurship.
2
Job Satisfaction Priorities. Finally, male and female STEM PhDs tend to differ in the career-related values they espouse, and accordingly in the reasons they give for changing jobs to engage in entrepreneurial ventures. For example, availability of health insurance benefits are significantly more important to female STEM PhDs’ job satisfaction, but as of 2010, entrepreneurial ventures were less likely to offer these benefits. Recent changes in access to health insurance coverage for self-employed individuals and small businesses thus may also help to close the gender gap in STEM fields entrepreneurship.
3
Acknowledgements
MBK Analytics, LLC, gratefully acknowledges superb direction and helpful comments received from Dr. Christine Kymn, as well as savvy editorial assistance from Brooke Nelson in SBA’s Office of Advocacy. MBK Associate Economist Dr. Dennis Barber, III, provided excellent research assistance and analytic support, and we sincerely appreciate contributions from Bern Dealy and John Clack in the initial phase of this project. We also thank our five anonymous peer reviewers for their insightful comments and suggestions on an earlier draft of this report. Finally, development of the university patents dataset used in this report was supported, in part, by the National Science Foundation’s Science of Science and Innovation Policy program, Grant No. 1355279.
4
Introduction
High-growth entrepreneurial firms—that is, small business ventures with higher-than-average growth in jobs, revenues, and wealth creation—are vital to the robustness and resilience of the U.S. economy. Schumpeter (1942) famously argued that innovation is the key to economic change and progress, and that entrepreneurs are the agents of that innovation. More recently, entrepreneurial firms have been credited with contributions to radical or “breakthrough” innovations disproportionate to their share of the nation’s total R&D expenditures, stimulating economic growth through their introduction of new products and processes (Audretsch 1995; Baumol 2004, 2010).
In 2010, U.S. small businesses (i.e., firms with fewer than 500 employees) paid for and performed over 18% of U.S. industry R&D, totaling over $40 billion, and they were also awarded 37% of U.S. industry patents. Small business R&D expenditures included $6.2 billion (12%) of the $51 billion spent by pharmaceutical and medical equipment manufacturers, as well as three-quarters of biotechnology R&D services representing some $2.2 billion in R&D expenditures. (National Science Foundation and National Center for Science and Engineering Statistics 2013). Small businesses also performed a disproportionate share of U.S. industrial R&D in manufacture of computer and electronic products, components, and instruments. In 2012, manufacturers of computer and electronic products contributed value-added of over $272 billion to US GDP (Bureau of Economic Analysis 2014).
Almost 40% of research-active pharmaceutical manufacturers, 51% of medical equipment manufacturers, and 67% of medical device manufacturers say that patents are “very important” to their business. Over 58% of companies providing scientific R&D services also rate patents as “very important,” along with half of research-active manufacturers of computer and electronic products, components, devices, and instruments (National Science Foundation and National Center for Science and Engineering Statistics 2013). Small businesses engaged in these high-tech, science-based industries thus may be particular contributors to their sectors’ overall innovative capacity.
In addition to their R&D investments, small businesses also employed some 382,000 R&D scientists, engineers, and technicians, representing 31% of the industrial research workforce. Numerous empirical studies have also found that new businesses account for a significantly larger share of U.S. job creation than established firms.1
Although most science-based entrepreneurial firms do not achieve high-growth status themselves, even those that do not often still contribute significant knowledge
1 See Braunerhjelm (2011) for a review and summary of this literature.
5
spillovers to users and firms, well beyond any returns the entrepreneurs capture for themselves (Colombo, Mustar, and Wright 2010).
How do Men and Women Differ in Entrepreneurship?
Women-owned businesses (WOBs) have typically and historically lagged behind male-owned businesses on a variety of traditional economic performance measures, including their use of external financial capital, growth in revenues and income (Morris et al. 2006; Brush et al. 2003). In 2007, over 88% of majority WOBs had no paid employees, versus 78% across all U.S. firms (author’s calculation, SBO data).
Explanations for these gaps are wide-ranging. Early literature focused on gender differences in human capital—both educational attainment and work experience—noting that women were less likely to pursue degrees in STEM fields, and were also less likely to have received training in business and management (Hisrich and Brush 1984).
More recent studies have attributed WOBs’ lower overall capitalization and slower growth in revenues and employment to structural and sectoral differences in the industries women entrepreneurs choose to enter (Carter and Allen 1997; Watson 2003). WOBs are also 32% more likely to be in retail consumer products and services, compared to majority male-owned businesses (Kelley et al. 2012).
Even in high-technology industries, women are more likely to found firms providing research and consulting services, which may be less scalable than sectors where WOBs are less represented, like semiconductor and aerospace manufacturing, navigational instruments, or communications equipment (Mayer 2006). Moreover, high-tech WOBs are less often located in geographic regions where they can take advantage of regional clustering of highly skilled labor, knowledge spillovers, and so on (Mayer 2006).
Recent studies have explicitly cautioned against presuming that factors conducive to entrepreneurship in the broader economy will also be conducive to entrepreneurship in STEM fields (Aldridge and Audretsch 2011; Goethner et al. 2012). Similar caution should be observed when generalizing results from surveys of the overall population or in different industry sectors, comparing women versus men in their attitudes, preferences, and entrepreneurial activities.
With these concerns fully in mind, we note a substantial literature has documented women’s lower preference for being self-employed. For example, analyzing survey data collected for 8,000 individuals across 29 countries, Verheul et al. (2012) find evidence to support the hypotheses that women are, on average, less risk-tolerant, and that more risk-tolerant individuals are more likely to express a preference for self-employment over regular wage employment. College-educated women in the United States may also perceive lack of competency as a greater barrier to entrepreneurship than do similarly-educated U.S. men (Shinnar, Giacomin, and Janssen 2012).
However, conditional on the individual’s viewing self-employment as preferable to regular employment, Verheul et al. (2012) find no evidence of differences between
6
men and women in their actually becoming self-employed: “women and men who are inclined to start up their own firms do not differ with respect to the impact of this preference on its materialization.”
Coleman and Robb’s (2012a) analysis of Kauffman Firm Survey data tell a somewhat different story, focusing only on young firms. Among firms founded in 2004, after four years the surviving WOBs had significantly lower growth in sales revenue than their male-owned peers, consistent with others’ earlier findings. However, among these surviving firms, the authors found there was no significant difference in jobs growth for male- versus women-owned businesses, after controlling for differences in financial capital at start-up, as well as various owner and firm characteristics including whether it was a home-based business.
About This Report
Given the apparent importance of science-based, innovative entrepreneurship to the nation’s economic growth discussed above, policymakers should be concerned by any evidence of structural or perceptual barriers that may preclude or discourage talented individuals from participating.
Fritsch (2011) argues that—though there exist well-known examples of innovative firms founded by individuals who eschewed higher education—typical founders of high-tech ventures are well-educated, and often hold academic degrees in natural sciences and engineering fields. Yet, even among STEM PhDs, significant gender differences remain in both their propensity to patent and their propensity to engage in entrepreneurship, whether as small business owners or as employees of these new ventures. The question, then, is: What explains these gaps?
Recent evidence indicates that gender disparities in high-growth STEM fields entrepreneurship may be attributable to a combination of women’s lower rates of postsecondary STEM degrees, a typically greater focus on teaching (and higher representation at teaching-focused institutions) among female STEM academic faculty, and women’s overall lower propensity towards self-employment. However, when women do decide to engage in STEM-based entrepreneurship, we should not a priori expect any difference in their ventures’ survival rates, jobs growth, or revenues.
Substantial research and advocacy effort has focused on reasons for (and potential solutions to) gender gaps in STEM higher education enrollments, retention, and completions. We do not reiterate those efforts here. Instead, this report focuses on identifying the relative importance of the other reasons prior literature suggests contribute to differences across individuals in their rates of innovation and entrepreneurship. For example, graduate training environments, postdoctoral training, and subsequent employment sectors and occupational activities among completed STEM PhDs may differentially influence male and female scientists’ innovative activities and entry into entrepreneurship. Our results presented in the final chapter of this report decompose the
7
contributions of these various reasons to the continuing gender gaps in patenting and entrepreneurship.
From a social welfare perspective, it is important also to distinguish between individuals’ sovereign preferences and personal values that should be respected, versus evidence suggestive of perceptual, practical, or structural barriers that might be appropriate targets for policy intervention. Encouraging women’s participation in science-based, innovative entrepreneurship is good for society only to the extent that it promotes economic growth and employment, while giving women more options for satisfying and meaningful work.
Whittington and Doerr (2008) argued that women scientists in academic settings may be marginalized relative to their male colleagues, whereas those working in more flexible, small science-based innovative firms that emphasize collaboration and teamwork may be more productive than those in more hierarchical organizations. They found that scientists of both genders working in science-based entrepreneurial biotechnology firms are equally likely to patent, and conclude that participation in such firms may provide “a more equalizing environment for women scientists.” If this productivity effect holds across other STEM fields, then encouraging women’s participation in entrepreneurial ventures more broadly—whether as owners, or as employees in entrepreneurial ventures—may be beneficial for innovation-driven economic growth.
Building on this notion, in this report we consider male and female STEM PhDs’ participation in entrepreneurial ventures broadly, to include: (a) unincorporated, non-employer self-employment; (b) incorporated self-employment or small business ownership; or (c) employment in a new venture that was founded within the past five years, and that has fewer than 100 employees.
Finally, rational and well-informed women scientists offered similar opportunities and support might still choose less often than similarly-educated men to pursue entrepreneurship. In the final section of this report, we explore differences by gender in the reasons that scientists choose to change employers, including their decisions to enter self-employment, found a company, or become employees in entrepreneurial ventures. Understanding gender-correlated differences in personal values and priorities as they relate to job satisfaction nuances our understanding of female scientists’ participation in innovation in entrepreneurship, and also suggests additional avenues for policymakers and entrepreneurial firms to consider in attracting female talent.
8
STEM Fields Graduate Enrollment
In this chapter, we explore gender differences across and within STEM fields in higher education enrollments, faculty employment, and faculty members’ participation in research, consulting, and patenting activities. These descriptive differences across STEM fields provide a framework for understanding how differences in field-specific human capital may contribute to the overall gender gap in STEM fields entrepreneurship.
Although women are more likely than men in the United States to attend college and complete bachelor’s degrees, in many STEM fields women remain substantially underrepresented both in STEM graduate programs and in the scientific workforce. If successful high-growth start-ups require specific academic training in relevant STEM fields as Coleman and Robb (2012b) suggest, then the smaller fraction of women graduating with bachelor’s and higher degrees in many STEM fields could thus pose a human capital resource-based constraint. Key Findings:
• Civil engineering, materials science, bioengineering, and mechanical engineering PhDs are more likely than PhDs from other STEM fields to engage in entrepreneurship.
• Industry sources fund a higher percentage of universities’ mechanical engineering research, versus any other R&D field.
• Mathematics and statistics, agricultural sciences, and earth/environmental sciences have the lowest rates of industry-funded university R&D, as well as the lowest rates of entrepreneurship among PhDs.
• Male graduate students in materials science, chemical engineering and agricultural or earth/environmental sciences are more likely than female students in those fields to receive financial support from industry.
• Female graduate students in chemical engineering and mechanical engineering more often enroll in programs with no industry-funded R&D.
• In fields with the lowest representation of women among recent PhDs, female graduate students preferentially attend programs with higher percentages of female faculty.
• Among faculty in PhD-granting departments, female faculty are proportionally represented in top-ranked chemistry and chemical engineering departments.
• Female computer science faculty are more often found in lower-ranked departments, but with higher shares of industry R&D funding.
9
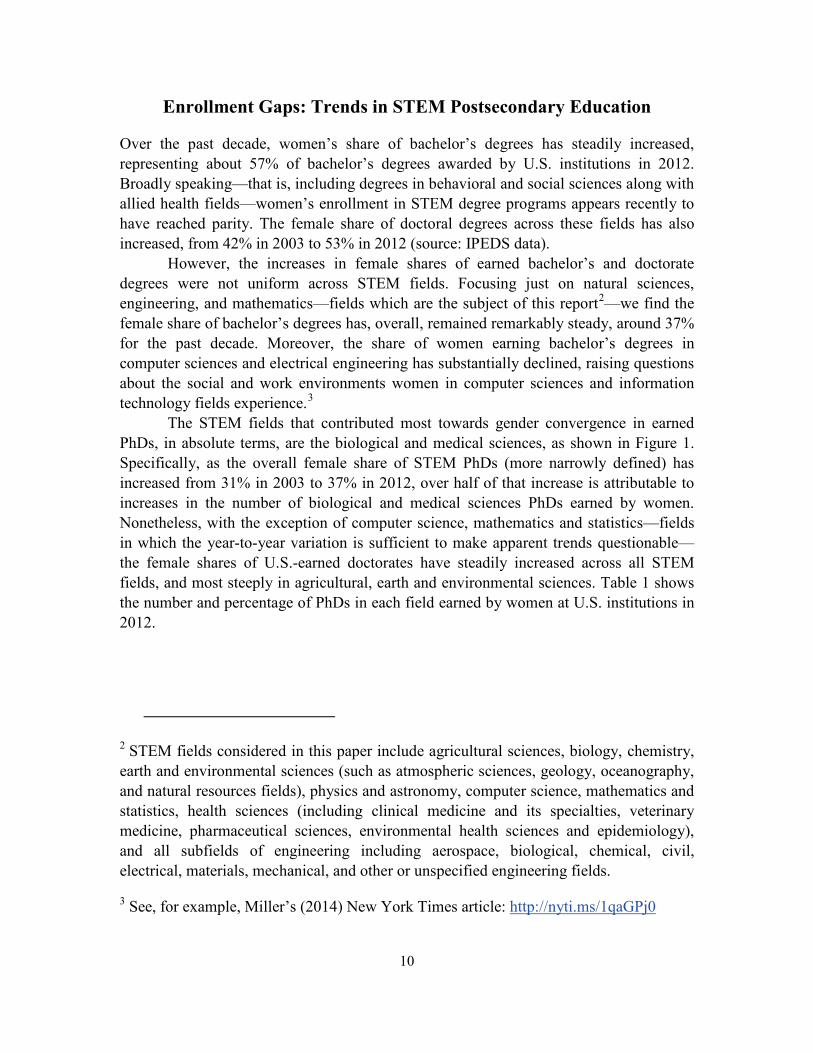
Enrollment Gaps: Trends in STEM Postsecondary Education
Over the past decade, women’s share of bachelor’s degrees has steadily increased, representing about 57% of bachelor’s degrees awarded by U.S. institutions in 2012. Broadly speaking—that is, including degrees in behavioral and social sciences along with allied health fields—women’s enrollment in STEM degree programs appears recently to have reached parity. The female share of doctoral degrees across these fields has also increased, from 42% in 2003 to 53% in 2012 (source: IPEDS data).
However, the increases in female shares of earned bachelor’s and doctorate degrees were not uniform across STEM fields. Focusing just on natural sciences, engineering, and mathematics—fields which are the subject of this report2—we find the female share of bachelor’s degrees has, overall, remained remarkably steady, around 37% for the past decade. Moreover, the share of women earning bachelor’s degrees in computer sciences and electrical engineering has substantially declined, raising questions about the social and work environments women in computer sciences and information technology fields experience.3
The STEM fields that contributed most towards gender convergence in earned PhDs, in absolute terms, are the biological and medical sciences, as shown in Figure 1. Specifically, as the overall female share of STEM PhDs (more narrowly defined) has increased from 31% in 2003 to 37% in 2012, over half of that increase is attributable to increases in the number of biological and medical sciences PhDs earned by women. Nonetheless, with the exception of computer science, mathematics and statistics—fields in which the year-to-year variation is sufficient to make apparent trends questionable—the female shares of U.S.-earned doctorates have steadily increased across all STEM fields, and most steeply in agricultural, earth and environmental sciences. Table 1 shows the number and percentage of PhDs in each field earned by women at U.S. institutions in 2012.
2 STEM fields considered in this paper include agricultural sciences, biology, chemistry, earth and environmental sciences (such as atmospheric sciences, geology, oceanography, and natural resources fields), physics and astronomy, computer science, mathematics and statistics, health sciences (including clinical medicine and its specialties, veterinary medicine, pharmaceutical sciences, environmental health sciences and epidemiology), and all subfields of engineering including aerospace, biological, chemical, civil, electrical, materials, mechanical, and other or unspecified engineering fields.
3 See, for example, Miller’s (2014) New York Times article: http://nyti.ms/1qaGPj0
10
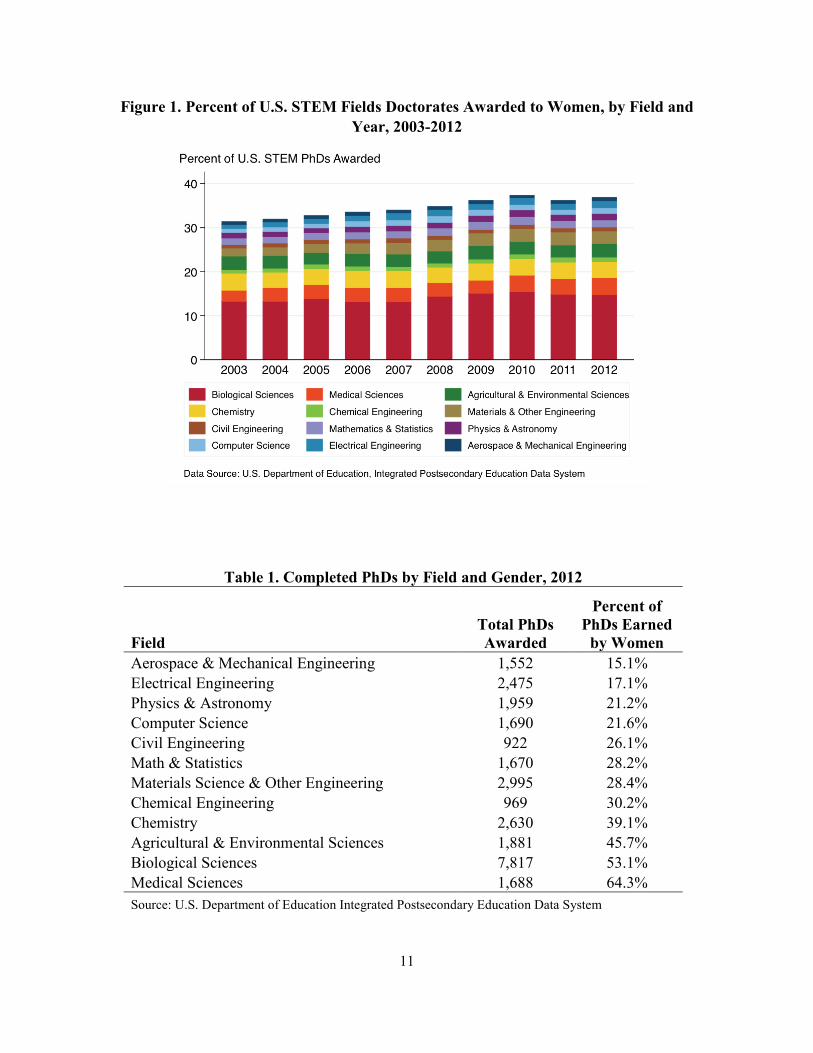
Figure 1. Percent of U.S. STEM Fields Doctorates Awarded to Women, by Field and Year, 2003-2012
Table 1. Completed PhDs by Field and Gender, 2012
Field Total PhDs Awarded
Percent of PhDs Earned
by Women Aerospace & Mechanical Engineering 1,552 15.1% Electrical Engineering 2,475 17.1% Physics & Astronomy 1,959 21.2% Computer Science 1,690 21.6% Civil Engineering 922 26.1% Math & Statistics 1,670 28.2% Materials Science & Other Engineering 2,995 28.4% Chemical Engineering 969 30.2% Chemistry 2,630 39.1% Agricultural & Environmental Sciences 1,881 45.7% Biological Sciences 7,817 53.1% Medical Sciences 1,688 64.3% Source: U.S. Department of Education Integrated Postsecondary Education Data System
11
If graduates across all STEM disciplines had equal propensity towards high-tech and science-based entrepreneurship, then perhaps the overall increase in women’s participation in STEM degree programs would bode well for longer-run trends in women’s participation in entrepreneurial ventures.
But in fact, substantial differences also exist across fields in graduates’ propensity to engage in entrepreneurship. Figure 2 depicts these differences.
Figure 2. Employment Sector of STEM PhDs, by Field of Degree
12
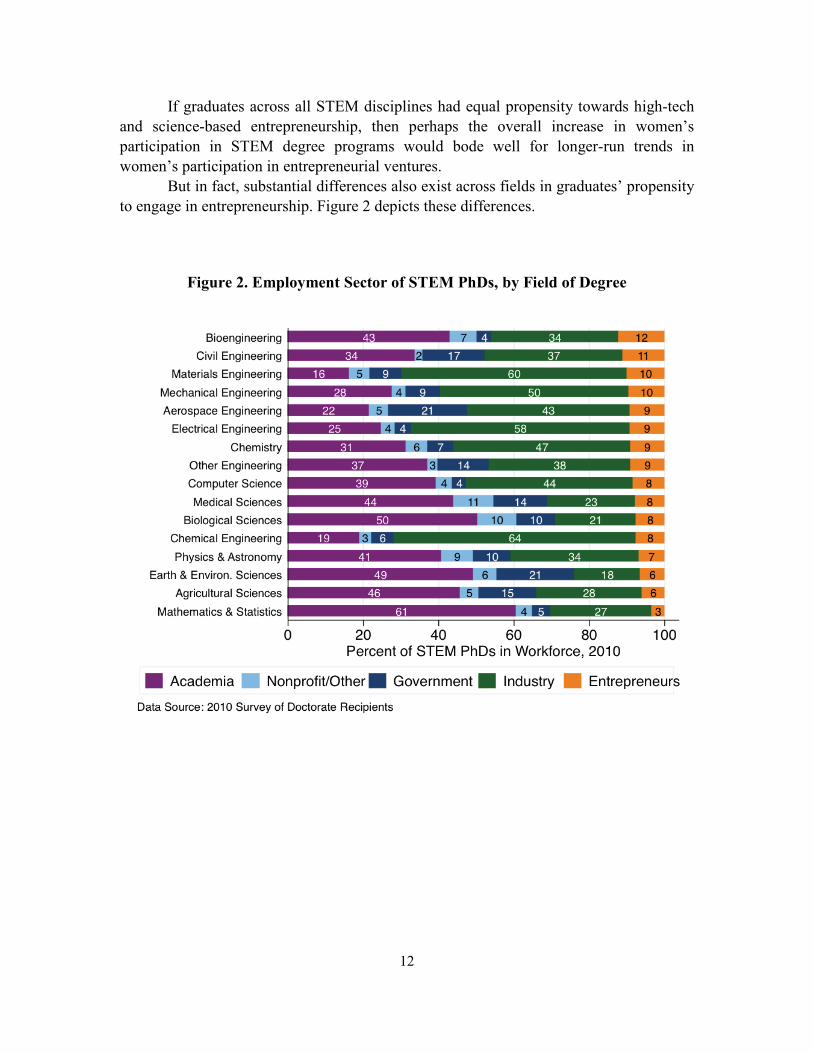
In particular, PhDs in biological and medical sciences—fields in which well over half of U.S. PhDs are now earned by women—have lower rates of entrepreneurial venturing than PhDs in chemistry and engineering fields. Likewise, although computer science and information technology industry fields dominate high-tech startups, their founders and scientific leaders rarely hold PhDs in computer science, and correspondingly we see relatively low rates of entry into entrepreneurship4 among PhDs in computer science, math and statistics.
The relative increase in women’s attainment of computer science, mathematics, and statistics PhDs over the past decade seems unlikely to spur higher participation by those same women in computer science and information technology entrepreneurship. In general, as Figure 2 shows, PhDs who hold degrees in engineering fields are more likely to engage in entrepreneurship than those in other scientific disciplines. The recent increases we observe in women earning doctorates in chemical engineering, materials science, and other engineering fields (including biomedical engineering) may thus be more pertinent to forecasting future trends.
Although the more applied nature of most engineering fields may attract individuals with greater economic or commercial orientation, it is also possible that the graduate training environment for PhD scientists and engineers might influence their subsequent career paths. Students who have opportunities to work on industry-sponsored research projects, and who observe their faculty mentors doing so, may be more comfortable and familiar with identifying commercial applications for their research. To explore this possibility, the next section compares rates of industry-funded university R&D across STEM fields.
STEM Fields Differ in Relative Commercial Orientation
In this section, we compare rates of industry-funded university R&D across STEM fields, and examine whether female graduate students and female faculty members are more or less common in departments with greater commercial focus. For our empirical analysis, we extracted data on U.S. universities’ total and industry-funded R&D expenditures by detailed STEM field from the NSF Higher Education Research and Development (HERD) Survey, for fiscal years 2010, 2011, and 2012.
4 As we discuss in a later section, in Figure 2 we define participation in entrepreneurship to include self-employment or small business ownership for firms with fewer than 500 employers, as well as employment in a private sector firm that was founded within the past five years, and has fewer than 100 employees.
13
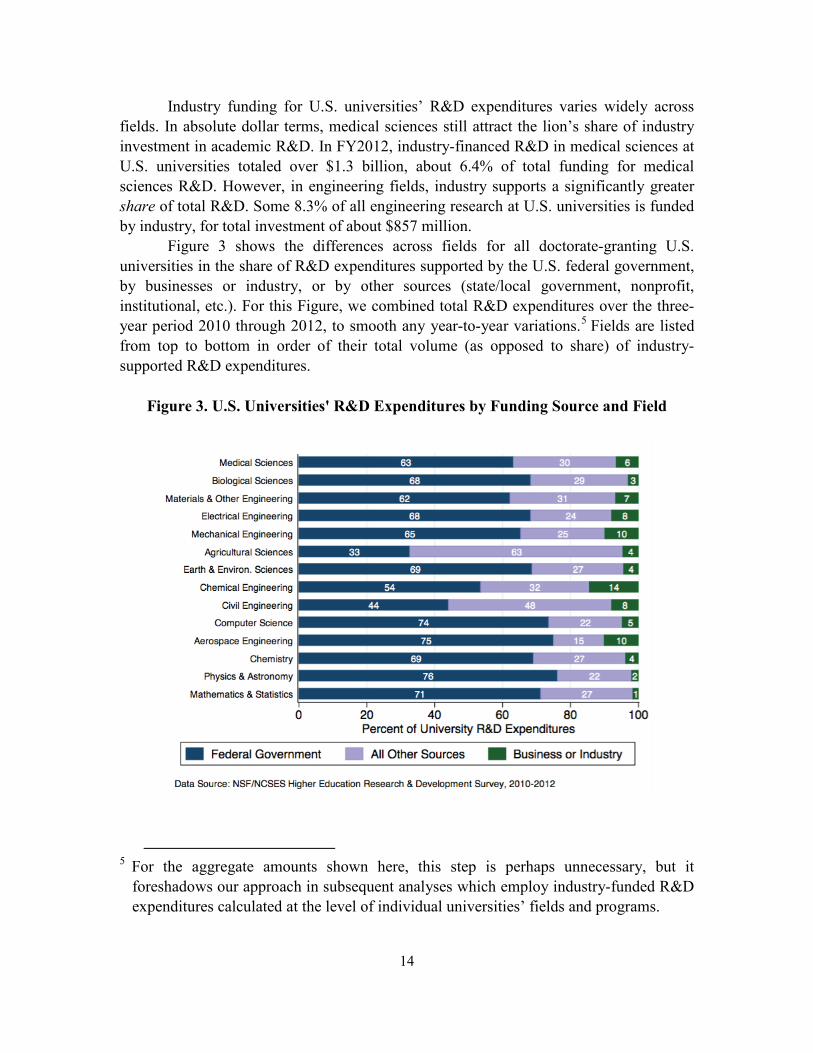
Industry funding for U.S. universities’ R&D expenditures varies widely across fields. In absolute dollar terms, medical sciences still attract the lion’s share of industry investment in academic R&D. In FY2012, industry-financed R&D in medical sciences at U.S. universities totaled over $1.3 billion, about 6.4% of total funding for medical sciences R&D. However, in engineering fields, industry supports a significantly greater share of total R&D. Some 8.3% of all engineering research at U.S. universities is funded by industry, for total investment of about $857 million.
Figure 3 shows the differences across fields for all doctorate-granting U.S. universities in the share of R&D expenditures supported by the U.S. federal government, by businesses or industry, or by other sources (state/local government, nonprofit, institutional, etc.). For this Figure, we combined total R&D expenditures over the three-year period 2010 through 2012, to smooth any year-to-year variations.5 Fields are listed from top to bottom in order of their total volume (as opposed to share) of industry-supported R&D expenditures.
Figure 3. U.S. Universities' R&D Expenditures by Funding Source and Field
5 For the aggregate amounts shown here, this step is perhaps unnecessary, but it foreshadows our approach in subsequent analyses which employ industry-funded R&D expenditures calculated at the level of individual universities’ fields and programs.
14
Even within engineering fields, we observe some correlation between industry-funded share of R&D at PhD-granting departments and PhDs’ entrepreneurial venturing. For example, mechanical engineering has the second-highest share of R&D funding from industry (10%), and likewise has a high rate of entrepreneurship among PhDs (10%).
In contrast, the relatively low rates of industry-funded R&D in agricultural, earth and environmental sciences (4%), and in mathematics and statistics (1%) are also consistent with the relatively lower rates of entrepreneurship among PhDs in these fields. One outlier, however, is among PhDs in physics and astronomy. Among all STEM fields, physics and astronomy together have the second-lowest level of industry-funded R&D (2%). Nonetheless, PhDs in these fields engage in entrepreneurship at higher than expected rates (6.8%), albeit with a fairly substantial gender gap.
Based on our analyses in the final section of this report, it seems this discrepancy may partly be explained by physics PhDs’ significantly higher tendency to work in occupations that they say are completely unrelated to their degrees, especially when engaging in entrepreneurship. Some 16.5% of physics PhDs in our analytic dataset mentioned this, compared to 8.5% of STEM PhDs overall.
On the other hand, even though universities’ materials science and “other engineering” researchers (which, in this survey, historically also included bioengineering) have relatively lower shares of their R&D funded by industry than those in all other engineering fields listed in Figure 3, PhD engineers in this former group have very high rates of entrepreneurship. This correlation is intriguing, as it also corresponds to a relatively higher share of government investment in those engineering subfields, as compared to other subfields in engineering.
Enrollment Gaps, Part II: Within-Field Differences in Research Focus and Intensity Across PhD-Granting Programs
The gender gap in STEM fields entrepreneurship is partly explained by differences across STEM fields in their industry or commercial focus, and women’s relatively lower share of degrees awarded in the most commercially-focused STEM disciplines. However, we also considered that, within a given STEM field, graduate departments and programs may also differ in their research intensity and relative commercial focus. If female graduate students preferentially enroll in less commercially-focused programs, then that disparity in enrollment and their graduate training environment might also help to explain the gender gap we observe in graduates’ subsequent entrepreneurship.
To address this question, we began by merging HERD R&D expenditures data with graduate student enrollment data from the NSF-NIH Survey of Graduate Students and Postdoctorates in Science and Engineering (GSS), described below. Using these combined data, we investigated whether departments that have a higher share of graduate students funded by external private sector sources are housed in universities that have
15
relatively higher shares of R&D funded by industry, for the corresponding disciplines or fields. Then, we asked whether female STEM PhD students systematically and disproportionately attend programs with fewer opportunities for industry-focused research support.
Data Sources
GSS data are collected from graduate-degree-granting departments and programs at U.S. universities, and include counts of full-time graduate students enrolled, by gender and by primary source of financial support. For this analysis, we extracted survey responses by institution and standardized detailed academic field for years 2010 and 2011, the two most recent years available. The survey-specific GSS “Source of Support” variable includes indicators for specific federal agencies, other federal sources, institutional support (includes state or local government investment and philanthropic donations), self-support (includes loans, personal resources, and family contributions), foreign (non-U.S.) sources of support, and finally “Other U.S. Source.”
Excluding the other specified categories above, “Other U.S. Source” thus includes only funding from industry, nonprofit organizations, or direct support from U.S. individuals outside of one’s own family. Unfortunately, we cannot explicitly determine from the GSS data how many graduate students with this source of support receive their funding from industry sources versus, for example, nonprofit organizations. We therefore begin by demonstrating the strong correlation between departments’ respective shares of industry-funded R&D, and their shares of students supported by these external private sector sources.
Descriptive statistics calculated on the GSS data are provided in Figure 4. As one might expect given the relatively higher rates of industry-funded R&D expenditures across engineering subfields versus the sciences, graduate students in engineering more often receive their primary financial support from industry or other external, private sector sources. In many fields, the relative shares of male versus female students relying on external private sector funding sources do not significantly differ.
However, there are some notable exceptions. Male students appear disproportionately to rely on (and thus potentially may gain greater exposure to) funding from commercially focused research in agricultural, earth and environmental sciences, chemical engineering, materials science, and other engineering fields. In contrast, women in mathematics and statistics graduate programs are actually more likely than men to receive funding from industry and nonprofit sources.
16
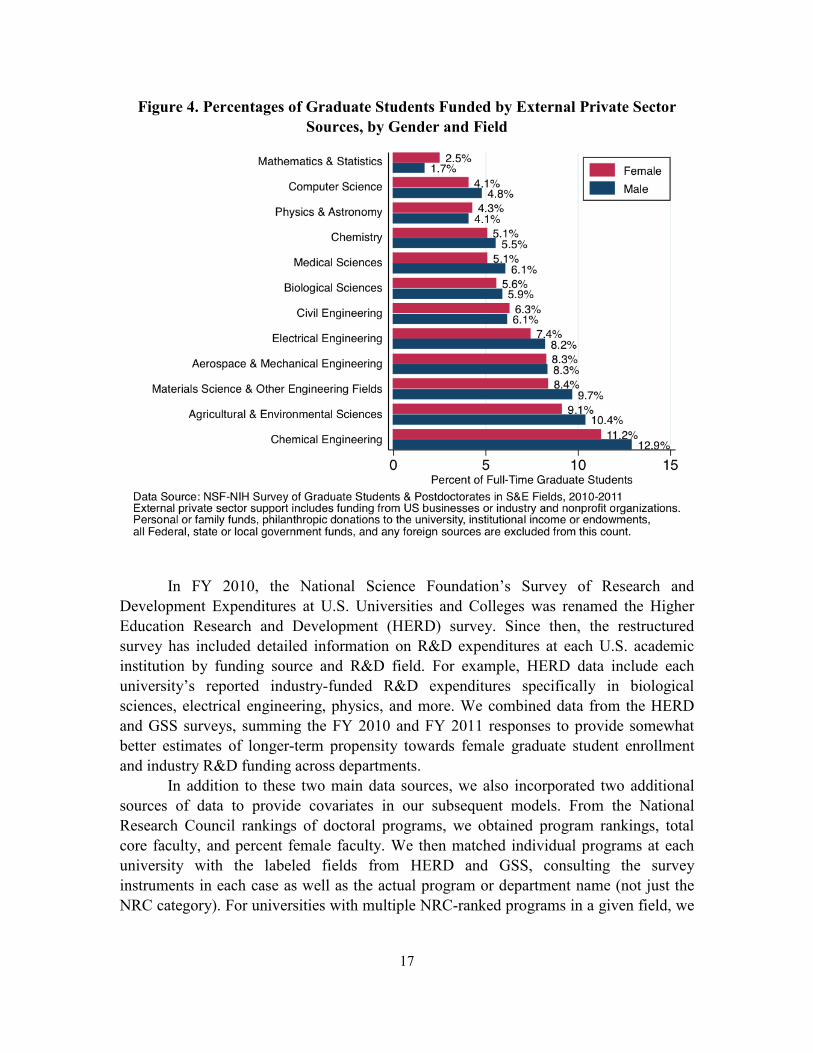
Figure 4. Percentages of Graduate Students Funded by External Private Sector Sources, by Gender and Field
In FY 2010, the National Science Foundation’s Survey of Research and
Development Expenditures at U.S. Universities and Colleges was renamed the Higher Education Research and Development (HERD) survey. Since then, the restructured survey has included detailed information on R&D expenditures at each U.S. academic institution by funding source and R&D field. For example, HERD data include each university’s reported industry-funded R&D expenditures specifically in biological sciences, electrical engineering, physics, and more. We combined data from the HERD and GSS surveys, summing the FY 2010 and FY 2011 responses to provide somewhat better estimates of longer-term propensity towards female graduate student enrollment and industry R&D funding across departments.
In addition to these two main data sources, we also incorporated two additional sources of data to provide covariates in our subsequent models. From the National Research Council rankings of doctoral programs, we obtained program rankings, total core faculty, and percent female faculty. We then matched individual programs at each university with the labeled fields from HERD and GSS, consulting the survey instruments in each case as well as the actual program or department name (not just the NRC category). For universities with multiple NRC-ranked programs in a given field, we
17
aggregated those programs and calculated a weighted average percent female faculty, with the total faculty count for each program serving as the weight. Then, because rankings are provided within NRC fields, we first converted all individual NRC-ranked program rankings into percentile ranks, coding the percentiles by quintile (top 20%, second 20%, etc.). Finally, when aggregating across NRC fields for merge with the HERD and GSS detailed fields, we generated two summary rank variables, representing respectively the (weighted) average quintile ranking across any aggregated programs, and the median quintile rank.
To complete our analytic dataset, we merged in counts of bachelor’s degrees awarded by university and STEM field, obtained from the U.S. Department of Education’s Integrated Postsecondary Education System (IPEDS). We use these counts to construct a ratio of undergraduate degrees awarded to graduate students enrolled, which we use as a proxy for the undergraduate teaching focus of the department.
Empirical Results
We began by estimating a linear regression model, with the outcome variable the female share of full-time graduate students in a given program. We controlled for differences across STEM fields in their average rates of women’s participation with field-specific fixed effects. We also control for other unobserved differences across universities in their attractiveness to (and recruitment of) female students with university fixed effects.6
In addition to examining the relationship between female graduate students’ enrollment and the share of students in the department or program with external private sector support, we also investigated relevance of four additional factors: whether the university has any industry-funded R&D in the department/program’s field, the department/program’s relative undergraduate or teaching focus, the department/program’s percentage of faculty who are female, and the department/program’s relative NRC ranking among PhD-granting programs in its field.
We allow for nonlinearity in the relationship between industry R&D funding and share of female students, by including a binary indicator variable that takes on value 1 if the department has no industry R&D funding, and 0 otherwise. This addition was in recognition that departments with no industry R&D funding whatsoever may be qualitatively different in its research focus and graduate training experience, compared to a department that has already obtained such funding. Mathematically, we suspect the difference between $0 and $200,000 may be a more dramatic change than, say, a
6 Hausman test rejects null hypothesis of no systematic differences across universities, p<.02, precluding use of a random effects model.
18
department that experiences a similar $200,000 increase in its industry-funded R&D support, from $1.8 million to $2.0 million.
Then, as described above, we added a covariate to proxy for the program or department’s relative focus on undergraduate versus graduate education. Using IPEDS counts of the number of Bachelor’s degrees awarded by university and field, we calculated the ratio of Bachelor’s degrees to full-time graduate students. We use full-time graduate students rather than completed PhDs in the denominator, for consistency with our outcome variable.
Third, we considered that, all else equal, prospective female graduate students might be more attracted to programs with a higher share of female faculty. To test this, we included estimates of the percent female faculty obtained from the NRC rankings data, described above.
Finally, previous research has shown that university characteristics—for example, Carnegie classification, or private versus public control—may be correlated with private sector investment in university R&D (Blume-Kohout, Kumar, and Sood 2014). Along these lines, we investigate whether the NRC ranking influences female student enrollment.
Results for this model are presented in Table 2.
19
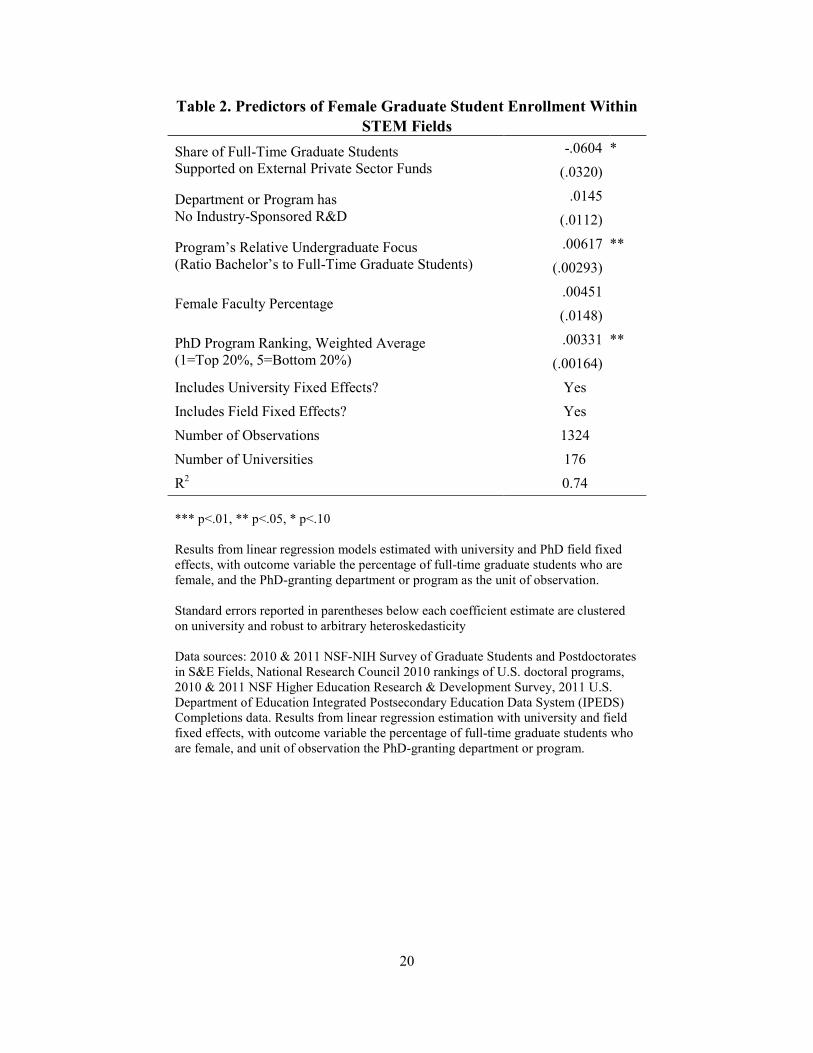
Table 2. Predictors of Female Graduate Student Enrollment Within STEM Fields
Share of Full-Time Graduate Students Supported on External Private Sector Funds
-.0604 * (.0320)
Department or Program has No Industry-Sponsored R&D
.0145 (.0112)
Program’s Relative Undergraduate Focus (Ratio Bachelor’s to Full-Time Graduate Students)
.00617 ** (.00293)
Female Faculty Percentage .00451 (.0148)
PhD Program Ranking, Weighted Average (1=Top 20%, 5=Bottom 20%)
.00331 ** (.00164)
Includes University Fixed Effects? Yes Includes Field Fixed Effects? Yes Number of Observations 1324 Number of Universities 176 R2 0.74 *** p<.01, ** p<.05, * p<.10 Results from linear regression models estimated with university and PhD field fixed effects, with outcome variable the percentage of full-time graduate students who are female, and the PhD-granting department or program as the unit of observation. Standard errors reported in parentheses below each coefficient estimate are clustered on university and robust to arbitrary heteroskedasticity Data sources: 2010 & 2011 NSF-NIH Survey of Graduate Students and Postdoctorates in S&E Fields, National Research Council 2010 rankings of U.S. doctoral programs, 2010 & 2011 NSF Higher Education Research & Development Survey, 2011 U.S. Department of Education Integrated Postsecondary Education Data System (IPEDS) Completions data. Results from linear regression estimation with university and field fixed effects, with outcome variable the percentage of full-time graduate students who are female, and unit of observation the PhD-granting department or program.
20
Across all STEM fields, we find that female graduate students disproportionately enrolled in departments or programs with lower shares of graduate students funded by external private sector sources (business, industry, or nonprofits). Female STEM graduate students also tend to enroll in lower-ranked departments or programs with relatively larger numbers of undergraduates, which may indicate greater teaching focus as part of their graduate training.
In contrast, averaging across all STEM fields, we did not find evidence of any systematic relationship between female graduate students’ enrollment across departments and either total absence of industry R&D funding, or percentage of faculty in the department or program who are female. We suspected, however, that overall tendencies across the STEM fields might obscure important differences between fields. So, in addition to the general model presented in Table 2, we also estimated a fully-saturated model (not shown) that included field-specific interaction terms for each of the explanatory variables noted above.
This fully-saturated model revealed some additional, significant differences. First, we found that female graduate students in chemical engineering and mechanical engineering enrolled at higher rates in graduate departments or programs with no industry-funded R&D.7 On the other hand, female graduate students in computer science, mathematics and statistics are no less likely than male students to enroll in programs with higher levels of external private sector funding for students. Although female graduate students do tend, overall, to enroll in programs with relatively larger undergraduate programs, this is especially significant in biology and electrical engineering, and the opposite is true in civil and environmental engineering.
Interestingly, the importance of women faculty members to attracting female graduate student enrollment appears to be correlated with fields’ overall representation of women at the PhD level. In aerospace, mechanical, and electrical engineering—fields with the lowest representation of women PhDs, as shown in Table 1—as well as in computer science, mathematics, and statistics, female graduate students disproportionately enroll in departments with higher shares of female faculty. Female graduate students are also significantly more likely to enroll in lower-ranked departments in these fields—particularly mechanical engineering—whereas female graduate students in biology are equally represented at all program tiers.
7 Due to differences across the HERD and GSS datasets in how these data are collected, the more precise interpretation of this result is: PhD-granting departments and programs that are housed in universities which performed no industry-funded R&D in those fields tended also to enroll a higher percentage of women among their full-time graduate students.
21
Taken together, these results suggest the possibility that a lack of female faculty mentors at top-tier, research-focused institutions may be contributing to a structural gender disparity in STEM PhDs’ training. In the next section, we investigate gender differences in faculty employment to shed additional light on this issue. If female graduate students preferentially enroll in lower-ranked departments with a higher proportion of female faculty, and if those female faculty members carry relatively higher teaching responsibilities and spend relatively less time on research and consulting activities, then female graduate students’ subsequent careers may also be more heavily weighted towards academia and specifically teaching-related activities in those fields.
Mentoring Gaps: Differences in Female Faculty Representation across PhD Programs
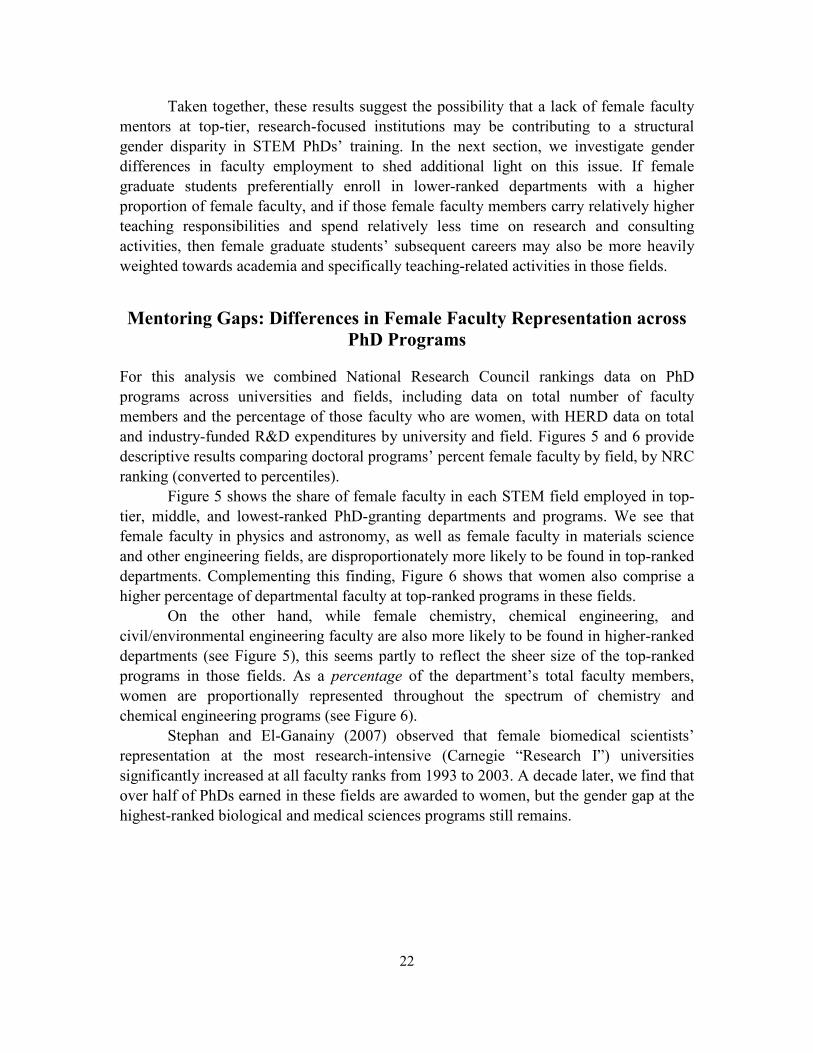
For this analysis we combined National Research Council rankings data on PhD programs across universities and fields, including data on total number of faculty members and the percentage of those faculty who are women, with HERD data on total and industry-funded R&D expenditures by university and field. Figures 5 and 6 provide descriptive results comparing doctoral programs’ percent female faculty by field, by NRC ranking (converted to percentiles).
Figure 5 shows the share of female faculty in each STEM field employed in top-tier, middle, and lowest-ranked PhD-granting departments and programs. We see that female faculty in physics and astronomy, as well as female faculty in materials science and other engineering fields, are disproportionately more likely to be found in top-ranked departments. Complementing this finding, Figure 6 shows that women also comprise a higher percentage of departmental faculty at top-ranked programs in these fields.
On the other hand, while female chemistry, chemical engineering, and civil/environmental engineering faculty are also more likely to be found in higher-ranked departments (see Figure 5), this seems partly to reflect the sheer size of the top-ranked programs in those fields. As a percentage of the department’s total faculty members, women are proportionally represented throughout the spectrum of chemistry and chemical engineering programs (see Figure 6).
Stephan and El-Ganainy (2007) observed that female biomedical scientists’ representation at the most research-intensive (Carnegie “Research I”) universities significantly increased at all faculty ranks from 1993 to 2003. A decade later, we find that over half of PhDs earned in these fields are awarded to women, but the gender gap at the highest-ranked biological and medical sciences programs still remains.
22
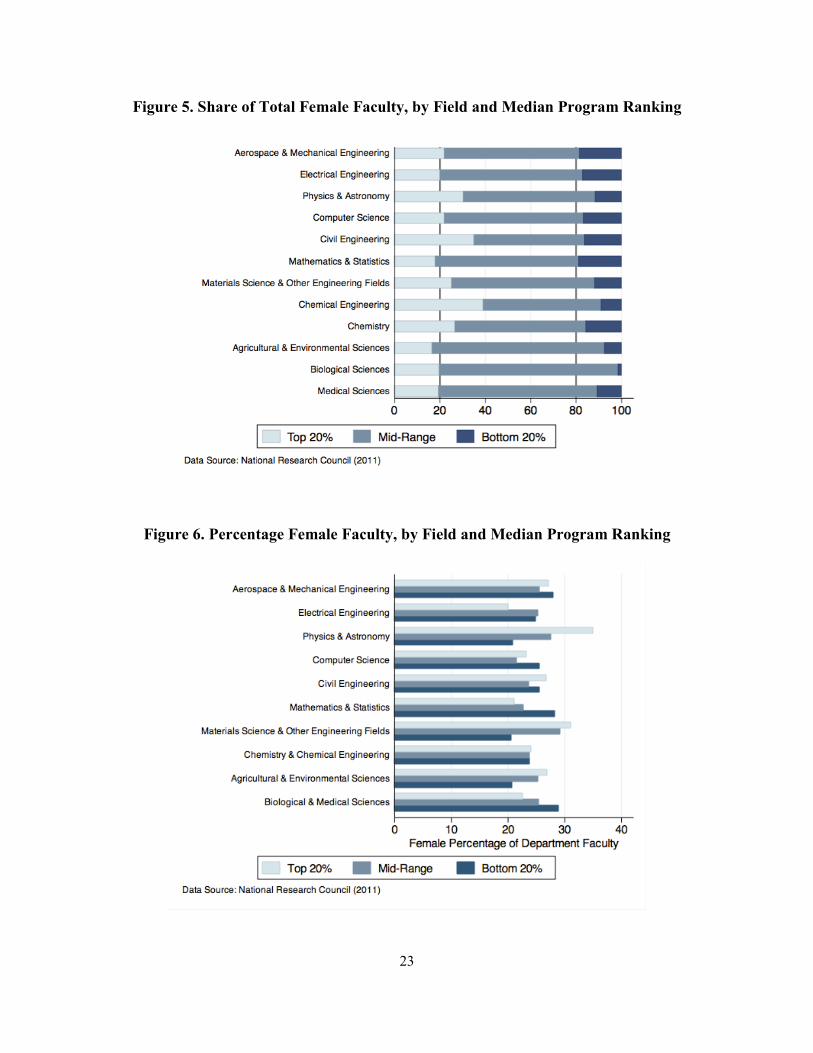
Figure 5. Share of Total Female Faculty, by Field and Median Program Ranking
Figure 6. Percentage Female Faculty, by Field and Median Program Ranking
23
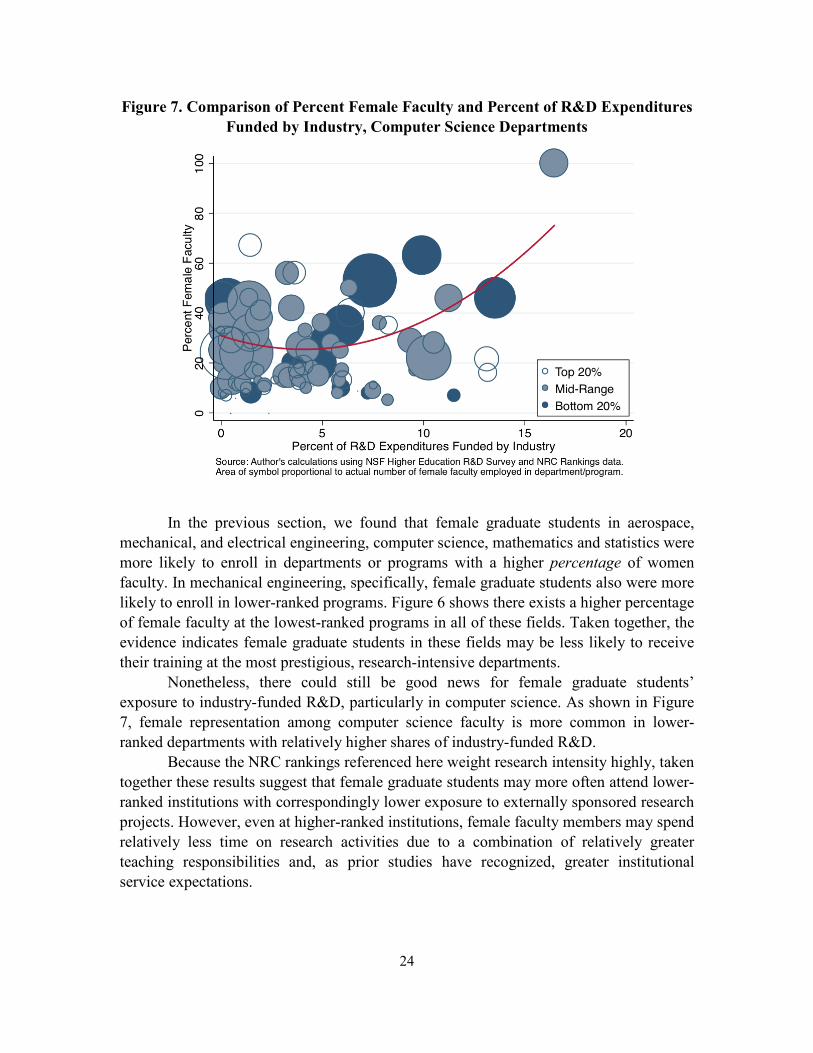
Figure 7. Comparison of Percent Female Faculty and Percent of R&D Expenditures Funded by Industry, Computer Science Departments
In the previous section, we found that female graduate students in aerospace,
mechanical, and electrical engineering, computer science, mathematics and statistics were more likely to enroll in departments or programs with a higher percentage of women faculty. In mechanical engineering, specifically, female graduate students also were more likely to enroll in lower-ranked programs. Figure 6 shows there exists a higher percentage of female faculty at the lowest-ranked programs in all of these fields. Taken together, the evidence indicates female graduate students in these fields may be less likely to receive their training at the most prestigious, research-intensive departments.
Nonetheless, there could still be good news for female graduate students’ exposure to industry-funded R&D, particularly in computer science. As shown in Figure 7, female representation among computer science faculty is more common in lower-ranked departments with relatively higher shares of industry-funded R&D.
Because the NRC rankings referenced here weight research intensity highly, taken together these results suggest that female graduate students may more often attend lower-ranked institutions with correspondingly lower exposure to externally sponsored research projects. However, even at higher-ranked institutions, female faculty members may spend relatively less time on research activities due to a combination of relatively greater teaching responsibilities and, as prior studies have recognized, greater institutional service expectations.
24

The next chapter investigates potential differences across STEM fields in female faculty members’ activities, to provide insight into the behaviors modeled for their graduate students.
25
Faculty Research, Consulting and Patenting Activities
In this chapter, we describe differences by gender and across fields in academic faculty members’ research, consulting, and patenting activities. These descriptive differences help us further understand how graduate training environments differ for male versus female PhD students, due to gender-correlated differences they may observe in faculty members’ activities.
Overall, we find that fields with relatively high growth in female representation among junior academic researchers—for example, postdocs, non-tenure-track research faculty, and research-focused tenure-track faculty—tend to have substantially lower gender disparities in academics’ recent patenting activities. Key Findings:
• Female faculty members in physics, astronomy, computer science, mathematics and statistics report spending significantly less time on research, compared with male faculty in the same disciplines.
• Only 1 in 3 female faculty in physics and astronomy identified R&D as their primary work activity, versus over half of male faculty in these fields.
• More than half (56%) of female faculty in mathematics and statistics focus solely on teaching.
• Across most engineering fields, there is no significant difference in male and female faculty members’ average time spent on research.
• However, the gender gap in patenting among electrical engineering faculty remains substantially larger than for other engineering fields.
• Female faculty in chemistry and chemical engineering average significantly higher percentages of time spent on research, compared with male faculty, and have higher rates of patenting than female faculty in other STEM fields.
• Female representation among research-focused faculty in biological sciences and medicine continues to increase, with no significant difference by gender in the share who said their primary work activity is R&D.
• Ratios of ever-patenting among male versus female faculty in biological sciences, chemistry and chemical engineering have closed to less than 2:1.
Extant literature provides a wealth of evidence regarding the correlates and outcomes
of STEM faculty members’ participation in a variety of commercially-oriented activities, including (but not limited to) faculty participation in industry-sponsored or -contracted research, consulting, patenting, and licensing or commercialization of technologies. Perkmann et al. (2013) recently provided a systematic review of this literature; here, we highlight only a few key findings most relevant to our current study.
Prior literature indicates that approximately 1 in 5 research faculty at U.S. research-intensive universities have received industry funding and/or consulted to
26
industry (Bozeman and Gaughan 2007). Even informal ‘academic engagement’ with industry can provide established firms with valuable knowledge and resources for innovation (Cohen, Nelson, and Walsh 2002). However, by many measures, male academics are significantly more likely than female academics to participate in these various pathways. For example, women scientists, especially those in academia, are significantly less likely than men to patent, overall (Stephan and El-Ganainy 2007; Ding, Murray, and Stuart 2006; Thursby and Thursby 2005).
Seniority is generally positively correlated with industry engagement as well, perhaps in part because senior researchers have had more time to grow broad professional networks, with potentially more opportunities for routine interaction or collaboration with industry (Perkmann et al. 2013). However, Ding et al.’s (2006) interviews with academic life scientists revealed that few women scientists had significant industry contacts, while male scientists “often described an industry contact as a precursor to patenting.”
Although many researchers have found academics’ engagement with industry is more common in applied fields like engineering, some studies suggest the specific pathways chosen for engaging industry may significantly differ by scientific discipline. For example, Perkmann et al. (2013) note, patenting and licensing are relatively uncommon in computer science, but these pathways are among the primary channels for knowledge transfer in biomedical engineering, chemical engineering, and materials science. By contrast, medical scientists are more likely to engage in collaborative research efforts with industry.
Evidence is mixed regarding the correlation between academic program rank or quality, and relative industry engagement. Private sector companies seeking academic partners may presume that higher-ranked institutions are more likely to provide ‘high-quality,’ commercially-valuable technologies.
Importantly for this current study, Bercovitz and Feldman (2008) found significant evidence of graduate school “imprinting” effects: medical school faculty members who had trained in departments that were active in engaging industry and technology transfer activities were more likely later—after becoming faculty members, themselves—to participate in technology transfer initiatives. Intriguingly, Lin and Bozeman (2006) mention that, despite their overall finding that university scientists with prior industry experience had lower career publications, among female academic scientists and engineers prior industry experience had a positive effect on research productivity. Ding et al. (2006) likewise found in their interviews of academic life scientists that, “regardless of gender, those that experienced patenting during [doctoral and postdoctoral] training were undaunted by the challenges of combining academic and commercial science.”
27
Data Sources
The analyses presented in this section draw primarily on data from the National Study of Postsecondary Faculty (NSOPF), which provides detailed information on faculty members’ time spent on research and income from consulting activities. We complement the NSOPF with data from the Survey of Doctorate Recipients (SDR), which has the advantage of providing somewhat more current responses, but the disadvantage of smaller sample size, making finer-grained investigations more difficult. Finally, to put universities’ patenting activities across fields in context, we include descriptive information on university-assigned patents derived from records of the U.S. Patent and Trademark Office (USPTO).
National Study of Postsecondary Faculty
The NSOPF was most recently conducted in 2004, and collected responses from a nationally-representative sample of full- and part-time faculty members at U.S. universities and colleges on a variety of subjects including the time faculty members spent on research, the share of their income derived from consulting, and measures of job satisfaction. Interactive summary tabulations from these data are available from the National Center for Education Statistics, U.S. Department of Education website.8
Survey of Doctorate Recipients and Doctorate Records File
The SDR is a biennial panel survey of individuals who earned PhDs at U.S. institutions since the mid-1970s. For this study, we used data available only under NSF restricted-use license, via the National Opinion Research Center (NORC) Data Enclave. For individuals who participated in both the 2008 and 2010 waves of the SDR, we combined their responses from both survey waves. Then, we merged in their linked responses from the NSF Survey of Earned Doctorates (SED) questionnaire, contained in the restricted-use Doctorate Records File (DRF). Unlike the SDR, the SED represents a census of all doctorates earned in the United States. The SDR panel is a sample drawn from the universe of SED respondents.
The 2010 SDR provides our base working file, and contains many variables of interest both for the descriptive analysis presented in this chapter, and also for our econometric analyses in the final chapter. These variables include: current labor force status; sector of employment (including both incorporated and unincorporated self-employment, type of institution if employed in academia, and so on); employer size;
8 Summary statistics including standard errors for t-statistic calculations were retrieved using the PowerStats interface, http://nces.ed.gov/datalab/index.aspx
28
whether their principal employment is with a new firm that came into existence within the past five years; whether the respondent changed jobs within the previous two years (and if so, why); whether they are married or “living as married,” and if so, whether their spouse or partner is employed, and if so, whether their spouse or partner’s occupation requires a bachelor’s or higher degree in a STEM field; how many children (dependents under age 19) live in their home, by age group; how closely related their job is to their first doctoral degree; and finally, their primary and secondary work activities, as well as which of several work activities they spend at least 10% of their time on, in a typical week. The 2010 SDR also contains a new module asking respondents to rate the importance they place on various job characteristics, and their relative satisfaction with each of those attributes in their current job, which we leverage in the final section of this report.
From the 2008 SDR, in addition to several employment and family demographics variables noted above that are common to both survey waves, we also extracted responses from that wave’s unique questions (not repeated in 2010) asking whether the individual had been named as inventor on any patent application within the previous five years (October 2003 through October 2008), and whether any patents they invented were licensed or commercialized over that same five-year period. One advantage of using the five-year “recent patents” outcome variable is that, unlike cumulative career patent counts, it permits us to test existence of impacts directly related to presence of young children in the home, rather than presuming parenthood also changes scientists’ long-run inventive trajectory.
We also supplemented the 2010 SDR’s responses to questions about reasons for job changes with individuals’ responses to those same questions in 2008, expanding our subpopulation of job-changers to include not only those who changed jobs between 2008 and 2010, but also those who changed jobs in the earlier window, 2006 to 2008. Because, as noted above, the questions on job satisfaction are unique to the 2010 survey, and because we are tying reasons for job changes to entrepreneurial participation in 2010, for this analysis we are interested only in each respondent’s most recent job change. Thus, if a respondent reported in 2010 that he or she changed jobs during the previous two year period, then—if they also changed jobs between 2006 and 2008—we only include in our analysis the reasons they cited for the more recent job change.
Finally, from the SDR-DRF linked responses, we extracted two additional sets of explanatory variables used in our study. First, we extracted categorical variables for the PhD’s total higher education debt (both undergraduate and graduate) as reported at the time they graduated, and recoded these categories for consistency across survey years. Then, we also extracted variables relating to the individual’s postdoctoral employment plans, specifically whether they had definite plans to work in business or industry, or if they planned to take a postdoc, whether the postdoc training/research would be primarily funded by industry.
29
United States Patent and Trademark Office (USPTO) data
Although we do not use the USPTO data for the empirical analyses of faculty patenting presented in this section,9 in Figure 8 we present counts of university-assigned patents by broad technology class and application year to provide context for the faculty patenting rates discussed below.
Many researchers and organizations have been involved in efforts to improve the quality and reliability of USPTO data, including disambiguation and identification of patents assigned to individual firms (Hall, Jaffe, and Trajtenberg 2001) and inventors (Lai et al. 2013), and incorporating cross-citations (Sampat 2011).
Building on these efforts, we use a disambiguated patents dataset incorporating confidential data provided by two large university system technology transfer offices to assign patents to their specific campuses where inventions took place, along with manual web-based lookup of hundreds of inventors’ CVs and scholarly publications, to identify the specific universities and campuses associated with each patent record.10
The broad technological categories we present in Figure 9 build on the original six technology categories proposed by (Hall, Jaffe, and Trajtenberg 2002), which we updated to include more recently introduced USPTO technology classes, with some reassignment of specific subclasses with respect to the Drug & Medical category. As Figure 8 shows, drugs and medical inventions dominate all other categories of patents produced by U.S. universities, representing over half of university-assigned patents during the U.S. National Institutes of Health budget doubling from 1998 to 2003.
9 The USPTO data described here are used in econometric analyses in the following chapter, as one source of university-specific, time-varying information about individuals’ graduate training environments.
10 This effort was supported in part by the National Science Foundation’s Science of Science and Innovation Policy program, Grant No. 1355279.
30
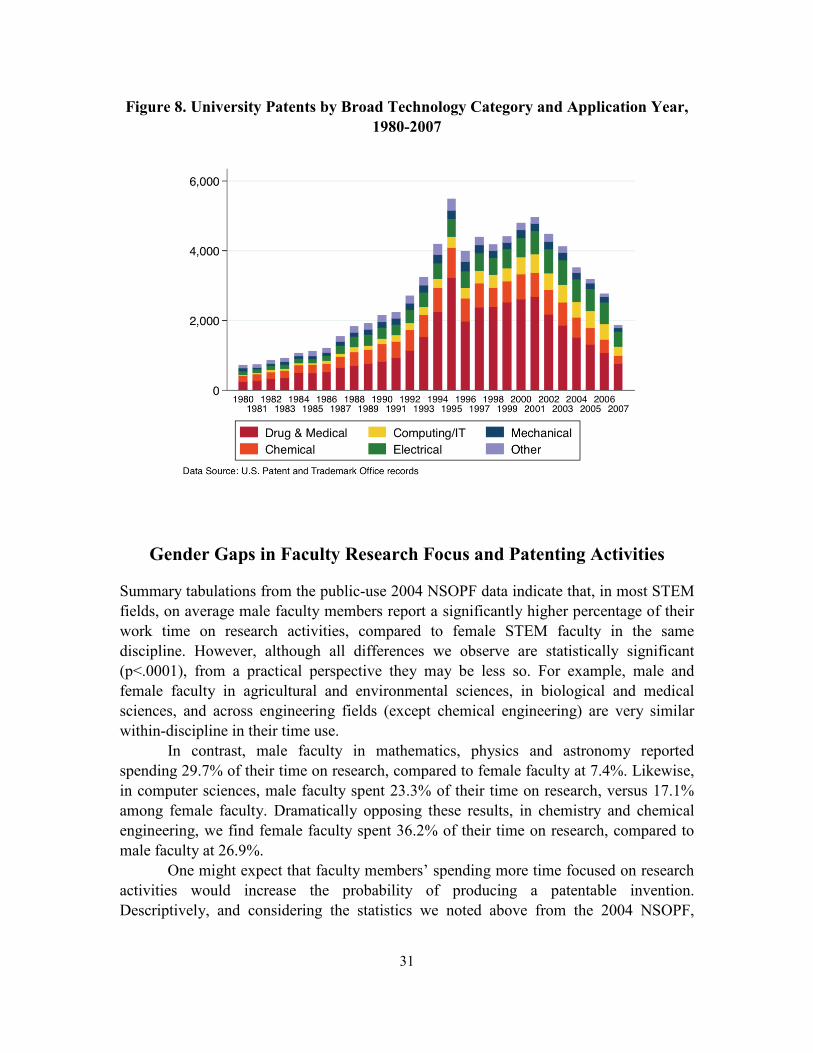
Figure 8. University Patents by Broad Technology Category and Application Year, 1980-2007
Gender Gaps in Faculty Research Focus and Patenting Activities
Summary tabulations from the public-use 2004 NSOPF data indicate that, in most STEM fields, on average male faculty members report a significantly higher percentage of their work time on research activities, compared to female STEM faculty in the same discipline. However, although all differences we observe are statistically significant (p<.0001), from a practical perspective they may be less so. For example, male and female faculty in agricultural and environmental sciences, in biological and medical sciences, and across engineering fields (except chemical engineering) are very similar within-discipline in their time use.
In contrast, male faculty in mathematics, physics and astronomy reported spending 29.7% of their time on research, compared to female faculty at 7.4%. Likewise, in computer sciences, male faculty spent 23.3% of their time on research, versus 17.1% among female faculty. Dramatically opposing these results, in chemistry and chemical engineering, we find female faculty spent 36.2% of their time on research, compared to male faculty at 26.9%.
One might expect that faculty members’ spending more time focused on research activities would increase the probability of producing a patentable invention. Descriptively, and considering the statistics we noted above from the 2004 NSOPF,
31
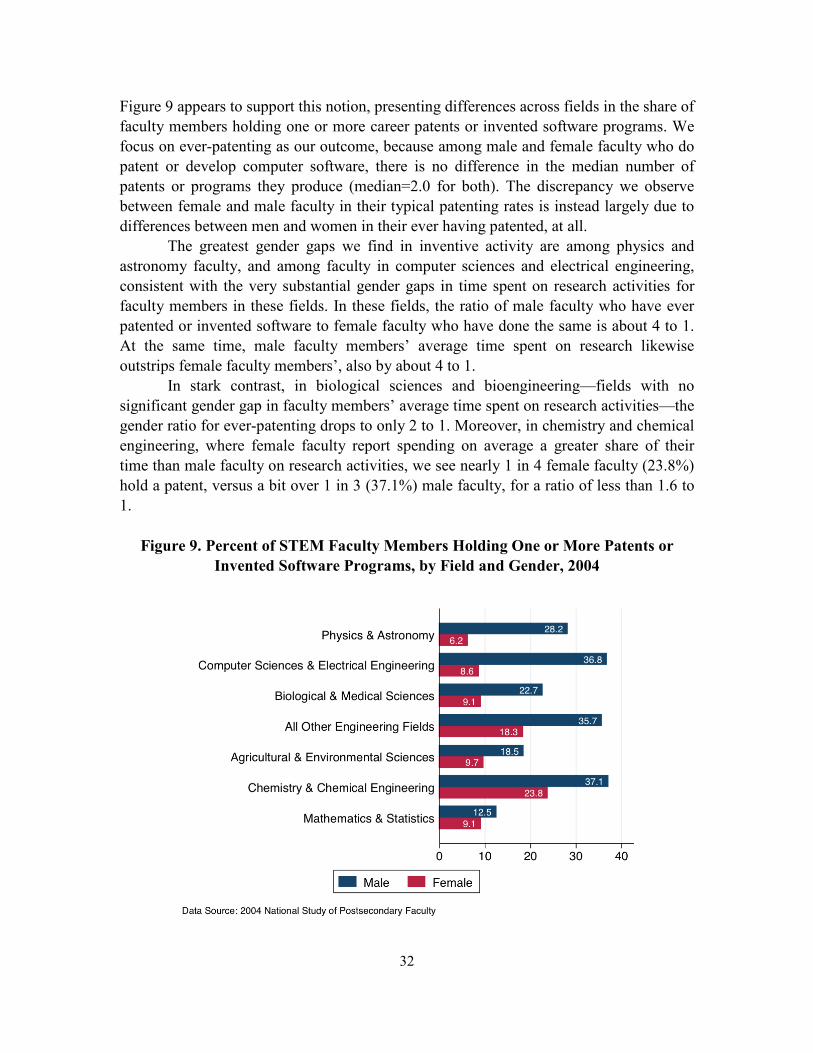
Figure 9 appears to support this notion, presenting differences across fields in the share of faculty members holding one or more career patents or invented software programs. We focus on ever-patenting as our outcome, because among male and female faculty who do patent or develop computer software, there is no difference in the median number of patents or programs they produce (median=2.0 for both). The discrepancy we observe between female and male faculty in their typical patenting rates is instead largely due to differences between men and women in their ever having patented, at all.
The greatest gender gaps we find in inventive activity are among physics and astronomy faculty, and among faculty in computer sciences and electrical engineering, consistent with the very substantial gender gaps in time spent on research activities for faculty members in these fields. In these fields, the ratio of male faculty who have ever patented or invented software to female faculty who have done the same is about 4 to 1. At the same time, male faculty members’ average time spent on research likewise outstrips female faculty members’, also by about 4 to 1.
In stark contrast, in biological sciences and bioengineering—fields with no significant gender gap in faculty members’ average time spent on research activities—the gender ratio for ever-patenting drops to only 2 to 1. Moreover, in chemistry and chemical engineering, where female faculty report spending on average a greater share of their time than male faculty on research activities, we see nearly 1 in 4 female faculty (23.8%) hold a patent, versus a bit over 1 in 3 (37.1%) male faculty, for a ratio of less than 1.6 to 1.
Figure 9. Percent of STEM Faculty Members Holding One or More Patents or Invented Software Programs, by Field and Gender, 2004
32
Our analysis of the 2010 SDR data provides additional nuance for this point. Specifically, in some fields, gender differences in faculty members’ typical work activities may partly be explained by differences in seniority. Across STEM fields, overall we find that female academics are less likely than male academics to hold tenured professor positions, and moreover female academics are substantially more likely than men to be in non-tenure-track positions (48.7% of women, versus 35.5% of men p<.001) working as lecturers, instructors, or in postdoc positions.
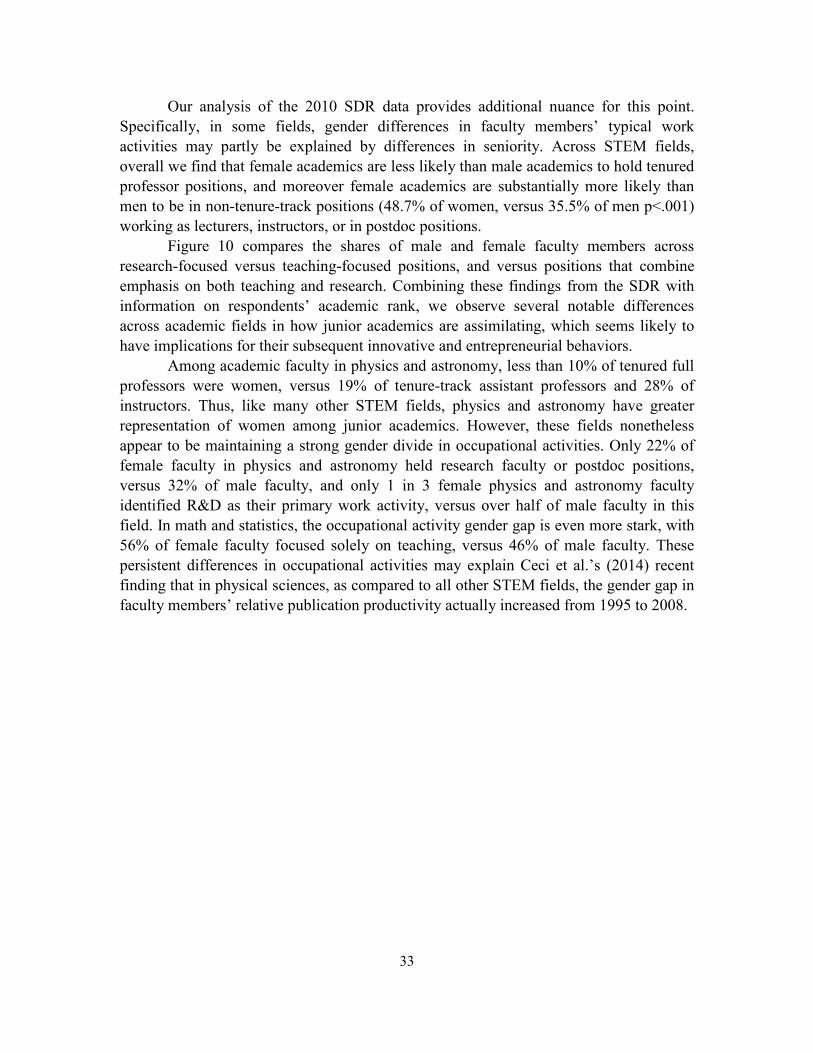
Figure 10 compares the shares of male and female faculty members across research-focused versus teaching-focused positions, and versus positions that combine emphasis on both teaching and research. Combining these findings from the SDR with information on respondents’ academic rank, we observe several notable differences across academic fields in how junior academics are assimilating, which seems likely to have implications for their subsequent innovative and entrepreneurial behaviors.
Among academic faculty in physics and astronomy, less than 10% of tenured full professors were women, versus 19% of tenure-track assistant professors and 28% of instructors. Thus, like many other STEM fields, physics and astronomy have greater representation of women among junior academics. However, these fields nonetheless appear to be maintaining a strong gender divide in occupational activities. Only 22% of female faculty in physics and astronomy held research faculty or postdoc positions, versus 32% of male faculty, and only 1 in 3 female physics and astronomy faculty identified R&D as their primary work activity, versus over half of male faculty in this field. In math and statistics, the occupational activity gender gap is even more stark, with 56% of female faculty focused solely on teaching, versus 46% of male faculty. These persistent differences in occupational activities may explain Ceci et al.’s (2014) recent finding that in physical sciences, as compared to all other STEM fields, the gender gap in faculty members’ relative publication productivity actually increased from 1995 to 2008.
33
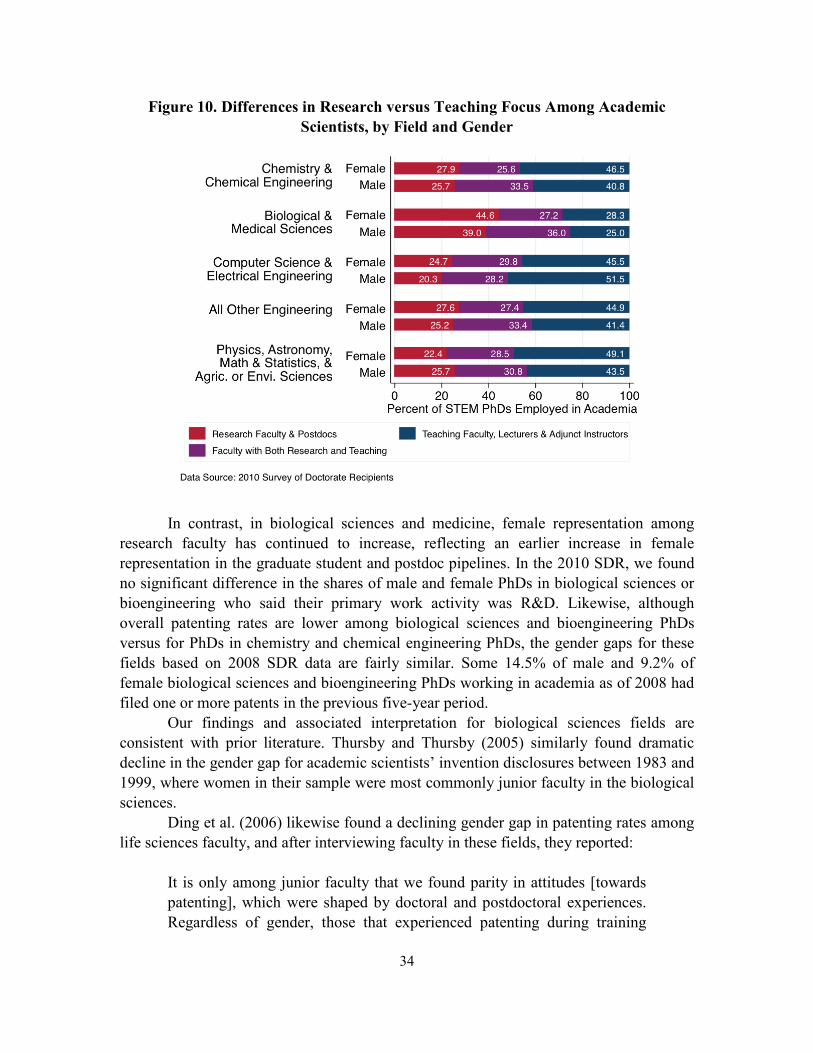
Figure 10. Differences in Research versus Teaching Focus Among Academic Scientists, by Field and Gender
In contrast, in biological sciences and medicine, female representation among
research faculty has continued to increase, reflecting an earlier increase in female representation in the graduate student and postdoc pipelines. In the 2010 SDR, we found no significant difference in the shares of male and female PhDs in biological sciences or bioengineering who said their primary work activity was R&D. Likewise, although overall patenting rates are lower among biological sciences and bioengineering PhDs versus for PhDs in chemistry and chemical engineering PhDs, the gender gaps for these fields based on 2008 SDR data are fairly similar. Some 14.5% of male and 9.2% of female biological sciences and bioengineering PhDs working in academia as of 2008 had filed one or more patents in the previous five-year period.
Our findings and associated interpretation for biological sciences fields are consistent with prior literature. Thursby and Thursby (2005) similarly found dramatic decline in the gender gap for academic scientists’ invention disclosures between 1983 and 1999, where women in their sample were most commonly junior faculty in the biological sciences.
Ding et al. (2006) likewise found a declining gender gap in patenting rates among life sciences faculty, and after interviewing faculty in these fields, they reported:
It is only among junior faculty that we found parity in attitudes [towards patenting], which were shaped by doctoral and postdoctoral experiences. Regardless of gender, those that experienced patenting during training
34
were undaunted by the challenges of combining academic and commercial science. (p. 667) Chemistry and chemical engineering have strong female representation among
research-focused academics, including postdocs and junior faculty. Over 35% of postdocs and 29% of untenured assistant professors women, compared to only 20% of tenured professors in these fields. As in the 2004 NSOPF data, in the 2008 SDR we again find that female faculty in chemistry and chemical engineering patent at a higher rate than female faculty in any other discipline.
The 2004 NSOPF found 31% of female faculty and 58% of male faculty in these fields held at least one patent or produced at least one computer software application in their career. Because the 2008 SDR restricts the question to ask only about patents filed in the past five years, the actual percentages we calculate with SDR data are lower than for total career patents. Despite this difference in survey questions, the 2008 SDR suggests a similar pattern, with 19.4% of female faculty and 26.5% of male faculty in chemistry and chemical engineering fields filing patent applications during the period October 2003 through October 2008 (difference not statistically significant, p=.17).
Civil engineering also has substantially greater representation by women among research faculty and postdocs, which might eventually help to close its 5:1 gender gap in patent applications. Mechanical, materials, electrical, and other engineering fields likewise have continued to increase female representation among postdocs and research faculty, which might lead to future declines in the patenting gaps for those fields as well.
On the other hand, although the female share of electrical engineering postdocs and research faculty—just under 20% for both categories—is comparable to that for other engineering fields in the 2010 SDR, only 11.8% of female faculty versus 33.8% of male faculty in electrical engineering had recently filed patent applications. This roughly 3:1 gender gap is substantially larger than in other engineering fields, where 9.5% of female faculty versus 23.6% of male faculty filed for patents.
In conclusion, we observe that fields with high growth in female representation among junior researchers—that is, among postdocs, non-tenure-track research faculty, and research-focused tenure-track faculty—tend to have substantially lower recent gender disparities in academic patenting. Physics, astronomy, mathematics, and statistics faculty have relatively low propensity to patent overall, but male faculty members’ continued dominance in patenting in these fields may be attributable to women’s higher representation in teaching-focused positions.
Gender Gaps in Faculty Engagement with Industry
As discussed above, in STEM fields, tenured faculty are overwhelmingly male, but a relatively high proportion of female faculty are untenured, tenure-track professors. If propensity towards freelance or consulting work is associated with academic life cycle—
35
that is, with whether a faculty member has already earned tenure—then these activities are likely to remain male-dominated while women gain experience and progress through the academic ranks.
Data from the 2004 NSOPF support this notion: across STEM fields, 45.9% of male tenured faculty and 40% of female tenured faculty report participating in outside/other employment, including consulting (t-stat for difference by gender 2.04, p<.05). In contrast, among untenured tenure-track faculty, less than a third participate in these activities, with no significant differences by gender.
We found similar results when examining an alternative measure, whether faculty members reported earning income from consulting or freelance work. Some 42.8% of male tenured faculty report income from consulting or freelance work, compared to 35.9% of female tenured faculty (t-stat for gender difference 2.47). However, at the tenure-track untenured level, there is no significant gap between male and female participation, but estimates of participation are again lower (28.0% of men, versus 26.7% of women).
As discussed by Boardman and Ponomariov (2009), this lower participation in “boundary-spanning” activities among junior faculty likely reflects the greater incentive untenured junior faculty have, as they approach their tenure decision, to spend time engaged in research activities with their primary employer. However, even among untenured tenure-track faculty, male STEM faculty report spending on average 34.1% of their time on research, versus only 25.6% among female STEM faculty.
Ginther (2008) studied similar outcomes using data from the 1995, 2001, and 2003 waves of the SDR. She found that experience with commercializing patents also increased academics’ probability of holding a second job, including self-employment, but found only weak association between patenting and exit from academic careers. However, controlling for patenting, publications and presentations, age and seniority, and PhD institution Carnegie classification, she also found women faculty are significantly less likely than male faculty to hold second jobs.
Gender Gaps in Academic Faculty’s Institutional Environments
Our discussion in the previous chapter of female faculty representation across PhD-granting departments and programs by programs’ NRC ranking was important for understanding possible sources of gender differences in graduate training environments. However, in addition to these imprinting effects, STEM PhDs’ participation in patenting and entrepreneurial activities are likely also to be influenced by local peer effects and institutional priorities.
So, beyond female representation across the PhD-granting programs we considered earlier with the NRC rankings data, we also used SDR and NSOPF data to gain a clearer understanding of the broader institutional environments in which male and female STEM PhDs find themselves, when employed as academic faculty.
36
Ceci et al. (2014) find that, among PhDs in engineering, earth/environmental sciences, physical sciences, mathematics and statistics, there is no difference by gender in access to tenure-track positions or salaries. However, Winslow (2010) also observed using data from the 1999 NSOPF that female faculty disproportionately select into less research-intensive institutions, which reward greater time spent on teaching.
Using 2004 NSOPF data, we similarly estimate only 15% of tenured STEM faculty at the most research-intensive PhD-granting universities are female, compared to over 30% at non-PhD-granting institutions. The 2010 SDR suggests possible improvement, with women representing 21% of tenured STEM faculty at institutions with Carnegie 2005 classifications of Doctoral Research “Very High” or “High”, versus 29% of tenured STEM faculty at master’s-granting institutions and baccalaureate colleges. The NSOPF data suggest these most research-intensive institutions also have significantly higher rates of faculty patenting, with 24.3% of faculty at private PhD-granting institutions and medical schools holding one or more patents, versus 22.0% of faculty at their public institution peers (difference significant at p<.10).
The gender gap in patenting might close more quickly at private PhD-granting institutions and medical schools, as a function of both their higher rates of faculty patenting and higher recruitment of female STEM faculty. Among tenured STEM faculty at these institutions, 36.1% of males and 20.5% of females hold one or more patents (difference 15.6%); for public PhD-granting institutions, the difference is 18.8% (31.9% for males, 13.1% for females). Preliminary results also suggest somewhat higher female representation among untenured, tenure-track faculty at private versus public PhD-granting institutions.
Among the non-PhD-granting institutions, private liberal arts colleges have made significant strides to increase female representation among their faculty. The female share of junior, tenure-track STEM faculty at liberal arts colleges is now approaching parity (47% of liberal arts colleges’ STEM faculty are women, per both SDR and NSOPF data). This is disproportionately high given that, overall, only one-third of untenured, tenure-track STEM faculty in the NSOPF sample and 38% of those in the SDR 2010 sample are female. By contrast, female representation among tenure-track STEM faculty at the most-research-intensive PhD-granting institutions remains significantly lower, 32.5% at private institutions and 36.1% at public institutions (2010 SDR).
37
Women in STEM: Innovation and Entrepreneurial Ventures
The previous chapter presented significant gender differences in employment and commercial research focus among STEM faculty, and across departments or programs in which female graduate students preferentially enroll. These descriptive findings, coupled with prior literature demonstrating importance of “imprinting” and “boundary-spanning” in graduate and postdoctoral training environments, suggest that the gender gap in STEM fields entrepreneurship may be partly attributable to differences in mentoring and commercial exposure female graduate students and postdocs receive. Key Findings:
• Male STEM PhDs participate in entrepreneurship and patenting at higher rates than female STEM PhDs (7.0% versus 5.4%, and 28% versus 15%, respectively).
• About one-third of the gender gap in patenting, but less than one-quarter of the gap in entrepreneurship, is attributable to gender differences in the distribution of PhD fields.
• About one-half of the gender gap in entrepreneurship is likewise attributable to gender differences in STEM PhDs’ graduate and postdoctoral training environments, sectors of employment, and years of experience.
• Female STEM PhDs who attended programs at universities with relatively higher patenting volume and higher shares of R&D funded by industry or other non-federal sources are significantly more likely to engage in patenting and entrepreneurship.
• Female STEM PhDs whose first postdoctoral employment was in (or funded by) industry are equally likely as men to participate in patenting and entrepreneurship.
• Arrival of young children at home significantly and substantially decreases women’s near-term patenting and entrepreneurship, with no effect found for men.
• Outside of academia, female STEM PhDs with recent experience licensing or commercializing patents are less likely to engage in entrepreneurship, whereas male STEM PhDs with the same experience are more likely to do so.
• Female STEM PhDs who start their own businesses or join entrepreneurial ventures are less likely than men to do so for family-related reasons, but more often do so to improve their working conditions.
• Female STEM PhDs are significantly more likely than males to choose unincorporated self-employment over regular employment for its degree of independence.
• Having a spouse or partner who works full-time in non-STEM fields increases female STEM PhDs’ propensity towards small business ownership.
38
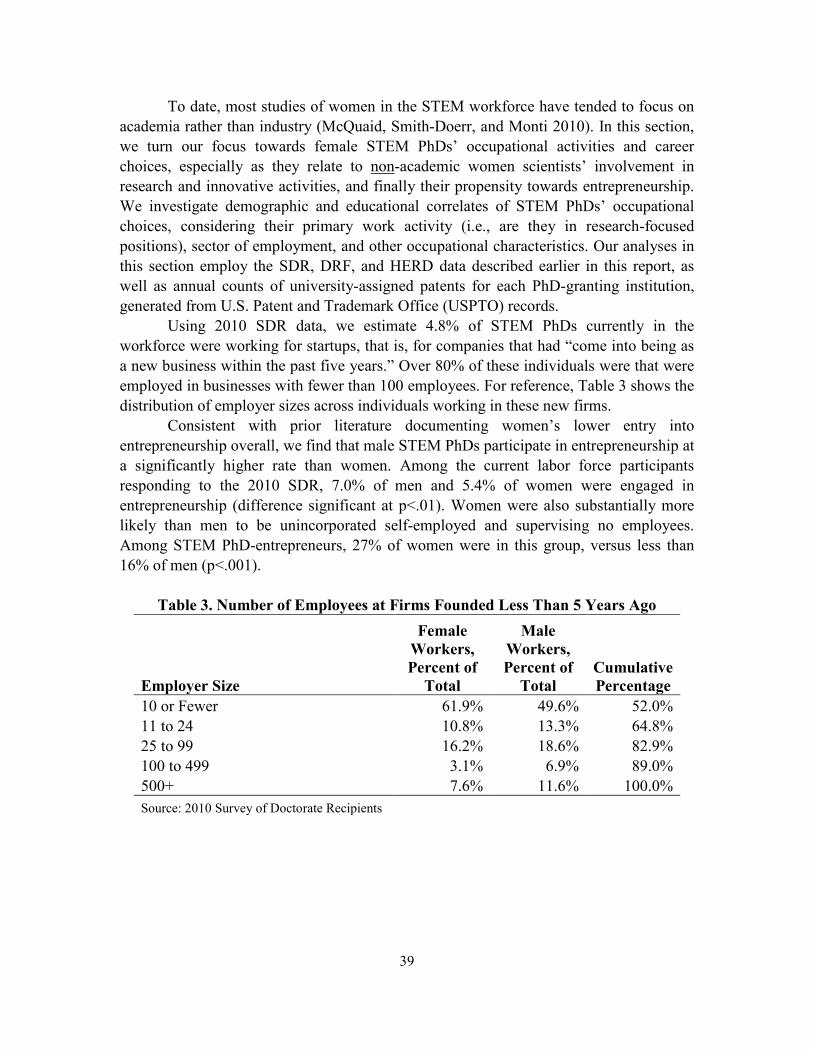
To date, most studies of women in the STEM workforce have tended to focus on academia rather than industry (McQuaid, Smith-Doerr, and Monti 2010). In this section, we turn our focus towards female STEM PhDs’ occupational activities and career choices, especially as they relate to non-academic women scientists’ involvement in research and innovative activities, and finally their propensity towards entrepreneurship. We investigate demographic and educational correlates of STEM PhDs’ occupational choices, considering their primary work activity (i.e., are they in research-focused positions), sector of employment, and other occupational characteristics. Our analyses in this section employ the SDR, DRF, and HERD data described earlier in this report, as well as annual counts of university-assigned patents for each PhD-granting institution, generated from U.S. Patent and Trademark Office (USPTO) records.
Using 2010 SDR data, we estimate 4.8% of STEM PhDs currently in the workforce were working for startups, that is, for companies that had “come into being as a new business within the past five years.” Over 80% of these individuals were that were employed in businesses with fewer than 100 employees. For reference, Table 3 shows the distribution of employer sizes across individuals working in these new firms.
Consistent with prior literature documenting women’s lower entry into entrepreneurship overall, we find that male STEM PhDs participate in entrepreneurship at a significantly higher rate than women. Among the current labor force participants responding to the 2010 SDR, 7.0% of men and 5.4% of women were engaged in entrepreneurship (difference significant at p<.01). Women were also substantially more likely than men to be unincorporated self-employed and supervising no employees. Among STEM PhD-entrepreneurs, 27% of women were in this group, versus less than 16% of men (p<.001).
Table 3. Number of Employees at Firms Founded Less Than 5 Years Ago
Employer Size
Female Workers, Percent of
Total
Male Workers, Percent of
Total Cumulative Percentage
10 or Fewer 61.9% 49.6% 52.0% 11 to 24 10.8% 13.3% 64.8% 25 to 99 16.2% 18.6% 82.9% 100 to 499 3.1% 6.9% 89.0% 500+ 7.6% 11.6% 100.0% Source: 2010 Survey of Doctorate Recipients
39
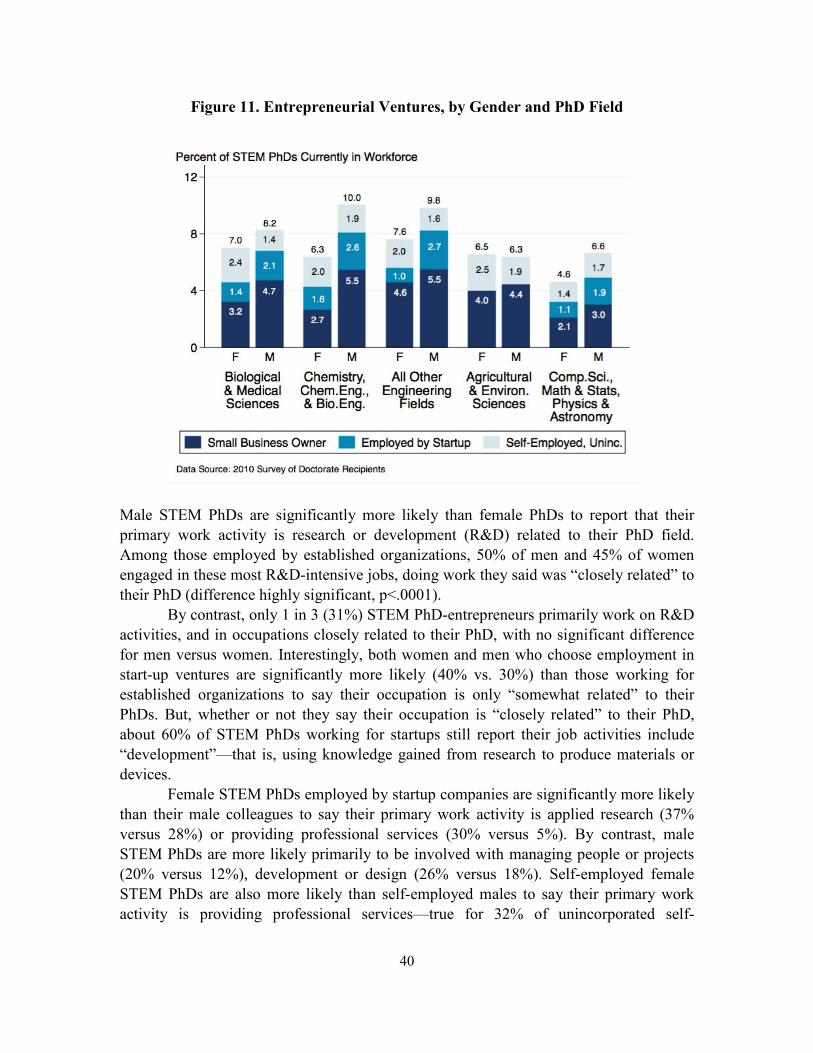
Figure 11. Entrepreneurial Ventures, by Gender and PhD Field
Male STEM PhDs are significantly more likely than female PhDs to report that their primary work activity is research or development (R&D) related to their PhD field. Among those employed by established organizations, 50% of men and 45% of women engaged in these most R&D-intensive jobs, doing work they said was “closely related” to their PhD (difference highly significant, p<.0001).
By contrast, only 1 in 3 (31%) STEM PhD-entrepreneurs primarily work on R&D activities, and in occupations closely related to their PhD, with no significant difference for men versus women. Interestingly, both women and men who choose employment in start-up ventures are significantly more likely (40% vs. 30%) than those working for established organizations to say their occupation is only “somewhat related” to their PhDs. But, whether or not they say their occupation is “closely related” to their PhD, about 60% of STEM PhDs working for startups still report their job activities include “development”—that is, using knowledge gained from research to produce materials or devices.
Female STEM PhDs employed by startup companies are significantly more likely than their male colleagues to say their primary work activity is applied research (37% versus 28%) or providing professional services (30% versus 5%). By contrast, male STEM PhDs are more likely primarily to be involved with managing people or projects (20% versus 12%), development or design (26% versus 18%). Self-employed female STEM PhDs are also more likely than self-employed males to say their primary work activity is providing professional services—true for 32% of unincorporated self-
40
employed women and 31% of women business owners, versus 21% of unincorporated self-employed men and 25% of male business owners.
But, while women business owners are similar to women employed by startups in their relatively higher focus on applied research, unincorporated self-employed of both genders are less likely to share that focus.
Among self-employed STEM PhDs, whether unincorporated or business owners, almost 1 in 4 (24%) say their occupation is “not related” to their PhD. Working in an occupation unrelated to one’s degree is particularly common among self-employed PhDs in physics, astronomy, and earth/environmental sciences, but it is also common among self-employed chemical engineers. How do these STEM PhD-entrepreneurs spend their work time?
As one might expect, over 60% of STEM PhD small business owners spend several hours each week managing people or projects, as well as at least 10% of their time on accounting and finance-related tasks. But—when their work is unrelated to their degree—self-employed STEM PhDs’ primary work activity is often to provide professional services. About 80% of self-employed mathematicians and statisticians and about 60% of self-employed agricultural scientists who say their occupations are unrelated to their doctoral training primarily provide professional services, along with 40% of chemists and chemical engineers.
On the other hand, over two-thirds of self-employed civil engineers and biologists say their occupation is closely related to their degree, along with about half of other engineers.
Consistent with prior literature, our analysis of the SDR data indicates that, as scientists age, they are less likely to remain in occupations where R&D activities are their primary focus. Female STEM PhDs are also less likely, on average, to be in research-focused jobs. On the other hand, foreign STEM PhDs who earned their PhDs at U.S. universities are significantly more likely to take research-focused jobs after they graduate, compared with U.S. citizens graduating from the same programs. Foreign-born, U.S.-trained STEM PhDs who had acquired a “green card” (permanent resident visa) by the 2010 survey were still significantly more likely than U.S. citizens to be in research-focused jobs, but—likely due to their greater flexibility in employment, as compared to those on temporary resident visas—permanent residents were also significantly less likely than those on temporary resident visas to stay in R&D-focused positions.
For men, after including the above-mentioned demographic variables, differences across graduate institutions seemed to have little impact on their probability of staying in R&D-focused jobs. However, for female STEM PhDs their probability of current employment in a R&D-focused occupation was significantly higher if they attended a more research-intensive PhD program, that is, one with relatively higher total R&D expenditures from all funding sources.
This evidence of differences in institutional predictors of research-focused occupations among male versus female STEM PhDs suggests to us that the gender gap in
41
innovative activities (e.g., patenting) and entrepreneurship may reflect differential responses by gender among STEM PhDs who trained in the same environments.
To summarize, we anticipate that several different mechanisms may explain existing gender gaps in STEM fields patenting and innovative entrepreneurship, as follows.
1. Women are less represented as graduate students and completed PhDs in STEM fields with a relatively higher propensity towards patenting and entrepreneurship.
2. In some fields, female graduate students and faculty members select into less research-intensive PhD-granting departments and programs.
3. In some fields, female graduate students less often enroll in PhD-granting departments and programs that attract higher shares of R&D funding from non-federal sources including industry.
4. In some fields, female graduate students and faculty members are less likely to train or work at universities with higher overall rates of patenting.
5. Institutional characteristics may also have different impacts on male versus female STEM PhDs’ subsequent innovative and entrepreneurial behaviors.
6. In many fields, women preferentially enter academic employment, which has lower rates of patenting and entrepreneurship than other sectors.
7. Differences in typical preferences regarding job characteristics among male and female STEM PhDs influence their subsequent occupational choices.
Our empirical analyses presented below decompose the contributions of these
several different mechanisms for the gender gaps in patenting and entrepreneurship, respectively, First, we explicitly account for differences in the distribution of PhDs earned by gender, across STEM fields.
Then, motivated by Bercowitz and Feldman’s (2008) study of medical scientists, we investigate possible “imprinting” due to greater commercial focus in individuals’ graduate training environments, including variables that represent: (a) the total volume of R&D and the relative share R&D funded by industry and other non-federal sources in the student’s field, at that university, in the year he or she earned the PhD; and (b) the average number of university-assigned patents produced by members of the individual’s doctoral institution over the five years preceding his or her degree completion, relative to other institutions that awarded PhDs to students in the same field.
Total and non-federally-funded R&D expenditures were extracted for each university, field, and year from the NSF Survey of R&D Expenditures at Universities and Colleges, the predecessor to the HERD survey we used in the previous chapter. University-assigned patent counts were derived from USPTO records, and reflect the number of successful patent applications the university filed each year. Because some smaller institutions have relatively large year-to-year fluctuations in their patent applications, we smooth the university patents variable, taking the average number over
42
the number of successful patent applications submitted by the university in the year the student graduated, and for the four years preceding.
In addition to graduate training effects, we also considered possible effects of PhDs’ postdoctoral boundary-spanning activities. Prior entrepreneurship literature, especially that focused on academic entrepreneurs, has discussed the importance of boundary-spanning individuals for successful commercialization of academic scientists research.
We hypothesized that multidisciplinary training may also serve as a type of boundary-spanning, providing scientists with a broader experience set to draw on for recognizing commercially-relevant opportunities. More commonly recognized boundary-spanning training experiences could include taking postdoctoral employment with industry as discussed previously, or earning a master’s degree in business administration or management. For example, Greene et al. (2001) found that owners of high-growth entrepreneurial firms are more likely than other entrepreneurs to hold graduate degrees, and those who attract financing more often have engineering or business degrees.
To test for influence of such boundary-spanning experiences on patenting and entrepreneurship, we specifically investigated whether having one’s first postdoctoral employment in industry, or having postdoctoral funding support (e.g., for a postdoctoral research fellowship) provided by industry, increased the probability of subsequent patenting or entrepreneurship. We identified respondents’ postdoctoral employment using their SDR-linked Survey of Earned Doctorates responses, which were collected around the time each respondent graduated from his or her STEM PhD program. Our industry postdoc dummy variable represents individuals who indicated they had already signed a contract or otherwise had a definite, firm commitment for a specific position (including postdoctoral fellowships), with a specific employer, and who were either going to work for business or industry, or taking a postdoctoral fellowship for which primary financial support came from industry sources.
We also examined whether individuals who completed a subsequent degree in business or management (including but not restricted to MBA degrees) were more likely to patent or engage in entrepreneurship. Finally, considering the possibility that interdisciplinary training earlier in one’s career might conceivably also influence an individual’s capacity for boundary-spanning and opportunity recognition, we control for whether their PhD was earned in the same field or discipline their bachelor’s degree.
Recent evidence has once again shown that family/household structure and especially parenthood can have very different impacts on female versus male scientists’ research productivity (Whittington 2011). We investigate the salience of these issues in the 2008 and 2010 SDR data, including variables for whether the respondent reports he or she is married or “living as married,” and if so, whether the spouse or partner works full-time, and then if so, whether the spouse or partner works in an occupation that requires at least a bachelor’s degree in a STEM field. We also considered and tested several alternative approaches to capture how childbearing and presence of dependent children of different age ranges in the home might differentially impact male and female scientists.
43
For these family-related variables, as with many other variables we considered but ultimately excluded from the final models presented here, we were guided in our model selection by theory and empirical evidence presented across the multiple streams of literature on which we draw, as well as empirical considerations. We used Akaike’s Information Criterion to evaluate the merits of expanding each model, and where multiple measures were available to represent a given concept, we preferentially selected variables that we found provided most insight specifically into gender-related differences. Finally, though the focus of this current report is on gender differences in STEM fields, we also recognize (and control for) differences in scientific career trajectories among underrepresented racial and ethnic minorities, and among foreign-born and immigrant scientists.
Descriptive statistics by gender for our outcome variables and key explanatory variables are presented in Table 4.
Overall, about 1 in 4 STEM PhDs (24.6%) in our analytic sample reported in the 2008 SDR that they had been named as inventor on one or more patent applications filed over the five-year period October 2003 through 2008. However, male STEM PhDs were significantly and substantially more likely to have filed one or more patents: 28.4% of men and 15.0% of women reported having done so during the five-year period.
44
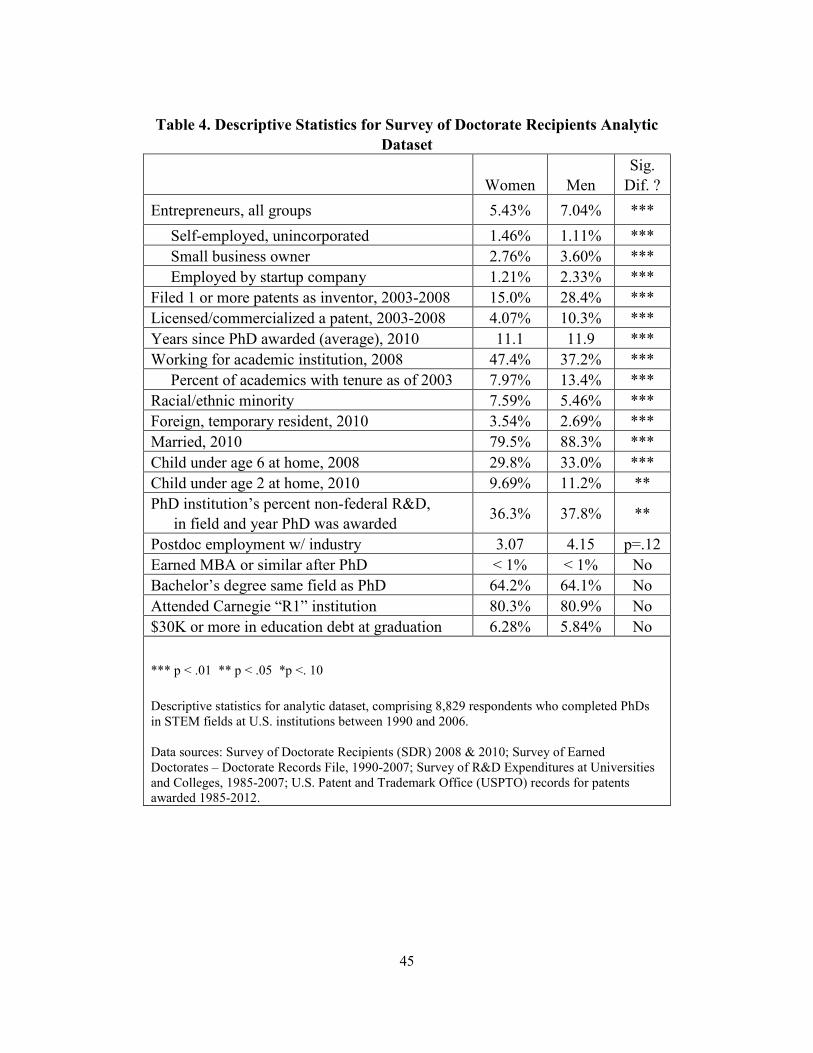
Table 4. Descriptive Statistics for Survey of Doctorate Recipients Analytic
Dataset
Women
Men Sig.
Dif. ? Entrepreneurs, all groups 5.43% 7.04% *** Self-employed, unincorporated 1.46% 1.11% *** Small business owner 2.76% 3.60% *** Employed by startup company 1.21% 2.33% *** Filed 1 or more patents as inventor, 2003-2008 15.0% 28.4% *** Licensed/commercialized a patent, 2003-2008 4.07% 10.3% *** Years since PhD awarded (average), 2010 11.1 11.9 *** Working for academic institution, 2008 47.4% 37.2% *** Percent of academics with tenure as of 2003 7.97% 13.4% *** Racial/ethnic minority 7.59% 5.46% *** Foreign, temporary resident, 2010 3.54% 2.69% *** Married, 2010 79.5% 88.3% *** Child under age 6 at home, 2008 29.8% 33.0% *** Child under age 2 at home, 2010 9.69% 11.2% ** PhD institution’s percent non-federal R&D,
in field and year PhD was awarded 36.3% 37.8% **
Postdoc employment w/ industry 3.07 4.15 p=.12 Earned MBA or similar after PhD < 1% < 1% No Bachelor’s degree same field as PhD 64.2% 64.1% No Attended Carnegie “R1” institution 80.3% 80.9% No $30K or more in education debt at graduation 6.28% 5.84% No *** p < .01 ** p < .05 *p <. 10 Descriptive statistics for analytic dataset, comprising 8,829 respondents who completed PhDs in STEM fields at U.S. institutions between 1990 and 2006. Data sources: Survey of Doctorate Recipients (SDR) 2008 & 2010; Survey of Earned Doctorates – Doctorate Records File, 1990-2007; Survey of R&D Expenditures at Universities and Colleges, 1985-2007; U.S. Patent and Trademark Office (USPTO) records for patents awarded 1985-2012.
45
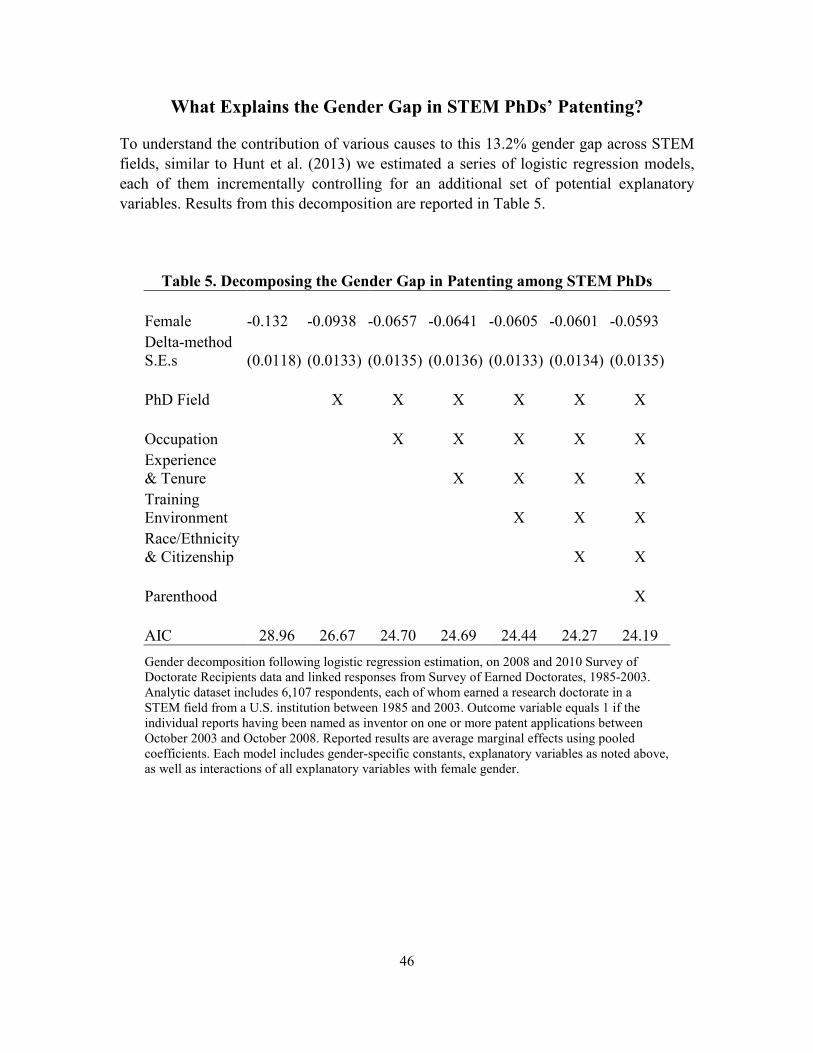
What Explains the Gender Gap in STEM PhDs’ Patenting?
To understand the contribution of various causes to this 13.2% gender gap across STEM fields, similar to Hunt et al. (2013) we estimated a series of logistic regression models, each of them incrementally controlling for an additional set of potential explanatory variables. Results from this decomposition are reported in Table 5.
Table 5. Decomposing the Gender Gap in Patenting among STEM PhDs
Female -0.132 -0.0938 -0.0657 -0.0641 -0.0605 -0.0601 -0.0593 Delta-method S.E.s (0.0118) (0.0133) (0.0135) (0.0136) (0.0133) (0.0134) (0.0135)
PhD Field
X X X X X X
Occupation
X X X X X Experience & Tenure
X X X X
Training Environment
X X X
Race/Ethnicity & Citizenship
X X
Parenthood
X
AIC 28.96 26.67 24.70 24.69 24.44 24.27 24.19 Gender decomposition following logistic regression estimation, on 2008 and 2010 Survey of Doctorate Recipients data and linked responses from Survey of Earned Doctorates, 1985-2003. Analytic dataset includes 6,107 respondents, each of whom earned a research doctorate in a STEM field from a U.S. institution between 1985 and 2003. Outcome variable equals 1 if the individual reports having been named as inventor on one or more patent applications between October 2003 and October 2008. Reported results are average marginal effects using pooled coefficients. Each model includes gender-specific constants, explanatory variables as noted above, as well as interactions of all explanatory variables with female gender.
46
Similar to Hunt et al.’s (2013) finding regarding individuals holding STEM bachelor’s degrees using data from the 2003 National Survey of College Graduates, here we find that about one-third of the gender gap (27-34%) in STEM PhDs’ patenting can likewise be explained by differences in the gender distribution across STEM PhD fields.11,12
We estimate that another one-fifth of the gender gap in STEM PhDs’ patenting can be attributed to differences in male and female STEM PhDs’ occupations, including whether they are employed in academia (which is associated with lower rates of patenting than other sectors), whether their primary or secondary work activity is R&D (basic research, applied research, development, or design), and how closely related their job is to their doctoral field of degree. Combined with gender differences in PhD completions across STEM fields, these gender differences in occupational activities and employment sector (academic or otherwise) explain about half of the patenting gender gap.
Gender differences in experience and seniority explain very little of the remaining gap, overall. Moreover, if we assume graduate and postdoctoral training experiences have the same impact for both male and female STEM PhDs, then—after controlling for field and occupation—it appears only about 2% of the overall gender patenting gap is attributable to these differences. But in fact, we find that some of these training environment variables have significantly different impacts for men versus women.
First, women who earned a master’s in a business-related field (i.e., MBA or similar) after their PhDs were just as likely as men to have filed a patent application within the past five years. Their probability of patenting increased by over 60% with a MBA or similar degree (p<.10), whereas for men earning a subsequent business degree had essentially zero impact.
Second, although for men postdoctoral employment in industry was associated with a significant 29% increase in probability of patenting (p<.05), the magnitude of the
11 PhD fields-of-degree represented by field-specific constants (i.e., “dummy variable” fixed effects) in all SDR-based analyses include: aerospace engineering, agricultural sciences, biological sciences, chemistry, chemical engineering, civil engineering, computer science, earth & environmental sciences (includes atmospheric sciences, geology, oceanography, and other environmental sciences), electrical engineering, mathematics and statistics, materials science and other/unspecified engineering fields, mechanical engineering, medical sciences, and physics and astronomy.
12 Table 5 reports decomposition results using pooled coefficients, as discussed by Oaxaca and Ransom (1994) and Fairlee (1999). However, within the text, we also report ranges representing the gap reduction associated with using only male or only female coefficients.
47
effect for women was more than twice that.13 In effect, for female STEM PhDs, either: (a) completion of a MBA or similar degree after their PhD, or (b) having their first postdoctoral employment “paid for” by industry—either of these seems sufficient to close the remainder of the gender gap in patenting.
Finally, though for men their doctoral university’s relative patenting volume had essentially no added impact, for women this aspect of the graduate training environment proved to be highly significant. Attending a doctoral program at a university at the 75th percentile for patenting versus at the 25th percentile increased the probability of a female STEM PhD filing a patent by about one percentage point.
Adding controls for race/ethnicity and citizenship status at this point provided little additional explanatory power, in part because there does not seem to be systematic correlation between our outcomes of interest, our key explanatory variable (gender) and these other demographic characteristics. That is, although these demographic characteristics are useful predictors and they do help to reduce the residual unexplained variance across individuals’ outcomes in our data, these characteristics explain very little of the gender gap, itself. Our results suggest that less than 1% of the patenting gender gap is attributable to differences in the share of women among U.S. citizens, permanent residents, foreign temporary residents, and underrepresented racial and ethnic U.S. minorities.
All together, the variables we have considered thus far seem to explain over half (54%) of the gender gap in STEM PhDs’ patenting. So what explains the remaining gap?
In contrast with Whittington’s (2011) earlier study that used data from the 1995 and 2001 SDR waves, in the 2008 SDR we find significant evidence that recent parenthood affects women scientists’ patenting rates differently from men’s, and not just among male and female scientists employed in academia. That earlier study found similar results to ours for male and female scientists in academia, but no significant difference for those in industry.
One possible reason for this difference in our results is due to coding of the explanatory variable. Whittington (2011) argues that “parental responsibilities for children of all ages can cause work/family conflict,” so uses presence of any dependent children under 18 at home as the explanatory variable. By contrast, our “parenthood” indicator variable takes on value 1 for presence of a child under six years of age in the respondent’s home in 2008, which corresponds to a child born either during or just prior
13 The difference in the average marginal effect of industry-supported postdoctoral employment estimated for men versus women was not, itself, statistically significant. However, both for men and for women, industry-supported postdoctoral employment was associated with significantly higher (p<.10) predicted probability of patenting, even after Bonferroni correction for multiple comparisons.
48
to the five-year look-back period, over which the respondent reports his or her patenting behavior. 14 Sensitivity tests including additional categorical variables for older age groups found no statistical evidence of impact, for men or women.
For men, we find that having a young child at home appears to have no practical or statistically significant impact on their probability of filing at least one patent application during the look-back window (point estimate 0.38 percentage points, p=.79). For women, however, having a young child at home is associated with a 4.0 percentage point decrease in the probability of filing any patents. Put another way, after controlling for all the other variables we discuss above, and conditional on women not having a young child at home, the gender gap in patenting is sufficiently small as to be no longer statistically significant.
In the full, final model, comparing field-specific fixed effects from the “male” model with those from the “female” model reveals only two fields with persistent, significant, and as-yet-unexplained gender gaps in STEM PhDs’ patenting rates. 15 In chemistry, there is still a 19-percentage-point gap, with female PhDs patenting at about half the rate of male PhDs, all else equal. Similarly, in medical sciences, there is a 12-percentage-point gap, with female PhDs patenting at about 65% of male PhDs’ rate, all else equal.
What Explains the Gender Gap in STEM PhDs’ Entrepreneurship?
In this final section, we take a similar approach as we did for STEM PhDs’ patenting, above, to describe the relative contributions of various potential influences to the gender gap in male and female STEM PhD’s participation in entrepreneurial ventures.
We begin by defining entrepreneurship broadly, as in the first chapter, to include: (a) unincorporated, non-employer self-employment; (b) incorporated self-employment or small business ownership; or (c) employment with a new venture that was founded within the past five years, and that has fewer than 100 employees. Our motivation for using this broader definition partly derives from recent literature demonstrating women scientists’ greater research productivity in collaborative, team-based environments. For example, Whittington and Doerr (2008) argued that women scientists in academic settings may be
14 Though we cannot rule out the possibility that an older child might have joined the household in 2008 by some means (blended households, adoption, and so on), nor that a young child might have been present during the period 2003-2008 but is no longer living in the respondent’s home in 2008, we have no reason to expect that measurement error in either direction would be systematically correlated with patents production.
15 Results robust to Bonferroni correction for multiple comparisons.
49
marginalized relative to their male colleagues, whereas women in more flexible, small science-based innovative firms that emphasize collaboration and teamwork may be more productive. Their study finds that male and female scientists working in science-based entrepreneurial biotechnology firms are equally likely to patent, and conclude that participation in such firms may provide “a more equalizing environment for women scientists,” at least for patenting.
With this broad definition, we estimate 7.0% of male STEM PhDs and 5.4% of female STEM PhDs participate in entrepreneurship, resulting in a gender gap of 1.4% (p=.008). If we restrict the sample to those who graduated more than six years prior to the 2010 survey (i.e., the same subpopulation we used to study the patents outcome), this gap closes to a statistically insignificant 0.8% (p=.29).
From an economic and policy perspective, non-employer self-employed individuals are less likely to contribute substantially to the science-based, innovative economic growth that we seek. In addition, the closing gap among STEM PhDs who graduated more than six years ago reflects significantly higher rates of unincorporated, non-employer self-employed for women versus men in that group. At the same time, among both recent and more senior STEM PhDs, women are significantly less likely than men to own small businesses or join start-up companies. If we exclude unincorporated self-employment, then among STEM PhDs who graduated in 2006 or earlier and who were in the workforce in 2010, the gender gap widens to a highly significant 1.71% (p<.001).
As in the previous section’s patents analysis, here we decompose the gender gap in entrepreneurship using a series of logistic regressions, beginning with PhD field. Results for this decomposition are presented in Table 6. In contrast with our findings for patenting, for entrepreneurship we find less than one-quarter (10-22%) of the gender gap is explained by differences in the gender distribution across PhD fields.
Due to employment restrictions that affect foreign workers’ ability to participate in entrepreneurship, we next added the set of citizenship and race/ethnicity control variables. However, none of these made a difference with respect to the gender gap in entrepreneurship (result column omitted for brevity).
We then control for prior patenting using both the patent filings outcome variable we explored in the previous section, as well as an additional indicator variable representing whether the individual reported having commercialized or licensed a patent over that same five-year period. Intriguingly, although the pooled coefficient suggests gender differences in invention and commercialization have no influence on subsequent entrepreneurship, this camouflages significantly different results obtained in the gender-specific regressions. Women who have experience commercializing or licensing a patent are significantly less likely to engage in subsequent entrepreneurship, whereas men with the same experience are significantly more likely to engage in entrepreneurship.
50
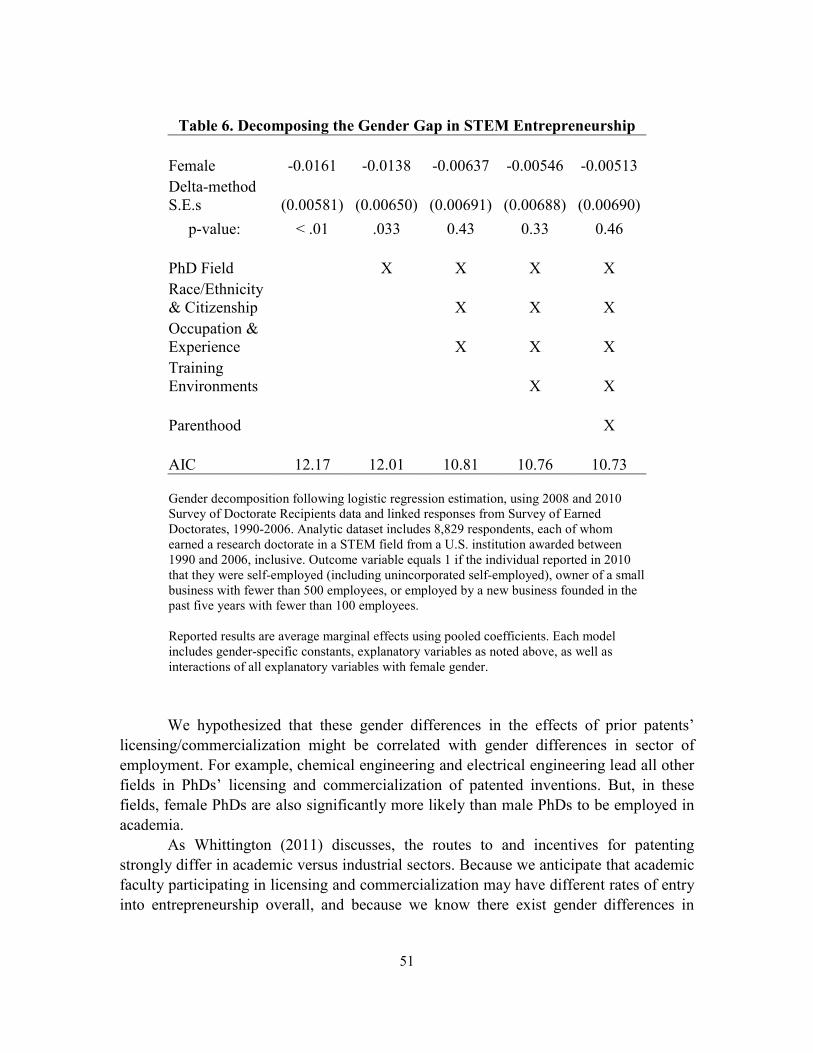
Table 6. Decomposing the Gender Gap in STEM Entrepreneurship
Female -0.0161 -0.0138 -0.00637 -0.00546 -0.00513 Delta-method S.E.s (0.00581) (0.00650) (0.00691) (0.00688) (0.00690) p-value: < .01 .033 0.43 0.33 0.46
PhD Field
X X X X Race/Ethnicity & Citizenship X X X Occupation & Experience
X X X
Training Environments X X
Parenthood
X
AIC 12.17 12.01 10.81 10.76 10.73 Gender decomposition following logistic regression estimation, using 2008 and 2010 Survey of Doctorate Recipients data and linked responses from Survey of Earned Doctorates, 1990-2006. Analytic dataset includes 8,829 respondents, each of whom earned a research doctorate in a STEM field from a U.S. institution awarded between 1990 and 2006, inclusive. Outcome variable equals 1 if the individual reported in 2010 that they were self-employed (including unincorporated self-employed), owner of a small business with fewer than 500 employees, or employed by a new business founded in the past five years with fewer than 100 employees. Reported results are average marginal effects using pooled coefficients. Each model includes gender-specific constants, explanatory variables as noted above, as well as interactions of all explanatory variables with female gender. We hypothesized that these gender differences in the effects of prior patents’
licensing/commercialization might be correlated with gender differences in sector of employment. For example, chemical engineering and electrical engineering lead all other fields in PhDs’ licensing and commercialization of patented inventions. But, in these fields, female PhDs are also significantly more likely than male PhDs to be employed in academia.
As Whittington (2011) discusses, the routes to and incentives for patenting strongly differ in academic versus industrial sectors. Because we anticipate that academic faculty participating in licensing and commercialization may have different rates of entry into entrepreneurship overall, and because we know there exist gender differences in
51
academic employment across fields, for the next model we include an indicator for prior academic employment (i.e., was the individual employed in academia as of 2008) and interact that with both female gender and the licensing/commercialization variable.
Our key finding from this model is that, relative to all other STEM PhDs working outside of academia, females who work outside of academia and who recently licensed or commercialized a patented invention are less likely to become entrepreneurs, whereas males in the same situation are more likely to become entrepreneurs.
After field-of-degree, occupational sector, and graduate school training environment variables are controlled for, male STEM PhDs’ industry-sponsored postdoctoral employment and more recent patenting experience have no significant influence on their participation in subsequent entrepreneurial ventures. But for women, entrepreneurship—even conditional on prior patenting—is significantly more common among women who had industry-supported postdoctoral employment.16 For this subset of women, the predicted probability of participating in entrepreneurship is not significantly different from that for men.
We also find that, relative to male STEM PhDs, female STEM PhDs have significantly higher rates of entrepreneurship if they attended graduate programs with higher levels of non-federal R&D funding, or in a university with higher overall patents production. Together with the other variables described above, these variables explain 34 to 48% of the gender gap in STEM fields entrepreneurship.
Finally, parenting young children significantly lowers the probability of entrepreneurial activity in the near term for women, but no significant effect for men.
16 The significant, positive difference in the impact of industry employment for female versus male scientists recalls Lin and Bozeman’s (2006) similar positive result for female—but not male—academic scientists who had prior industry experience.
52
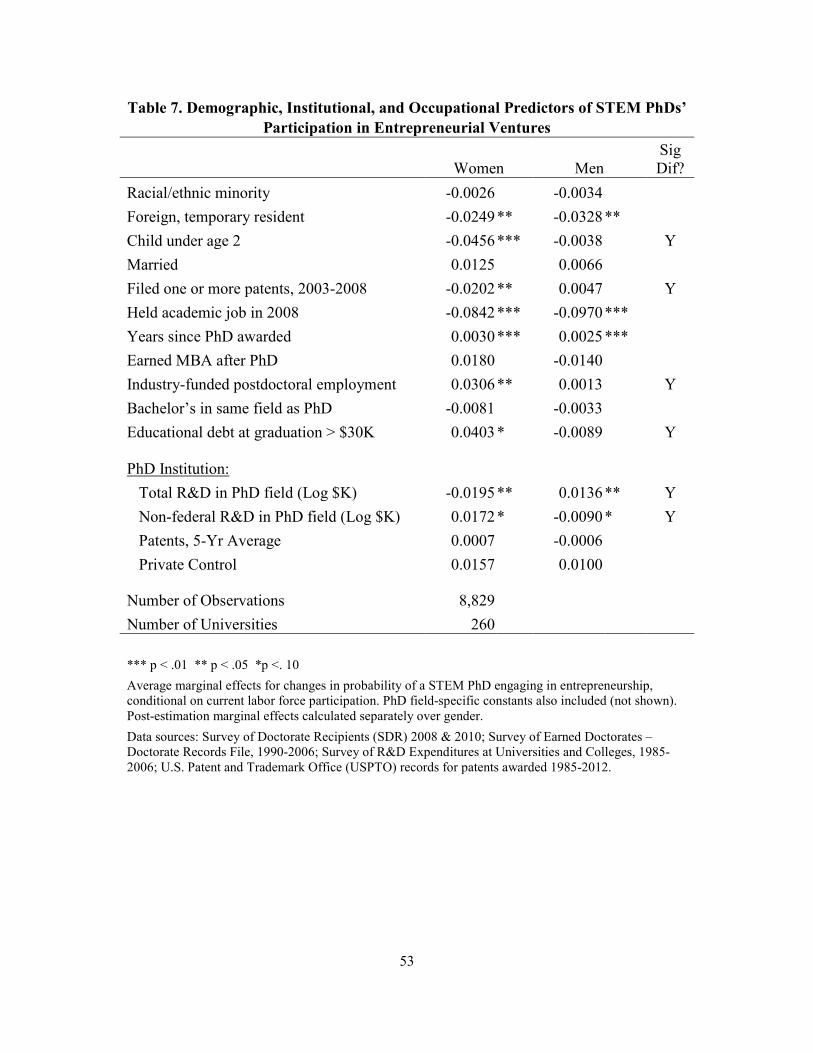
Table 7. Demographic, Institutional, and Occupational Predictors of STEM PhDs’ Participation in Entrepreneurial Ventures
Women Men
Sig Dif?
Racial/ethnic minority -0.0026 -0.0034 Foreign, temporary resident -0.0249 ** -0.0328 ** Child under age 2 -0.0456 *** -0.0038 Y Married 0.0125 0.0066 Filed one or more patents, 2003-2008 -0.0202 ** 0.0047 Y Held academic job in 2008 -0.0842 *** -0.0970 *** Years since PhD awarded 0.0030 *** 0.0025 *** Earned MBA after PhD 0.0180 -0.0140 Industry-funded postdoctoral employment 0.0306 ** 0.0013 Y Bachelor’s in same field as PhD -0.0081 -0.0033 Educational debt at graduation > $30K 0.0403 * -0.0089 Y
PhD Institution: Total R&D in PhD field (Log $K) -0.0195 ** 0.0136 ** Y Non-federal R&D in PhD field (Log $K) 0.0172 * -0.0090 * Y Patents, 5-Yr Average 0.0007 -0.0006 Private Control 0.0157 0.0100
Number of Observations 8,829 Number of Universities 260
*** p < .01 ** p < .05 *p <. 10 Average marginal effects for changes in probability of a STEM PhD engaging in entrepreneurship, conditional on current labor force participation. PhD field-specific constants also included (not shown). Post-estimation marginal effects calculated separately over gender. Data sources: Survey of Doctorate Recipients (SDR) 2008 & 2010; Survey of Earned Doctorates – Doctorate Records File, 1990-2006; Survey of R&D Expenditures at Universities and Colleges, 1985-2006; U.S. Patent and Trademark Office (USPTO) records for patents awarded 1985-2012.
53
Table 7 presents results from our full logistic regression model, with average marginal effects of each explanatory variable on the predicted probability of STEM PhDs’ engaging in entrepreneurship estimated separately for men and women, via inclusion of an indicator variable for female gender as well as interactions between female gender and all explanatory variables shown.
We observe no statistically significant difference in STEM entrepreneurship for racial or ethnic minorities versus non-minority U.S. citizens or permanent residents.17 However, as expected given employment restrictions for foreign temporary residents, their participation in entrepreneurship is significantly lower for both men and women, albeit with no significant difference by gender.
As noted above, having a young child makes a substantial difference for women’s participation in entrepreneurship. Female STEM PhDs with any child under age 2 at home have 4.6 percentage points lower probability of engaging in entrepreneurship of any kind, including unincorporated self-employment, compared to other female STEM PhDs. For male STEM PhDs, the corresponding point estimate is 0.4 percentage points, and is not statistically significant.
Prior patenting also has significantly different effects for men and women. In this model, we use the indicator for having filed any patents, same as the outcome variable for the patenting regressions reported earlier. If we instead use the indicator variable for patents commercialization and licensing, as discussed in the decomposition analysis above, we obtain very similar results.
For both men and women, employment in the academic sector as of 2008 significantly and substantially decreases likelihood of moving into entrepreneurship, all
17 Our analytic dataset includes 50 STEM PhD-entrepreneurs who are racial/ethnic minorities, representing 5.6% of the racial/ethnic minorities surveyed. The point estimate for non-minorities’ participation is 7.0%, and though suggestive, a simple chi-square test comparison of these participation rates also lacks statistical significance (p=.15). However, the lack of significance in the full model is also partly attributable (as for women) to differences in racial/ethnic minorities’ PhD fields. For example, in this sample racial/ethnic minorities are disproportionately more likely to have earned their PhDs in medical sciences, and in both biological and medical sciences, minority and non-minority PhDs have essentially the same rate of entrepreneurship. By contrast, racial/ethnic minority PhD completions in most engineering fields (except electrical) are relatively lower than for other STEM fields, and among those who do earn PhDs in those engineering fields, their rate of entrepreneurship is significantly lower than for non-minority PhDs (2.8% versus 9.3% among non-minority U.S. citizens and permanent residents, p<.01).
54
else equal. Likewise, for both genders, increasing seniority and experience—as measured by years since PhD was awarded—is associated with higher rates of entrepreneurship.
The influences of R&D funding in the graduate training environment also differ significantly for men versus women. For men, their graduate institution’s total volume of R&D in their field is a strong positive predictor, whereas for women, it is specifically the amount of R&D funded by industry and non-federal sources, and its share of the total. The negative sign on total R&D coupled with the positive sign on non-federal R&D indicate the latter: an increase in total R&D due to an increase in federal R&D funding (holding non-federal R&D constant) significantly decreases women’s propensity towards entrepreneurship, whereas an increase in non-federal R&D funding holding total R&D constant (i.e., increasing the non-federal share) significantly increases women’s propensity towards entrepreneurship.
Having their first postdoctoral employment in industry, or with funding from industry sources, also significantly increases women’s probability of subsequent entrepreneurship, by 3.1 percentage points. But for men, the point estimate is again insignificant, only 0.1 percentage points. We also observe a positive sign for women’s earning a MBA or similar degree after their PhD—a significant predictor of women’s patenting in the previous regression set—but with only 30 female STEM PhDs in our sample holding these degrees, this result was imprecisely estimated and is not statistically significant. Finally, though we see negative signs for the estimated effects of earning one’s PhD in the same field as the bachelor’s degree, consistent with our intuition that multidisciplinary academic training may increase propensity towards entrepreneurship, these estimated effects are also not statistically significant.
The one additional result we wish to highlight from this final regression concerns the role of student debt in entrepreneurship. Among female STEM PhDs, having over $30,000 in cumulative higher education debt at the time they complete their PhDs predicts 4.0 percentage points higher probability of entrepreneurship. It is important to note, this debt measure does not reflect current remaining debt loads, which could affect (for example) individuals’ personal access to credit. In fact, when we included additional terms in the model to allow these debt loads to decay over time—that is, so that student debt would have progressively less influence as years since graduation increased—these terms were not significant, and did not improve model fit (per the Akaike Information Criterion). There are several possible explanations for this finding, one of which is that debt-aversion is likely to be negatively correlated with entrepreneurial venturing, especially for high-tech ventures requiring substantial upfront investment. Women who demonstrate willingness to take on significant debt as students might thus be understood as less debt-averse (and possibly less risk-averse) than their same-field, same-gender peers.
55
Seeking Satisfaction: Gender Gaps in Career Preferences?
In this final section, we consider how demographic and occupational characteristics of women with STEM degrees correlate to their job satisfaction, to identify possible opportunities for encouraging higher levels of female representation in science-based innovation entrepreneurial ventures.
Like male entrepreneurs, female entrepreneurs are often motivated by desires for independence, self-achievement, recognition and control. Previous studies have found women entrepreneurs may be more often motivated by occupational flexibility, which allows them the opportunity to balance their work and family obligations, maintaining professional freedom to “do what [they] want to do” while also “making a living” (Morris et al. 2006; Olsen and Currie 1992; Orser and Dyke 2009; Kepler and Shane 2007).
Morris et al. (2006) also found “helping people” was a primary motivator for women entrepreneurs, but—perhaps contrary to common perceptions—regular employment’s barriers to advancement (e.g., “hitting the corporate glass ceiling”) were much less important to women’s entrepreneurial intent.
For entrepreneurs with a high-growth focus, high need for achievement, competitiveness, and feeling challenged may be especially relevant (Stewart and Roth 2007). On the other hand, even though family financial security tends to be very important to women entrepreneurs, they are much less likely than men to indicate that income or “getting rich” motivated their startup (Kepler and Shane 2007; Olsen and Currie 1992; Morris et al. 2006).
Using data on the 13,415 STEM PhDs who responded to both the 2008 and 2010 waves of the Survey of Doctorate Recipients, and who were still in the labor force as of 2010, we find a slightly higher fraction of female STEM PhDs than male STEM PhDs changed employers at least once within the past four years (29%, versus 26% of men, p<.001). However, among STEM PhDs who did change employment, only 7.8% of female job-changers versus 12.7% of male job-changers moved towards entrepreneurial ventures. Interestingly, male and female STEM PhDs who changed jobs during this period were equally likely to enter unincorporated self-employment (1.8% of job changers, both genders).
Overall, 12% of individuals who entered unincorporated self-employment came from academia: 6.3% from 4-year colleges and universities, 5.4% from medical schools, and the remainder from university-affiliated research institutes. Over half of those entering unincorporated self-employment (52%) had worked in industry previously, while another 27% were already self-employed, in another business.
Among those who became small business owners, 74% came from industry and 6.8% from academia, and 11% had previously been self-employed. Finally, among those who changed jobs to join a start-up company, 84% came from industry, with still only 6% from academia, most of them previously working in university-affiliated research institutes. Only 4% of those joining startups as employees were previously self-employed.
56
Among academics who left their jobs to start their own businesses, men and women were equally represented: that is, half of academic entrepreneurs starting new businesses were male, and half were female. By contrast, among job-changers who previously worked in non-academic sectors, only 1 in 5 who became entrepreneurs were female.
Figure 12 presents gender differences in the reasons STEM PhDs present for their decisions to change employers. In general, when female STEM PhDs change employers—whether to work for another large organization or to become entrepreneurs—we find they are significantly more likely than men to do so for a change their working conditions, such as their hours or their working environments: 35% of women and 29% of men mentioned this reason for changing jobs (p=.0001). Similarly, 34% of women versus 31% of men said they switched employment due to changes in their career or professional interests (p=.078), and a significantly higher fraction of women indicated family-related reasons, such as children or spousal employment (17%, versus 11% of men, p<.0001).
On the other hand, male and female STEM PhDs did not significantly differ in the share of each group who said they were motivated by increasing pay, promotion or advancement opportunities, with over half (56%) of both groups citing this reason for changing jobs.
Academic entrepreneurs most commonly cited a change in their career or professional interests as their reason for leaving academia, with 68% of male STEM PhDs and 50% of female STEM PhDs mentioning this among their reasons for changing jobs. Improving working conditions was mentioned by 46% of those who left academia for entrepreneurship, with no difference by gender. Interestingly, among non-academic men who became entrepreneurs, only 31% raised this issue (15% difference versus academic men, p=.12), whereas for women there was no difference by former sector of employment.
Female STEM PhDs in academia were more likely than those outside of academia to change jobs for family-related reasons (19%, versus 13% among non-academic women), especially if they had a spouse or partner who worked full-time in a job that also required at least a bachelor’s degree in science or engineering. Some 29% of female STEM PhDs in academia (and 20% of female STEM PhDs outside of academia) with a spouse or partner also in STEM cited family reasons for their job change, versus only 8.5% among all other female STEM PhDs. Male STEM PhDs in academia with a spouse or partner also working full-time in STEM appear to confront similar issues, with 23% mentioning this concern. Still, overall, only 13% of male STEM PhDs in academia (and 10% outside) said they changed jobs for family reasons (p<.10 for difference by employer sector).
57
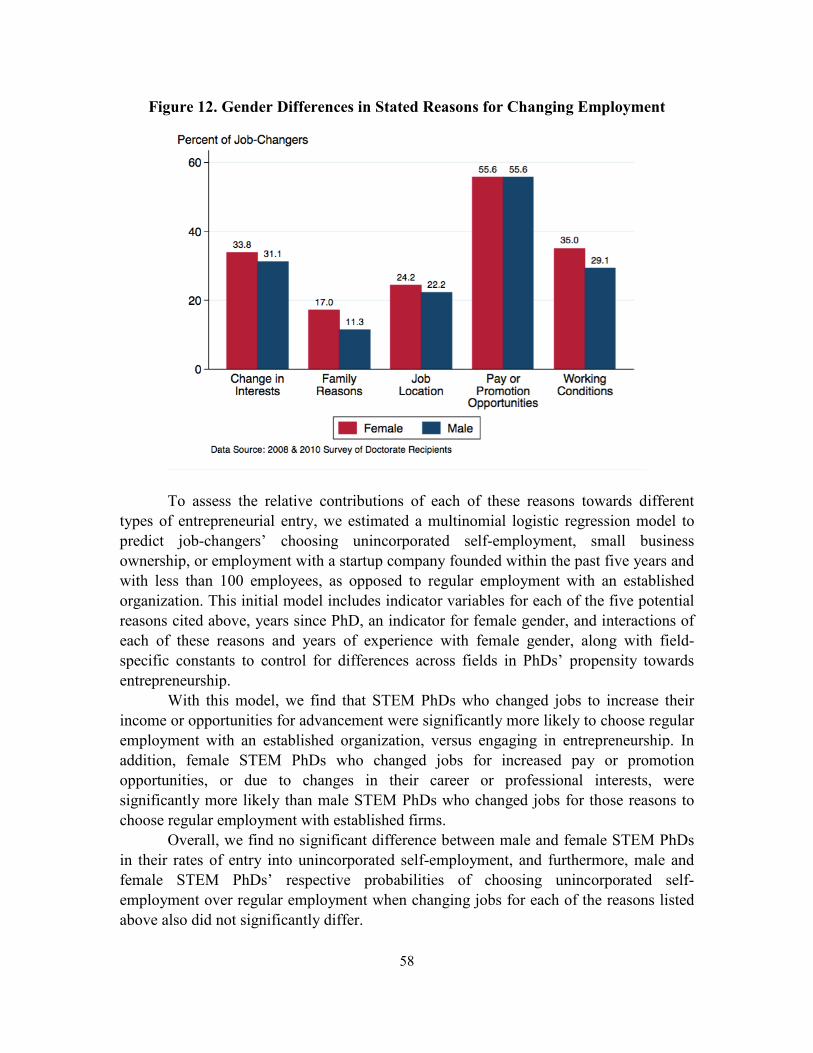
Figure 12. Gender Differences in Stated Reasons for Changing Employment
To assess the relative contributions of each of these reasons towards different
types of entrepreneurial entry, we estimated a multinomial logistic regression model to predict job-changers’ choosing unincorporated self-employment, small business ownership, or employment with a startup company founded within the past five years and with less than 100 employees, as opposed to regular employment with an established organization. This initial model includes indicator variables for each of the five potential reasons cited above, years since PhD, an indicator for female gender, and interactions of each of these reasons and years of experience with female gender, along with field-specific constants to control for differences across fields in PhDs’ propensity towards entrepreneurship.
With this model, we find that STEM PhDs who changed jobs to increase their income or opportunities for advancement were significantly more likely to choose regular employment with an established organization, versus engaging in entrepreneurship. In addition, female STEM PhDs who changed jobs for increased pay or promotion opportunities, or due to changes in their career or professional interests, were significantly more likely than male STEM PhDs who changed jobs for those reasons to choose regular employment with established firms.
Overall, we find no significant difference between male and female STEM PhDs in their rates of entry into unincorporated self-employment, and furthermore, male and female STEM PhDs’ respective probabilities of choosing unincorporated self-employment over regular employment when changing jobs for each of the reasons listed above also did not significantly differ.
58
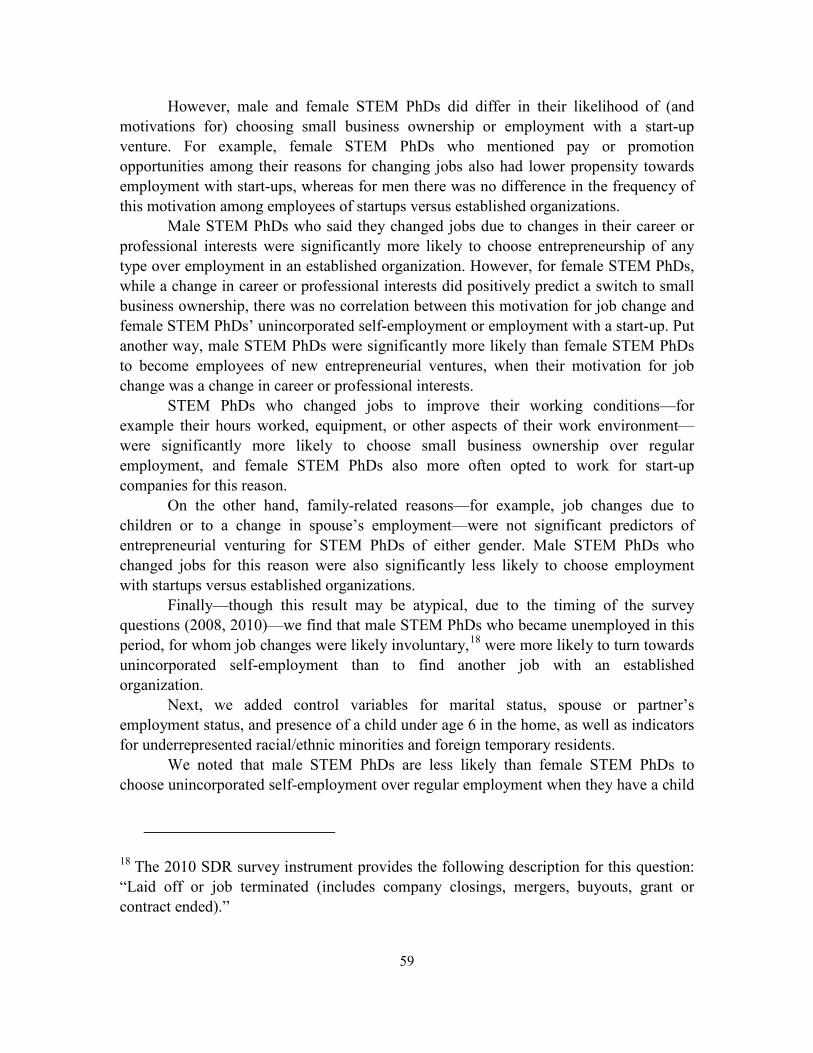
However, male and female STEM PhDs did differ in their likelihood of (and motivations for) choosing small business ownership or employment with a start-up venture. For example, female STEM PhDs who mentioned pay or promotion opportunities among their reasons for changing jobs also had lower propensity towards employment with start-ups, whereas for men there was no difference in the frequency of this motivation among employees of startups versus established organizations.
Male STEM PhDs who said they changed jobs due to changes in their career or professional interests were significantly more likely to choose entrepreneurship of any type over employment in an established organization. However, for female STEM PhDs, while a change in career or professional interests did positively predict a switch to small business ownership, there was no correlation between this motivation for job change and female STEM PhDs’ unincorporated self-employment or employment with a start-up. Put another way, male STEM PhDs were significantly more likely than female STEM PhDs to become employees of new entrepreneurial ventures, when their motivation for job change was a change in career or professional interests.
STEM PhDs who changed jobs to improve their working conditions—for example their hours worked, equipment, or other aspects of their work environment—were significantly more likely to choose small business ownership over regular employment, and female STEM PhDs also more often opted to work for start-up companies for this reason.
On the other hand, family-related reasons—for example, job changes due to children or to a change in spouse’s employment—were not significant predictors of entrepreneurial venturing for STEM PhDs of either gender. Male STEM PhDs who changed jobs for this reason were also significantly less likely to choose employment with startups versus established organizations.
Finally—though this result may be atypical, due to the timing of the survey questions (2008, 2010)—we find that male STEM PhDs who became unemployed in this period, for whom job changes were likely involuntary,18 were more likely to turn towards unincorporated self-employment than to find another job with an established organization.
Next, we added control variables for marital status, spouse or partner’s employment status, and presence of a child under age 6 in the home, as well as indicators for underrepresented racial/ethnic minorities and foreign temporary residents.
We noted that male STEM PhDs are less likely than female STEM PhDs to choose unincorporated self-employment over regular employment when they have a child
18 The 2010 SDR survey instrument provides the following description for this question: “Laid off or job terminated (includes company closings, mergers, buyouts, grant or contract ended).”
59
under age 6 at home. On the other hand, women with children under age 6 at home are significantly less likely than men in the same situation to become small business owners.
In addition, though we observe some evidence suggesting unmarried female STEM PhDs may be less likely than unmarried males to become small business owners (p<.16), there is effectively no difference by gender in unmarried STEM PhDs’ propensity towards employment in startup ventures.
By contrast, female STEM PhDs with a spouse or partner that worked full-time in a non-STEM occupation were significantly more likely—compared both with married men and with all other women—to become small business owners when they changed jobs, instead of pursuing regular employment. Among female STEM PhDs who changed jobs, the probability of becoming small business owners increased by over 5 percentage points if their spouse or partner worked full-time in a non-STEM occupation.
Although PhD field-of-degree, family structure, and motivations for individuals’ job changes account for much of the gender difference in job-changers’ entrepreneurial venturing, this analysis does not identify why female STEM PhDs with spouses or partners working full-time (and in non-STEM fields) would preferentially become entrepreneurs. Moreover, increased pay or promotion opportunities, as well as changes in career or professional interests, remain significantly less important to female STEM PhDs than to male STEM PhDs in their respective decisions to join start-up ventures.
To address these issues further, and also more generally to identify the attitudinal correlates of entrepreneurship, we next added to our model a set of indicators for individuals’ responses to a series of questions on the importance of various job characteristics to their overall job satisfaction.
Job-Related Values and Sources of Job Satisfaction To put this next analysis in context, we begin this sub-section with a description of results reported by the Society for Human Resources Management, from their 2012 Employee Job Satisfaction and Engagement survey (SHRM 2012).
The SHRM survey identified “opportunities to use skills/abilities” as the dominant source of employee engagement for executive, managerial, and professional non-managerial workers, especially at firms with fewer than 100 employees. Over 70% of workers with college or post-graduate education identified this aspect of their job as “very important” to their job satisfaction, versus 49% of those with less than college education. However, only 36% of workers report being “very satisfied” with their opportunities to use their skills and abilities. Indeed, the only job aspects for which the survey found a greater gap between the share of workers who found an aspect “very important” and the share who were “very satisfied” were compensation, job security, and communication between employees and senior management.
Highly-educated professional workers in the SHRM survey often identified “autonomy and independence” as a salient factor in engagement, and they were more likely than less-educated workers to cite “meaningfulness of the job” as a key factor in
60
their job satisfaction (though only 33% of workers report being “very satisfied” with this aspect of their job). On the other hand, the SHRM survey found that employees in small businesses were overwhelmingly less likely to emphasize importance of their job’s benefits.
None of the job attributes and preferences we mention above differed significantly for men versus women in the SHRM survey. However, that survey did document key gender difference: women more frequently stated having a variety of work was important to them (37% versus 29%). Women also placed greater priority than men on the overall corporate culture (52% vs. 40%), and related organizational commitments to a diversity, inclusiveness, and a “green” workplace. The organization’s commitment to social responsibility likewise was more important to women (33% vs. 21%), but this divided along occupational lines as well, with executives much more likely to cite it than professional non-management employees. Finally, women were more likely than men to cite relationships with co-workers as a very important source of job satisfaction (44% vs. 35%).
Using the SDR data, we compared results by gender for several similar measures of job satisfaction to those described above, for STEM PhDs who do and do not engage in entrepreneurial ventures. Specific job attributes asked about in the 2010 SDR include: salary, benefits, job security, job location, opportunities for advancement, intellectual challenge, level of responsibility, degree of independence, and contribution to society.19 For each of these job attributes, we coded an explanatory variable with value 1 if the respondent said that attribute was “very important” to them, and 0 otherwise. Then, for each job attribute, we coded an additional explanatory variable with value 1 if they said they were “very satisfied” with that aspect of their job, and 0 otherwise.
We then estimated both binomial logistic regression models to predict any entrepreneurial venture as of 2010, as well as multinomial logistic regression models to compare probabilities of engaging in unincorporated self-employment, small business ownership, or employment in a new venture, versus regular employment with an established organization. Variables for importance and satisfaction derived from each job attribute mentioned above were included, as well as interactions between importance and satisfaction for each attribute, and then both of those interacted with female gender. Field-specific constants, indicators for racial/ethnic minority and foreign temporary resident status, and indicators for marital status, spouse/partner working full-time, and presence of a child under age 6 were also included. Salient results from our econometric models are reported in Table 8, and described below.
19 The survey instrument asks, “When thinking about a job, how important is each of the following factors to you?” Responses are coded on a 4-point scale, as “Very important,” “Somewhat important,” “Somewhat unimportant,” or “Not important at all.”
61
Job Security and Benefits. STEM PhDs who indicated that job security is important to them were significantly less likely to have changed jobs in the past four years, overall. In addition, those who said job security was “very important” to them were also significantly less likely to participate in entrepreneurship, with no difference by gender. Male and female STEM PhDs who placed relatively lower value on job benefits were significantly more likely to engage in entrepreneurship, with no difference in that case by gender or marital status. However, STEM PhDs who reported that either (a) high satisfaction with their job benefits, or (b) job benefits were very important to them, were significantly less likely to be engaged in entrepreneurship, whereas those who reported both (a) and (b) were least likely of all. We explore this job benefits issue in more detail in the last subsection of this chapter. Salary and Opportunities for Advancement. Both male and female STEM PhDs were more likely to have changed jobs in the past four years if they said salary or opportunities for advancement were important to them. Male STEM PhDs who judged salary as “very important” were significantly more likely to engage in entrepreneurship versus those who said that factor was less important to them. In addition, among STEM PhDs for whom salary is “very important,” both male and female STEM PhD-entrepreneurs were significantly more likely to be “very satisfied” with their salaries, as compared to those regularly employed. For women, this is particularly true among those who are unincorporated self-employed.
Similarly, both male and female STEM PhD-entrepreneurs were more likely to be very satisfied with their job’s opportunities for advancement, compared with those who were regularly employed. STEM PhDs who felt opportunities for advancement were very important, and who were very satisfied with those opportunities, were especially more likely to own small businesses. For men, this was also the case for those employed in startup ventures, though that did not hold true for women. Overall, for women, high satisfaction with their job’s opportunities for advancement was significantly less predictive of entrepreneurship than it was for men. Independence and Responsibility. Overall, we found no significant difference in STEM PhDs’ probability of entrepreneurship based on the importance they placed on their job’s degree of independence. However, both male and female STEM PhDs who engaged in entrepreneurship were more likely to say they were very satisfied with that aspect of their job. In addition, as shown in Table 8, multinomial logistic regression reveals that female STEM PhDs who value professional independence most highly are more likely to engage in unincorporated self-employment versus regular employment, whereas male STEM PhDs who share that value tend more often to become small business owners.
Male STEM PhDs who emphasized the importance of their job’s level of responsibility were more often very satisfied with that aspect of their job as entrepreneurs. On the other hand, male entrepreneurs were significantly less likely than
62
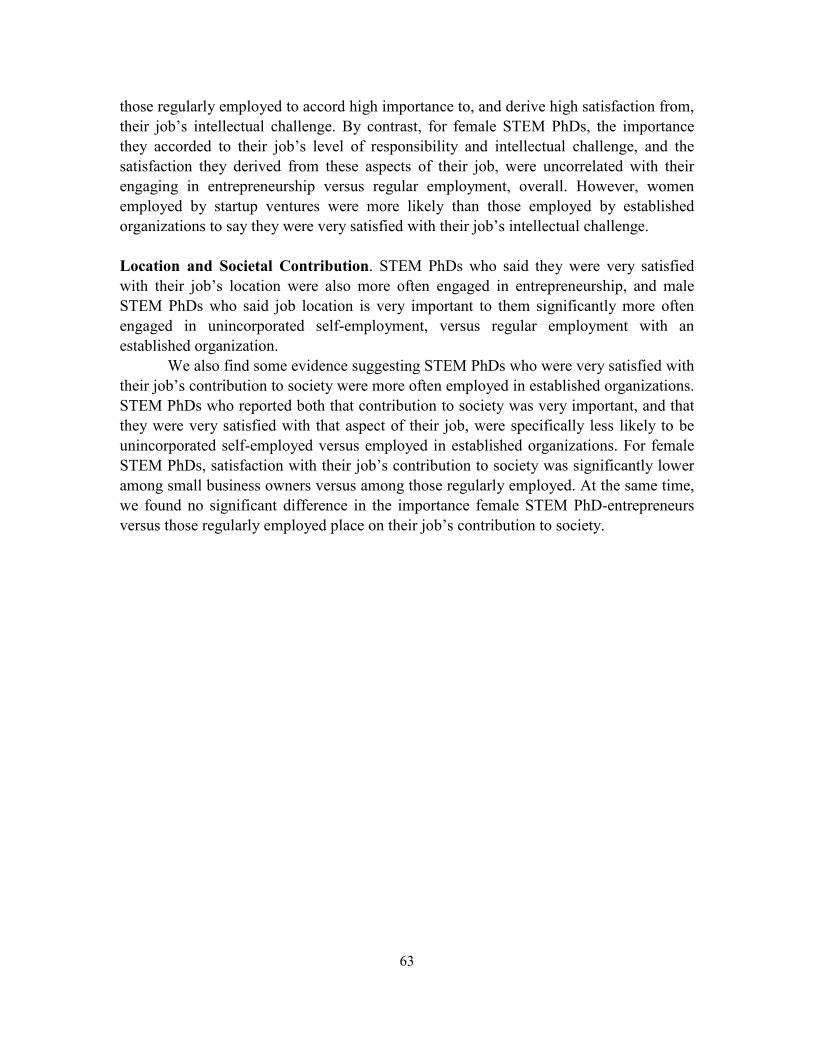
those regularly employed to accord high importance to, and derive high satisfaction from, their job’s intellectual challenge. By contrast, for female STEM PhDs, the importance they accorded to their job’s level of responsibility and intellectual challenge, and the satisfaction they derived from these aspects of their job, were uncorrelated with their engaging in entrepreneurship versus regular employment, overall. However, women employed by startup ventures were more likely than those employed by established organizations to say they were very satisfied with their job’s intellectual challenge. Location and Societal Contribution. STEM PhDs who said they were very satisfied with their job’s location were also more often engaged in entrepreneurship, and male STEM PhDs who said job location is very important to them significantly more often engaged in unincorporated self-employment, versus regular employment with an established organization.
We also find some evidence suggesting STEM PhDs who were very satisfied with their job’s contribution to society were more often employed in established organizations. STEM PhDs who reported both that contribution to society was very important, and that they were very satisfied with that aspect of their job, were specifically less likely to be unincorporated self-employed versus employed in established organizations. For female STEM PhDs, satisfaction with their job’s contribution to society was significantly lower among small business owners versus among those regularly employed. At the same time, we found no significant difference in the importance female STEM PhD-entrepreneurs versus those regularly employed place on their job’s contribution to society.
63
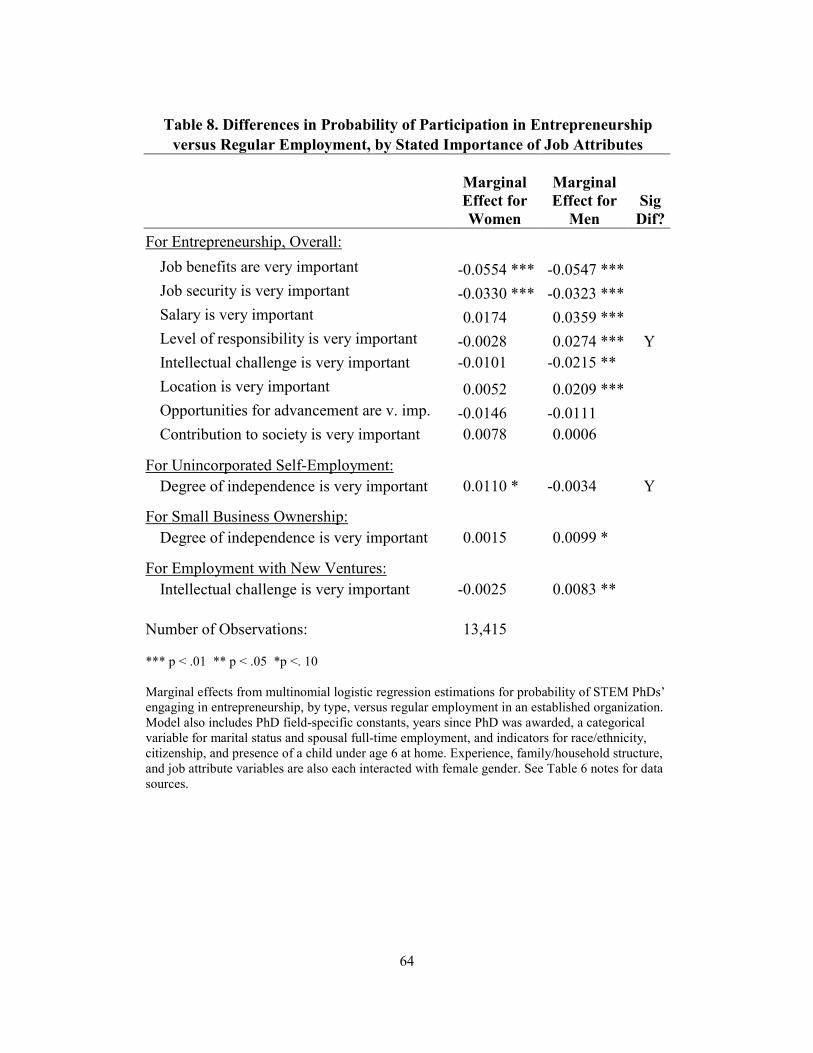
Table 8. Differences in Probability of Participation in Entrepreneurship
versus Regular Employment, by Stated Importance of Job Attributes
Marginal Effect for Women
Marginal Effect for
Men Sig Dif?
For Entrepreneurship, Overall: Job benefits are very important -0.0554 *** -0.0547 *** Job security is very important -0.0330 *** -0.0323 *** Salary is very important 0.0174 0.0359 *** Level of responsibility is very important -0.0028 0.0274 *** Y Intellectual challenge is very important -0.0101 -0.0215 ** Location is very important 0.0052 0.0209 *** Opportunities for advancement are v. imp. -0.0146 -0.0111 Contribution to society is very important 0.0078 0.0006
For Unincorporated Self-Employment: Degree of independence is very important 0.0110 * -0.0034 Y
For Small Business Ownership: Degree of independence is very important 0.0015 0.0099 *
For Employment with New Ventures: Intellectual challenge is very important -0.0025 0.0083 **
Number of Observations: 13,415 *** p < .01 ** p < .05 *p <. 10 Marginal effects from multinomial logistic regression estimations for probability of STEM PhDs’ engaging in entrepreneurship, by type, versus regular employment in an established organization. Model also includes PhD field-specific constants, years since PhD was awarded, a categorical variable for marital status and spousal full-time employment, and indicators for race/ethnicity, citizenship, and presence of a child under age 6 at home. Experience, family/household structure, and job attribute variables are also each interacted with female gender. See Table 6 notes for data sources.
64
Job Satisfaction is Higher, Overall, for STEM PhD-Entrepreneurs Overall, 45% of STEM PhDs employed by established organizations say they are “very satisfied” with their job. But STEM PhD-entrepreneurs are significantly more likely to report high levels of job satisfaction, especially those who own their own businesses. We found that 62% of male STEM PhDs and 54% of female STEM PhDs who own their own businesses say they are “very satisfied” with their jobs. What contributes to this higher level of satisfaction?
Among male STEM PhDs who are small business owners, over half say they are very satisfied with their job’s opportunities for advancement, compared with only 22% of male STEM PhDs in regular employment. Overall, male STEM PhDs who are self-employed are much more likely to be satisfied or very satisfied with their levels of intellectual challenge, independence, and responsibility—job attributes that male STEM PhD-entrepreneurs also tend more often to say are very important to them.
Among female STEM PhDs, a higher proportion of small business owners are similarly very satisfied with their opportunities for advancement, intellectual challenge, and responsibility. But overall, female STEM PhD-entrepreneurs are substantially more likely to express high satisfaction with their job’s degree of independence, an attribute which Table 8 suggests is of especially high importance among self-employed women.
We suspected that the relatively higher satisfaction we observe among female STEM PhD-entrepreneurs with their job’s independence and responsibility might partly be due to differences in their typical work activities, versus the work activities pursued by female STEM PhDs in established organizations. Similar to the SHRM’s finding that women more often say having a variety of tasks is important to them, among STEM PhDs we observe that women who engage in a greater number of work activities report higher overall job satisfaction. Female STEM PhDs who report being “very satisfied” with their jobs, overall, averaged 3.94 different tasks, compared to 3.80 tasks among those dissatisfied with their jobs. In addition, female STEM PhDs who were small business owners identified on average 4.05 tasks, versus 3.91 tasks among those with regular employment.
In addition to work activities, we also observed above that entrepreneurs are less likely than those employed in established organizations to say they prioritize job benefits. Among STEM PhD-entrepreneurs who have a spouse or partner who works full-time, only 1 in 3 say job benefits are “very important.” But, among STEM PhDs who are unmarried or whose spouse or partner is not working full-time, 64% of women and 58% of men say job benefits are “very important”. At the same time, female STEM PhDs are more likely than males to be dissatisfied with their job benefits, and—as shown in Figure 13—for both genders, dissatisfaction with benefits is also typically higher among entrepreneurs.
65
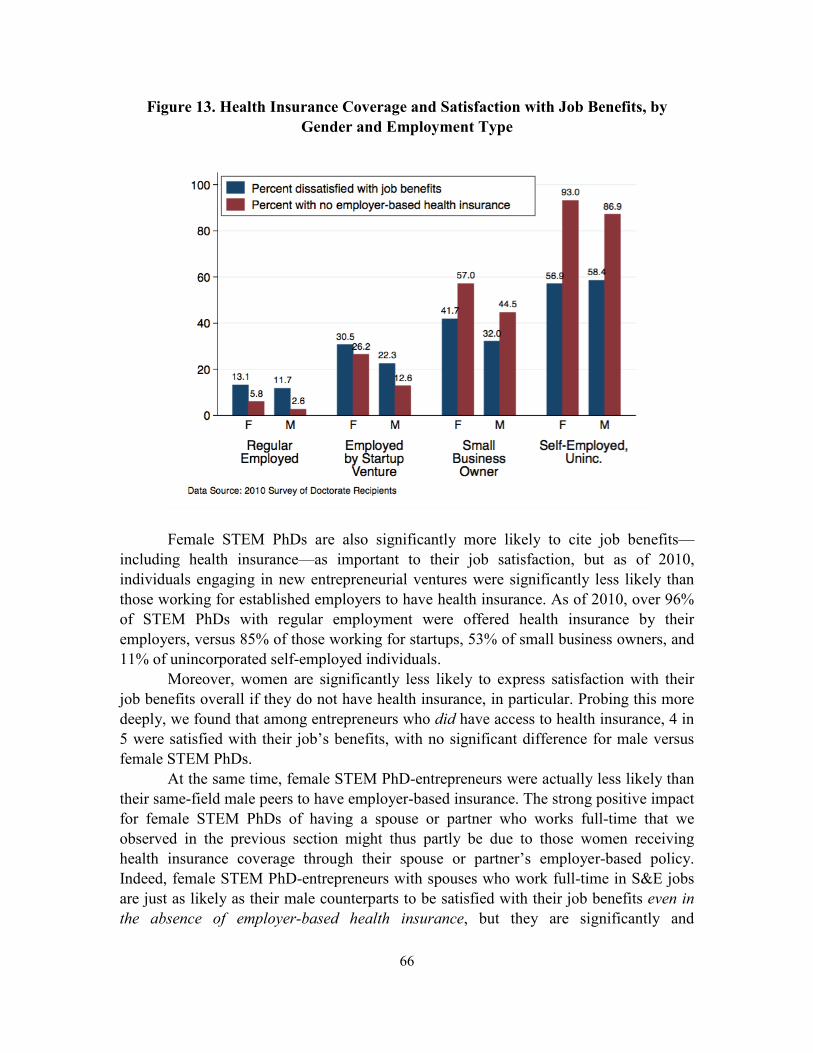
Figure 13. Health Insurance Coverage and Satisfaction with Job Benefits, by Gender and Employment Type
Female STEM PhDs are also significantly more likely to cite job benefits—
including health insurance—as important to their job satisfaction, but as of 2010, individuals engaging in new entrepreneurial ventures were significantly less likely than those working for established employers to have health insurance. As of 2010, over 96% of STEM PhDs with regular employment were offered health insurance by their employers, versus 85% of those working for startups, 53% of small business owners, and 11% of unincorporated self-employed individuals.
Moreover, women are significantly less likely to express satisfaction with their job benefits overall if they do not have health insurance, in particular. Probing this more deeply, we found that among entrepreneurs who did have access to health insurance, 4 in 5 were satisfied with their job’s benefits, with no significant difference for male versus female STEM PhDs.
At the same time, female STEM PhD-entrepreneurs were actually less likely than their same-field male peers to have employer-based insurance. The strong positive impact for female STEM PhDs of having a spouse or partner who works full-time that we observed in the previous section might thus partly be due to those women receiving health insurance coverage through their spouse or partner’s employer-based policy. Indeed, female STEM PhD-entrepreneurs with spouses who work full-time in S&E jobs are just as likely as their male counterparts to be satisfied with their job benefits even in the absence of employer-based health insurance, but they are significantly and
66
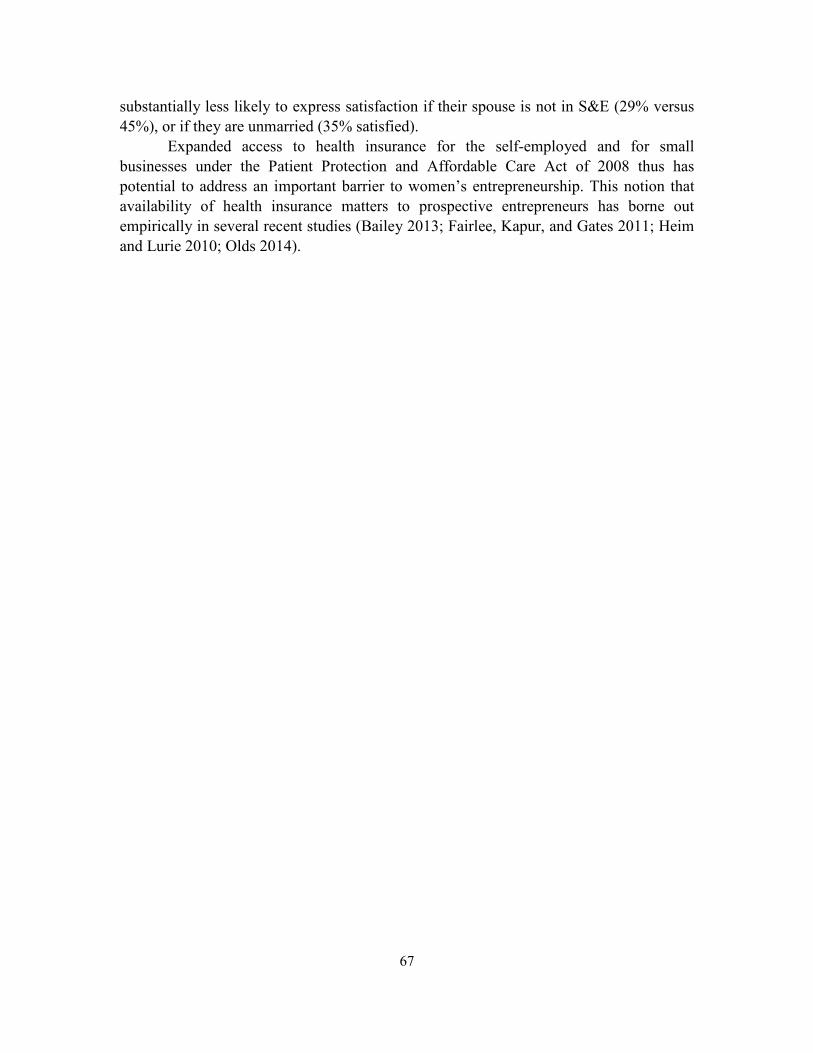
substantially less likely to express satisfaction if their spouse is not in S&E (29% versus 45%), or if they are unmarried (35% satisfied).
Expanded access to health insurance for the self-employed and for small businesses under the Patient Protection and Affordable Care Act of 2008 thus has potential to address an important barrier to women’s entrepreneurship. This notion that availability of health insurance matters to prospective entrepreneurs has borne out empirically in several recent studies (Bailey 2013; Fairlee, Kapur, and Gates 2011; Heim and Lurie 2010; Olds 2014).
67
Conclusions
This report examined multiple data sources for evidence to help explain persistent and systematic differences between highly-educated men and women across STEM fields in their respective rates of participation in entrepreneurship, highlighting significant findings that may help to inform policy or non-governmental interventions, including among higher education administrators. At the same time, these analyses and their limitations also identify subjects for which additional data collection and further research may be warranted.
Implications for Policy and Practice
Across all STEM fields, female PhDs have lower rates of patenting and entrepreneurship than do male PhDs. This report finds that over half of the gender gap in patenting and over two-thirds of the gap in STEM PhDs entrepreneurship—55% and 68%, respectively—can be attributed to gender differences in the distribution of PhD fields, sectors of employment (specifically academia), experience and seniority, graduate and postdoctoral training environments, and effects of parenthood.
Seeking Faculty Mentors. In the STEM fields with lowest female representation among U.S.-earned PhDs—aerospace, mechanical, and electrical engineering—as well as in computer science, math and statistics, we find that female graduate students disproportionately enroll in programs with relatively higher shares of female faculty. Unfortunately, this tendency also correlates with female students’ disproportionate enrollment in lower-ranked and less research-intensive programs.
To be clear, across the majority of STEM fields, conditional on academic employment in a PhD-granting department, we found no evidence that female STEM faculty members are disproportionately hired into lower-ranked programs. In fact, we find that female faculty members in chemical engineering, civil engineering, and physics and astronomy were actually more often employed by higher-ranked departments and programs. This is consistent with recent evidence by Ceci et al. (2014), who found no evidence of bias in faculty hiring across STEM fields. But because higher-ranked departments are often also bigger departments with higher faculty employment overall, within any given department, female faculty as a percentage of the total may still be small.
Thus, what seems to matter more to female graduate student enrollment in these least-representative STEM fields is not just whether female faculty mentors are present in the department or program, but also the extent to which they are outnumbered. Interventions in larger research-intensive institutions that help to provide female students with a more intimate group of students and female faculty mentors may improve these
68
students’ subsequent innovative activity and participation in entrepreneurial ventures, where at present women in these fields are substantially less likely than men to join start-up companies, despite their similar rates of small business ownership. Different Training Environments. This report finds that female STEM PhDs who attend universities with a higher share of industry or other non-federal R&D funding in their field are more likely to engage in entrepreneurship later in their careers. This ‘imprinting’ effect has been observed in previous studies (see, for example, Bercovitz and Feldman (2008)), but here we find the effect for women is significantly higher than for men, and is also in the opposite direction. Male STEM PhDs who attended universities that had higher overall research volume in their fields were significantly more likely to become entrepreneurs, and federally-funded research was relatively more important. For women, overall research intensity only mattered to the extent that it was non-federally-funded.
Given this significantly stronger influence of industry and other non-federal R&D funding in female STEM PhDs’ graduate training environments for their subsequent entrepreneurship, it is particularly of note that female graduate students in chemical and mechanical engineering disproportionately enroll in programs with no industry-funded R&D. Moreover, within STEM fields, PhD-granting programs with a higher percentage of their full-time graduate students funded by external private sector sources (including, for example, industry-funded research assistantships) tend also to have significantly lower representation of female students. In addition, in some STEM PhD-granting departments—particularly those in materials science and chemical engineering—female students are disproportionately less likely than their male classmates to receive their primary funding from these sources.
Different Work Activities—by Choice? In electrical engineering, biological sciences, and chemistry, female PhD students disproportionally enroll in departments with larger undergraduate populations. The higher ratio of undergraduate majors to graduate students in these departments may emphasize providing students with opportunities to focus on their teaching portfolios, which in turn may help to explain the interesting bifurcation of careers we observe in biological and medical sciences faculty, where female faculty are more likely than male faculty to have positions that either focus exclusively on research (e.g., postdocs and research faculty positions) or focus exclusively on teaching (e.g., teaching faculty, lecturers, and adjunct instructors).
In some STEM fields, such as physics and astronomy, female faculty members also typically spend significantly greater time on teaching and less time on research than their male colleagues, despite their significantly greater representation among faculty in the most prestigious departments and programs.
As noted earlier, the presence of devoted and enthusiastic female faculty mentors at the undergraduate and graduate levels is important for student retention in STEM fields, and especially in fields with low overall representation of women. Further research
69
might provide specific policy recommendations with respect to prioritization of academic versus entrepreneurial employment outcomes among female STEM PhDs in these fields.
Relatedly, it is also important to understand whether the continuing gender gap in occupational activities we observe in some STEM fields, with women disproportionately represented in teaching-focused careers, reflects individual preferences or other issues such as structural barriers, discriminatory practices, or field-specific professional culture. For the latter, additional field-specific research using common analytical frameworks is needed to parse these potential influences. Opportunities for Engagement. What opportunities might exist to translate the apparent desire for research-focused careers among female chemists and engineers into higher rates of entrepreneurship? Chemistry and chemical engineering, in particular, have more equitable representation of women across PhD-granting departments and programs, and female faculty in these fields reported significantly higher research activity than their male colleagues, including a smaller gap in career patents than most other fields. However, female PhDs in chemistry and chemical engineering are significantly less likely than their male classmates to have been funded by industry or other external private sector sources as graduate students, and they are also less likely to engage in entrepreneurship.
This report observed strong positive correlations between female PhD’s entrepreneurial venturing and their (a) earning PhDs from programs with higher levels of non-federally-funded R&D expenditure, and/or (b) their taking postdoctoral employment in industry or funded by industry sources. These findings suggest possible avenues to increase women’s entrepreneurship, especially in chemistry and chemical engineering, materials science, and mechanical engineering, by providing greater opportunities for industry-sponsored research earlier in their careers. In many other engineering fields—fields which produce more patents and PhD-entrepreneurs than other scientific disciplines—the female share of research-focused postdocs and faculty members is also increasing, which may help to close the gender gap in STEM fields entrepreneurship as these women gain experience and greater professional seniority.
Directions for Further Research The descriptive analyses presented in this report are intended to highlight differences between male and female STEM PhDs in their typical institutional training environments, as well as differences in the relative importance of various occupational characteristics, as a window into possible reasons for continuing gender disparities in STEM fields entrepreneurship. None of these correlations should be interpreted as “proving” causality. For example, although we do find that—controlling for field of degree—female PhDs are more likely to have recently applied for a patent if they earned their PhD at a university that produced more patent applications at the time they attended, we cannot infer that
70
placing female students in PhD programs at universities with higher patenting rates will necessarily cause them to patent inventions later in their careers. However, coupled with our descriptive findings, these limitations point toward possible policy experiments to evaluate effectiveness of different interventions that could increase female STEM PhDs’ exposure to industry-funded research and commercially-focused mentors (including academic faculty who patent), as well as policies that might provide greater support for female STEM PhDs’ continued research productivity while parenting young children.
Male and female STEM PhDs who engage in entrepreneurial ventures are significantly more likely to report high levels of job satisfaction. However, female STEM PhDs tend to place greater emphasis than their male colleagues on the importance of job benefits, particularly health insurance, in assessing job satisfaction. Entrepreneurial ventures have historically been less likely to offer such benefits, which may also explain some of the observed gender gap in entrepreneurship. New options and incentives for small business owners to acquire health insurance under the Affordable Care Act legislation provide a sort of natural experiment that could be tapped to investigate whether alleviating this source of job dissatisfaction encourages women’s participation in entrepreneurship.
This report also found that presence of a young child (under age 6) at home yields a significant, short-run decrease in female scientists’ patenting and entrepreneurial venturing, with no comparable effects for men. Together with differences in the gender distribution of PhD fields-of-degree and differences in graduate training environments, we find that differences in occupational activities, employment sector, and motherhood explain most of the gender gap in patenting and entrepreneurship. If the academic sector in general, and teaching-focused positions in particular, provide women scientists with more supportive and flexible environments during their childbearing years, then—since academics, on average, have lower rates of patenting and switching to entrepreneurship, compared with those in other sectors—the gender gap in patenting and entrepreneurship may be difficult to close. More research and data are needed to understand how policies may differ across sectors and employers, and the relative importance of these policies to female scientists’ career choices.
Biological and medical sciences produce more academic patents than any other field, and female representation in these fields is approaching parity, especially among postdocs and research-focused faculty members. Given the magnitude of academic entrepreneurship in biological and medical sciences and their approaching steady-state gender dynamics, additional research is needed to determine whether gender disparities in biomedical sciences patenting and entrepreneurship will continue to decline as one would expect. If not, additional research will be necessary to identify any remaining actual or perceived barriers for women’s participation in biomedical sciences innovation and entrepreneurial ventures. For example, while women’s participation in biological and medical sciences research has increased, continued weakening in venture capital markets for early-stage life science firms may have disproportionately impacted women’s nascent STEM-based entrepreneurial ventures.
71
Although we did include medicine and closely related health sciences (e.g., veterinary medicine, environmental health sciences, pharmacy, etc.) in this study, we excluded some allied health services fields that also offer research doctorates, such as physical therapy and rehabilitation, audiology and communication disorders, and nursing. Descriptive analyses of trends in self-employment, research orientation, and gender differences in participation suggest these health service-oriented fields are again fundamentally different from most of the other STEM fields discussed in this report, but are similar to those observed for clinical psychology, which we also excluded. Excluding clinical psychology, allied health sciences, and other health-related social sciences from this study did help narrow our focus towards those sciences which tend towards higher-growth, innovation-based entrepreneurship. At the same time, from a social welfare perspective, innovative research activities and entrepreneurial venturing in the social and behavioral sciences ought not be overlooked. Future research focusing on the societal and economic contributions of individuals trained in social and behavioral sciences would serve to complement the existing literature.
72
References
Aldridge, T. Taylor, and David Audretsch. 2011. "The Bayh-Dole Act and scientist entrepreneurship." Research Policy no. 40:1058-1067.
Audretsch, David B. 1995. Innovation and Industry Evolution. Cambridge, MA: MIT Press.
Bailey, James. 2013. Health insurance and the supply of entrepreneurs: new evidence from the Affordable Care Act's dependent coverage mandate, Department of Economics, Temple University, Philadelphia, PA.
Baumol, William J. 2004. "Entrepreneurial enterprises, large established firms and other components of the free-market growth machine." Small Business Economics no. 23 (1):9-21.
———. 2010. The Microtheory of Innovative Entrepreneurship. Princeton: Princeton University Press.
Bercovitz, Janet, and Maryann Feldman. 2008. "Academic entrepreneurs: organizational change at the individual level." Organization Science no. 19 (1):69-89.
Blume-Kohout, Margaret E., Krishna B. Kumar, and Neeraj Sood. 2014. "University R&D funding strategies in a changing federal funding environment." Science and Public Policy (in press).
Boardman, P. Craig, and Branco L. Ponomariov. 2009. "University researchers working with private companies." Technovation no. 29 (8):142-153.
Bozeman, Barry, and Monica Gaughan. 2007. "Impacts of grants and contracts on academic researchers' interactions with industry." Research Policy no. 36 (5):694-707.
Braunerhjelm, Pontus. 2011. "Entrepreneurship, innovation and economic growth: interdependencies, irregularities and regularities." In Handbook of Research on Innovation and Entrepreneurship, edited by David B. Audretsch, Oliver Falck, Stephan Heblich and Adam Lederer, 161-213. Northampton, MA: Edward Elgar.
Brush, Candida, Nancy M. Carter, Elizabeth Gatewood, Patricia G. Greene, and Myra Hart. 2003. "Venture capital access: is gender an issue?" In The Emergence of Entrepreneurship Policy: Governance, Start-Ups, and Growth in the US Knowledge Economy, edited by David M. Hart, 141-154. Cambridge, UK: Cambridge University Press.
Bureau of Economic Analysis. 2014. Gross Domestic Product by Industry Data. U.S. Department of Commerce, 23 January 2014 [cited 25 August 2014]. Available from http://www.bea.gov/industry/gdpbyind_data.htm.
73
Carter, Nancy M., and Kathleen R. Allen. 1997. "Size determinants of women-owned businesses: choice or barriers to resources?" Entrepreneurship & Regional Development no. 9 (3):211-220.
Ceci, Stephen J., Donna K. Ginther, Shulamit Kahn, and Wendy M. Williams. 2014. "Women in academic science: explaining the gap." Psychological Science in the Public Interest no. forthcoming.
Cohen, Wesley M., Richard R. Nelson, and John P. Walsh. 2002. "Links and impacts: the influence of public research on industrial R&D." Management Science no. 48 (1):1-23.
Coleman, Susan, and Alicia Robb. 2012a. "Gender-based firm performance differences in the United States: examining the roles of financial capital and motivations." In Global Women's Entrepreneurship Research: Diverse Settings, Questions, and Approaches, edited by Karen D. Hughes and Jennifer E. Jennings. Northampton, MA: Edward Elgar.
———. 2012b. A Rising Tide: Financing Strategies for Women-Owned Firms. Stanford, CA: Stanford University Press.
Colombo, Massimo, Philippe Mustar, and Mike Wright. 2010. "Dynamics of science-based entrepreneurship." Journal of Technology Transfer no. 35 (1):1-15.
Ding, Waverly W., Fiona Murray, and Toby E. Stuart. 2006. "Gender differences in patenting in the academic life sciences." Science no. 313:665-667.
Fairlee, Robert W. 1999. "The absence of the African-American owned business: an analysis of the dynamic of self-employment." Journal of Labor Economics no. 17 (1):80-108.
Fairlee, Robert W., Kanika Kapur, and Susan Gates. 2011. "Is employer-based health insurance a barrier to entrepreneurship?" Journal of Health Economics no. 30 (1):146-162.
Fritsch, Michael. 2011. "Start-ups in innovative industries: causes and effects." In Handbook fo Research on Innovation and Entrepreneurship, edited by David B. Audretsch, Oliver Falck, Stephan Heblich and Adam Lederer, 365-381. Northampton, MA: Edward Elgar.
Ginther, Donna K. 2008. Does scientific innovation lead to entrepreneurship? A comparison of academic and industry sectors. In mimeo, edited by University of Kansas.
Goethner, Maximilian, Martin Obschonka, Rainer K. Silbereisen, and Uwe Cantner. 2012. "Scientists' transition to academic entrepreneurship: economic and psychological determinants." Journal of Economic Psychology no. 33 (3):628-641.
Greene, Patricia G., Candida G. Brush, Myra M. Hart, and Patrick Saparito. 2001. "Patterns of venture capital funding: is gender a factor?" Venture Capital no. 3 (1):63-83.
74
Hall, Bronwyn H., Adam B. Jaffe, and Manuel Trajtenberg. 2001. The NBER patent citations data file : lessons, insights and methodological tools. Cambridge, MA: National Bureau of Economic Research.
———. 2002. "The NBER patent-citations data file: lessons, insights, and methodological tools." In Patents, Citations, and Innovations: A Window on the Knowledge Economy, edited by Adam B. Jaffe and Manuel Trajtenberg. Cambridge, MA: MIT Press.
Heim, Bradley T., and Ithai Z. Lurie. 2010. "The effect of self-employed health insurance subsidies on self-employment." Journal of Public Economics no. 94 (11-12):995-1007.
Hisrich, Robert, and Candida Brush. 1984. "The woman entrepreneur: management skills and business problems." Journal of Small Business Management no. 22 (1):30-37.
Hunt, Jennifer, Jean-Philippe Garant, Hannah Herman, and David J. Munroe. 2013. "Why are women underrepresented amongst patentees?" Research Policy no. 42:831-843.
Kelley, Donna J., Abdul Ali, Candida Brush, Andrew C. Corbett, Mahdi Majbouri, and Edward G. Rogoff. 2012. 2012 United States Report. In Global Entrepreneurship Monitor. Wellesley, MA: Babson College.
Kepler, Erin, and Scott Shane. 2007. Are Male and Female Entrepreneurs Really That Different? Washington, DC: U.S. Small Business Administration Office of Advocacy.
Lai, Ronald, Alexander D'Amour, Amy Yu, David M. Doolin, and Lee Fleming. 2013. Disambiguation and Co-authorship Networks of the U.S. Patent Inventor Database (1975-2010). edited by Harvard Institute of Quantitative Social Science Harvard Business School: Harvard Dataverse Network.
Lin, Min-Wei, and Barry Bozeman. 2006. "Researchers' industry experience and productivity in university-industry research centers: a 'scientific and technical human capital' explanation." Journal of Technology Transfer no. 31 (2):269-290.
Mayer, Heike. 2006. Economic trends and location patterns of women high-tech entrepreneurs. Frontiers of Entrepreneurship Research 26 (11), http://digitalknowledge.babson.edu/fer/vol26/iss11/1/.
McQuaid, Jim, Laurel Smith-Doerr, and Daniel J. Monti. 2010. "Expanding entrepreneurship: female and foreign-born founders of New England biotechnology firms." American Behavioral Scientist no. 53 (7):1045-1063.
Miller, Claire Cain. 2014. "Technology's Man Problem." New York Times, 6 April.
Morris, Michael H., Nola N. Miyasaki, Craig E. Watters, and Susan M. Coombes. 2006. "The dilemma of growth: understanding venture size choices of women entrepreneurs." Journal of Small Business Management no. 44 (2):221-244.
75
National Science Foundation, and National Center for Science and Engineering Statistics. 2014. Domestic R&D paid for and performed by the company, by industry, by company size: 2010 2013 [cited 14 August 2014]. Available from http://www.nsf.gov/statistics/nsf13332/tables/tab107.xls.
Oaxaca, Ronald L., and Michael R. Ransom. 1994. "On discrimination and the decomposition of wage differentials." Journal of Econometrics no. 61:5-21.
Olds, Gareth. 2014. Entrepreneurship and public health insurance. Job Market Paper, Department of Economics, Brown University, Providence, RI.
Olsen, Shirley F., and Helen M. Currie. 1992. "Female entrepreneurs: personal value systems and business strategies in a male-dominated industry." Journal of Small Business Management no. 30 (1):49-57.
Orser, Barbara, and Lorraine Dyke. 2009. "The influence of gender and occupational-role on entrepreneurs' and corporate managers' success criteria." Journal of Small Business and Entrepreneurship no. 22 (3):327-354.
Perkmann, Markus, Valentina Tartari, Maureen McKelvey, Erkko Autio, Anders Brostrom, Pablo D'Este, Riccardo Fini, Aldo Guena, Rosa Grimaldi, Alan Hughes, Stefan Krabel, Michael Kitson, Patrick Llerena, Franceso Lissoni, Ammon Salter, and Maurizio Sobrero. 2013. "Academic engagement and commercialisation: a review of the literature on university-industry relations." Research Policy no. 42:423-442.
Sampat, Bhaven N. 2011. USPTO Patent and Citation Data. Harvard Dataverse Network.
Schumpeter, Joseph A. 1942. Capitalism, Socialism and Democracy. New York: Harper and Row.
Shinnar, Rachel S., Olivier Giacomin, and Frank Janssen. 2012. "Entrepreneurial perceptions and intentions: the role of gender and culture." Entrepreneurship Theory and Practice no. 36 (3):465-493.
SHRM. 2012. Employee Job Satisfaction and Engagement. Alexandria, VA: Society for Human Resources Management.
Stephan, Paula E., and Asmaa El-Ganainy. 2007. "The entrepreneurial puzzle: explaining the gender gap." Journal of Technology Transfer no. 32 (5):475-487.
Stewart, Wayne H., and Philip J. Roth. 2007. "A meta-analysis of achievement motivation differences between entrepreneurs and managers." Journal of Small Business Management no. 45 (4):401-421.
Thursby, Jerry G., and Marie C. Thursby. 2005. "Gender patterns of research and licensing activity of science and engineering faculty." Journal of Technology Transfer no. 30 (4):343-353.
76
Verheul, Ingrid, Roy Thurik, Isabel Grilo, and Peter van der Zwan. 2012. "Explaining preferences and actual involvement in self-employment: gender and the entrepreneurial personality." Journal of Economic Psychology no. 33:325-341.
Watson, John. 2003. "Failure rates for female-controlled businesses: Are they any different?" Journal of Small Business Management no. 41 (3):262-277.
Whittington, Kjersten Bunker. 2011. "Mothers of invention? Gender, motherhood, and new dimensions of productivity in the science profession." Work and Occupations no. 38 (3):417-456.
Whittington, Kjersten Bunker, and Laurel Smith-Doerr. 2008. "Women inventors in context: disparities in patenting across academia and industry." Gender & Society no. 22 (2):194-218.
Winslow, Sarah. 2010. "Gender inequality and time allocations among academic faculty." Gender & Society no. 24 (6):769-793.
77