Embed Size (px)
Citation preview
Unemployment Compensation: Status of
the Fund & Employer Contribution Rates
Revenue Stabilization and Tax Policy Committee
July 15, 2021
• Established in 1935 during passage of Social Security Act in response to estimated 25 percent unemployment rate during Great Depression.
• Initial safety net for people who are out of work through no fault of their own.• Helps stabilizes economy during economic contractions.• The multiplier effect for Unemployment Insurance is at least 1.7, meaning that
$100 in UI benefits leads to $70 additional GDP in the private sector. 1
• The New Mexico Department of Workforce Solutions administers the unemployment insurance program. Rules, policies, and procedures are set by New Mexico State Statue and the Department, with oversight by the U.S. Department of Labor.
• Benefits are financed through employers’ payroll tax contributions.
1 Gabriel Chodorow-Reich, “Geographic Cross-Sectional Fiscal Spending Multipliers: What Have We Learned?” American Economic Journal: Economic Policy 11 (2) (2019): 1–34, available at Geographic Cross-Sectional Fiscal Spending Multipliers: What Have We Learned? - American Economic Association (aeaweb.org); Marco Di Maggio and Amir Kermani,“The Importance of Unemployment Insurance as an Automatic Stabilizer.” Working Paper no. 22625 (National Bureau of Economic Research 2016).
Purpose of Unemployment Insurance Program
Agenda
1. Employer Contribution Rates2. UI Trust Fund & Forecast3. New Mexico Economy4. Claimant information5. Department Initiatives
How are Employer Contribution Rates Computed?
The amount of tax an experienced employer pays depends on:1. the number of its employees;2. the state’s taxable wage base;3. the contribution rate assigned to the employer;4. and the balance of the Trust Fund.
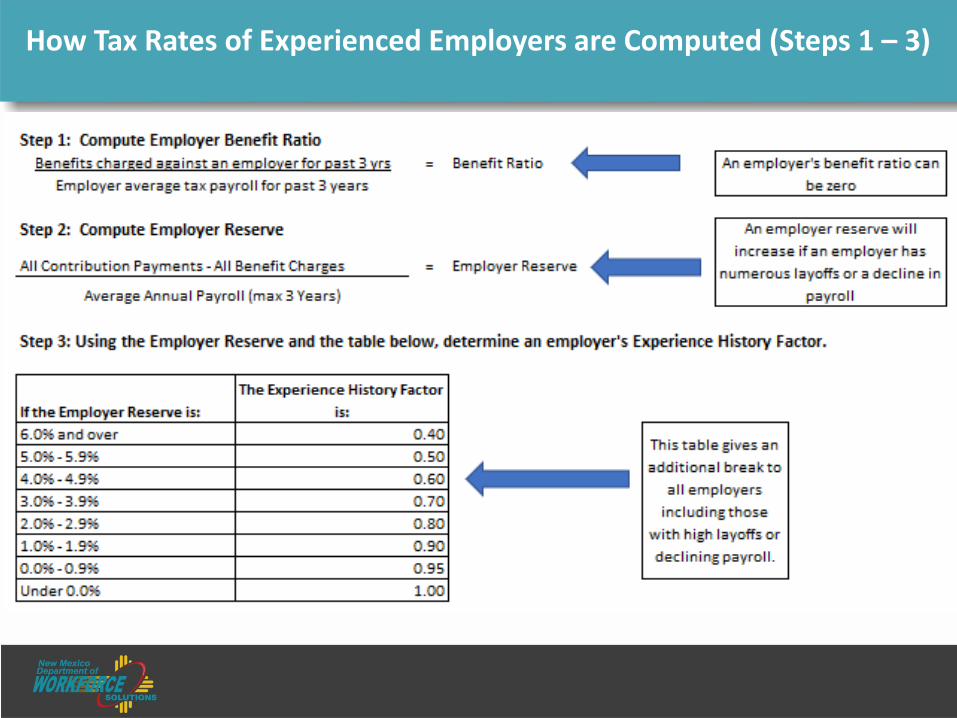
How Tax Rates of Experienced Employers are Computed (Steps 1 – 3)
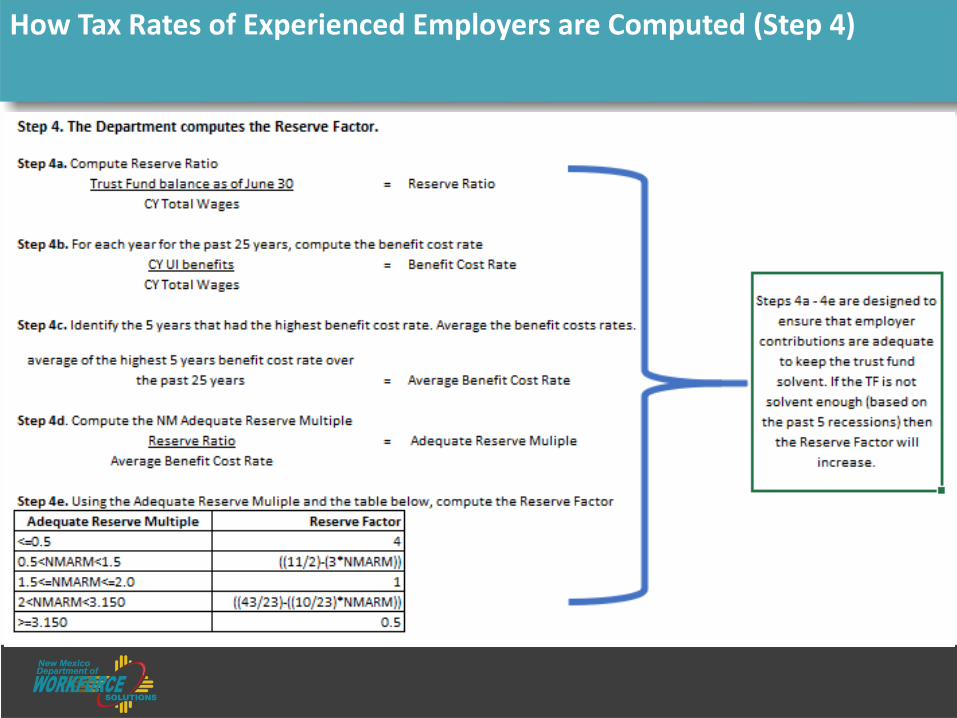
How Tax Rates of Experienced Employers are Computed (Step 4)
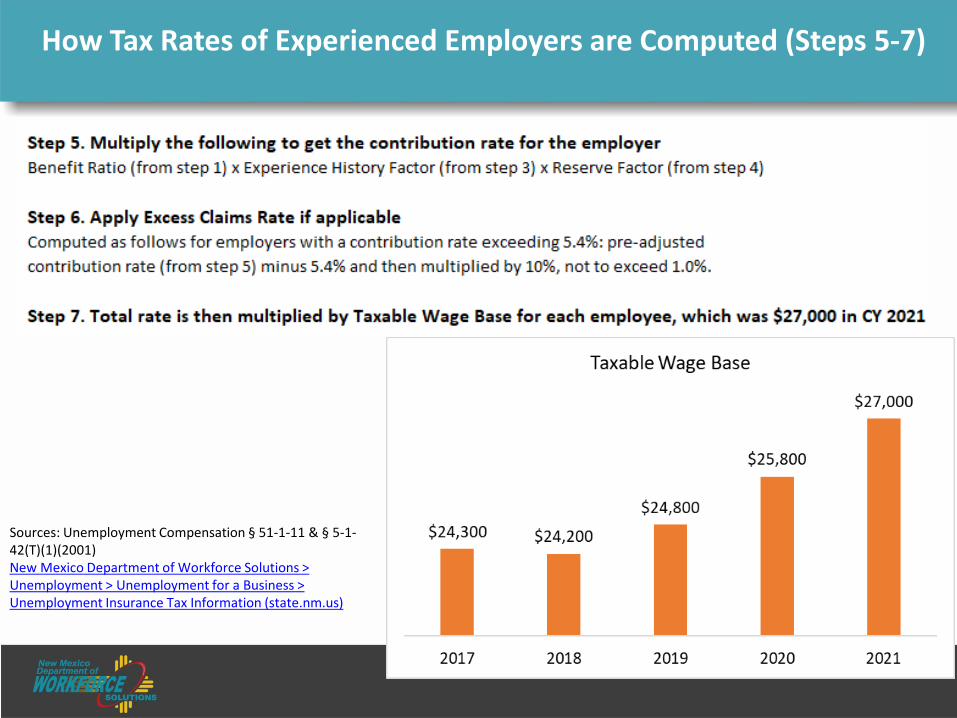
How Tax Rates of Experienced Employers are Computed (Steps 5-7)
Sources: Unemployment Compensation § 51-1-11 & § 5-1-42(T)(1)(2001)New Mexico Department of Workforce Solutions > Unemployment > Unemployment for a Business > Unemployment Insurance Tax Information (state.nm.us)
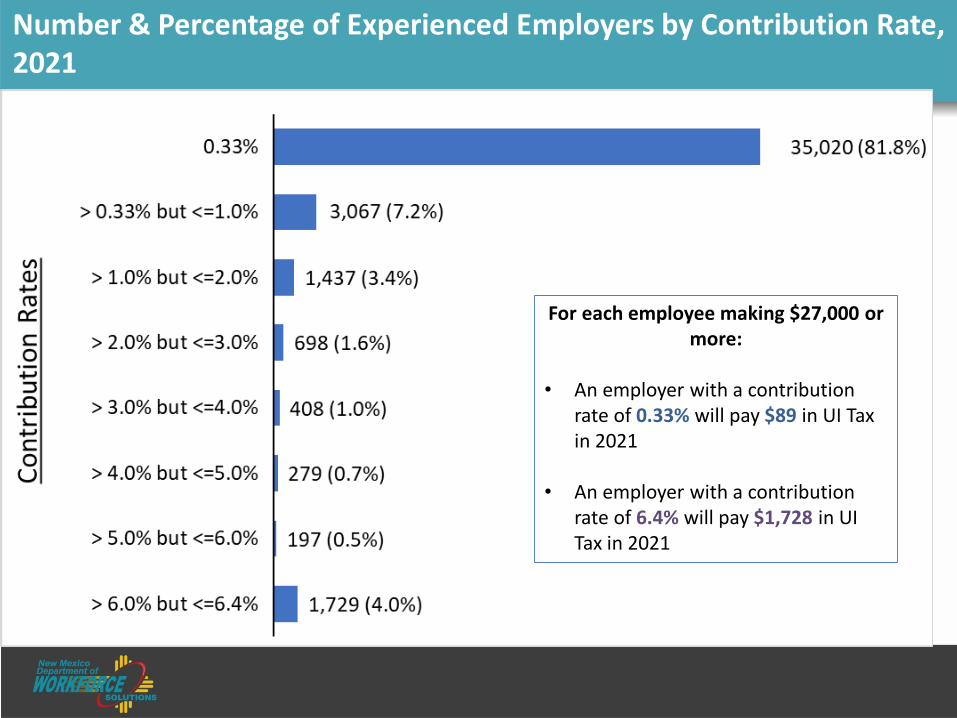
Number & Percentage of Experienced Employers by Contribution Rate, 2021
For each employee making $27,000 or more:
• An employer with a contribution rate of 0.33% will pay $89 in UI Tax in 2021
• An employer with a contribution rate of 6.4% will pay $1,728 in UI Tax in 2021
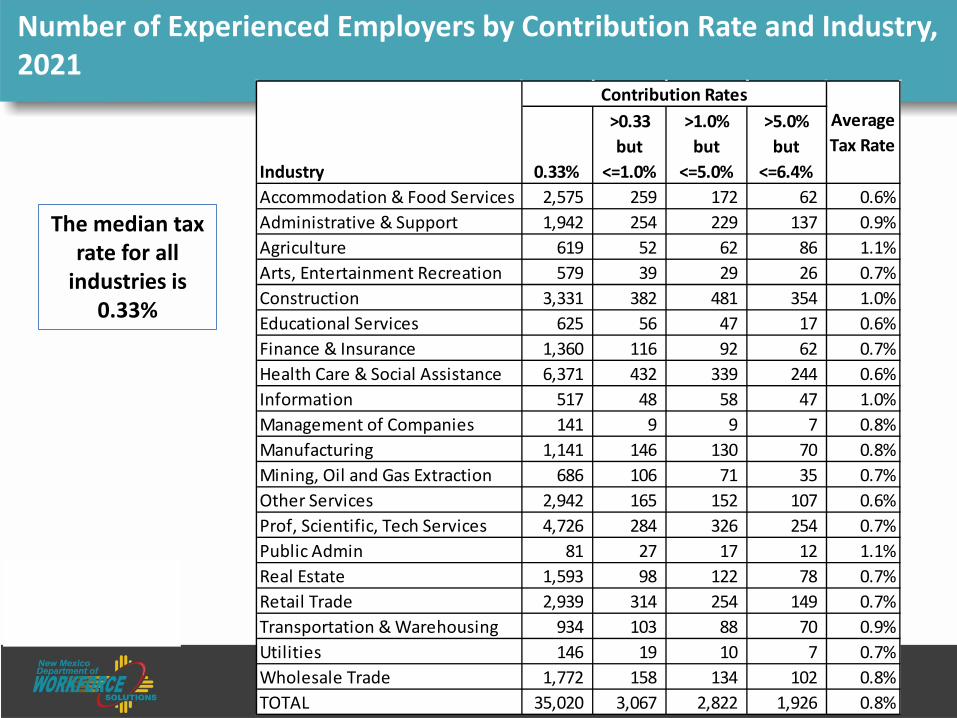
Number of Experienced Employers by Contribution Rate and Industry, 2021
The median tax rate for all
industries is 0.33%
0.33%
>0.33 but
<=1.0%
>1.0% but
<=5.0%
>5.0% but
<=6.4%Accommodation & Food Services 2,575 259 172 62 0.6%Administrative & Support 1,942 254 229 137 0.9%Agriculture 619 52 62 86 1.1%Arts, Entertainment Recreation 579 39 29 26 0.7%Construction 3,331 382 481 354 1.0%Educational Services 625 56 47 17 0.6%Finance & Insurance 1,360 116 92 62 0.7%Health Care & Social Assistance 6,371 432 339 244 0.6%Information 517 48 58 47 1.0%Management of Companies 141 9 9 7 0.8%Manufacturing 1,141 146 130 70 0.8%Mining, Oil and Gas Extraction 686 106 71 35 0.7%Other Services 2,942 165 152 107 0.6%Prof, Scientific, Tech Services 4,726 284 326 254 0.7%Public Admin 81 27 17 12 1.1%Real Estate 1,593 98 122 78 0.7%Retail Trade 2,939 314 254 149 0.7%Transportation & Warehousing 934 103 88 70 0.9%Utilities 146 19 10 7 0.7%Wholesale Trade 1,772 158 134 102 0.8%TOTAL 35,020 3,067 2,822 1,926 0.8%
Industry
Average Tax Rate
Contribution Rates
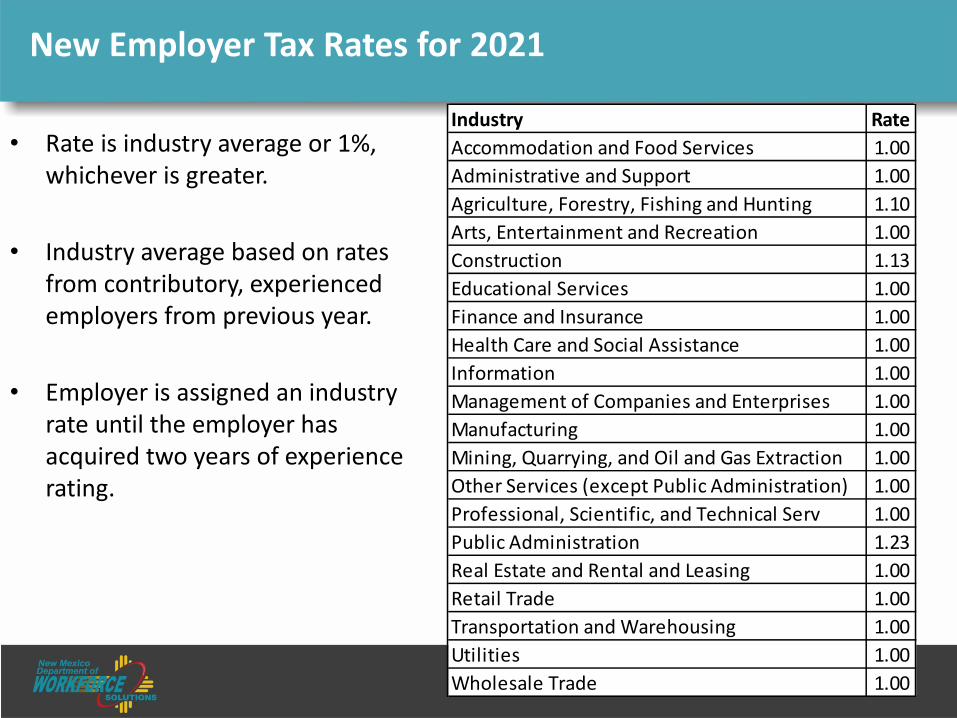
New Employer Tax Rates for 2021
• Rate is industry average or 1%, whichever is greater.
• Industry average based on rates from contributory, experienced employers from previous year.
• Employer is assigned an industry rate until the employer has acquired two years of experience rating.
Industry RateAccommodation and Food Services 1.00Administrative and Support 1.00Agriculture, Forestry, Fishing and Hunting 1.10Arts, Entertainment and Recreation 1.00Construction 1.13Educational Services 1.00Finance and Insurance 1.00Health Care and Social Assistance 1.00Information 1.00Management of Companies and Enterprises 1.00Manufacturing 1.00Mining, Quarrying, and Oil and Gas Extraction 1.00Other Services (except Public Administration) 1.00Professional, Scientific, and Technical Serv 1.00Public Administration 1.23Real Estate and Rental and Leasing 1.00Retail Trade 1.00Transportation and Warehousing 1.00Utilities 1.00Wholesale Trade 1.00
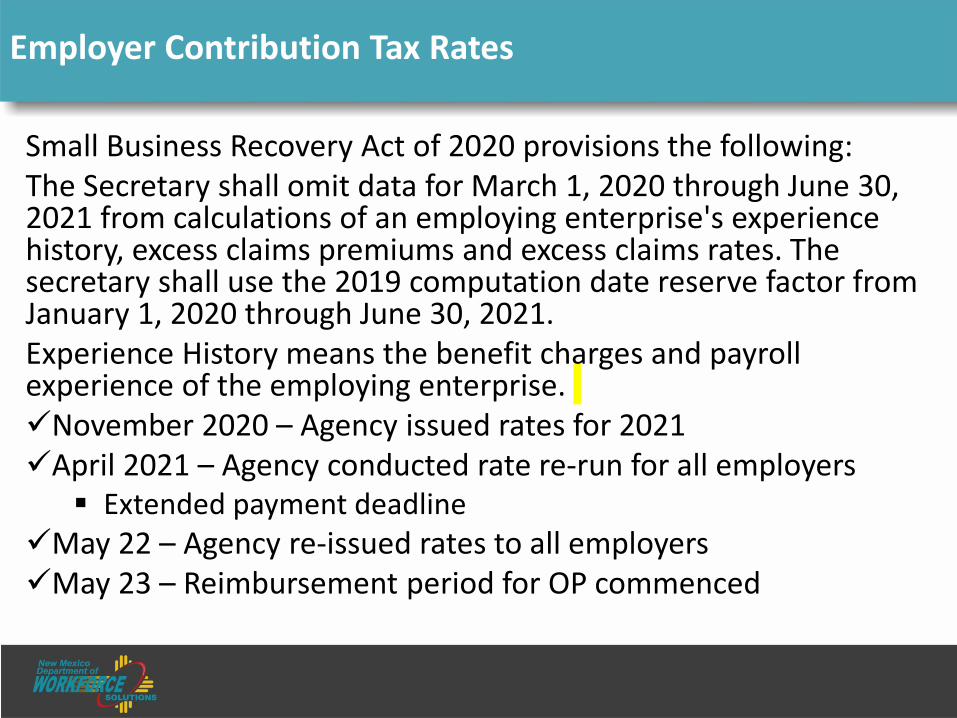
Employer Contribution Tax Rates
Small Business Recovery Act of 2020 provisions the following:The Secretary shall omit data for March 1, 2020 through June 30, 2021 from calculations of an employing enterprise's experience history, excess claims premiums and excess claims rates. The secretary shall use the 2019 computation date reserve factor from January 1, 2020 through June 30, 2021.Experience History means the benefit charges and payroll experience of the employing enterprise. November 2020 – Agency issued rates for 2021April 2021 – Agency conducted rate re-run for all employers Extended payment deadline
May 22 – Agency re-issued rates to all employersMay 23 – Reimbursement period for OP commenced
Agenda
1. Employer Contribution Rates2. UI Trust Fund & Forecast3. New Mexico Economy4. Claimant information5. Department Initiatives
UI Trust Fund Replenishment and Payback of Loan
• The total UI Trust Fund loan from the U.S. Department of Labor was $284 million.
• On June 24, 2021, NMDWS made a $100 million loan payment to the U.S. Department of Labor, a sum appropriated from the state general fund in the 2021 Legislative Session.
• The department received more than $600 million in American Rescue Plan Act (ARPA) funding from the New Mexico Department of Finance and Administration to replenish the Trust Fund as well as pay back the federal loan.
• The trust fund balance, after payments and transfers are completed, will be $460 million.
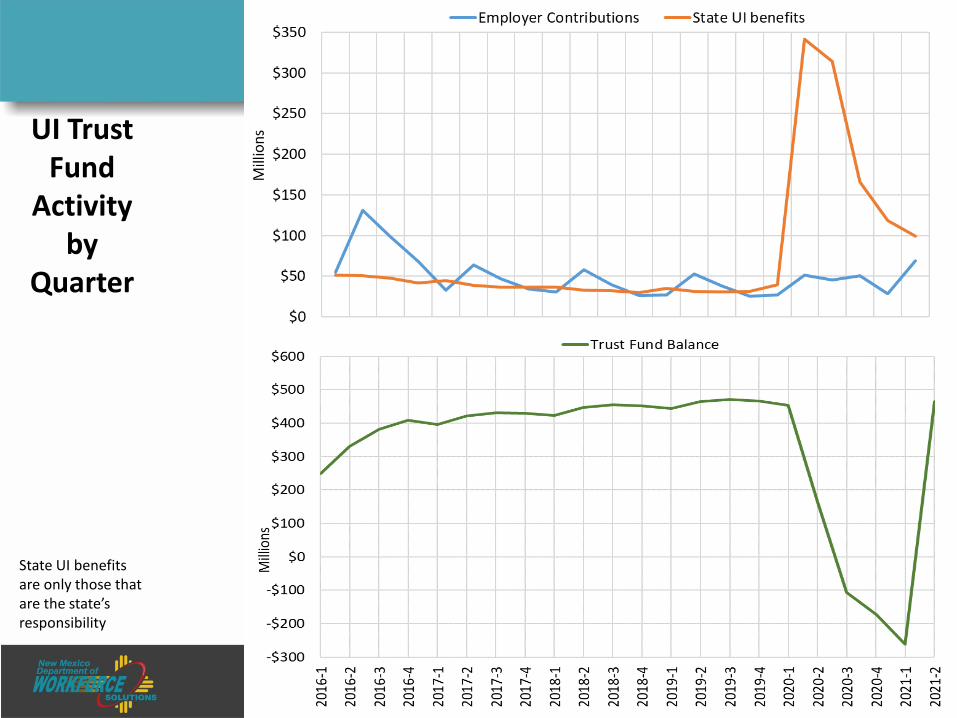
UI Trust Fund
Activity by
Quarter
State UI benefits are only those that are the state’s responsibility
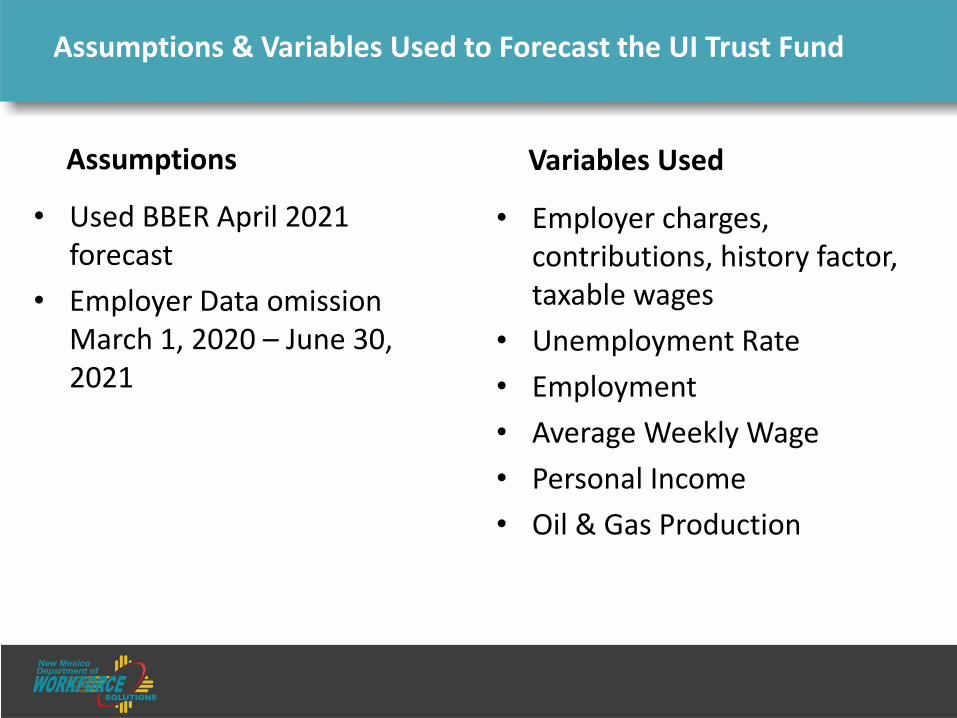
Assumptions
• Used BBER April 2021 forecast
• Employer Data omission March 1, 2020 – June 30, 2021
Variables Used
• Employer charges, contributions, history factor, taxable wages
• Unemployment Rate• Employment• Average Weekly Wage• Personal Income• Oil & Gas Production
Assumptions & Variables Used to Forecast the UI Trust Fund
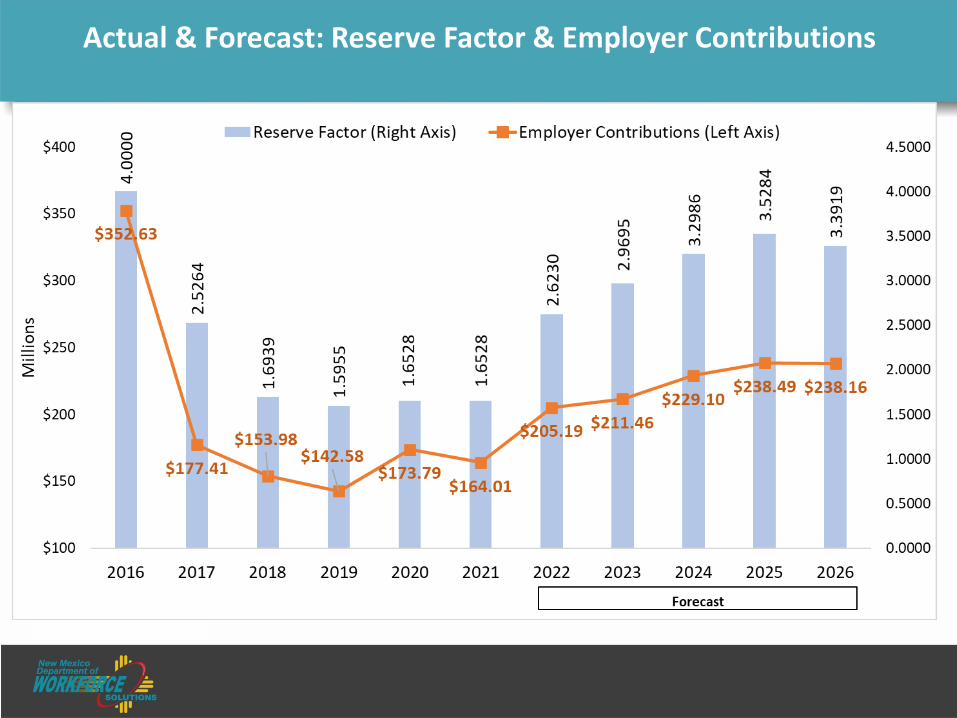
Actual & Forecast: Reserve Factor & Employer Contributions
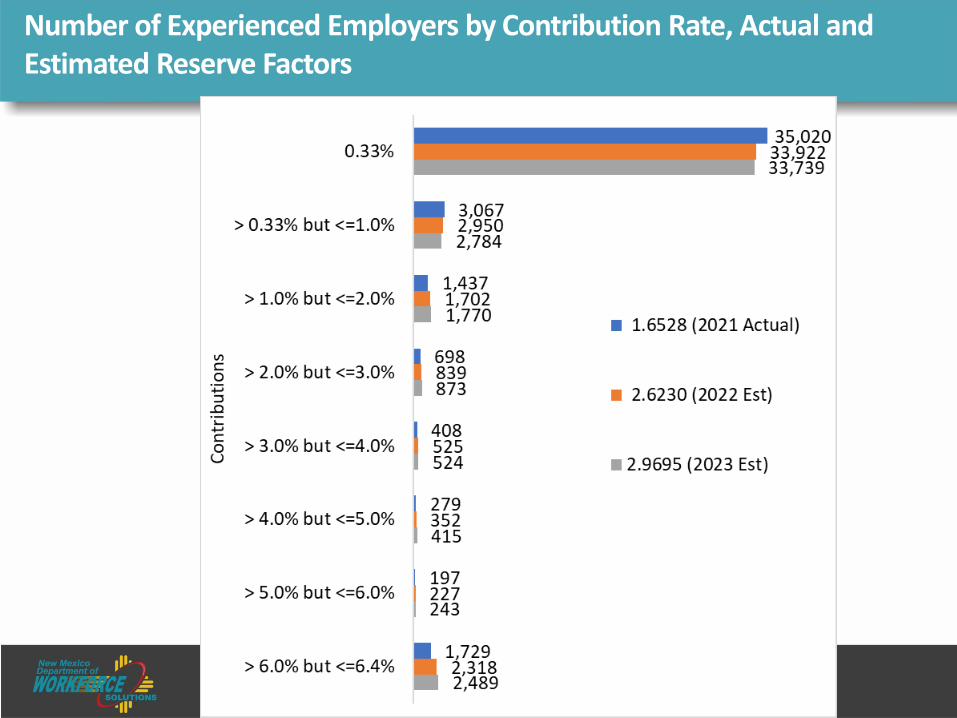
Number of Experienced Employers by Contribution Rate, Actual and Estimated Reserve Factors
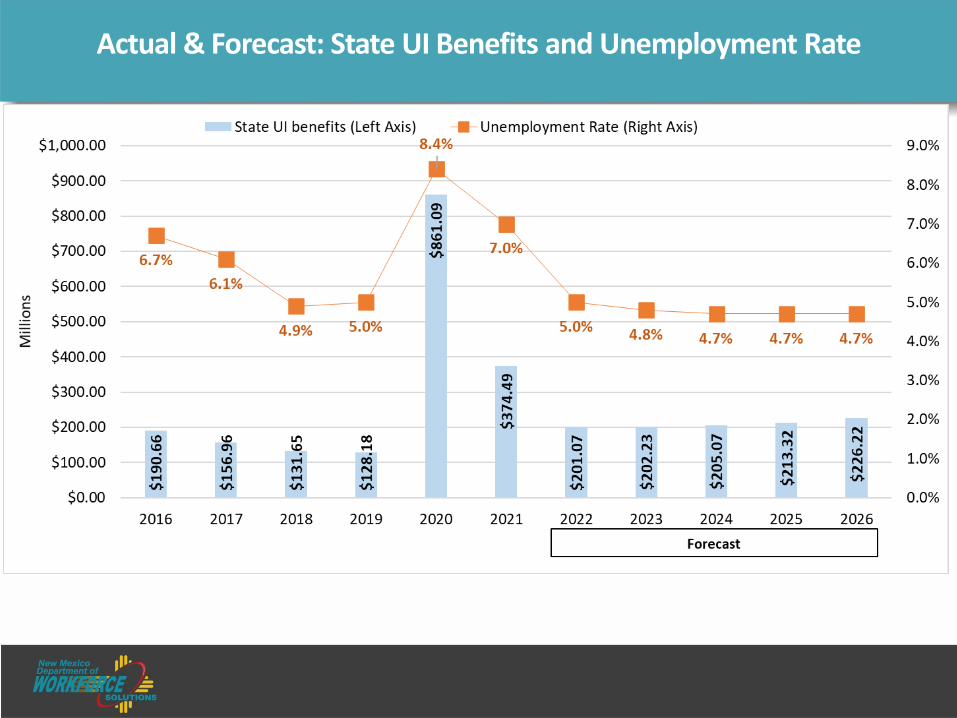
Actual & Forecast: State UI Benefits and Unemployment Rate
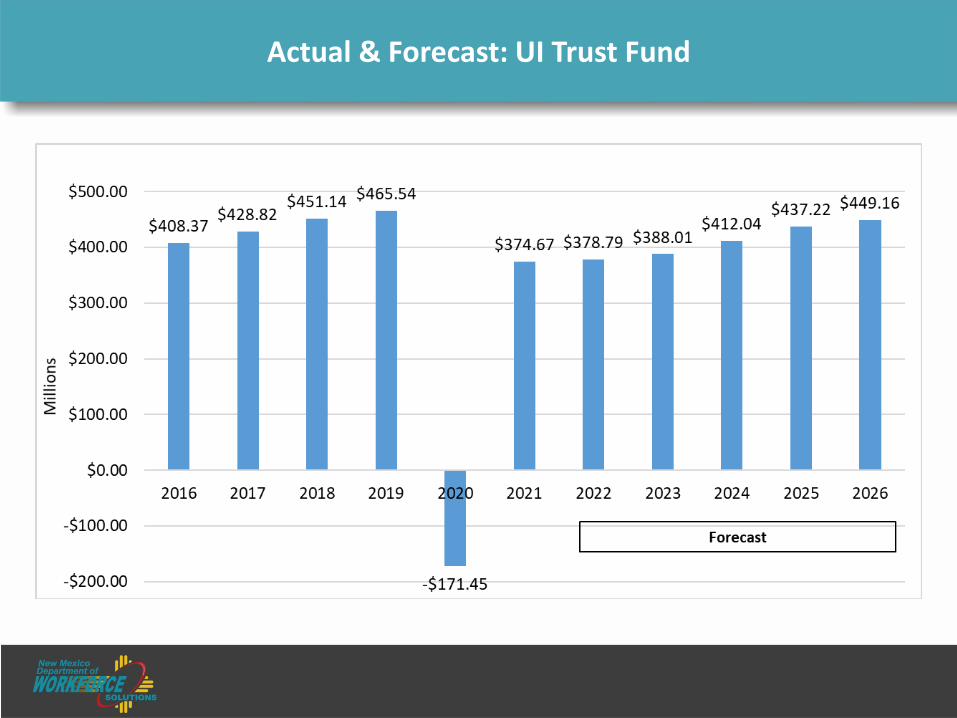
Actual & Forecast: UI Trust Fund
Agenda
1. Employer Contribution Rates2. UI Trust Fund & Forecast3. New Mexico Economy4. Claimant Information5. Department Initiatives
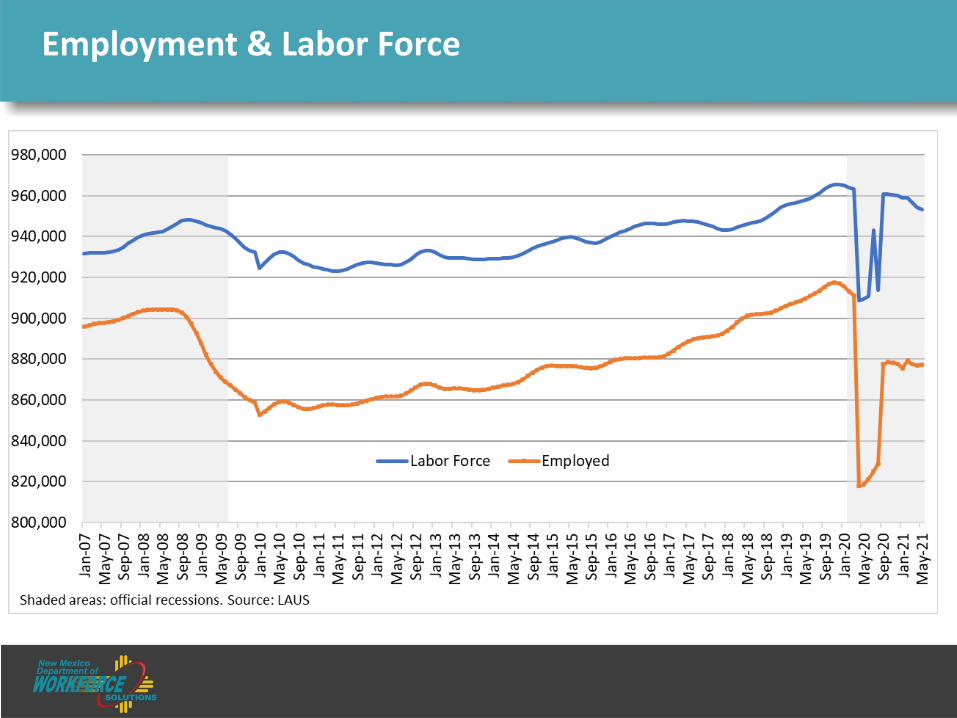
Employment & Labor Force
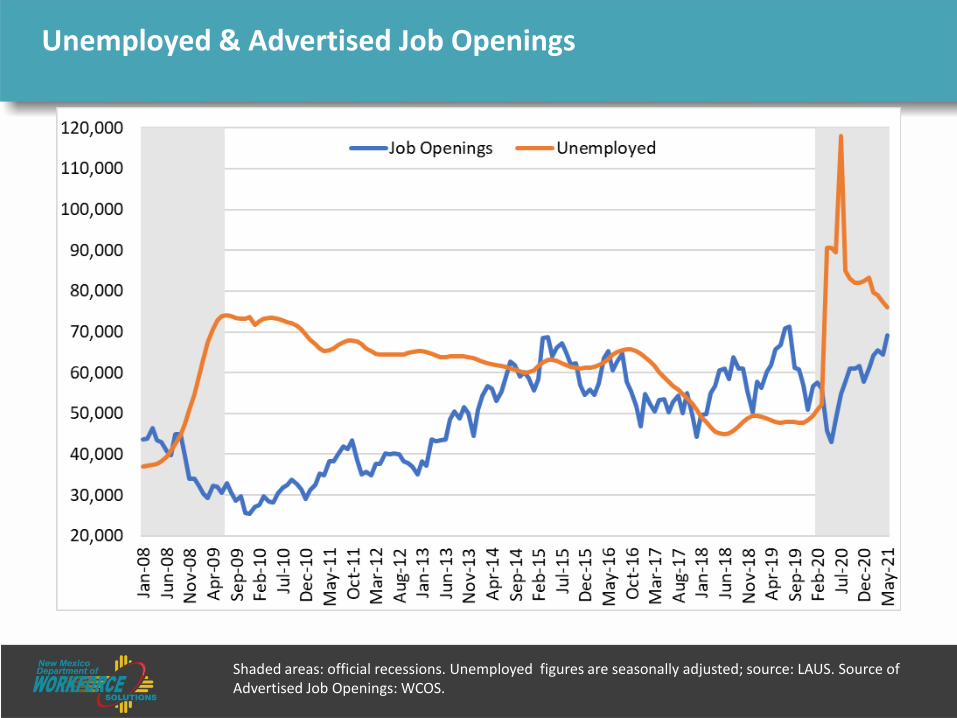
Unemployed & Advertised Job Openings
Shaded areas: official recessions. Unemployed figures are seasonally adjusted; source: LAUS. Source of Advertised Job Openings: WCOS.
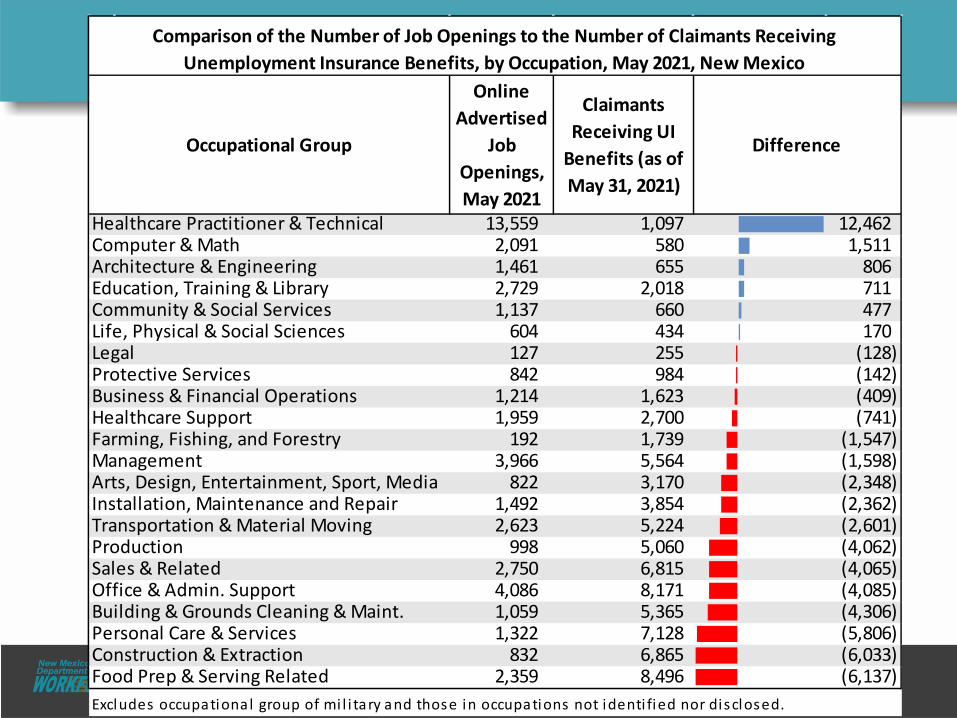
Online Advertised
Job Openings, May 2021
Claimants Receiving UI
Benefits (as of May 31, 2021)
13,559 1,097 12,462 2,091 580 1,511 1,461 655 806 2,729 2,018 711 1,137 660 477
604 434 170 127 255 (128) 842 984 (142)
1,214 1,623 (409) 1,959 2,700 (741)
192 1,739 (1,547) 3,966 5,564 (1,598)
822 3,170 (2,348) 1,492 3,854 (2,362) 2,623 5,224 (2,601)
998 5,060 (4,062) 2,750 6,815 (4,065) 4,086 8,171 (4,085) 1,059 5,365 (4,306) 1,322 7,128 (5,806)
832 6,865 (6,033) 2,359 8,496 (6,137)
Excludes occupational group of mi l i tary and those in occupations not identi fied nor disclosed.
LegalLife, Physical & Social Sciences
Protective Services
Comparison of the Number of Job Openings to the Number of Claimants Receiving Unemployment Insurance Benefits, by Occupation, May 2021, New Mexico
Food Prep & Serving RelatedConstruction & Extraction
Building & Grounds Cleaning & Maint.Personal Care & Services
Occupational Group
Installation, Maintenance and RepairTransportation & Material MovingProduction
Office & Admin. SupportSales & Related
Business & Financial OperationsHealthcare SupportFarming, Fishing, and ForestryManagementArts, Design, Entertainment, Sport, Media
Education, Training & Library
Healthcare Practitioner & TechnicalComputer & MathArchitecture & Engineering
Community & Social Services
Difference
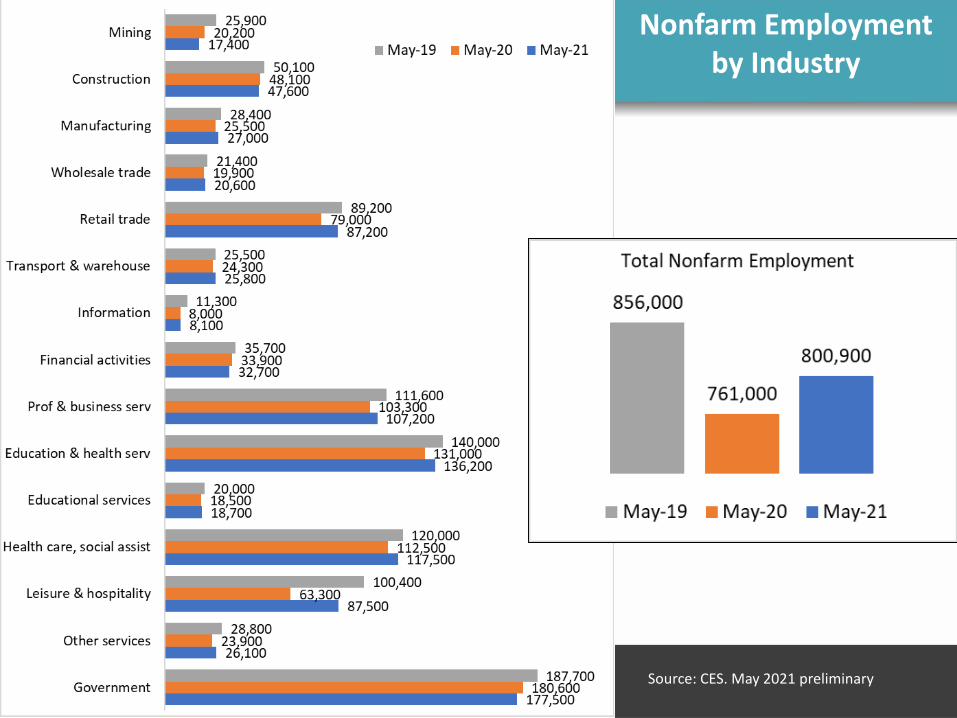
Nonfarm Employment by Industry
Source: CES. May 2021 preliminary

Number of Establishments, Employment, and Average Weekly Wage, by Quarter
Source: QCEW. Data is preliminary and subject to change.
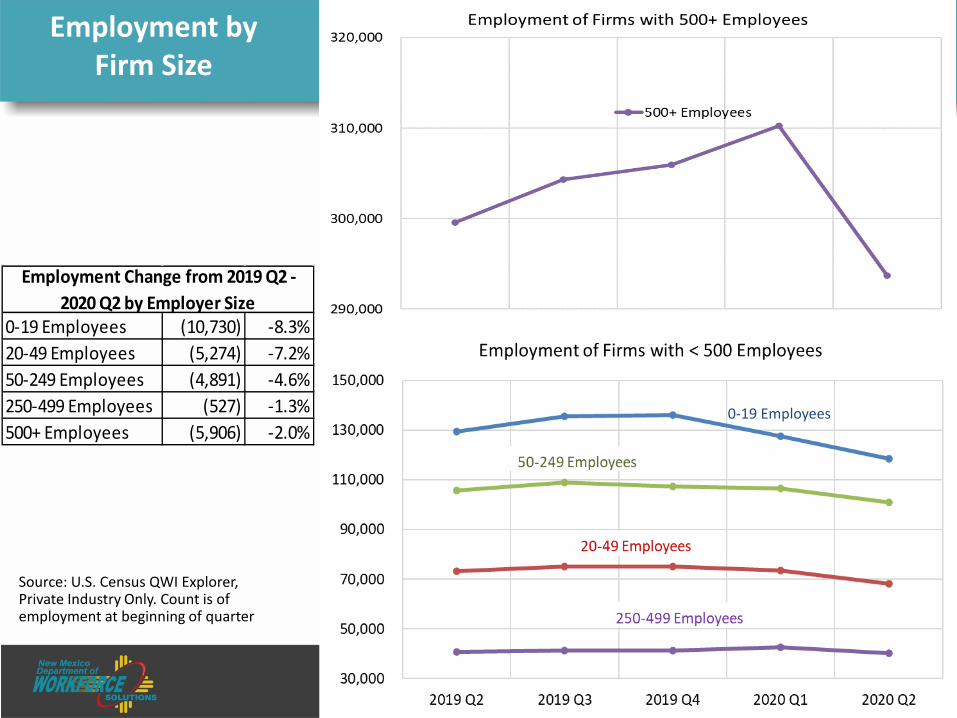
Source: U.S. Census QWI Explorer, Private Industry Only. Count is of employment at beginning of quarter
Employment by Firm Size
0-19 Employees (10,730) -8.3%20-49 Employees (5,274) -7.2%50-249 Employees (4,891) -4.6%250-499 Employees (527) -1.3%500+ Employees (5,906) -2.0%
Employment Change from 2019 Q2 - 2020 Q2 by Employer Size
0-19 Employees
Agenda
1. Employer Contribution Rates2. UI Trust Fund & Forecast3. New Mexico Economy4. Claimant Information5. Department Initiatives
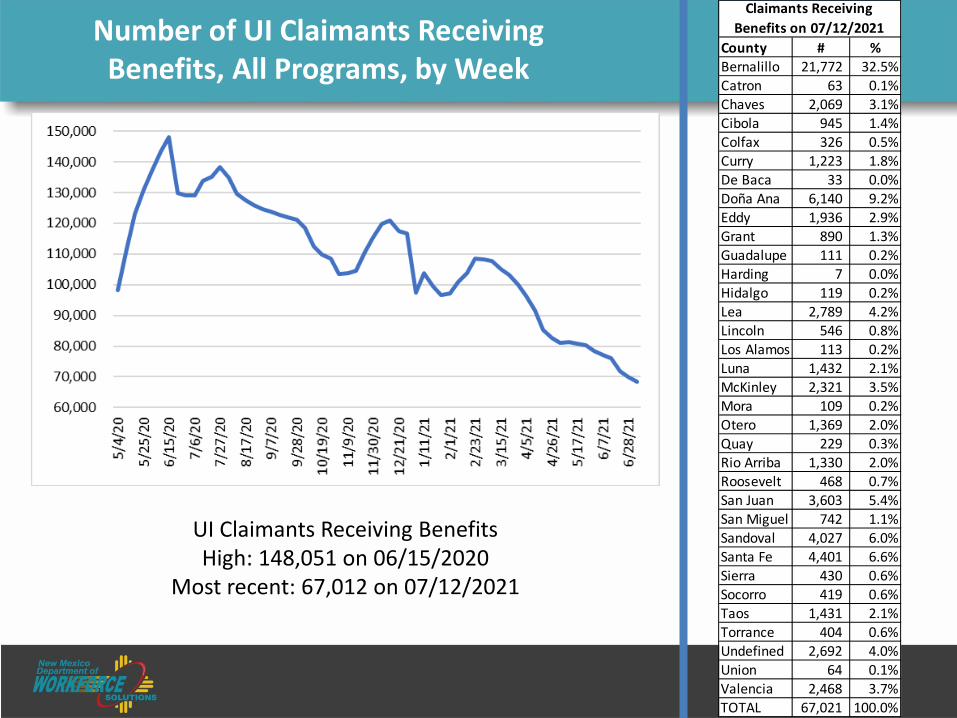
Number of UI Claimants Receiving Benefits, All Programs, by Week
County # %Bernalillo 21,772 32.5%Catron 63 0.1%Chaves 2,069 3.1%Cibola 945 1.4%Colfax 326 0.5%Curry 1,223 1.8%De Baca 33 0.0%Doña Ana 6,140 9.2%Eddy 1,936 2.9%Grant 890 1.3%Guadalupe 111 0.2%Harding 7 0.0%Hidalgo 119 0.2%Lea 2,789 4.2%Lincoln 546 0.8%Los Alamos 113 0.2%Luna 1,432 2.1%McKinley 2,321 3.5%Mora 109 0.2%Otero 1,369 2.0%Quay 229 0.3%Rio Arriba 1,330 2.0%Roosevelt 468 0.7%San Juan 3,603 5.4%San Miguel 742 1.1%Sandoval 4,027 6.0%Santa Fe 4,401 6.6%Sierra 430 0.6%Socorro 419 0.6%Taos 1,431 2.1%Torrance 404 0.6%Undefined 2,692 4.0%Union 64 0.1%Valencia 2,468 3.7%TOTAL 67,021 100.0%
Claimants Receiving Benefits on 07/12/2021
UI Claimants Receiving BenefitsHigh: 148,051 on 06/15/2020
Most recent: 67,012 on 07/12/2021
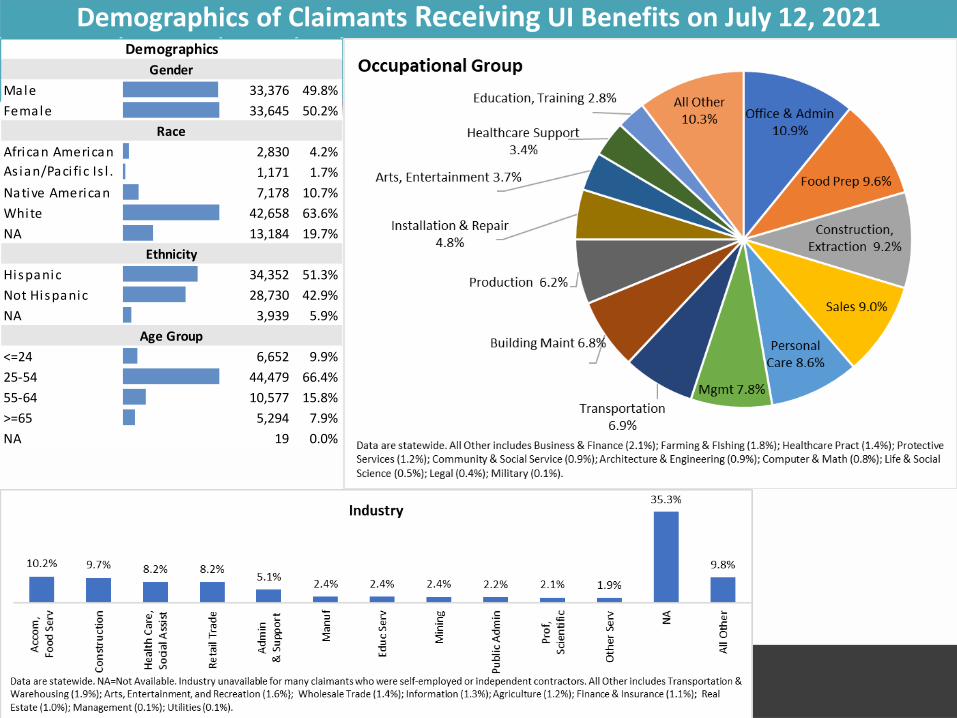
Demographics of Claimants Receiving UI Benefits on July 12, 2021
Male 33,376 49.8%Female 33,645 50.2%
African American 2,830 4.2%As ian/Paci fic Is l . 1,171 1.7%Native American 7,178 10.7%White 42,658 63.6%NA 13,184 19.7%
Hispanic 34,352 51.3%Not Hispanic 28,730 42.9%NA 3,939 5.9%
<=24 6,652 9.9%25-54 44,479 66.4%55-64 10,577 15.8%>=65 5,294 7.9%NA 19 0.0%
Gender
Race
Ethnicity
Age Group
Demographics
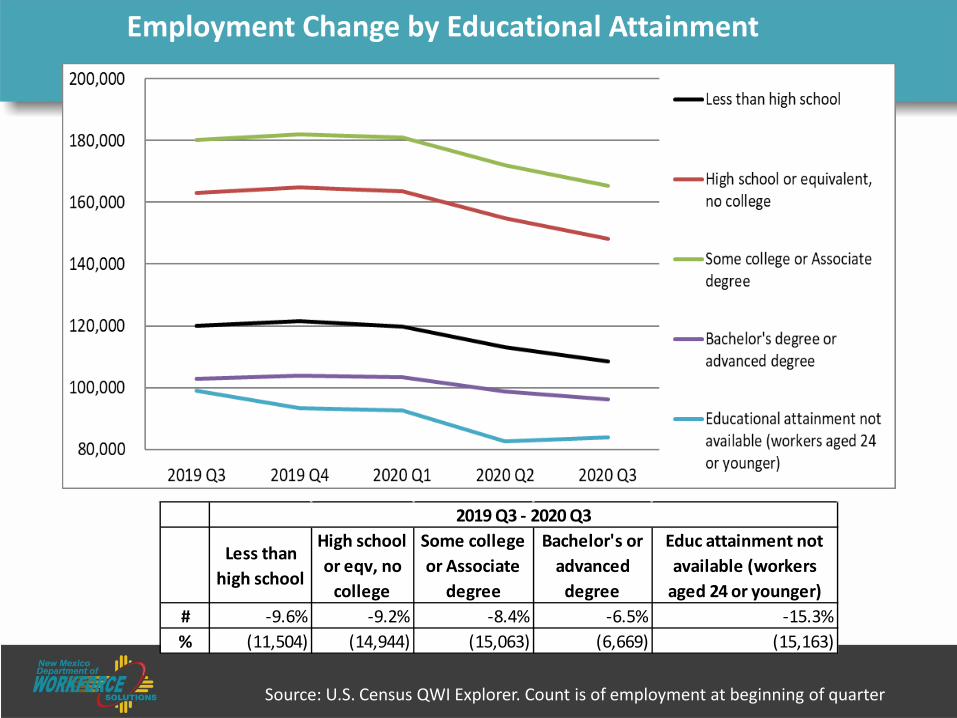
Employment Change by Educational Attainment
Less than high school
High school or eqv, no
college
Some college or Associate
degree
Bachelor's or advanced
degree
Educ attainment not available (workers
aged 24 or younger)# -9.6% -9.2% -8.4% -6.5% -15.3%% (11,504) (14,944) (15,063) (6,669) (15,163)
2019 Q3 - 2020 Q3
Source: U.S. Census QWI Explorer. Count is of employment at beginning of quarter
Agenda
1. Employer Contribution Rates2. UI Trust Fund & Forecast3. New Mexico Economy4. Claimant Information5. Department Initiatives
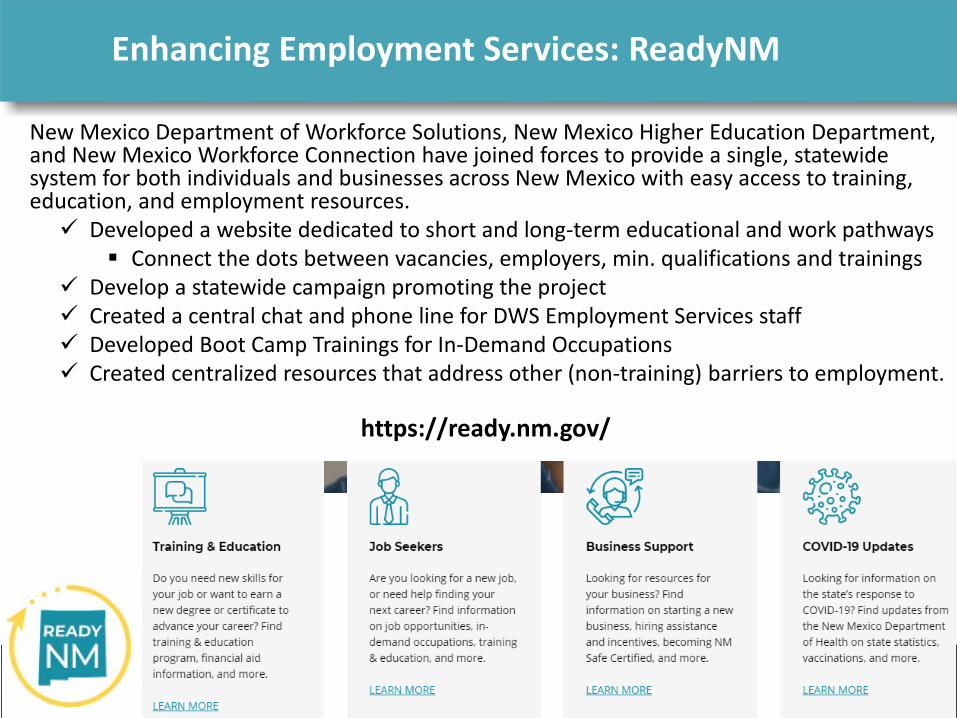
Enhancing Employment Services: ReadyNM
New Mexico Department of Workforce Solutions, New Mexico Higher Education Department, and New Mexico Workforce Connection have joined forces to provide a single, statewide system for both individuals and businesses across New Mexico with easy access to training, education, and employment resources. Developed a website dedicated to short and long-term educational and work pathways
Connect the dots between vacancies, employers, min. qualifications and trainings Develop a statewide campaign promoting the project Created a central chat and phone line for DWS Employment Services staff Developed Boot Camp Trainings for In-Demand Occupations Created centralized resources that address other (non-training) barriers to employment.
https://ready.nm.gov/
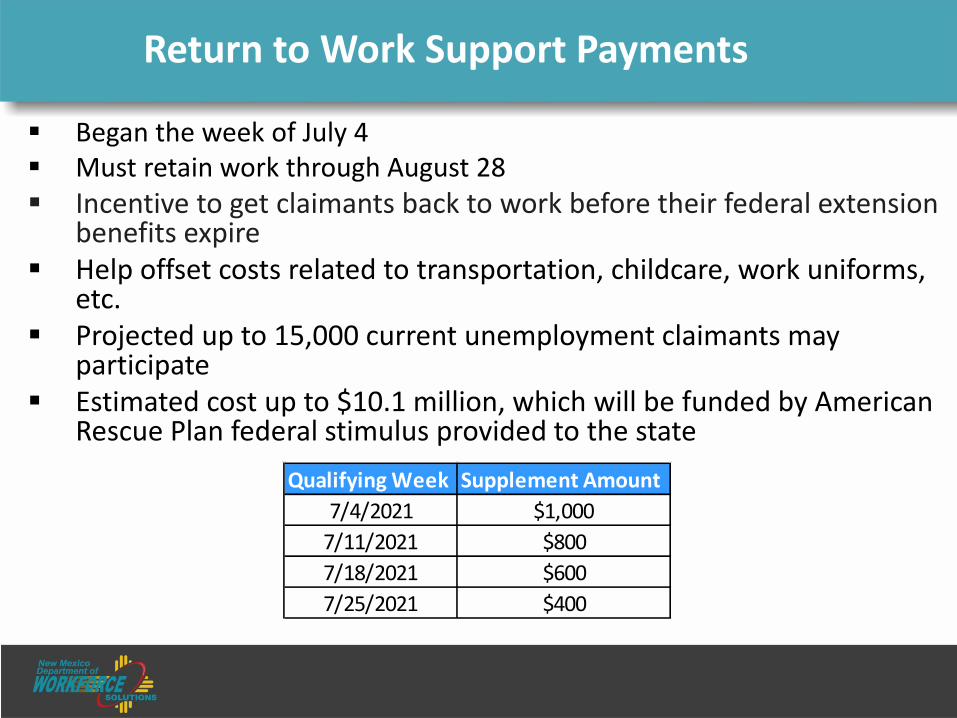
Return to Work Support Payments
Began the week of July 4 Must retain work through August 28 Incentive to get claimants back to work before their federal extension
benefits expire Help offset costs related to transportation, childcare, work uniforms,
etc. Projected up to 15,000 current unemployment claimants may
participate Estimated cost up to $10.1 million, which will be funded by American
Rescue Plan federal stimulus provided to the stateQualifying Week Supplement Amount
7/4/2021 $1,0007/11/2021 $8007/18/2021 $6007/25/2021 $400
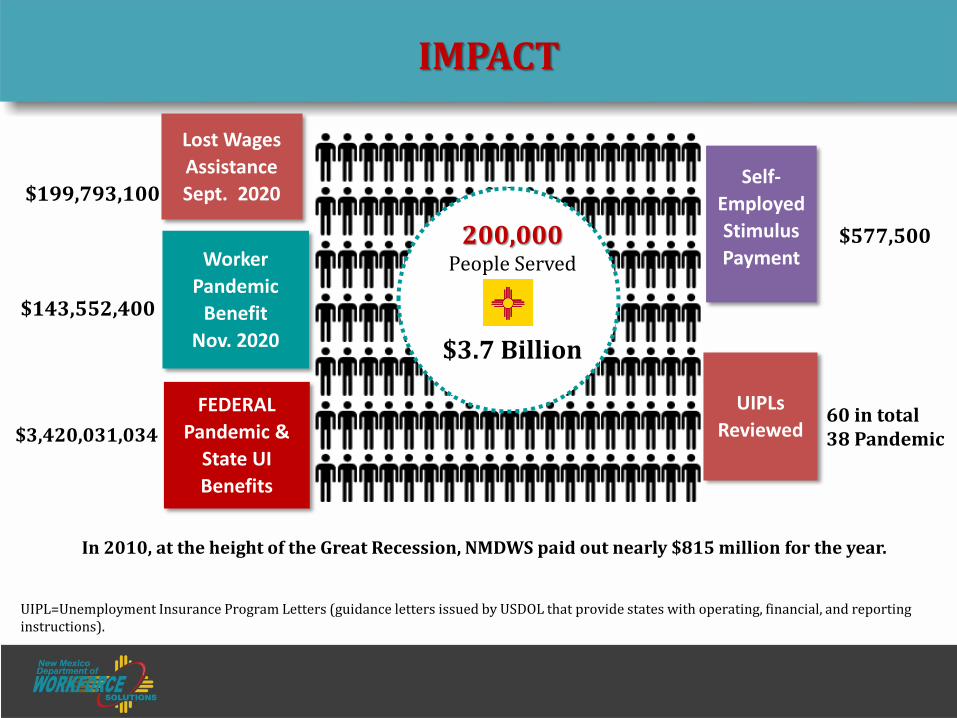
UIPLs Reviewed
60 in total38 Pandemic
Self-Employed Stimulus Payment
Lost Wages AssistanceSept. 2020
FEDERAL Pandemic &
State UI Benefits
Worker Pandemic
Benefit Nov. 2020
$199,793,100
$143,552,400
$3,420,031,034
IMPACT
In 2010, at the height of the Great Recession, NMDWS paid out nearly $815 million for the year.
UIPL=Unemployment Insurance Program Letters (guidance letters issued by USDOL that provide states with operating, financial, and reporting instructions).
$577,500200,000 People Served
$3.7 Billion
Thank you!