Embed Size (px)
Citation preview
Unit 5
Influencing the American Political and
Economic Systems
Political activity is economic activity
Political Spectrum
Political Parties and our 2 party system
Interest Groups
Political Action Committees (P.A.C.)
Constituents (voters), their influence, pork, earmarks
Campaigns, Advertising, Marketing, Propaganda
Game Theory, Rational Decisions
Allocating scarce resources that have alternative uses?
Campaign Finance and Reform- hard money and soft money
The Media and current “news” sources
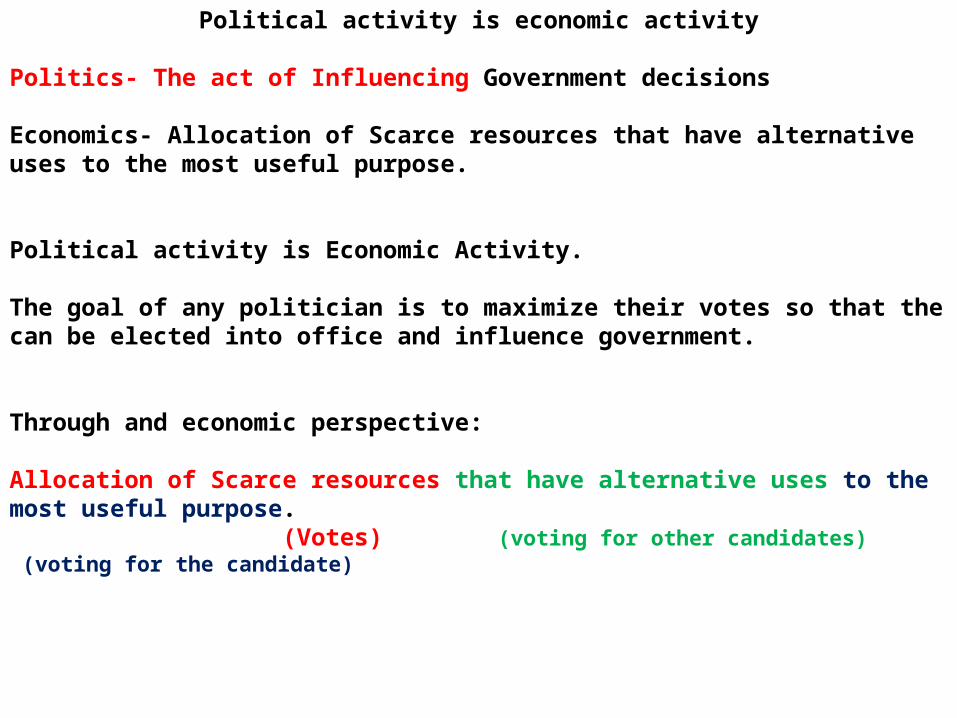
Political activity is economic activity
Politics- The act of Influencing Government decisions
Economics- Allocation of Scarce resources that have alternative uses to the most useful purpose.
Political activity is Economic Activity.
The goal of any politician is to maximize their votes so that the can be elected into office and influence government.
Through and economic perspective:
Allocation of Scarce resources that have alternative uses to the most useful purpose. (Votes) (voting for other candidates) (voting for the candidate)
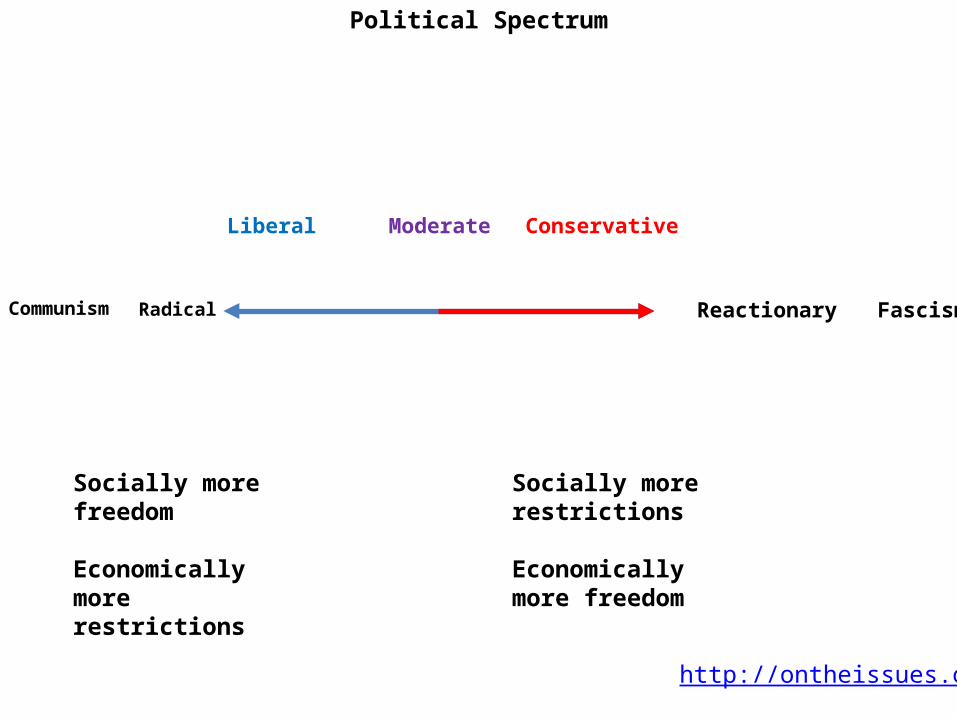
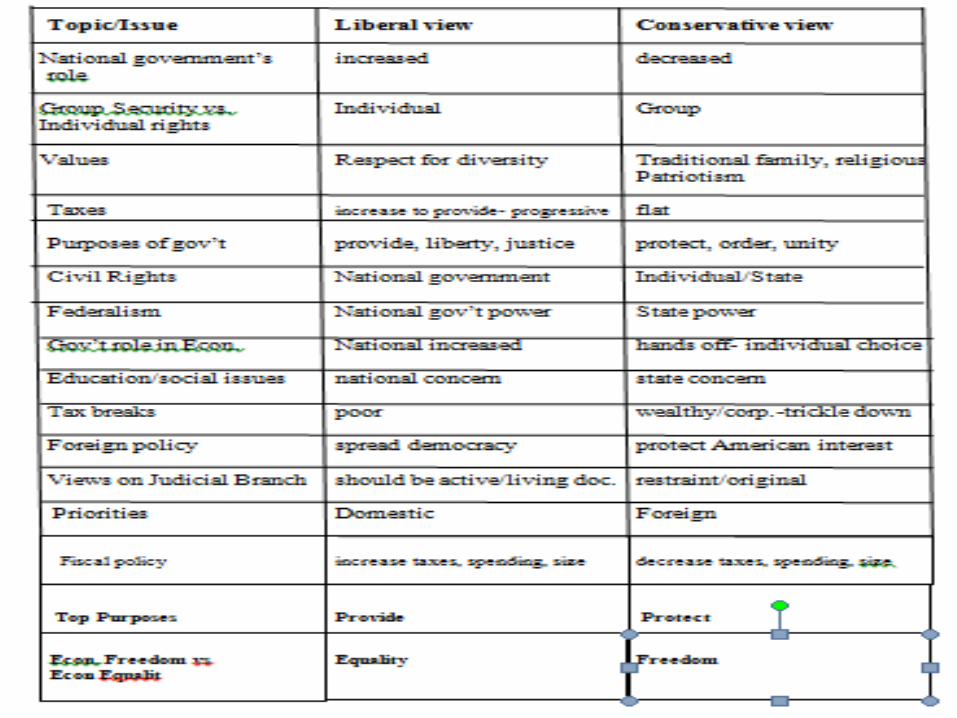
Political Spectrum
Moderate ConservativeLiberal
Reactionary FascismCommunism Radical
Socially more freedom
Economically more restrictions
Socially more restrictions
Economically more freedom
http://ontheissues.org
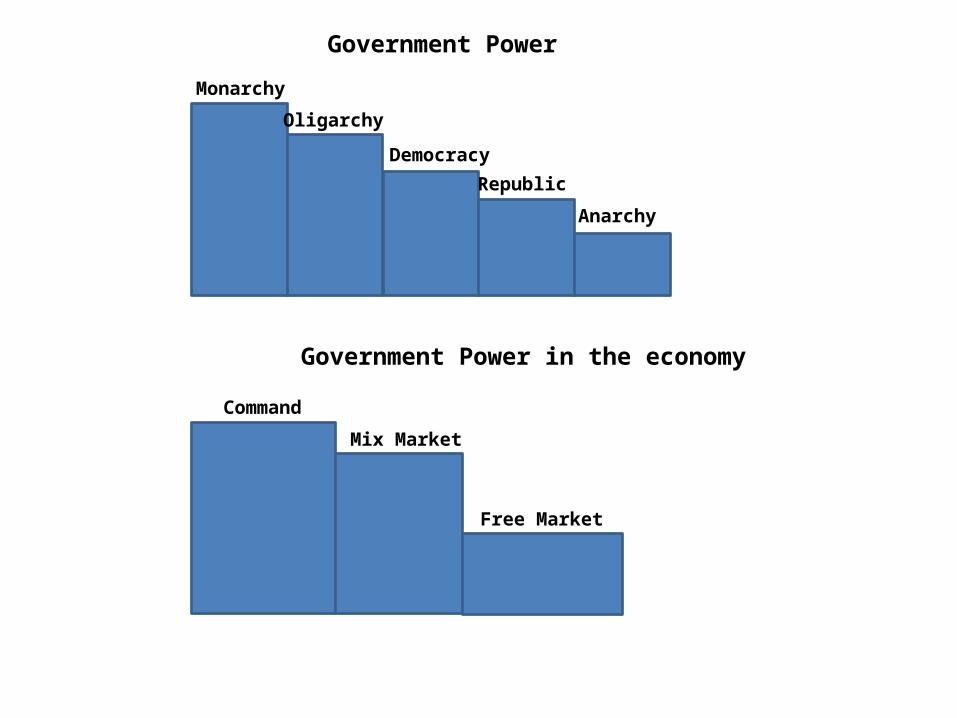
Monarchy
Oligarchy
Democracy
Republic
Anarchy
Command
Mix Market
Free Market
Government Power
Government Power in the economy

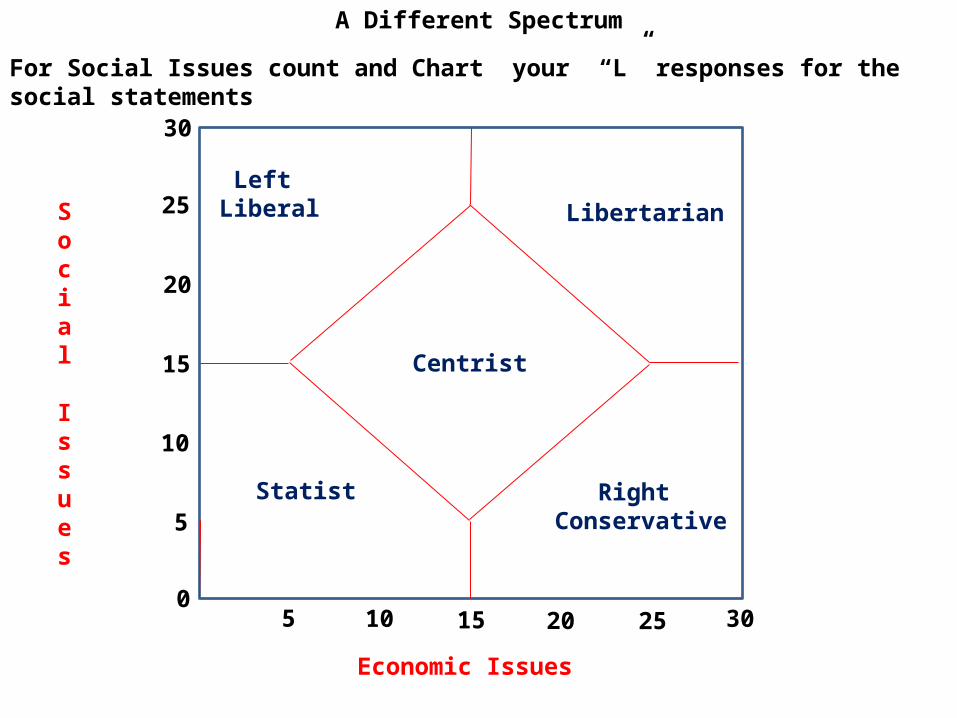
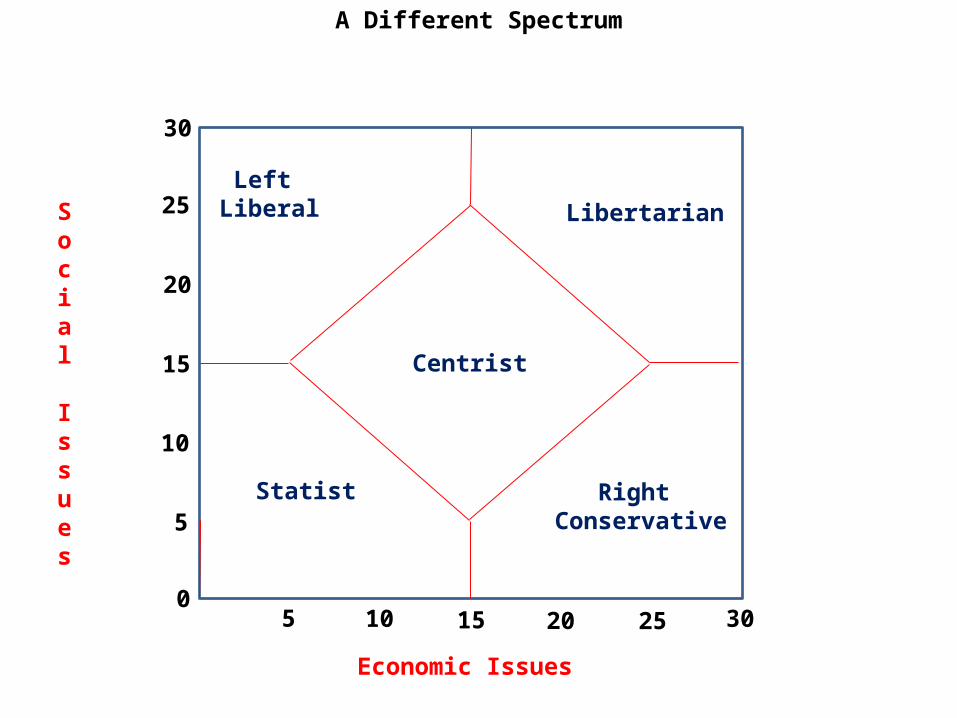
A Different Spectrum
5
10
15
20
25
30
05 10 15 25 30
20
Centrist
Libertarian
Right Conservative
Left Liberal
Statist
Social Issues
Economic Issues
A Different Spectrum
5
10
15
20
25
30
05 10 15 25 30
20
Centrist
Libertarian
Right Conservative
Left Liberal
Statist
Social Issues
Economic Issues
For Social Issues count and Chart your “L” responses for the social statements

A Different Spectrum
5
10
15
20
25
30
05 10 15 25 30
20
Centrist
Libertarian
Right Conservative
Left Liberal
Statist
Social Issues
Economic Issues
For Economic Issues count and Chart your “C” responses for the economic statements
A Different Spectrum
5
10
15
20
25
30
05 10 15 25 30
20
Centrist
Libertarian
Right Conservative
Left Liberal
Statist
Social Issues
Economic Issues
A Different Spectrum
5
10
15
20
25
30
05 10 15 25 30
20
Social Issues
Economic Issues
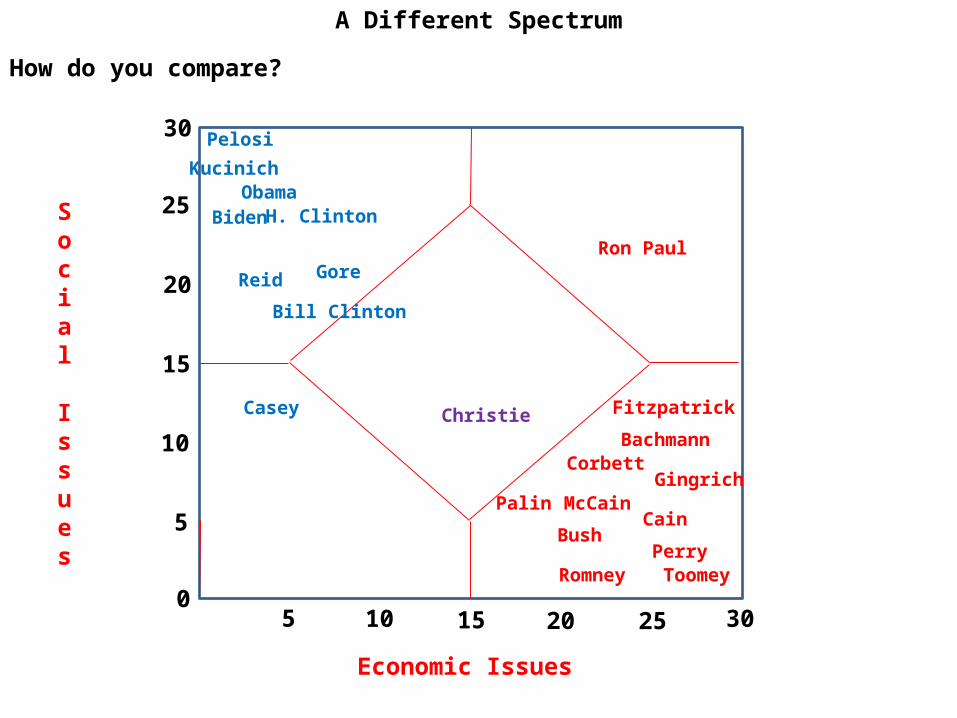
How do you compare?
ObamaBiden
Kucinich
Pelosi
Reid
H. Clinton
Gore
Bill Clinton
Christie Fitzpatrick
Toomey
Casey
Ron Paul
Palin
BachmannCorbett
McCain
RomneyPerry
Cain
Gingrich
Bush

A Different Spectrum
5
10
15
20
25
30
05 10 15 25 30
20
Social Issues
Economic Issues
How do you compare?
ObamaBiden
Kucinich
Pelosi
Reid
H. Clinton
Gore
Bill Clinton
Christie Fitzpatrick
Toomey
Casey
Ron Paul
Palin
BachmannCorbett
McCain
RomneyPerry
Cain
Gingrich
Bush

A Different Spectrum
5
10
15
20
25
30
05 10 15 25 30
20
Social Issues
Economic Issues
How do you compare?
ObamaBiden
Kucinich
Pelosi
Reid
H. Clinton
Gore
Bill Clinton
Christie Fitzpatrick
Toomey
Casey
Ron Paul
Palin
BachmannCorbett
McCain
RomneyPerry
Cain
Gingrich
Bush
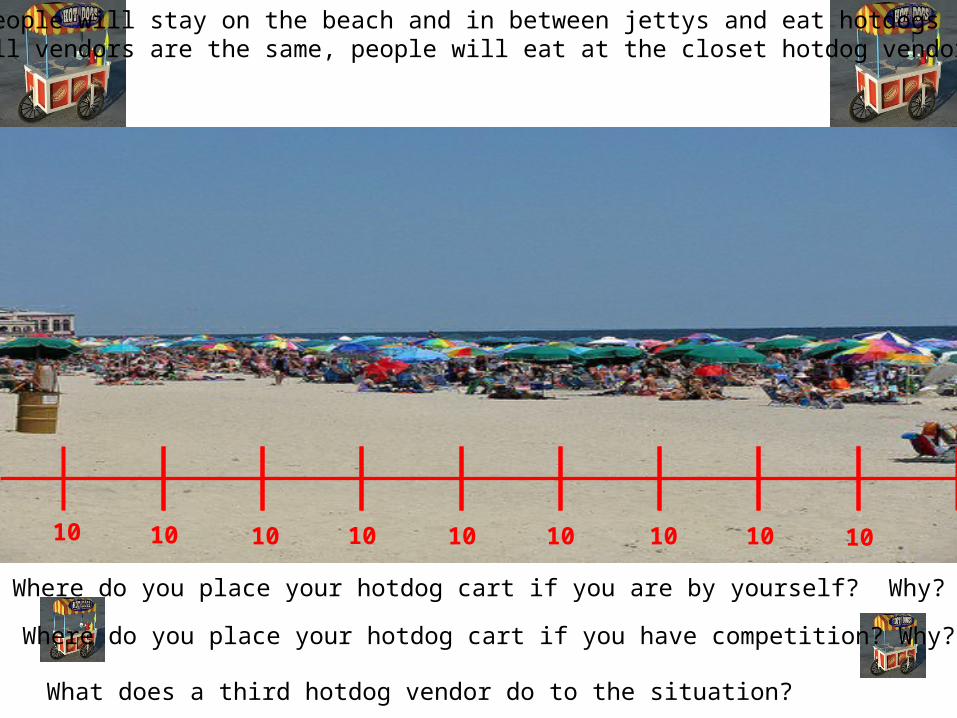
10 10 10 10 10 10 10 10 10
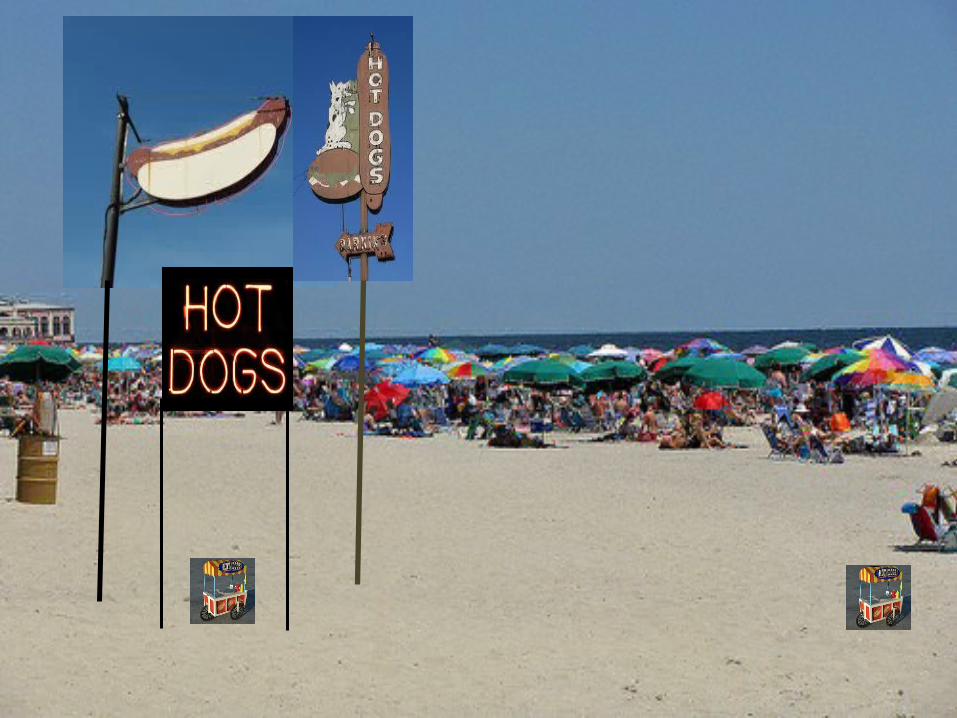
People will stay on the beach and in between jettys and eat hotdogsAll vendors are the same, people will eat at the closet hotdog vendors
Where do you place your hotdog cart if you are by yourself? Why?
Where do you place your hotdog cart if you have competition? Why?
What does a third hotdog vendor do to the situation?
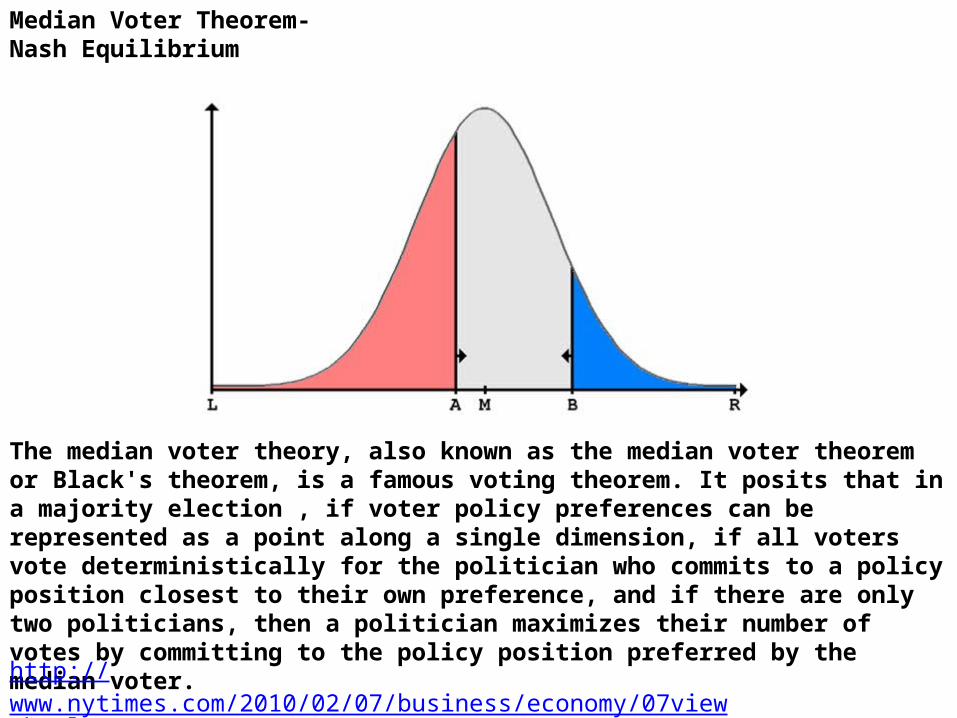
Median Voter Theorem-Nash Equilibrium
The median voter theory, also known as the median voter theorem or Black's theorem, is a famous voting theorem. It posits that in a majority election , if voter policy preferences can be represented as a point along a single dimension, if all voters vote deterministically for the politician who commits to a policy position closest to their own preference, and if there are only two politicians, then a politician maximizes their number of votes by committing to the policy position preferred by the median voter.
http://www.nytimes.com/2010/02/07/business/economy/07view.html
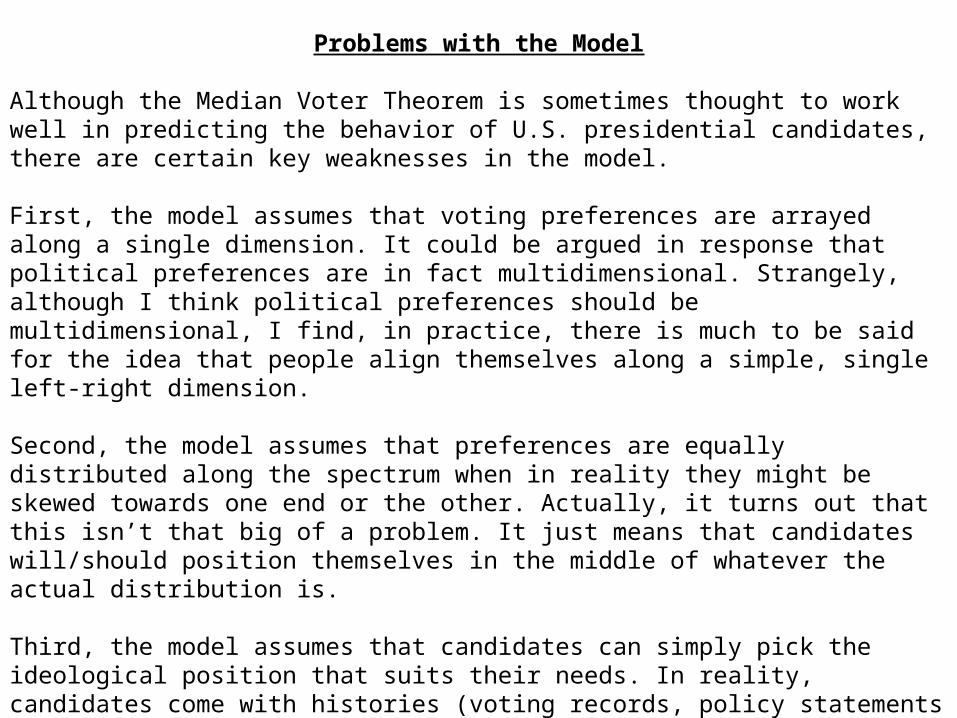
Problems with the Model
Although the Median Voter Theorem is sometimes thought to work well in predicting the behavior of U.S. presidential candidates, there are certain key weaknesses in the model.
First, the model assumes that voting preferences are arrayed along a single dimension. It could be argued in response that political preferences are in fact multidimensional. Strangely, although I think political preferences should be multidimensional, I find, in practice, there is much to be said for the idea that people align themselves along a simple, single left-right dimension.
Second, the model assumes that preferences are equally distributed along the spectrum when in reality they might be skewed towards one end or the other. Actually, it turns out that this isn’t that big of a problem. It just means that candidates will/should position themselves in the middle of whatever the actual distribution is.
Third, the model assumes that candidates can simply pick the ideological position that suits their needs. In reality, candidates come with histories (voting records, policy statements etc.) that might make it difficult for such positioning to be credible to the electorate.
Finally, the model assumes that every voter actually votes. If not-voting is an option, things become more complicated. The model also becomes more complicated when there are more than two candidates running for election
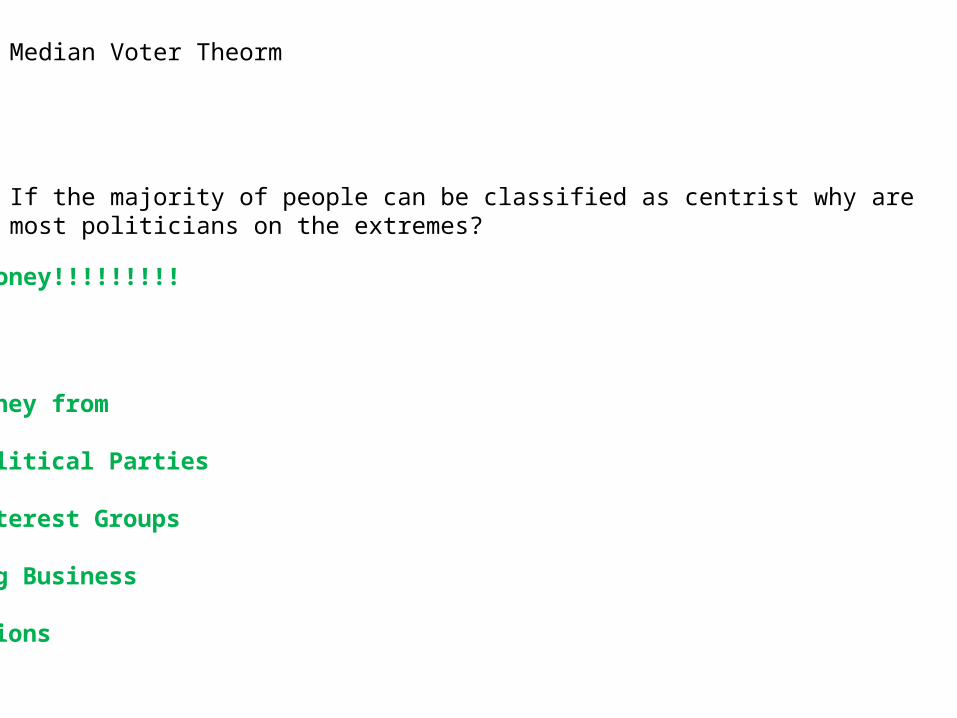
If the majority of people can be classified as centrist why are most politicians on the extremes?
Money!!!!!!!!!
Money from
Political Parties
Interest Groups
Big Business
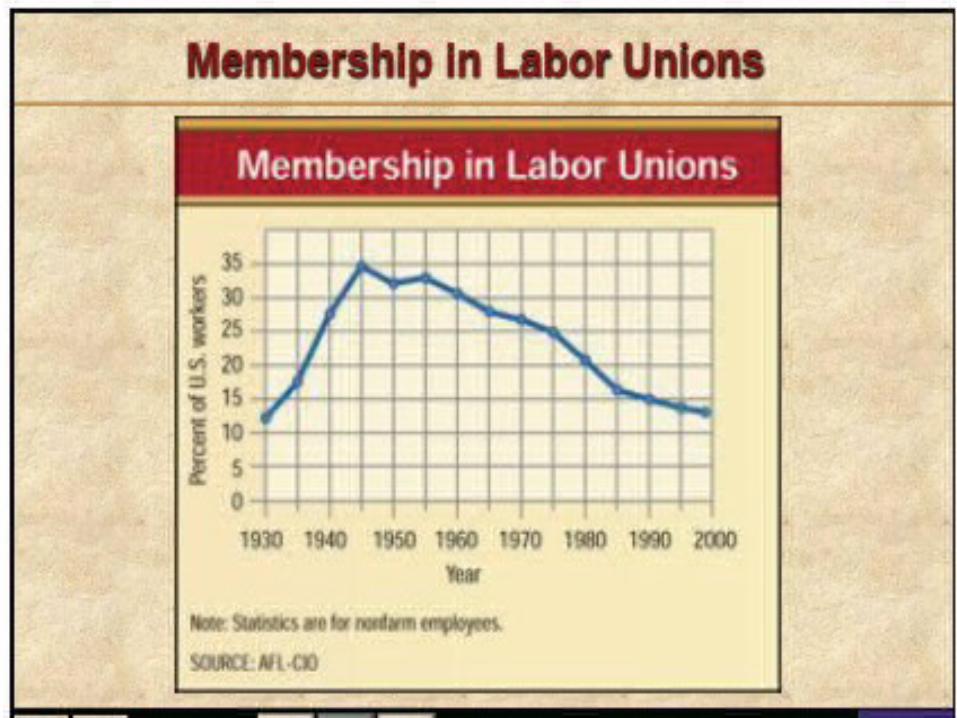
Unions
Median Voter Theorm
96% of all elections are won by the candidate who earns the most money
How would the political party react if a candidate became increasingly moderate?
How would the party react if a candidate suggested a compromise with the other party?
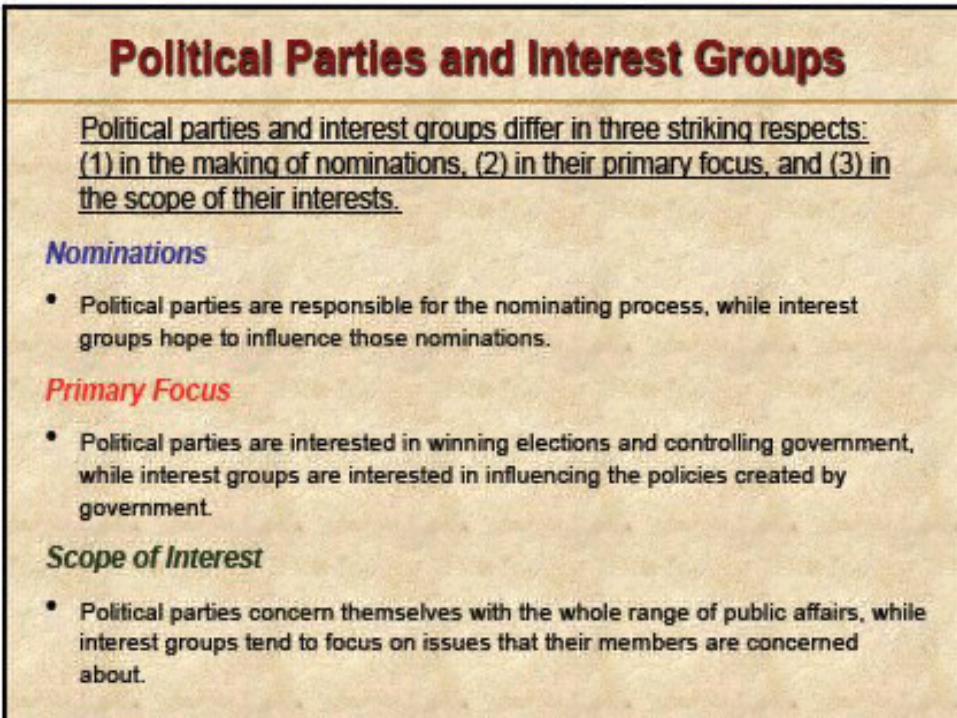
Political Parties
Political Parties are formed by people who share similar ideas. The goals of the party are to influence and control government decisions by getting their representatives elected into public office.
Conservative generally favor the Republican PartyLiberals generally favor the Democratic Party
We have a 2 party system Why? This does lead to stability
Roles of Political Parties:
Nominating Candidates and support them financially
Informing and activating supporters
Bonding (Stamp of Approval) – reputation
Governing (check and balance)
Watchdog
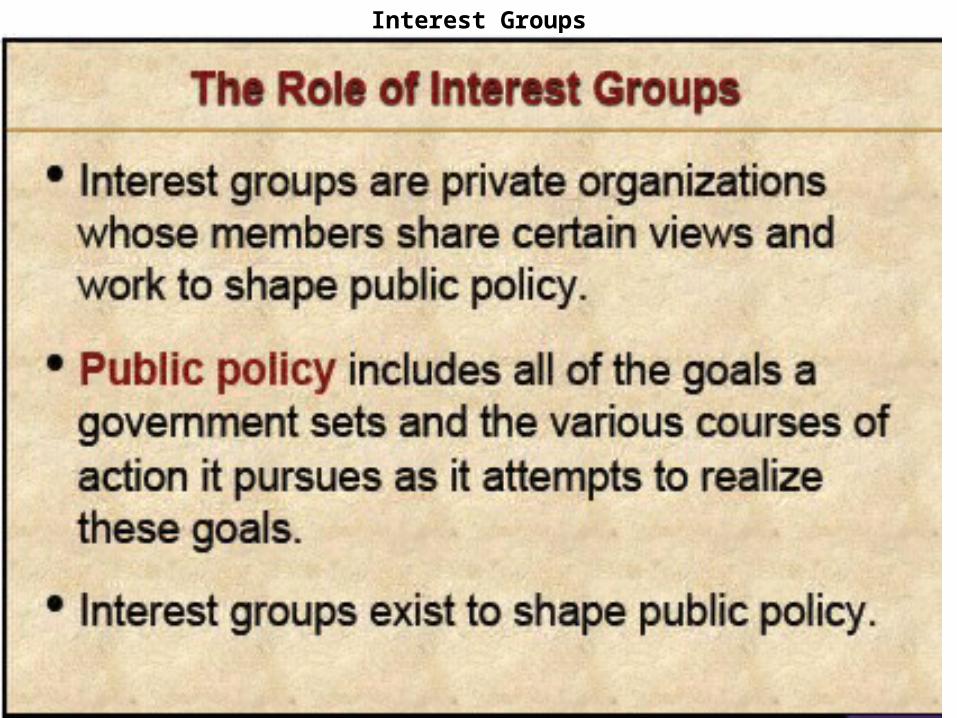
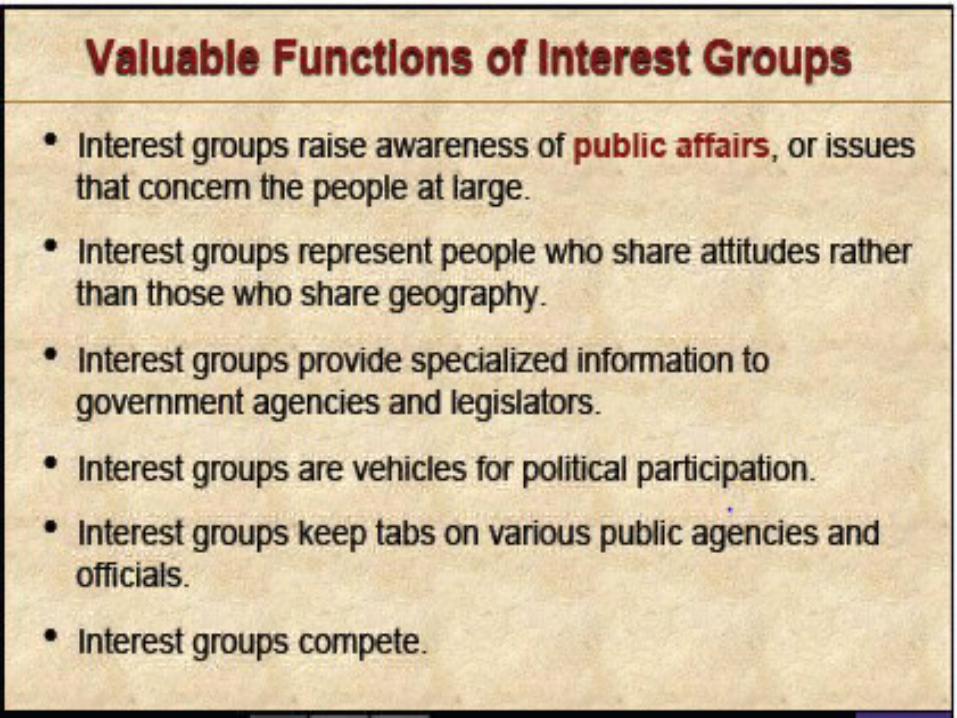
Interest Groups
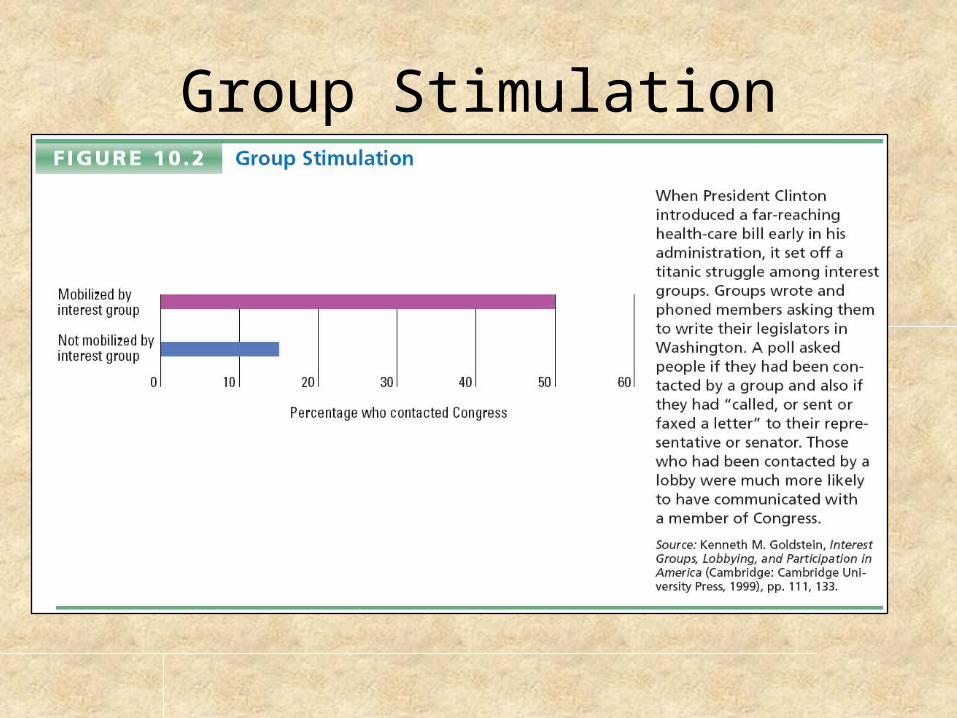
Group Stimulation
How Interest Groups Form• Who is Being Organized
– The wealthy, well-educated, and politically motivated are more likely to form and join lobbies
– Factors affecting group organization
• A disturbance or adverse change may make people aware that they need political representation
• The quality of leadership
• The higher the socioeconomic level of potential members, the more likely those members are to join
• Establishment by an institution
Interest Group Resources• Membership
– One of the most valuable resources a group can have is a large and politically active membership
– Members provide political muscle and financial resources
– Maintaining Membership
• Ideological appeals
• Direct mail
• The Internet
– Free-rider problem: a situation in which people benefit from the activities of the organization but do not contribute to those activities
Interest Group Resources
• Lobbyists
– Can be either full-time employees of the organization or hired from law firms or public relations firms
– Lobbyists can be fundraisers for candidates
– Typical interaction between lobbyists and policymakers is transmission of information
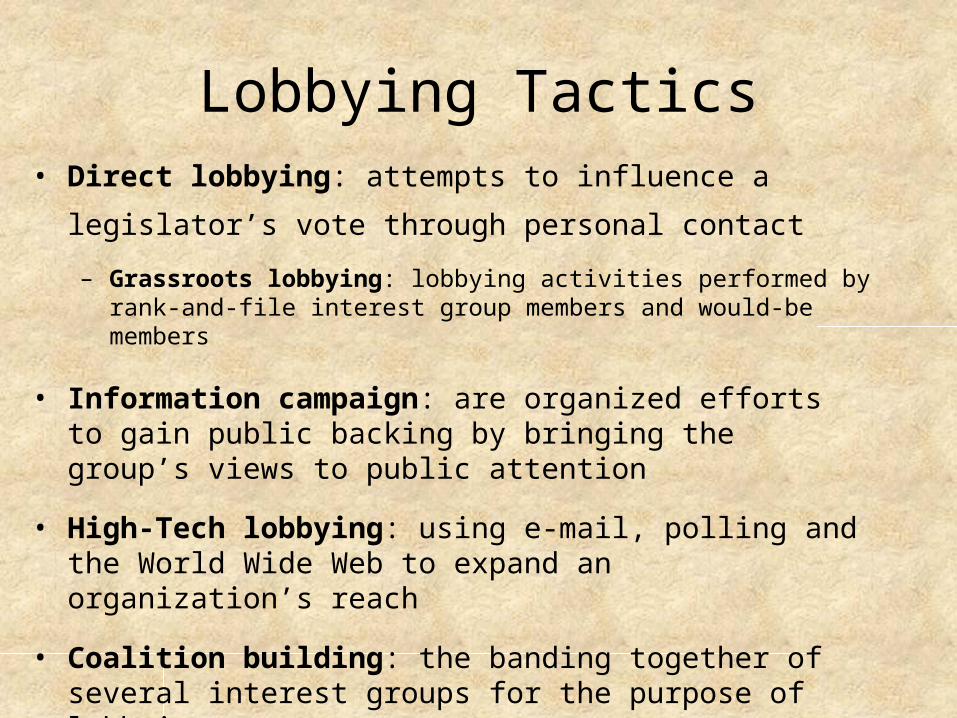
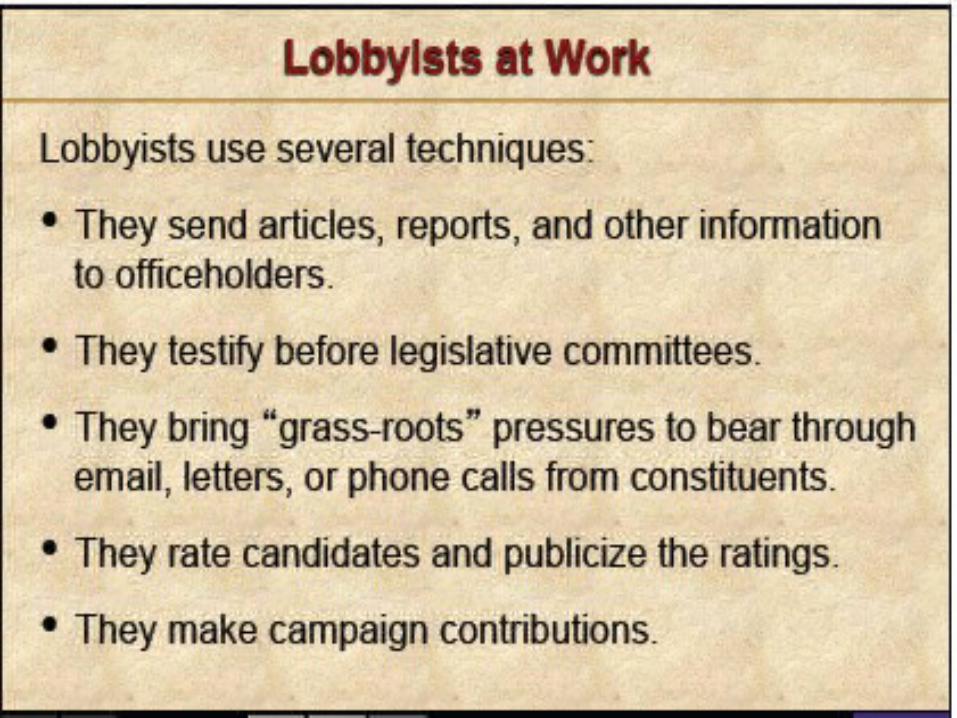
Lobbying Tactics• Direct lobbying: attempts to influence a legislator’s vote through
personal contact – Grassroots lobbying: lobbying activities performed by rank-and-file interest
group members and would-be members
• Information campaign: are organized efforts to gain public backing by bringing the group’s views to public attention
• High-Tech lobbying: using e-mail, polling and the World Wide Web to expand an organization’s reach
• Coalition building: the banding together of several interest groups for the purpose of lobbying
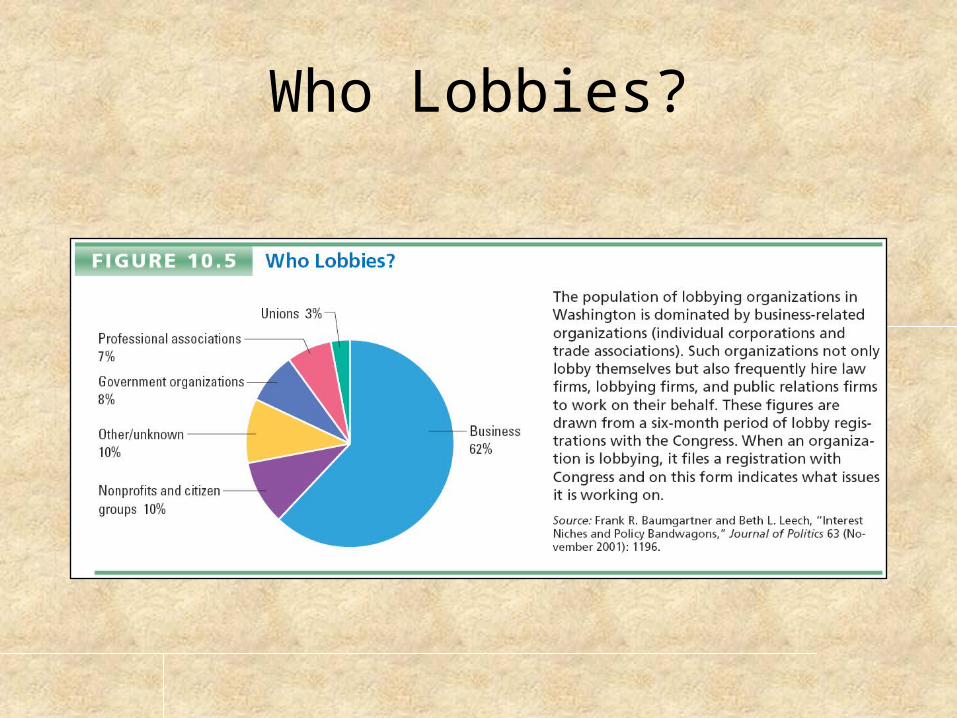
Who Lobbies?

Political Parties Interest Groups
Political Parties Interest Groups

Political Parties Interest Groups
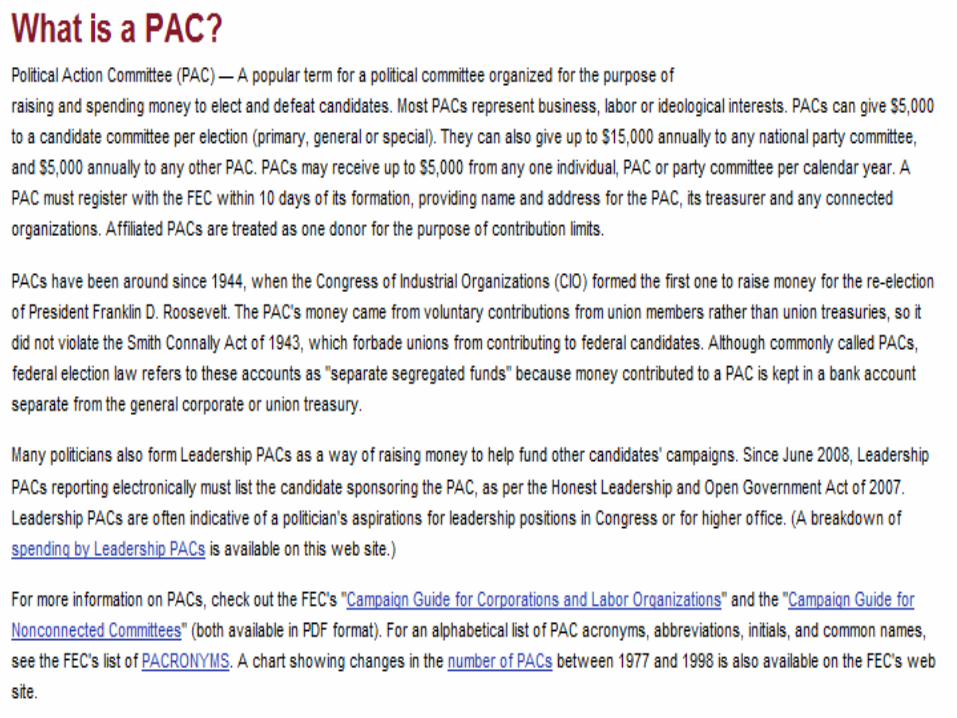
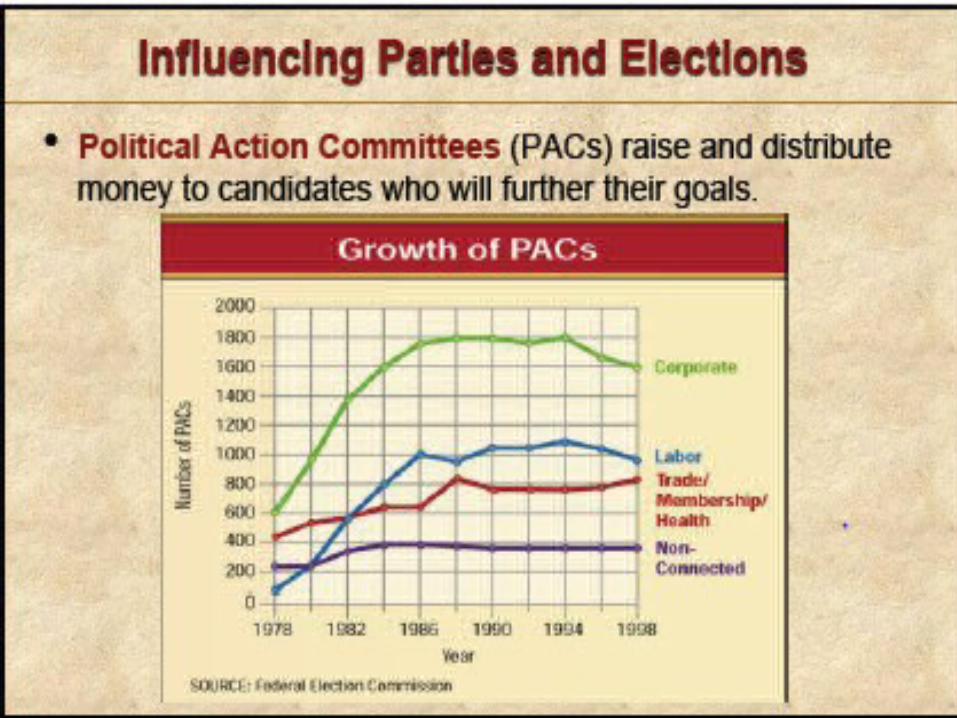
Political Action Committees
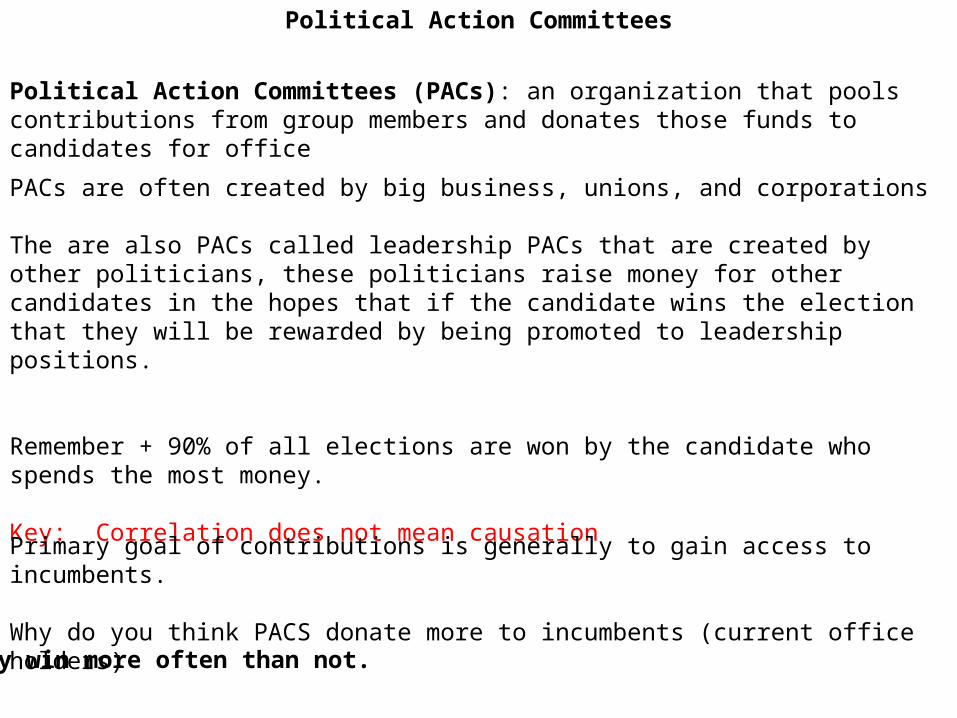
Political Action Committees (PACs): an organization that pools contributions from group members and donates those funds to candidates for office
They win more often than not.
PACs are often created by big business, unions, and corporations
The are also PACs called leadership PACs that are created by other politicians, these politicians raise money for other candidates in the hopes that if the candidate wins the election that they will be rewarded by being promoted to leadership positions.
Remember + 90% of all elections are won by the candidate who spends the most money.
Key: Correlation does not mean causation
Primary goal of contributions is generally to gain access to incumbents.
Why do you think PACS donate more to incumbents (current office holders)
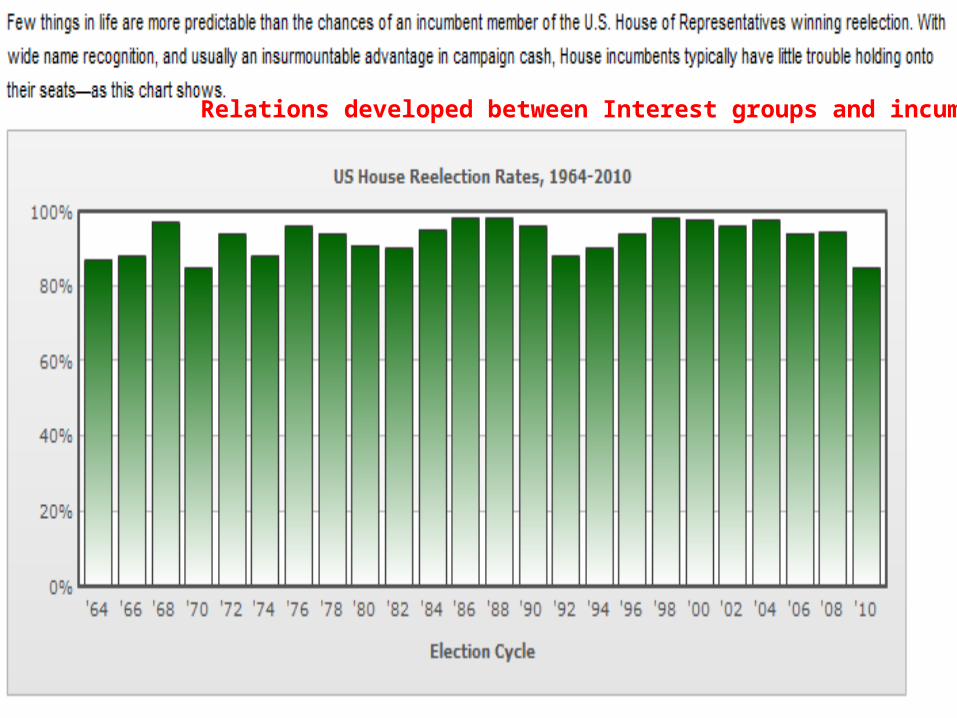
Relations developed between Interest groups and incumbent
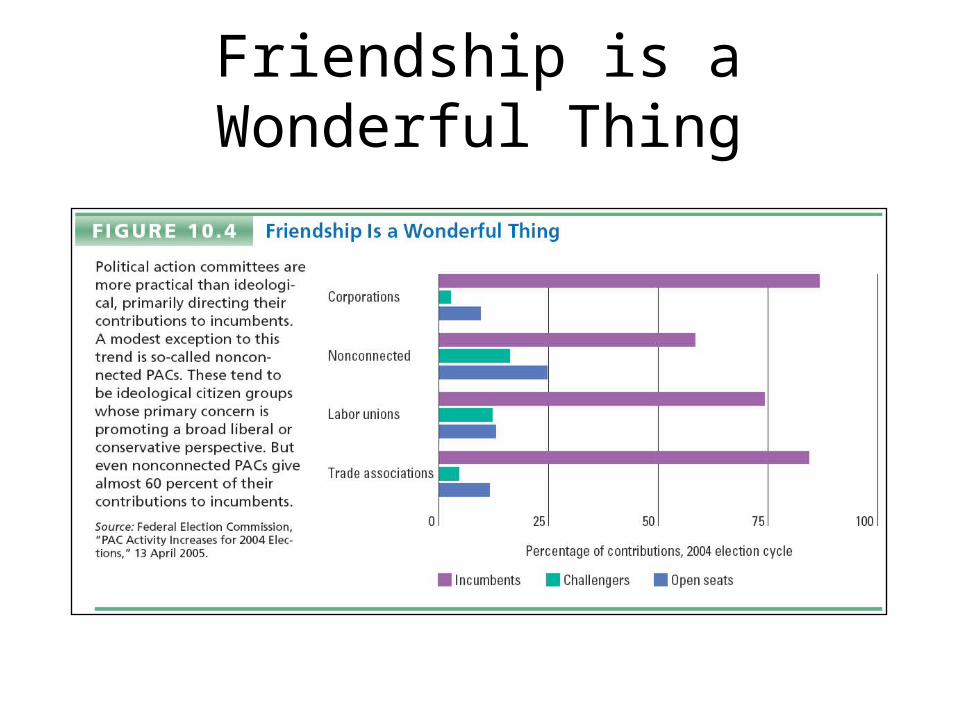
Friendship is a Wonderful Thing
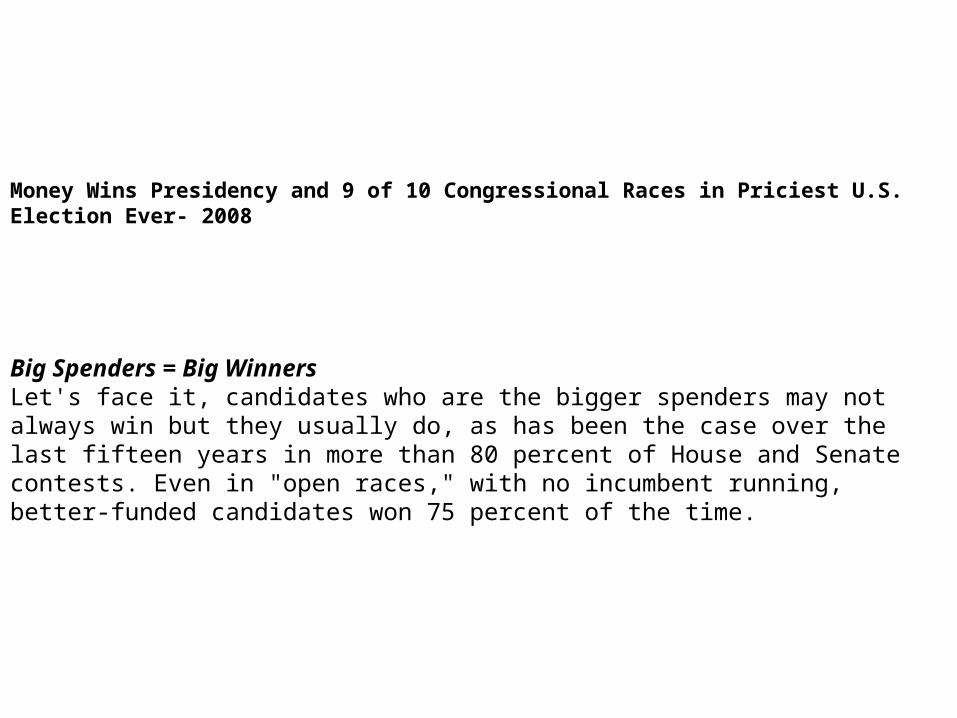
Money Wins Presidency and 9 of 10 Congressional Races in Priciest U.S. Election Ever- 2008
Big Spenders = Big Winners Let's face it, candidates who are the bigger spenders may not always win but they usually do, as has been the case over the last fifteen years in more than 80 percent of House and Senate contests. Even in "open races," with no incumbent running, better-funded candidates won 75 percent of the time.
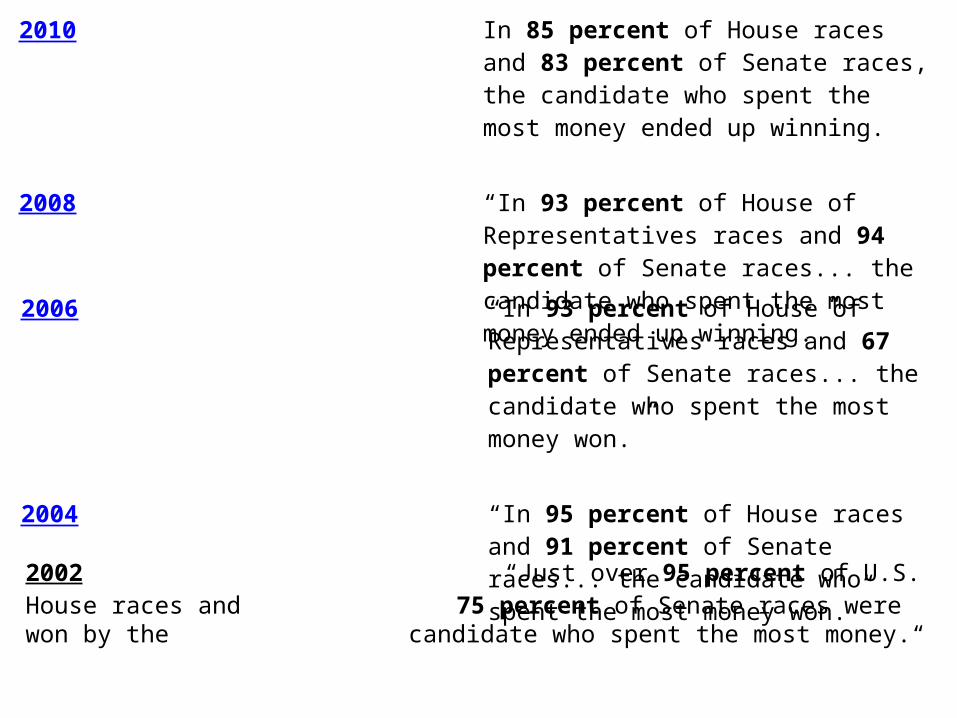
2010 In 85 percent of House races and 83 percent of Senate races, the candidate who spent the most money ended up winning.
2008 “In 93 percent of House of Representatives races and 94 percent of Senate races... the candidate who spent the most money ended up winning.”
2006 “In 93 percent of House of Representatives races and 67 percent of Senate races... the candidate who spent the most money won.”
2004 “In 95 percent of House races and 91 percent of Senate races... the candidate who spent the most money won.”
2002 “Just over 95 percent of U.S. House races and 75 percent of Senate races were won by the candidate who spent the most money.“
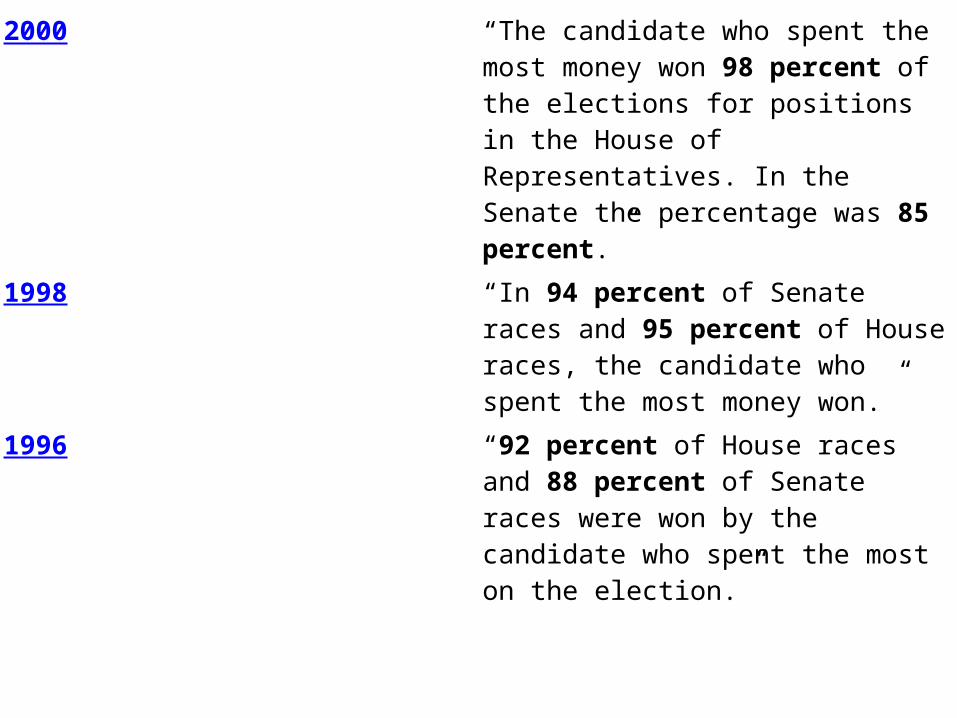
2000 “The candidate who spent the most money won 98 percent of the elections for positions in the House of Representatives. In the Senate the percentage was 85 percent.”
1998 “In 94 percent of Senate races and 95 percent of House races, the candidate who spent the most money won.”
1996 “92 percent of House races and 88 percent of Senate races were won by the candidate who spent the most on the election.”
Make a list of assumptions about raising money and elections
Use the information from the previous slides to help you with your educated assumptions
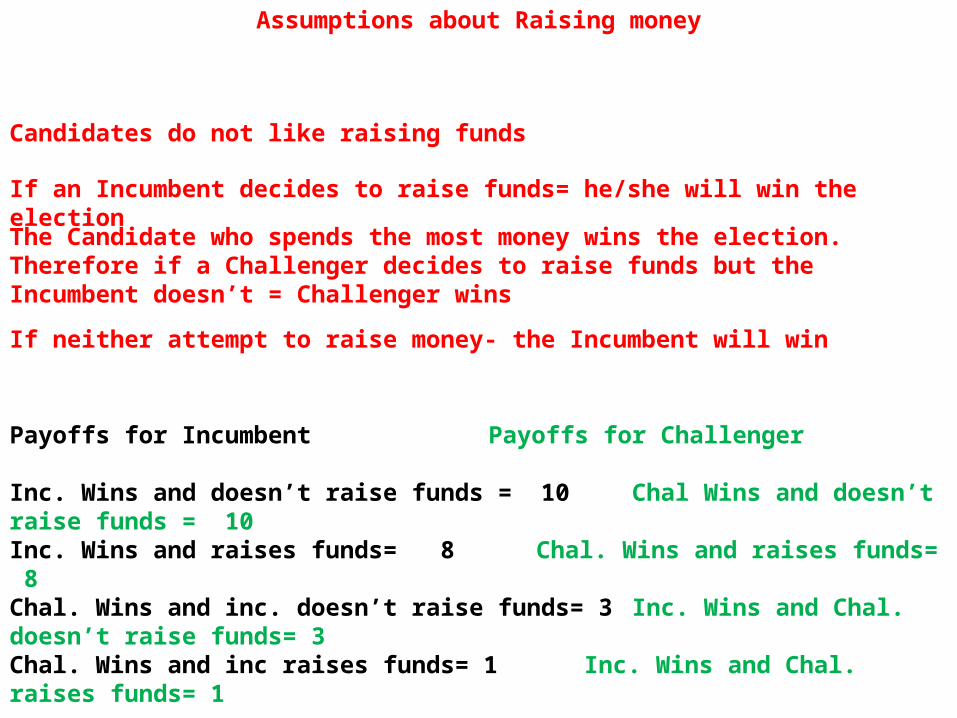
Assumptions about Raising money
Candidates do not like raising funds
The Candidate who spends the most money wins the election. Therefore if a Challenger decides to raise funds but the Incumbent doesn’t = Challenger wins
If an Incumbent decides to raise funds= he/she will win the election
If neither attempt to raise money- the Incumbent will win
Payoffs for Incumbent Payoffs for Challenger
Inc. Wins and doesn’t raise funds = 10 Chal Wins and doesn’t raise funds = 10Inc. Wins and raises funds= 8 Chal. Wins and raises funds= 8Chal. Wins and inc. doesn’t raise funds= 3 Inc. Wins and Chal. doesn’t raise funds= 3Chal. Wins and inc raises funds= 1 Inc. Wins and Chal. raises funds= 1
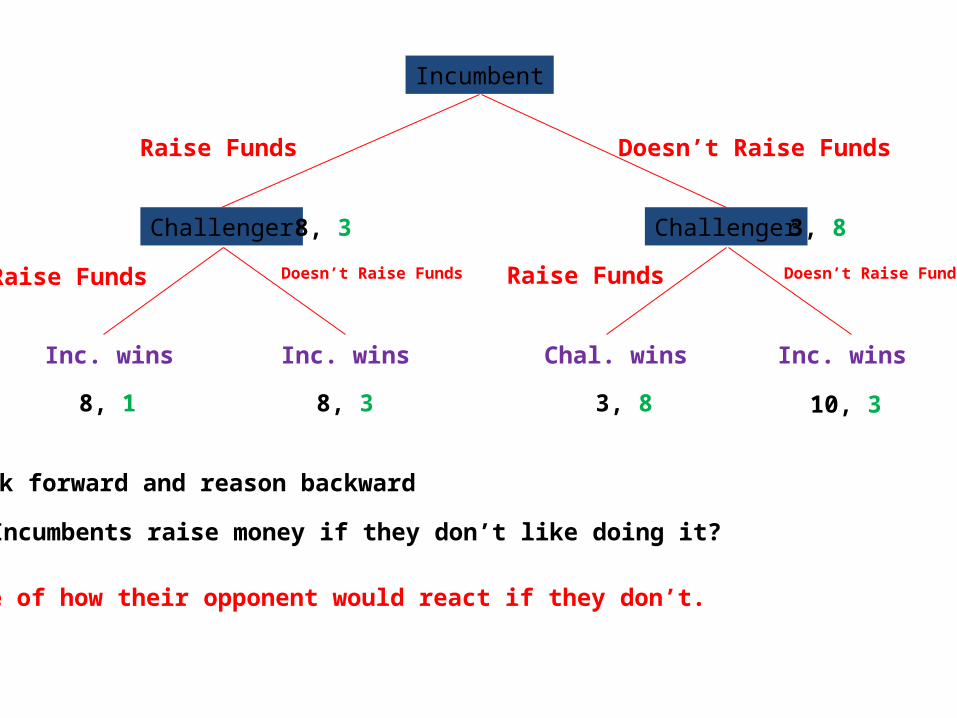
Incumbent
ChallengerChallenger
Raise Funds Doesn’t Raise Funds
Raise Funds Raise Funds Doesn’t Raise FundsDoesn’t Raise Funds
Inc. wins Inc. wins Chal. wins Inc. wins
8, 1 8, 3 3, 8 10, 3
8, 3 3, 8
Look forward and reason backward
Why do Incumbents raise money if they don’t like doing it?
Because of how their opponent would react if they don’t.
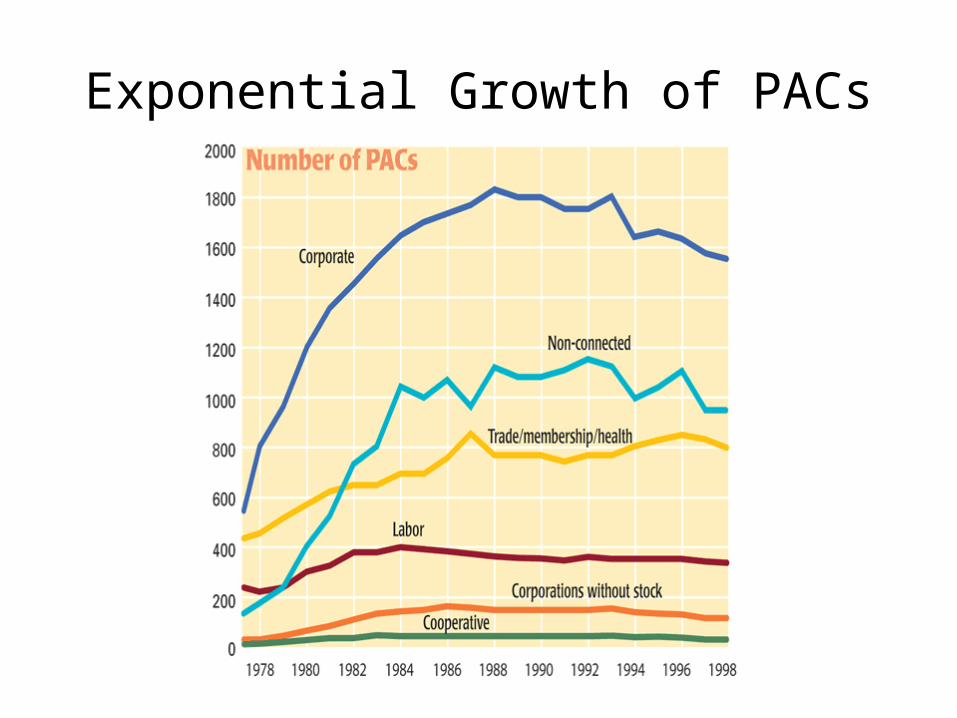
Exponential Growth of PACs
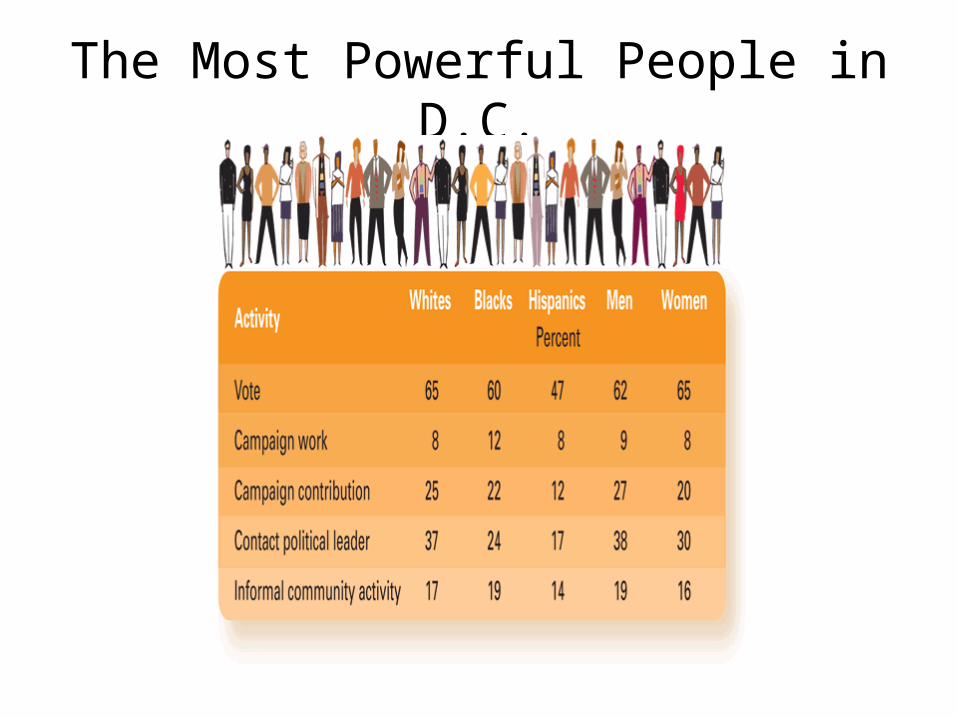
The Most Powerful People in D.C.
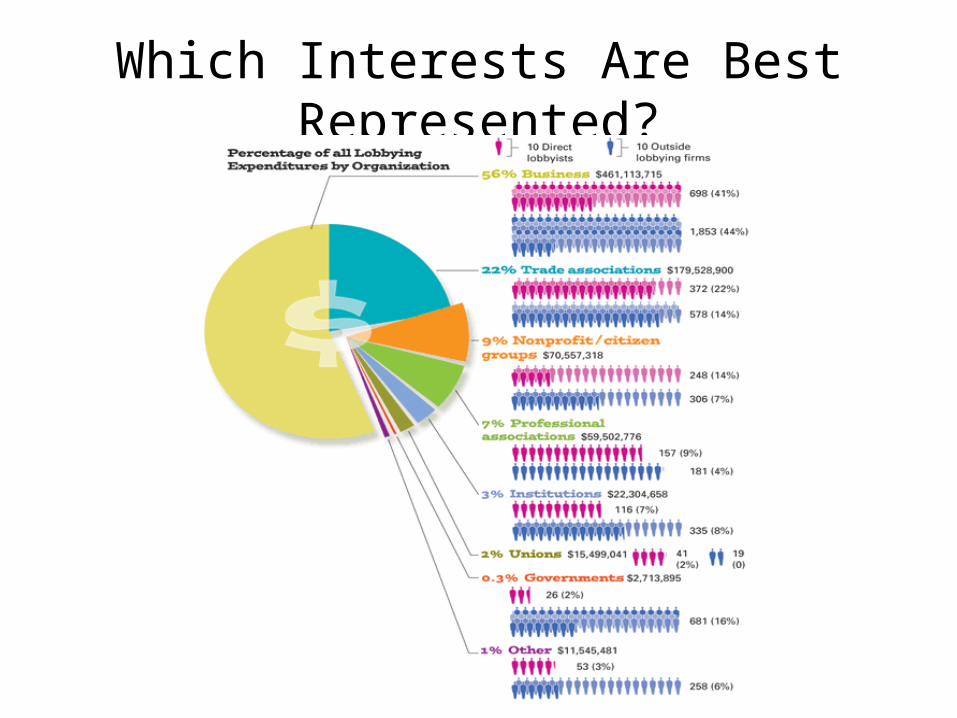
Which Interests Are Best Represented?
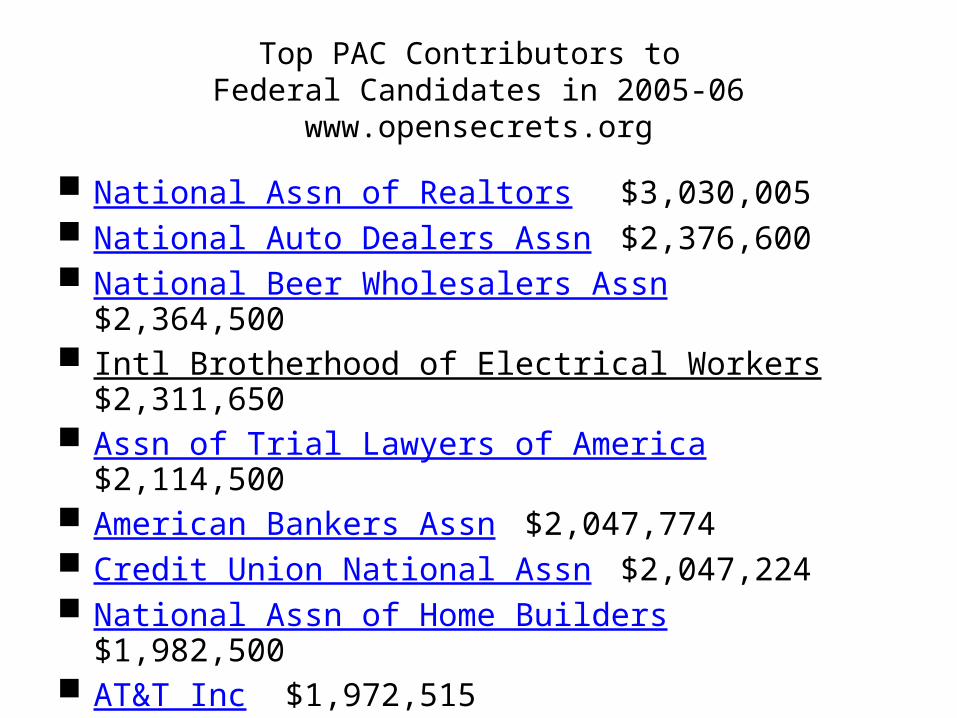
Top PAC Contributors to Federal Candidates in 2005-06
www.opensecrets.org
National Assn of Realtors $3,030,005 National Auto Dealers Assn $2,376,600 National Beer Wholesalers Assn $2,364,500 Intl Brotherhood of Electrical Workers $2,311,650 Assn of Trial Lawyers of America $2,114,500 American Bankers Assn $2,047,774 Credit Union National Assn $2,047,224 National Assn of Home Builders $1,982,500 AT&T Inc $1,972,515 United Parcel Service (UPS) $1,872,179
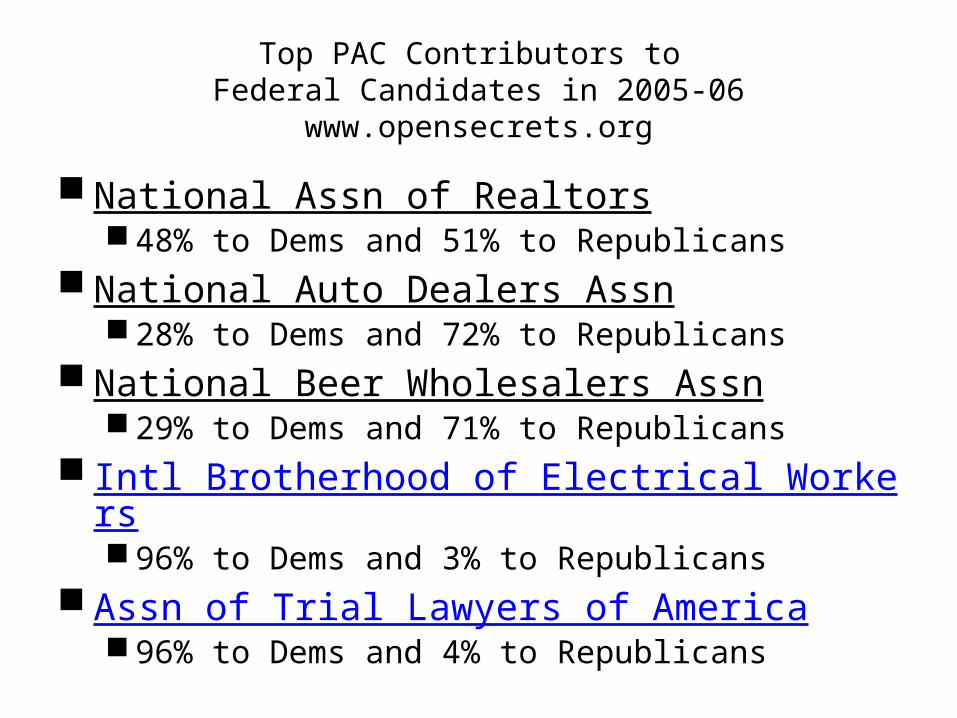
Top PAC Contributors to Federal Candidates in 2005-06
www.opensecrets.org
National Assn of Realtors 48% to Dems and 51% to Republicans
National Auto Dealers Assn 28% to Dems and 72% to Republicans
National Beer Wholesalers Assn 29% to Dems and 71% to Republicans
Intl Brotherhood of Electrical Workers 96% to Dems and 3% to Republicans
Assn of Trial Lawyers of America 96% to Dems and 4% to Republicans
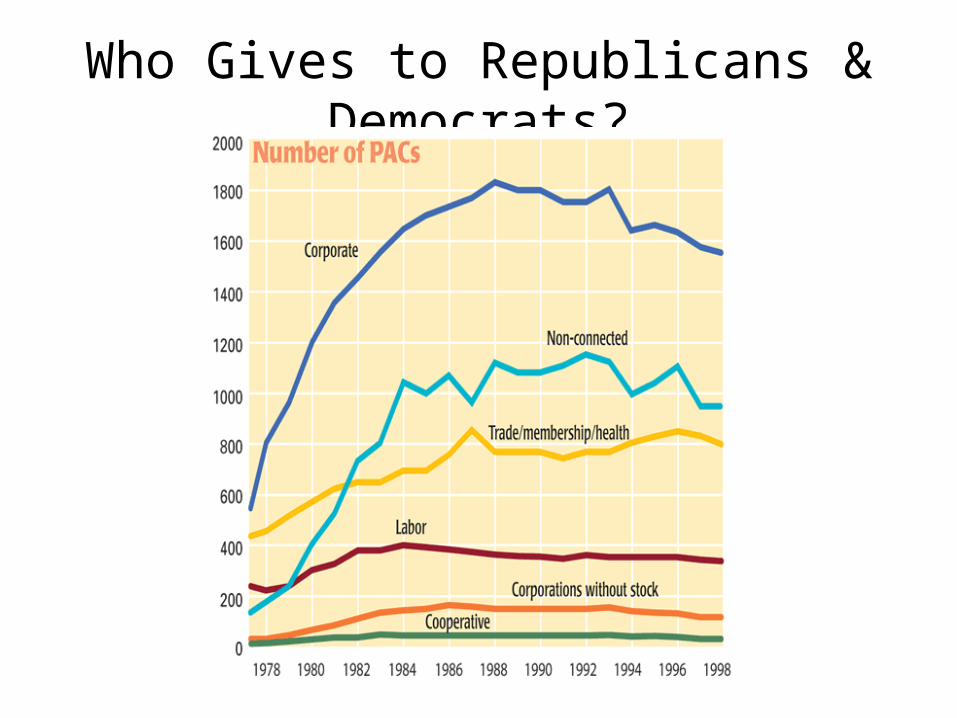
Who Gives to Republicans & Democrats?
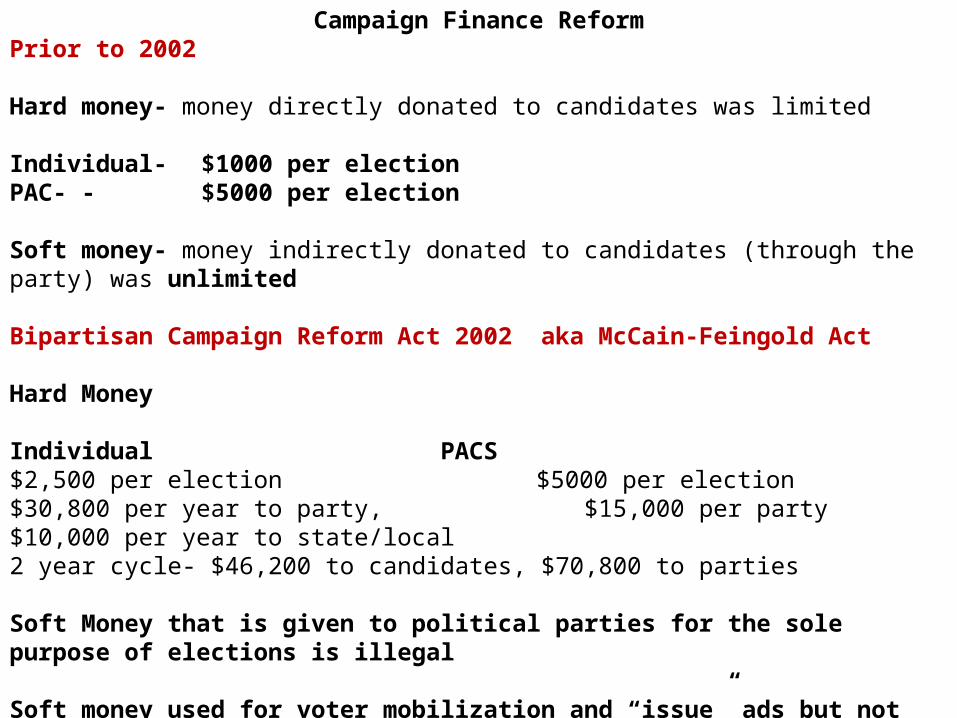
Campaign Finance ReformPrior to 2002
Hard money- money directly donated to candidates was limited
Individual- $1000 per electionPAC- - $5000 per election
Soft money- money indirectly donated to candidates (through the party) was unlimited
Bipartisan Campaign Reform Act 2002 aka McCain-Feingold Act
Hard Money
Individual PACS$2,500 per election $5000 per election$30,800 per year to party, $15,000 per party$10,000 per year to state/local2 year cycle- $46,200 to candidates, $70,800 to parties
Soft Money that is given to political parties for the sole purpose of elections is illegal
Soft money used for voter mobilization and “issue” ads but not directly endorsing or criticizing as specific candidate are legal. This is called a 527
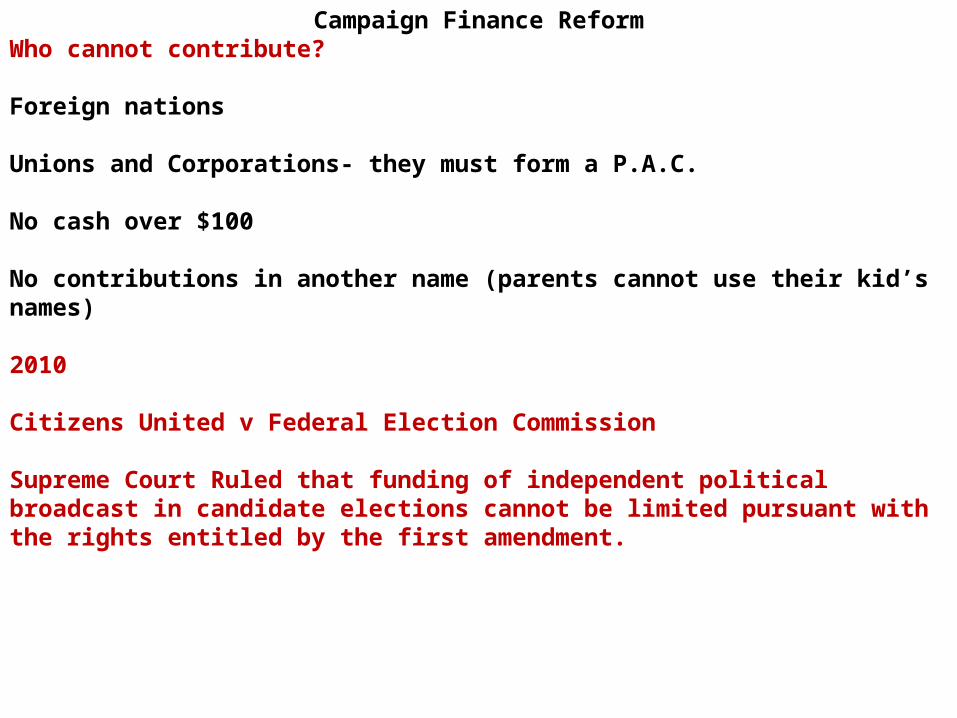
Campaign Finance ReformWho cannot contribute?
Foreign nations
Unions and Corporations- they must form a P.A.C.
No cash over $100
No contributions in another name (parents cannot use their kid’s names)
2010
Citizens United v Federal Election Commission
Supreme Court Ruled that funding of independent political broadcast in candidate elections cannot be limited pursuant with the rights entitled by the first amendment.
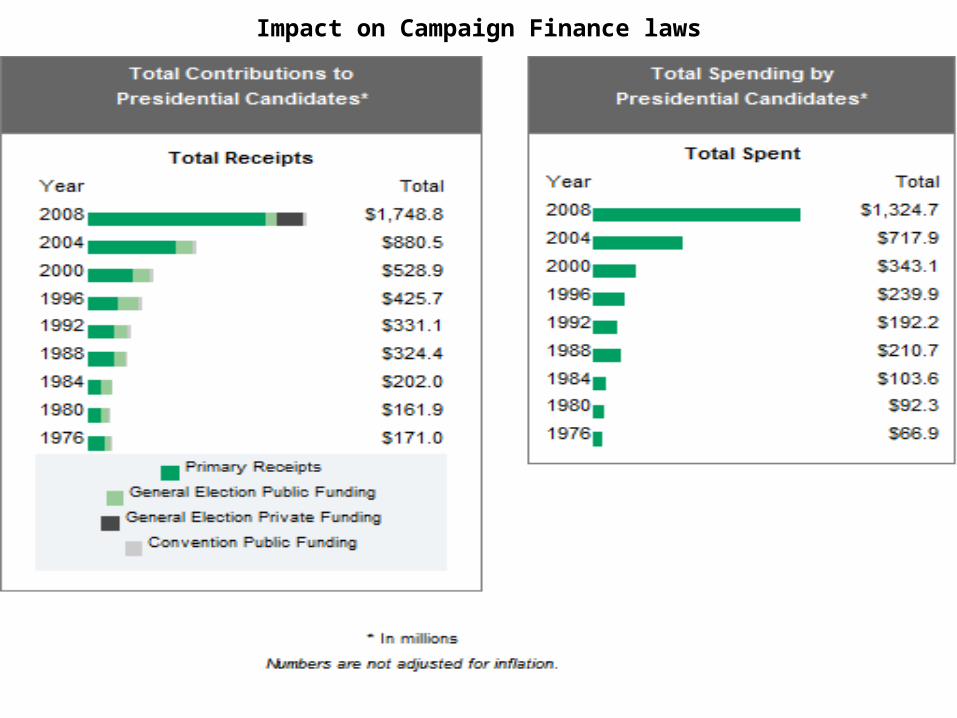
Impact on Campaign Finance laws
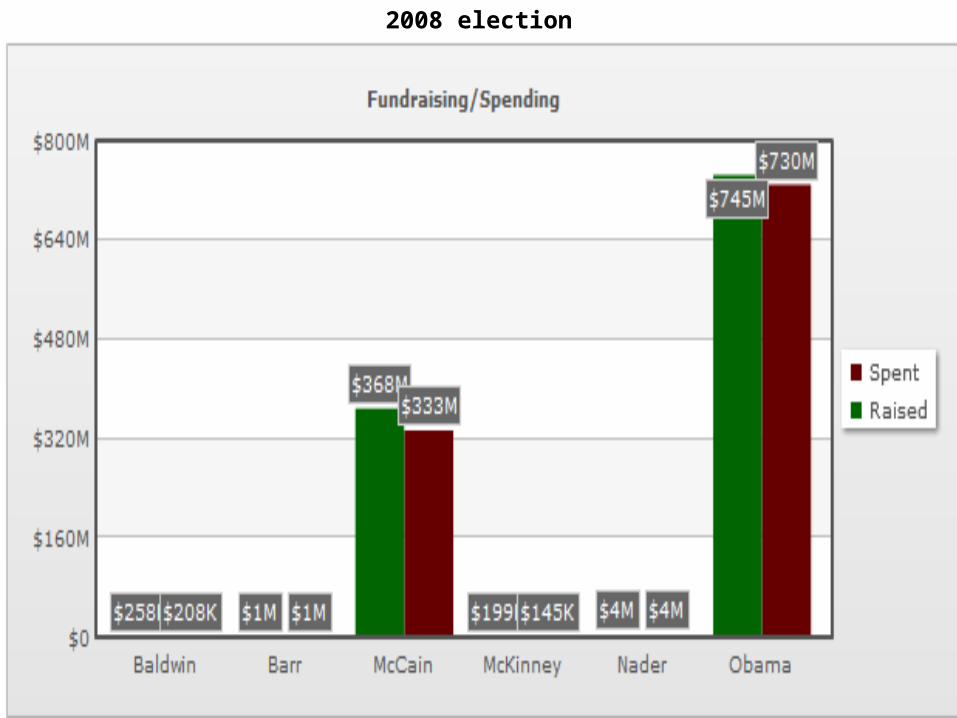
2008 election
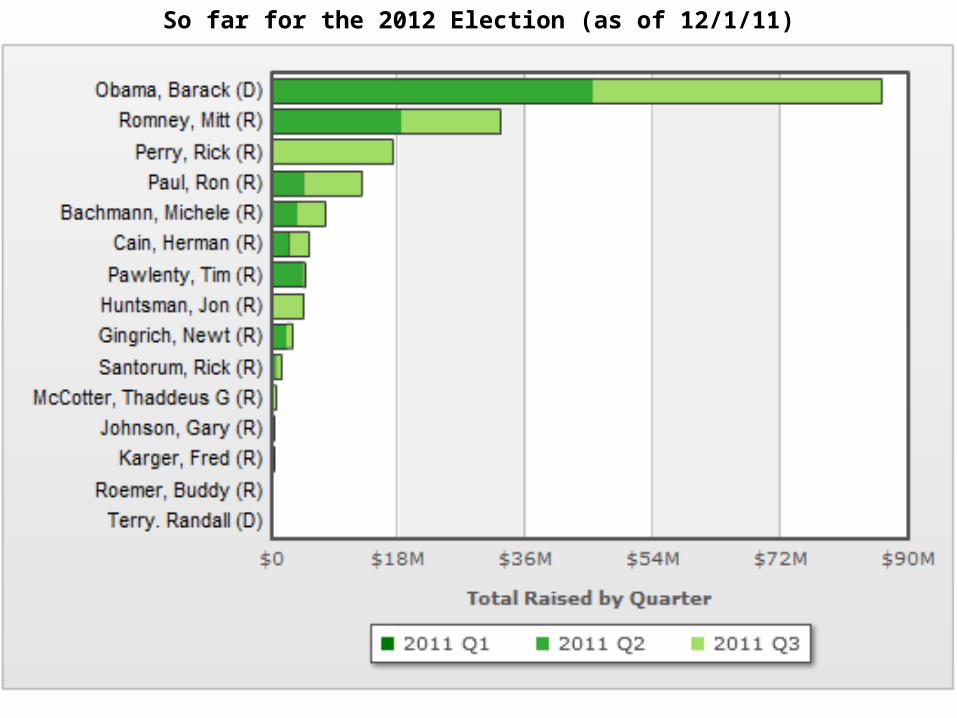
So far for the 2012 Election (as of 12/1/11)
It begs the question
If current office holders benefit so much from money why would they want to make it more difficult to raise it?
Hint: Think about the Public Choice theory on why businesses like regulations.
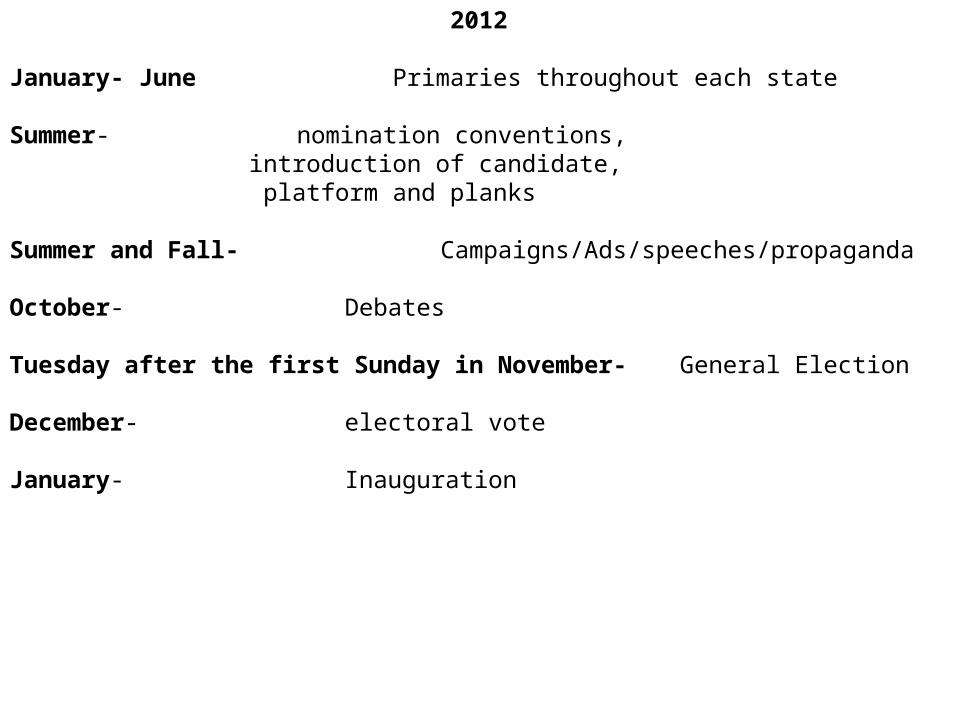
2012
January- June Primaries throughout each state
Summer- nomination conventions, introduction of candidate, platform and planks
Summer and Fall- Campaigns/Ads/speeches/propaganda
October- Debates
Tuesday after the first Sunday in November- General Election
December- electoral vote
January- Inauguration
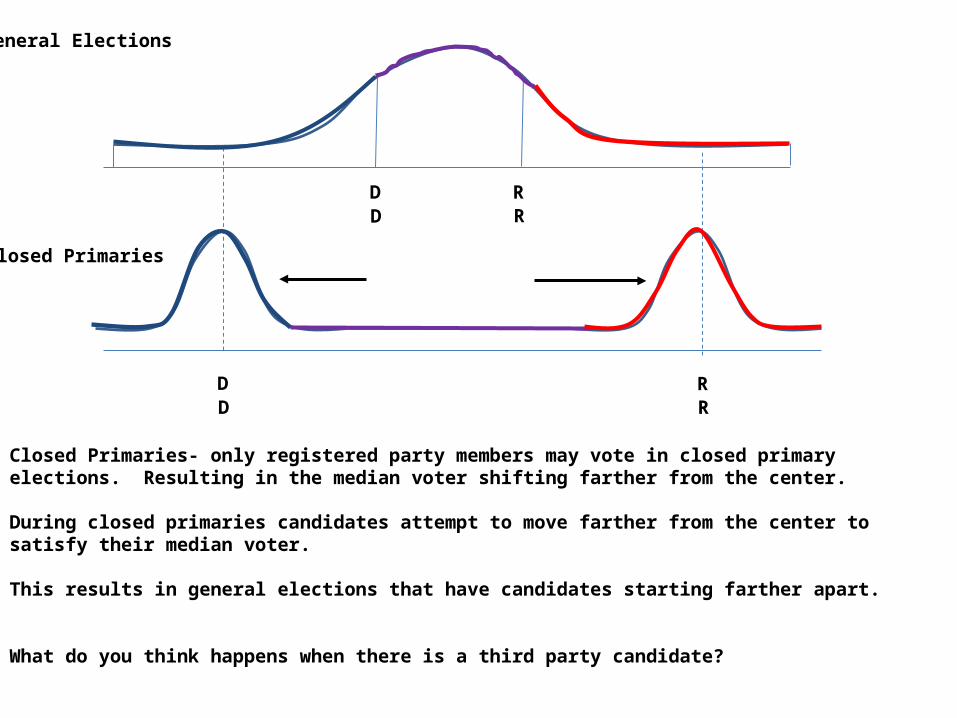
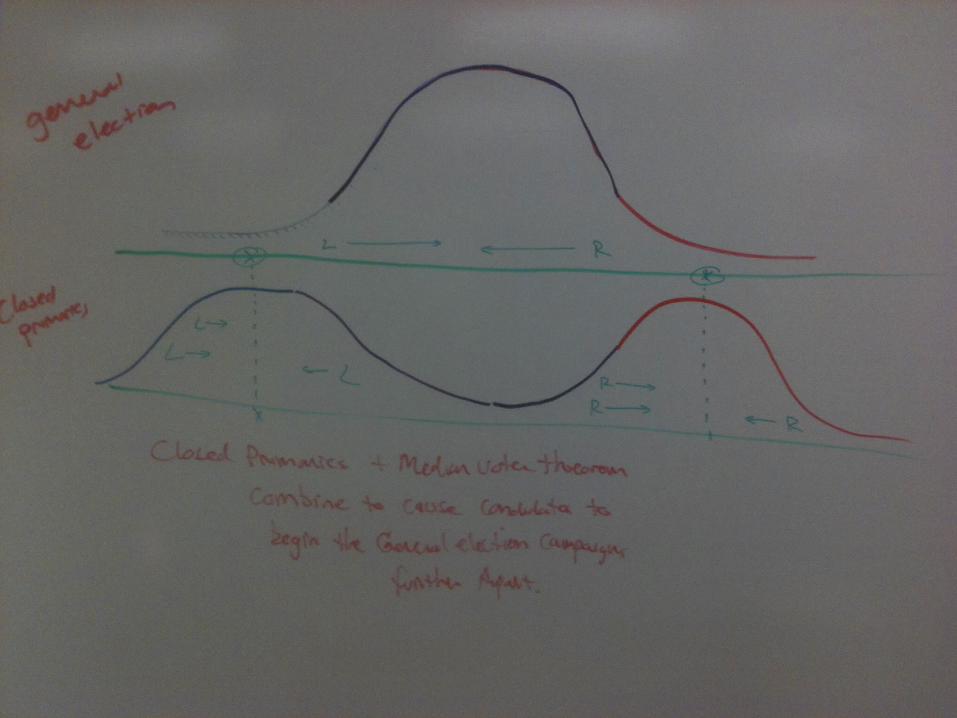
General Elections
Closed Primaries
Closed Primaries- only registered party members may vote in closed primary elections. Resulting in the median voter shifting farther from the center.
During closed primaries candidates attempt to move farther from the center to satisfy their median voter.
This results in general elections that have candidates starting farther apart.
What do you think happens when there is a third party candidate?
DD
RR
DD
RR
Party Platform- Issues that the candidates/party are running on
Plank- individual issues of a platform
Click on the links below to read about each parties platform from 2008
Republican Party platform 2008
Democratic Party platform 2008
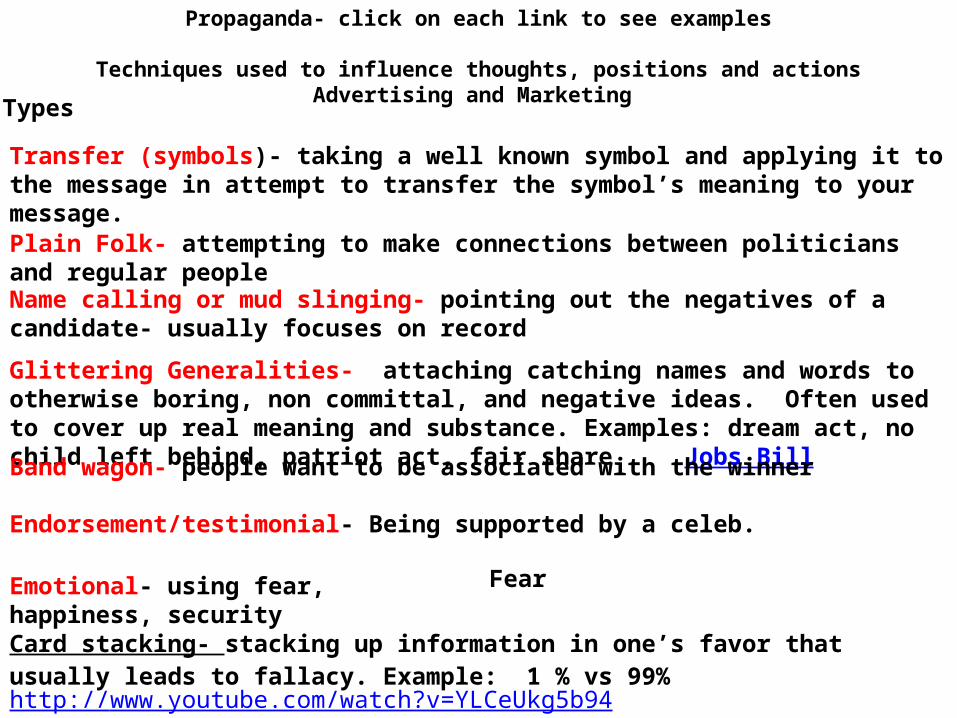
Propaganda- click on each link to see examples
Techniques used to influence thoughts, positions and actionsAdvertising and Marketing Types
Transfer (symbols)- taking a well known symbol and applying it to the message in attempt to transfer the symbol’s meaning to your message.
Plain Folk- attempting to make connections between politicians and regular people
Name calling or mud slinging- pointing out the negatives of a candidate- usually focuses on record
Glittering Generalities- attaching catching names and words to otherwise boring, non committal, and negative ideas. Often used to cover up real meaning and substance. Examples: dream act, no child left behind, patriot act, fair share Jobs Bill
Band wagon- people want to be associated with the winner
Endorsement/testimonial- Being supported by a celeb.
Emotional- using fear, happiness, security
Card stacking- stacking up information in one’s favor that usually leads to fallacy. Example: 1 % vs 99% http://www.youtube.com/watch?v=YLCeUkg5b94
Fear
Political-business cycle
Media
Sound bites
Election 2004 and Beyond
G. Terry MadonnaCenter for Politics & Public Affairs
The Floyd InstituteFranklin & Marshall College
The Historical Perspective
• Presidential Election Parity
• Incumbency Problems
• Electoral College Balance
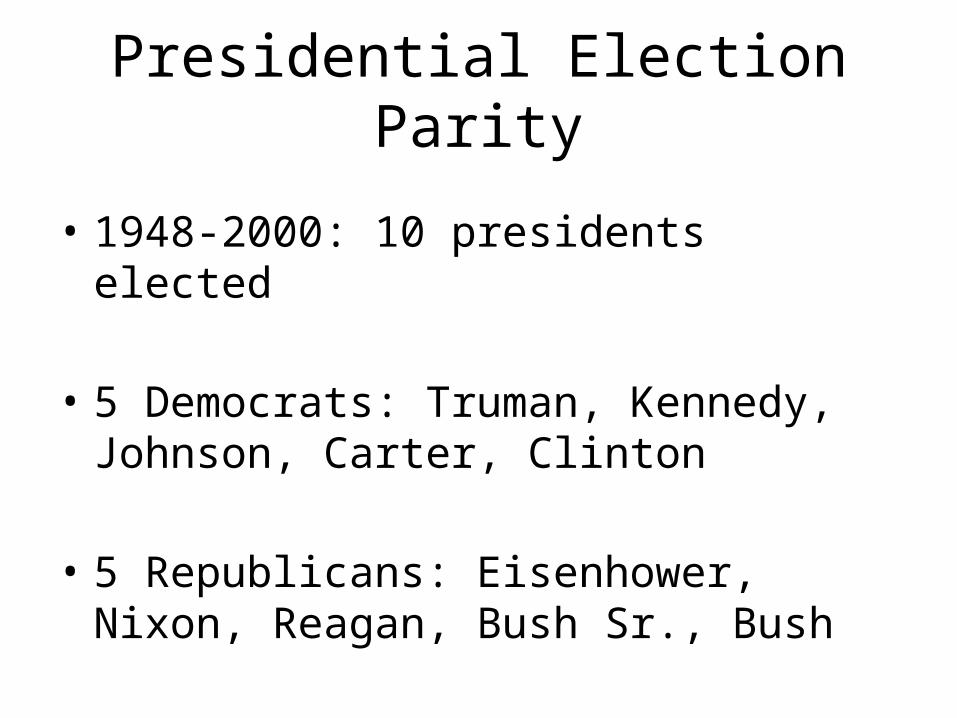
Presidential Election Parity
• 1948-2000: 10 presidents elected
• 5 Democrats: Truman, Kennedy, Johnson, Carter, Clinton
• 5 Republicans: Eisenhower, Nixon, Reagan, Bush Sr., Bush
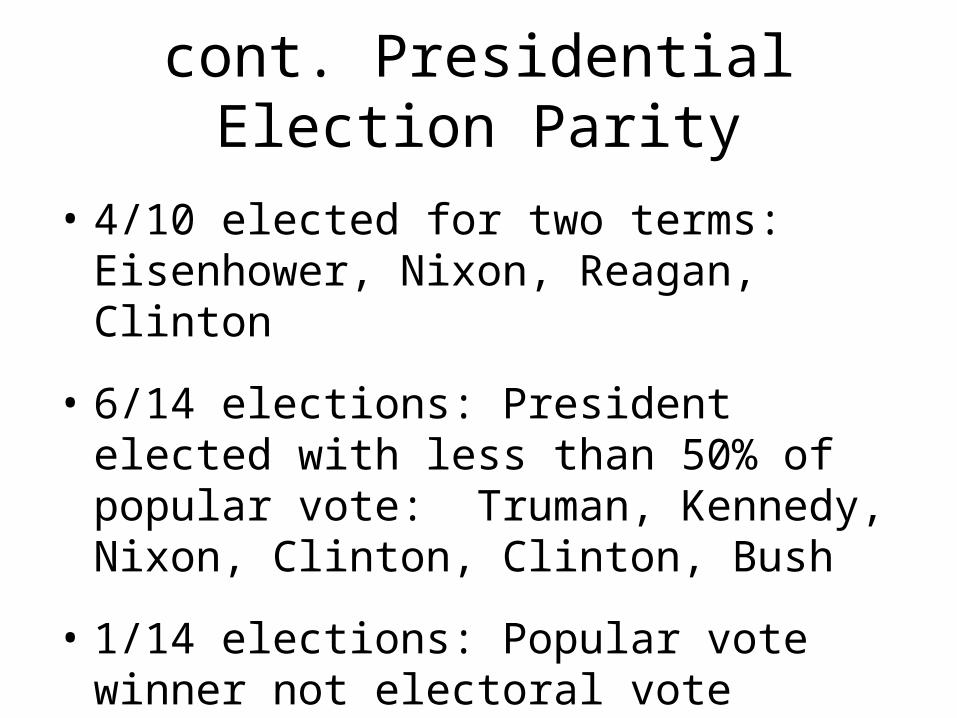
cont. Presidential Election Parity
• 4/10 elected for two terms: Eisenhower, Nixon, Reagan, Clinton
• 6/14 elections: President elected with less than 50% of popular vote: Truman, Kennedy, Nixon, Clinton, Clinton, Bush
• 1/14 elections: Popular vote winner not electoral vote winner: Bush (2000)
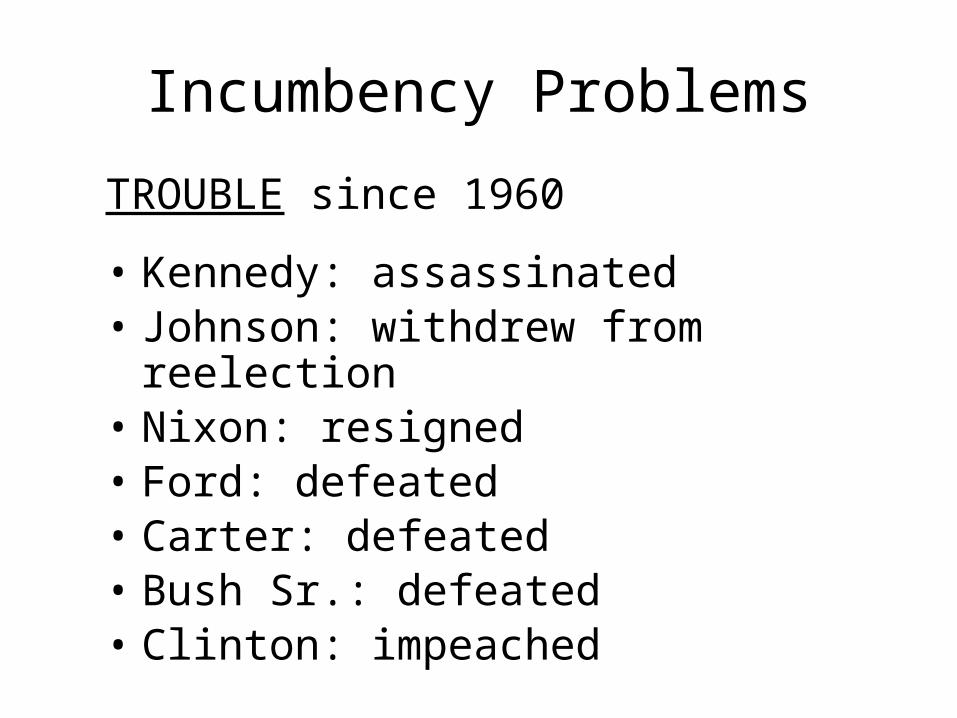
Incumbency Problems
TROUBLE since 1960
• Kennedy: assassinated• Johnson: withdrew from reelection• Nixon: resigned• Ford: defeated• Carter: defeated• Bush Sr.: defeated• Clinton: impeached
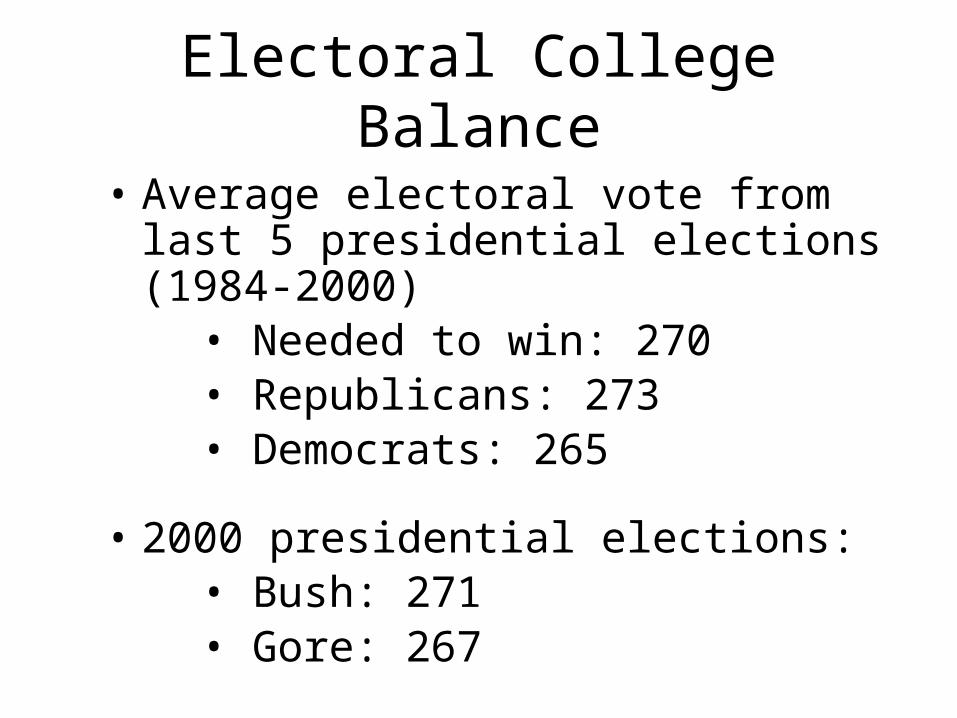
Electoral College Balance
• Average electoral vote from last 5 presidential elections (1984-2000)
• Needed to win: 270• Republicans: 273• Democrats: 265
• 2000 presidential elections: • Bush: 271• Gore: 267
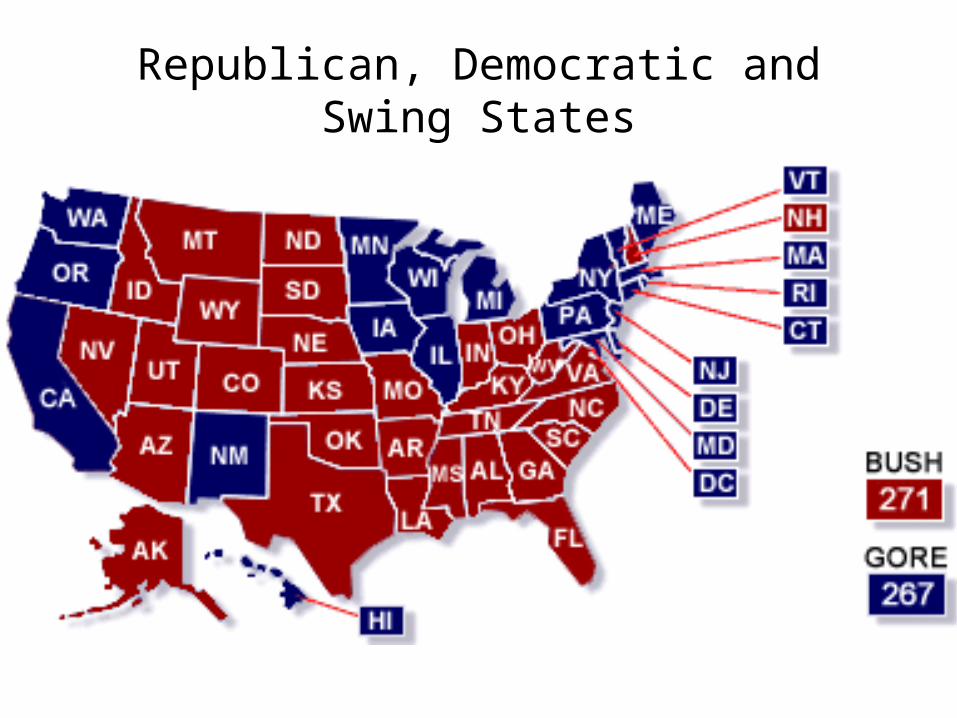
Republican, Democratic and Swing States
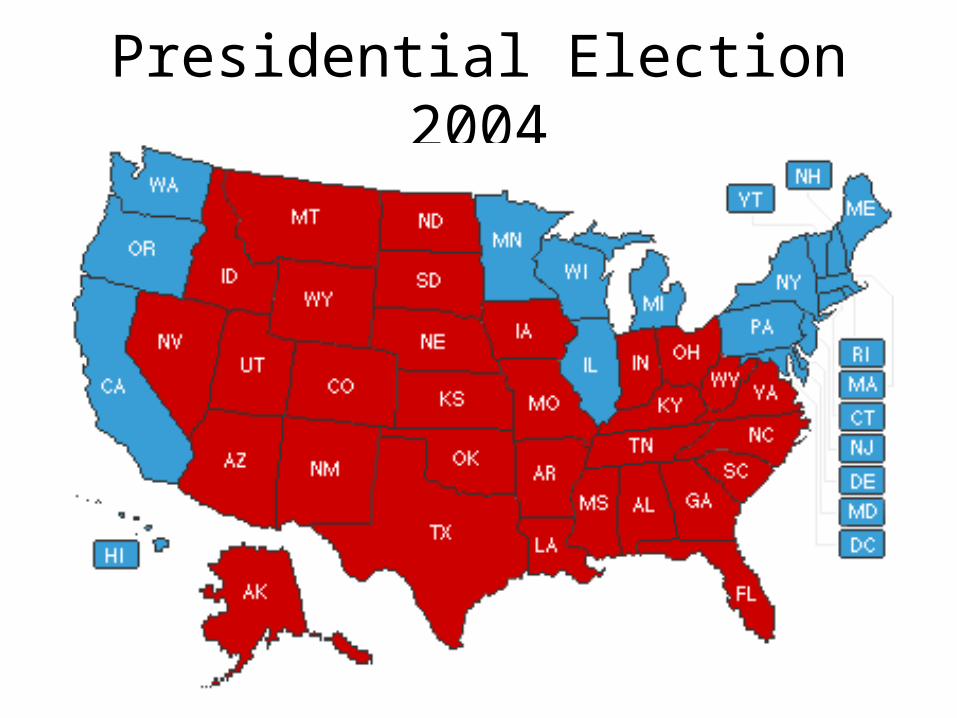
Presidential Election 2004
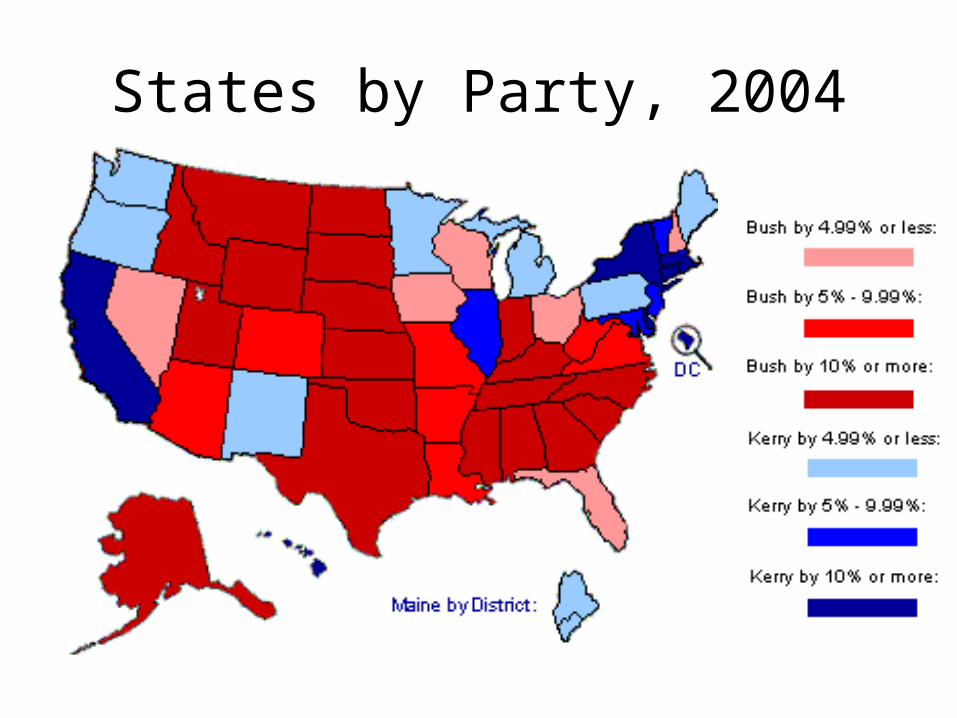
States by Party, 2004
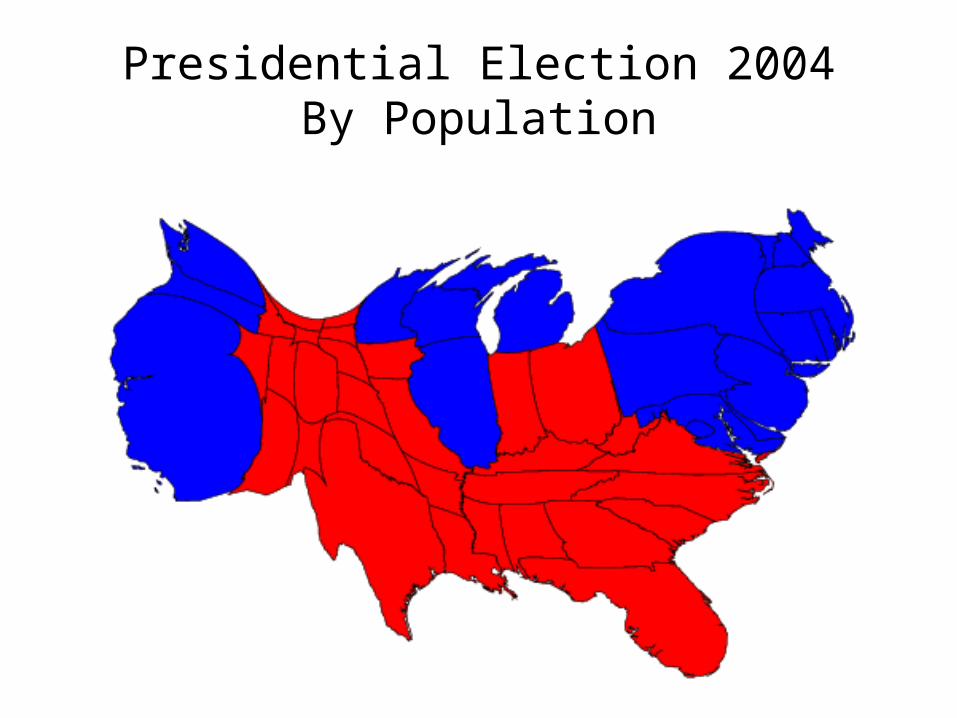
Presidential Election 2004By Population
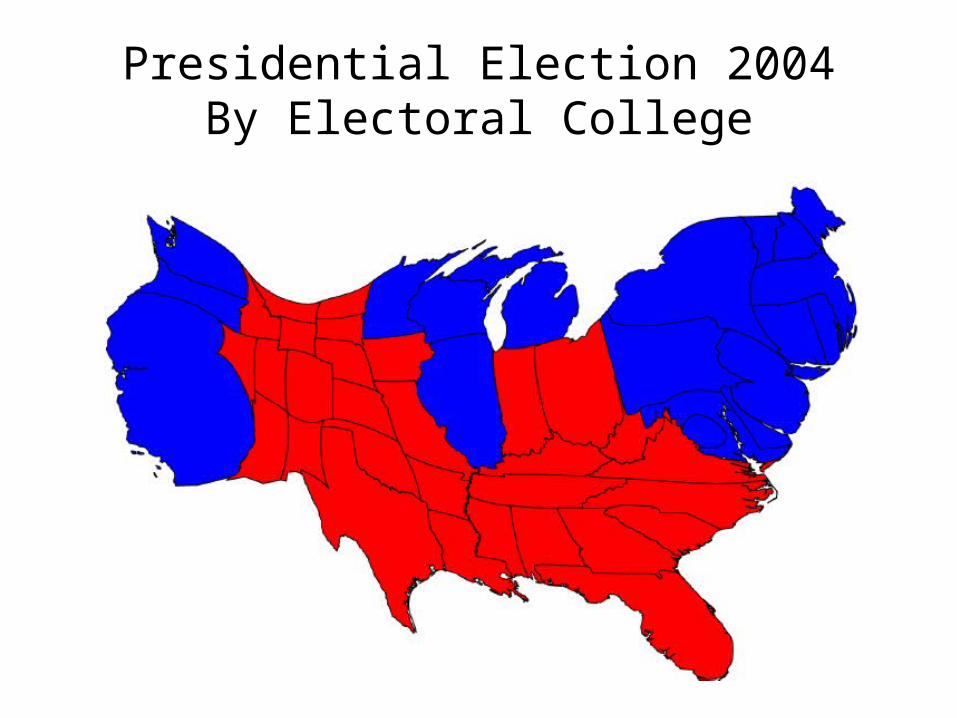
Presidential Election 2004By Electoral College
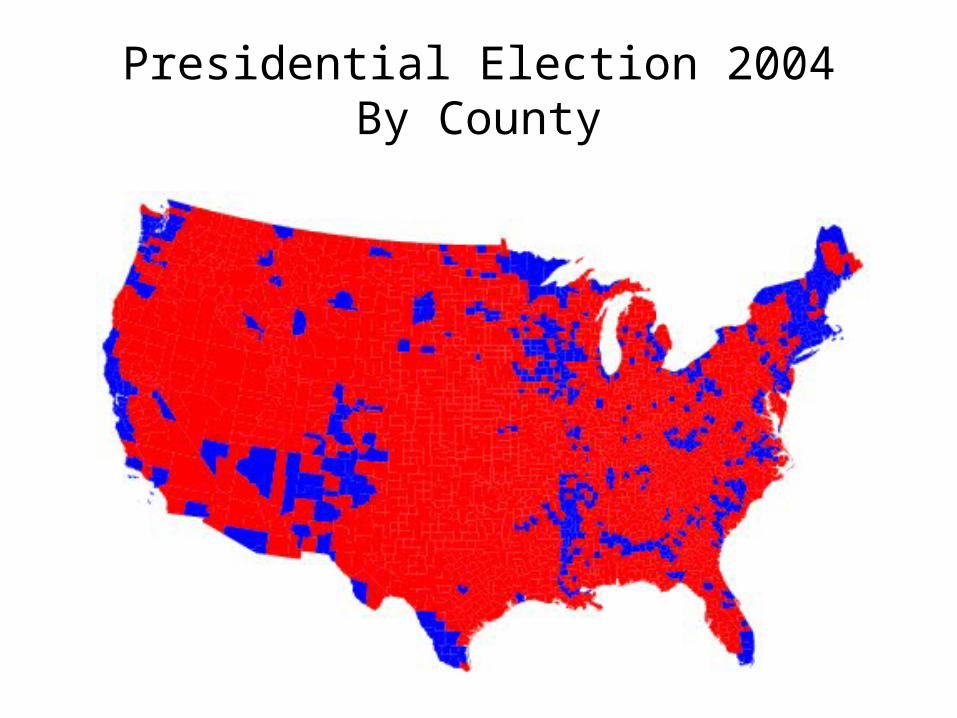
Presidential Election 2004By County
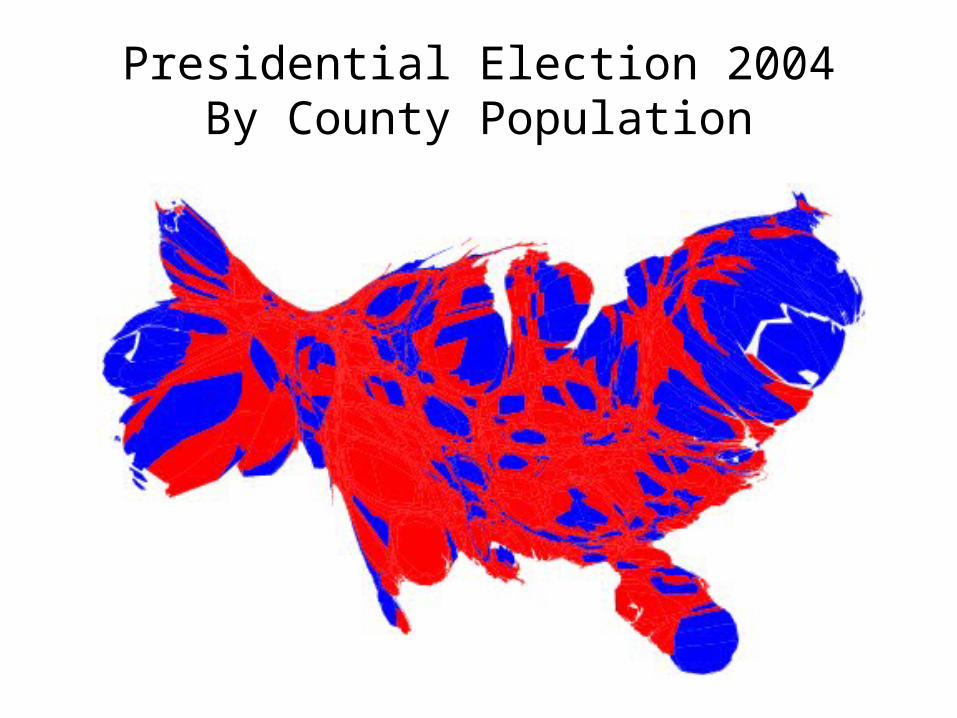
Presidential Election 2004By County Population
Strategic Thinking
• Why all states are not equal
• Why all votes are not equal
• What calculus really does matter
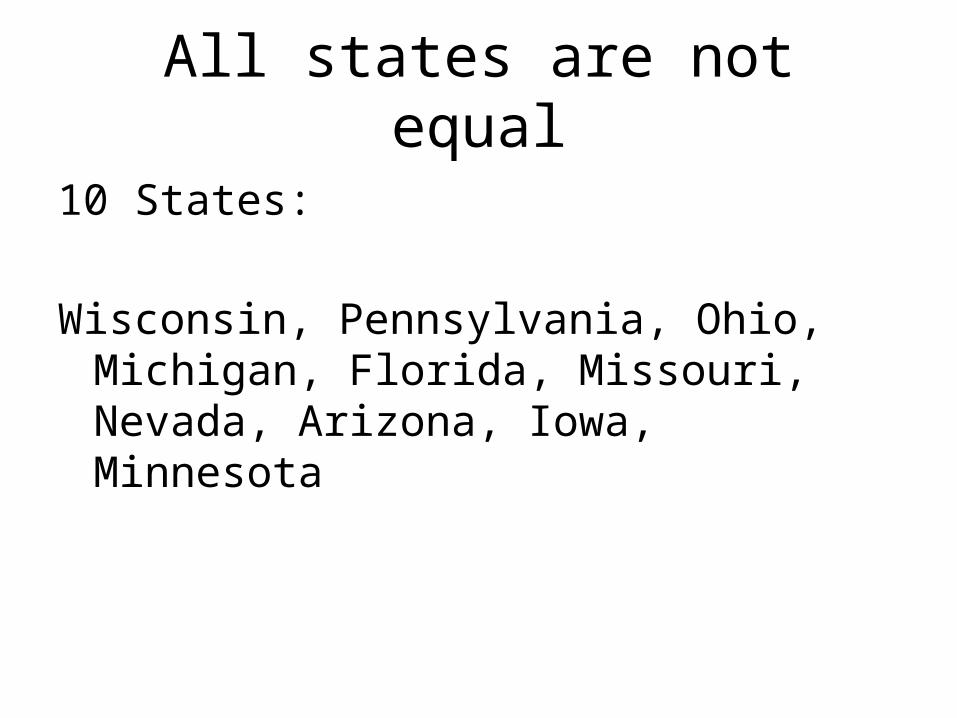
All states are not equal
10 States:
Wisconsin, Pennsylvania, Ohio, Michigan, Florida, Missouri, Nevada, Arizona, Iowa, Minnesota
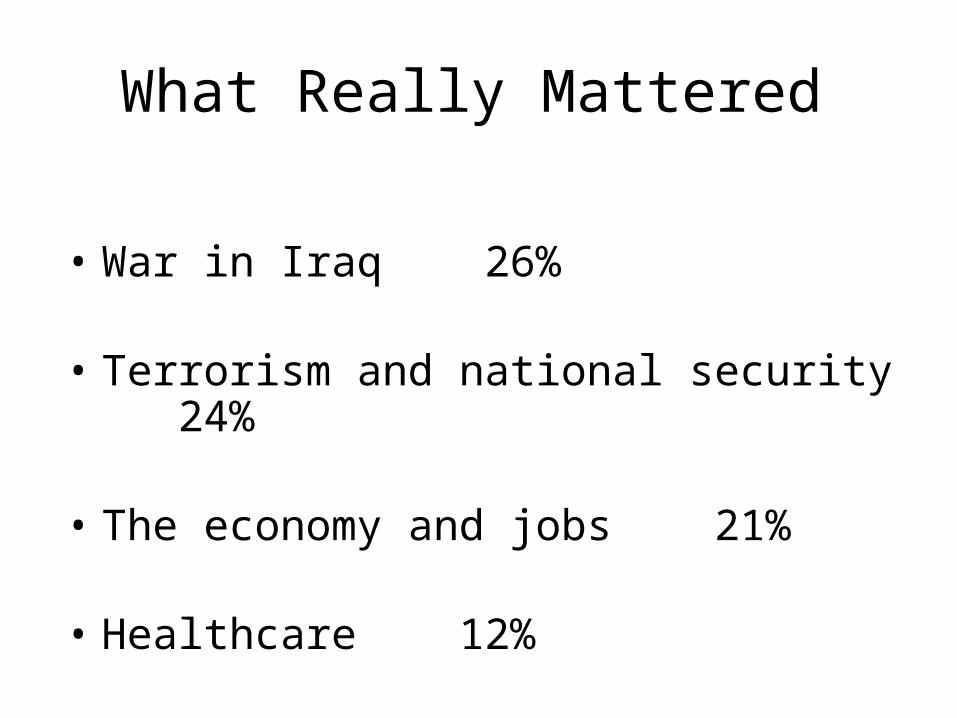
What Really Mattered
• War in Iraq 26%
• Terrorism and national security 24%
• The economy and jobs 21%
• Healthcare 12%
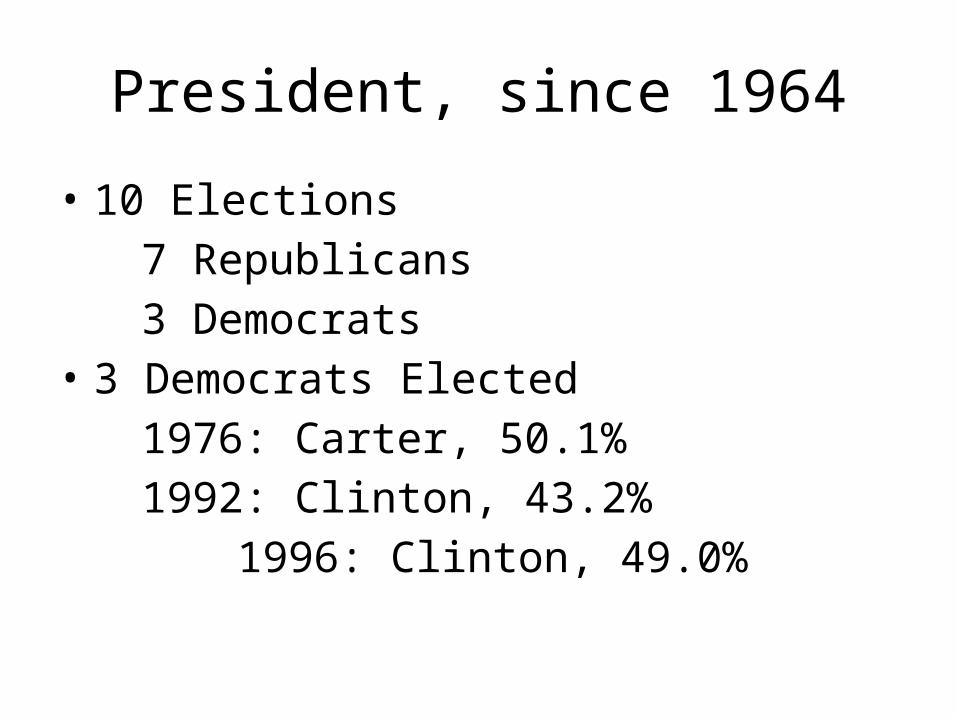
President, since 1964
• 10 Elections7 Republicans3 Democrats
• 3 Democrats Elected1976: Carter, 50.1%1992: Clinton, 43.2%
1996: Clinton, 49.0%
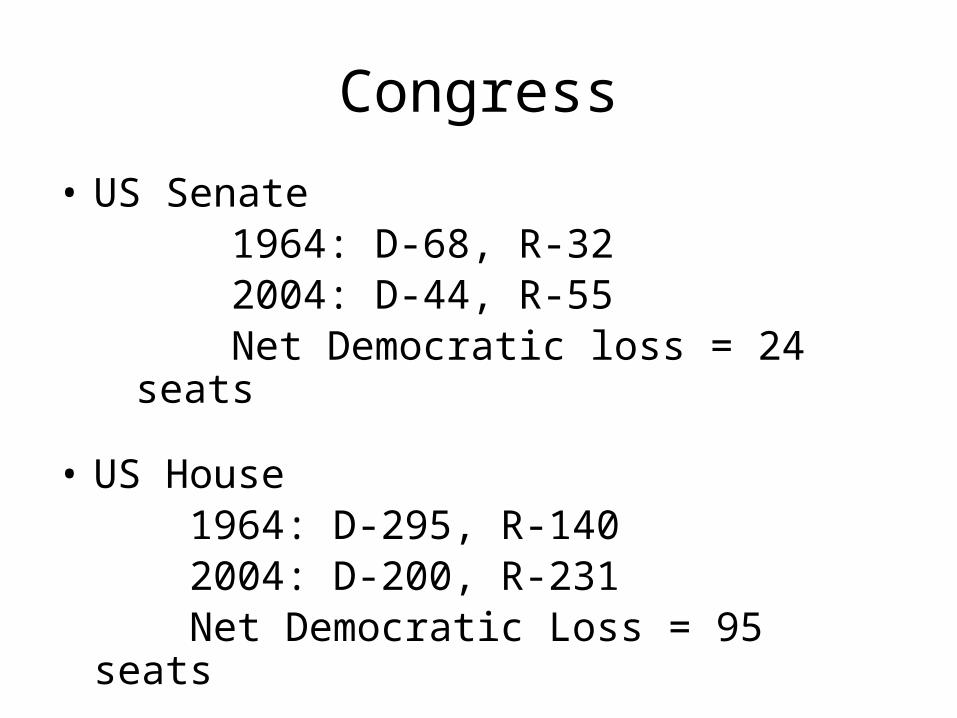
Congress
• US Senate1964: D-68, R-322004: D-44, R-55Net Democratic loss = 24 seats
• US House1964: D-295, R-1402004: D-200, R-231Net Democratic Loss = 95 seats
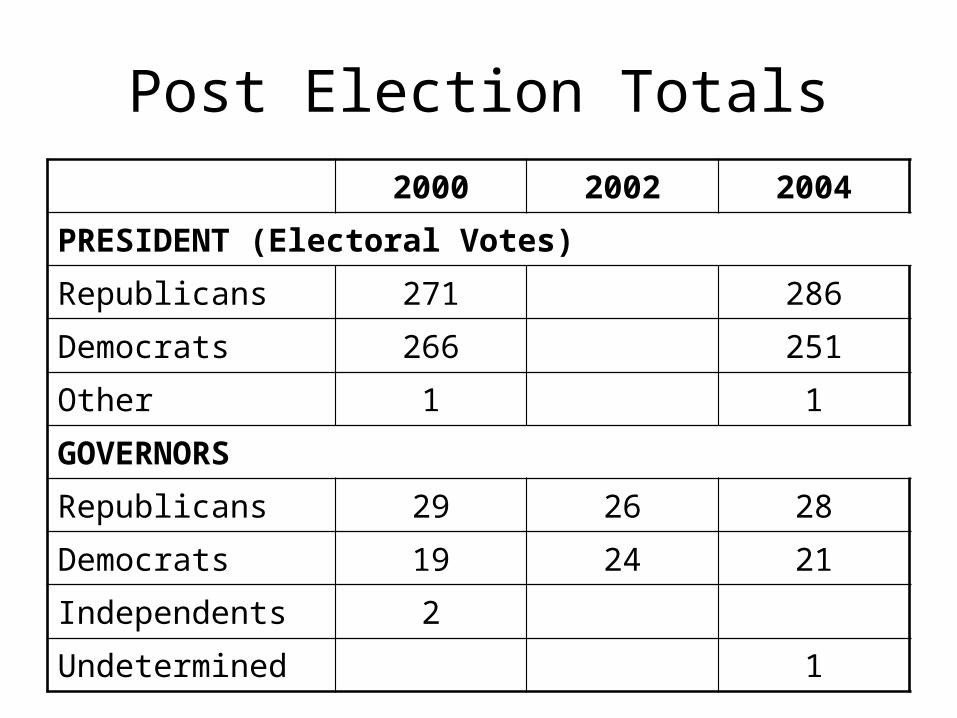
Post Election Totals2000 2002 2004
PRESIDENT (Electoral Votes)
Republicans 271 286
Democrats 266 251
Other 1 1
GOVERNORS
Republicans 29 26 28
Democrats 19 24 21
Independents 2
Undetermined 1
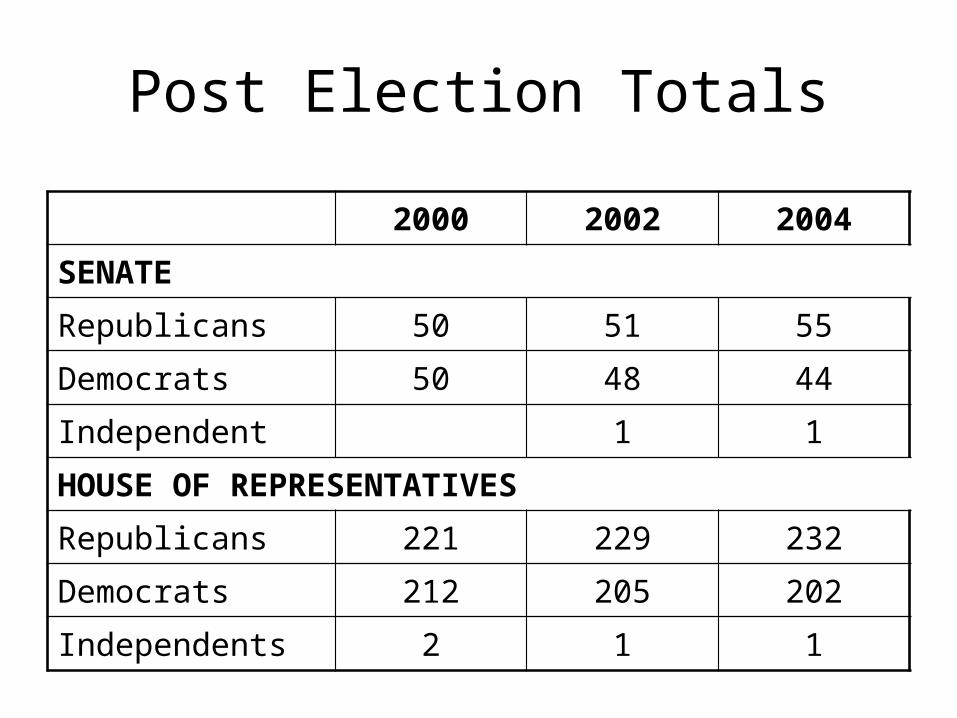
Post Election Totals
2000 2002 2004
SENATE
Republicans 50 51 55
Democrats 50 48 44
Independent 1 1
HOUSE OF REPRESENTATIVES
Republicans 221 229 232
Democrats 212 205 202
Independents 2 1 1
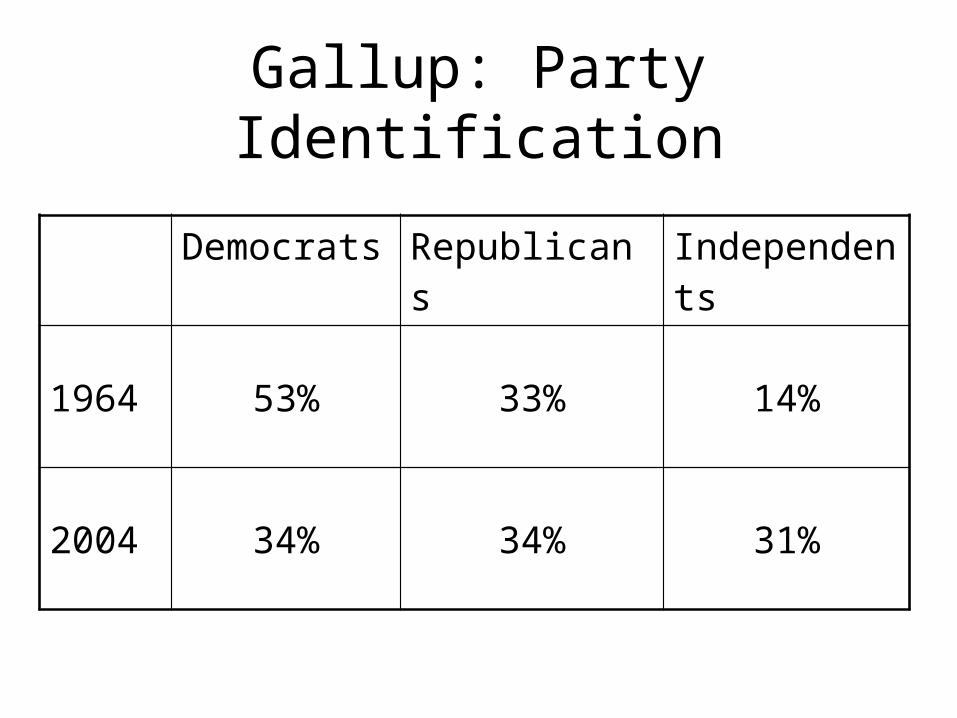
Gallup: Party Identification
Democrats Republicans Independents
1964 53% 33% 14%
2004 34% 34% 31%
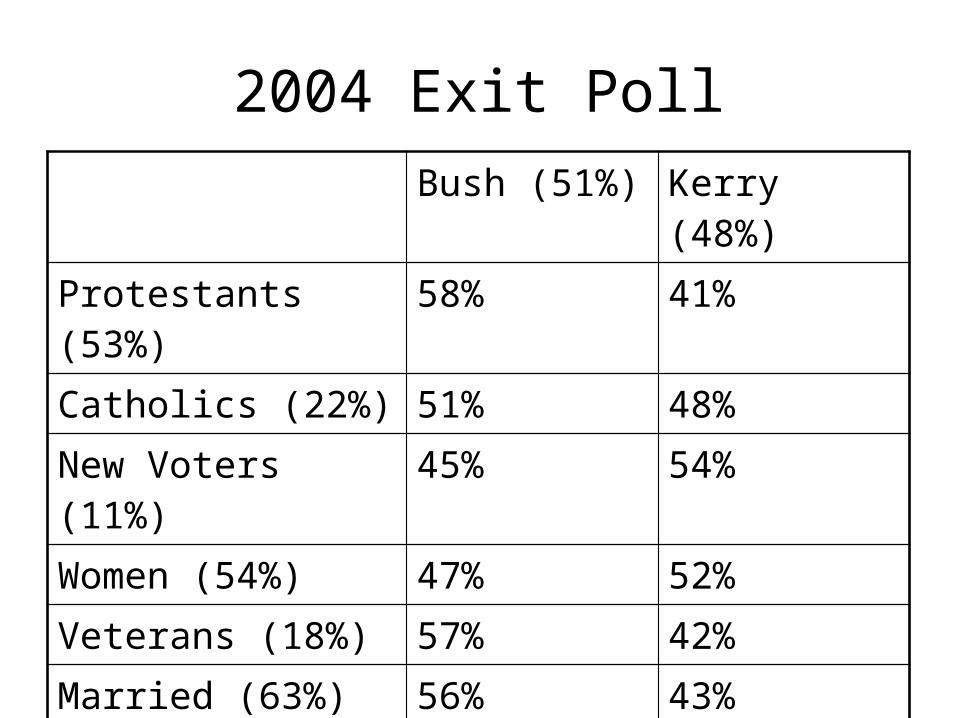
2004 Exit PollBush (51%) Kerry (48%)
Protestants (53%) 58% 41%Catholics (22%) 51% 48%New Voters (11%) 45% 54%Women (54%) 47% 52%Veterans (18%) 57% 42%Married (63%) 56% 43%Not married (37%) 40% 59%Gay (4%) 23% 77%Gun-owners (41%) 61% 37%
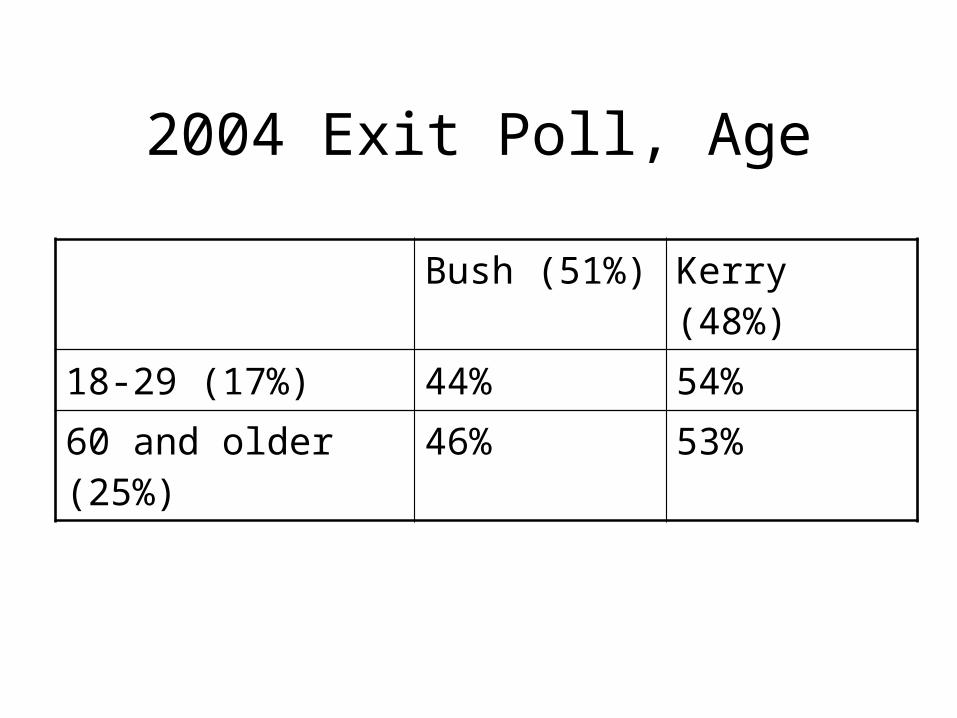
2004 Exit Poll, Age
Bush (51%) Kerry (48%)
18-29 (17%) 44% 54%
60 and older (25%) 46% 53%
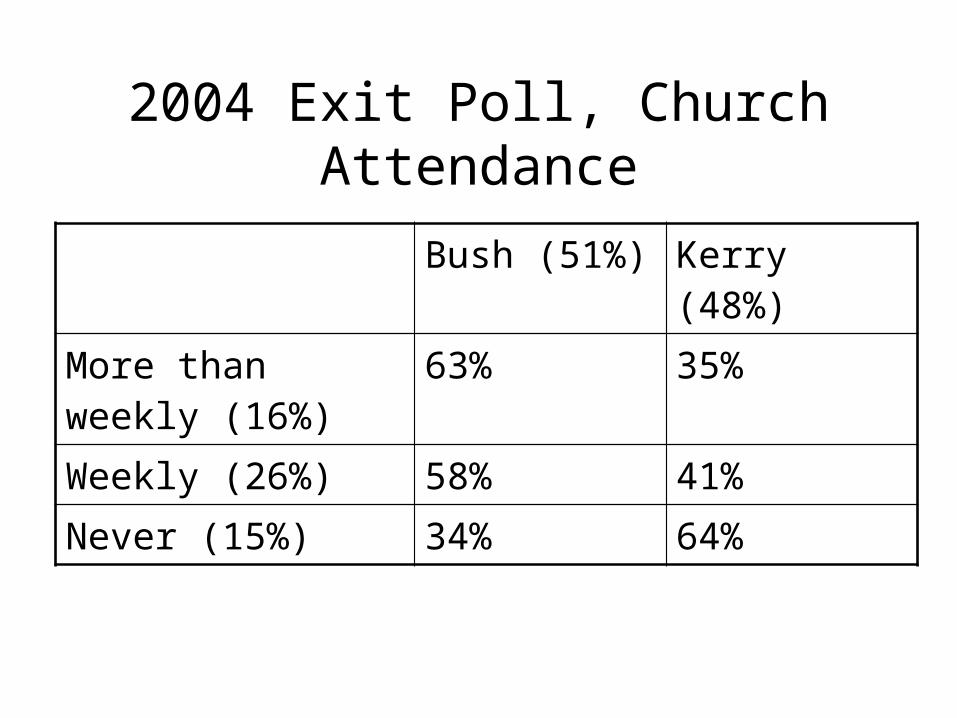
2004 Exit Poll, Church Attendance
Bush (51%) Kerry (48%)
More than weekly (16%)
63% 35%
Weekly (26%) 58% 41%
Never (15%) 34% 64%
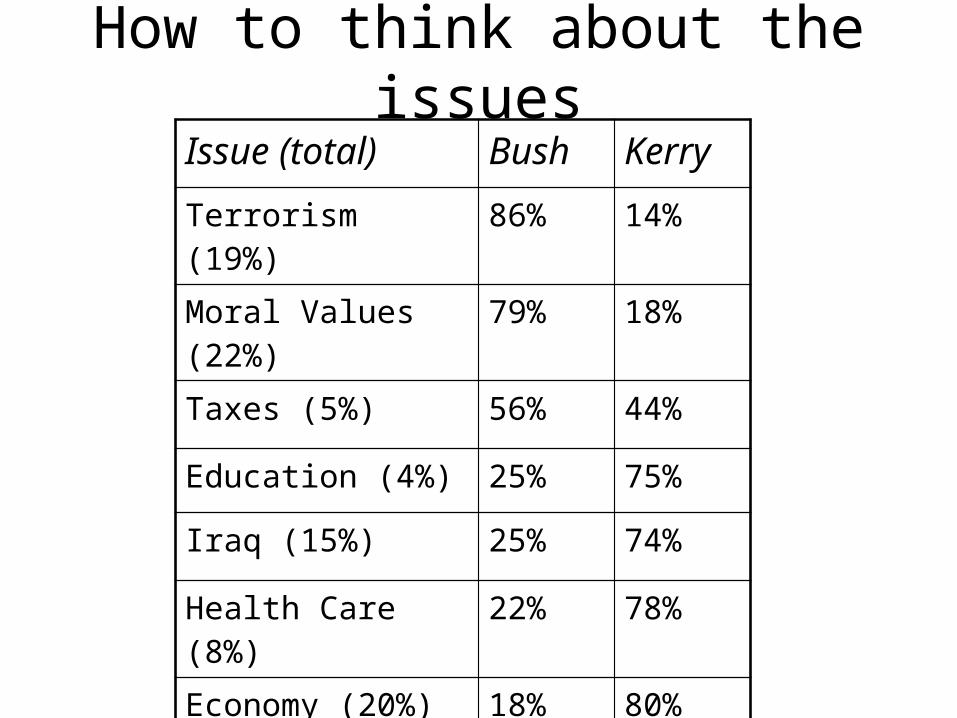
How to think about the issuesIssue (total) Bush Kerry
Terrorism (19%) 86% 14%
Moral Values (22%) 79% 18%
Taxes (5%) 56% 44%
Education (4%) 25% 75%
Iraq (15%) 25% 74%
Health Care (8%) 22% 78%
Economy (20%) 18% 80%
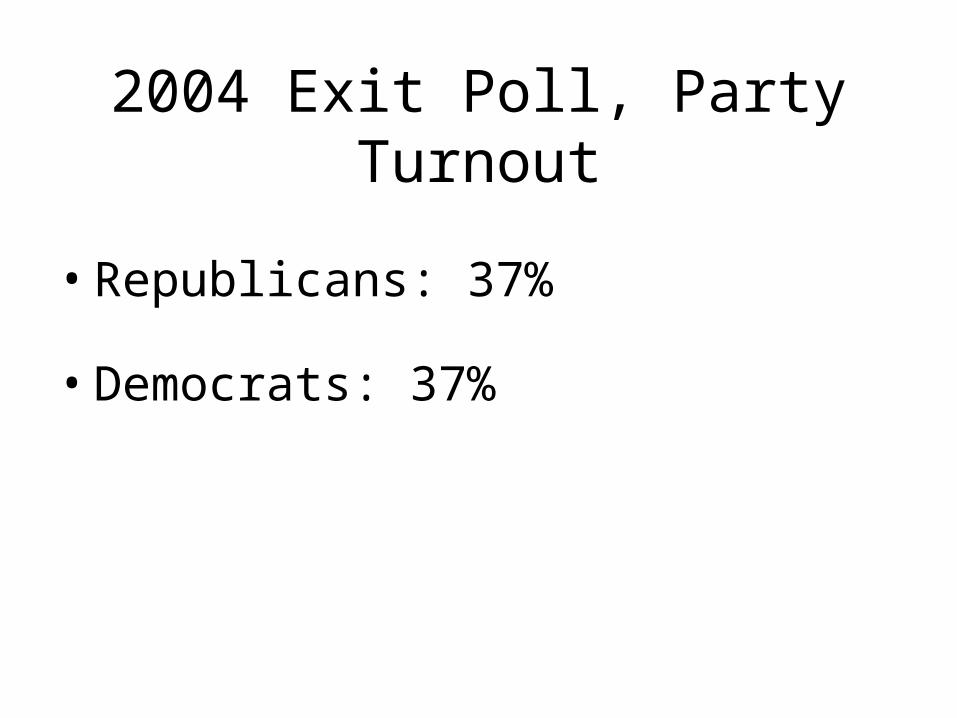
2004 Exit Poll, Party Turnout
• Republicans: 37%
• Democrats: 37%
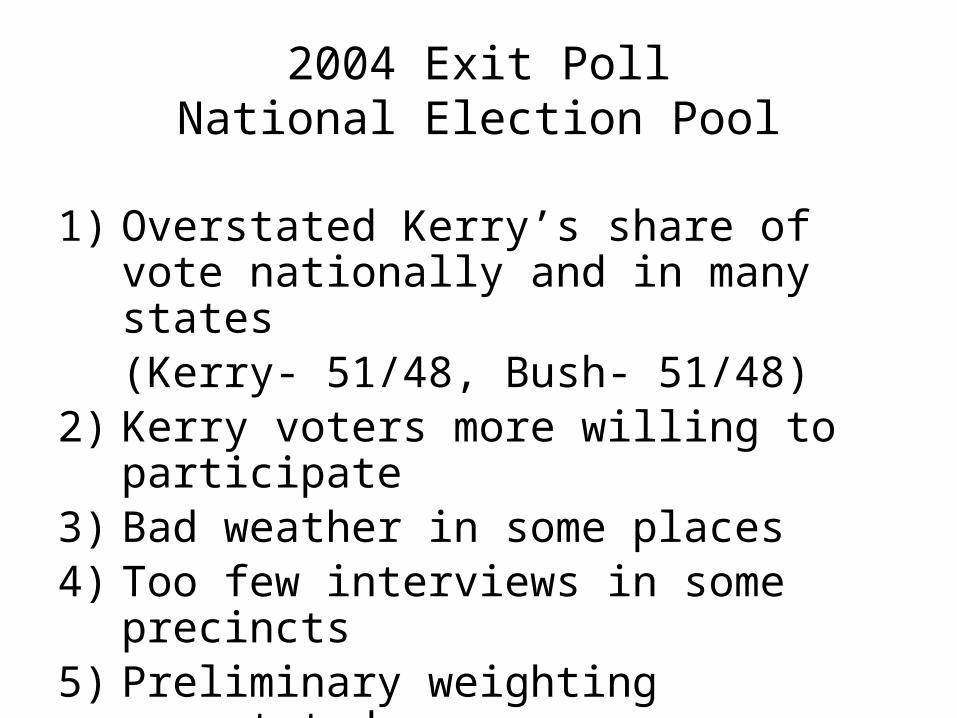
2004 Exit PollNational Election Pool
1) Overstated Kerry’s share of vote nationally and in many states (Kerry- 51/48, Bush- 51/48)
2) Kerry voters more willing to participate3) Bad weather in some places4) Too few interviews in some precincts5) Preliminary weighting overstated women6) At least one database server problem
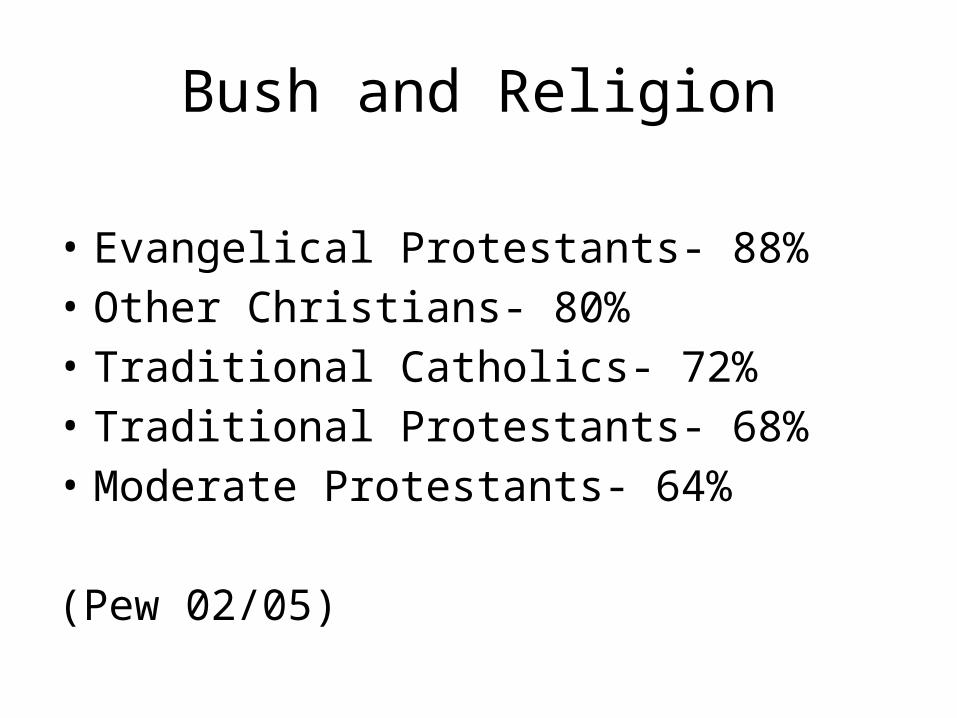
Bush and Religion
• Evangelical Protestants- 88%• Other Christians- 80%• Traditional Catholics- 72%• Traditional Protestants- 68%• Moderate Protestants- 64%
(Pew 02/05)
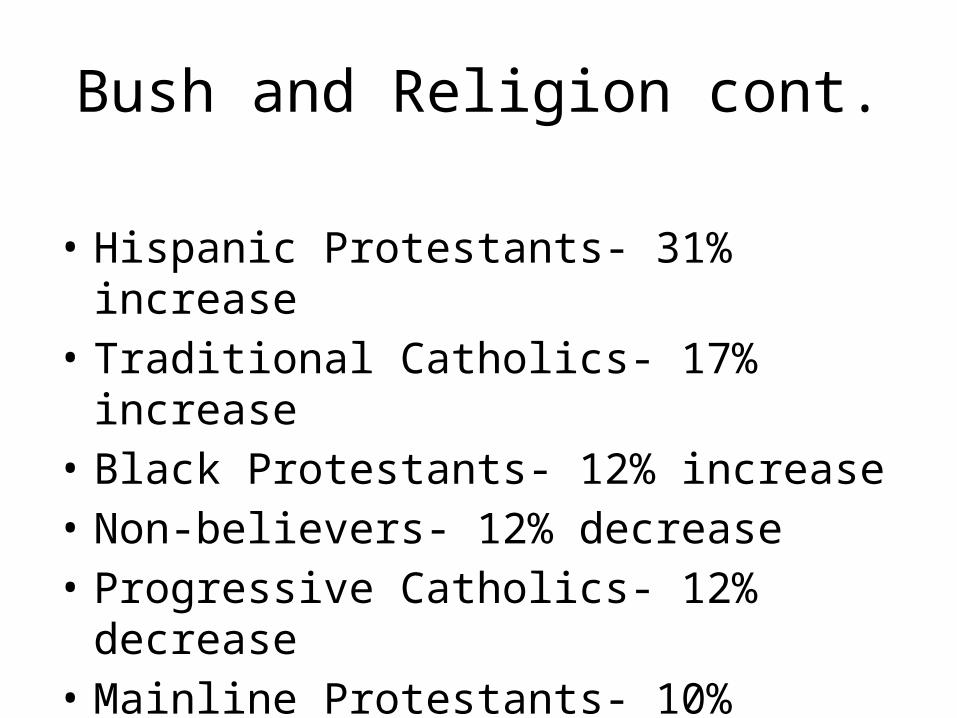
Bush and Religion cont.
• Hispanic Protestants- 31% increase• Traditional Catholics- 17% increase• Black Protestants- 12% increase• Non-believers- 12% decrease• Progressive Catholics- 12% decrease• Mainline Protestants- 10% decrease
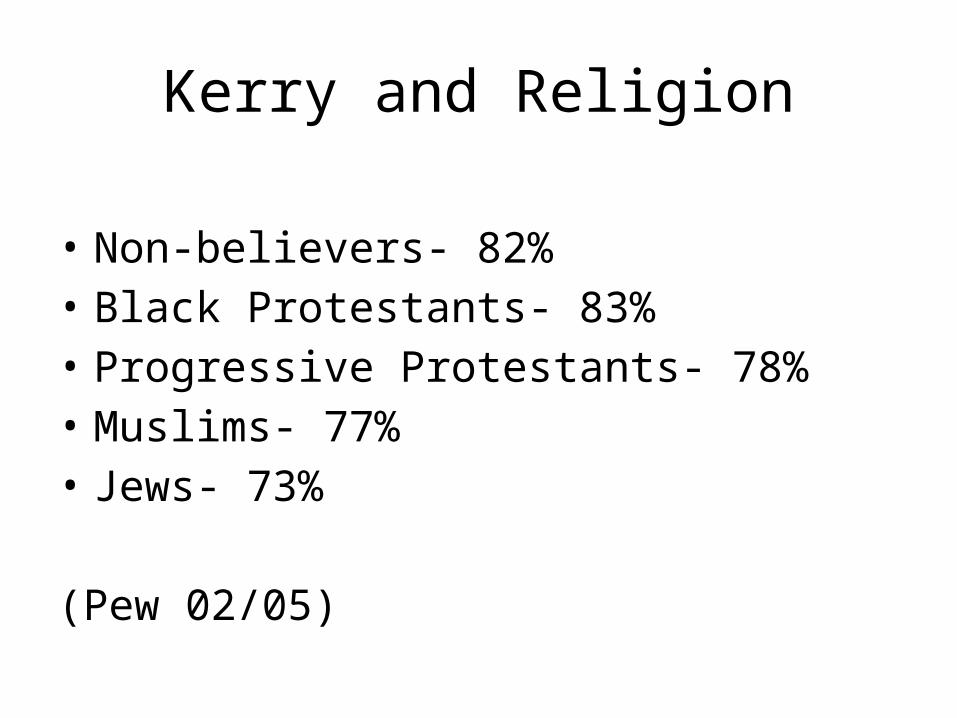
Kerry and Religion
• Non-believers- 82%• Black Protestants- 83%• Progressive Protestants- 78%• Muslims- 77%• Jews- 73%
(Pew 02/05)
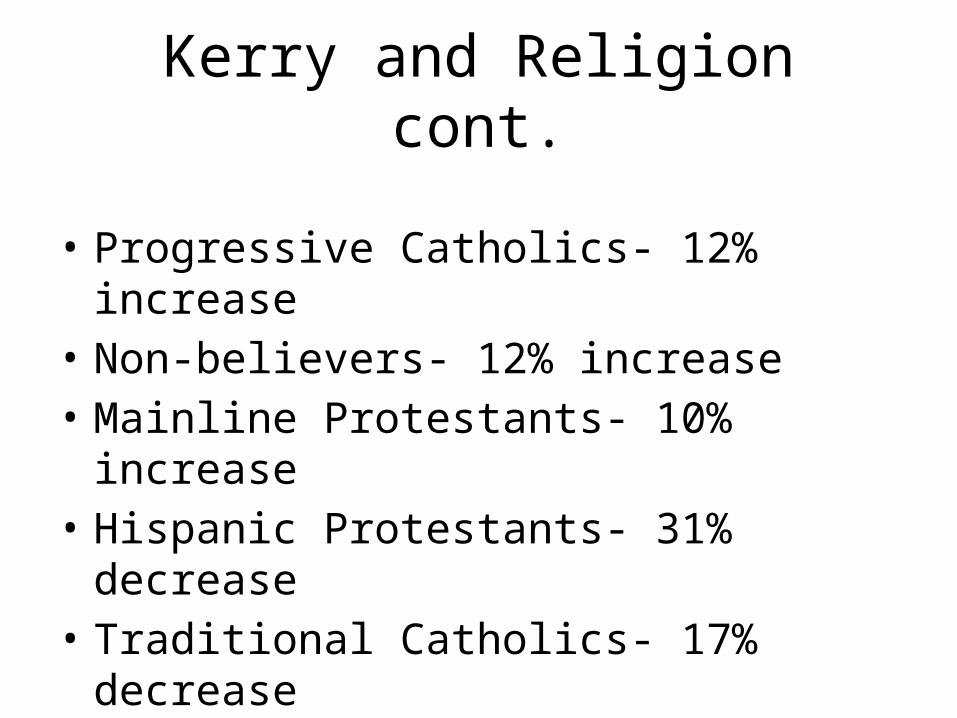
Kerry and Religion cont.
• Progressive Catholics- 12% increase• Non-believers- 12% increase• Mainline Protestants- 10% increase• Hispanic Protestants- 31% decrease• Traditional Catholics- 17% decrease• Black Protestants- 12% decrease• Other Christians- 11% decrease
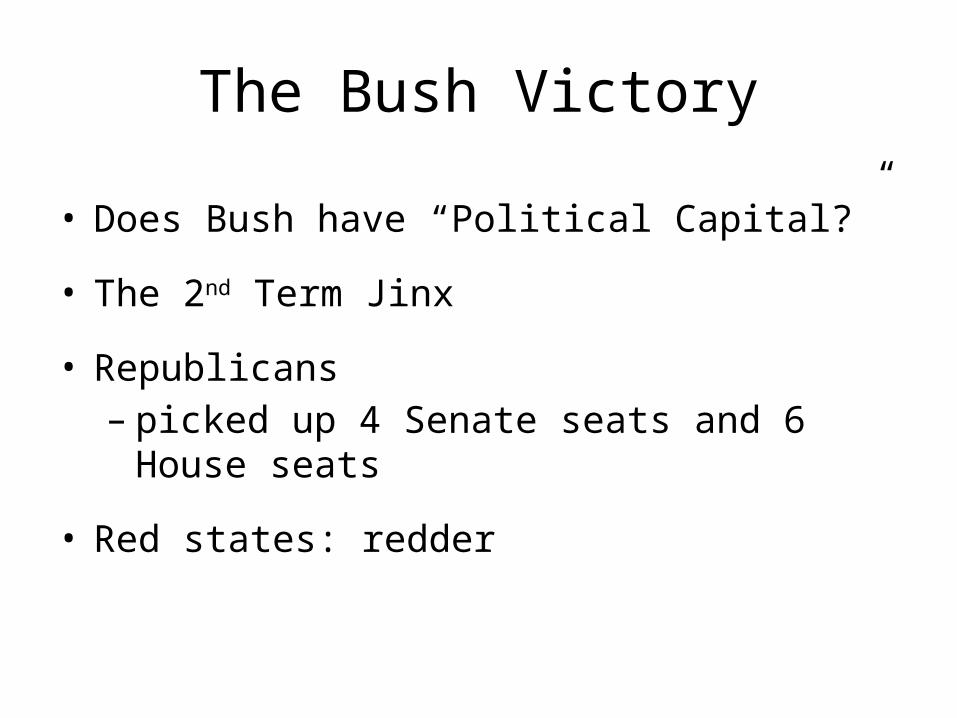
The Bush Victory
• Does Bush have “Political Capital?”
• The 2nd Term Jinx
• Republicans– picked up 4 Senate seats and 6 House seats
• Red states: redder
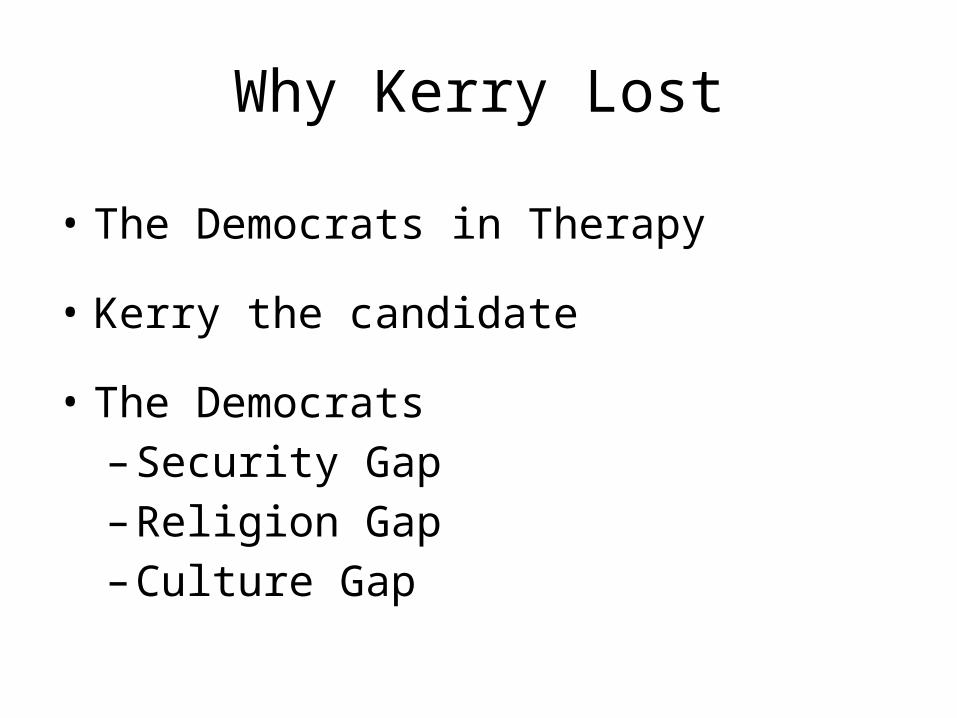
Why Kerry Lost
• The Democrats in Therapy
• Kerry the candidate
• The Democrats– Security Gap– Religion Gap– Culture Gap
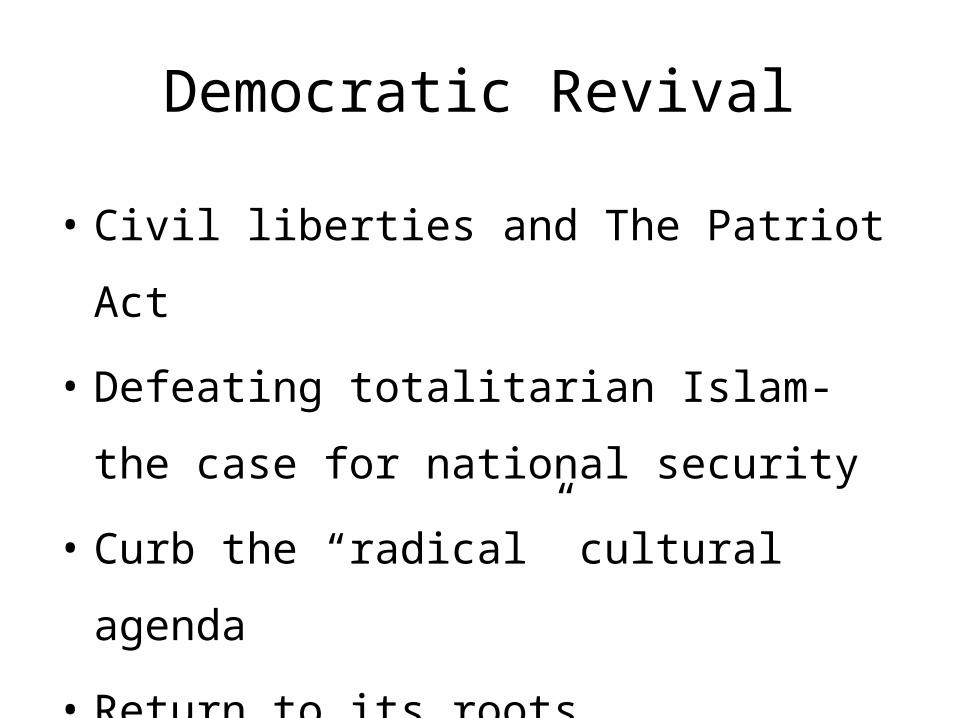
Democratic Revival
• Civil liberties and The Patriot Act
• Defeating totalitarian Islam- the case for
national security
• Curb the “radical” cultural agenda
• Return to its roots
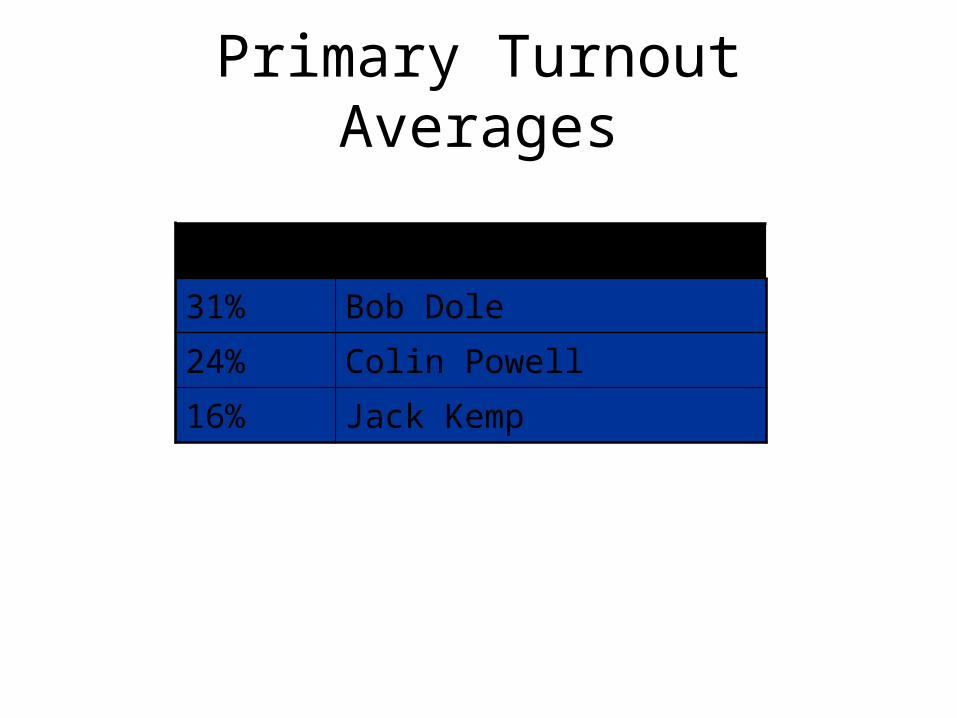
Primary Turnout Averages
1996 GOP Primary Averages
31% Bob Dole
24% Colin Powell
16% Jack Kemp
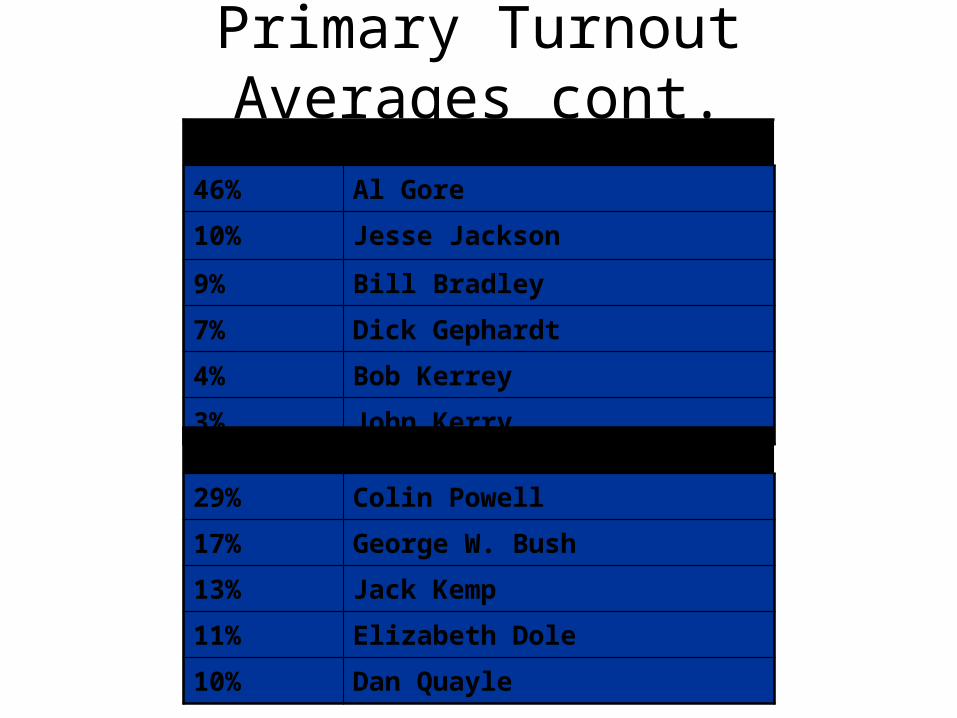
Primary Turnout Averages cont.2000 Democratic Primary Averages
46% Al Gore
10% Jesse Jackson
9% Bill Bradley
7% Dick Gephardt
4% Bob Kerrey
3% John Kerry
2000 GOP Primary Averages
29% Colin Powell
17% George W. Bush
13% Jack Kemp
11% Elizabeth Dole
10% Dan Quayle
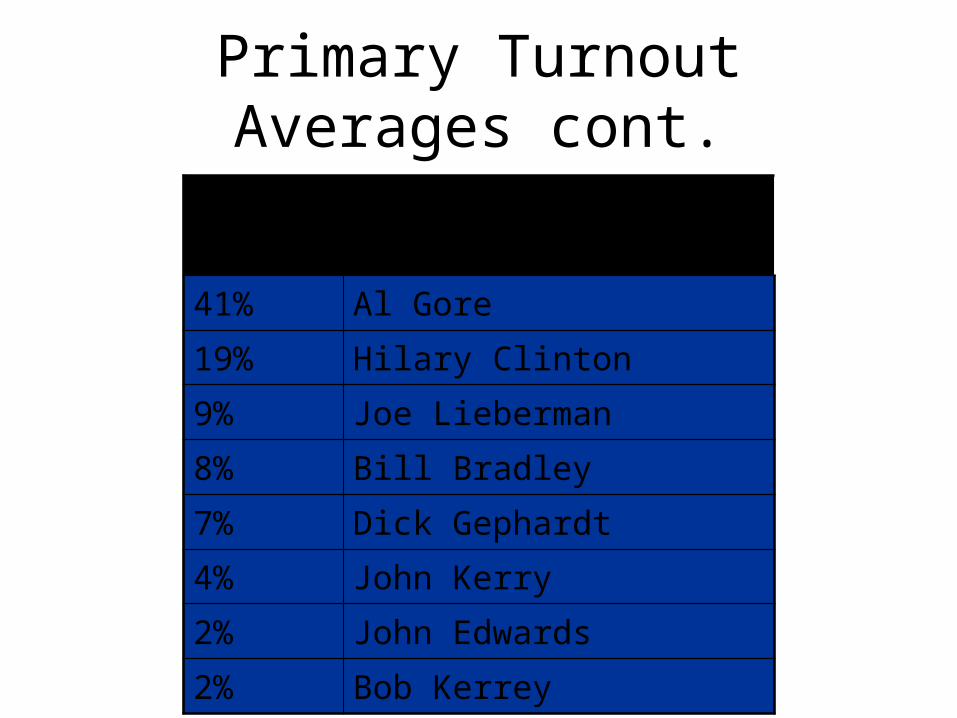
Primary Turnout Averages cont.
2004 Democratic Primary Averages
41% Al Gore
19% Hilary Clinton
9% Joe Lieberman
8% Bill Bradley
7% Dick Gephardt
4% John Kerry
2% John Edwards
2% Bob Kerrey
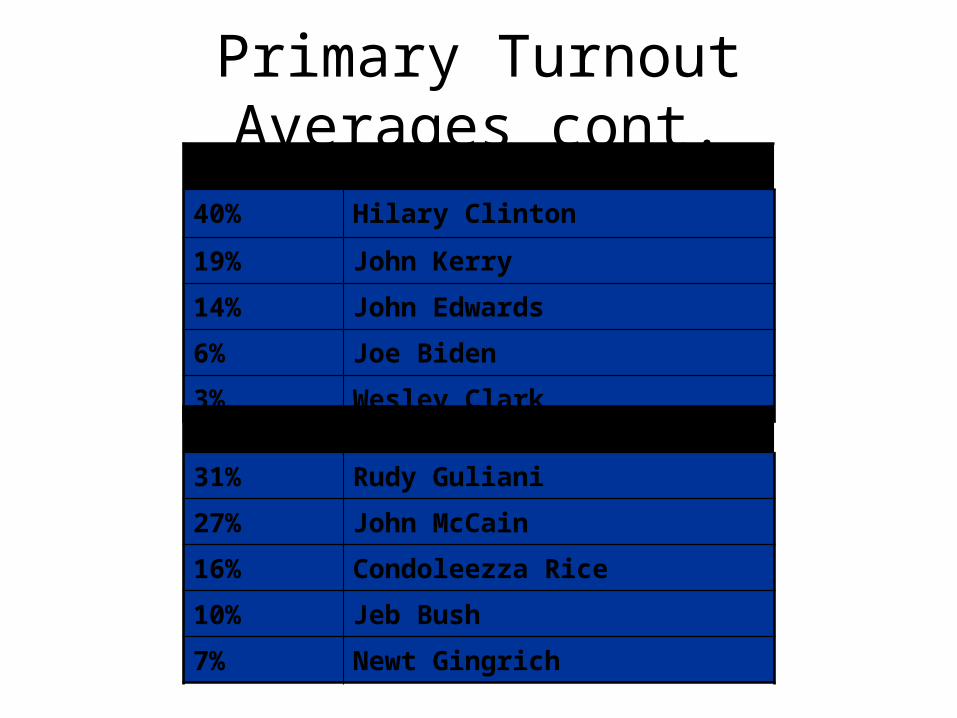
Primary Turnout Averages cont.2008 Democratic Primary Averages
40% Hilary Clinton
19% John Kerry
14% John Edwards
6% Joe Biden
3% Wesley Clark
2008 GOP Primary Averages
31% Rudy Guliani
27% John McCain
16% Condoleezza Rice
10% Jeb Bush
7% Newt Gingrich
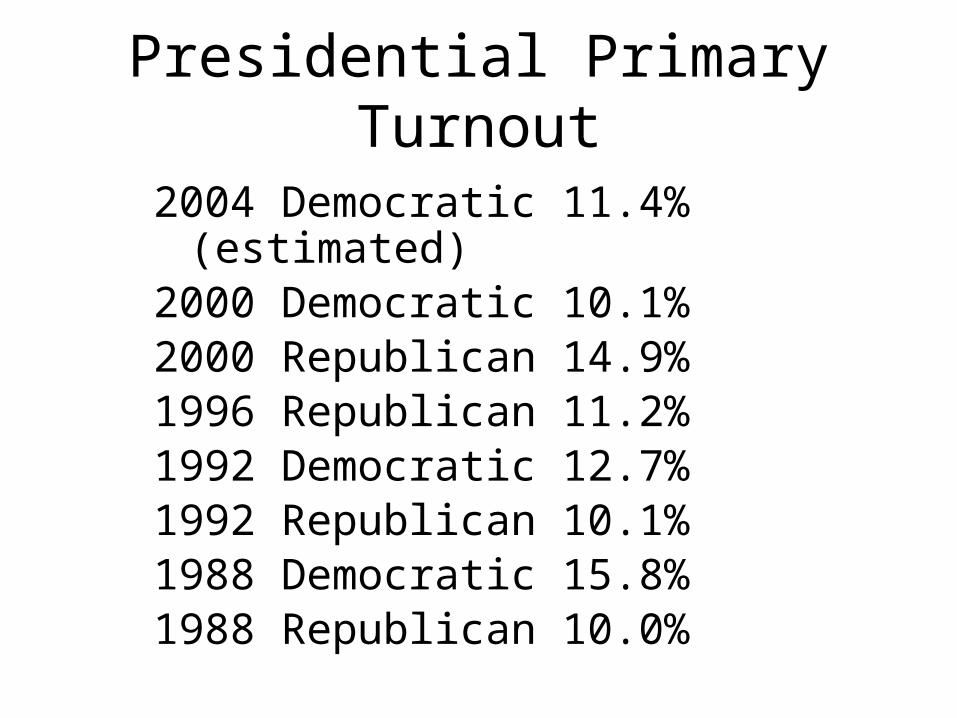
Presidential Primary Turnout
2004 Democratic 11.4% (estimated) 2000 Democratic 10.1% 2000 Republican 14.9% 1996 Republican 11.2% 1992 Democratic 12.7% 1992 Republican 10.1% 1988 Democratic 15.8% 1988 Republican 10.0%
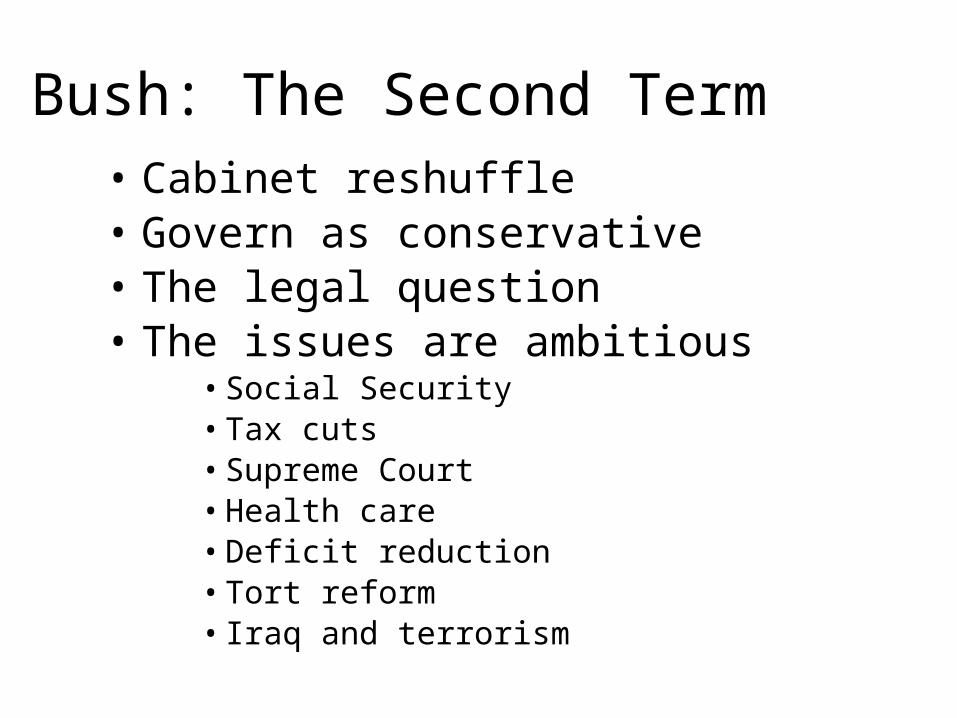
Bush: The Second Term• Cabinet reshuffle• Govern as conservative• The legal question• The issues are ambitious
• Social Security• Tax cuts• Supreme Court• Health care• Deficit reduction• Tort reform• Iraq and terrorism
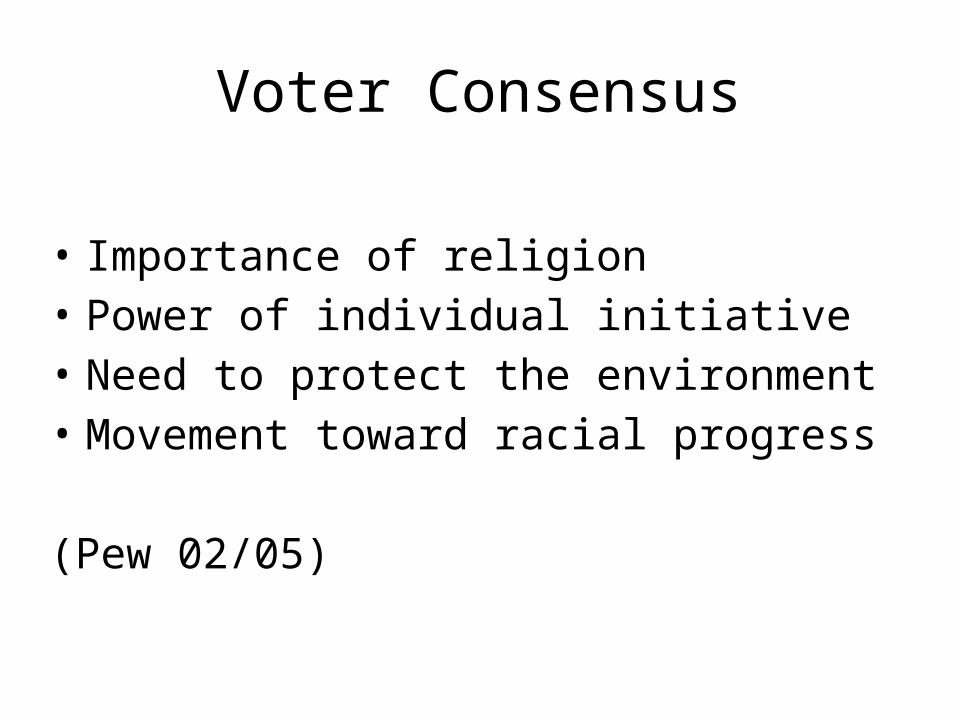
Voter Consensus
• Importance of religion• Power of individual initiative• Need to protect the environment• Movement toward racial progress
(Pew 02/05)
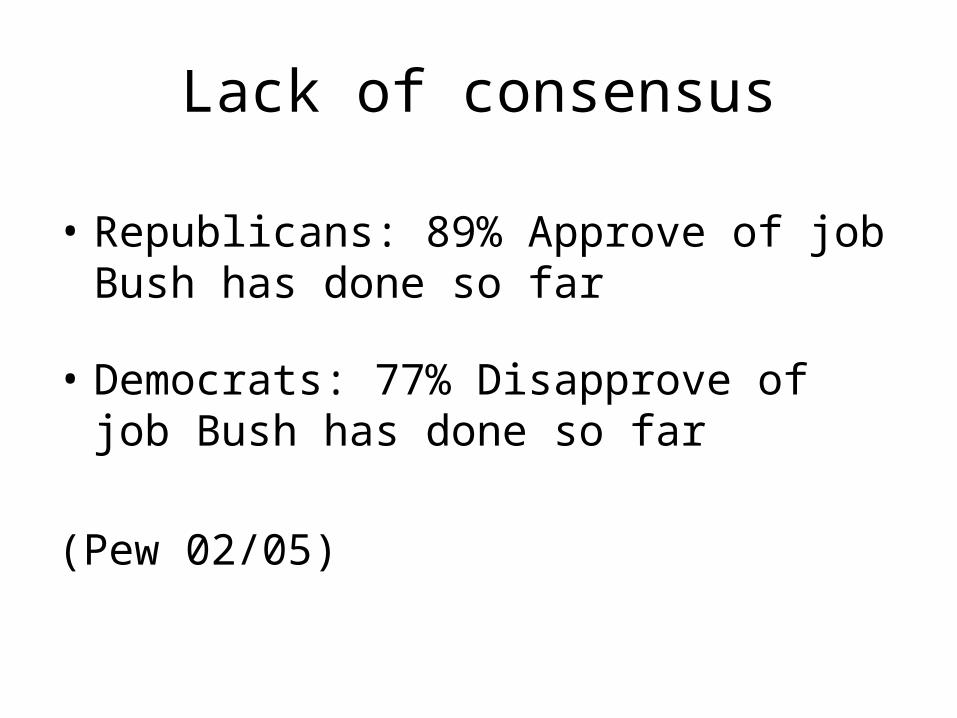
Lack of consensus
• Republicans: 89% Approve of job Bush has done so far
• Democrats: 77% Disapprove of job Bush has done so far
(Pew 02/05)
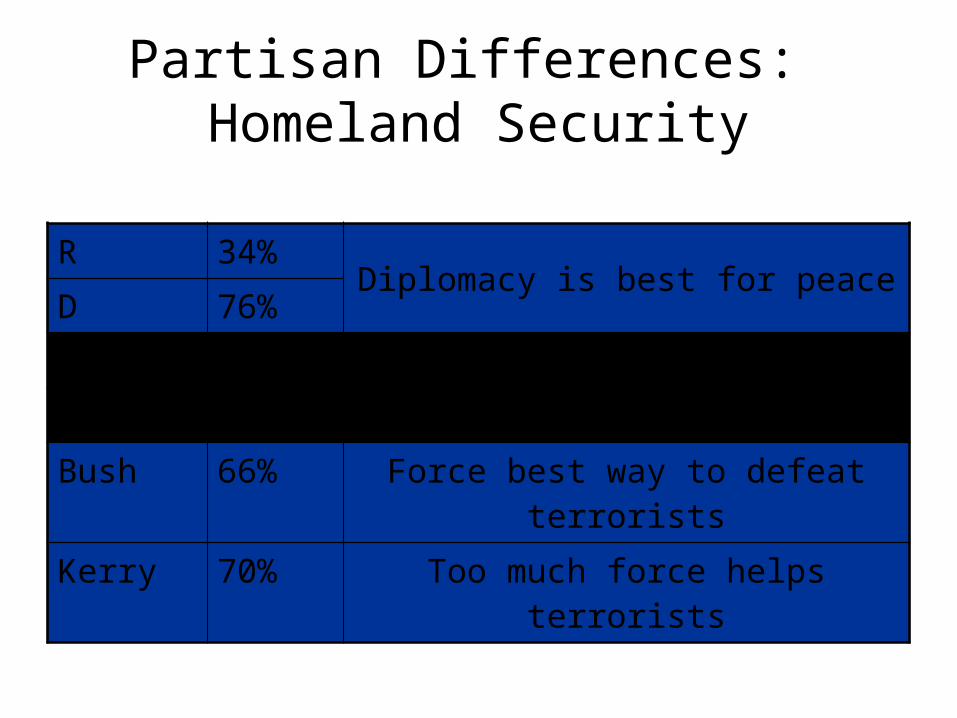
Partisan Differences: Homeland Security
R 34%Diplomacy is best for peace
D 76%
R 66%Fight, right or wrong
D 27%
Bush 66% Force best way to defeat terrorists
Kerry 70% Too much force helps terrorists
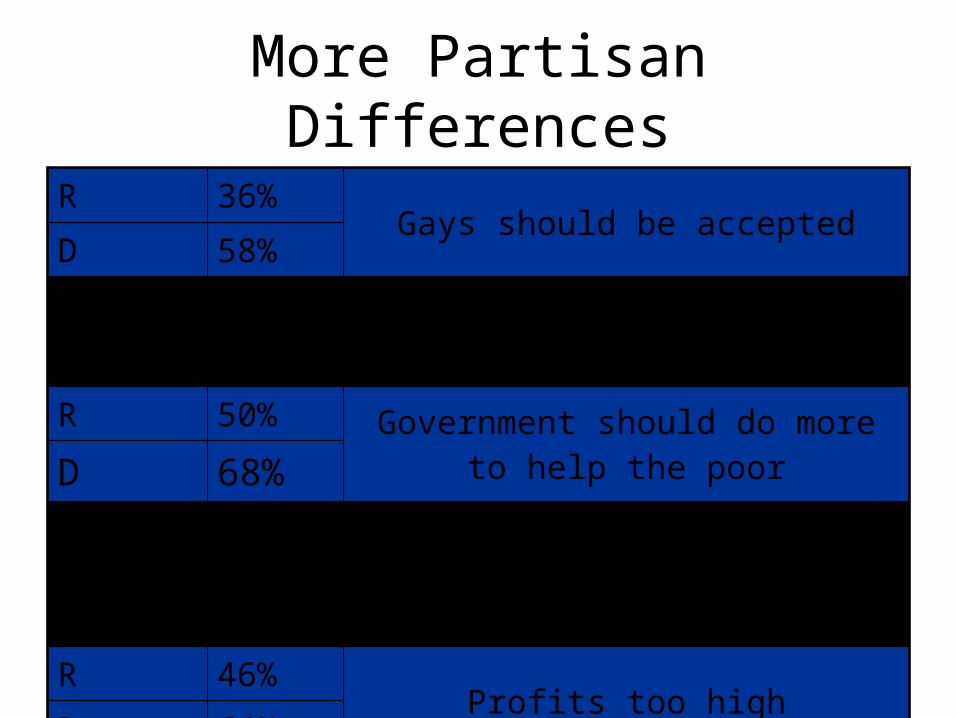
More Partisan Differences
R 36%Gays should be accepted
D 58%
R 50%The poor have easy lives
D 24%
R 50% Government should do more to help the poorD 68%
R 35% Health coverage for the uninsured should be a high priorityD 81%
R 46%Profits too high
D 64%
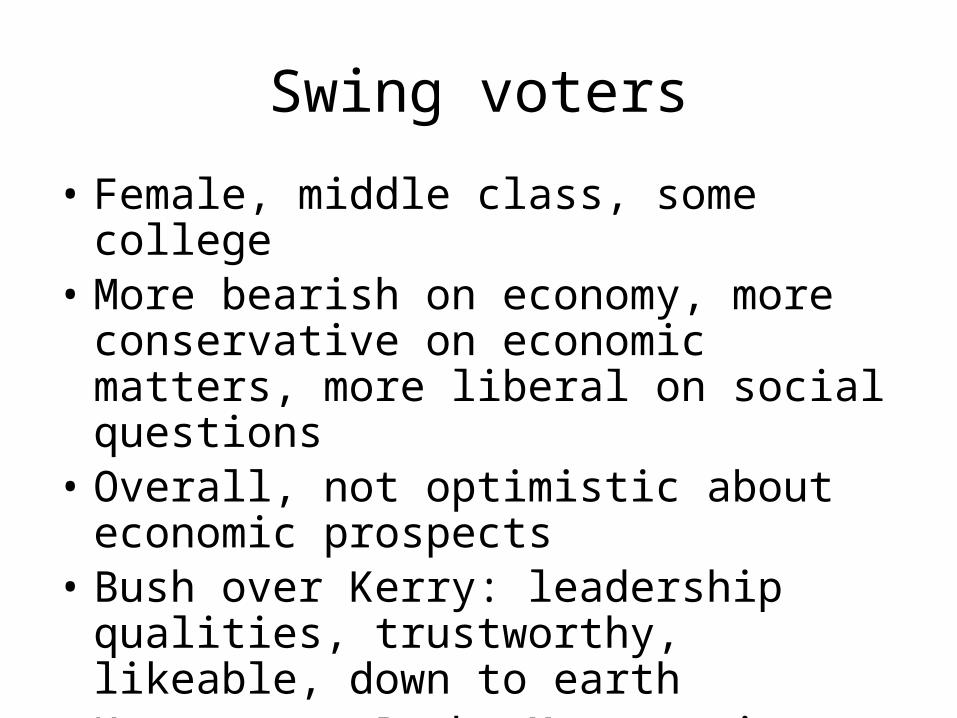
Swing voters
• Female, middle class, some college• More bearish on economy, more conservative
on economic matters, more liberal on social questions
• Overall, not optimistic about economic prospects
• Bush over Kerry: leadership qualities, trustworthy, likeable, down to earth
• Kerry over Bush: More caring
What is public policy?
• Simple definition: whatever government chooses to do or not to do
• Not simply acts of Congress: Congress passes an average of 300-400 laws each year
• Most governmental output comes from bureaucrats
Key Features of Public Policy
– Purposive or goal-oriented– Consists of courses or patterns of action taken over
time by governmental decision– Emerge in response to policy demands (claims for
action made by other actors, including citizens, interest groups, public officials) upon government officials and agencies
– May be positive or negative– Based on law and authoritative– Political/communal
What affects the construction of public policy?
• Interest groups• Elites• Federalism• Separation of powers• Institutions of government• American ideology• Public opinion
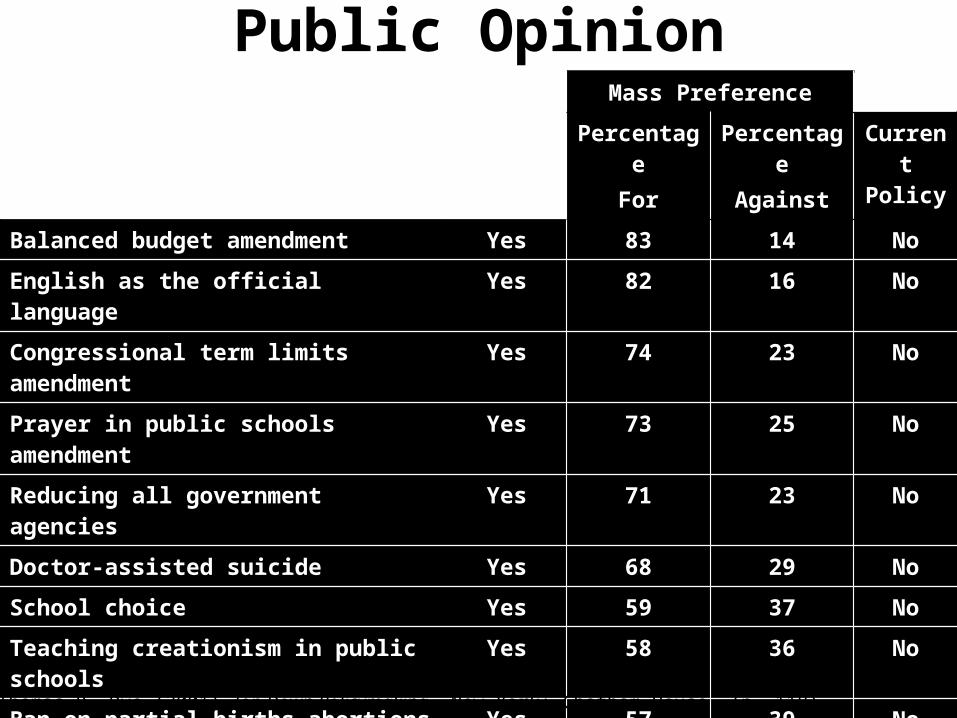
Public OpinionMass Preference
PercentageFor
PercentageAgainst
Current Policy
Balanced budget amendment Yes 83 14 No
English as the official language Yes 82 16 No
Congressional term limits amendment Yes 74 23 No
Prayer in public schools amendment Yes 73 25 No
Reducing all government agencies Yes 71 23 No
Doctor-assisted suicide Yes 68 29 No
School choice Yes 59 37 No
Teaching creationism in public schools Yes 58 36 No
Ban on partial-births abortions Yes 57 39 No
Five-year freeze on legal immigration Yes 50 46 No
Federal flat tax system Yes 49 39 No
School busing for racial balance No 34 62 Yes
Racial preferences in jobs and school
No 14 83 Yes
Source: Thomas R. Dye (2001) Top Down Policymaking. New York: Chatham House. (p. 118)
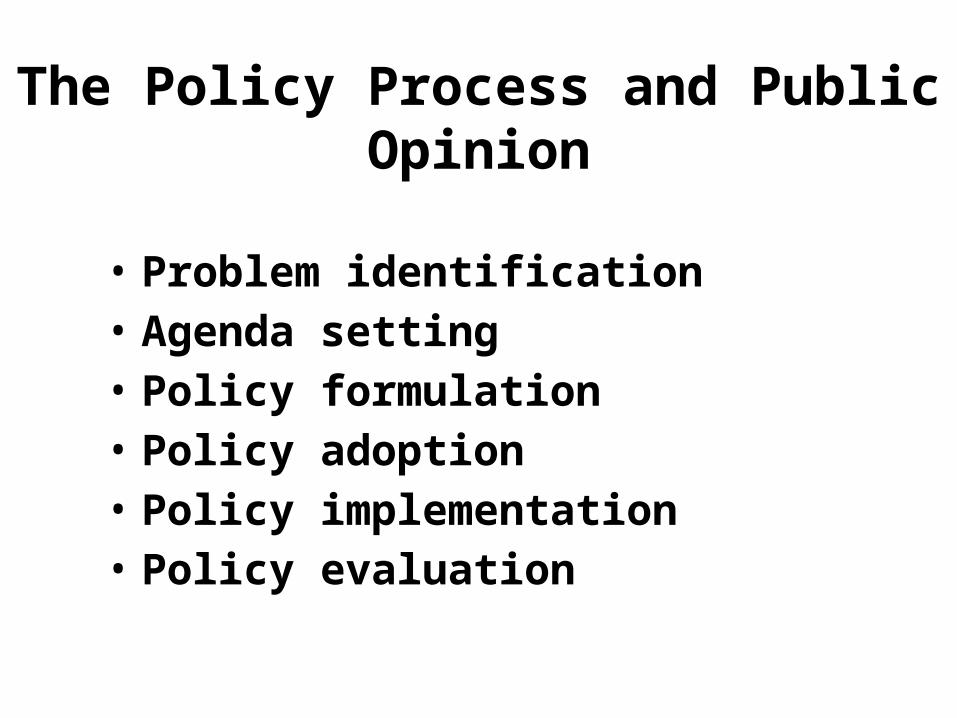
The Policy Process and Public Opinion
• Problem identification• Agenda setting• Policy formulation• Policy adoption• Policy implementation• Policy evaluation
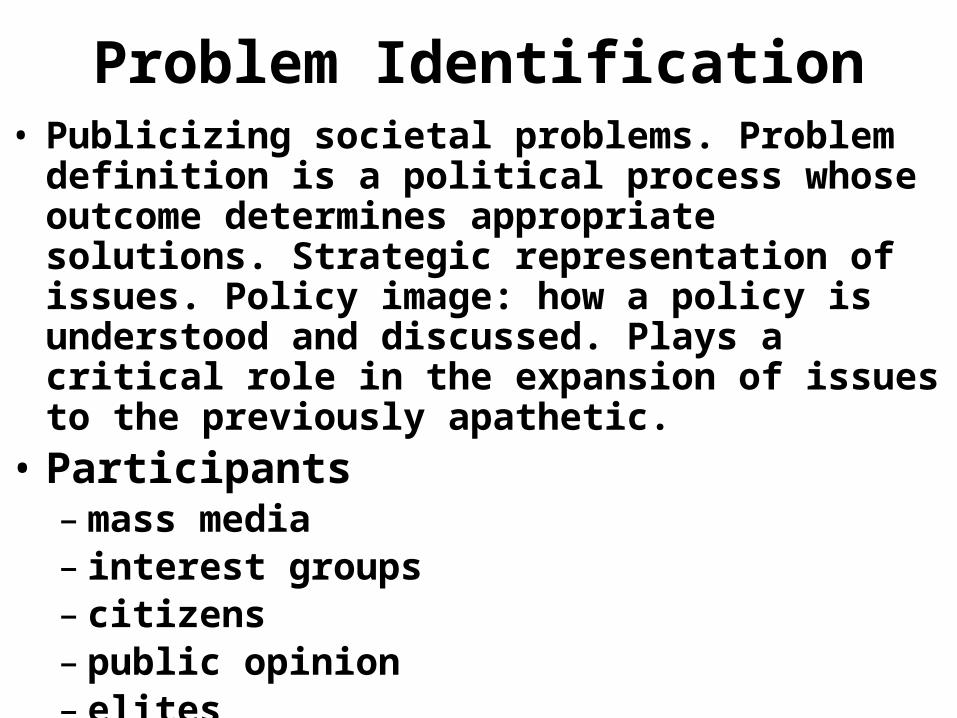
Problem Identification• Publicizing societal problems. Problem definition is a
political process whose outcome determines appropriate solutions. Strategic representation of issues. Policy image: how a policy is understood and discussed. Plays a critical role in the expansion of issues to the previously apathetic.
• Participants– mass media– interest groups– citizens– public opinion– elites
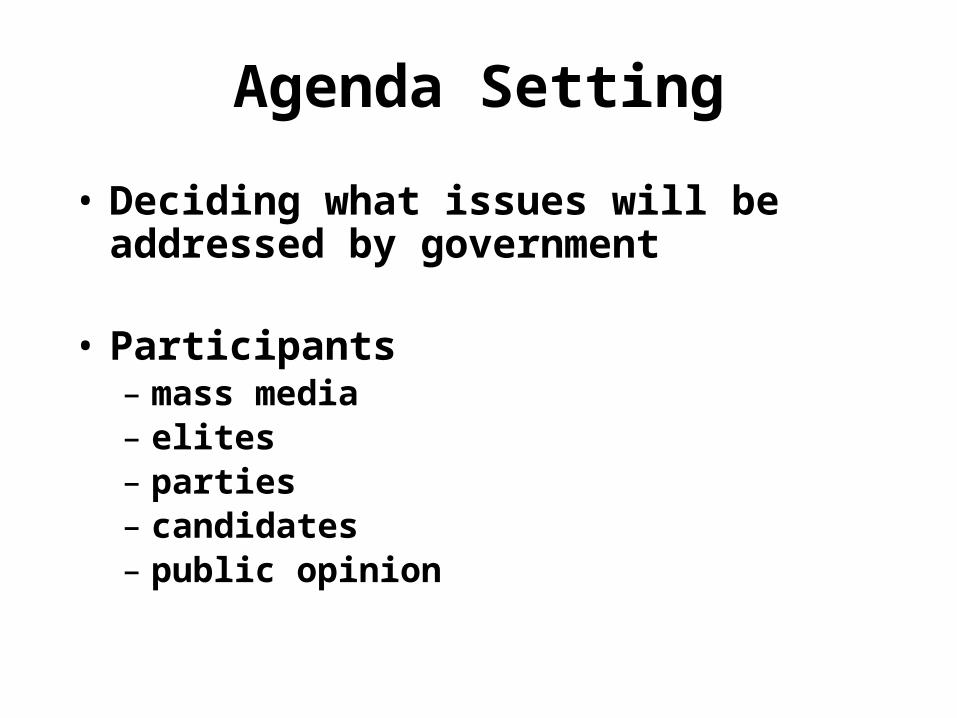
Agenda Setting
• Deciding what issues will be addressed by government
• Participants– mass media– elites– parties– candidates– public opinion
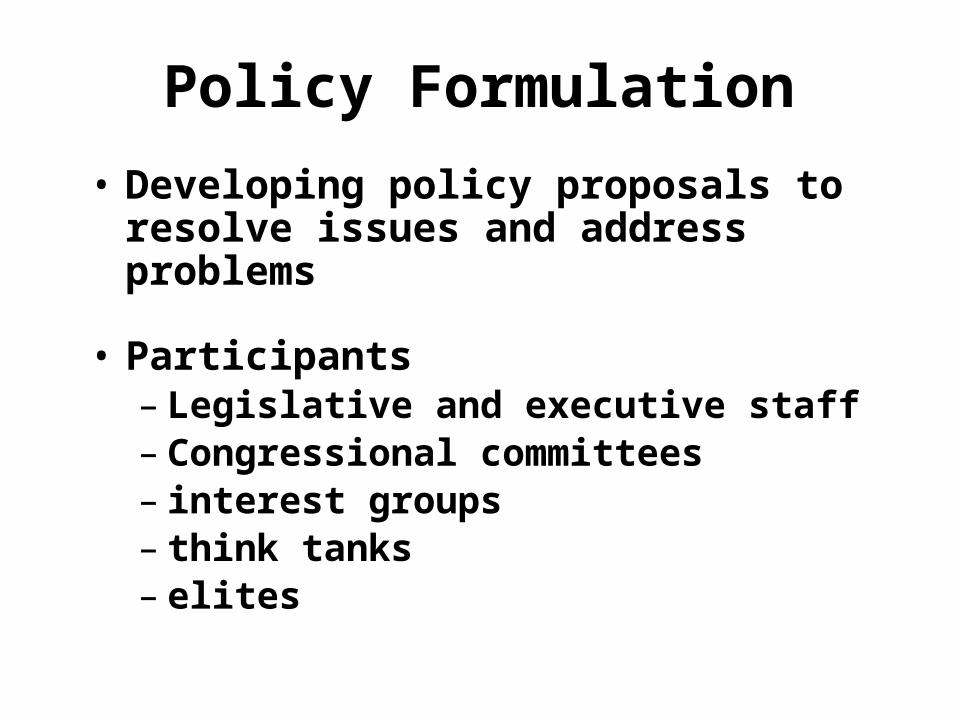
Policy Formulation
• Developing policy proposals to resolve issues and address problems
• Participants– Legislative and executive staff– Congressional committees– interest groups– think tanks– elites
Policy Adoption
• Selecting a policy from the many possible policies available
• Participants– President– Congress– Courts
Policy Implementation
• Process by which a law or policy is put into operation by the bureaucracy
• Participants– Bureaucracies– Congress– Courts
Policy Evaluation
• Learning about the consequences of public policy
• Participants– Bureaucracies– Congress– mass media– think tanks– public opinion
The Big Question: Do Public Officials Lead Public
Opinion or Follow Public Opinion?
• There are both elected and non-elected public officials. The impact and importance of public opinion may differ for both.
• There is no definitive answer to the question.
Elected Officials
• Adherence to a set of American ideals establishes the broad framework for the trajectory of American policy. These ideals are used as reference points by political elites.
• Political officials have significant freedom to operate. This freedom increases or decreases depending on the visibility and technical complexity of an issue.
Elected Officials cont.
• Elected officials understand that all decisions have the potential to become issues during the electoral process.
• Political officials have significant opportunities to lead and manipulate opinion on any given issue.
• Evidence suggests that polls are used to shape ends and suggest issues rather than establish policy.
Bureaucrats
• Bureaucrats have significant control over information, which they can use to drive policy making.
• Bureaucrats’ technical expertise, too, gives them a decided advantage in policy development.
• Bureaucrats are interested in their organization’s survival, so they will react accordingly.
Bureaucrats cont.
• Bureaucrats have different motivations for enacting policy beyond organizational survival.
• Bureaucrats are asked to arbitrate between competing interests because of legislative delegation. Process is most important in this process—there is no public good to which they aspire.
• Bureaucrats experience little oversight in most situations.
The Case for Polls
• Establish a framework for issues• Provide information for public debate and
discussion• Explain the views people hold• Are the best tools we currently have for
understanding public attitudes, beliefs, and behaviors
Sampling Issues
• How are respondents selected?
• Probability samples– Use of probability samples allows survey results to
be generalized to the larger group from which the sample was selected.
• Non-probability samples
The Sampling Error Issue
• Sampling error: “Error created from using a sample to represent a larger population.”
• Sampling error is known and calculable.
• Non-sampling error (errors that arise from questionnaire design, interviewing, data entry, and data analysis) is not calculable.
Interviewing Issues
• How many calls are made to reach a respondent?
• Which days of the week are interviews conducted?
• How many days are included in the sample?• What about people who refuse?
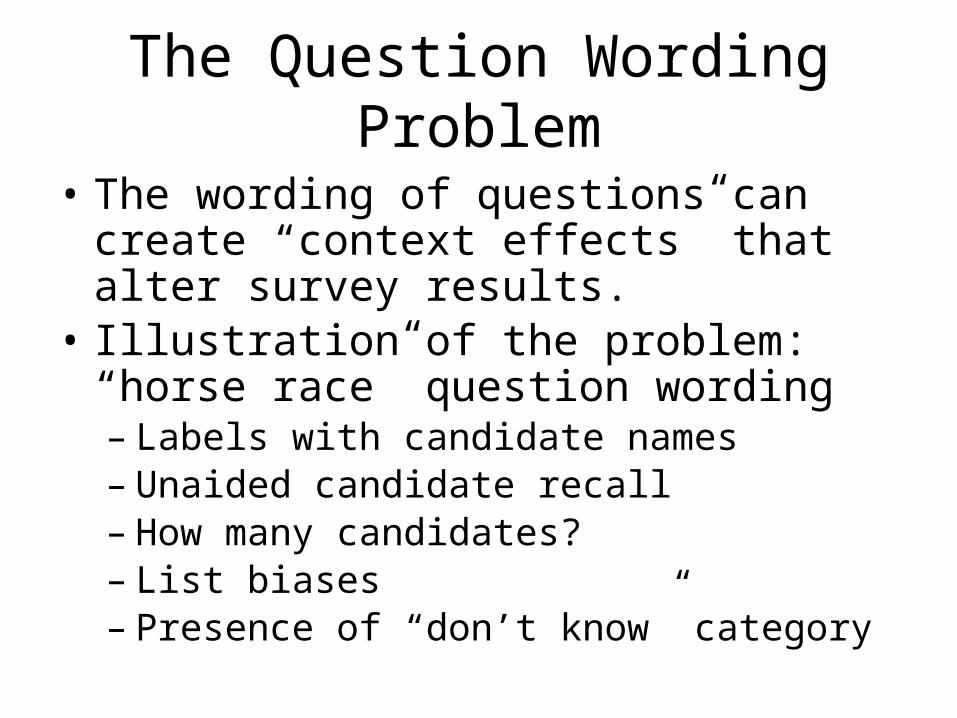
The Question Wording Problem
• The wording of questions can create “context effects” that alter survey results.
• Illustration of the problem: “horse race” question wording– Labels with candidate names– Unaided candidate recall– How many candidates?– List biases– Presence of “don’t know” category
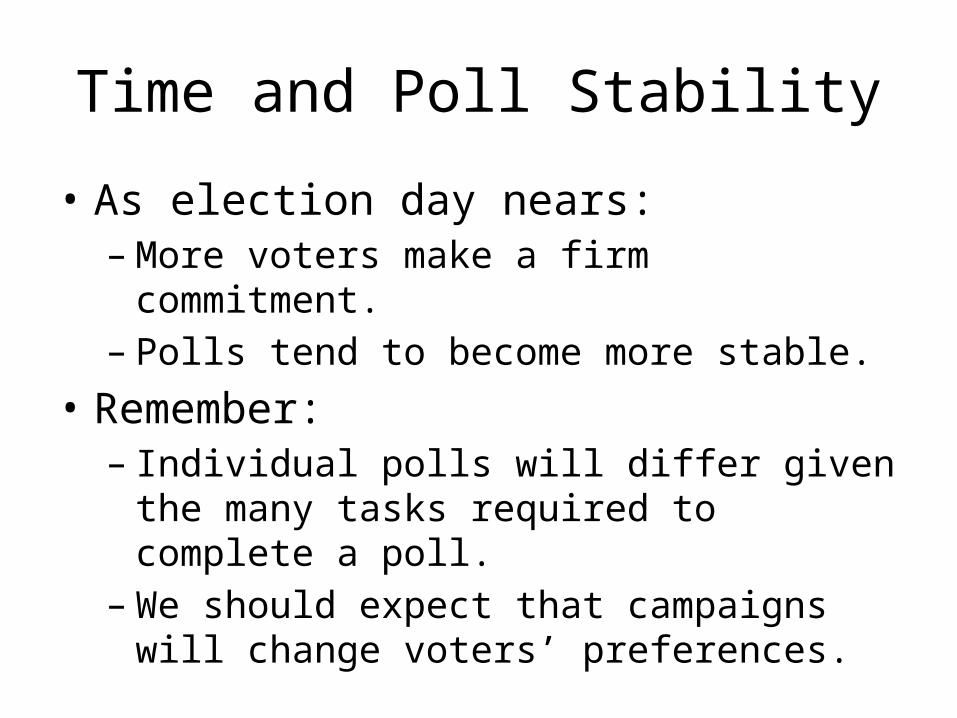
Time and Poll Stability
• As election day nears:– More voters make a firm commitment.– Polls tend to become more stable.
• Remember:– Individual polls will differ given the many tasks
required to complete a poll.– We should expect that campaigns will change
voters’ preferences.
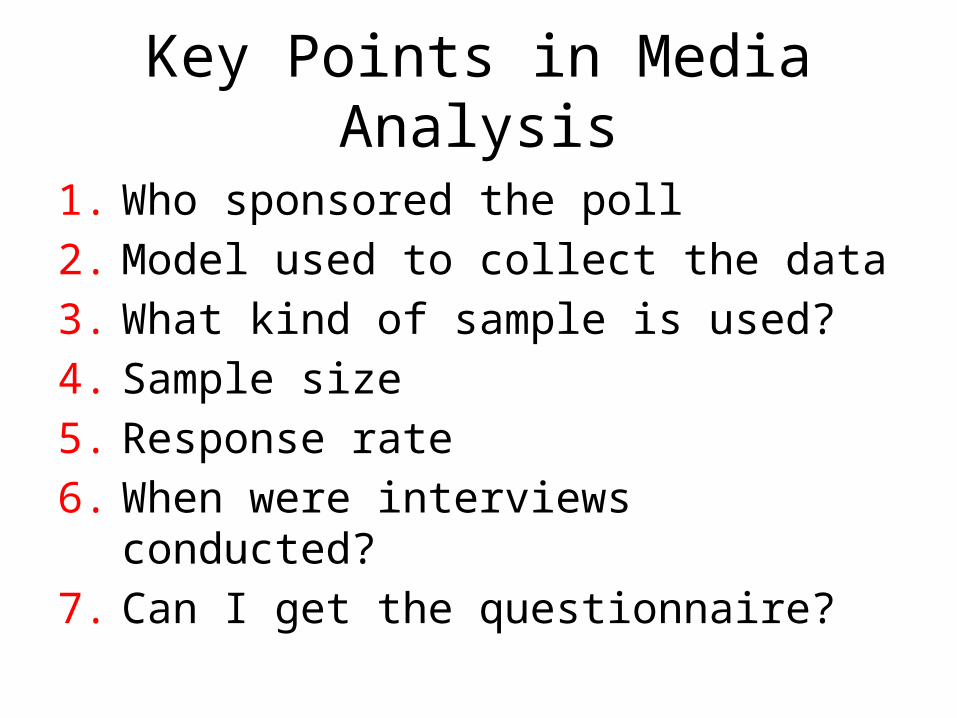
Key Points in Media Analysis
1. Who sponsored the poll2. Model used to collect the data3. What kind of sample is used?4. Sample size5. Response rate6. When were interviews conducted?7. Can I get the questionnaire?
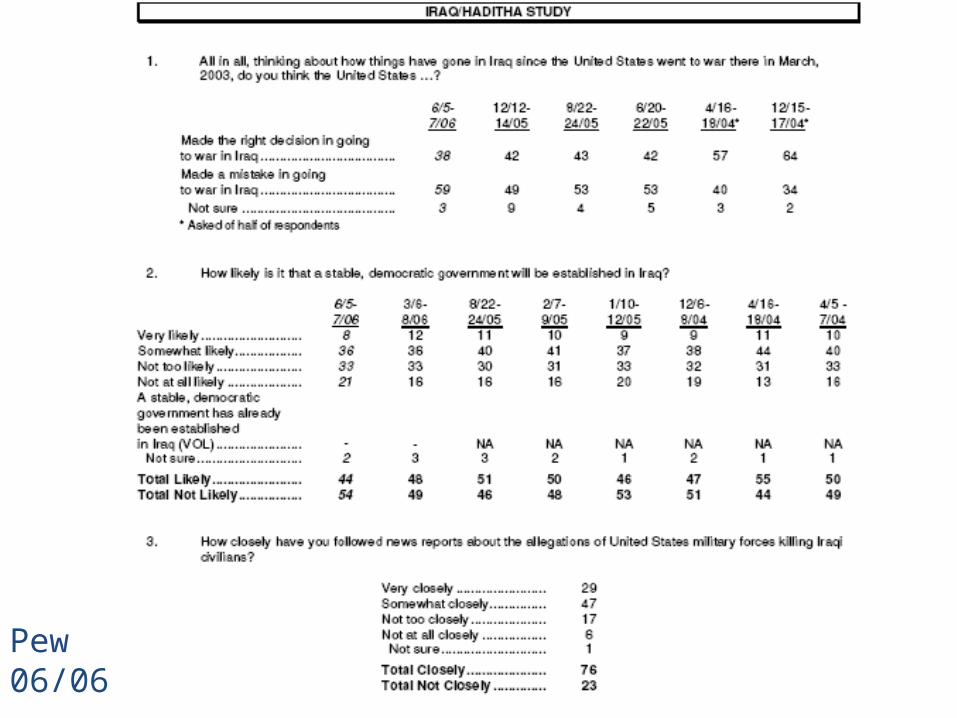
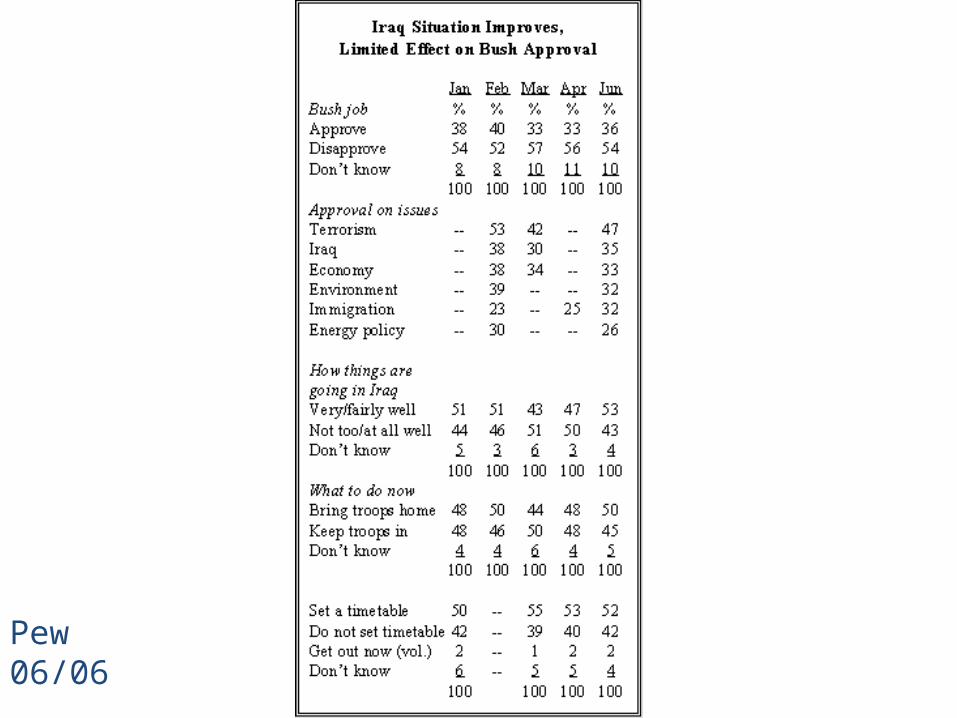
Pew 06/06
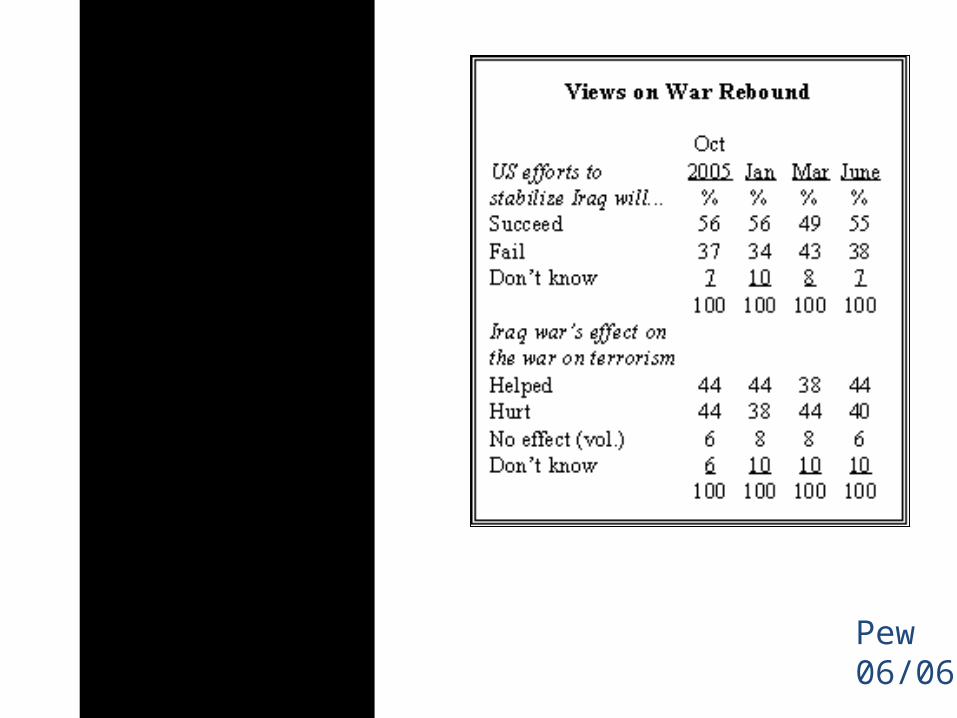
Pew 06/06
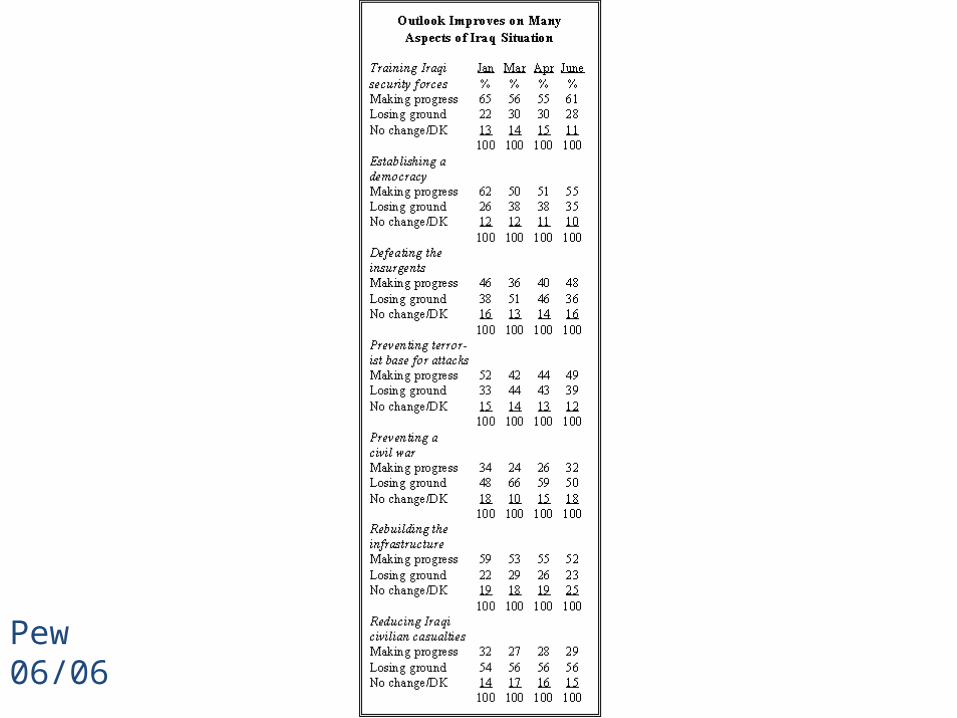
Pew 06/06
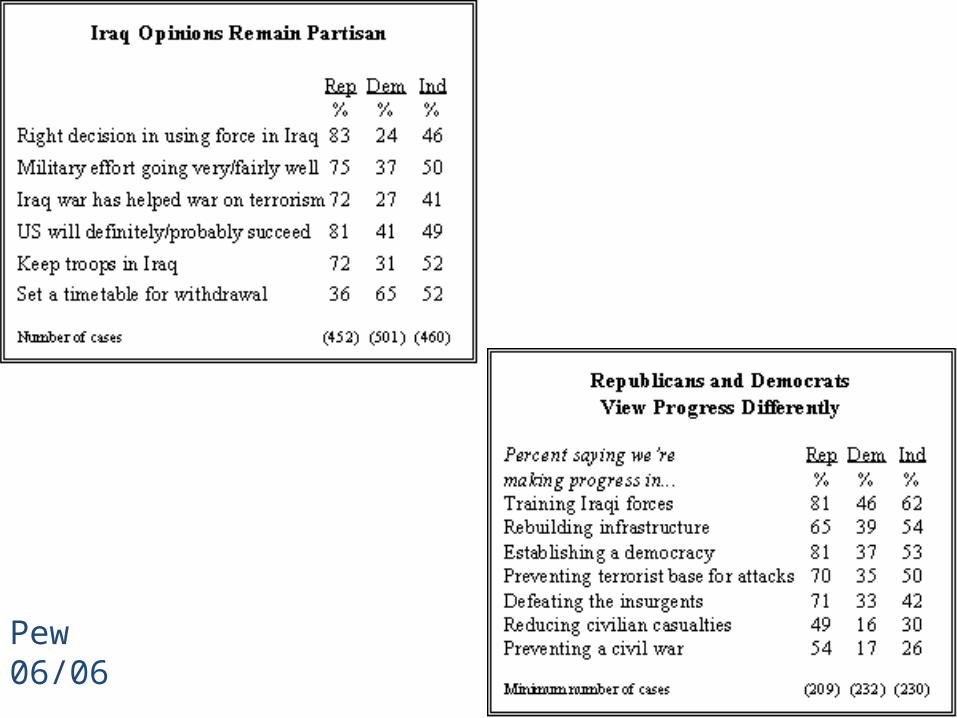
Pew 06/06
Pew 06/06
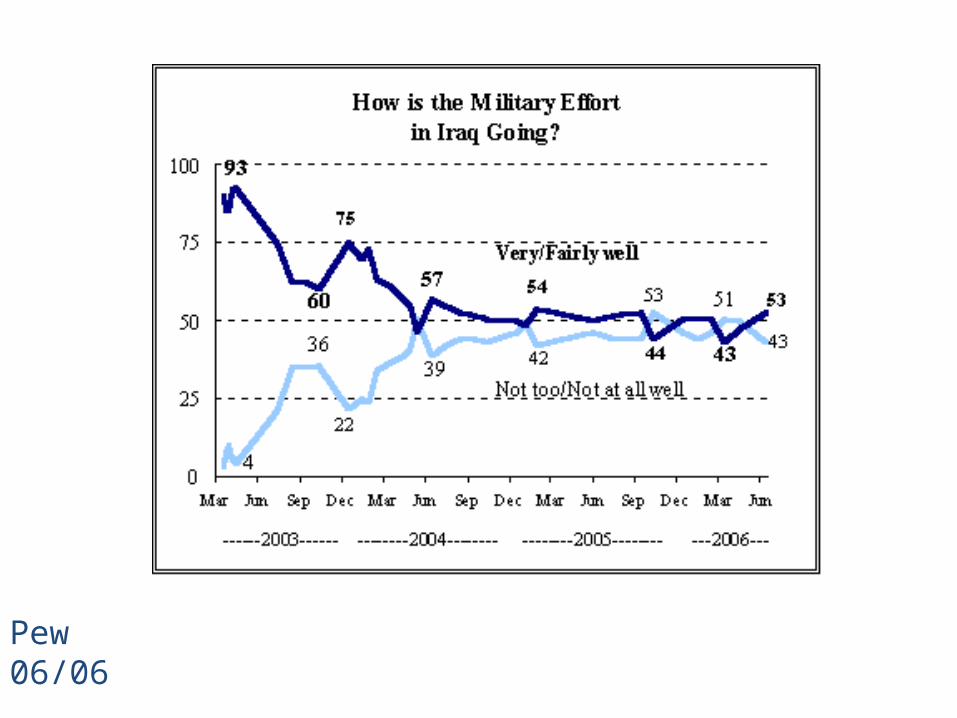
Pew 06/06
Email [email protected]
http://politics.fandm.edu
Keystone PollsVoter and political analysisPolitically Uncorrected

TVmedia
VotersEarmarksPork
Tragedy of the commons
Election year events
Money and primaries
http://www.opensecrets.org/industries/
http://usgovinfo.about.com/blorgs.htm
http://pag.vancouver.wsu.edu/alpha.html