Embed Size (px)
Citation preview
Lesson Alignment Guide – Mathematics Cranston Public Schools
Grade 5 Unit Unit Title Lesson Day
3.1 Representing & Interpreting Data Using Fractions
1 1 - 5
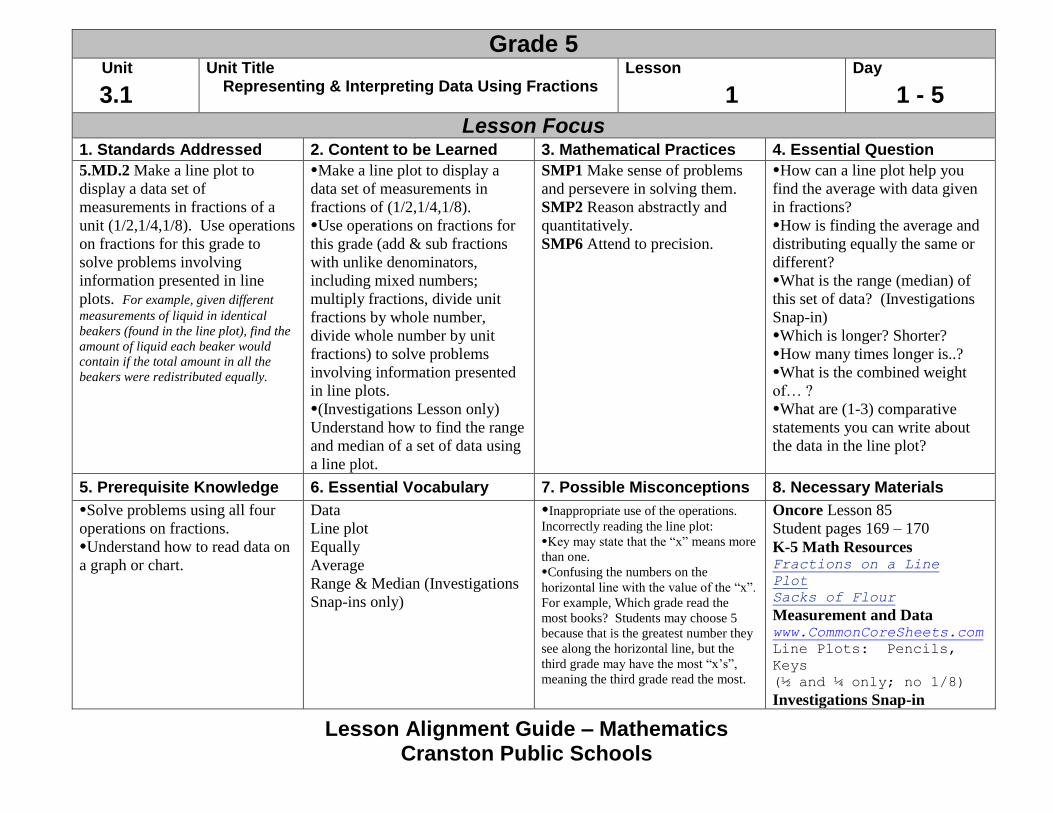
Lesson Focus 1. Standards Addressed 2. Content to be Learned 3. Mathematical Practices 4. Essential Question
5.MD.2 Make a line plot to
display a data set of
measurements in fractions of a
unit (1/2,1/4,1/8). Use operations
on fractions for this grade to
solve problems involving
information presented in line
plots. For example, given different
measurements of liquid in identical
beakers (found in the line plot), find the
amount of liquid each beaker would
contain if the total amount in all the
beakers were redistributed equally.
Make a line plot to display a
data set of measurements in
fractions of (1/2,1/4,1/8).
Use operations on fractions for
this grade (add & sub fractions
with unlike denominators,
including mixed numbers;
multiply fractions, divide unit
fractions by whole number,
divide whole number by unit
fractions) to solve problems
involving information presented
in line plots.
(Investigations Lesson only)
Understand how to find the range
and median of a set of data using
a line plot.
SMP1 Make sense of problems
and persevere in solving them.
SMP2 Reason abstractly and
quantitatively.
SMP6 Attend to precision.
How can a line plot help you
find the average with data given
in fractions?
How is finding the average and
distributing equally the same or
different?
What is the range (median) of
this set of data? (Investigations
Snap-in)
Which is longer? Shorter?
How many times longer is..?
What is the combined weight
of… ?
What are (1-3) comparative
statements you can write about
the data in the line plot?
5. Prerequisite Knowledge 6. Essential Vocabulary 7. Possible Misconceptions 8. Necessary Materials
Solve problems using all four
operations on fractions.
Understand how to read data on
a graph or chart.
Data
Line plot Equally
Average
Range & Median (Investigations
Snap-ins only)
Inappropriate use of the operations.
Incorrectly reading the line plot:
Key may state that the “x” means more
than one.
Confusing the numbers on the
horizontal line with the value of the “x”.
For example, Which grade read the
most books? Students may choose 5
because that is the greatest number they
see along the horizontal line, but the
third grade may have the most “x’s”,
meaning the third grade read the most.
Oncore Lesson 85
Student pages 169 – 170
K-5 Math Resources Fractions on a Line
Plot Sacks of Flour
Measurement and Data www.CommonCoreSheets.com
Line Plots: Pencils,
Keys
(½ and ¼ only; no 1/8)
Investigations Snap-in
Lesson Alignment Guide – Mathematics Cranston Public Schools
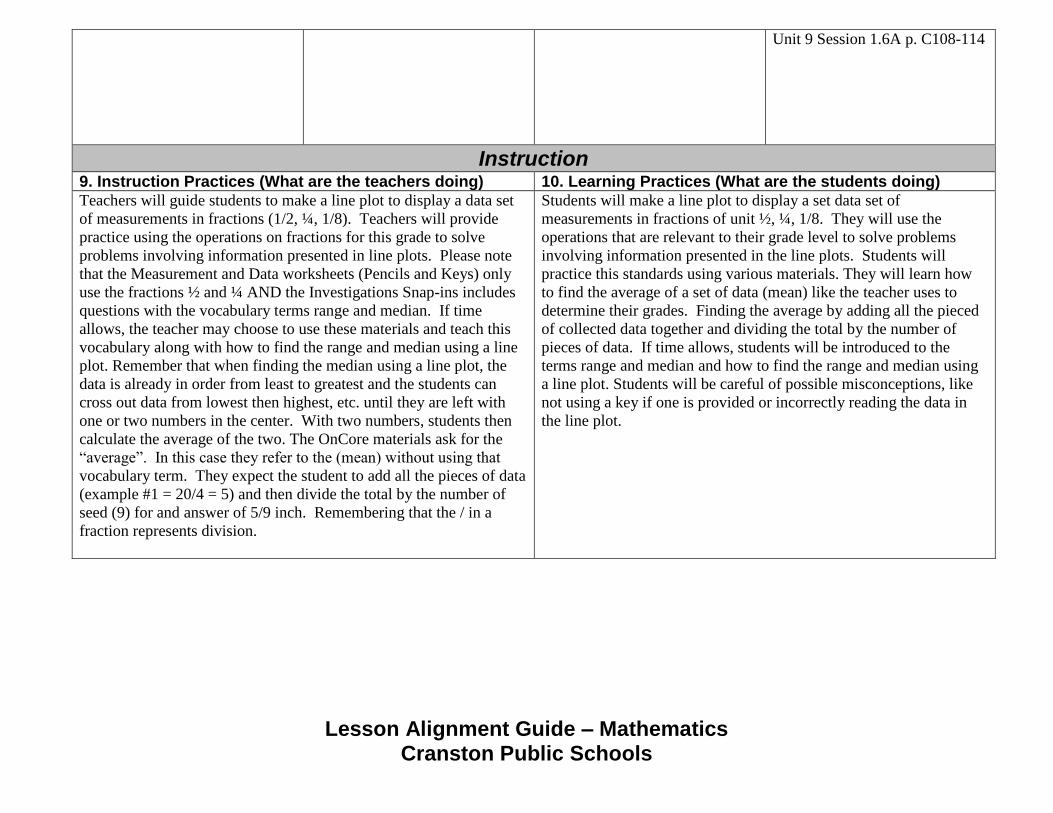
Unit 9 Session 1.6A p. C108-114
Instruction 9. Instruction Practices (What are the teachers doing) 10. Learning Practices (What are the students doing) Teachers will guide students to make a line plot to display a data set
of measurements in fractions (1/2, ¼, 1/8). Teachers will provide
practice using the operations on fractions for this grade to solve
problems involving information presented in line plots. Please note
that the Measurement and Data worksheets (Pencils and Keys) only
use the fractions ½ and ¼ AND the Investigations Snap-ins includes
questions with the vocabulary terms range and median. If time
allows, the teacher may choose to use these materials and teach this
vocabulary along with how to find the range and median using a line
plot. Remember that when finding the median using a line plot, the
data is already in order from least to greatest and the students can
cross out data from lowest then highest, etc. until they are left with
one or two numbers in the center. With two numbers, students then
calculate the average of the two. The OnCore materials ask for the
“average”. In this case they refer to the (mean) without using that
vocabulary term. They expect the student to add all the pieces of data
(example #1 = 20/4 = 5) and then divide the total by the number of
seed (9) for and answer of 5/9 inch. Remembering that the / in a
fraction represents division.
Students will make a line plot to display a set data set of
measurements in fractions of unit ½, ¼, 1/8. They will use the
operations that are relevant to their grade level to solve problems
involving information presented in the line plots. Students will
practice this standards using various materials. They will learn how
to find the average of a set of data (mean) like the teacher uses to
determine their grades. Finding the average by adding all the pieced
of collected data together and dividing the total by the number of
pieces of data. If time allows, students will be introduced to the
terms range and median and how to find the range and median using
a line plot. Students will be careful of possible misconceptions, like
not using a key if one is provided or incorrectly reading the data in
the line plot.
Lesson Alignment Guide – Mathematics Cranston Public Schools
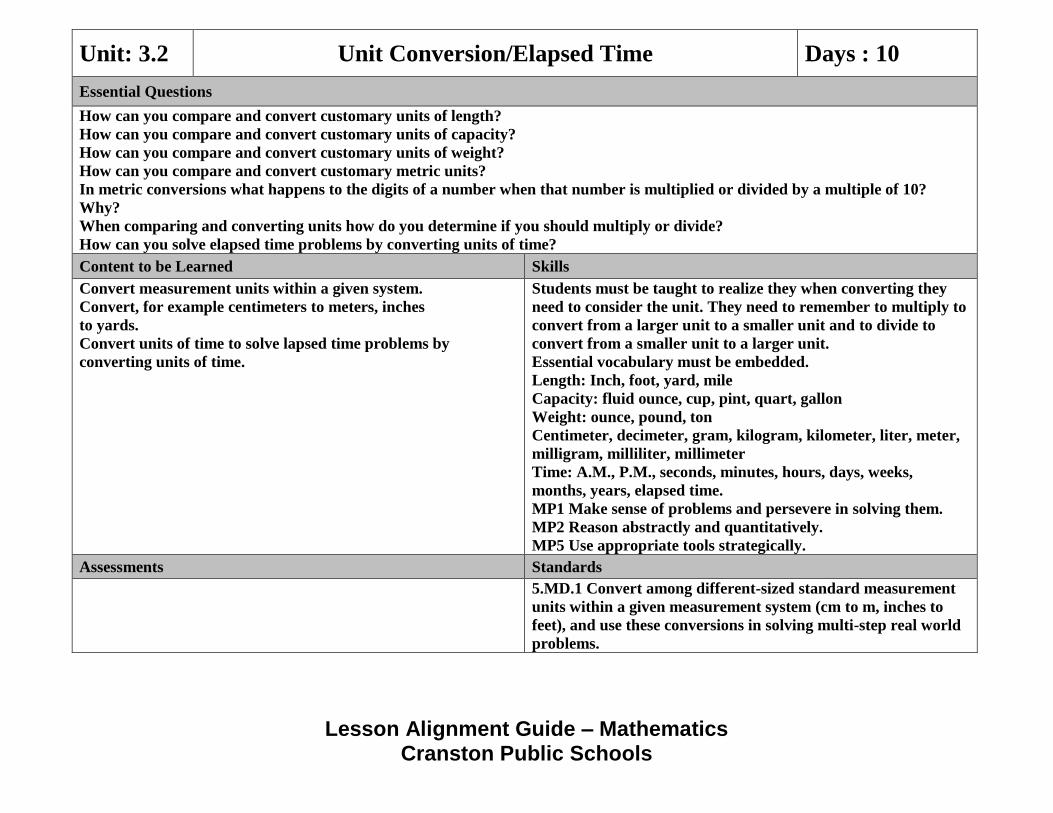
Unit: 3.2 Unit Conversion/Elapsed Time Days : 10
Essential Questions
How can you compare and convert customary units of length?
How can you compare and convert customary units of capacity?
How can you compare and convert customary units of weight?
How can you compare and convert customary metric units?
In metric conversions what happens to the digits of a number when that number is multiplied or divided by a multiple of 10?
Why?
When comparing and converting units how do you determine if you should multiply or divide?
How can you solve elapsed time problems by converting units of time?
Content to be Learned Skills
Convert measurement units within a given system.
Convert, for example centimeters to meters, inches
to yards.
Convert units of time to solve lapsed time problems by
converting units of time.
Students must be taught to realize they when converting they
need to consider the unit. They need to remember to multiply to
convert from a larger unit to a smaller unit and to divide to
convert from a smaller unit to a larger unit.
Essential vocabulary must be embedded.
Length: Inch, foot, yard, mile
Capacity: fluid ounce, cup, pint, quart, gallon
Weight: ounce, pound, ton
Centimeter, decimeter, gram, kilogram, kilometer, liter, meter,
milligram, milliliter, millimeter
Time: A.M., P.M., seconds, minutes, hours, days, weeks,
months, years, elapsed time.
MP1 Make sense of problems and persevere in solving them.
MP2 Reason abstractly and quantitatively.
MP5 Use appropriate tools strategically.
Assessments Standards
5.MD.1 Convert among different-sized standard measurement
units within a given measurement system (cm to m, inches to
feet), and use these conversions in solving multi-step real world
problems.
Lesson Alignment Guide – Mathematics Cranston Public Schools
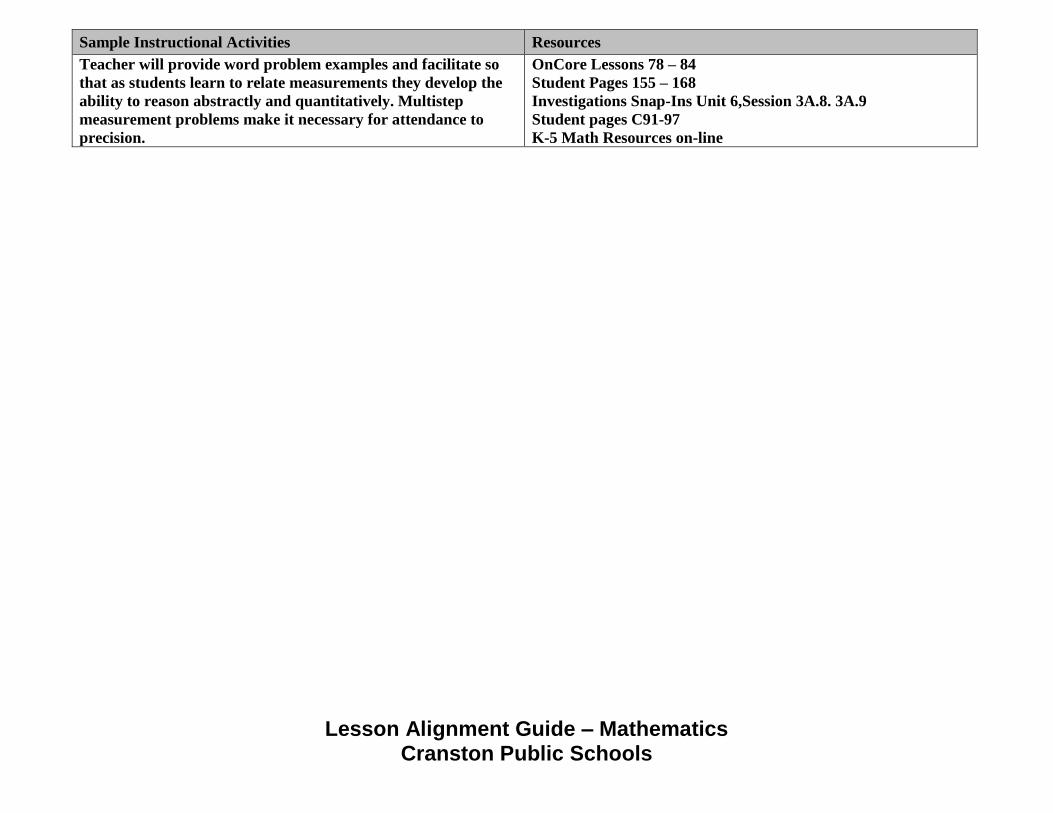
Sample Instructional Activities Resources
Teacher will provide word problem examples and facilitate so
that as students learn to relate measurements they develop the
ability to reason abstractly and quantitatively. Multistep
measurement problems make it necessary for attendance to
precision.
OnCore Lessons 78 – 84
Student Pages 155 – 168
Investigations Snap-Ins Unit 6,Session 3A.8. 3A.9
Student pages C91-97
K-5 Math Resources on-line
Lesson Alignment Guide – Mathematics Cranston Public Schools
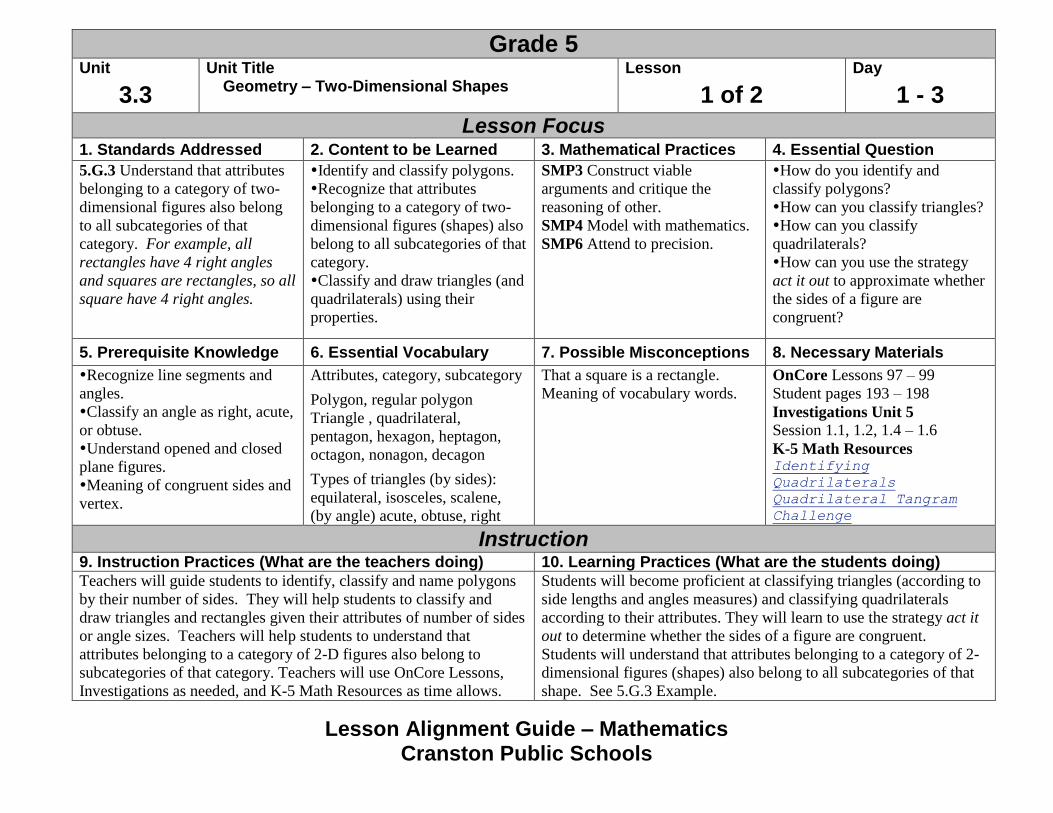
Grade 5 Unit Unit Title Lesson Day
3.3 Geometry – Two-Dimensional Shapes
1 of 2 1 - 3
Lesson Focus 1. Standards Addressed 2. Content to be Learned 3. Mathematical Practices 4. Essential Question
5.G.3 Understand that attributes
belonging to a category of two-
dimensional figures also belong
to all subcategories of that
category. For example, all
rectangles have 4 right angles
and squares are rectangles, so all
square have 4 right angles.
Identify and classify polygons.
Recognize that attributes
belonging to a category of two-
dimensional figures (shapes) also
belong to all subcategories of that
category.
Classify and draw triangles (and
quadrilaterals) using their
properties.
SMP3 Construct viable
arguments and critique the
reasoning of other.
SMP4 Model with mathematics.
SMP6 Attend to precision.
How do you identify and
classify polygons?
How can you classify triangles?
How can you classify
quadrilaterals?
How can you use the strategy
act it out to approximate whether
the sides of a figure are
congruent?
5. Prerequisite Knowledge 6. Essential Vocabulary 7. Possible Misconceptions 8. Necessary Materials
Recognize line segments and
angles.
Classify an angle as right, acute,
or obtuse.
Understand opened and closed
plane figures.
Meaning of congruent sides and
vertex.
Attributes, category, subcategory
Polygon, regular polygon
Triangle , quadrilateral,
pentagon, hexagon, heptagon,
octagon, nonagon, decagon
Types of triangles (by sides):
equilateral, isosceles, scalene,
(by angle) acute, obtuse, right
That a square is a rectangle.
Meaning of vocabulary words.
OnCore Lessons 97 – 99
Student pages 193 – 198
Investigations Unit 5
Session 1.1, 1.2, 1.4 – 1.6
K-5 Math Resources Identifying
Quadrilaterals
Quadrilateral Tangram
Challenge
Instruction 9. Instruction Practices (What are the teachers doing) 10. Learning Practices (What are the students doing)
Teachers will guide students to identify, classify and name polygons
by their number of sides. They will help students to classify and
draw triangles and rectangles given their attributes of number of sides
or angle sizes. Teachers will help students to understand that
attributes belonging to a category of 2-D figures also belong to
subcategories of that category. Teachers will use OnCore Lessons,
Investigations as needed, and K-5 Math Resources as time allows.
Students will become proficient at classifying triangles (according to
side lengths and angles measures) and classifying quadrilaterals
according to their attributes. They will learn to use the strategy act it
out to determine whether the sides of a figure are congruent.
Students will understand that attributes belonging to a category of 2-
dimensional figures (shapes) also belong to all subcategories of that
shape. See 5.G.3 Example.
Lesson Alignment Guide – Mathematics Cranston Public Schools
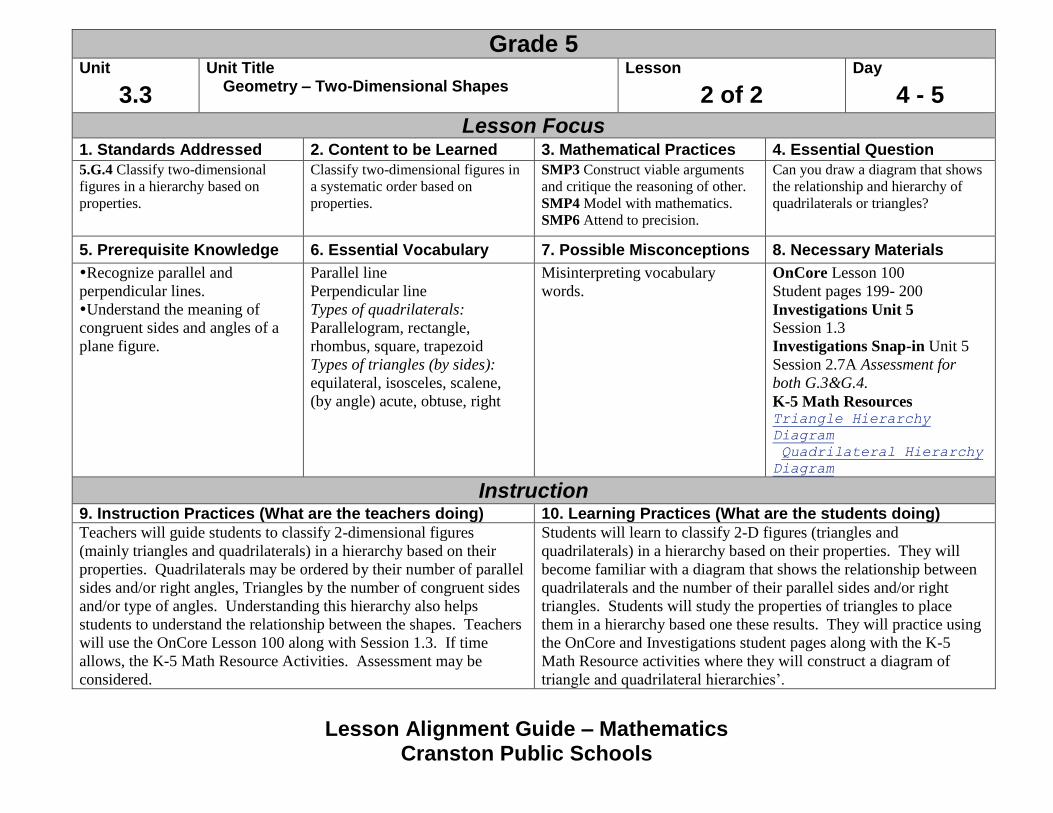
Grade 5 Unit Unit Title Lesson Day
3.3 Geometry – Two-Dimensional Shapes
2 of 2 4 - 5
Lesson Focus 1. Standards Addressed 2. Content to be Learned 3. Mathematical Practices 4. Essential Question
5.G.4 Classify two-dimensional
figures in a hierarchy based on
properties.
Classify two-dimensional figures in
a systematic order based on
properties.
SMP3 Construct viable arguments
and critique the reasoning of other.
SMP4 Model with mathematics.
SMP6 Attend to precision.
Can you draw a diagram that shows
the relationship and hierarchy of
quadrilaterals or triangles?
5. Prerequisite Knowledge 6. Essential Vocabulary 7. Possible Misconceptions 8. Necessary Materials
Recognize parallel and
perpendicular lines.
Understand the meaning of
congruent sides and angles of a
plane figure.
Parallel line
Perpendicular line
Types of quadrilaterals:
Parallelogram, rectangle,
rhombus, square, trapezoid
Types of triangles (by sides):
equilateral, isosceles, scalene,
(by angle) acute, obtuse, right
Misinterpreting vocabulary
words.
OnCore Lesson 100
Student pages 199- 200
Investigations Unit 5
Session 1.3
Investigations Snap-in Unit 5
Session 2.7A Assessment for
both G.3&G.4.
K-5 Math Resources Triangle Hierarchy
Diagram
Quadrilateral Hierarchy Diagram
Instruction 9. Instruction Practices (What are the teachers doing) 10. Learning Practices (What are the students doing)
Teachers will guide students to classify 2-dimensional figures
(mainly triangles and quadrilaterals) in a hierarchy based on their
properties. Quadrilaterals may be ordered by their number of parallel
sides and/or right angles, Triangles by the number of congruent sides
and/or type of angles. Understanding this hierarchy also helps
students to understand the relationship between the shapes. Teachers
will use the OnCore Lesson 100 along with Session 1.3. If time
allows, the K-5 Math Resource Activities. Assessment may be
considered.
Students will learn to classify 2-D figures (triangles and
quadrilaterals) in a hierarchy based on their properties. They will
become familiar with a diagram that shows the relationship between
quadrilaterals and the number of their parallel sides and/or right
triangles. Students will study the properties of triangles to place
them in a hierarchy based one these results. They will practice using
the OnCore and Investigations student pages along with the K-5
Math Resource activities where they will construct a diagram of
triangle and quadrilateral hierarchies’.
Lesson Alignment Guide – Mathematics Cranston Public Schools
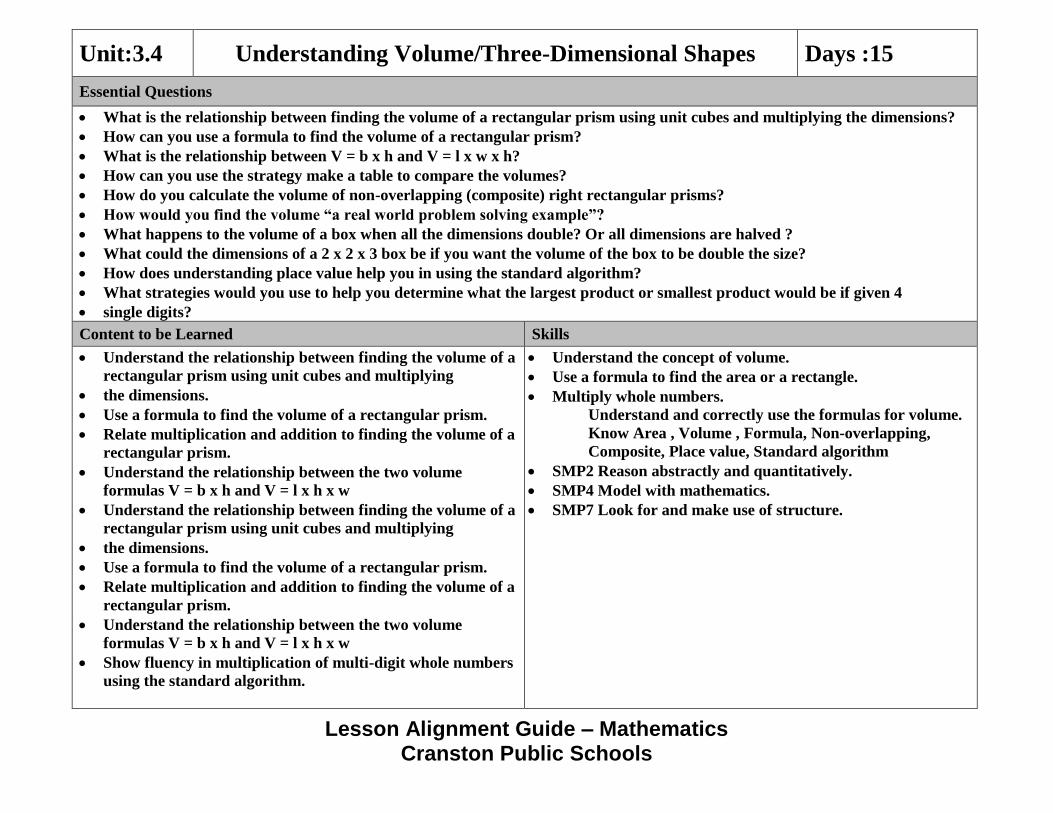
Unit:3.4 Understanding Volume/Three-Dimensional Shapes Days :15
Essential Questions
What is the relationship between finding the volume of a rectangular prism using unit cubes and multiplying the dimensions?
How can you use a formula to find the volume of a rectangular prism?
What is the relationship between V = b x h and V = l x w x h?
How can you use the strategy make a table to compare the volumes?
How do you calculate the volume of non-overlapping (composite) right rectangular prisms?
How would you find the volume “a real world problem solving example”?
What happens to the volume of a box when all the dimensions double? Or all dimensions are halved ?
What could the dimensions of a 2 x 2 x 3 box be if you want the volume of the box to be double the size?
How does understanding place value help you in using the standard algorithm?
What strategies would you use to help you determine what the largest product or smallest product would be if given 4
single digits?
Content to be Learned Skills
Understand the relationship between finding the volume of a
rectangular prism using unit cubes and multiplying
the dimensions.
Use a formula to find the volume of a rectangular prism.
Relate multiplication and addition to finding the volume of a
rectangular prism.
Understand the relationship between the two volume
formulas V = b x h and V = l x h x w
Show fluency in multiplication of multi-digit whole numbers
using the standard algorithm.
Understand the concept of volume.
Use a formula to find the area or a rectangle.
Multiply whole numbers.
Understand and correctly use the formulas for volume.
Know Area , Volume , Formula, Non-overlapping,
Composite, Place value, Standard algorithm
SMP2 Reason abstractly and quantitatively.
SMP4 Model with mathematics.
SMP7 Look for and make use of structure.
Lesson Alignment Guide – Mathematics Cranston Public Schools
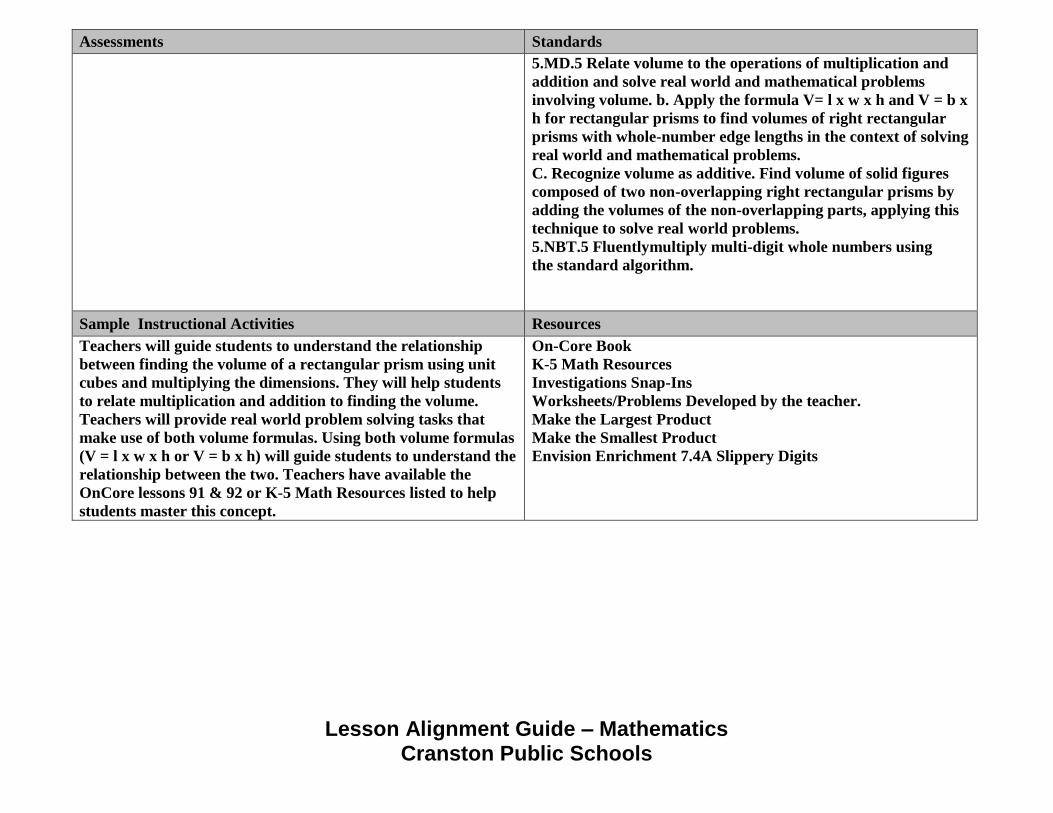
Assessments Standards
5.MD.5 Relate volume to the operations of multiplication and
addition and solve real world and mathematical problems
involving volume. b. Apply the formula V= l x w x h and V = b x
h for rectangular prisms to find volumes of right rectangular
prisms with whole-number edge lengths in the context of solving
real world and mathematical problems.
C. Recognize volume as additive. Find volume of solid figures
composed of two non-overlapping right rectangular prisms by
adding the volumes of the non-overlapping parts, applying this
technique to solve real world problems.
5.NBT.5 Fluentlymultiply multi-digit whole numbers using
the standard algorithm.
Sample Instructional Activities Resources
Teachers will guide students to understand the relationship
between finding the volume of a rectangular prism using unit
cubes and multiplying the dimensions. They will help students
to relate multiplication and addition to finding the volume.
Teachers will provide real world problem solving tasks that
make use of both volume formulas. Using both volume formulas
(V = l x w x h or V = b x h) will guide students to understand the
relationship between the two. Teachers have available the
OnCore lessons 91 & 92 or K-5 Math Resources listed to help
students master this concept.
On-Core Book
K-5 Math Resources
Investigations Snap-Ins
Worksheets/Problems Developed by the teacher.
Make the Largest Product
Make the Smallest Product
Envision Enrichment 7.4A Slippery Digits
Lesson Alignment Guide – Mathematics Cranston Public Schools
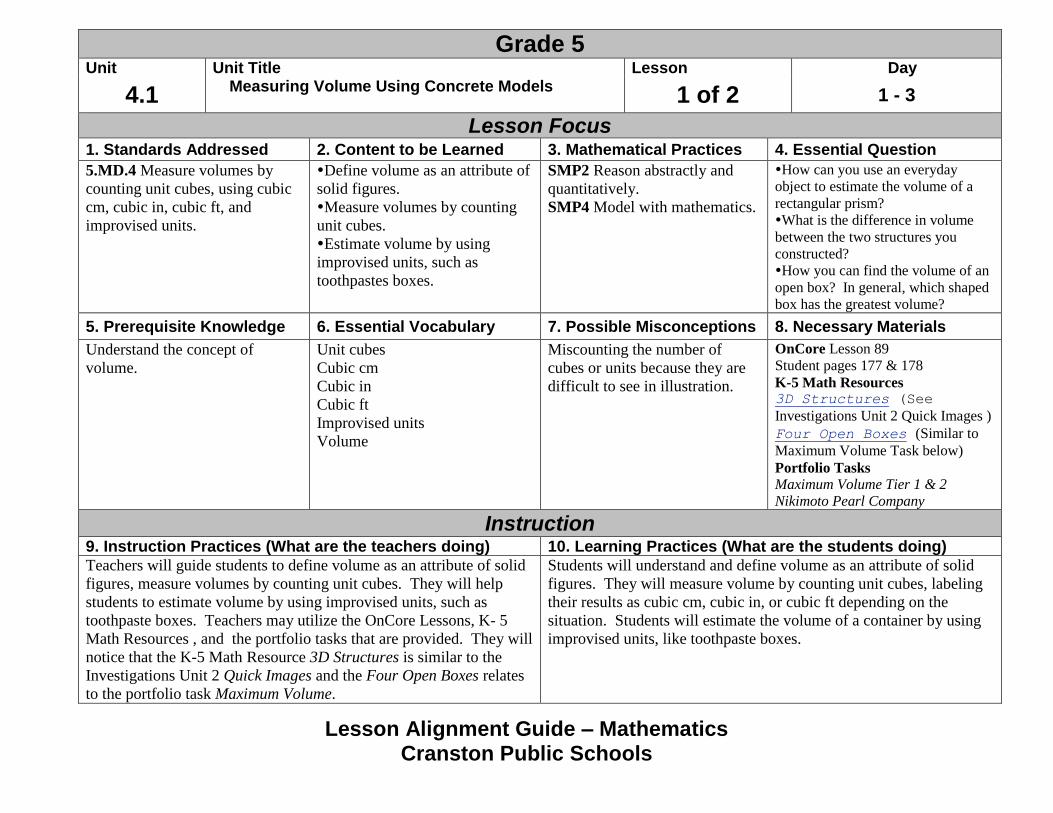
Grade 5 Unit Unit Title Lesson Day
4.1 Measuring Volume Using Concrete Models
1 of 2 1 - 3
Lesson Focus 1. Standards Addressed 2. Content to be Learned 3. Mathematical Practices 4. Essential Question
5.MD.4 Measure volumes by
counting unit cubes, using cubic
cm, cubic in, cubic ft, and
improvised units.
Define volume as an attribute of
solid figures.
Measure volumes by counting
unit cubes.
Estimate volume by using
improvised units, such as
toothpastes boxes.
SMP2 Reason abstractly and
quantitatively.
SMP4 Model with mathematics.
How can you use an everyday
object to estimate the volume of a
rectangular prism?
What is the difference in volume
between the two structures you
constructed?
How you can find the volume of an
open box? In general, which shaped
box has the greatest volume?
5. Prerequisite Knowledge 6. Essential Vocabulary 7. Possible Misconceptions 8. Necessary Materials
Understand the concept of
volume.
Unit cubes
Cubic cm
Cubic in
Cubic ft
Improvised units
Volume
Miscounting the number of
cubes or units because they are
difficult to see in illustration.
OnCore Lesson 89
Student pages 177 & 178
K-5 Math Resources 3D Structures (See
Investigations Unit 2 Quick Images )
Four Open Boxes (Similar to
Maximum Volume Task below)
Portfolio Tasks
Maximum Volume Tier 1 & 2
Nikimoto Pearl Company
Instruction 9. Instruction Practices (What are the teachers doing) 10. Learning Practices (What are the students doing) Teachers will guide students to define volume as an attribute of solid
figures, measure volumes by counting unit cubes. They will help
students to estimate volume by using improvised units, such as
toothpaste boxes. Teachers may utilize the OnCore Lessons, K- 5
Math Resources , and the portfolio tasks that are provided. They will
notice that the K-5 Math Resource 3D Structures is similar to the
Investigations Unit 2 Quick Images and the Four Open Boxes relates
to the portfolio task Maximum Volume.
Students will understand and define volume as an attribute of solid
figures. They will measure volume by counting unit cubes, labeling
their results as cubic cm, cubic in, or cubic ft depending on the
situation. Students will estimate the volume of a container by using
improvised units, like toothpaste boxes.
Lesson Alignment Guide – Mathematics Cranston Public Schools
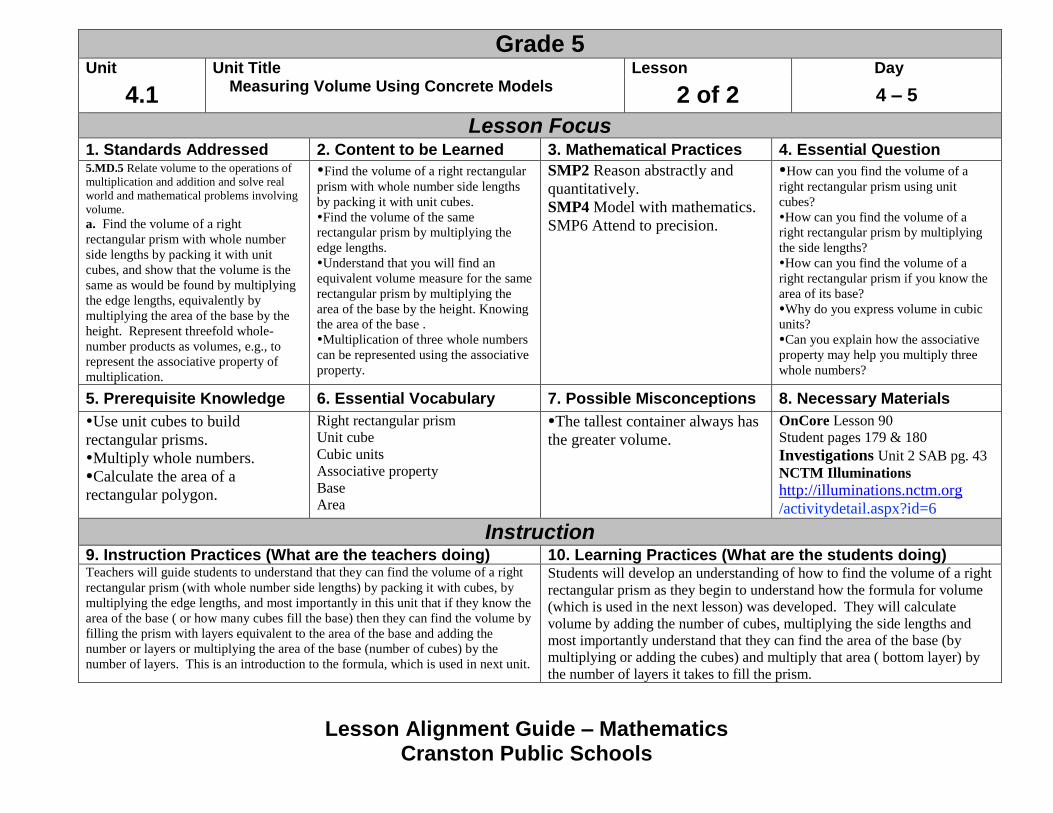
Grade 5 Unit Unit Title Lesson Day
4.1 Measuring Volume Using Concrete Models
2 of 2 4 – 5
Lesson Focus 1. Standards Addressed 2. Content to be Learned 3. Mathematical Practices 4. Essential Question 5.MD.5 Relate volume to the operations of
multiplication and addition and solve real
world and mathematical problems involving
volume.
a. Find the volume of a right
rectangular prism with whole number
side lengths by packing it with unit
cubes, and show that the volume is the
same as would be found by multiplying
the edge lengths, equivalently by
multiplying the area of the base by the
height. Represent threefold whole-
number products as volumes, e.g., to
represent the associative property of
multiplication.
Find the volume of a right rectangular
prism with whole number side lengths
by packing it with unit cubes.
Find the volume of the same
rectangular prism by multiplying the
edge lengths.
Understand that you will find an
equivalent volume measure for the same
rectangular prism by multiplying the
area of the base by the height. Knowing
the area of the base .
Multiplication of three whole numbers
can be represented using the associative
property.
SMP2 Reason abstractly and
quantitatively.
SMP4 Model with mathematics.
SMP6 Attend to precision.
How can you find the volume of a
right rectangular prism using unit
cubes?
How can you find the volume of a
right rectangular prism by multiplying
the side lengths?
How can you find the volume of a
right rectangular prism if you know the
area of its base?
Why do you express volume in cubic
units?
Can you explain how the associative
property may help you multiply three
whole numbers?
5. Prerequisite Knowledge 6. Essential Vocabulary 7. Possible Misconceptions 8. Necessary Materials
Use unit cubes to build
rectangular prisms.
Multiply whole numbers.
Calculate the area of a
rectangular polygon.
Right rectangular prism
Unit cube
Cubic units
Associative property
Base
Area
The tallest container always has
the greater volume.
OnCore Lesson 90
Student pages 179 & 180
Investigations Unit 2 SAB pg. 43
NCTM Illuminations
http://illuminations.nctm.org
/activitydetail.aspx?id=6
Instruction 9. Instruction Practices (What are the teachers doing) 10. Learning Practices (What are the students doing) Teachers will guide students to understand that they can find the volume of a right
rectangular prism (with whole number side lengths) by packing it with cubes, by
multiplying the edge lengths, and most importantly in this unit that if they know the
area of the base ( or how many cubes fill the base) then they can find the volume by
filling the prism with layers equivalent to the area of the base and adding the
number or layers or multiplying the area of the base (number of cubes) by the
number of layers. This is an introduction to the formula, which is used in next unit.
Students will develop an understanding of how to find the volume of a right
rectangular prism as they begin to understand how the formula for volume
(which is used in the next lesson) was developed. They will calculate
volume by adding the number of cubes, multiplying the side lengths and
most importantly understand that they can find the area of the base (by
multiplying or adding the cubes) and multiply that area ( bottom layer) by
the number of layers it takes to fill the prism.
Lesson Alignment Guide – Mathematics Cranston Public Schools
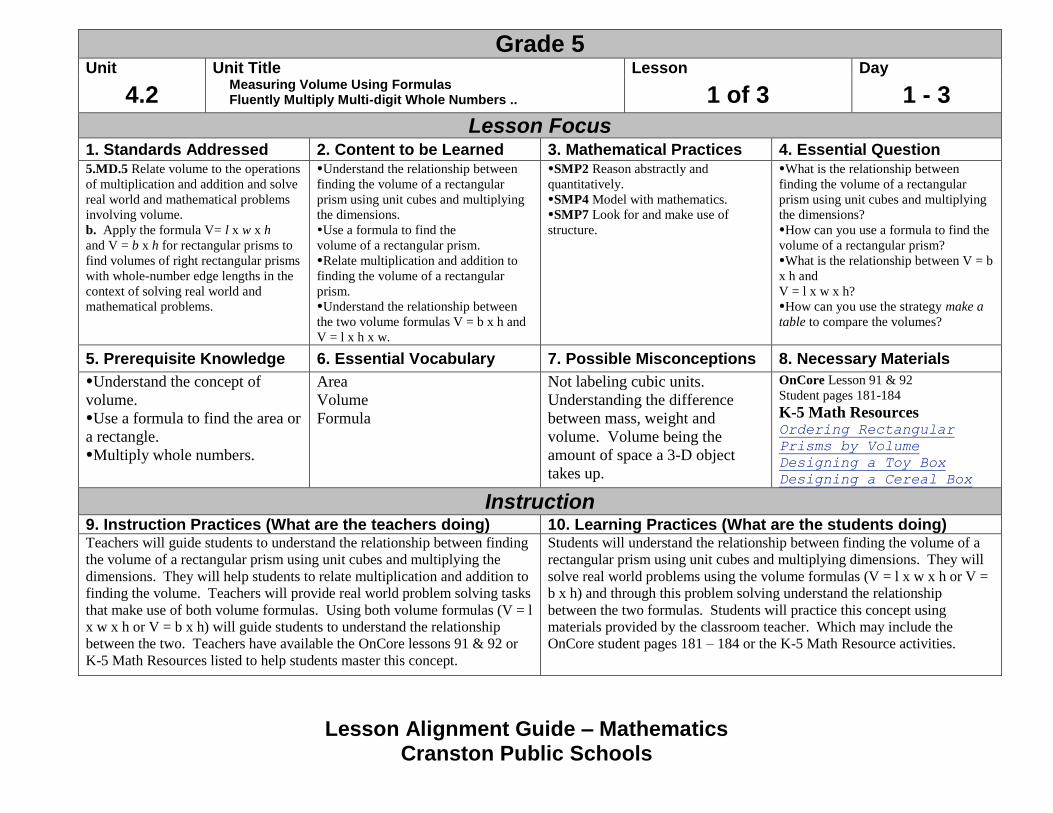
Grade 5 Unit Unit Title Lesson Day
4.2 Measuring Volume Using Formulas Fluently Multiply Multi-digit Whole Numbers .. 1 of 3 1 - 3
Lesson Focus 1. Standards Addressed 2. Content to be Learned 3. Mathematical Practices 4. Essential Question 5.MD.5 Relate volume to the operations
of multiplication and addition and solve
real world and mathematical problems
involving volume.
b. Apply the formula V= l x w x h
and V = b x h for rectangular prisms to
find volumes of right rectangular prisms
with whole-number edge lengths in the
context of solving real world and
mathematical problems.
Understand the relationship between
finding the volume of a rectangular
prism using unit cubes and multiplying
the dimensions.
Use a formula to find the
volume of a rectangular prism.
Relate multiplication and addition to
finding the volume of a rectangular
prism.
Understand the relationship between
the two volume formulas V = b x h and
V = l x h x w.
SMP2 Reason abstractly and
quantitatively.
SMP4 Model with mathematics.
SMP7 Look for and make use of
structure.
What is the relationship between
finding the volume of a rectangular
prism using unit cubes and multiplying
the dimensions?
How can you use a formula to find the
volume of a rectangular prism?
What is the relationship between V = b
x h and
V = l x w x h?
How can you use the strategy make a
table to compare the volumes?
5. Prerequisite Knowledge 6. Essential Vocabulary 7. Possible Misconceptions 8. Necessary Materials
Understand the concept of
volume.
Use a formula to find the area or
a rectangle.
Multiply whole numbers.
Area
Volume
Formula
Not labeling cubic units.
Understanding the difference
between mass, weight and
volume. Volume being the
amount of space a 3-D object
takes up.
OnCore Lesson 91 & 92
Student pages 181-184
K-5 Math Resources Ordering Rectangular
Prisms by Volume
Designing a Toy Box
Designing a Cereal Box
Instruction 9. Instruction Practices (What are the teachers doing) 10. Learning Practices (What are the students doing) Teachers will guide students to understand the relationship between finding
the volume of a rectangular prism using unit cubes and multiplying the
dimensions. They will help students to relate multiplication and addition to
finding the volume. Teachers will provide real world problem solving tasks
that make use of both volume formulas. Using both volume formulas (V = l
x w x h or V = b x h) will guide students to understand the relationship
between the two. Teachers have available the OnCore lessons 91 & 92 or
K-5 Math Resources listed to help students master this concept.
Students will understand the relationship between finding the volume of a
rectangular prism using unit cubes and multiplying dimensions. They will
solve real world problems using the volume formulas (V = l x w x h or V =
b x h) and through this problem solving understand the relationship
between the two formulas. Students will practice this concept using
materials provided by the classroom teacher. Which may include the
OnCore student pages 181 – 184 or the K-5 Math Resource activities.
Lesson Alignment Guide – Mathematics Cranston Public Schools
Grade 5 Unit Unit Title Lesson Day
4.2 Measuring Volume Using Formulas Fluently Multiply Multi-digit Whole Numbers .. 2 of 3 4 - 7
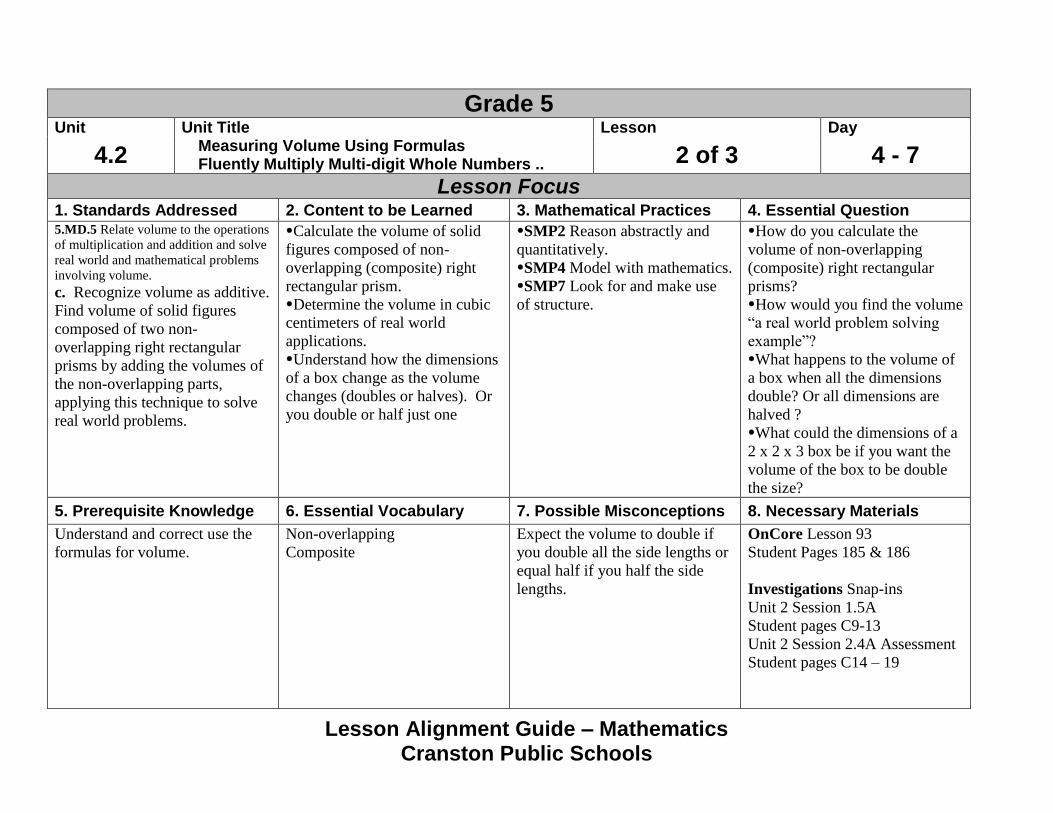
Lesson Focus 1. Standards Addressed 2. Content to be Learned 3. Mathematical Practices 4. Essential Question 5.MD.5 Relate volume to the operations
of multiplication and addition and solve
real world and mathematical problems
involving volume.
c. Recognize volume as additive.
Find volume of solid figures
composed of two non-
overlapping right rectangular
prisms by adding the volumes of
the non-overlapping parts,
applying this technique to solve
real world problems.
Calculate the volume of solid
figures composed of non-
overlapping (composite) right
rectangular prism.
Determine the volume in cubic
centimeters of real world
applications.
Understand how the dimensions
of a box change as the volume
changes (doubles or halves). Or
you double or half just one
SMP2 Reason abstractly and
quantitatively.
SMP4 Model with mathematics.
SMP7 Look for and make use
of structure.
How do you calculate the
volume of non-overlapping
(composite) right rectangular
prisms?
How would you find the volume
“a real world problem solving
example”?
What happens to the volume of
a box when all the dimensions
double? Or all dimensions are
halved ?
What could the dimensions of a
2 x 2 x 3 box be if you want the
volume of the box to be double
the size?
5. Prerequisite Knowledge 6. Essential Vocabulary 7. Possible Misconceptions 8. Necessary Materials
Understand and correct use the
formulas for volume.
Non-overlapping
Composite
Expect the volume to double if
you double all the side lengths or
equal half if you half the side
lengths.
OnCore Lesson 93
Student Pages 185 & 186
Investigations Snap-ins
Unit 2 Session 1.5A
Student pages C9-13
Unit 2 Session 2.4A Assessment
Student pages C14 – 19
Lesson Alignment Guide – Mathematics Cranston Public Schools
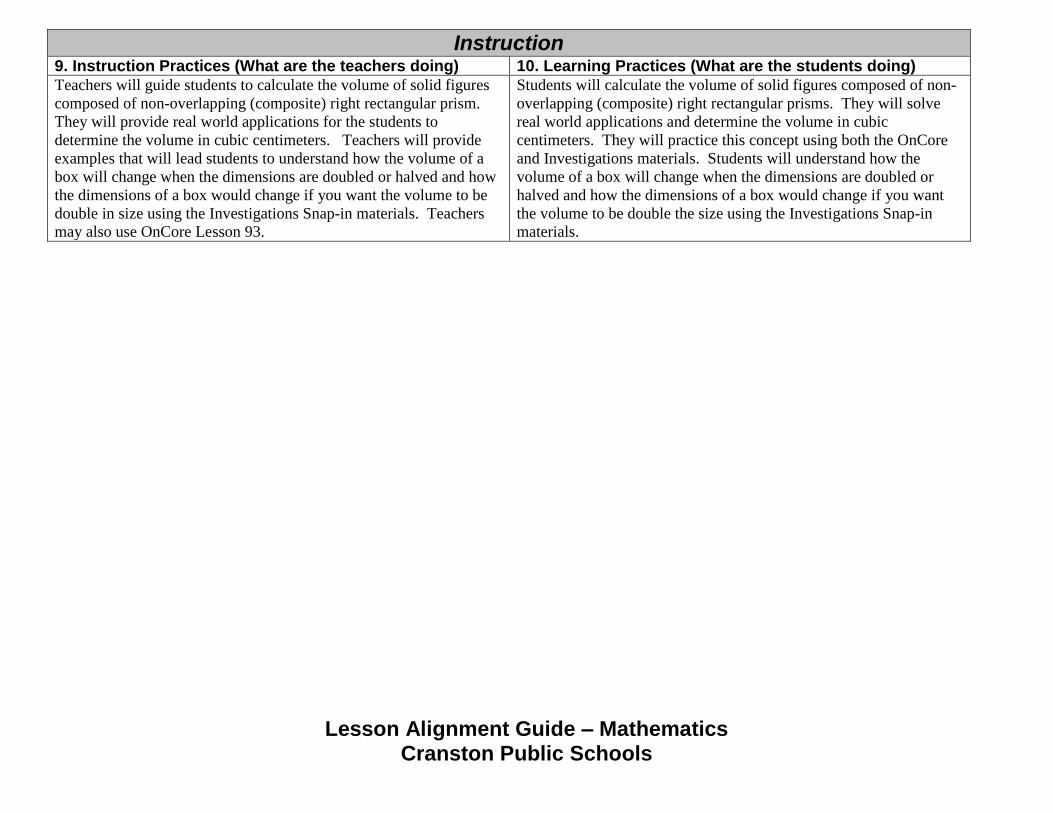
Instruction 9. Instruction Practices (What are the teachers doing) 10. Learning Practices (What are the students doing)
Teachers will guide students to calculate the volume of solid figures
composed of non-overlapping (composite) right rectangular prism.
They will provide real world applications for the students to
determine the volume in cubic centimeters. Teachers will provide
examples that will lead students to understand how the volume of a
box will change when the dimensions are doubled or halved and how
the dimensions of a box would change if you want the volume to be
double in size using the Investigations Snap-in materials. Teachers
may also use OnCore Lesson 93.
Students will calculate the volume of solid figures composed of non-
overlapping (composite) right rectangular prisms. They will solve
real world applications and determine the volume in cubic
centimeters. They will practice this concept using both the OnCore
and Investigations materials. Students will understand how the
volume of a box will change when the dimensions are doubled or
halved and how the dimensions of a box would change if you want
the volume to be double the size using the Investigations Snap-in
materials.
Cranston Public Schools
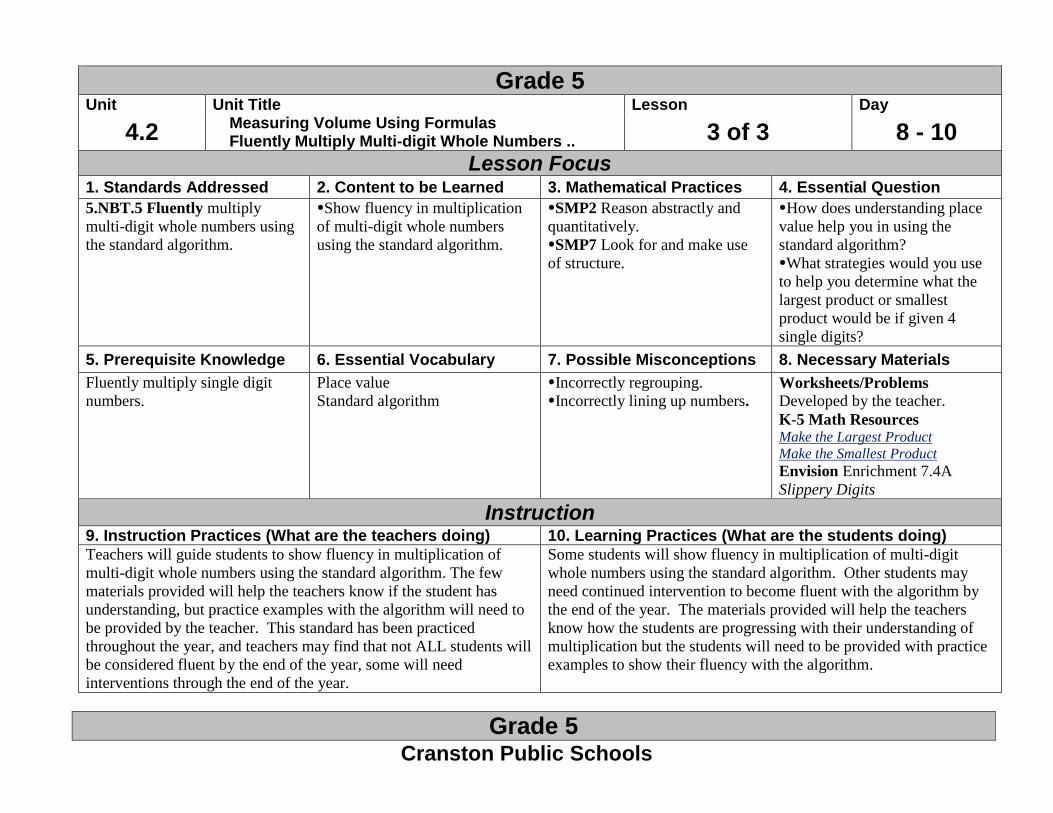
Grade 5 Unit Unit Title Lesson Day
4.2 Measuring Volume Using Formulas Fluently Multiply Multi-digit Whole Numbers .. 3 of 3 8 - 10
Lesson Focus 1. Standards Addressed 2. Content to be Learned 3. Mathematical Practices 4. Essential Question
5.NBT.5 Fluently multiply
multi-digit whole numbers using
the standard algorithm.
Show fluency in multiplication
of multi-digit whole numbers
using the standard algorithm.
SMP2 Reason abstractly and
quantitatively.
SMP7 Look for and make use
of structure.
How does understanding place
value help you in using the
standard algorithm?
What strategies would you use
to help you determine what the
largest product or smallest
product would be if given 4
single digits?
5. Prerequisite Knowledge 6. Essential Vocabulary 7. Possible Misconceptions 8. Necessary Materials
Fluently multiply single digit
numbers.
Place value
Standard algorithm Incorrectly regrouping.
Incorrectly lining up numbers.
Worksheets/Problems
Developed by the teacher.
K-5 Math Resources Make the Largest Product
Make the Smallest Product
Envision Enrichment 7.4A
Slippery Digits
Instruction 9. Instruction Practices (What are the teachers doing) 10. Learning Practices (What are the students doing) Teachers will guide students to show fluency in multiplication of
multi-digit whole numbers using the standard algorithm. The few
materials provided will help the teachers know if the student has
understanding, but practice examples with the algorithm will need to
be provided by the teacher. This standard has been practiced
throughout the year, and teachers may find that not ALL students will
be considered fluent by the end of the year, some will need
interventions through the end of the year.
Some students will show fluency in multiplication of multi-digit
whole numbers using the standard algorithm. Other students may
need continued intervention to become fluent with the algorithm by
the end of the year. The materials provided will help the teachers
know how the students are progressing with their understanding of
multiplication but the students will need to be provided with practice
examples to show their fluency with the algorithm.
Grade 5
Cranston Public Schools
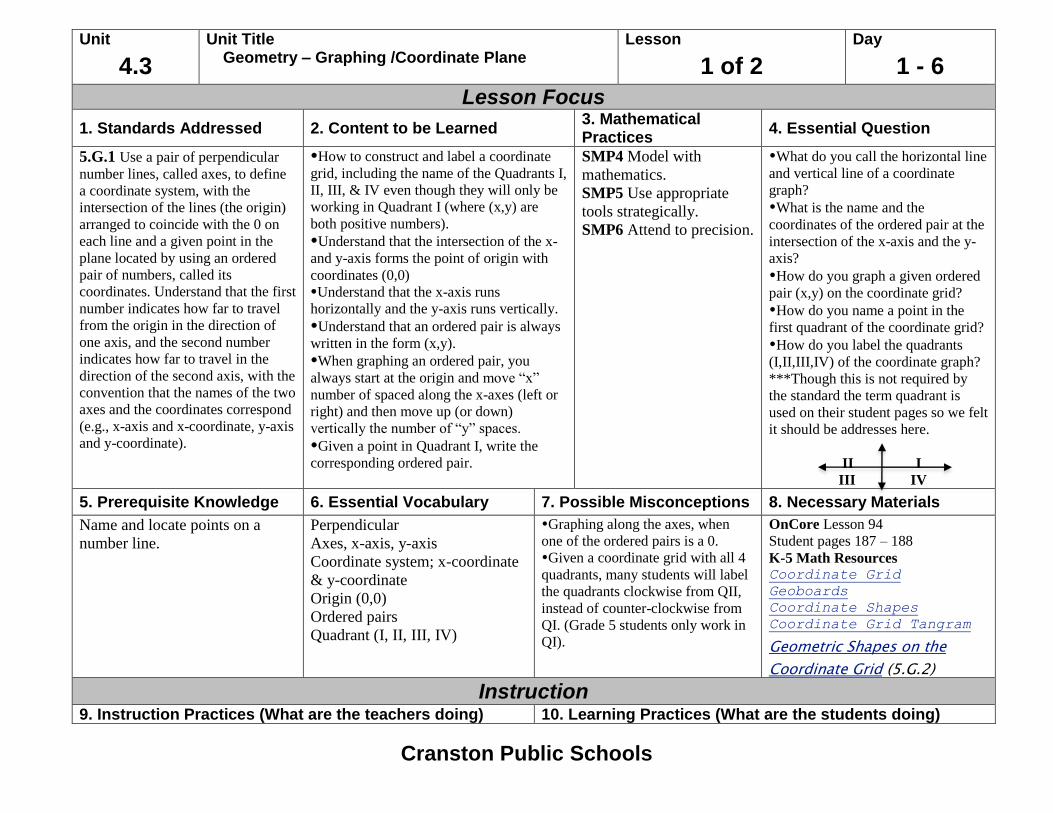
Unit Unit Title Lesson Day
4.3 Geometry – Graphing /Coordinate Plane
1 of 2 1 - 6
Lesson Focus
1. Standards Addressed 2. Content to be Learned 3. Mathematical Practices
4. Essential Question
5.G.1 Use a pair of perpendicular
number lines, called axes, to define
a coordinate system, with the
intersection of the lines (the origin)
arranged to coincide with the 0 on
each line and a given point in the
plane located by using an ordered
pair of numbers, called its
coordinates. Understand that the first
number indicates how far to travel
from the origin in the direction of
one axis, and the second number
indicates how far to travel in the
direction of the second axis, with the
convention that the names of the two
axes and the coordinates correspond
(e.g., x-axis and x-coordinate, y-axis
and y-coordinate).
How to construct and label a coordinate
grid, including the name of the Quadrants I,
II, III, & IV even though they will only be
working in Quadrant I (where (x,y) are
both positive numbers).
Understand that the intersection of the x-
and y-axis forms the point of origin with
coordinates (0,0)
Understand that the x-axis runs
horizontally and the y-axis runs vertically.
Understand that an ordered pair is always
written in the form (x,y).
When graphing an ordered pair, you
always start at the origin and move “x”
number of spaced along the x-axes (left or
right) and then move up (or down)
vertically the number of “y” spaces.
Given a point in Quadrant I, write the
corresponding ordered pair.
SMP4 Model with
mathematics.
SMP5 Use appropriate
tools strategically.
SMP6 Attend to precision.
What do you call the horizontal line
and vertical line of a coordinate
graph?
What is the name and the
coordinates of the ordered pair at the
intersection of the x-axis and the y-
axis?
How do you graph a given ordered
pair (x,y) on the coordinate grid?
How do you name a point in the
first quadrant of the coordinate grid?
How do you label the quadrants
(I,II,III,IV) of the coordinate graph?
***Though this is not required by
the standard the term quadrant is
used on their student pages so we felt
it should be addresses here.
II I
III IV
5. Prerequisite Knowledge 6. Essential Vocabulary 7. Possible Misconceptions 8. Necessary Materials
Name and locate points on a
number line.
Perpendicular
Axes, x-axis, y-axis
Coordinate system; x-coordinate
& y-coordinate
Origin (0,0)
Ordered pairs
Quadrant (I, II, III, IV)
Graphing along the axes, when
one of the ordered pairs is a 0.
Given a coordinate grid with all 4
quadrants, many students will label
the quadrants clockwise from QII,
instead of counter-clockwise from
QI. (Grade 5 students only work in
QI).
OnCore Lesson 94
Student pages 187 – 188
K-5 Math Resources Coordinate Grid
Geoboards
Coordinate Shapes
Coordinate Grid Tangram
Geometric Shapes on the
Coordinate Grid (5.G.2)
Instruction 9. Instruction Practices (What are the teachers doing) 10. Learning Practices (What are the students doing)
Cranston Public Schools
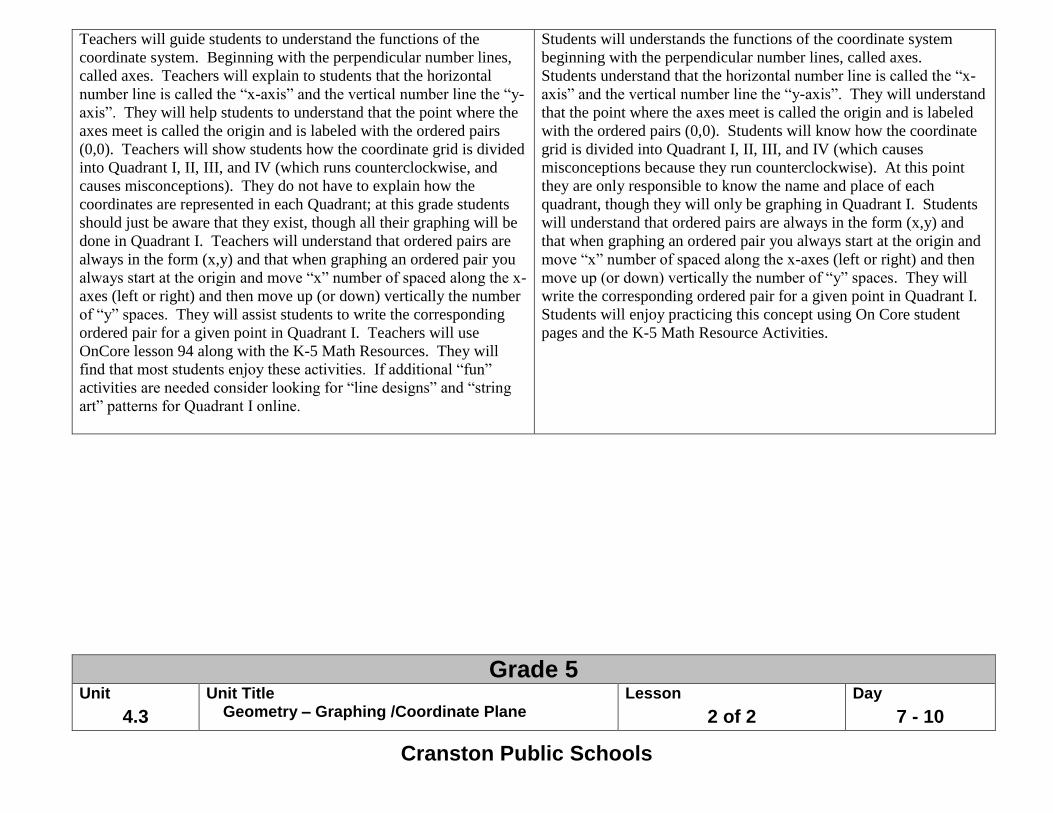
Teachers will guide students to understand the functions of the
coordinate system. Beginning with the perpendicular number lines,
called axes. Teachers will explain to students that the horizontal
number line is called the “x-axis” and the vertical number line the “y-
axis”. They will help students to understand that the point where the
axes meet is called the origin and is labeled with the ordered pairs
(0,0). Teachers will show students how the coordinate grid is divided
into Quadrant I, II, III, and IV (which runs counterclockwise, and
causes misconceptions). They do not have to explain how the
coordinates are represented in each Quadrant; at this grade students
should just be aware that they exist, though all their graphing will be
done in Quadrant I. Teachers will understand that ordered pairs are
always in the form (x,y) and that when graphing an ordered pair you
always start at the origin and move “x” number of spaced along the x-
axes (left or right) and then move up (or down) vertically the number
of “y” spaces. They will assist students to write the corresponding
ordered pair for a given point in Quadrant I. Teachers will use
OnCore lesson 94 along with the K-5 Math Resources. They will
find that most students enjoy these activities. If additional “fun”
activities are needed consider looking for “line designs” and “string
art” patterns for Quadrant I online.
Students will understands the functions of the coordinate system
beginning with the perpendicular number lines, called axes.
Students understand that the horizontal number line is called the “x-
axis” and the vertical number line the “y-axis”. They will understand
that the point where the axes meet is called the origin and is labeled
with the ordered pairs (0,0). Students will know how the coordinate
grid is divided into Quadrant I, II, III, and IV (which causes
misconceptions because they run counterclockwise). At this point
they are only responsible to know the name and place of each
quadrant, though they will only be graphing in Quadrant I. Students
will understand that ordered pairs are always in the form (x,y) and
that when graphing an ordered pair you always start at the origin and
move “x” number of spaced along the x-axes (left or right) and then
move up (or down) vertically the number of “y” spaces. They will
write the corresponding ordered pair for a given point in Quadrant I.
Students will enjoy practicing this concept using On Core student
pages and the K-5 Math Resource Activities.
Grade 5 Unit Unit Title Lesson Day
4.3 Geometry – Graphing /Coordinate Plane 2 of 2 7 - 10
Cranston Public Schools
Lesson Focus
1. Standards Addressed 2. Content to be Learned 3. Mathematical Practices
4. Essential Question
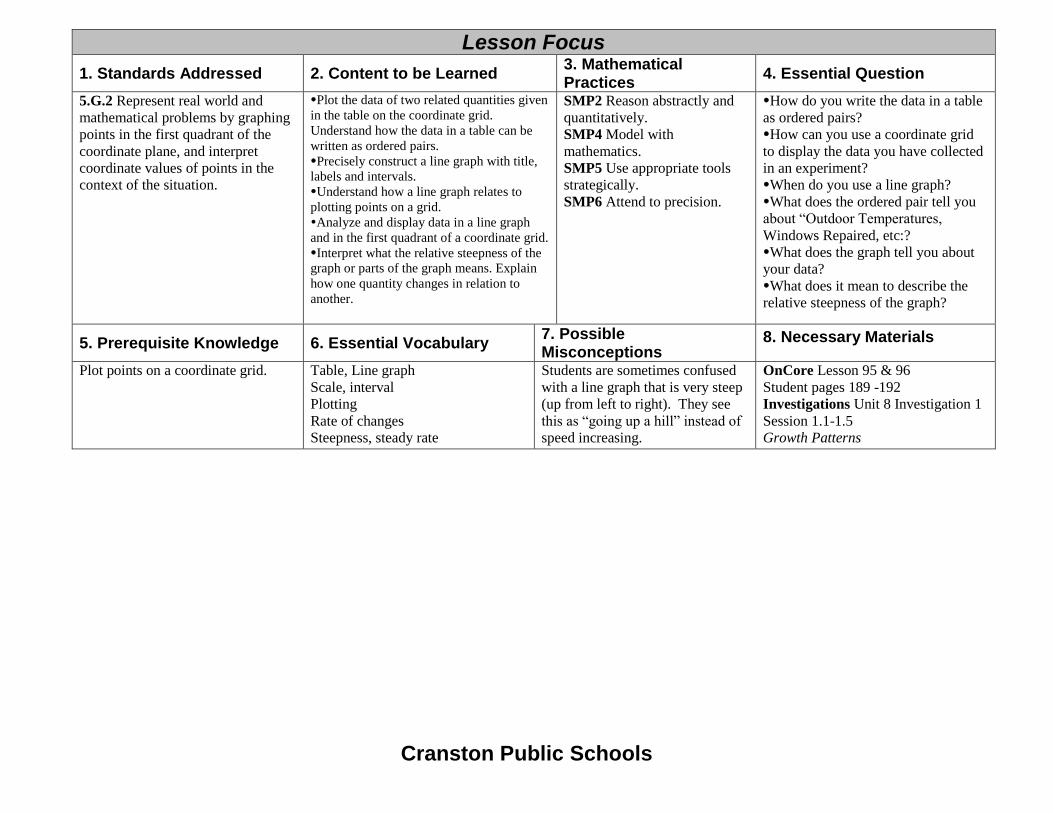
5.G.2 Represent real world and
mathematical problems by graphing
points in the first quadrant of the
coordinate plane, and interpret
coordinate values of points in the
context of the situation.
Plot the data of two related quantities given
in the table on the coordinate grid.
Understand how the data in a table can be
written as ordered pairs.
Precisely construct a line graph with title,
labels and intervals.
Understand how a line graph relates to
plotting points on a grid.
Analyze and display data in a line graph
and in the first quadrant of a coordinate grid.
Interpret what the relative steepness of the
graph or parts of the graph means. Explain
how one quantity changes in relation to
another.
SMP2 Reason abstractly and
quantitatively.
SMP4 Model with
mathematics.
SMP5 Use appropriate tools
strategically.
SMP6 Attend to precision.
How do you write the data in a table
as ordered pairs?
How can you use a coordinate grid
to display the data you have collected
in an experiment?
When do you use a line graph?
What does the ordered pair tell you
about “Outdoor Temperatures,
Windows Repaired, etc:?
What does the graph tell you about
your data?
What does it mean to describe the
relative steepness of the graph?
5. Prerequisite Knowledge 6. Essential Vocabulary 7. Possible Misconceptions
8. Necessary Materials
Plot points on a coordinate grid. Table, Line graph
Scale, interval
Plotting
Rate of changes
Steepness, steady rate
Students are sometimes confused
with a line graph that is very steep
(up from left to right). They see
this as “going up a hill” instead of
speed increasing.
OnCore Lesson 95 & 96
Student pages 189 -192
Investigations Unit 8 Investigation 1
Session 1.1-1.5
Growth Patterns
Cranston Public Schools
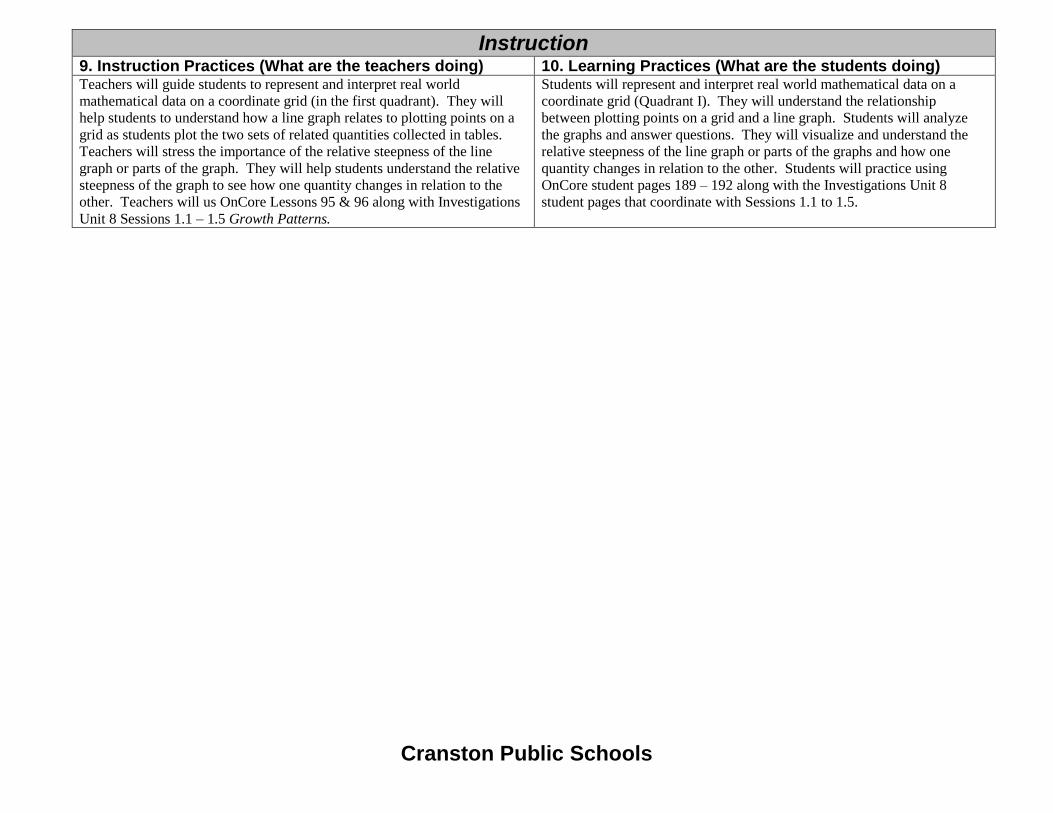
Instruction 9. Instruction Practices (What are the teachers doing) 10. Learning Practices (What are the students doing) Teachers will guide students to represent and interpret real world
mathematical data on a coordinate grid (in the first quadrant). They will
help students to understand how a line graph relates to plotting points on a
grid as students plot the two sets of related quantities collected in tables.
Teachers will stress the importance of the relative steepness of the line
graph or parts of the graph. They will help students understand the relative
steepness of the graph to see how one quantity changes in relation to the
other. Teachers will us OnCore Lessons 95 & 96 along with Investigations
Unit 8 Sessions 1.1 – 1.5 Growth Patterns.
Students will represent and interpret real world mathematical data on a
coordinate grid (Quadrant I). They will understand the relationship
between plotting points on a grid and a line graph. Students will analyze
the graphs and answer questions. They will visualize and understand the
relative steepness of the line graph or parts of the graphs and how one
quantity changes in relation to the other. Students will practice using
OnCore student pages 189 – 192 along with the Investigations Unit 8
student pages that coordinate with Sessions 1.1 to 1.5.
Cranston Public Schools
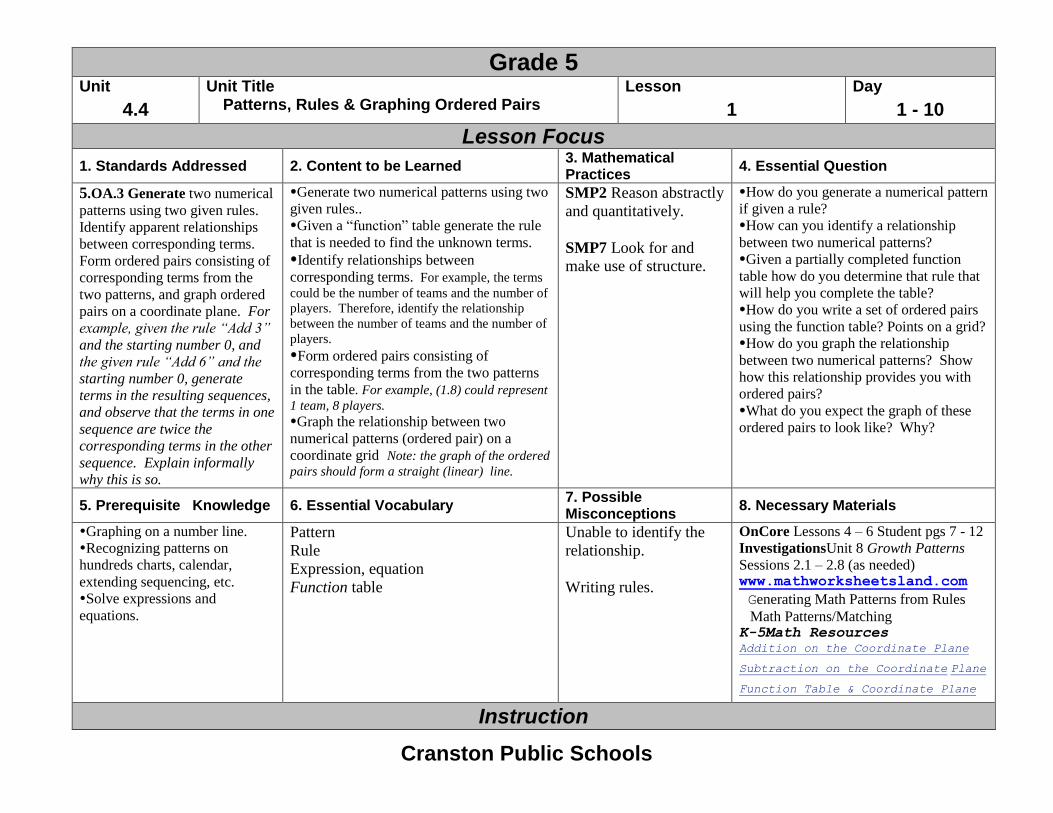
Grade 5 Unit Unit Title Lesson Day
4.4 Patterns, Rules & Graphing Ordered Pairs 1 1 - 10
Lesson Focus
1. Standards Addressed 2. Content to be Learned 3. Mathematical Practices
4. Essential Question
5.OA.3 Generate two numerical
patterns using two given rules.
Identify apparent relationships
between corresponding terms.
Form ordered pairs consisting of
corresponding terms from the
two patterns, and graph ordered
pairs on a coordinate plane. For
example, given the rule “Add 3”
and the starting number 0, and
the given rule “Add 6” and the
starting number 0, generate
terms in the resulting sequences,
and observe that the terms in one
sequence are twice the
corresponding terms in the other
sequence. Explain informally
why this is so.
Generate two numerical patterns using two
given rules..
Given a “function” table generate the rule
that is needed to find the unknown terms.
Identify relationships between
corresponding terms. For example, the terms
could be the number of teams and the number of
players. Therefore, identify the relationship
between the number of teams and the number of
players. Form ordered pairs consisting of
corresponding terms from the two patterns
in the table. For example, (1.8) could represent
1 team, 8 players.
Graph the relationship between two
numerical patterns (ordered pair) on a
coordinate grid Note: the graph of the ordered
pairs should form a straight (linear) line.
SMP2 Reason abstractly
and quantitatively.
SMP7 Look for and
make use of structure.
How do you generate a numerical pattern
if given a rule?
How can you identify a relationship
between two numerical patterns?
Given a partially completed function
table how do you determine that rule that
will help you complete the table?
How do you write a set of ordered pairs
using the function table? Points on a grid?
How do you graph the relationship
between two numerical patterns? Show
how this relationship provides you with
ordered pairs?
What do you expect the graph of these
ordered pairs to look like? Why?
5. Prerequisite Knowledge 6. Essential Vocabulary 7. Possible Misconceptions
8. Necessary Materials
Graphing on a number line.
Recognizing patterns on
hundreds charts, calendar,
extending sequencing, etc.
Solve expressions and
equations.
Pattern
Rule
Expression, equation
Function table
Unable to identify the
relationship.
Writing rules.
OnCore Lessons 4 – 6 Student pgs 7 - 12
InvestigationsUnit 8 Growth Patterns
Sessions 2.1 – 2.8 (as needed) www.mathworksheetsland.com
Generating Math Patterns from Rules
Math Patterns/Matching K-5Math Resources Addition on the Coordinate Plane
Subtraction on the Coordinate Plane
Function Table & Coordinate Plane
Instruction
Cranston Public Schools
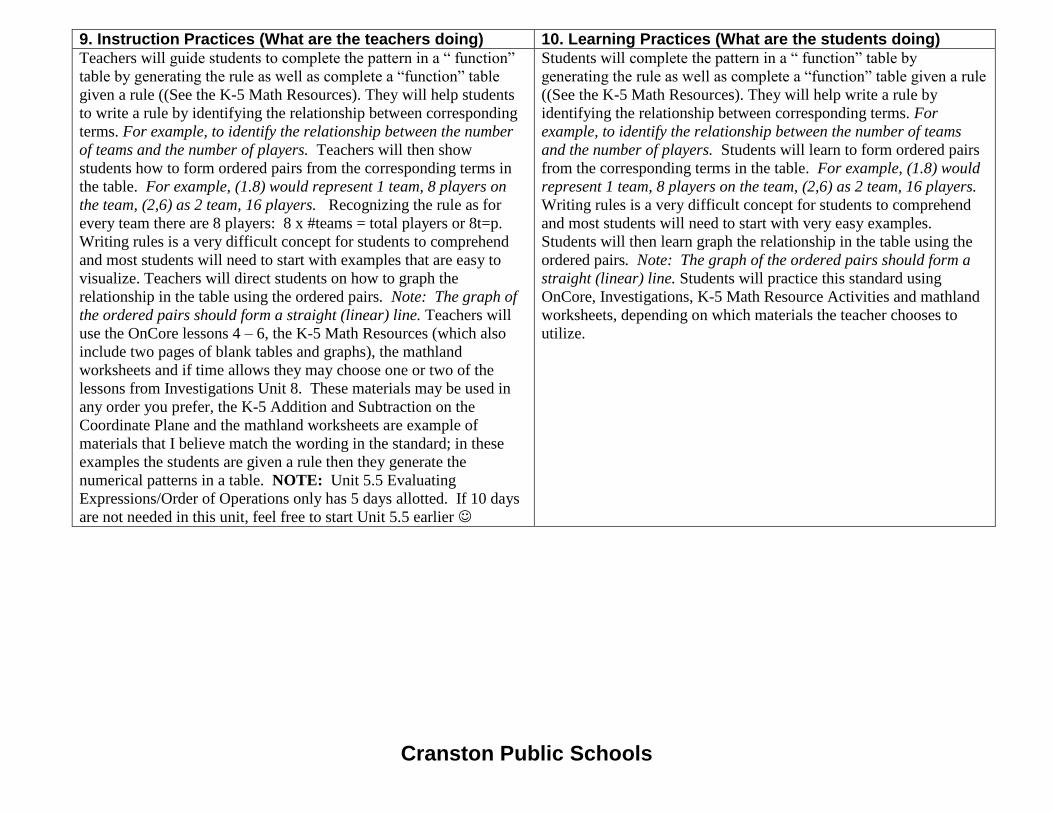
9. Instruction Practices (What are the teachers doing) 10. Learning Practices (What are the students doing) Teachers will guide students to complete the pattern in a “ function”
table by generating the rule as well as complete a “function” table
given a rule ((See the K-5 Math Resources). They will help students
to write a rule by identifying the relationship between corresponding
terms. For example, to identify the relationship between the number
of teams and the number of players. Teachers will then show
students how to form ordered pairs from the corresponding terms in
the table. For example, (1.8) would represent 1 team, 8 players on
the team, (2,6) as 2 team, 16 players. Recognizing the rule as for
every team there are 8 players: 8 x #teams = total players or 8t=p.
Writing rules is a very difficult concept for students to comprehend
and most students will need to start with examples that are easy to
visualize. Teachers will direct students on how to graph the
relationship in the table using the ordered pairs. Note: The graph of
the ordered pairs should form a straight (linear) line. Teachers will
use the OnCore lessons 4 – 6, the K-5 Math Resources (which also
include two pages of blank tables and graphs), the mathland
worksheets and if time allows they may choose one or two of the
lessons from Investigations Unit 8. These materials may be used in
any order you prefer, the K-5 Addition and Subtraction on the
Coordinate Plane and the mathland worksheets are example of
materials that I believe match the wording in the standard; in these
examples the students are given a rule then they generate the
numerical patterns in a table. NOTE: Unit 5.5 Evaluating
Expressions/Order of Operations only has 5 days allotted. If 10 days
are not needed in this unit, feel free to start Unit 5.5 earlier
Students will complete the pattern in a “ function” table by
generating the rule as well as complete a “function” table given a rule
((See the K-5 Math Resources). They will help write a rule by
identifying the relationship between corresponding terms. For
example, to identify the relationship between the number of teams
and the number of players. Students will learn to form ordered pairs
from the corresponding terms in the table. For example, (1.8) would
represent 1 team, 8 players on the team, (2,6) as 2 team, 16 players.
Writing rules is a very difficult concept for students to comprehend
and most students will need to start with very easy examples.
Students will then learn graph the relationship in the table using the
ordered pairs. Note: The graph of the ordered pairs should form a
straight (linear) line. Students will practice this standard using
OnCore, Investigations, K-5 Math Resource Activities and mathland
worksheets, depending on which materials the teacher chooses to
utilize.
Cranston Public Schools
Grade 5 Unit Unit Title Lesson Day
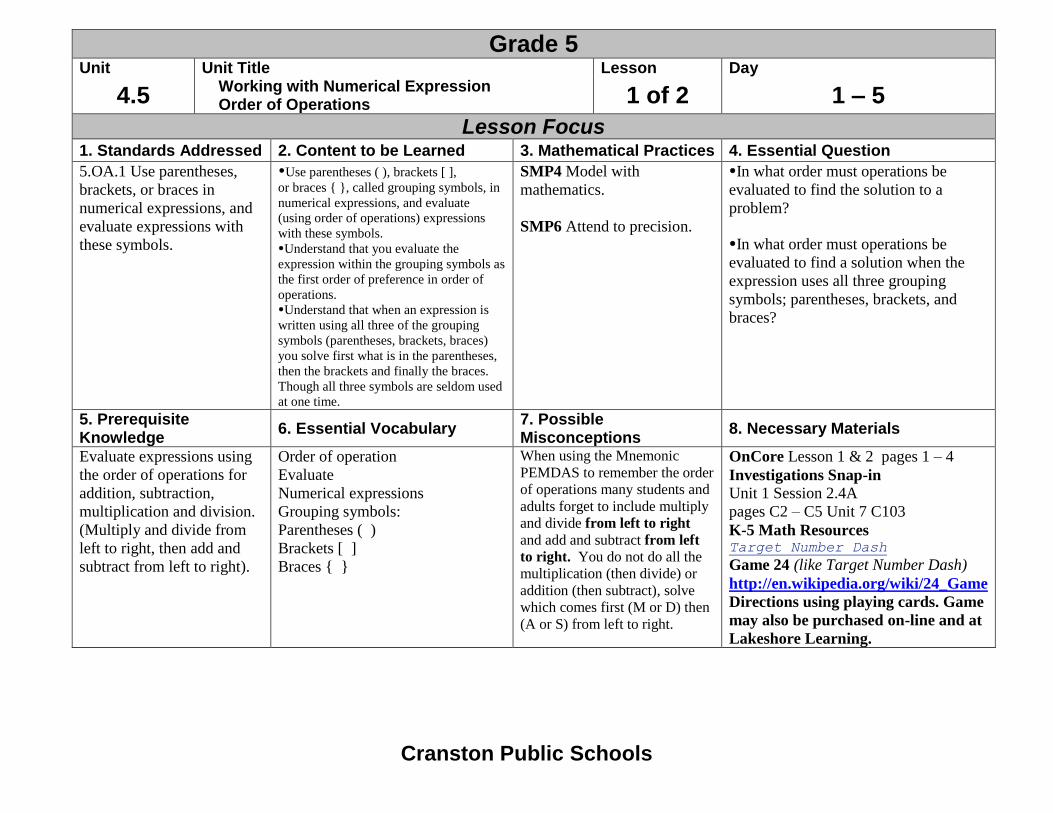
4.5 Working with Numerical Expression Order of Operations 1 of 2 1 – 5
Lesson Focus 1. Standards Addressed 2. Content to be Learned 3. Mathematical Practices 4. Essential Question
5.OA.1 Use parentheses,
brackets, or braces in
numerical expressions, and
evaluate expressions with
these symbols.
Use parentheses ( ), brackets [ ],
or braces { }, called grouping symbols, in
numerical expressions, and evaluate
(using order of operations) expressions
with these symbols.
Understand that you evaluate the
expression within the grouping symbols as
the first order of preference in order of
operations.
Understand that when an expression is
written using all three of the grouping
symbols (parentheses, brackets, braces)
you solve first what is in the parentheses,
then the brackets and finally the braces.
Though all three symbols are seldom used
at one time.
SMP4 Model with
mathematics.
SMP6 Attend to precision.
In what order must operations be
evaluated to find the solution to a
problem?
In what order must operations be
evaluated to find a solution when the
expression uses all three grouping
symbols; parentheses, brackets, and
braces?
5. Prerequisite Knowledge
6. Essential Vocabulary 7. Possible Misconceptions
8. Necessary Materials
Evaluate expressions using
the order of operations for
addition, subtraction,
multiplication and division.
(Multiply and divide from
left to right, then add and
subtract from left to right).
Order of operation
Evaluate
Numerical expressions
Grouping symbols:
Parentheses ( )
Brackets [ ]
Braces { }
When using the Mnemonic
PEMDAS to remember the order
of operations many students and
adults forget to include multiply
and divide from left to right
and add and subtract from left
to right. You do not do all the
multiplication (then divide) or
addition (then subtract), solve
which comes first (M or D) then
(A or S) from left to right.
OnCore Lesson 1 & 2 pages 1 – 4
Investigations Snap-in
Unit 1 Session 2.4A
pages C2 – C5 Unit 7 C103
K-5 Math Resources Target Number Dash
Game 24 (like Target Number Dash)
http://en.wikipedia.org/wiki/24_Game
Directions using playing cards. Game
may also be purchased on-line and at
Lakeshore Learning.
Cranston Public Schools
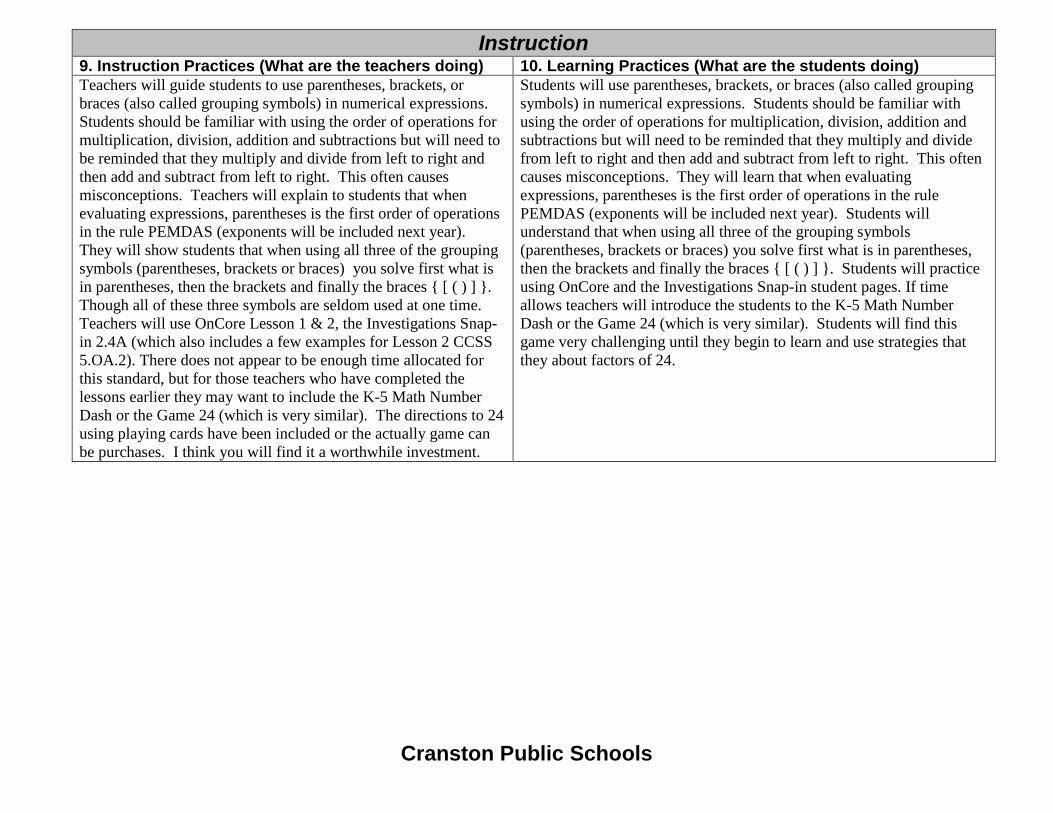
Instruction 9. Instruction Practices (What are the teachers doing) 10. Learning Practices (What are the students doing)
Teachers will guide students to use parentheses, brackets, or
braces (also called grouping symbols) in numerical expressions.
Students should be familiar with using the order of operations for
multiplication, division, addition and subtractions but will need to
be reminded that they multiply and divide from left to right and
then add and subtract from left to right. This often causes
misconceptions. Teachers will explain to students that when
evaluating expressions, parentheses is the first order of operations
in the rule PEMDAS (exponents will be included next year).
They will show students that when using all three of the grouping
symbols (parentheses, brackets or braces) you solve first what is
in parentheses, then the brackets and finally the braces { [ ( ) ] }.
Though all of these three symbols are seldom used at one time.
Teachers will use OnCore Lesson 1 & 2, the Investigations Snap-
in 2.4A (which also includes a few examples for Lesson 2 CCSS
5.OA.2). There does not appear to be enough time allocated for
this standard, but for those teachers who have completed the
lessons earlier they may want to include the K-5 Math Number
Dash or the Game 24 (which is very similar). The directions to 24
using playing cards have been included or the actually game can
be purchases. I think you will find it a worthwhile investment.
Students will use parentheses, brackets, or braces (also called grouping
symbols) in numerical expressions. Students should be familiar with
using the order of operations for multiplication, division, addition and
subtractions but will need to be reminded that they multiply and divide
from left to right and then add and subtract from left to right. This often
causes misconceptions. They will learn that when evaluating
expressions, parentheses is the first order of operations in the rule
PEMDAS (exponents will be included next year). Students will
understand that when using all three of the grouping symbols
(parentheses, brackets or braces) you solve first what is in parentheses,
then the brackets and finally the braces { [ ( ) ] }. Students will practice
using OnCore and the Investigations Snap-in student pages. If time
allows teachers will introduce the students to the K-5 Math Number
Dash or the Game 24 (which is very similar). Students will find this
game very challenging until they begin to learn and use strategies that
they about factors of 24.
Cranston Public Schools
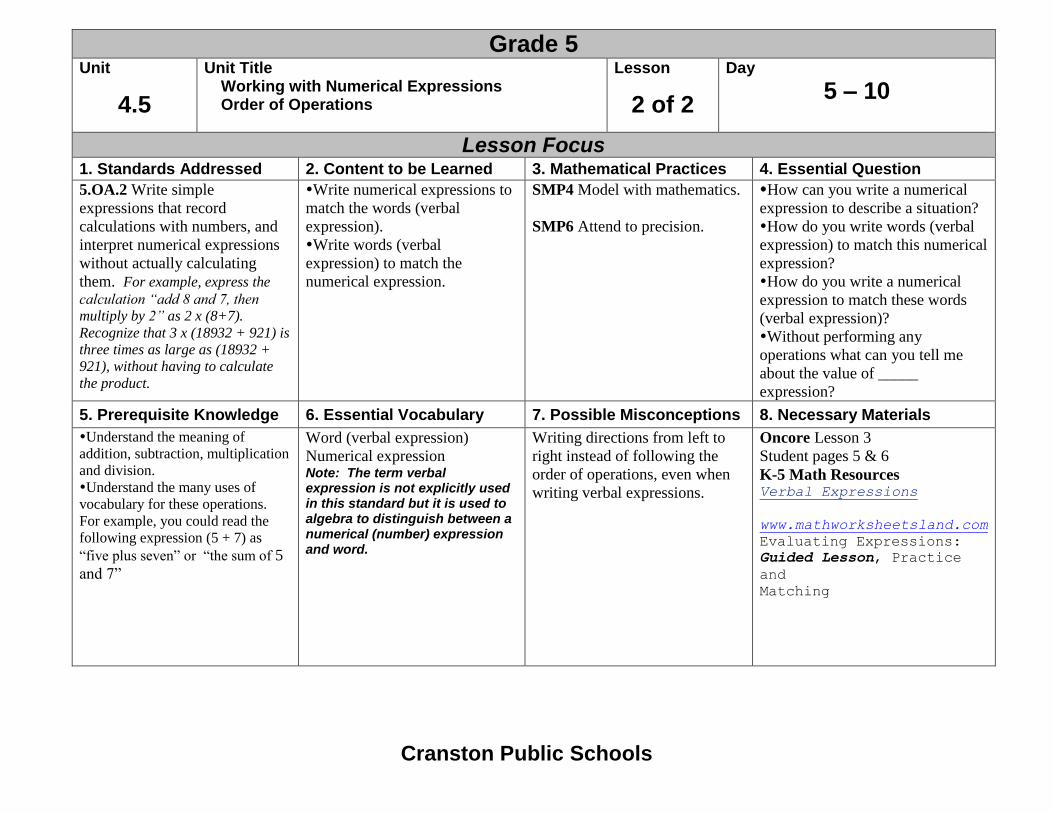
Grade 5 Unit Unit Title Lesson Day
4.5 Working with Numerical Expressions Order of Operations 2 of 2
5 – 10
Lesson Focus 1. Standards Addressed 2. Content to be Learned 3. Mathematical Practices 4. Essential Question
5.OA.2 Write simple
expressions that record
calculations with numbers, and
interpret numerical expressions
without actually calculating
them. For example, express the
calculation “add 8 and 7, then
multiply by 2” as 2 x (8+7).
Recognize that 3 x (18932 + 921) is
three times as large as (18932 +
921), without having to calculate
the product.
Write numerical expressions to
match the words (verbal
expression).
Write words (verbal
expression) to match the
numerical expression.
SMP4 Model with mathematics.
SMP6 Attend to precision.
How can you write a numerical
expression to describe a situation?
How do you write words (verbal
expression) to match this numerical
expression?
How do you write a numerical
expression to match these words
(verbal expression)?
Without performing any
operations what can you tell me
about the value of _____
expression?
5. Prerequisite Knowledge 6. Essential Vocabulary 7. Possible Misconceptions 8. Necessary Materials
Understand the meaning of
addition, subtraction, multiplication
and division.
Understand the many uses of
vocabulary for these operations.
For example, you could read the
following expression (5 + 7) as
“five plus seven” or “the sum of 5
and 7”
Word (verbal expression)
Numerical expression Note: The term verbal expression is not explicitly used in this standard but it is used to algebra to distinguish between a numerical (number) expression and word.
Writing directions from left to
right instead of following the
order of operations, even when
writing verbal expressions.
Oncore Lesson 3
Student pages 5 & 6
K-5 Math Resources Verbal Expressions
www.mathworksheetsland.com
Evaluating Expressions:
Guided Lesson, Practice
and
Matching
Cranston Public Schools
Instruction 9. Instruction Practices (What are the teachers doing) 10. Learning Practices (What are the students doing)
Teachers will guide students to write simple expressions that record
calculations with numbers, and interpret numerical expressions
without actually calculating them. They will help students to write
numerical expressions to match the words (verbal expressions; term
used in algebra but not required here) and to write words (verbal
expressions) to match a numerical expression. Teachers will direct
students to understand the many uses of vocabulary for the
operations. For example you can read (5+7) as “five plus seven” or
“the sum of 5 and 7”. Teachers should read the Guided Lesson that
is included from www.mathworksheetsland.com before instructing
this lesson. They will gain an understanding of how to read an
expression that is in parentheses, remembering that the parentheses
tells you to you complete that operations (find the sum, difference,
product or quotient) before moving onto the next operation when
solving an expression. Teachers will use OnCore, they may refer
back to some of the Investigations student pages in Lesson 1 (CCSS
5.OA.1), the K-5 Math Resource and the Practice and Matching
page that has been included form www.mathworksheetsland.com.
Please note, more time will need to be considered for this unit for
next year. Only 5 days *has been allocated.
Students will write simple expressions that record calculations with
numbers, and interpret numerical expressions without actually
calculating them. They will learn to write numerical expressions that
match words (verbal expressions) and visa versa to write words (verbal
expressions) that match a numerical expression. Students will be
aware of the different vocabulary that is used to define the four
mathematical operations. They will gain an understanding of how to
read an expression that is in parentheses remembering that the
parentheses tells you to complete that operation first (find the sum,
difference, product or quotient) before moving onto the next operation
when solving an expression. They will practice this standard using
OnCore, K-5 Math Resources and the practice and matching pages
from www.mathworksheetsland.com as provided by their teachers and
time allows.