Embed Size (px)
Citation preview
UNIVERSITI PUTRA MALAYSIA
ECONOMICS OF INTEGRATED FISH-CHICKEN FARMING SYSTEM (LONGYAM) IN TASIKMALAYA DISTRICT,
INDONESIA
AMlE KUSUMAWARDHANI
FEP 1991 8
ECOROKICS OF INTEGRATED FISH-CHICKER FARKIRG SYSTEK (LORGYAX) IR TASIKKALAYA DISTRICT,
INDONESIA
By
AXlE KUSUMAVARDHlRI
Thesis Submitted in Partial Fulf ilment of the Requirements for the Degree of Kaster of Science
in the Faculty of Economics and Kanagement Universiti Pertanian Kalaysia
March 1991

Dedicated with love t o :
my l a t e father , Soemardi Darmoatmodj o , my late mother , Titi Koelj ati ,
my grandmother , my sis ters , my brothers
ii
ACKNOWLEDGEMENT
Thanks to the almighty God "Al lah s . w . t . " without Whose
blessing this s t udy would not have been pos s ible .
I a m d e e p l y g r a t e f u l t o m y l a t e p a r e n t s w h o h a d
s p l endour ed m e w i t h und i vided l o v e and a t t e n t i o n t h a t h a v e
always been t h e driving f orce f o r me , giving m e s tr ength and
guidance .
I would also l ike t o express my sincere appreciation and
thanks to the chairman of my supervisory commi t t ee , Prof . Dr .
Mohd . Ariff Hussein for his guidance and advise throughout the
preparat ion of this thesis .
I wish to ext end my s incere gratitude t o my
supervisory commi t tee members : Dr . Syed Kadir Long Alsagoff f or
his valuable comments and supervision in data collec tion , and
Dr . Eddie Chiew Fook Chong for his sugges t ions , encouragements
and endless pat ience in complet ing this work .
My s incere appreciat ion is expressed t o :
Internat ional Development Research Centr e ( IDRC ) f or
providing me a two-year mas t eral degree fellowship
Univers i t as Diponegoro ( UNDIP ) , par ticularly Fakultas
Ekonomi UNDIP , Semarang , Indones i a , for giving me a s t udy
leave
iii
Dr Nik Mus tapha Raj a Abdul lah and Mr . Kapi Sudar f or
t h e i r r e s pons i b i l i t y i n adm i n i s t e r i n g t h e UPM- I DRC
Fellowship Award .
All lecturers at the Faculty of Economic s and Management ,
Univers i t i Pertanian Malaysia for providing me much
knowledge and guidance throughout my study in pur suing
Master Degree in Fisheries Economics .
Tasikmalaya District Fisheries Service , especially Pak
Yudi Nugraha f or providing the secondary data r equired .
Pak Talim , Pak Dadang , Pak Deden , Pak ling Sahidin , Pak
Gunawan , I r . Moh . Hus s ein S. also Drh . Tuty Mardianti and
Ir Moh . Yanuar for useful assis t ance in data collect ion .
I am very grateful to my grandmother , my s i s ters and my
brothers f o r t h e i r b l e s s i ng s a n d r em a r k a b l e m o r a l s u p p o r t
during my s t udy .
To my best friend , Noor Aziah Zakari a , l owe her special
thanks for helping and accompanying me dur ing those t imes of
needs. Thanks also due to my f r i ends : Alias , Bang Mat Lani ,
Mas Poeng , Pak Mohar i , Pak Rakhman , Rode l , Indah , Tun, and many
o thers for sharing the knowledge and valuable help during my
s t udy . Their friendliness and thought f ulness will be
remembered .
iv
TABLE OF CONTENTS
Page
ACKNOWLEDGEMENT S . . . . • . . . . . . . . . . . . . . . . . . . . . . • . . . • • . . ii i
LI ST OF TABLES . . . . . . . . . . . . . . . . . . . . . . . . . . . . . . . . . . . . . ix
LIST OF FIGURES xiv
LIST OF PLATES . . . . . . . . . . • . . . . . . . . . . . . . . . . . . . . . . . . . . xv
ABSTRACT . . . . . . . . . . . . . . . . . . . . . . . . . . . . . . . . . . . . . . . . . . . xvi
ABSTRAK
CHAPTER
I
II
III
xviii
INTRODUCTION . . . . . . . . . . . . . . . . . . . . . . . . . • . . . 1
Background . . . . . . . . . . . . . . . . . . . . . • . . . . . • . . . 1
General Features o f Fi sherie s in Indon e s i a . . . . . . . . . . . . . . . . . . . . . . . . . . . . . . . . 3
Import ance and Advantage of IF - CFS 11
Fish Cu lture i n the District of Tas i kmal aya . . . . . . . . . . . . . . . . . . . . . . . . . . . . . . 16
Statement o f the Problem . . • . . . • • . • • • • • • • • 2 2
Objectives o f the Study 2 4
REVIEW OF LITERATURE 26
Studies on Integrated Fish Farming Sys tem . . . . • . . • . . . . . • . . . • . . . . . . . . • . . . . • . • . 26
Studies Using Linear Programming 3 5
CONCEPTS , DEFINITION AND METHODS 44
Concept o f Costs and Returns . . . • . . . • . . . . . 44
Development of Linear Programming . • • • . • . . 47
v
IV
V
The Linear Programming Model . . . .. . . . . . . . . 49
Sensitivity Analysis . . . . . . • . . . . • . • . . 5 6 Parametric Programming . . . . • . . . . . . • . . 5 8
Data Col lection 60
Sampling and Sample Size . . . . . • . . • • . . 60 The Survey . . . . . . . . . . . . . . . . . . . . . • . • . . 62
SOCIO-ECONOMIC PROFILE OF LONGYAM FARMERS AND THEIR MANAGEMENT PRACTICES . . . . . . • . • • . . . . • . • • . . • . . . . . . . • . . • 64
Characteristics of Longyam Farmers . . . • • . • 64
Age Distribution • • • • . . . . . • . . . . . . • • . . 64 Educational Status . . . . • • . . . . . . . . . . • . 67 Experience . . . . . . . . • . . • • • . . • . • . . . • . . . 6 8 Sources of Longyam Knowledge . • . • . . . . 69 Type o f Enterprise . . . . . . • . . . • . . . . . . . 69 Occupation . • . . . • • . . . . • . . . . . . . . . . . . . . 69 Sources of Longyam Finance . . . . . . • . . . 71
Longyam Management Practices • • • . . • . . . . . . . 74
Fish Culture Practices . . . . . • • . . . . . . . 74 Chicken Raising Practices . . . . • • . . . . . 8 0
ANALYSIS OF COSTS AND RETURNS . . . . • • . • . • . . 85
Costs , Revenues and Profitability o f the Fish CuI ture . . . . . . . . . . . . • • • • . . . . . . . . . . . . . 86
Costs , Revenues and Profitability of the Chicken Enterprise . . . . . . . . . . . . . . . . . . . . . . . 97
Gros s Revenue , Total Net Income of Longyam
Expenses and 109
Gross revenue of Longyam . . . • • • • • • • • • 109 Total Expenses of Longyam • • . • . • • • • . • 110 Net Income of Longyam • . . . • • • • . • • • • • 114
vi
VI
VII
MODEL SPECIFICATION FOR LONGYAM . . • . . . • . • • 117
Real Activities . . . . . . . . . . . • . . . • . . . . . . . . . . 119
Fish • • . . . . . . • • . . . . . . . . • . . . . • . . . . . . • . . 119 Chicken . . . . . . . . . . . . . . • . . . . • . . . • . • • . . . 1 2 3
Disposal Activities . . . . . . . . • . . . . . . . . . . . . . 125
Hired Labour Activities . . . . . . . . . . . • . . 125 Borrowed Capital activities . . . . . . . . . . 126 Cash Trans f er Activities . . . . . . . . . . . . . 1 2 7
Restrictions . . . . . . . . . • . . . . . . . . • . . . . . . . . . . 128
Land Restrictions . . . . . . . . . . • . . . . . . . • 128 Capital Restrictions . . . . . • . . . . . . . • . . 129 Labour Restrictions . . . . . . . . . . . . . • • . . 129 Production Restrictions • . • . . . • . . . . . . 130
The Aggregated Model . . . . . . . . . . . . . . . . . • . . . 1 3 2
OPTIMAL L INEAR PROGRAMMING RESULTS . . . . • . . 13 5
Small Farms . . . . . . . . .. . . . . . . . . . . . . . . . . . . . . 1 3 7
Optimal Solution o f Longyam Operation . . . . • . . . . . . . . . . . . . . . . . . • . . . 13 7 Use of Resources in Optimal Solution • . . . • • . . . . • . • . . • . . . . . • . . . . . . 141
Medium Farms
Optimal Solution of Longyam
147
Operation . . . . • • . • • • . . . . . . . . . . . • • . • . . 147 Use of Resources in Optimal Solution . . . . . . . . . . . . . . . . . . . . . . . . • . . . 152
Large Farms . . . • • . . . . . . . • . . . . . . . . . . . . . . . . . 157
Optimal Solution o f Longyam Operation • • . • . . . . . . . . . . • . • . . . . . . . . . . 1 5 7 Use of Resources in Optimal �"lution . . • . • . . . . . . . . . . • • • . . . . • . . • . . 161
Sensitivity Analysis ( Postoptimality Analysis ) • • • . • . . . . . • . . • • . . . . . . . . . . • • • . . . . 166
Range of Optimality ... .. ...... ...... 166 Range of Feasibility ....... .... ... .. 177
vii
VIII
IX
Comparison Between Existing Practice and Optimal Plan . . . . • • • . . . . . . . . . . . • . . . . . . 1 8 9
Smal l Farms . . . . . • . . . . . • • . . . . . • • . . . . . 1 8 9 Medium Farms . . • . . . . . . • . . . . . . . . . . . . . . 195 Large Farms . . . . . . . . . . . . . . . . . . . . . . . . . 1 9 8
PROGRAMMING WITH VARIABLE CAPITAL RESOURCE CONSTRAINT . . . . . . . . . • . . . . . . . . . . . • 201
Smal l Farms . . . . . . . . . . . . . . . . . . . . . . . . . . • . . . 203
Medium Farms . . . . . . . . • . . . . . . . . . . • . . . . • . . . . 207
Large Farms . . . . . . . . . . . . . . . • . . . . . . . • . . . • . . 2 1 2
SUMMARY , CONCLUSIONS AND POLICY IMPLICATIONS . . . . . . . . . . . . . . • . . . . . . . . . . . . . . 218
Summary and Conclusions • . • . . . . . • . . • . . . • . • 218
S ocio-economic Profile and Longyam Management Practices • • . • . . • . • • • • . • • . 2 1 8 Analysis of Costs and Returns . • • . . • . 2 2 0 Results of Analysis Using LP Model . . 2 21 Programming with Variable Constraints . • . . . . . . . . . • . . • . . . . • . . . . . 2 24
Policy Implications . . . • . . . . . . . . . . . . . . . • . • 2 2 5
Limitation of the Present Study . . . . . . . . . . 2 2 8
BIBLIOGRAPHY . . . . . . . . . . . . . . . . . . . . . . . • • • . . . . . . . . . . . . . 2 3 0
APPENDICES 2 3 5
A Figures . . . . • . . . . . . . . . . . . . . • . . . . . • . • . 2 3 5
B Tables . . . . • • . • • • . • • • • • . • • • • • • • . • • • • • 238
C Plate . • . . . . . • • . . . . . . . . . . . . • . . . . . . . • . 260
BIOGRAPHICAL SKETCH . . . . . . . . . . . . . . . . . . . . . . . . . . . . . . . . 2 6 2
viii
Table
1
2
3
4
5
6
7
8
9
10
1 1
1 2
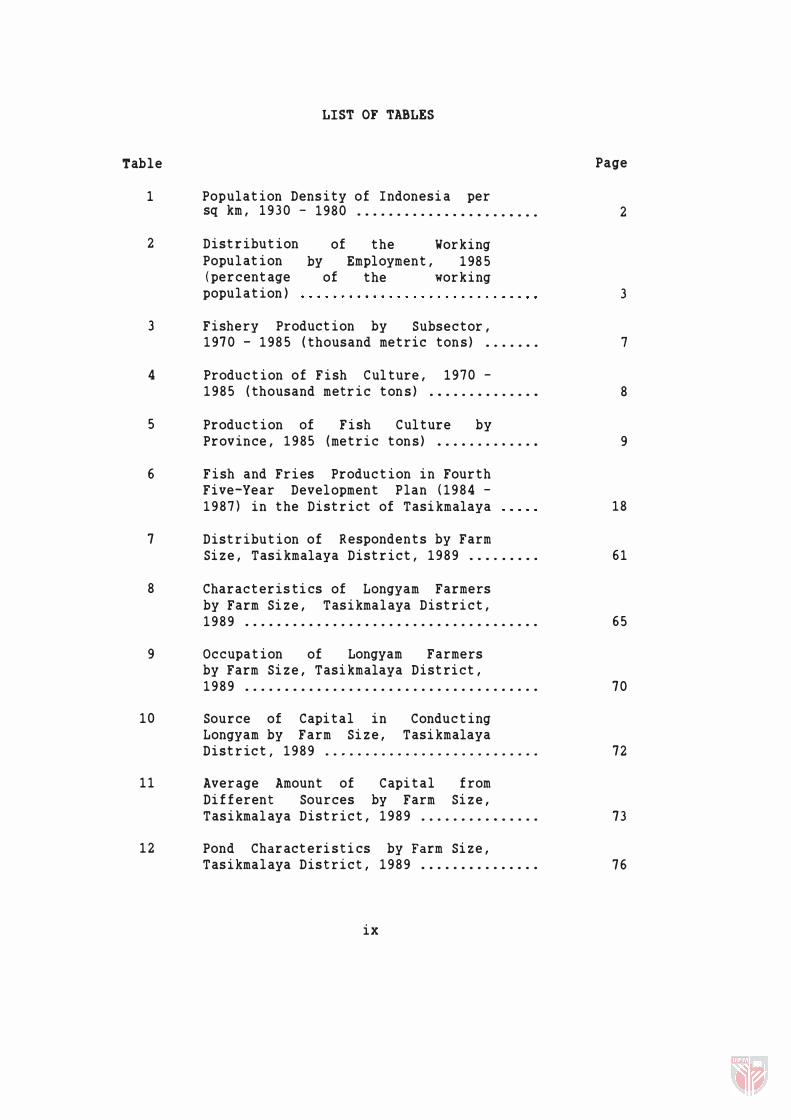
LIST OF TABLES
Population Density of Indonesia per sq km , 1 9 3 0 - 1980 . . . . . . . . . . . . . • . • . . . • . . .
Distribution Population ( percentage population )
of by
of
the Working Employment , 1 985
the working
Fishery Production by Subsector , 1 970 - 1 985 (thousand metric ton s ) . . . . . • .
Production of Fish Culture , 1970-1 985 (thousand metric ton s ) . • . . . . • . . . . . . •
Production of Fish Culture by Province , 1 9 85 (metric ton s ) • . . • . . . . . . . . .
Fish and Fries Production in Fourth Five-Year Devel opment P lan ( 19 8 4 -1 9 8 7 ) in the District of Tasikmalaya
Distribution of Respondents by Farm Size , Tasikmalaya District , 1 9 8 9 . . . . . . . . .
Characteristics of Longyam Farmers by Farm Size , Tasikmalaya District , 1 9 8 9 . . . . . . . . . . . . . . . . . . . . . . . . . . . . . • . . . . . . .
occupation of Longyam Farmers by Farm Size , Tasikmalaya District , 1 9 8 9 . . . . . . • . . . . . . . . . . . . . . . . . . . . . . . . . . . . . •
Source of Capital in Conducting Longyam by Farm Size , Tasikmalaya District , 1 9 8 9 . . • . . . . . . . . . . . . . . . . . . . . . . . .
Average Amount of Capital from Different Sources by Farm Size , Tasikmalaya District , 1 9 8 9 . . . . . . . . . • . . . . .
Pond Characteris tics by Farm Size , Tasikmalaya Dis tric t , 1 9 8 9 • . . . . . . . . . . . . . •
ix
Page
2
3
7
8
9
18
6 1
65
70
72
73
76
1 3
14
15
1 6
1 7
18
19
20
21
2 2
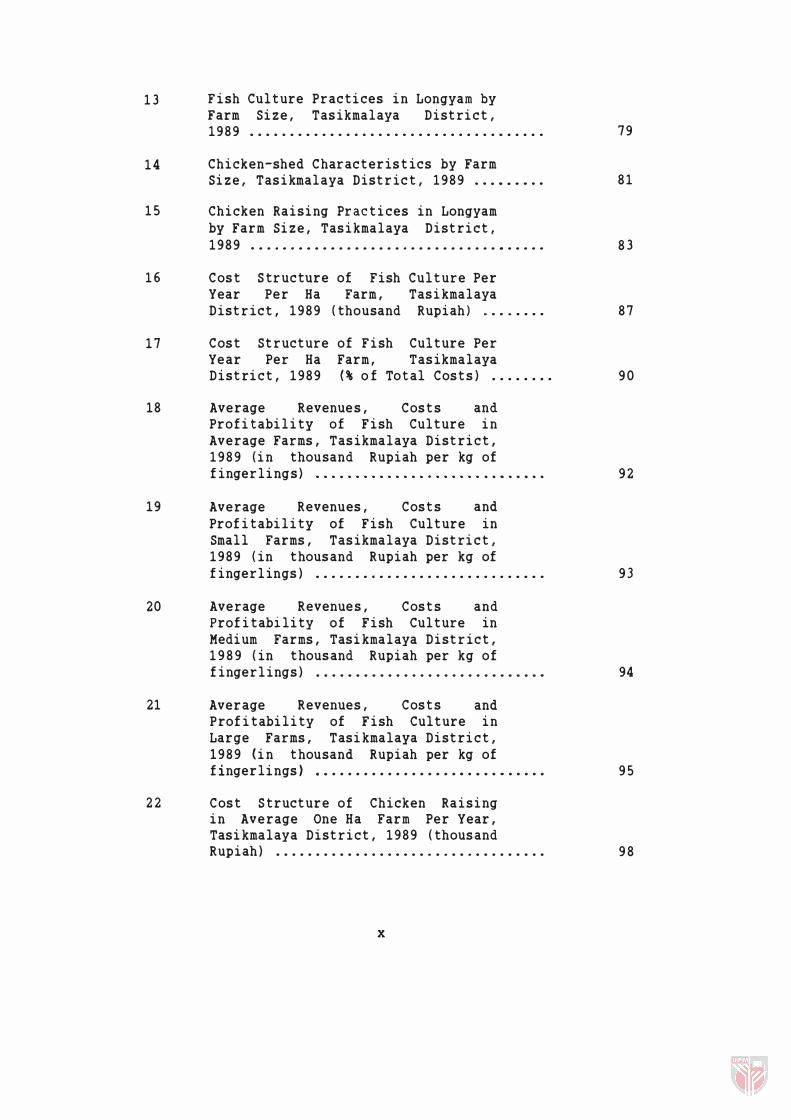
Fish Culture Practices in Longyam by Farm Size , Tasikmalaya District , 1 9 8 9 . . . . . . . . . . . . . . . . . . . . . . . . . . . . . . . . . . . . .
Chicken-shed Characteristics by Farm Size , Tasikmalaya District , 1 9 8 9 . . . • . . . . .
Chicken Raising Practices in Longyam by Farm Size , Tasikmalaya District , 1 9 8 9 . . . . . . . . . . . . . . . . . . . . . . . . . . . . . . . • . . . . .
Cost Structure of Fish Culture Per Year Per Ha Farm , Tasikmalaya District , 1 9 8 9 ( thousand Rupiah ) . ... ... .
Cost Structure of Fish Culture Per Year Per Ha Farm , Tasikmalaya District , 1 9 8 9 (% o f To t al Costs ) ....... .
Average Revenues , Costs and Profitability of Fish Culture in Average Farms , Tasikmalaya District , 1 9 8 9 (in thousand Rupiah per kg of fingerling s ) . . . • . . . . . . . . . . • . . . . . . . . • . . • . .
Average Revenues , Costs and Profitability of Fish Culture in Small Farms , Tasikmalaya District , 1 9 8 9 ( in thous and Rupiah per kg of finger lings ) ..... ....................... .
Average Revenues , Costs and Profitability of Fish Culture in Medium Farms , Tasikmalaya District , 1 9 8 9 ( in thous and Rupiah per kg of fingerlings ) ............................ .
Average Revenues , Costs and Profitability of Fish Culture in Large Farms , Tasikmalaya District , 1 9 8 9 (in thousand Rupiah per kg of fingerlings) . • . . . . . . . . . . . . . . . . • . • . . • . . . . .
Cost Structure of Chicken Raising in Average One Ha Farm Per Year , Tasikmalaya District , 1 9 8 9 ( thous and Rupiah ) .................... .. ... ........ .
x
7 9
8 1
8 3
8 7
9 0
9 2
93
94
95
9 8
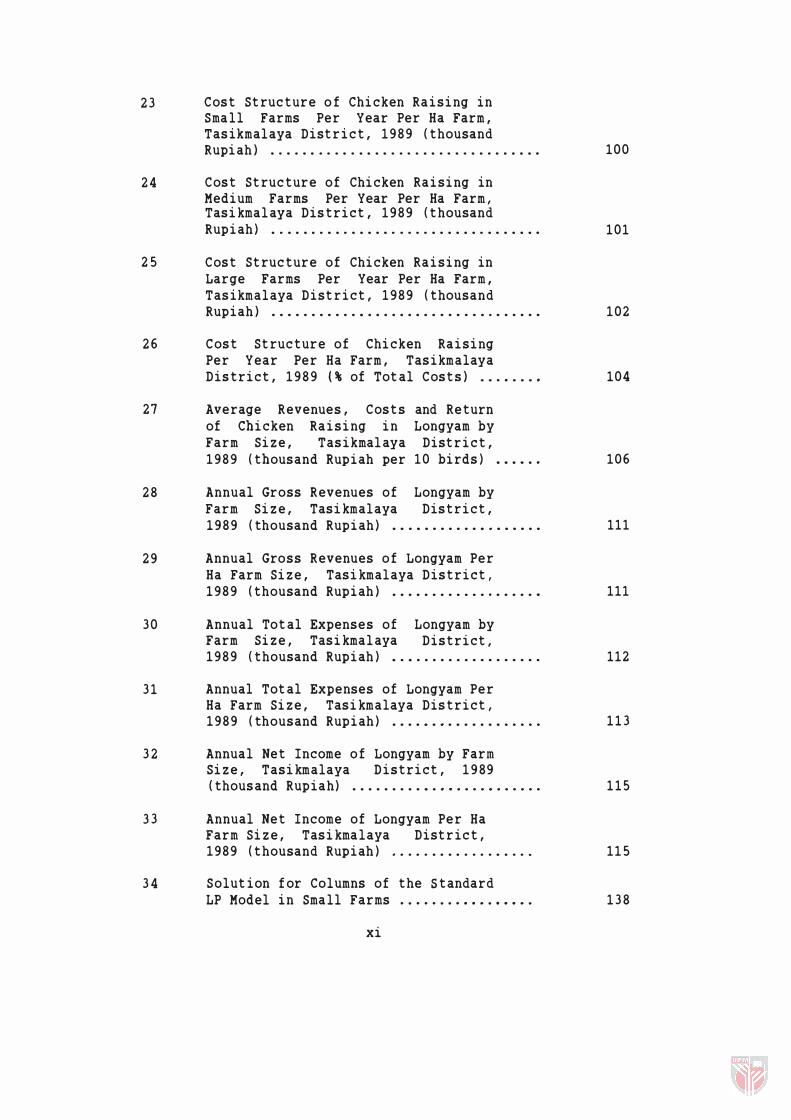
2 3
2 4
2 5
2 6
27
2 8
2 9
30
3 1
3 2
3 3
3 4
Cost Structure o f Chicken Raising in Sma l l Farms Per Year Per Ha Farm , Tasikmal aya District , 1 9 8 9 ( thousand Rupiah ) . . . . . . ... . . . . . . .... . . .. . . . . . . . . . . .
Cost Structure of Chicken Raising in Medium Farms Per Year Per Ha Farm , Tasikmal aya District , 1 9 8 9 ( thousand Rupiah ) . . . . . . . . . . . . . . . ..... . . . . . . . . . . . . . .
Cost Structure of Chicken Raising in Large Farms Per Year Per Ha Farm , Tasikmal aya District , 1 9 8 9 ( thousand Rupiah ) . . . . . . . . . . . • . . . . . . . . . . . . . . . . . . . . . .
Cost Structure of Chicken Raising Per Year Per Ha Farm , Tasikmalaya District , 1 9 8 9 (% of Total Costs ) . . . . . . . •
Average Revenues , Costs of Chicken Raising in Farm Size , Tasikmal aya 1 9 8 9 ( thousand Rupiah per
and Return Longyam by
District , 10 birds ) . . . • . .
Annual Gross Revenues of Longyam by Farm Size , Tasikmal aya District , 1 9 8 9 ( thousand Rupiah ) . . . • . . . . . . . • • . . . . . .
Annual Gross Revenues o f Longyam Per Ha Farm Size , Tasikmal aya District, 1 9 8 9 ( thousand Rupiah ) . . . . . . . . . . . . . . . . . . •
Annual Total Expenses of Longyam by Farm Size , Tasikmal aya District , 1 9 8 9 ( thousand Rupiah ) • . • . . . . . . . . . . . . . . . .
Annual Total Expenses of Longyam Per Ha Farm Size , Tasikmalaya District , 1 9 8 9 ( thousand Rupiah ) . . . . • . • . . . . . . . . . . . .
Annual Net Income o f Longyam by Farm Size , Tasikmalaya District , 1 9 89 ( thous and Rupiah) . . . . . . . . . • . • • . . . . • . . . . . .
Annual Net Income of Longyam Per Ha Farm Size , Tasikma l aya District , 1989 ( thousand Rupiah ) . .... . . . . .... . . .. .
Solution f or Columns of the Standard LP Model in Sma l l Farms . . . . . . . . . . • . . . . • .
xi
100
101
102
104
106
111
111
112
1 1 3
1 15
115
1 3 8
3 5
3 6
3 7
3 8
3 9
4 0
4 1
4 2
43
44
45
46
47
48
49
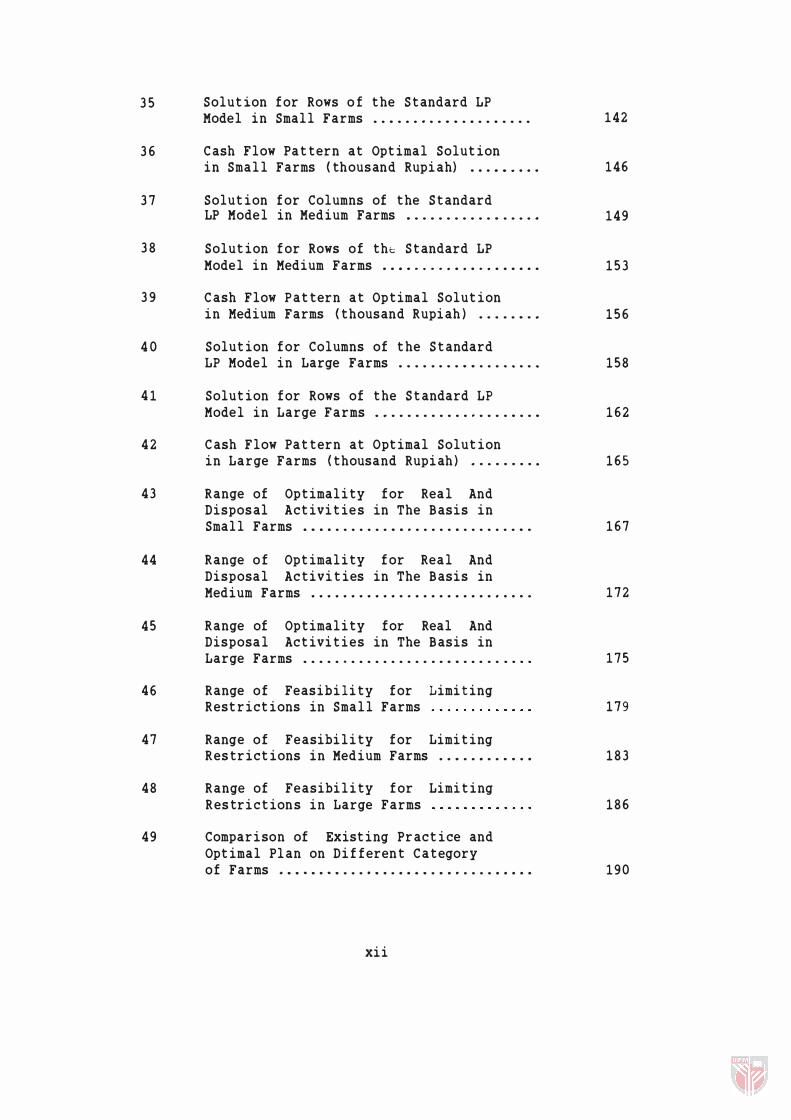
Solution for Rows of the Standard LP Model in Small Farms . . • . . . . . . • • . . . . • . . . .
Cash Flow Pattern at Optimal Solution in Small Farms ( thousand Rupiah) . . . • • . . . .
Solution for Columns of the Standard LP Model in Medium Farms . . . . . . . . . . . • . . . . •
Solution for Rows of the Standard LP Model in Medium Farms . . • . . . . . . . . . . . . . . . . .
Cash Flow Pattern at Optimal Solution in Medium Farms ( thousand Rupiah ) . . . . . • . •
Solution for Columns of the Standard LP Model in Large Farms . . . . . . . . • • . . . • • . . •
Solution for Rows of the Standard LP Model in Large Farms . • . . . . . . . . . . . . . . . • . . •
Cash Flow Pattern at Optimal Solution in Large Farms ( thousand Rupiah) • . . . . . . . .
Range of Optimality for Real And Disposal Activitie s in The Basis in Small Farms . • . . . . . . . . . • . . . . . . . . . . . . . . . • .
Range of Optimality for Real And Disposal Activities in The Basis in Medium Farms . . . . . . . . . . . . . . . . . . . . . . . . . . . .
Range of Optimality for Real And Disposal Activities in The Basis in Large Farms . . . . . . . . . . . . . . . . . . • • . . . . . . . . .
Range of Feasibility for Restrictions in Small Farms
Limiting
Range of Feasibility for Limiting Restrictions in Medium Farms . . • . . . . . • • . .
Range of Feasibility for Restrictions in Large Farms
Limiting
Comparison of Existing Practice and Optimal Plan on Different Category of Farms • • • • • . • • . . . • • . . . . • • . • . . . . . . . . . . .
xii
142
146
149
1 5 3
1 5 6
1 5 8
1 6 2
1 6 5
1 6 7
1 7 2
1 7 5
1 7 9
1 8 3
1 8 6
190
50
51
5 2
5 3
54
Employment in the Existing Practice and Optimal Plan in Small Farms . • . . . . . • .
Employment in the Existing Practice and Optimal Plan in Medium Farms • . . . . . . .
Employment of the Existing Practice and Optimal Plan in Large Farms . . . . . . . . .
Optimal Solution at Various Level of Total Borrowed Capital in Small Farms . . . . . . . . . . . . . . . . . . . . . . . . . . . • . . . . . . .
Resource Use at Optimal Solution at Various Level of Total Borrowed Capital in Small Farms . . . . . . . . . . . . . • . . . .
5 5 Optimal Solution at Various Level of Total Borrowed Capital in Medium
5 6
Farms . . . . . . . . . . . . . . . . . . . . . . . . . . . . . . . . . . .
Resource Use at Optimal Solution at Various Level of Total Borrowed Capital in Medium Farms . . . . . . . . . . . . . . . . .
57 Optimal Solution at Various Level of Total Borrowed Capital in Large
5 8
5 9
60
6 1
62
6 3
6 4
Farms . . . . . . . . . . . . . . . . . . . . . . . . . . . . . . . . . . .
Resource Use at Optimal Solution at Various Level of Total Borrowed Capital in Large Farms . . . . . . . . . . . . . • . . . .
Real Activities in the Tasikmalaya District , 1 9 8 9
L P Model ,
Disposal Activities in the LP Model , Tasikmalaya District , 1 9 8 9 . . . . . . . . . . . . . .
Res t r i c t ions in the St andard LP Hode I .................................. .
LP Matrix for Small Farms . . . . . . . . . . . . . . .
LP Matrix for Medium Farms . . . . . . . . . . . . . . .
LP Matrix for Large Farms . . . . . . . . . . . . . . . .
xiii
194
197
199
204
206
208
210
213
2 1 5
2 3 9
240
241
242
248
2 54
Figure
1
2
3
4
5
LIST OF FIGURES
Diagramatic Representat ion of the Breakdown of Chicken Manure in Fish Pond and I t s Nutr ient Pathways in Polycul ture . . . . . . . . . . . . . . . . . . . . • . . . . . . . . . . .
Diagrama t ic Representat ion o f I nt egrated Fish-Chicken Farming Syst em . . . . . . . . . . . . . . . . . . . . . . . . . . . . . . . . . . . . •
Area of Longyam , Tasikmalaya District , 198'1 ............................ .
Map of Java I s land Showing the Locat ion of the St udy area . • . • . . . . . . . . . . . • . . . . . . . . . .
Arrangement Sys tem o f Batt eries in Chicken-Shed . . . . . . . . . . • . . . . . . . . . . . . . . . . .
xiv
Page
14
15
21
2 3 6
2 3 '1
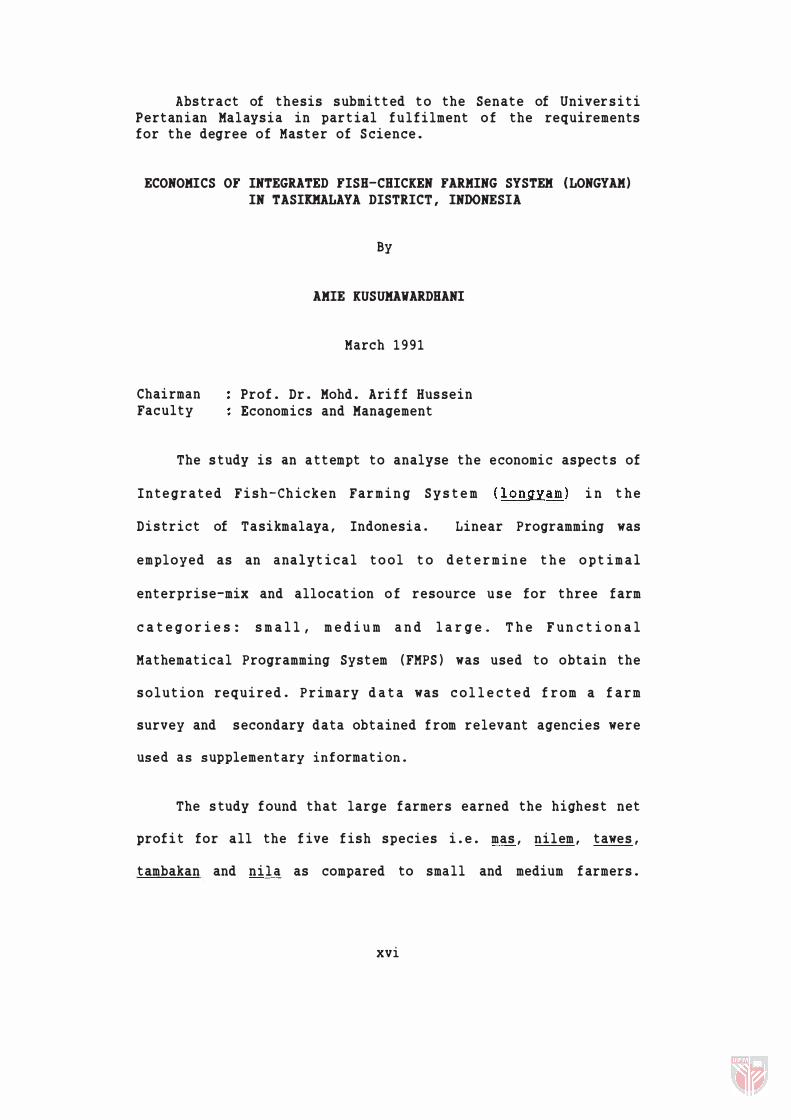
Abs tract of thesis submi t t ed t o the Senat e of Univer s i t i Pertan ian Malays i a in par t ial f u l f i lment o f the requirements for the degree of Mas ter of S cience .
ECONOMICS OF INTEGRATED FISH-CHICKEN FARKING SYSTEK (LONGYAK) IN TASIKKALAYA DISTRICT, INDONESIA
Chai rman Faculty
By
AKIE KUSUKAVARDHANI
March 1 9 9 1
Prof . Dr . Mohd . Ari f f Hus sein Economics and Management
The s tudy is an a t t empt to analyse the economi c aspec t s of
I n t e g r a t e d F i sh-Ch i c k e n Far m i n g S y s t e m ( l o ngyam ) i n t h e
District of Tasikmalaya , Indonesia . Linear Programming was
employed as an analyt i c a l t o o l t o d e t e r m i n e t h e o p t i m a l
ent erprise-mix and allocat ion o f resource u s e for three farm
c a t e g o r i e s: s m a l l , m e d i u m a n d l a r g e . T h e F u n c t i o n a l
Mathemat ical Programming Syst em ( FMPS ) was used to obtain the
s o l u t ion requi r e d . Pr imary d a t a was c o l l e c t e d f r om a f a r m
survey and s econdary data obt ained f rom relevant agencies were
used as supplement ary information .
The s tudy found that large farmers earned the highes t net
prof i t for all the f ive f ish species i . e . mas , ni l em , tawes ,
tambakan and nit� as compared to sma l l and medium f armers .
xvi
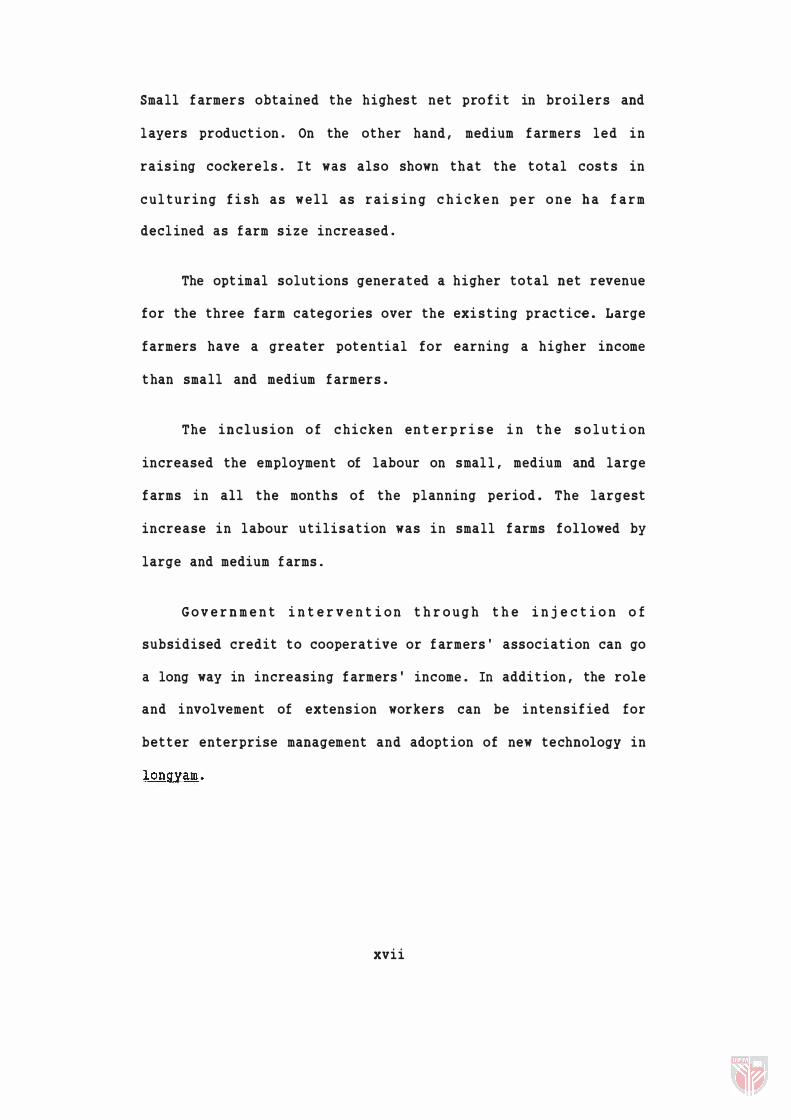
Small f armer s obtained the highes t net pro f i t in broilers and
layers product ion . On the other hand , medium f armers led in
rais ing cockerels . I t was also shown that the total cos t s in
c u l t u r ing f i sh as w e l l as r a i s i n g c h i c k e n p e r o n e h a f a r m
decl ined as f arm size increased .
The opt imal solut ions generated a higher total net revenue
for the three f arm categories over the exi s t ing prac t ice . Large
farmers have a greater pot ential for earning a higher income
t han small and medium f armers .
The i n c l u s ion o f chicken en t e r p r i s e i n t h e s o l u t i on
increased the employment of labour on smal l , medium and large
f arms in all the months of the planning period . The largest
increase in labour u t i l i s a t ion was in small f arms fol lowed by
large and medium f arms .
G o v e r n m e n t i n t e r v e n t i o n t h r o u g h t h e i n j e c t i o n o f
subsidised credit to cooperat ive or f armers ' associat ion can go
a long way in increasing f armers' income . In addi t ion , the role
and involvement of extens ion workers can be intensif ied for
bet t er enterprise management and adopt ion of new technology in
longyam .
xvii
Abs trak tes i s yang dikemukakan kepada Senat Universiti Pert anian Mal ays i a sebagai memenuhi sebahagian daripada syarat untuk Ijazah Mas t er Sai ns.
KEPENTINGAN EKONOHI SISTEH PERLADANGAN IKAN-AYAH (LONGYAH) BERSEPADU DI DAERAH TASIKHALAYA, INDONESIA
Pengeru s i Faku l t i
Oleh
AHIE KUSUHAWARDHANI
Mac 1991
Prof . Dr . Mohd . Arif f Hus s e i n Ekonomi dan Pengurusan
Kajian ini adalah satu percubaan untuk mengan a l isis aspek
ekonomi l ongyam (Si stem Perladangan Ikan-Ayam Bersepadu) di
Daerah Ta s i kma l aya , In d o n e s i a . P e m p rogr a m a n l i n e a r t e l a h
digunakan sebagai a l a t untuk menentukan gabungan bidangusaha-
bidangusaha dan peng agihan s u m b e r yang o p t im u m b a gi t i g a
kategori ko lam: kecil, sederhana d a n besar . Pakej komputer FMPS
(Funct ional Mathematlcal Programming System) digunakan untuk
mendapatkan penyelesaian yang diperlukan. Dat a primer yang
diperlukan didapati daripada banc i an ladang. Un tuk melengkapkan
maklumat , data sekundar diperolehi dari agensi-agensi yang
berkai tan .
Kaj ian i ni mendapa t i petani yang mengusahakan kolam dalam
kat egori besar memperolehi pendapa t an bers ih yang tertinggi
bagi kes emua l ima jenis ikan , iai tu mas , nilem, t awes , t ambakan
xviii
dan nila berbanding dengan pengusaha kolam bersaiz keeil dan
sederhana . Petani dalam kat egori keeil memperolehi keuntungan
b e r s ih yang t i nggi d a l am pent e r n a k a n a y a m d a g i n g d a n ayam
telur , sementara pengus aha kolam bersaiz s ederhana memperoleh i
pul angan yang t inggi bagi ternakan ayam pejantan . Kaj ian j uga
menunj ukkan j umlah kos te rnakan i kan s ehektar sebagaimana dalam
t ernakan ayam menurun dengan peningkatan saiz kolam .
Penye lesaian opt imum menghas ilkan j umlah pul angan bersih
yang lebih tinggi bagi ket iga-t iga kategor i kolam dibandingkan
dengan amalan masakini . Potensi untuk memperolehi pendapatan
yang t inggi adalah besar bagi petani yang mengusahakan kolam
bersaiz besar .
Pemi l ihan t ernakan ayam di dalam penyel esaian opt imum ,
meningkat kan gun a tenaga buruh bagi kesemua kategori kolam dan
tempoh masa peraneangan . Peningkatan penggunaan buruh yang
t inggi berlaku bagi kebun bersaiz kec i l , diikuti oleh kolam
bersaiz besar dan s ederhana .
Campur tangan pemerintah melalui subs idi kredit kepada
koperasi atau pertubuhan pel adang dijangka boleh meningkat kan
pendapatan pe tani . Selanj utnya peni ngkatan akt iviti-akt iviti
pengembangan , j uga oleh pemer intah dij angka boleh memban tu
pet ani menggunakan teknologi baru di dalam pengusahaan longyam .
xix
CHAPTER I
IBTRODUCTIOB
B ackground
I ndon e s i a i s t h e l ar g e s t a r ch i p e l a g o i n t h e wo r l d. I t
comprises of f ive ma j or i s l ands and more than 13 , 000 smaller
one s . The f i v e m a i n is l ands a r e S u m a t e r a , J av a - M a du r a ,
Kal imantan , Sul awes i and I rian Jaya. Altogether about 6 , 000
islands are inhabi ted .
The archipelago is on a crossroad between two oceans , the
Pacific and the Indian oceans , and bridges two cont inents , Asia
and Aus tralia. Th is unique pos i t ion has a great inf luence on
the evolution of the cul tural , social , pol i t i cal and economic
l i f e of the people in the count ry.
The area of the Republic of Indonesia is e s t ima t ed at
5 , 19 3,250 sq km which embr aces a l and territ ory of 2 , 0 27 , 087 sq
km and a sea t e r r i t ory of 3 , 1 6 6 , 1 6 3 sq k m ( D e p a r t m e n t o f
Informat ion, Indones i a , 1989 ) . A s the i s lands o f Indonesia l i e
along t h e equator , h e r cl imate and weather a r e characterised by
the two t ropical s easons , name ly the dry and the rainy s easons .
The dry s eason i s b e t w e e n Apr i l a n d O c t o b e r a n d t he r a i ny
s e a s o n i s b e t w e e n N o v e m b e r a n d M a r c h , w i t h t h e
heaviest r ainfa l l during December and January .
1
2
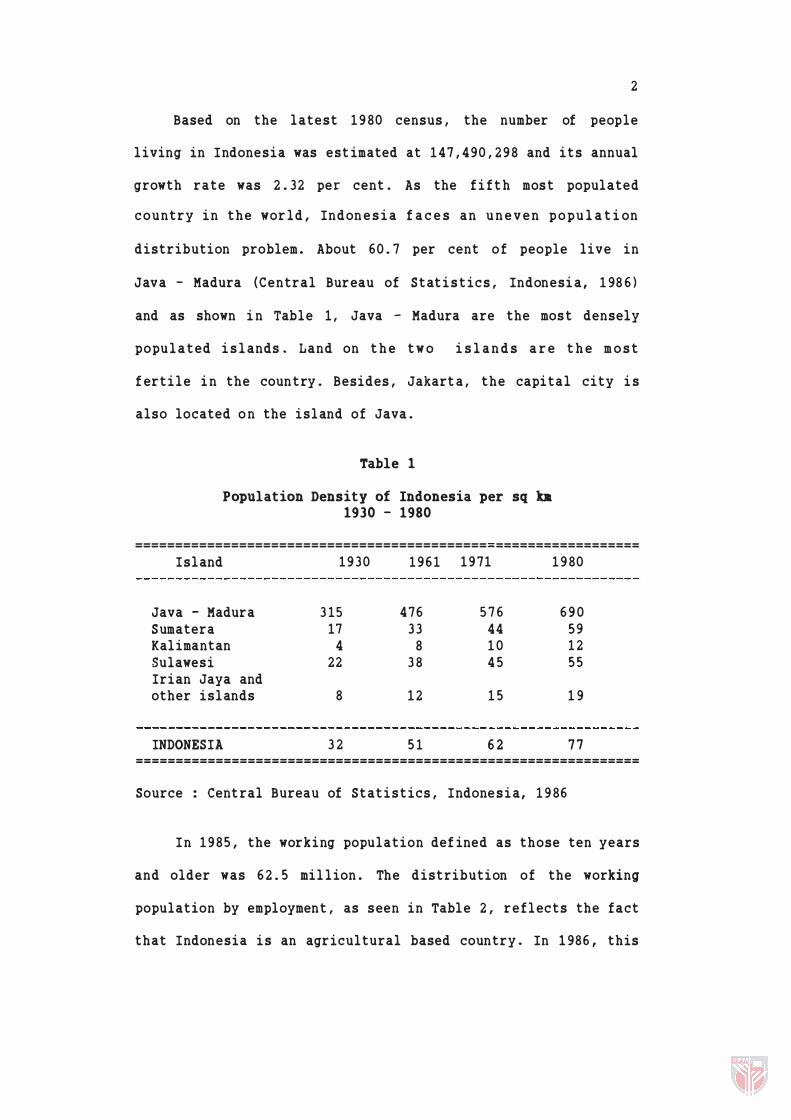
Based on the latest 1980 census , the number of people
l iving in Indonesia was est imated at 147 , 490 , 298 and i t s annual
growth rate was 2 . 32 per cent . As the f i f t h mos t populated
c o u n t r y i n the wor l d , Indon e s i a f a c e s a n u n e v e n p o p u l a t i on
distr ibution problem . About 60 . 7 per cent o f people live in
Java - Madura (Central Bur eau of Stat i s t ic s , Indonesi a , 198 6 )
and as shown i n Tabl e 1 , Java - Madura are the mos t densely
popu l a t ed i s l ands. Land on t h e t w o i s l a n d s a r e t h e m o s t
f er t i l e i n the coun t ry . Besides , Jakart a , the capi tal city i s
also located o n the island of Java .
Table 1
Population Density of Indonesia per sq ka 1930 - 1980
===============================================================
Island 1930
Java - Madura 3 15 Sumatera 17 Kal imantan 4 Sulawesi 22 Irian Jaya and other islands 8
INDONESIA 3 2
196 1 1971
476 5 7 6 3 3 44
8 1 0 3 8 4 5
1 2 1 5
5 1 6 2
1980
690 59 1 2 5 5
1 9
7 7 ===============================================================
Source : Cent ral Bureau of Stat i s t ics , Indone s i a , 1986
I n 1985, the working populat ion def ined as those ten years
and older was 6 2 . 5 mi l l ion . The dist ribution of the working
populat ion by employment , as s een in Tabl e 2, r e f l ec t s the fact
that Indonesia i s an agr icul tural based country . In 1986 , this
3
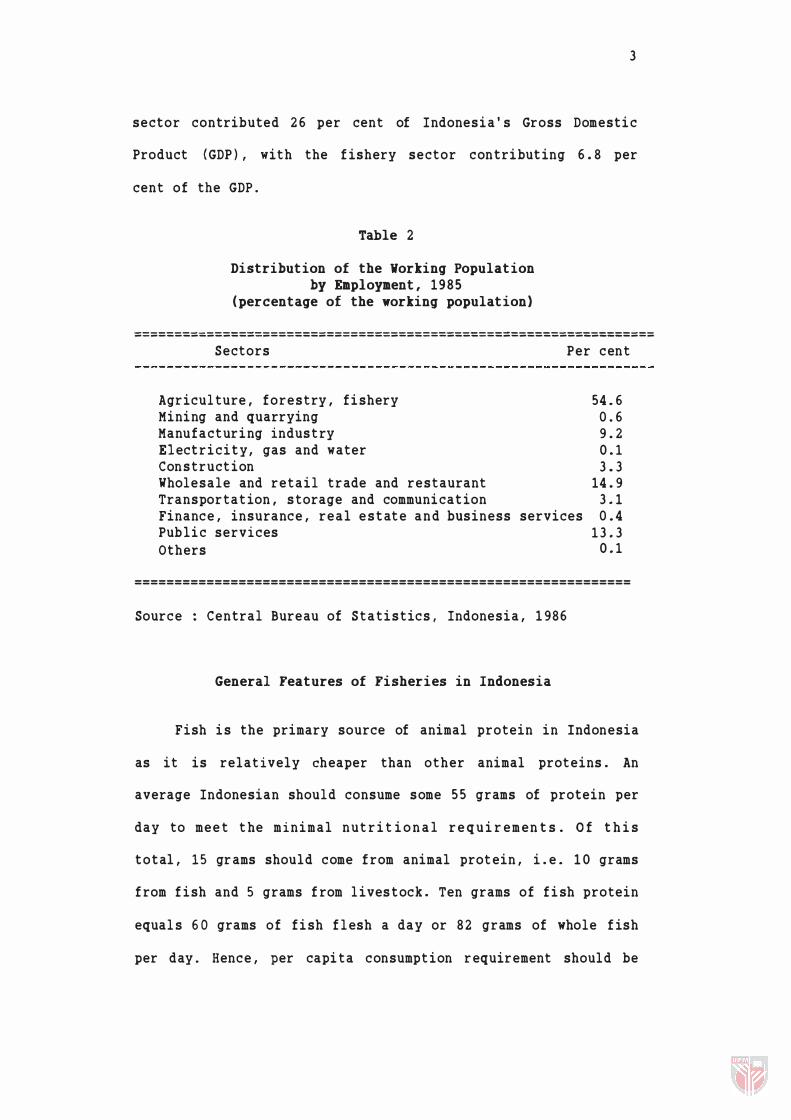
sector contributed 2 6 per cent of I ndones i a' s Gross Domest i c
Product (GDP ) , with the f ishery sector contribut ing 6 . 8 per
cent of the GDP .
Table 2
Distribution of the Vorking Population by Employment, 1 9 8 5
(percentage of the working population)
----------------------------------------------------------------------------------------------------------------------------------
Sectors Per c ent
Agr icul ture , forestry , f i shery 54 . 6 Mining and quarrying 0 . 6 Manufactur i ng indus t ry 9 . 2 Elect r i c i t y , gas and water 0 . 1 Con s t ruct ion 3 . 3 Wholesale and retail trade and restaurant 14 . 9 Transpor tat ion , s torage and communi cat ion 3 . 1 Financ e , insuranc e , r e a l e s t at e a n d bus iness services 0 . 4 Pub l i c services 1 3 . 3 Others 0 . 1
==============================================================
Sourc e : Central Bureau of S t a t i s t ic s , Indonesia , 1986
General Features of Fisheries in Indonesia
Fish i s the primary source of animal protein in Indonesia
as it is relat ively cheaper than other animal prot eins . An
average Indonesian shoul d consume some 5 5 grams of protein per
day to me e t t he m i n i m a l nut r i t i o n a l r e q u i r e m e n t s . Of t h i s
t o t al , 15 gr ams should come f rom animal prot ein , i . e . 1 0 grams
f rom f i sh and 5 grams f rom l ives t ock . Ten grams of f i sh protein
equal s 60 grams of f i sh f l esh a day or 8 2 grams of whole f ish
per day. Henc e , per capi t a consumpt ion r equir ement should be
4
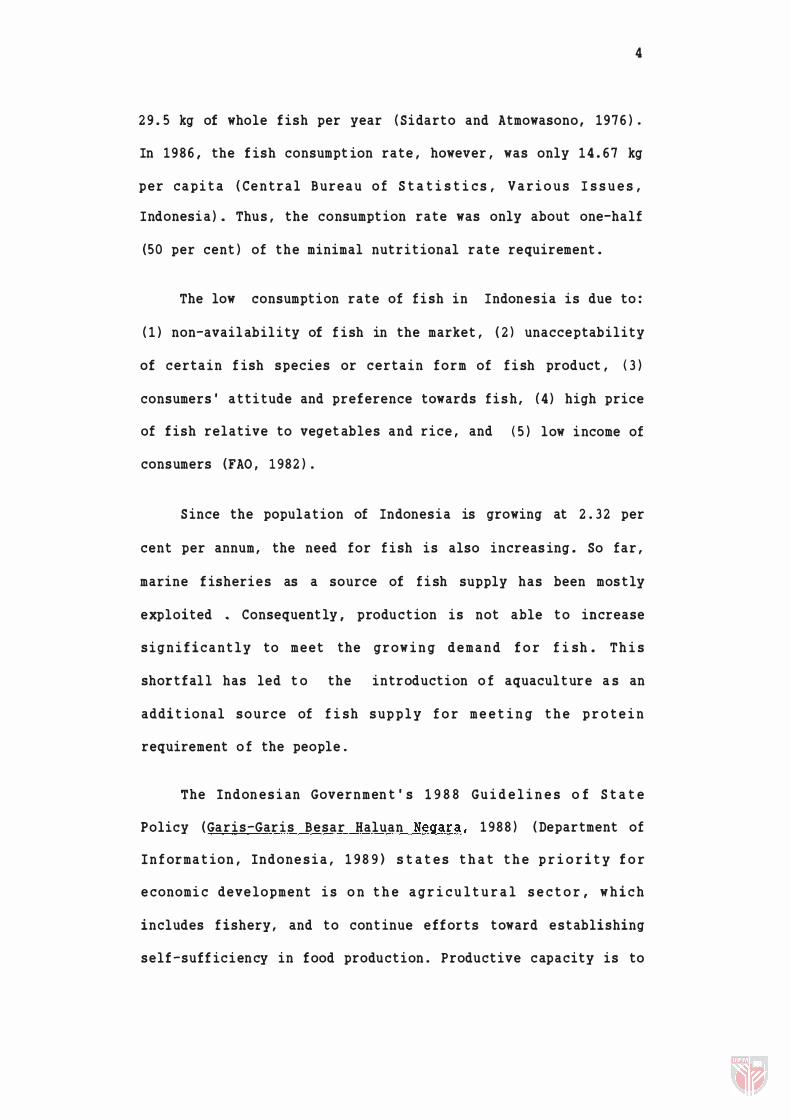
29 . 5 kg of whole f ish per year ( Sidarto and Atmowasono , 197 6 ) .
In 1 9 8 6 , the f ish consumpt ion rate , however , was only 1 4 . 6 7 kg
p e r c a p i t a ( Ce n t r a l B u r e a u o f S t a t i s t i c s , V a r i o u s I s s u e s ,
Indonesi a ) . Thus , the consumpt ion rate was only about one-half
(50 per cent ) of the minimal nut r i t ional rate requirement .
The low consumpt ion rate of f i sh in Indonesia is due to:
( 1 ) non-avail abil i ty of f i sh in the market , ( 2 ) unacceptability
of certain f ish species or certain form of f i sh product , ( 3 )
consumers ' a t t i tude and pref erence towards f i s h , (4 ) high price
of f ish relative to veget ables and rice , and ( 5 ) low i ncome of
consumers (FAO , 1 982 ) .
S ince the populat ion of Indones i a is growing at 2 . 3 2 per
cent per annum , the need for f i sh is also increas ing . So far ,
marine f isheries as a source of f i sh supply has been mos t ly
exploited • Consequent ly, produ c t ion is not able t o increase
s i g n i f i c a n t l y to meet the g r ow i n g d e m a n d f o r f i sh . Th i s
shor t f al l has led t o the introduct ion o f aquacul t ur e a s an
addi t ional s o u r c e of f i sh s up p l y f o r m e e t i n g t h e p r o t e i n
requirement o f the people .
The Indon e s i an Governmen t ' s 1 9 8 8 Gu i d e l i n e s o f S t a t e
Policy (Garis-Gar is Besar Haluan N�gara , 1988 ) ( Depar tment of
I n f orma t ion , Indone s i a , 198 9 ) s t a t e s t h a t t h e p r i o r i t y f o r
e conomi c deve lopment i s o n t h e a g r i c u l t u r a l s e c t o r , w h i c h
includes f ishery , and to cont inue e ff or t s toward establishing
self -suff ic i en cy in f ood product ion . Product ive c apacity is to
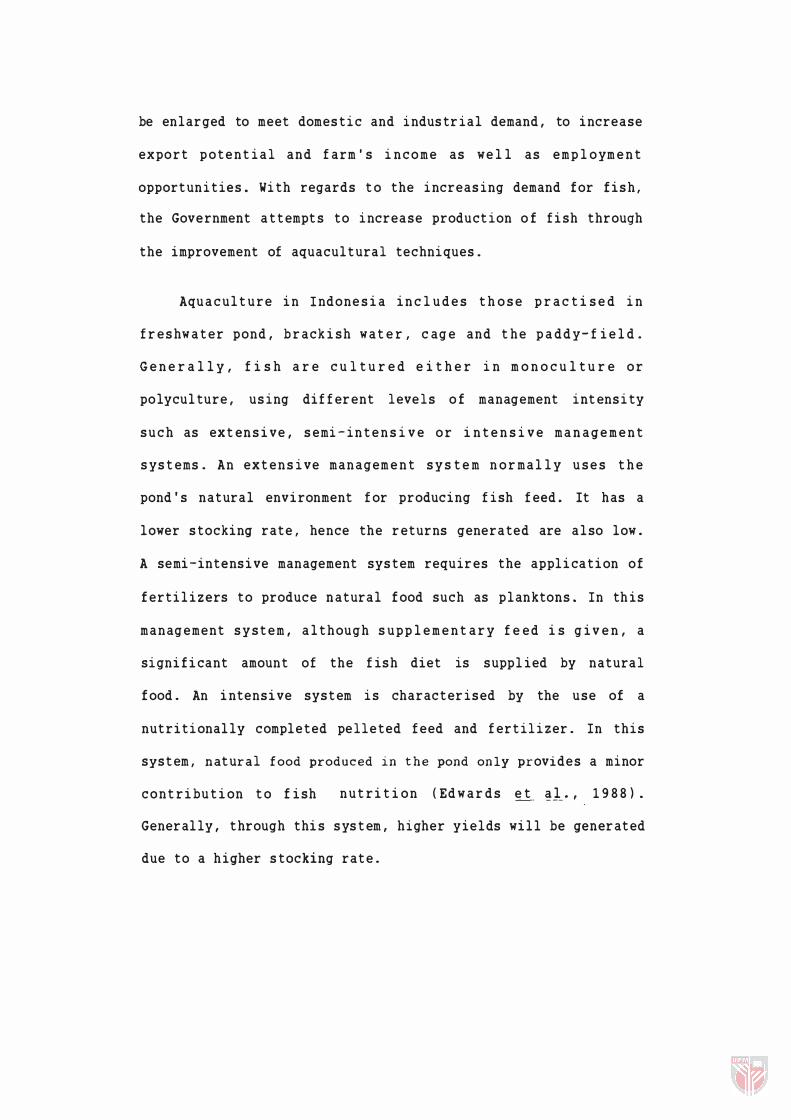
be enlarged to meet domes tic and indus trial demand , to increase
export p o t e n t ial and f arm's i n c o m e as w e l l as e m p l o ym e n t
opport unities . With regards t o the increasing demand for fis h ,
the Government a t t empt s to increase production o f fish through
the improvement of aquacult ural techniques.
Aqu a c ult ure in Indone sia in c l u d e s t h o s e p r a c t i s e d in
f r e s hw a t er pond , brackish w a t e r , c ag e and t he p a d d y-f ie l d .
Ge n e r a l l y , f i s h a r e c u l t u r e d e i t h e r i n m o n o c u l t u r e or
polyculture , using dif f erent levels of management int ensity
s u c h as ex t ensive, s emi-in t e n s i v e or i n t e n s i v e m a n a g e m e n t
s ys t ems . An ex t e n s ive man agem e n t s y s t e m n or m ally u s e s t h e
pond's natural environment f or producing f ish f eed. It has a
lower s tocking rate , hence the returns genera ted are also low .
A semi-intensive management sys tem requires the applica tion of
fertilizers to produce natural food such as planktons. In this
m a n agement s y s t e m, alt hough s u p p l e m e n t ary f e e d i s giv e n , a
significant amount of the f ish diet is supplied by natural
food . An intensive sys t em is charac t eris ed by the use of a
nutritionally comple ted pelle ted f eed and f ertilizer . In this
sys t em , nat ural food produced in the pond only provides a minor
c o n t ribu tion t o fish n u t ri t i o n ( Ed w ar d s e t �1., 1 9 8 8 ) .
Generally, through this s ys t em , higher yields will be generat ed
due to a higher s tocking rat e .
6
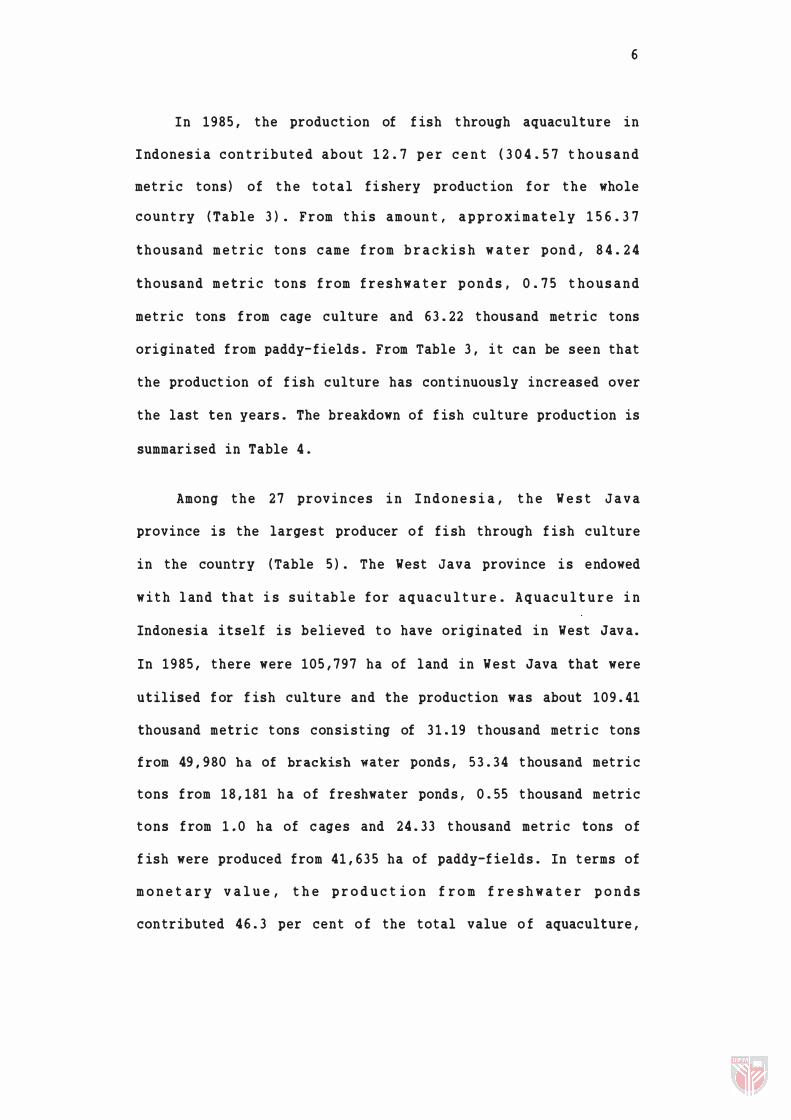
I n 1 9 8 5 , the product ion of f ish t hrough aquaculture in
I ndone s i a c on t r i b u t e d about 1 2 . 7 p e r c e n t ( 3 0 4 . 5 7 t ho u s a n d
met r i c tons ) of t h e t o t a l f i shery produc t ion f o r t h e whole
coun t ry ( Table 3 ) . F r om t h i s amoun t , a p p r o x i ma t e l y 1 5 6 . 3 7
thousand m e t r i c t on s c ame f rom b r a c k i s h w a t e r pon d , 8 4 . 2 4
thousand m e t r i c tons f r om f r e s hw a t e r p o n d s , 0 . 7 5 t ho u s a n d
met r i c tons f rom c age culture and 6 3 . 22 thous and met r ic tons
originated f rom paddy- f ields . From Table 3 , i t can be s ee n that
the product ion of f ish culture has con t i nuous ly increas ed over
the last ten years . The breakdown of f ish culture product ion is
summar i sed in Table 4 .
Among the 2 7 prov i n c e s i n I n d o n e s i a , t h e W e s t J a v a
province is the larges t producer o f f i sh through f ish culture
in the country ( Table 5 ) . The West Java province i s endowed
w i t h l and that i s s u i t able f o r aqua c u l t u r e . A q u ac u l t u r e i n
Indonesia itself i s believed t o have originated i n West Jav a .
In 1 9 8 5 , there were 105 , 7 9 7 ha of land in W e s t Java that were
utilised f or f ish culture and the product ion was about 109 . 41
thousand metric t ons consi s t i ng of 3 1 . 19 t hous and met r i c tons
f rom 49,9 80 ha of brackish water ponds , 53 . 34 t housand met r i c
tons f rom 1 8 , 181 h a of f re shwater ponds , 0 . 55 t housand metric
tons f rom 1 . 0 ha of c ages and 24 . 3 3 t housand met r i c tons of
f ish were produced f rom 41 , 6 3 5 ha of paddy-f ields . In t erms of
m o n e t a r y v a l u e , t h e p r o d u c t i o n f r o m f r e s h w a t e r p o n d s
con tr ibuted 4 6 . 3 per cent o f the total value o f aquaculture ,