Embed Size (px)
Citation preview
University of Groningen
Improving protein stabilization by spray dryingGrasmeijer, Niels
IMPORTANT NOTE: You are advised to consult the publisher's version (publisher's PDF) if you wish to cite fromit. Please check the document version below.
Document VersionPublisher's PDF, also known as Version of record
Publication date:2016
Link to publication in University of Groningen/UMCG research database
Citation for published version (APA):Grasmeijer, N. (2016). Improving protein stabilization by spray drying: formulation and processdevelopment [Groningen]: University of Groningen
CopyrightOther than for strictly personal use, it is not permitted to download or to forward/distribute the text or part of it without the consent of theauthor(s) and/or copyright holder(s), unless the work is under an open content license (like Creative Commons).
Take-down policyIf you believe that this document breaches copyright please contact us providing details, and we will remove access to the work immediatelyand investigate your claim.
Downloaded from the University of Groningen/UMCG research database (Pure): http://www.rug.nl/research/portal. For technical reasons thenumber of authors shown on this cover page is limited to 10 maximum.
Download date: 22-06-2018
Unraveling protein stabilization mechanisms | 13
Chapter 2
Unraveling protein stabilization mechanisms: vitrification and water replacement in a glass transition temperature controlled system
N. Grasmeijer, M. Stankovic, H. de Waard, H.W. Frijlink, W.L.J. Hinrichs
doi:10.1016/j.bbapap.2013.01.020
14 | Chapter 2
Abstract
The aim of this study was to elucidate the role of the two main mechanisms used to explain the stabilization of proteins by sugar glasses during drying and subsequent storage: the vitrification and the water replacement theory. Although in literature protein stability is often attributed to either vitrification or water replacement, both mechanisms could play a role and they should be considered simultaneously. A model protein, alkaline phosphatase, was incorporated in either inulin or trehalose by spray drying. To study the storage stability at different glass transition temperatures, a buffer which acts as a plasticizer, ammediol, was incorporated in the sugar glasses. At low glass transition temperatures (<50 ºC), the enzymatic activity of the protein strongly decreased during storage at 60 °C. Protein stability increased when the glass transition temperature was raised considerably above the storage temperature. This increased stability could be attributed to vitrification. A further increase of the glass transition temperature did not further improve stability. In conclusion, vitrification plays a dominant role in stabilization at glass transition temperatures up to 10 to 20 °C above storage temperature, depending on whether trehalose or inulin is used. On the other hand, the water replacement mechanism predominately determines stability at higher glass transition temperatures.
Unraveling protein stabilization mechanisms | 15
Introduction
Proteins are applied more and more as therapeutic agents. Unfortunately, many of these proteins are labile and need to be stabilized. Proteins can be stabilized by drying a sugar-containing solution of the protein, thereby incorporating the protein into a matrix of the sugar in the glassy state. Two mechanisms of stabilization have been described, namely the water replacement theory and the glass dynamics hypothesis or vitrification theory [1-3]. Although in literature protein stability is often attributed to either vitrification or water replacement, both could have an effect and should be considered simultaneously.
The water replacement theory states that in solution, the conformation of the protein is maintained by the interaction with water, mainly due to hydrogen bonding. Upon drying, this interaction is lost and replaced by hydrogen bonds between the protein and the sugar by which the protein structure is maintained upon drying [4]. To maximize the hydrogen bonding with the protein, the sugar molecules should closely fit the irregular surface of the protein and should thus be in the amorphous state (and not in the crystalline state). A closely related theory is the water entrapment theory, which states that rather than forming hydrogen bonds directly with the sugar, the protein is coupled to the amorphous sugar matrix through water molecules entrapped at the interface [5]. Although the water replacement theory and water entrapment theory describe fundamentally different mechanisms, the stabilization in both theories is mediated by hydrogen bonding. It is not within the aim of this study to discern between these two theories and therefore, further discussion regarding the water replacement theory could also hold true for the water entrapment theory, unless stated otherwise.
The second theory, the vitrification theory, dictates that the protein will be immobilized inside the sugar matrix, preventing translational molecular movements and thereby degradation. The translational molecular mobility within the sample is mainly determined by the thermodynamic state of the sugar. For an amorphous sugar, the translational molecular mobility is determined by the difference between the glass transition temperature and the storage temperature. Although the translational molecular mobility of an amorphous sugar in its glassy state is greatly reduced compared to a sugar in its rubbery state, it is not completely absent. As a rule of thumb, the glass transition temperature should be at least 50 °C above the storage temperature for the translational molecular mobility to become “insignificant over the lifetime of a typical pharmaceutical product” [6].
Although such a rule of thumb is useful for designing a stable protein formulation, further optimization requires more detailed knowledge of the importance of the glass transition temperature for protein stabilization. Even though it is generally accepted that the glass transition temperature is important for the stability of the
16 | Chapter 2
protein, there is little detailed overview of the relation between the stability and the glass transition temperature of a given system [7]. To investigate this, typical 3-component systems, consisting of a model protein (alkaline phosphatase), a buffer (ammediol), and either inulin or trehalose, were spray dried. These sugars were selected because trehalose is often considered as the golden standard in protein stabilization [8], while previous studies have shown that inulin also has good stabilizing properties [9-13]. Besides the fact that both sugars have a high glass transition temperature, both sugars are also hydrophilic, have good hydrogen bonding capacity, are non-toxic and have no reducing groups, which makes them excellent candidates for the stabilization of proteins [10]. Ammediol was chosen as a buffer because it is also a good glass former, just like the sugars. Due the low glass transition temperature of ammediol, it will act as a plasticizer [14]. This enables adjustment of the glass transition temperature, allowing the stability to be determined for a wide range of glass transition temperatures, which in turn enabled us to study different system mobilities, without changing the type of stabilizing sugar. In this study, we investigated whether this strategy can be used to study the different roles in protein stabilization of the water replacement and vitrification mechanism.
Materials and methods
Materials
Alkaline phosphatase from bovine intestinal mucosa (10-30 Units/mg, ~160 kDa), bovine serum albumin, ammediol, and para-nitrophenylphosphate were obtained from Sigma-Aldrich Co. (St. Louis, Missouri). Magnesium chloride was purchased from Fluka Chemie GmbH (Buchs, Switzerland). Trehalose was obtained from Cargill B.V. (Amsterdam, The Netherlands) and inulin with a degree of polymerization of 23 from Sensus (Roosendaal, The Netherlands). All experiments were performed with millipore water, type 1.
Spray drying
Protein containing powders were produced by dissolving alkaline phosphatase at a concentration of 2.5 mg/mL in a 50 mM ammediol at pH 9.8. Either inulin or trehalose was added in varying concentrations to obtain a range of samples with different sugar/buffer mass ratios and thus with different glass transition temperatures. The solutions were spray dried with a B-290 spray dryer (Büchi Labortechnik AG, Flawil, Switzerland). The inlet air temperature was set at 100 °C, the aspirator at 100%, pump speed at 7%, and atomizing airflow at 50 mm. These settings were chosen such, that the outlet temperature (around 58-64 °C) was similar to the storage temperature. Samples were stored in a desiccator over silica for one
Unraveling protein stabilization mechanisms | 17
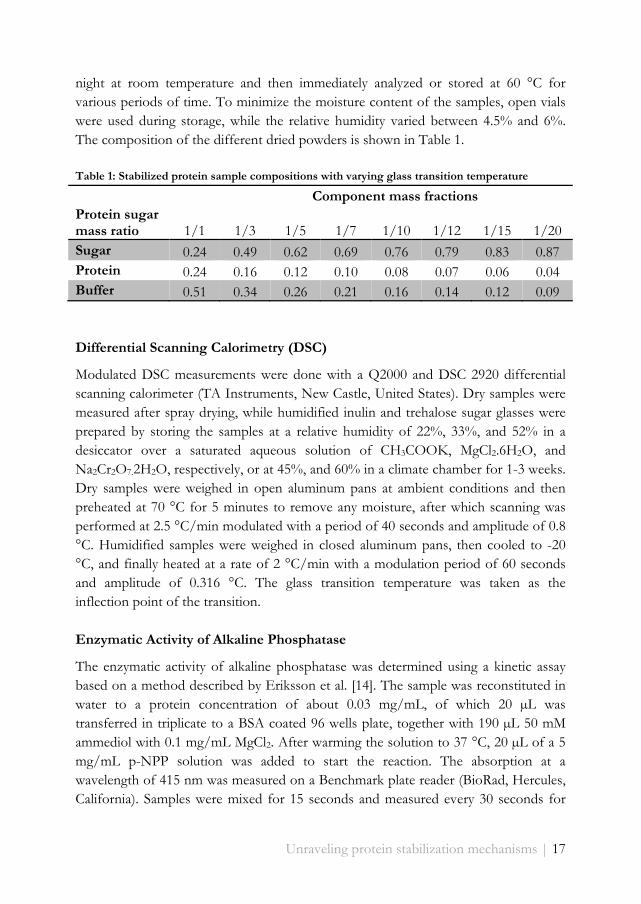
night at room temperature and then immediately analyzed or stored at 60 °C for various periods of time. To minimize the moisture content of the samples, open vials were used during storage, while the relative humidity varied between 4.5% and 6%. The composition of the different dried powders is shown in Table 1.
Table 1: Stabilized protein sample compositions with varying glass transition temperature
Component mass fractions Protein sugar mass ratio 1/1 1/3 1/5 1/7 1/10 1/12 1/15 1/20 Sugar 0.24 0.49 0.62 0.69 0.76 0.79 0.83 0.87 Protein 0.24 0.16 0.12 0.10 0.08 0.07 0.06 0.04 Buffer 0.51 0.34 0.26 0.21 0.16 0.14 0.12 0.09
Differential Scanning Calorimetry (DSC)
Modulated DSC measurements were done with a Q2000 and DSC 2920 differential scanning calorimeter (TA Instruments, New Castle, United States). Dry samples were measured after spray drying, while humidified inulin and trehalose sugar glasses were prepared by storing the samples at a relative humidity of 22%, 33%, and 52% in a desiccator over a saturated aqueous solution of CH3COOK, MgCl2.6H2O, and Na2Cr2O7.2H2O, respectively, or at 45%, and 60% in a climate chamber for 1-3 weeks. Dry samples were weighed in open aluminum pans at ambient conditions and then preheated at 70 °C for 5 minutes to remove any moisture, after which scanning was performed at 2.5 °C/min modulated with a period of 40 seconds and amplitude of 0.8 °C. Humidified samples were weighed in closed aluminum pans, then cooled to -20 °C, and finally heated at a rate of 2 °C/min with a modulation period of 60 seconds and amplitude of 0.316 °C. The glass transition temperature was taken as the inflection point of the transition.
Enzymatic Activity of Alkaline Phosphatase
The enzymatic activity of alkaline phosphatase was determined using a kinetic assay based on a method described by Eriksson et al. [14]. The sample was reconstituted in water to a protein concentration of about 0.03 mg/mL, of which 20 µL was transferred in triplicate to a BSA coated 96 wells plate, together with 190 µL 50 mM ammediol with 0.1 mg/mL MgCl2. After warming the solution to 37 °C, 20 µL of a 5 mg/mL p-NPP solution was added to start the reaction. The absorption at a wavelength of 415 nm was measured on a Benchmark plate reader (BioRad, Hercules, California). Samples were mixed for 15 seconds and measured every 30 seconds for
18 | Chapter 2
5.5 minutes. To calculate the remaining activity, the rate of conversion was compared to a standard of unprocessed alkaline phosphatase.
Dynamic Vapor Sorption (DVS) analysis
The water sorption isotherms of different powders were measured at ambient pressure and 25 °C using a DVS-1000 water sorption instrument (Surface Measurement Systems Limited, London, UK). To estimate the glass transition temperature of protein containing samples, the moisture content of protein/ammediol containing powders was determined at a relative humidity of 4.5% or 6.0%, dependent on the conditions during the stability study, for samples with an initial mass of approximately 35 mg. To determine the influence of water on the glass transition temperature of sugar glasses, the moisture content of humidified sugar glasses without protein/ammediol was measured at relative humidity’s of 0% – 90% with steps of 10%, for samples with an initial mass of around 10 mg. After subjecting the samples to the specified humidity equilibrium was assumed when the change in mass was less than 0.9 µg during 10 minutes. Results
Glass transition temperature
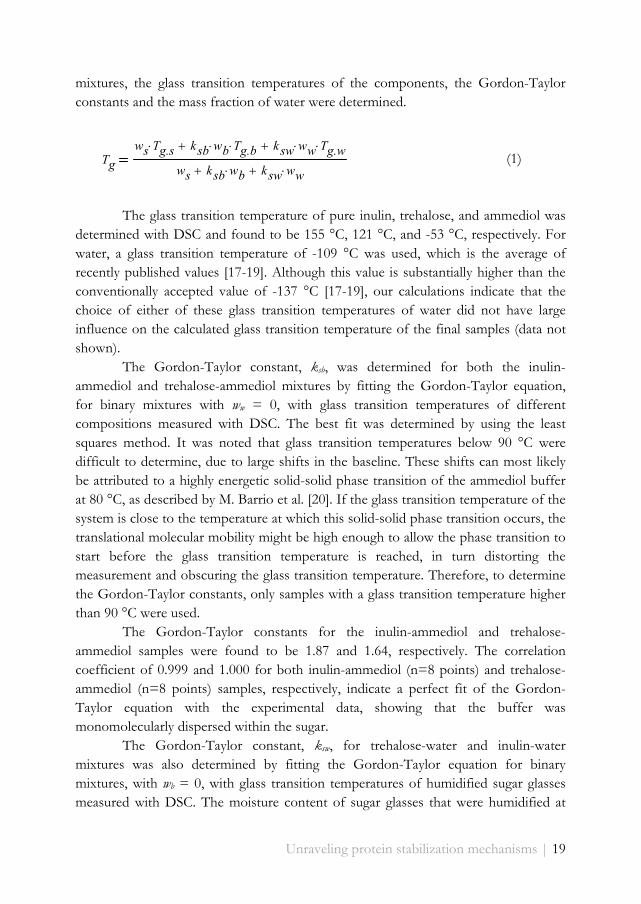
In an attempt to determine the glass transition temperature by DSC, it was found that alkaline phosphatase interfered with the measurements. DSC measurements performed with different modulations or higher scan rates of up to 20 °C/min, did not improve the result. Therefore, the glass transition temperature of the sugar/buffer matrix, without the protein, was used as the glass transition temperature of the sample, thereby neglecting the influence of the protein on the glass transition temperature. However, it is well known that the glass transition temperature can be greatly influenced by residual moisture or moisture adsorbed from the environment, which should be taken into account by estimating the glass transition temperature of a sugar-buffer-water mixture [15]. This was achieved by using the Gordon-Taylor equation, extended for a ternary mixture (Equation 1), which describes the relation between the composition of a three component mixture (with mass fractions ws, wb, and ww) and its glass transition temperature (Tg) [16]. Besides the mass fraction of the components, the glass transition temperature of the mixture is also dependent on the glass transition temperature of the individual components (Tg.s, Tg.b, and Tg.w) and two component-dependent Gordon-Taylor constants (ksb and ksw). The subscripts s, b, and w are used for sugar, buffer, and water, respectively. To calculate the glass transition temperature of both the inulin-ammediol-water and trehalose-ammediol-water
Unraveling protein stabilization mechanisms | 19
mixtures, the glass transition temperatures of the components, the Gordon-Taylor constants and the mass fraction of water were determined.
(1) The glass transition temperature of pure inulin, trehalose, and ammediol was
determined with DSC and found to be 155 °C, 121 °C, and -53 °C, respectively. For water, a glass transition temperature of -109 °C was used, which is the average of recently published values [17-19]. Although this value is substantially higher than the conventionally accepted value of -137 °C [17-19], our calculations indicate that the choice of either of these glass transition temperatures of water did not have large influence on the calculated glass transition temperature of the final samples (data not shown).
The Gordon-Taylor constant, ksb, was determined for both the inulin-ammediol and trehalose-ammediol mixtures by fitting the Gordon-Taylor equation, for binary mixtures with ww = 0, with glass transition temperatures of different compositions measured with DSC. The best fit was determined by using the least squares method. It was noted that glass transition temperatures below 90 °C were difficult to determine, due to large shifts in the baseline. These shifts can most likely be attributed to a highly energetic solid-solid phase transition of the ammediol buffer at 80 °C, as described by M. Barrio et al. [20]. If the glass transition temperature of the system is close to the temperature at which this solid-solid phase transition occurs, the translational molecular mobility might be high enough to allow the phase transition to start before the glass transition temperature is reached, in turn distorting the measurement and obscuring the glass transition temperature. Therefore, to determine the Gordon-Taylor constants, only samples with a glass transition temperature higher than 90 °C were used.
The Gordon-Taylor constants for the inulin-ammediol and trehalose-ammediol samples were found to be 1.87 and 1.64, respectively. The correlation coefficient of 0.999 and 1.000 for both inulin-ammediol (n=8 points) and trehalose-ammediol (n=8 points) samples, respectively, indicate a perfect fit of the Gordon-Taylor equation with the experimental data, showing that the buffer was monomolecularly dispersed within the sugar.
The Gordon-Taylor constant, ksw, for trehalose-water and inulin-water mixtures was also determined by fitting the Gordon-Taylor equation for binary mixtures, with wb = 0, with glass transition temperatures of humidified sugar glasses measured with DSC. The moisture content of sugar glasses that were humidified at
Tg
ws Tg.s ksb wb Tg.b ksw ww Tg.w
ws ksb wb ksw ww
20 | Chapter 2
specific relative humidities was determined with DVS analysis. The Gordon-Taylor constants for the trehalose-water and inulin-water mixtures were found to be 7.90 and 6.57, respectively. The Gordon-Taylor constant for a trehalose-water mixture was found to be higher than values found in literature (i.e. 5.2, 6.5, and 7.3), due to the higher glass transition temperature of water we used [21-23].
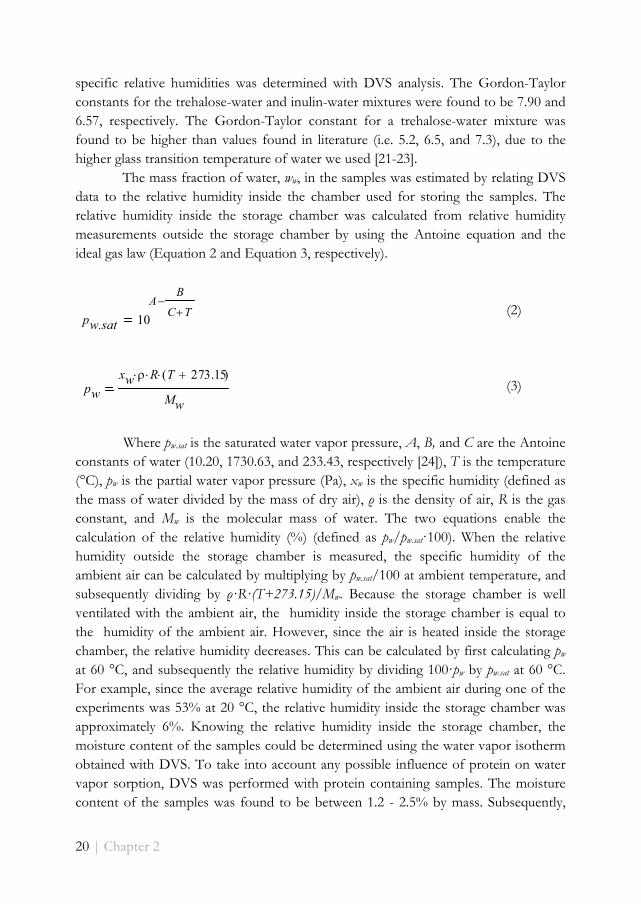
The mass fraction of water, ww, in the samples was estimated by relating DVS data to the relative humidity inside the chamber used for storing the samples. The relative humidity inside the storage chamber was calculated from relative humidity measurements outside the storage chamber by using the Antoine equation and the ideal gas law (Equation 2 and Equation 3, respectively).
(2)
(3) Where pw.sat is the saturated water vapor pressure, A, B, and C are the Antoine
constants of water (10.20, 1730.63, and 233.43, respectively [24]), T is the temperature (°C), pw is the partial water vapor pressure (Pa), xw is the specific humidity (defined as the mass of water divided by the mass of dry air), ρ is the density of air, R is the gas constant, and Mw is the molecular mass of water. The two equations enable the calculation of the relative humidity (%) (defined as pw/pw.sat·100). When the relative humidity outside the storage chamber is measured, the specific humidity of the ambient air can be calculated by multiplying by pw.sat/100 at ambient temperature, and subsequently dividing by ρ·R·(T+273.15)/Mw. Because the storage chamber is well ventilated with the ambient air, the humidity inside the storage chamber is equal to the humidity of the ambient air. However, since the air is heated inside the storage chamber, the relative humidity decreases. This can be calculated by first calculating pw at 60 °C, and subsequently the relative humidity by dividing 100·pw by pw.sat at 60 °C. For example, since the average relative humidity of the ambient air during one of the experiments was 53% at 20 °C, the relative humidity inside the storage chamber was approximately 6%. Knowing the relative humidity inside the storage chamber, the moisture content of the samples could be determined using the water vapor isotherm obtained with DVS. To take into account any possible influence of protein on water vapor sorption, DVS was performed with protein containing samples. The moisture content of the samples was found to be between 1.2 - 2.5% by mass. Subsequently,
pw.sat 10
AB
C T
pw
xw R T 273.15( )
Mw
Unraveling protein stabilization mechanisms | 21
the glass transition temperature of both inulin-ammediol-water and trehalose-ammediol-water mixtures was calculated with the Gordon-Taylor equation (Equation 1). The glass transition temperatures as calculated with the Gordon-Taylor equation were used to estimate the different glass transition temperatures of the prepared protein samples. These results are presented in Table 2.
Table 2: Estimated glass transition temperatures for stabilized protein samples
Glass transition temperature (°C) protein sugar mass ratioa 1/1 1/3 1/5 1/7 1/10 1/12 1/15 1/20 Inulin -16 28 51 64 76 81 86 89 Trehalose -20 18 37 49 59 64 69 73 a The glass transition temperature was determined for samples without protein
Varying glass transition temperature
To investigate the contribution of both the vitrification and water replacement mechanism on the stability of the protein at different glass transition temperatures, samples with varying glass transition temperatures (and thus varying translational molecular mobility) were prepared. The enzymatic activity of the protein was measured after storing these samples in a desiccator overnight and after storing them for 12 days at 60 °C.
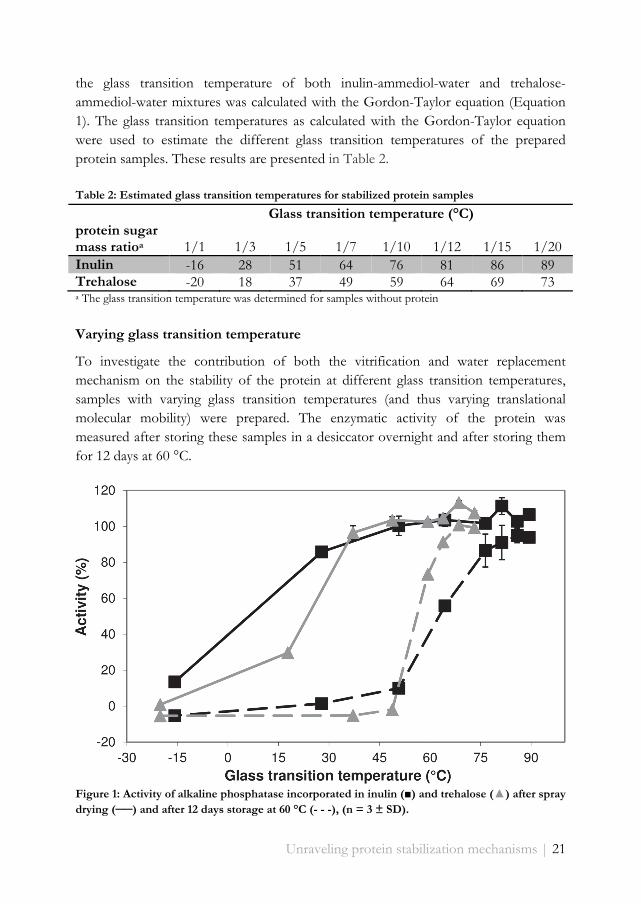
Figure 1: Activity of alkaline phosphatase incorporated in inulin (■) and trehalose (▲) after spray drying (──) and after 12 days storage at 60 °C (- - -), (n = 3 ± SD).
22 | Chapter 2
Samples with the lowest glass transition temperature, below 0 °C, already lost
most of their activity during spray drying (Figure 1). However, when the glass transition temperature is raised above 30-40 °C (close to the spray dryer outlet temperature of around 60 °C), the loss of activity was strongly reduced and became negligible at values over 45 °C. After storing the spray dried samples for 12 days at 60 °C, the stability curve shifted to the right, indicating that a higher glass transition temperature is required for protein stabilization during storage. Complete activity loss was observed for samples with a glass transition temperature below 50-60 °C, while at higher glass transition temperatures the activity loss quickly decreased. Although the shift is observed for both sugars, trehalose appeared to stabilize the protein already at somewhat lower glass transition temperatures than inulin.
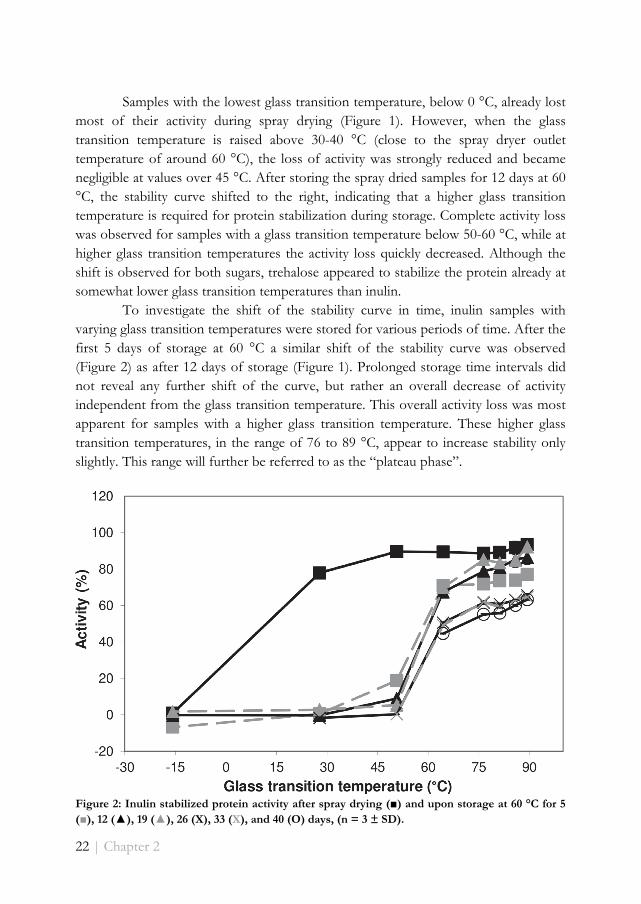
To investigate the shift of the stability curve in time, inulin samples with varying glass transition temperatures were stored for various periods of time. After the first 5 days of storage at 60 °C a similar shift of the stability curve was observed (Figure 2) as after 12 days of storage (Figure 1). Prolonged storage time intervals did not reveal any further shift of the curve, but rather an overall decrease of activity independent from the glass transition temperature. This overall activity loss was most apparent for samples with a higher glass transition temperature. These higher glass transition temperatures, in the range of 76 to 89 °C, appear to increase stability only slightly. This range will further be referred to as the “plateau phase”.
Figure 2: Inulin stabilized protein activity after spray drying (■) and upon storage at 60 °C for 5 (■), 12 (▲), 19 (▲), 26 (X), 33 (X), and 40 (O) days, (n = 3 ± SD).
Unraveling protein stabilization mechanisms | 23
Constant glass transition temperature
The decrease of activity within the plateau phase was investigated in more detail. This was done by measuring the activity loss of samples with varying protein content and a constant glass transition temperature during storage at 60 °C. The protein content was varied by preparing samples with varying protein/sugar mass ratios of 1/1, 1/10, and 1/20 (Table 3). A fixed buffer/sugar mass ratio of 0.20 and 0.13 was chosen for inulin samples to obtain a glass transition temperature of around 80 °C and 93 °C, respectively. Trehalose samples with similar glass transition temperatures were obtained by choosing a buffer/sugar mass ratio of 0.06 and 0.02, respectively.
Table 3: Stabilized protein sample compositions with constant glass transition temperature
Component mass fractions
Trehalose (Tg = 81 °C) Trehalose (Tg = 91 °C) Protein sugar mass ratio 1/1 1/10 1/20 1/1 1/10 1/20
Trehalose 0.48 0.86 0.90 0.50 0.89 0.93 Protein 0.48 0.09 0.04 0.50 0.09 0.05 Buffer 0.03 0.05 0.06 0.01 0.02 0.02
Inulin (Tg = 78 °C) Inulin (Tg = 95 °C) Protein sugar mass ratio 1/1 1/10 1/20 1/1 1/10 1/20
Inulin 0.45 0.77 0.80 0.47 0.81 0.85 Protein 0.45 0.08 0.04 0.47 0.08 0.04 Buffer 0.09 0.15 0.16 0.06 0.11 0.11
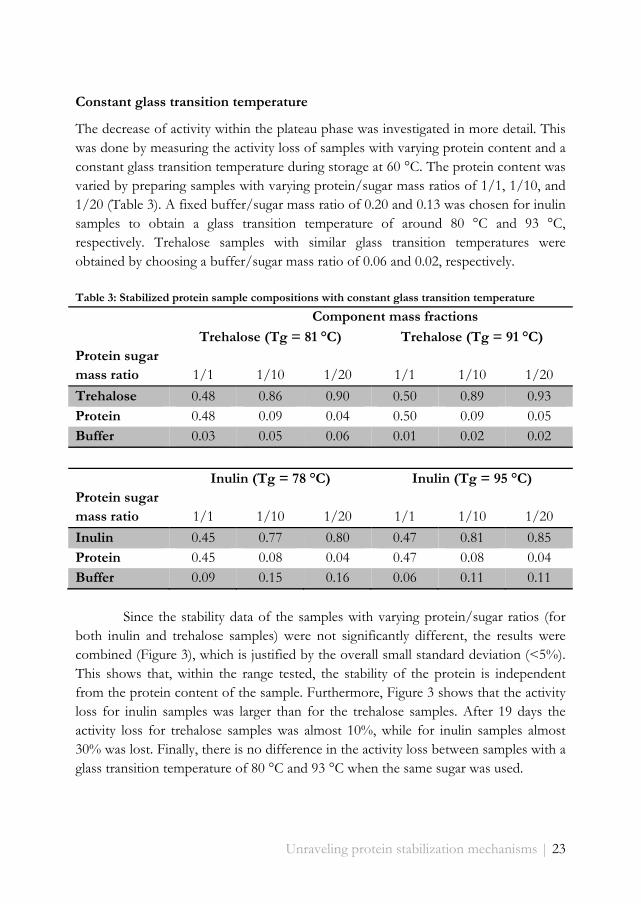
Since the stability data of the samples with varying protein/sugar ratios (for
both inulin and trehalose samples) were not significantly different, the results were combined (Figure 3), which is justified by the overall small standard deviation (<5%). This shows that, within the range tested, the stability of the protein is independent from the protein content of the sample. Furthermore, Figure 3 shows that the activity loss for inulin samples was larger than for the trehalose samples. After 19 days the activity loss for trehalose samples was almost 10%, while for inulin samples almost 30% was lost. Finally, there is no difference in the activity loss between samples with a glass transition temperature of 80 °C and 93 °C when the same sugar was used.
24 | Chapter 2
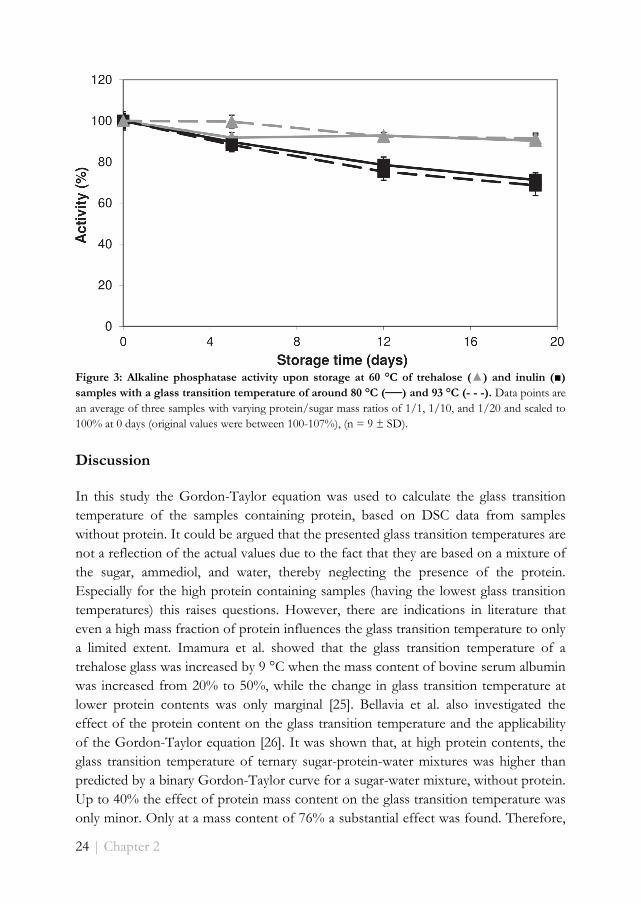
Figure 3: Alkaline phosphatase activity upon storage at 60 °C of trehalose (▲) and inulin (■) samples with a glass transition temperature of around 80 °C (──) and 93 °C (- - -). Data points are an average of three samples with varying protein/sugar mass ratios of 1/1, 1/10, and 1/20 and scaled to 100% at 0 days (original values were between 100-107%), (n = 9 ± SD).
Discussion
In this study the Gordon-Taylor equation was used to calculate the glass transition temperature of the samples containing protein, based on DSC data from samples without protein. It could be argued that the presented glass transition temperatures are not a reflection of the actual values due to the fact that they are based on a mixture of the sugar, ammediol, and water, thereby neglecting the presence of the protein. Especially for the high protein containing samples (having the lowest glass transition temperatures) this raises questions. However, there are indications in literature that even a high mass fraction of protein influences the glass transition temperature to only a limited extent. Imamura et al. showed that the glass transition temperature of a trehalose glass was increased by 9 °C when the mass content of bovine serum albumin was increased from 20% to 50%, while the change in glass transition temperature at lower protein contents was only marginal [25]. Bellavia et al. also investigated the effect of the protein content on the glass transition temperature and the applicability of the Gordon-Taylor equation [26]. It was shown that, at high protein contents, the glass transition temperature of ternary sugar-protein-water mixtures was higher than predicted by a binary Gordon-Taylor curve for a sugar-water mixture, without protein. Up to 40% the effect of protein mass content on the glass transition temperature was only minor. Only at a mass content of 76% a substantial effect was found. Therefore,
Unraveling protein stabilization mechanisms | 25
it can be assumed that the addition of protein will only moderately influence the glass transition temperature of the samples with a protein/sugar mass ratio of 1/1, corresponding to a protein mass content of 24%. Moreover, the protein activity in the 24% samples was completely lost after storage at 60 °C and conclusions of our study were not based on these samples but on samples with much lower protein content. Therefore, it is justified to consider the glass transition temperatures as obtained from the Gordon-Taylor equation for ternary systems representative for the glass transition temperatures of the protein containing samples (Table 2).
The employed three-component system for protein stabilization clearly shows two different phases. In the first phase, protein stability increases rapidly with increasing glass transition temperature. In the second phase (the plateau phase) the stability is independent from the glass transition temperature of the sugar matrix but varies depending on the sugar applied.
In general, the results show an increased stability with an increasing glass transition temperature up to 10-20 °C above the storage temperature. This observation is in line with the vitrification mechanism. When the glass transition temperature of the sugar is below the storage temperature, the material will be in a mobile rubbery state, which will enable the protein to degrade and lose its activity. This effect is observed both during spray drying and storage. Of course, considering the variation in sugar content of the samples, one could argue that a minimum amount of sugar is required to saturate the surface of the protein, thereby maximizing protein stability by forming as many hydrogen bonds as possible. Although it is tempting to explain the lack of stability of samples with a low glass transition temperature, having a protein/sugar mass ratio of 1/1 and 1/3, by the low amount of sugar, the low standard deviation shown in Figure 3 shows that the protein stability is independent of the protein/sugar mass ratio within the range tested. Therefore, the relatively low sugar content of the samples with a protein/sugar mass ratio of 1/1 and 1/3 cannot account for the activity loss of these samples, clearly pointing to the glass transition temperature as the major determinant of the stability in this phase.
During the relatively short spray drying process, the maximum temperature of the dried samples is assumed to be that of the outlet temperature, which was 58-64 °C. However, even samples with a glass transition temperature as low as 30 °C exhibited quite good process stability, whereas during storage at 60°C for 12 days, the protein activity of the samples with a glass transition temperature below storage temperature was completely lost. Apparently, within the short spray drying time, even the samples with a glass transition temperature up to 30 °C below the outlet temperature did not degrade fast enough to show any loss of activity.
When the glass transition temperature is raised above storage temperature, the amorphous sugar will change to the less mobile glassy state, which should keep the
26 | Chapter 2
protein vitrified in its original conformation. Although the onset of protein stabilization appeared to occur when the glass transition temperature was around the storage temperature, it was also shown that the protein was still not fully stabilized immediately after the glass transition temperature was raised above the storage temperature. The stability appeared to increase exponentially over a 20-30 °C temperature range around the storage temperature before reaching a plateau phase, showing maximum stabilization. This finding is in agreement with the result of a study by Hancock et al. (6), who showed that in the range between the glass transition temperature and 50 °C below glass transition temperature, the translational molecular mobility strongly decreases. In addition, from the data presented in the same study, one can conclude that the change of the translational molecular mobility was much faster for the relatively small sucrose than for the much larger PVP K90. This resulted in a difference in mobility of several orders of magnitude when the storage temperature was 50 °C below the glass transition temperature. A similar difference was found in this study. The stability of the protein when incorporated in trehalose increased faster with increasing glass transition temperature than when the protein was incorporated in the larger inulin. The same phenomenon was also observed in more detail by others. Wolkers et al. [27, 28] applied FT-IR to show that the wavenumber temperature coefficient of the OH-stretching mode band position increased with increasing molecular mass, indicating that the average hydrogen bond length increases with increasing molecular mass. This results in a more loosely packed glass and a higher mobility of the sugar matrix.
It should, however, be kept in mind that in order to obtain a glass transition temperature similar to the trehalose samples, the inulin samples contained higher amounts of buffer. Therefore, one could argue that the stability difference found to exist between both sugars was caused by the replacement of sugar with buffer, which could result in a less favorable interaction with the protein. However, under that assumption, this could be said for the entire stability curve and this would imply that the loss of activity at lower glass transition temperatures is not due to increased translational molecular mobility but due to replacement of sugar by the buffer. In other words, the protein stability would under such assumption be dominated entirely by water replacement and never by vitrification. However, it seems unlikely that this is the case. Although the same difference in stability between inulin and trehalose is observed at high glass transition temperatures where mobility is expected to be negligible, at lower glass transition temperatures the rate of activity loss is much faster and is more likely to be caused by a higher mobility. In addition, the facts that the sudden exponential increase of stability occurs only at (I) glass transition temperatures around the storage temperature and (II) shows a good correlation with results from
Unraveling protein stabilization mechanisms | 27
literature, strongly suggests that protein stability is dominated by mobility and thus vitrification at lower glass transition temperatures.
Therefore, the fact that for maximum protein stability a slightly higher glass transition temperature is required with inulin than with trehalose, should be attributed to their difference in molecular size. While trehalose has a molecular mass of 342 g/mol, the type of inulin used in this study is a long chained oligosaccharide with a molecular mass of 3908 g/mol. Therefore, the translational molecular mobility of a trehalose glass is likely to be smaller than the translational molecular mobility of an inulin glass, resulting in the slight difference in protein stability with trehalose and inulin at glass transition temperatures where the mobility dictates the protein stability. These findings confirm that the protein stability at temperatures near the glass transition temperature is largely dependent on the translational molecular mobility of the sugar.
It is important to be aware of a study by Francia et al., which reported an increased rigidity of a trehalose matrix when its water content is decreased [29]. The increased rigidity of the matrix was attributed to the anchorage hypothesis, which links the water replacement theory with the water entrapment theory, stating that at low hydration levels the water and trehalose molecules form a continuous matrix with a high rigidity. Therefore, the increased stability of samples when their glass transition temperature is increased to above storage temperature could have simply been coinciding with a decrease of the water content in the mixtures. However, the water content in the trehalose and inulin mixtures used in this study showed only little variation for samples with a glass transition temperature between 40 °C below and 40 °C above the storage temperature. With an average water/sugar mass ratio of approximately 0.02, the standard deviation was only around 10%. Therefore the anchorage mechanism does not appear to play a role in this system, which further reinforces the statement that the stability increase can be attributed to the vitrification theory.
At high glass transition temperatures, where the protein stability reaches the plateau phase, the activity loss was found to be independent from the glass transition temperature. Instead, a steady decline in activity was observed over time, both for inulin and trehalose samples. As is shown in the previous section, the protein can be considered immobile at these glass transition temperatures. At these high glass transition temperatures degradation can only take place when there is either enough free volume or insufficient interaction between the protein and the sugar (i.e. hydrogen bonding). Therefore, the primary stabilization mechanism in this region is most likely water replacement. This hypothesis is supported by the fact that the activity loss with inulin is higher than with trehalose. If stabilization is indeed realized by water replacement, then the difference in activity loss between inulin and trehalose
28 | Chapter 2
must be caused by a difference in the ability of the sugar to form hydrogen bonds with the protein. Since it is likely that the small trehalose molecule will be able to fit the irregular protein surface more closely than the larger inulin molecules, thereby forming more hydrogen bonds with the protein, the resulting stability will be higher. Although the question whether the interaction between the protein and the sugar is direct or facilitated by a hydration layer is not relevant for the current discussion, an interesting observation can be made regarding this subject. If water molecules would be entrapped at the interface between protein and sugar, an influence of the water/protein molar ratio on the stability would be expected. However, no difference in stability was observed between samples with a protein/sugar ratio of 1, 10, and 20 (Figure 3), while the water/protein molar ratio differed substantially (3200, 1600, and 160, respectively). Although it is unknown whether there is a minimum water/protein ratio above which the stability is no longer affected, the results seem to correspond more with the water replacement mechanism rather than the water entrapment mechanism.
In addition to the water entrapment theory, another interesting perspective on the topic is given by the slaving model as proposed by Frauenfelder et al.[30]. In their study, a clear physical explanation is given for the mobility of a protein incorporated in a sugar glass. Instead of considering the mobility of the protein as being autonomous, it is considered to be governed by the surrounding matrix (“slaved”). Large scale motions of the protein are caused by mobility of the matrix bulk, while internal protein motions are caused by local movements in the, several molecules thick, layer surrounding the protein. These motions are designated as primary (α) and secondary (β) fluctuations, respectively. When the viscosity of the matrix bulk is low (rubbery state), α fluctuations cause large scale motions of the protein, which then mainly determine the protein stability. This is in agreement with the vitrification theory. However, at high viscosity (glassy state), α fluctuations in the bulk are absent and the protein stability is mainly determined by local β fluctuations. Although this is a different explanation than given by the water replacement theory, both theories appear to be in agreement with the results of our study. Instead of attributing the stability of the protein at high glass transition temperature to the hydrogen bond formation with the matrix, it is instead attributed to the local mobility of the surrounding, closely confined, molecules. Therefore, the difference in stability at high glass transition temperature between trehalose and inulin should then be explained by their difference in mobility, comparable to the vitrification theory.
If the stability at the high glass transition temperatures is indeed dominated by the water replacement mechanism, it is important to consider the following. As mentioned before, in order to compare the activity of trehalose and inulin samples at the same glass transition temperatures, a relatively higher ammediol/sugar ratio was
Unraveling protein stabilization mechanisms | 29
required for inulin due to its inherently higher glass transition temperature of 155 °C. It could be argued whether or not the protein stability with inulin was different from trehalose due to a more prevalent interaction of the buffer with the protein and not just a difference in molecular mass of the sugar. Studies have already shown that plasticizers can even have a stabilizing effect when added in small amounts, despite the decrease of the glass transition temperature [31, 32]. It is hypothesized that the buffer can form hydrogen bonds with the protein at sites that have not been occupied by the sugar, further stabilizing the protein until the reduced glass transition temperature increases the mobility of the sugar matrix to an extent that enables the protein to degrade. Although in our case ammediol did not seem to have a stabilizing effect on the protein, it is more than likely that a higher ammediol content will cause replacement of part of the sugar, interacting with the protein, by ammediol instead. If ammediol is not as good a stabilizer as the sugar, this could decrease the stability of the protein. However, although it remains unclear whether the difference in stability with inulin and trehalose is mainly caused by the difference in ammediol content or molecular mass, both causes are consistent with the water replacement theory.
Conclusion
In conclusion, it is shown that at glass transition temperatures below the storage temperature protein stabilization is dominated by the vitrification mechanism. However, when the glass transition temperature is raised significantly above the storage temperature, the protein becomes immobile and the water replacement mechanism becomes the dominant mechanism for protein stabilization. Acknowledgments
This research forms part of the Project P3.02 DESIRE of the research program of the BioMedical Materials institute, co-funded by the Dutch Ministry of Economic Affairs, Agriculture and Innovation. This project is part-financed by the European Union, European Regional Development Fund and The Ministry of Economic Affairs, Agriculture and Innovation, Peaks in the Delta References
1. Chang LQ, Pikal MJ. Mechanisms of protein stabilization in the solid state. J Pharm Sci. 2009;98(9):2886-908.
2. Chang L, Shepherd D, Sun J, Ouellette D, Grant KL, Tang X, et al. Mechanism of protein stabilization by sugars during freeze-drying and
30 | Chapter 2
storage: Native structure preservation, specific interaction, and/or immobilization in a glassy matrix? J Pharm Sci. 2005;94(7):1427-44.
3. Sampedro J, Uribe S. Trehalose-enzyme interactions result in structure stabilization and activity inhibition. The role of viscosity. Mol Cell Biochem. 2004;256-257(1):319-27.
4. Carpenter JF, Crowe JH. An infrared spectroscopic study of the interactions of carbohydrates with dried proteins. Biochemistry (Mosc). 1989;28(9):3916-22.
5. Belton PS, Gil AM. IR and Raman spectroscopic studies of the interaction of trehalose with hen egg white lysozyme. Biopolymers. 1994;34(7):957-61.
6. Hancock BC, Shamblin SL, Zografi G. Molecular Mobility of Amorphous Pharmaceutical Solids Below Their Glass Transition Temperatures. Pharm Res. 1995;12(6):799-806.
7. Yu L. Pharmaceutical Quality by Design: Product and Process Development, Understanding, and Control. Pharm Res. 2008;25(4):781-91.
8. Jain NK, Roy I. Effect of trehalose on protein structure. Protein Sci. 2009;18(1):24-36.
9. Kawai K, Suzuki T. Stabilizing effect of four types of disaccharide on the enzymatic activity of freeze-dried lactate dehydrogenase: Step by step evaluation from freezing to storage. Pharm Res. 2007;24(10):1883-90.
10. Hinrichs WLJ, Prinsen MG, Frijlink HW. Inulin glasses for the stabilization of therapeutic proteins. Int J Pharm. 2001;215(1-2):163-74.
11. Amorij JP, Meulenaar J, Hinrichs WLJ, Stegmann T, Huckriede A, Coenen F, et al. Rational design of an influenza subunit vaccine powder with sugar glass technology: Preventing conformational changes of haemagglutinin during freezing and freeze-drying. Vaccine. 2007;25(35):6447-57.
12. Zijlstra GS, J. Ponsioen B, A. Hummel S, Sanders N, Hinrichs WLJ, de Boer AH, et al. Formulation and process development of (recombinant human) deoxyribonuclease I as a powder for inhalation. Pharm Dev Technol. 2009;14(4):358-68.
13. Rodríguez Furlán LT, Padilla AP, Campderrós ME. Inulin like lyoprotectant of bovine plasma proteins concentrated by ultrafiltration. Food Research International. 2010;43(3):788-96.
14. Eriksson JHC, Hinrichs WLJ, de Jong GJ, Somsen GW, Frijlink HW. Investigations into the stabilization of drugs by sugar glasses: III. The influence of various high-pH buffers. Pharm Res. 2003;20(9):1437-43.
15. Hancock BC, Zografi G. The relationship between the glass transition temperature and the water content of amorphous pharmaceutical solids. Pharm Res. 1994;11(4):471-7.
Unraveling protein stabilization mechanisms | 31
16. Gordon M, Taylor JS. Ideal copolymers and the second-order transitions of synthetic rubbers. i. non-crystalline copolymers. Journal of Applied Chemistry. 1952;2(9):493-500.
17. Velikov V, Borick S, Angell CA. The glass transition of water, based on hyperquenching experiments. Science. 2001;294(5550):2335-8.
18. Miller AA. Glass-transition temperature of water. Science. 1969;163(3873):1325-6.
19. Giovambattista N, Angell CA, Sciortino F, Stanley HE. Glass-Transition Temperature of Water: A Simulation Study. Phys Rev Lett. 2004;93(4):047801.
20. Barrio M, Font J, López D, Muntasell J, Tamarit J, Cossio F. Polymorphism in 2-Amino-2-Methyl-l,3 propanediol plastic crystal. Journal of Phase Equilibria. 1991;12(4):409-15.
21. Crowe LM, Reid DS, Crowe JH. Is trehalose special for preserving dry biomaterials? Biophys J. 1996;71(4):2087-93.
22. Chen T, Fowler A, Toner M. Literature Review: Supplemented Phase Diagram of the Trehalose–Water Binary Mixture. Cryobiology. 2000;40(3):277-82.
23. Roos Y. Melting and glass transitions of low molecular weight carbohydrates. Carbohydr Res. 1993;238(0):39-48.
24. Yaws CL, Yang HC. To estimate vapor pressure easily. Hydrocarbon Processing. 1989;68(10):65-70.
25. Imamura K, Ohyama K-i, Yokoyama T, Maruyama Y, Kazuhiro N. Temperature scanning FTIR analysis of secondary structures of proteins embedded in amorphous sugar matrix. J Pharm Sci. 2009;98(9):3088-98.
26. Bellavia G, Giuffrida S, Cottone G, Cupane A, Cordone L. Protein Thermal Denaturation and Matrix Glass Transition in Different Protein−Trehalose−Water Systems. The Journal of Physical Chemistry B. 2011;115(19):6340-6.
27. Wolkers WF, Oliver AE, Tablin F, Crowe JH. A Fourier-transform infrared spectroscopy study of sugar glasses. Carbohydr Res. 2004;339(6):1077-85.
28. Shirke S, Ludescher RD. Molecular mobility and the glass transition in amorphous glucose, maltose, and maltotriose. Carbohydr Res. 2005;340(17):2654-60.
29. Francia F, Dezi M, Mallardi A, Palazzo G, Cordone L, Venturoli G. Protein−Matrix Coupling/Uncoupling in “Dry” Systems of Photosynthetic Reaction Center Embedded in Trehalose/Sucrose: The Origin of Trehalose Peculiarity. J Am Chem Soc. 2008;130(31):10240-6.
32 | Chapter 2
30. Frauenfelder H, Chen G, Berendzen J, Fenimore PW, Jansson H, McMahon BH, et al. A unified model of protein dynamics. Proceedings of the National Academy of Sciences. 2009;106(13):5129-34.
31. Chang L, Shepherd D, Sun J, Tang X, Pikal MJ. Effect of sorbitol and residual moisture on the stability of lyophilized antibodies: Implications for the mechanism of protein stabilization in the solid state. J Pharm Sci. 2005;94(7):1445-55.
32. Cicerone MT, Soles CL. Fast Dynamics and Stabilization of Proteins: Binary Glasses of Trehalose and Glycerol. Biophys J. 2004;86(6):3836-45.

Unraveling protein stabilization mechanisms | 33

34 | Chapter 3