Embed Size (px)
DESCRIPTION
Update to and Demonstration of NWS/NCEP Meteorological Models and their Utility for Air Quality. Jeff McQueen, Pius Lee, Jianping Huang, Ho-Chun Huang, Perry Shafran , Jerry Gorline , Eric Rogers, Geoff DiMego & Ivanka Stajner October 28, 2014. NAM V3.1 Model Changes. - PowerPoint PPT Presentation
Citation preview
Update to and Demonstration of NWS/NCEP Meteorological Models and
their Utility for Air QualityJeff McQueen, Pius Lee, Jianping Huang,
Ho-Chun Huang, Perry Shafran, Jerry Gorline,Eric Rogers, Geoff DiMego & Ivanka Stajner
October 28, 2014
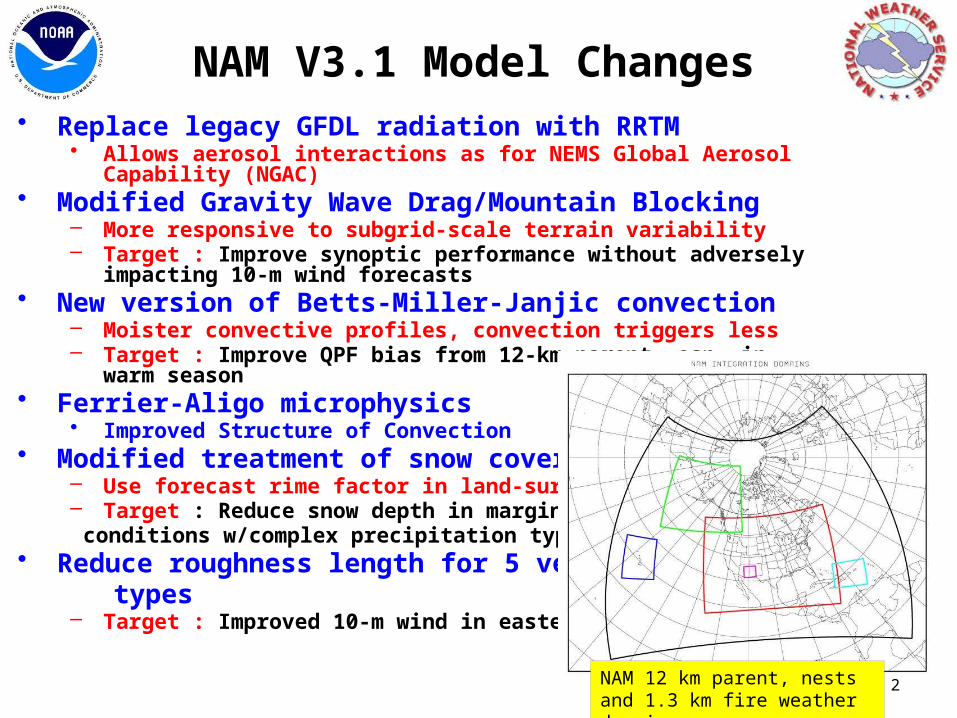
NAM V3.1 Model Changes • Replace legacy GFDL radiation with RRTM
• Allows aerosol interactions as for NEMS Global Aerosol Capability (NGAC)• Modified Gravity Wave Drag/Mountain Blocking
– More responsive to subgrid-scale terrain variability– Target : Improve synoptic performance without adversely impacting 10-m wind
forecasts• New version of Betts-Miller-Janjic convection
– Moister convective profiles, convection triggers less– Target : Improve QPF bias from 12-km parent, esp. in warm season
• Ferrier-Aligo microphysics• Improved Structure of Convection
• Modified treatment of snow cover/depth– Use forecast rime factor in land-surface physics– Target : Reduce snow depth in marginal winter conditions w/complex precipitation type
• Reduce roughness length for 5 vegetation types
– Target : Improved 10-m wind in eastern CONUS
2NAM 12 km parent, nests and 1.3 km fire weather domains
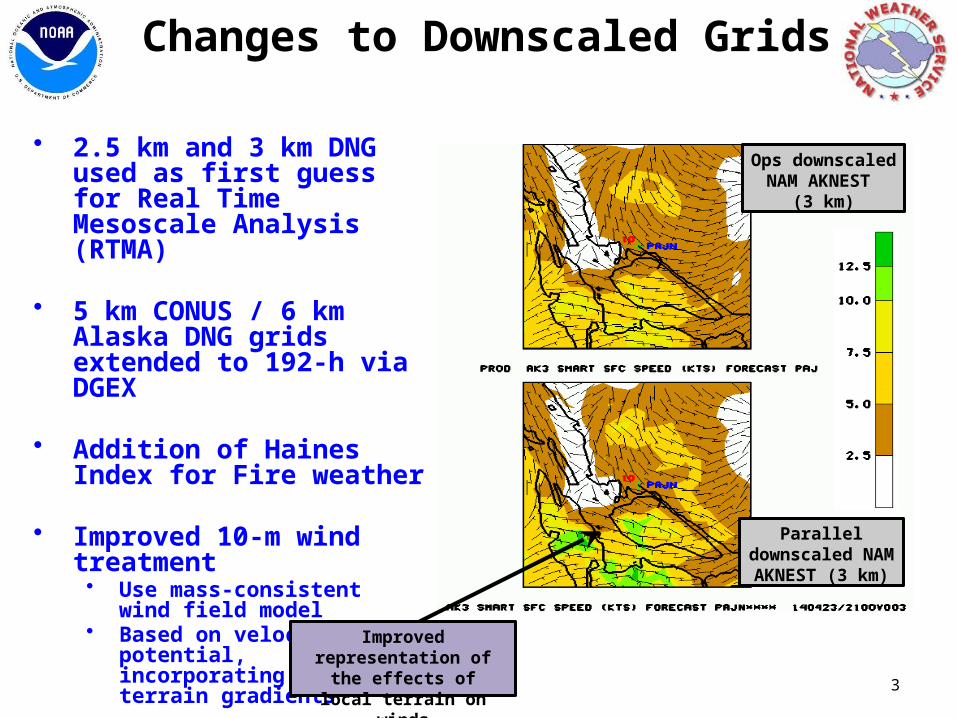
Changes to Downscaled Grids
• 2.5 km and 3 km DNG used as first guess for Real Time Mesoscale Analysis (RTMA)
• 5 km CONUS / 6 km Alaska DNG grids extended to 192-h via DGEX
• Addition of Haines Index for Fire weather
• Improved 10-m wind treatment• Use mass-consistent wind field
model• Based on velocity potential,
incorporating local terrain gradients
3
Ops downscaled NAM AKNEST
(3 km)
Parallel downscaled NAM AKNEST (3 km)
Improved representation of the effects of local
terrain on winds
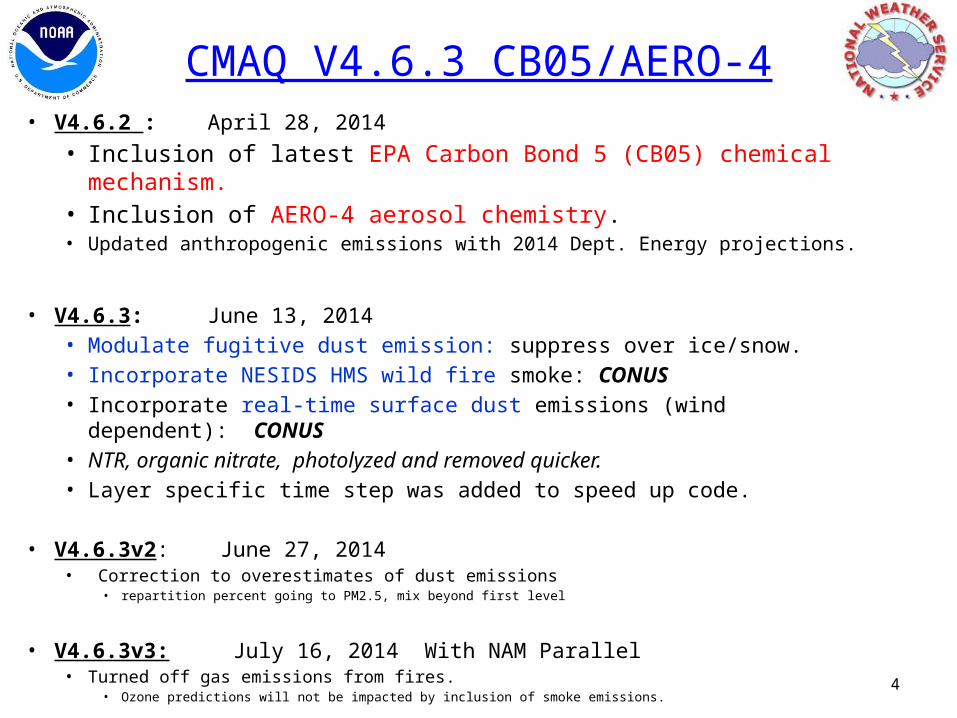
• V4.6.2 : April 28, 2014• Inclusion of latest EPA Carbon Bond 5 (CB05) chemical mechanism.• Inclusion of AERO-4 aerosol chemistry.• Updated anthropogenic emissions with 2014 Dept. Energy projections.
• V4.6.3: June 13, 2014• Modulate fugitive dust emission: suppress over ice/snow.• Incorporate NESIDS HMS wild fire smoke: CONUS • Incorporate real-time surface dust emissions (wind dependent): CONUS • NTR, organic nitrate, photolyzed and removed quicker.• Layer specific time step was added to speed up code.
• V4.6.3v2: June 27, 2014• Correction to overestimates of dust emissions
• repartition percent going to PM2.5, mix beyond first level
• V4.6.3v3: July 16, 2014 With NAM Parallel• Turned off gas emissions from fires.
• Ozone predictions will not be impacted by inclusion of smoke emissions.
CMAQ V4.6.3 CB05/AERO-4
4
5
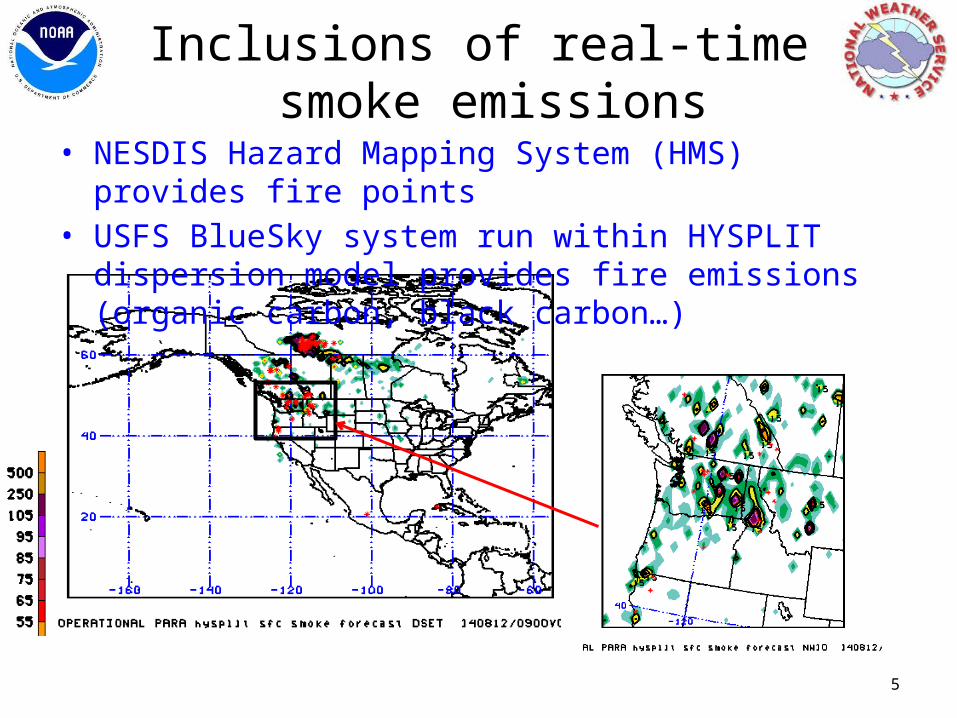
Inclusions of real-time smoke emissions
• NESDIS Hazard Mapping System (HMS) provides fire points• USFS BlueSky system run within HYSPLIT dispersion model
provides fire emissions (organic carbon, black carbon…)
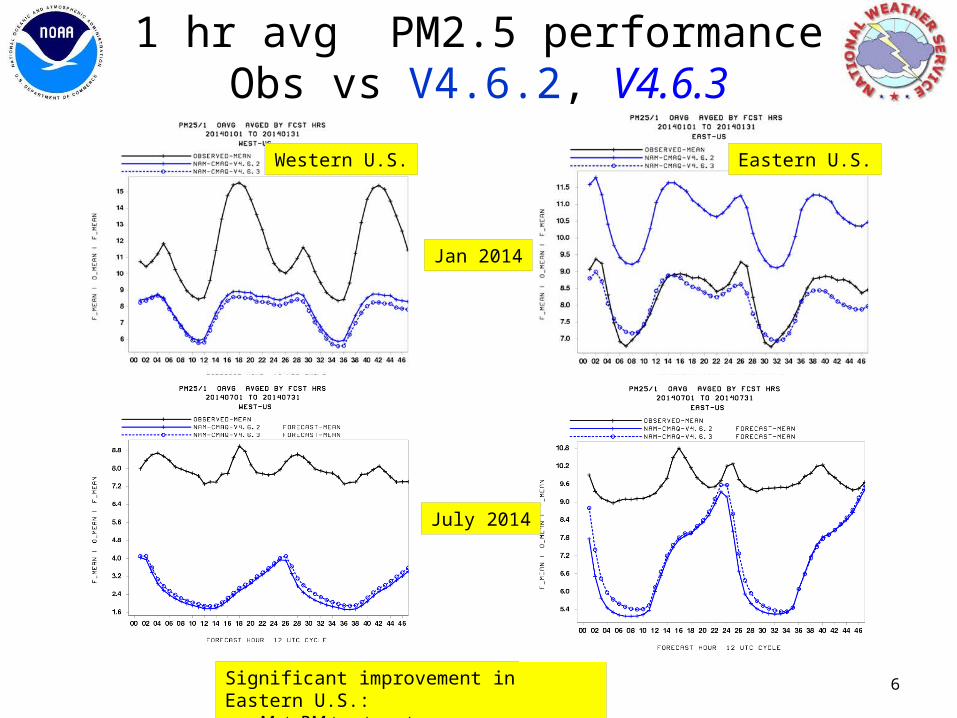
1 hr avg PM2.5 performanceObs vs V4.6.2, V4.6.3
6
Eastern U.S.Western U.S.
Significant improvement in Eastern U.S.: - Met, PM treatment over snow
Jan 2014
July 2014
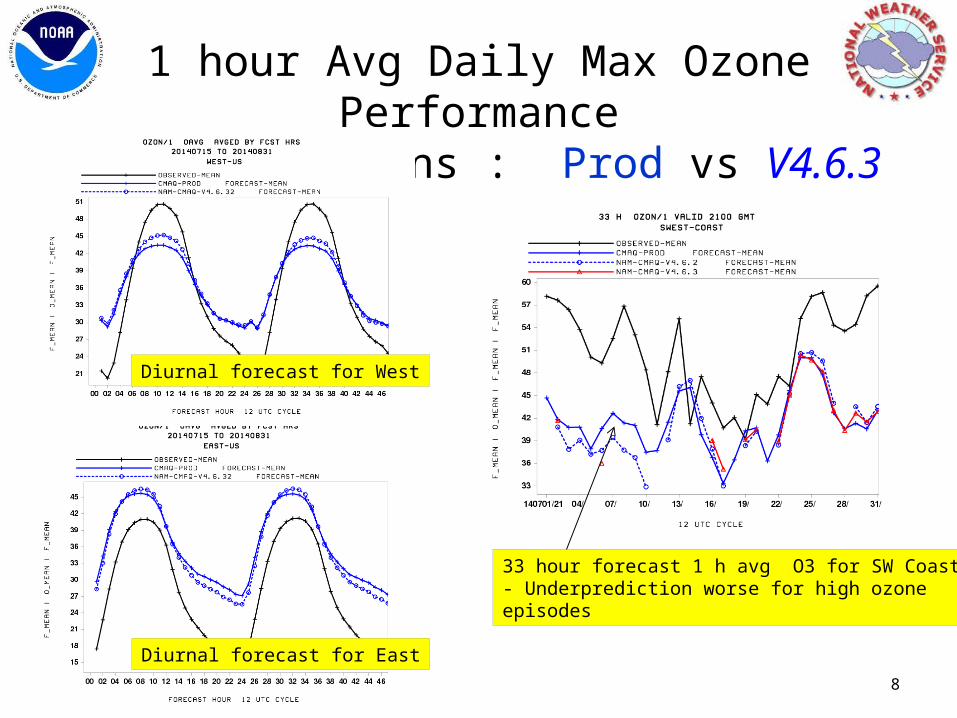
1 hour Avg Daily Max Ozone Performancevs observations : Prod vs V4.6.3
8
33 hour forecast 1 h avg O3 for SW Coast- Underprediction worse for high ozoneepisodes
Parallel
Diurnal forecast for West
Diurnal forecast for East
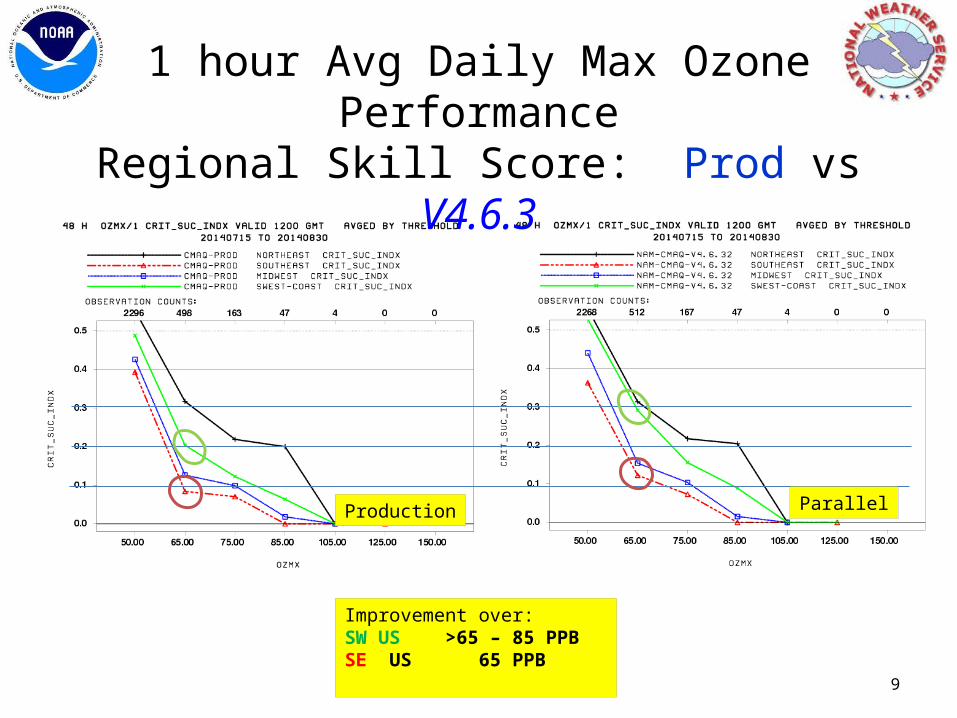
Improvement over:SW US >65 – 85 PPBSE US 65 PPB
1 hour Avg Daily Max Ozone PerformanceRegional Skill Score: Prod vs V4.6.3
9
Production Parallel
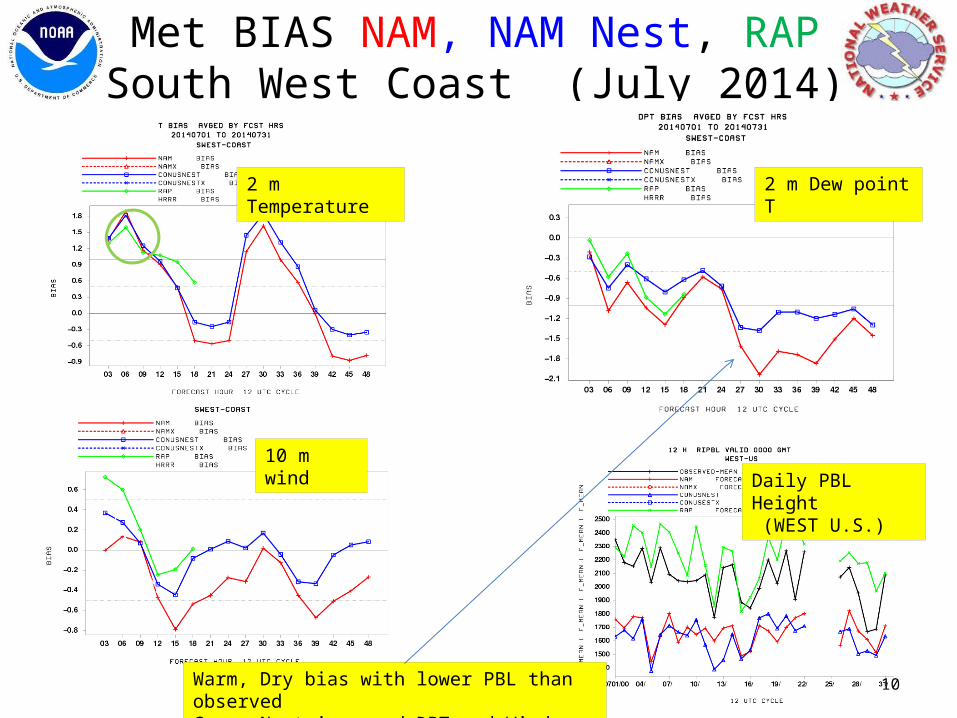
Met BIAS NAM, NAM Nest, RAPSouth West Coast (July 2014)
10Warm, Dry bias with lower PBL than observedConus Nest improved DPT and Winds
2 m Temperature 2 m Dew point T
10 m windDaily PBL Height (WEST U.S.)
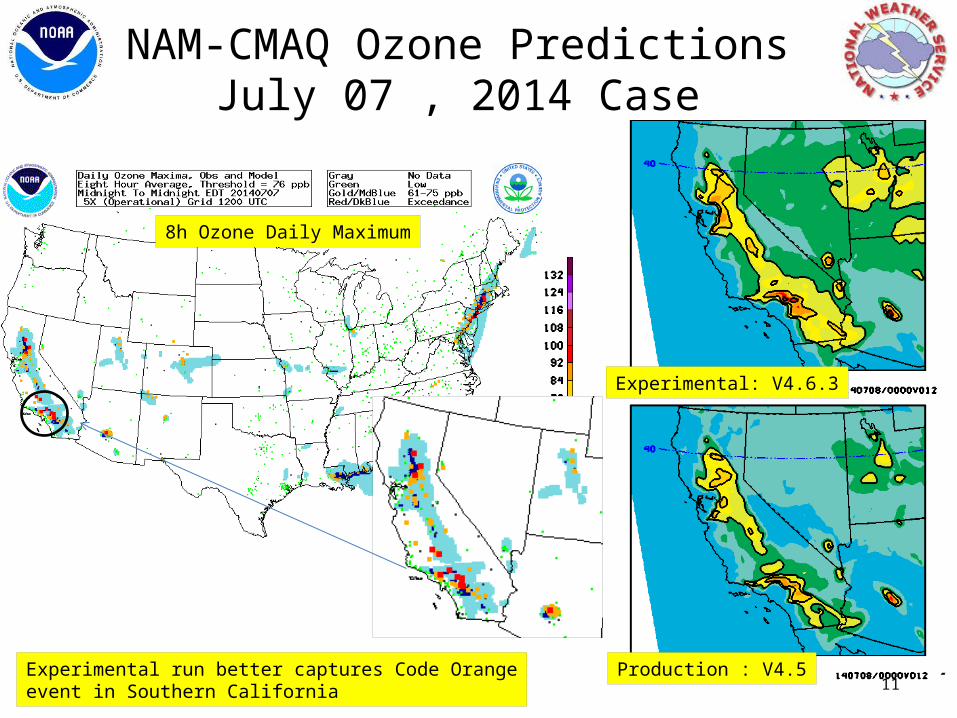
NAM-CMAQ Ozone PredictionsJuly 07 , 2014 Case
11Experimental run better captures Code Orangeevent in Southern California
Experimental: V4.6.3
Production : V4.5
8h Ozone Daily Maximum
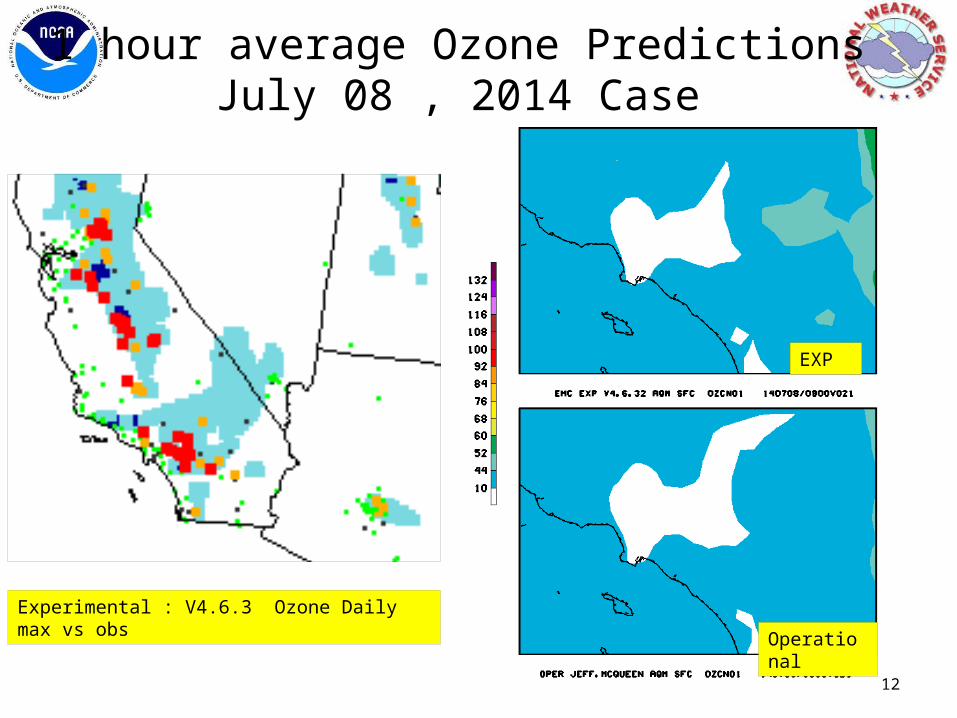
1 hour average Ozone PredictionsJuly 08 , 2014 Case
12
EXP
Operational
Experimental : V4.6.3 Ozone Daily max vs obs
13
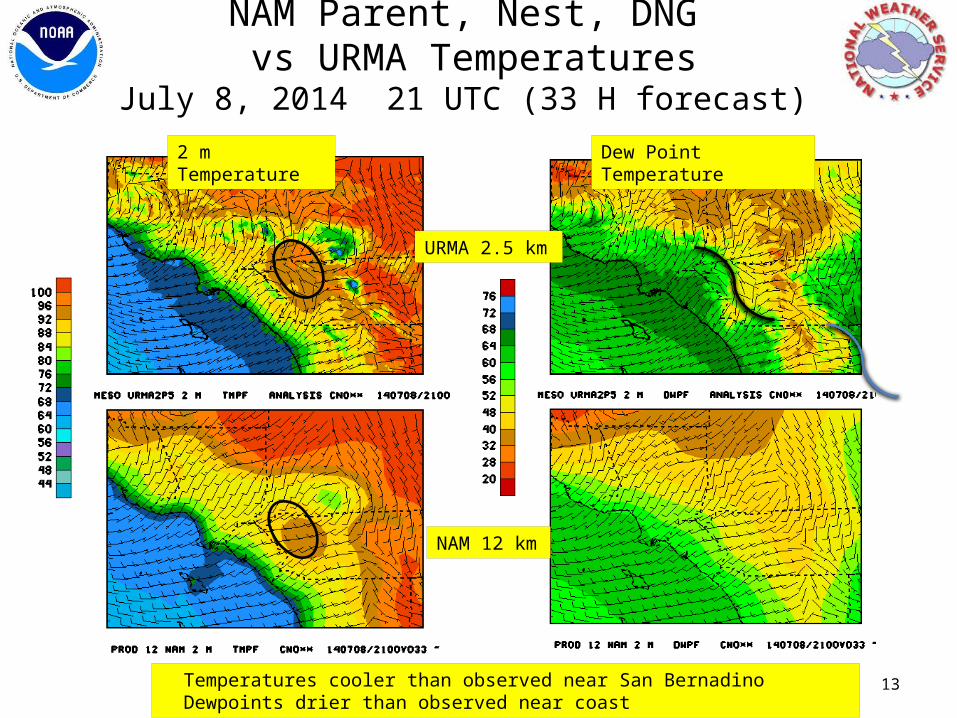
NAM Parent, Nest, DNG vs URMA Temperatures
July 8, 2014 21 UTC (33 H forecast)
Temperatures cooler than observed near San Bernadino Dewpoints drier than observed near coast
Dew Point Temperature2 m Temperature
URMA 2.5 km
NAM 12 km
14
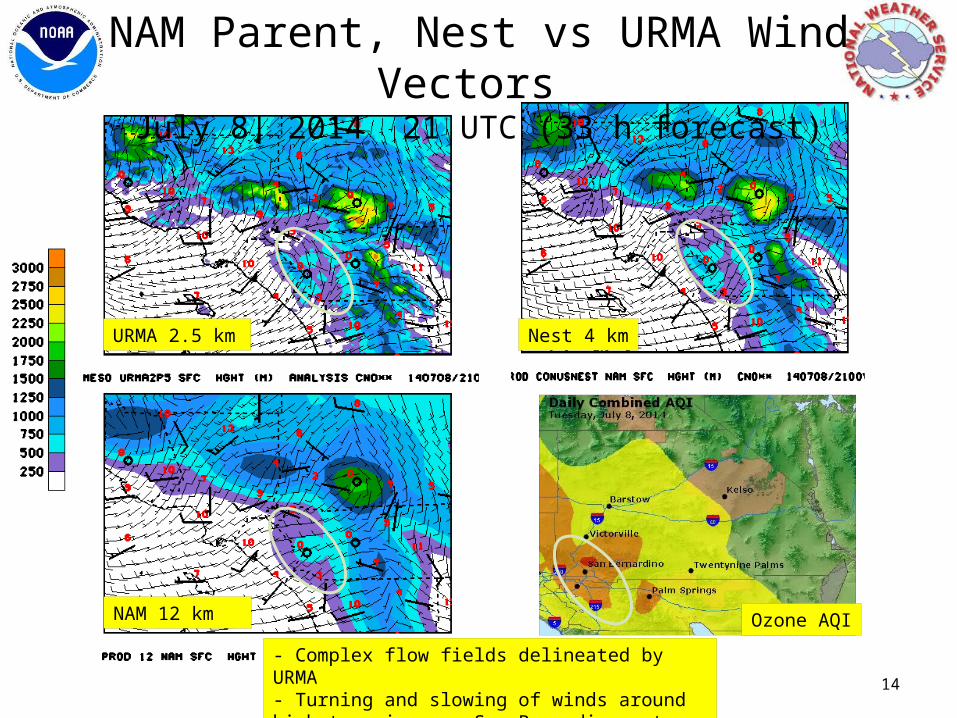
NAM Parent, Nest vs URMA Wind Vectors July 8, 2014 21 UTC (33 h forecast)
- Complex flow fields delineated by URMA- Turning and slowing of winds around high terrain near San Bernadino not captured by NAM 12
URMA 2.5 km
NAM 12 km
Nest 4 km
Ozone AQI
15
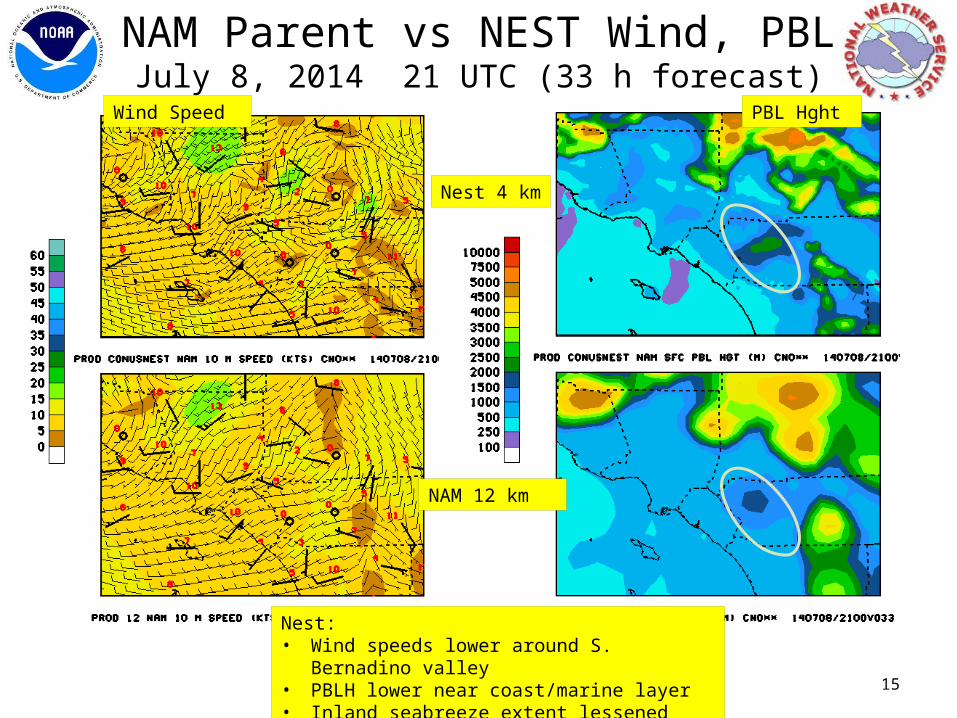
NAM Parent vs NEST Wind, PBLJuly 8, 2014 21 UTC (33 h forecast)
Nest:• Wind speeds lower around S. Bernadino valley• PBLH lower near coast/marine layer• Inland seabreeze extent lessened
Wind Speed
NAM 12 km
Nest 4 km
PBL Hght
19
Summary• Smoke, dust, ozone, anthropogenic PM : unified system using CMAQ V4.6.3
supported by CMAS.
• Ozone predictions improved with latest changes to V4.6.3– Although strong under-prediction in California still evident
• PBL under-predicted with NAM upgrade:– may contribute to Eastern U.S ozone over-predictions
• NWS Un-Restricted Mesoscale Analysis (2.5 km) proved useful for evaluating NAM 12 and 4 km predictions
• 4 km Nest useful for identifying processes not resolved with 12 km runs - 4 km nest captured blocking flow in San Bernadino Valley, California
• Met performance should be carefully evaluated while proceeding to address other system errors
- Concern that we are making changes to chem/emissions that mask 1st order met errors
20
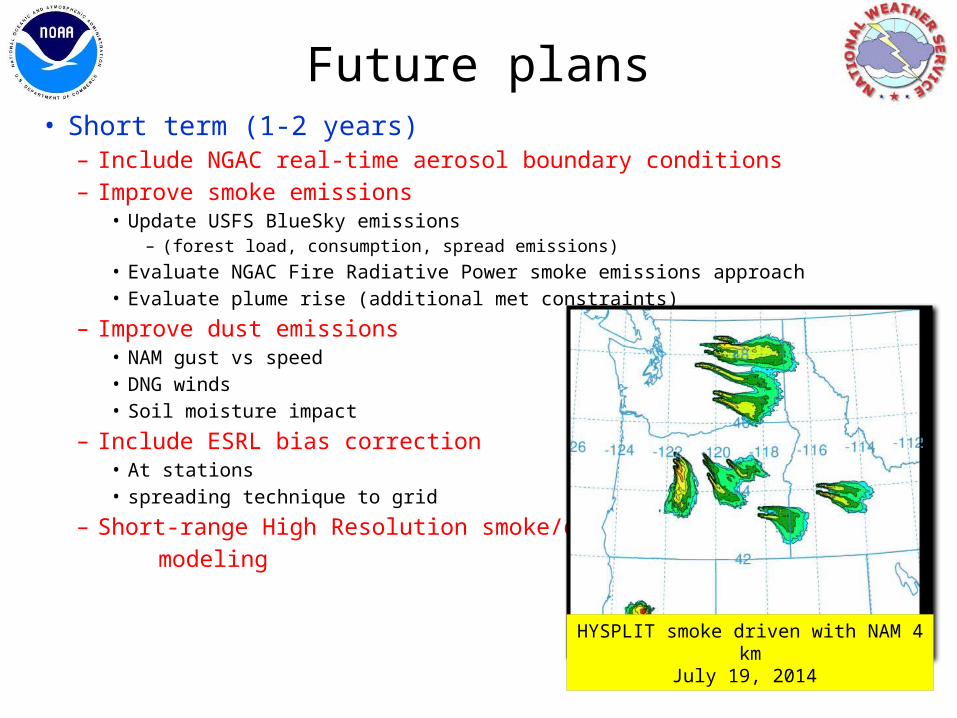
Future plans• Short term (1-2 years)
– Include NGAC real-time aerosol boundary conditions– Improve smoke emissions
• Update USFS BlueSky emissions – (forest load, consumption, spread emissions)
• Evaluate NGAC Fire Radiative Power smoke emissions approach• Evaluate plume rise (additional met constraints)
– Improve dust emissions• NAM gust vs speed• DNG winds• Soil moisture impact
– Include ESRL bias correction• At stations • spreading technique to grid
– Short-range High Resolution smoke/dust modeling
HYSPLIT smoke driven with NAM 4 kmJuly 19, 2014