Embed Size (px)
Citation preview
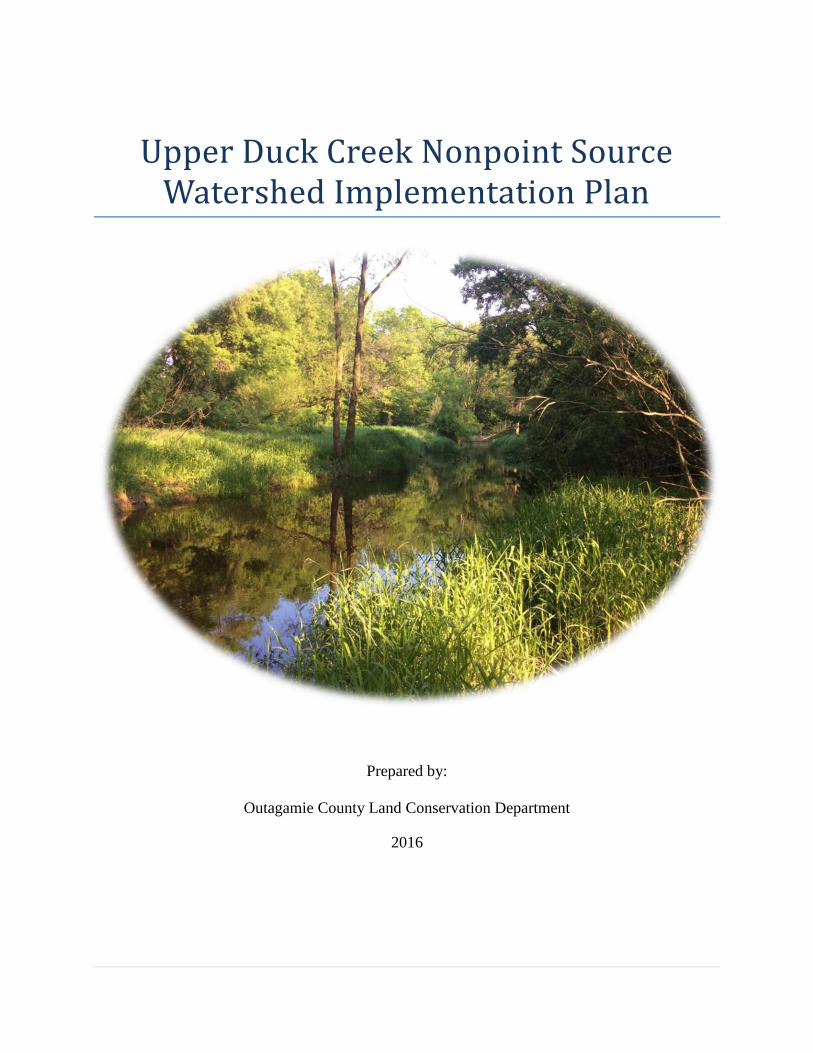
Upper Duck Creek Nonpoint Source Watershed Implementation Plan
Prepared by:
Outagamie County Land Conservation Department
2016

(This page intentionally left blank)
Upper Duck Creek Nonpoint Source Watershed
Implementation Plan
Prepared By:
Outagamie County Land Conservation Department
3365 W. Brewster St.
Appleton, WI 54914
May 2016

(This page intentionally left blank)

i
Table of Contents List of Figures ................................................................................................................................ iii
List of Tables .................................................................................................................................. v
List of Appendices ......................................................................................................................... vi
Acknowledgements ................................................................................................................... vii
Executive Summary ................................................................................................................... ix
1.0 Introduction ............................................................................................................................... 1
1.1 Upper Duck Watershed Setting ............................................................................................ 1
1.2 Purpose .................................................................................................................................. 2
1.3 US EPA Watershed Plan Requirements ............................................................................... 3
1.4 Prior Studies, Projects, and Existing Resource Management and Comprehensive Plans .... 4
1.5 Wisconsin Ecoregion ............................................................................................................ 6
1.6 Climate .................................................................................................................................. 7
1.7 Topology and geology .......................................................................................................... 7
1.8 Soil Characteristics ............................................................................................................... 9
2.0 Watershed Jurisdictions, Demographics, and Transportation Network.................................. 13
2.1 Watershed Jurisdictions ...................................................................................................... 13
2.2 Jurisdictional Roles and Responsibilities............................................................................ 14
2.3 Transportation ..................................................................................................................... 15
2.4 Population Demographics ................................................................................................... 16
3.0 Land Use/Land Cover ............................................................................................................. 17
3.1 Existing Land Use/Land Cover ........................................................................................... 17
3.2 Crop Rotation ...................................................................................................................... 19
4.0 Water Quality .......................................................................................................................... 21
4.1 Designated Use and Impairments ....................................................................................... 21
4.2 Point Sources ...................................................................................................................... 22
4.3 Nonpoint Sources ................................................................................................................ 22
4.4 Water Quality Monitoring................................................................................................... 24
5.0 Pollutant Loading Model ........................................................................................................ 29
6.0 Watershed Inventory ............................................................................................................... 33
ii
6.1 Barnyard Inventory Results ................................................................................................ 33
6.2 Streambank Inventory Results ............................................................................................ 35
6.3 Upland Inventory ................................................................................................................ 37
6.4 Wetland Inventory .............................................................................................................. 52
7.0 Watershed Goals and Management Objectives ...................................................................... 57
8.0 Management Measures Implementation ................................................................................. 59
9.0 Load Reductions ..................................................................................................................... 63
10.0 Information and Education ................................................................................................... 67
10.1 Alliance for the Great Lakes Survey ................................................................................. 67
10.2 Recommended Information and Education Campaigns ................................................... 70
11.0 Cost Analysis ........................................................................................................................ 77
12.0 Funding Sources.................................................................................................................... 81
12.1 Federal and State Funding Sources ................................................................................... 81
12.2 Adaptive Management and Water Quality Trading .......................................................... 82
12.3 Phosphorus Multi- Discharger Variance (Wisconsin Act 378) ........................................ 83
13.0 Measuring Plan Progress and Success .................................................................................. 85
13.1 Water Quality Monitoring................................................................................................. 85
13.2 Tracking of Progress and Success of Plan ........................................................................ 89
13.3 Progress Evaluation .......................................................................................................... 91
14.0 Literature Cited ..................................................................................................................... 95
iii
List of Figures
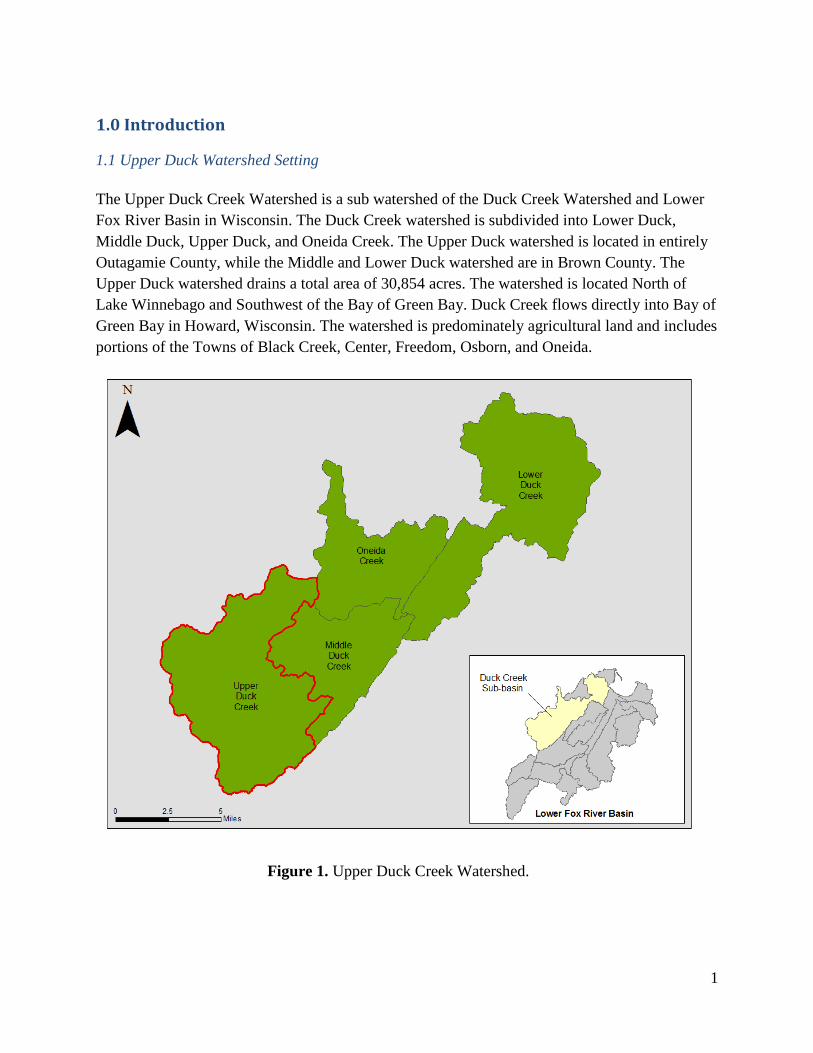
Figure 1. Upper Duck Creek Watershed. ........................................................................................ 1
Figure 2. Mouth of the Fox River emptying into the Bay of Green Bay, April 2011. Photo Credit:
Steve Seilo. ..................................................................................................................................... 2
Figure 3. Map of Ecoregions of Wisconsin. Source: Omerik et al 2000. ....................................... 6
Figure 4. Ice Age Geology of Wisconsin. ©Mountain Press, 2004................................................ 7
Figure 5. Digital Elevation Model. ................................................................................................. 8
Figure 6. Soil Hydrologic Groups. ................................................................................................ 10
Figure 7. Soil erodibility. .............................................................................................................. 11
Figure 8. Watershed Jurisdictions. ................................................................................................ 13
Figure 9. Up Duck Creek Legal Drains. ....................................................................................... 14
Figure 10. Transportation.............................................................................................................. 15
Figure 11. NLCD 2011 Land Use. ................................................................................................ 18
Figure 12. Crop rotation in Upper Duck Creek Watershed 2009-2014. ....................................... 20
Figure 13. Impaired stream segments. .......................................................................................... 21
Figure 14. Duck Creek Monitoring Sites. ..................................................................................... 24
Figure 15. LFRWMP Phosphorus and Turbidity data at Cth FF location 2003-2014. ................. 25
Figure 16. LFRWMP Phosphorus and Turbidity data Overland Rd Location 2003-2014. .......... 25
Figure 17. LFRWMP Macroinvertebrate Citizen Biotic Index Score 2004-2014, Duck Creek,
WI. ................................................................................................................................................ 26
Figure 18. Water quality data from Duck Creek at Cth FF(Hillcrest Rd) WDNR Station ID
053690 from 2011-2013. .............................................................................................................. 27
Figure 19. Duck Creek subbasin used for SWAT model. ............................................................. 29
Figure 20. Sources of baseline TP in Upper Duck Creek Watershed. .......................................... 30
Figure 21. Sources of baseline TSS loading in the Upper Duck Creek Watershed. ..................... 31
Figure 22. Location of active livestock operations in Upper Duck Creek Watershed. ................ 34
Figure 23. Duck Creek from Cty TK S Bridge looking south. ..................................................... 35
Figure 24. Streambank Inventory data. ......................................................................................... 36
Figure 25. Field in watershed with little crop residue (3/19/2015). ............................................. 37
Figure 26. Correlation between observed crop residue cover and minNDTI values in Upper Duck
Creek Watershed in Spring of 2015. ............................................................................................. 38
Figure 27. Crop Residue Cover Estimates based on Normalize Difference Tillage Index (March
2015-May 2015)............................................................................................................................ 39
Figure 28. Erosion vulnerability. .................................................................................................. 40
Figure 29. USLE (Low Cover-High Cover) Soil Loss Difference. .............................................. 41
Figure 30. Nutrient Management Plan coverage. ......................................................................... 42
Figure 31. Soil test phosphorus concentration (left) and soil Phosphorus Index (right). ............. 43
Figure 32. Tiled fields in Upper Duck Creek Watershed. ............................................................ 45
Figure 33. Priority riparian and legal drain buffer restoration sites. ............................................. 47
Figure 34. High stream power index indicating potential gully erosion....................................... 48
iv
Figure 35. Areas of concentrated flow causing gully and sheet erosion in Upper Duck Creek
Watershed (3/20/15)...................................................................................................................... 49
Figure 36. Priority locations for grassed waterways and concentrated flow area plantings. ........ 50
Figure 37. Previous conservation practices installed in the Upper Duck Creek. .......................... 51
Figure 38. Existing and Potentially Restorable Wetlands (Wisconsin Department of Natural
Resources) ..................................................................................................................................... 52
Figure 39. Duck-Pensaukee Wetland Assessment of Number of Services for Potentially
Restorable Wetlands. (The Nature Conservancy & Environmental Law Institute)...................... 54
Figure 40. Duck-Pensaukee Wetland assessment of flood abatement services for potentially
restorable wetlands. (The Nature Conservancy & Environmental Law Institute) ........................ 55
Figure 41. Duck-Pensaukee wetland assessment of water quality protection for potentially
restorable wetlands. (The Nature Conservancy & Environmental Law Institute ......................... 56
Figure 42. Survey results on Thoughts on Current Conservation Programs in all subwatersheds.
(Alliance for the Great Lakes) ...................................................................................................... 68
Figure 43. Survey responses to severity of sources of pollution in the Lower Fox River and Bay
of Green Bay. (Alliance for the Great Lakes) ............................................................................... 70
Figure 44. Approximate sample locations for the Lower Fox River Volunteer Monitoring. ....... 85
Figure 45. Priority location for additional monitoring station on Duck Creek. ............................ 86
Figure 46. Adaptive Management Process ................................................................................... 91
Figure 47. Pollutant load allocation map for Duck Creek. ........................................................... 99
Figure 48. Riparian buffer catchment. ........................................................................................ 104
v
List of Tables
Table 1. Hydrologic Soil Group...................................................................................................... 9
Table 2. Hydrologic Soil Group Description. ................................................................................. 9
Table 3. Watershed Jurisdictions. ................................................................................................. 13
Table 4. Population Projections. Source: Wisconsin Department of Administration Demographic
Services Center (Eagan-Robertson 2013) ..................................................................................... 16
Table 5. Population and Median House Hold Income. Source: U.S. Census Bureau (US Census
Bureau 2010 & 2008-2012 US Census Bureau American Community Survey 5 Year Estimates)
....................................................................................................................................................... 16
Table 6. Land Use/Land Cover. Source: NLCD 2011. ................................................................. 17
Table 7. Crop Rotation. ................................................................................................................. 19
Table 8. Annual water quality statistics Duck Creek near Howard, WI 2004-2008 (USGS
04072150) ..................................................................................................................................... 26
Table 9. STEPL model TP & TSS baseline loading results. ........................................................ 30
Table 10. Farms with >15 lbs P/year loading. .............................................................................. 33
Table 11. Watershed Goals and Management Objectives. ........................................................... 57
Table 12. Management Measures Implementation Plan Matrix. .................................................. 60
Table 13. Expected load reductions from recommended best management practices. ................ 64
Table 14. Information and Education Plan Implementation Matrix. ............................................ 73
Table 15. Cost estimates for implementation of best management practices. .............................. 77
Table 16. Information and Education Costs. ................................................................................ 78
Table 17. Water Quality Monitoring Costs................................................................................... 79
Table 18. Comparison of Adaptive Management and Water Quality Trading. ............................ 82
Table 19. Water quality monitoring indicators for success. ......................................................... 88
Table 20. Information and Education Plan Implementation Goal Milestones .............................. 93
Table 21. Cropland Best Management practices reduction efficiencies. .................................... 102
Table 22. STEPL inputs for combined cropland practices and load reductions. ........................ 103
Table 23. STEPL inputs for Vegetative Buffers and Load Reductions. ..................................... 104
Table 24. STEPL inputs and load reductions for wetland restoration. ....................................... 105
Table 25. STEPL inputs and load reductions for treatment wetlands......................................... 105
Table 26. STEPL inputs for gully dimensions and load reductions from grassed
waterways/WASCOB’s. ............................................................................................................. 106
Table 27. STEPL inputs for gullies/concentrated flow and load reductions from concentrated
flow area planting. ...................................................................................................................... 106
vi
List of Appendices
Appendix A. Glossary of Terms and Acronyms. .......................................................................... 97
Appendix B. Pollutant load allocations for Duck Creek Subbasin. (Obtained from: Total
Maximum Daily Load and Watershed Plan for Total Phosphorus and Total Suspended Solids in
the Lower Fox River Basin and Lower Green Bay) ..................................................................... 99
Appendix C. STEPL Inputs & Results for best management practices. ..................................... 102
Appendix D. Lower Fox River Surface Water Monitoring Summary........................................ 107
Appendix E. Strategy to meet Lower Fox TMDL phosphorus reduction target. ....................... 109
vii
Acknowledgements
Funding for the development of the Upper Duck Creek Watershed plan was provided by an
EPA-319 grant. Outagamie County Land Conservation Department staff conducted analysis,
summarized results, and authored the Upper Duck Creek Watershed plan.
Primary Authors and Contributors to the Nonpoint Source Watershed Implementation Plan:
Outagamie County Land Conservation Department- Sarah Francart, Greg Baneck, Jeremy
Freund, Traci Meulmans, Sarah Minniecheske
Alliance for the Great Lakes- Olga Lyandres, Aritree Samanta, Todd Brennan
Wisconsin Department of Natural Resources- Andrew Craig
A special acknowledgement and thank you to all the landowners that participated in the Alliance
for the Great Lakes Survey and the local agronomists and consultants who helped administer the
survey.

viii
(This page intentionally left blank)
ix
Upper Duck Watershed Implementation Plan
Executive Summary
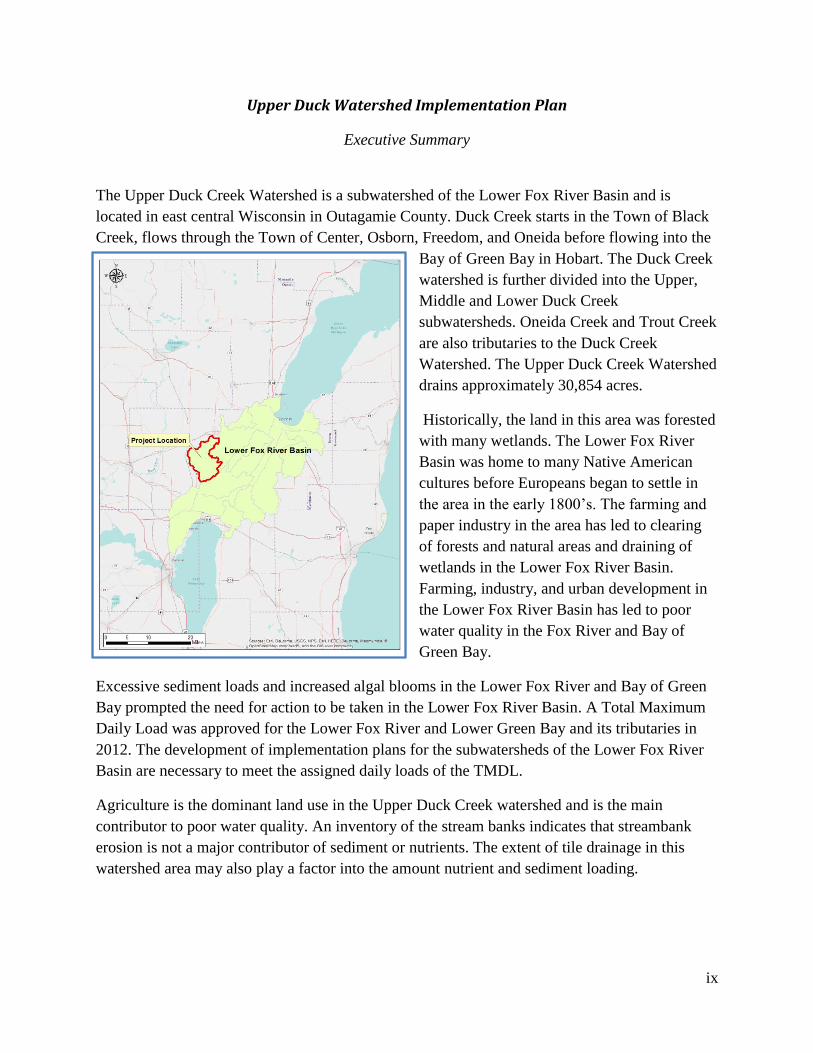
The Upper Duck Creek Watershed is a subwatershed of the Lower Fox River Basin and is
located in east central Wisconsin in Outagamie County. Duck Creek starts in the Town of Black
Creek, flows through the Town of Center, Osborn, Freedom, and Oneida before flowing into the
Bay of Green Bay in Hobart. The Duck Creek
watershed is further divided into the Upper,
Middle and Lower Duck Creek
subwatersheds. Oneida Creek and Trout Creek
are also tributaries to the Duck Creek
Watershed. The Upper Duck Creek Watershed
drains approximately 30,854 acres.
Historically, the land in this area was forested
with many wetlands. The Lower Fox River
Basin was home to many Native American
cultures before Europeans began to settle in
the area in the early 1800’s. The farming and
paper industry in the area has led to clearing
of forests and natural areas and draining of
wetlands in the Lower Fox River Basin.
Farming, industry, and urban development in
the Lower Fox River Basin has led to poor
water quality in the Fox River and Bay of
Green Bay.
Excessive sediment loads and increased algal blooms in the Lower Fox River and Bay of Green
Bay prompted the need for action to be taken in the Lower Fox River Basin. A Total Maximum
Daily Load was approved for the Lower Fox River and Lower Green Bay and its tributaries in
2012. The development of implementation plans for the subwatersheds of the Lower Fox River
Basin are necessary to meet the assigned daily loads of the TMDL.
Agriculture is the dominant land use in the Upper Duck Creek watershed and is the main
contributor to poor water quality. An inventory of the stream banks indicates that streambank
erosion is not a major contributor of sediment or nutrients. The extent of tile drainage in this
watershed area may also play a factor into the amount nutrient and sediment loading.
x
The Upper Duck Creek Watershed plan provides a framework to accomplish the following goals:
Goal #1: Improve surface water quality to meet the TMDL limits for total phosphorus and
sediment.
Goal #2: Increase citizens’ awareness of water quality issues and active participation in
stewardship of the watershed.
Goal #3: Reduce runoff volume and flood levels during peak storm events.
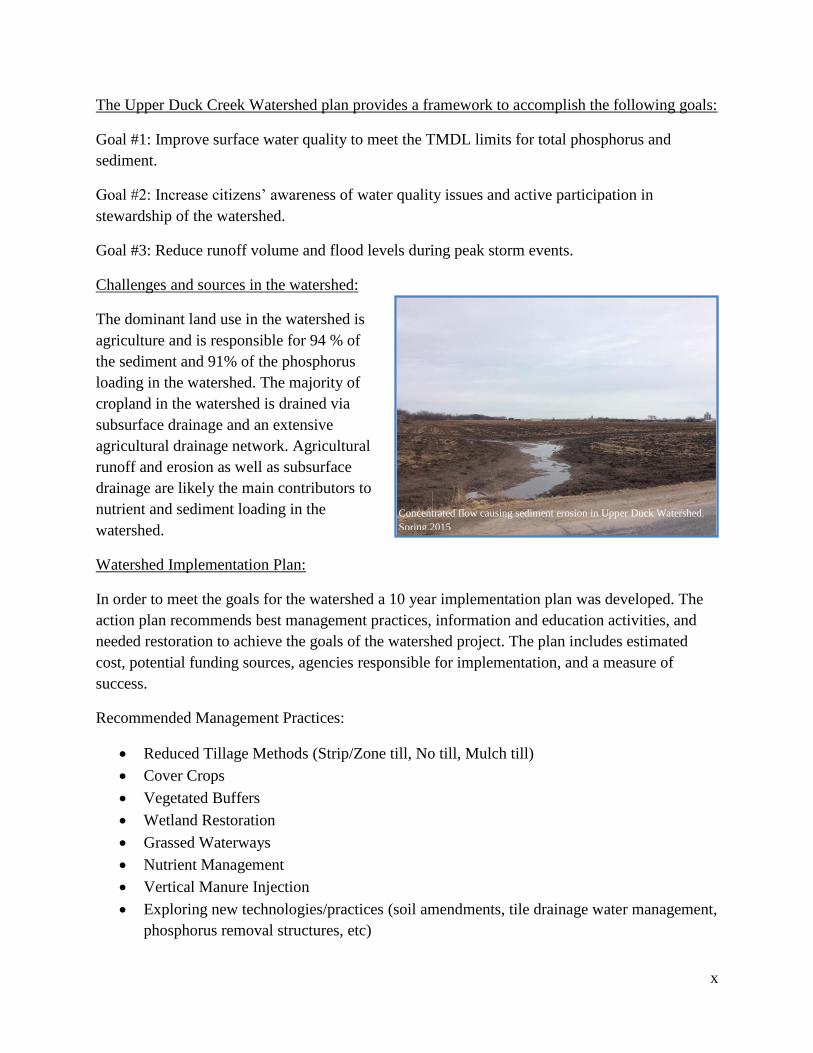
Challenges and sources in the watershed:
The dominant land use in the watershed is
agriculture and is responsible for 94 % of
the sediment and 91% of the phosphorus
loading in the watershed. The majority of
cropland in the watershed is drained via
subsurface drainage and an extensive
agricultural drainage network. Agricultural
runoff and erosion as well as subsurface
drainage are likely the main contributors to
nutrient and sediment loading in the
watershed.
Watershed Implementation Plan:
In order to meet the goals for the watershed a 10 year implementation plan was developed. The
action plan recommends best management practices, information and education activities, and
needed restoration to achieve the goals of the watershed project. The plan includes estimated
cost, potential funding sources, agencies responsible for implementation, and a measure of
success.
Recommended Management Practices:
Reduced Tillage Methods (Strip/Zone till, No till, Mulch till)
Cover Crops
Vegetated Buffers
Wetland Restoration
Grassed Waterways
Nutrient Management
Vertical Manure Injection
Exploring new technologies/practices (soil amendments, tile drainage water management,
phosphorus removal structures, etc)
Concentrated flow causing sediment erosion in Upper Duck Watershed.
Spring 2015
xi
Education and Information Recommendations:
Provide educational workshops and tours on how to implement best management
practices.
Engage landowners in planning and implementing conservation on their land and
ensuring they know what technical tools and financial support is available to them.
Provide information on water quality and conservation practices to landowners in the
watershed area.
Newsletters and/or webpage with watershed project updates and other pertinent
conservation related information.
Conclusion
Meeting the goals for the Upper Duck Creek watershed will be challenging. Watershed planning
and implementation is primarily a voluntary effort with limited enforcement for “non-compliant”
sites that will need to be supported by focused technical and financial assistance. It will require
widespread cooperation and commitment of the watershed community to improve the water
quality and condition of the watershed. This plan needs to be adaptable to the many challenges,
changes and lessons that will be found in this watershed area.

xii
(This page intentionally left blank)
xiii
List of Acronyms
AM- Adaptive Management
BMP- Best Management Practice
CAFO- Concentrated Animal Feeding Operation
CLU- Common Land Unit
GBMSD- Green Bay Metropolitan Sewerage District (NEW Water)
GLRI- Great Lakes Restoration Initiative
GIS- Geographic Information System
HSG-Hydrologic Soil Group
IBI- Index of Biotic Integrity
LFRWMP- Lower Fox River Watershed Monitoring Program
LWCD/LCD- Land and Water Conservation Department/ Land Conservation Department
MS4- Municipal Separate Storm Sewer System
NRCS-Natural Resource Conservation Service
PI- Phosphorus Index
USEPA- United States Environmental Protection Agency
UWEX- University of Wisconsin Extension
USDA- United States Department of Agriculture
USGS-United States Geologic Service
UWGB-University of Wisconsin-Green Bay
WDNR-Wisconsin Department of Natural Resources
WPDES- Wisconsin Pollutant Discharge Elimination System
WWTF- Waste Water Treatment Facility
TMDL-Total Maximum Daily Load
TP- Total Phosphorus
xiv
TSS- Total Suspended Solids
WQT- Water Quality Trading
Note: Lower Fox River TMDL plan- Refers to the report “Total Maximum Daily Load and
Watershed Management Plan for Total Phosphorus and Total Suspended Solids in the Lower
Fox River Basin and Lower Green Bay” prepared by the Cadmus Group that was approved in
2012 by WDNR and EPA.
1
1.0 Introduction
1.1 Upper Duck Watershed Setting
The Upper Duck Creek Watershed is a sub watershed of the Duck Creek Watershed and Lower
Fox River Basin in Wisconsin. The Duck Creek watershed is subdivided into Lower Duck,
Middle Duck, Upper Duck, and Oneida Creek. The Upper Duck watershed is located in entirely
Outagamie County, while the Middle and Lower Duck watershed are in Brown County. The
Upper Duck watershed drains a total area of 30,854 acres. The watershed is located North of
Lake Winnebago and Southwest of the Bay of Green Bay. Duck Creek flows directly into Bay of
Green Bay in Howard, Wisconsin. The watershed is predominately agricultural land and includes
portions of the Towns of Black Creek, Center, Freedom, Osborn, and Oneida.
Figure 1. Upper Duck Creek Watershed.
2
1.2 Purpose
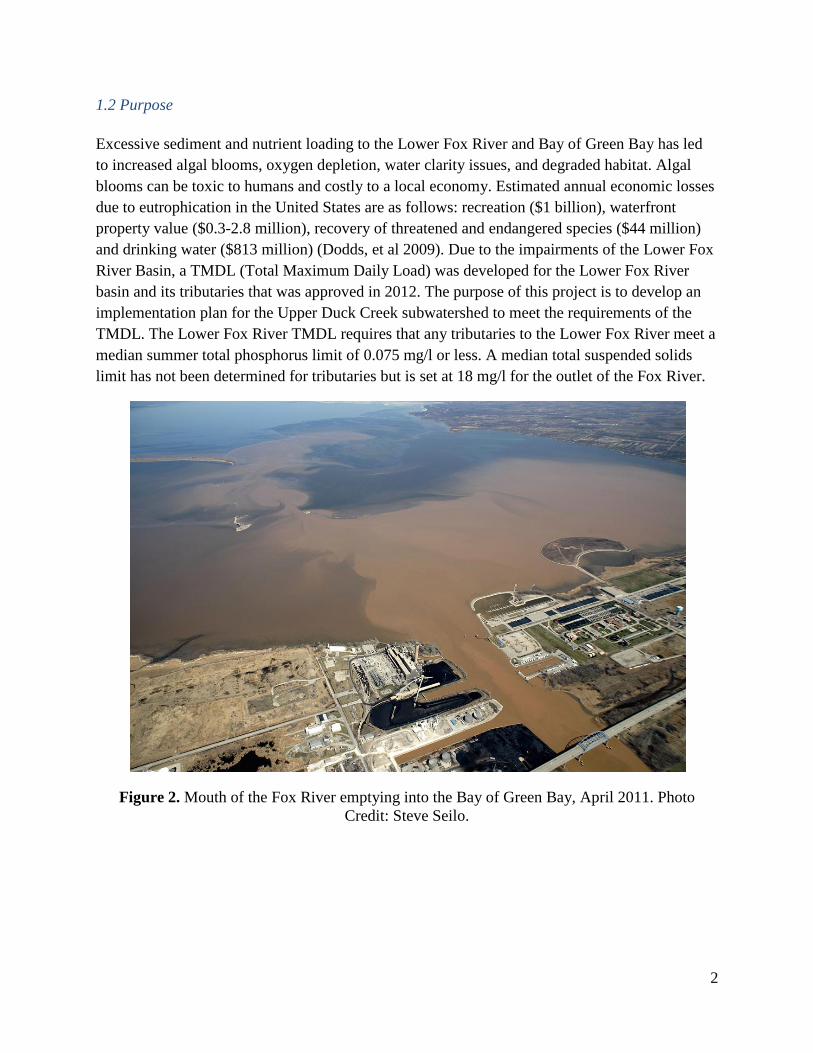
Excessive sediment and nutrient loading to the Lower Fox River and Bay of Green Bay has led
to increased algal blooms, oxygen depletion, water clarity issues, and degraded habitat. Algal
blooms can be toxic to humans and costly to a local economy. Estimated annual economic losses
due to eutrophication in the United States are as follows: recreation ($1 billion), waterfront
property value ($0.3-2.8 million), recovery of threatened and endangered species ($44 million)
and drinking water ($813 million) (Dodds, et al 2009). Due to the impairments of the Lower Fox
River Basin, a TMDL (Total Maximum Daily Load) was developed for the Lower Fox River
basin and its tributaries that was approved in 2012. The purpose of this project is to develop an
implementation plan for the Upper Duck Creek subwatershed to meet the requirements of the
TMDL. The Lower Fox River TMDL requires that any tributaries to the Lower Fox River meet a
median summer total phosphorus limit of 0.075 mg/l or less. A median total suspended solids
limit has not been determined for tributaries but is set at 18 mg/l for the outlet of the Fox River.
Figure 2. Mouth of the Fox River emptying into the Bay of Green Bay, April 2011. Photo
Credit: Steve Seilo.
3
1.3 US EPA Watershed Plan Requirements
In 1987, Congress enacted the Section 319 of the Clean Water Act which established a national
program to control nonpoint sources of water pollution. Section 319 grant funding is available to
states, tribes, and territories for the restoration of impaired waters and to protect unimpaired/high
quality waters. Watershed plans funded by Clean Water Act section 319 funds must address nine
key elements that the EPA has identified as critical for achieving improvements in water quality
(USEPA 2008). The nine elements from the USEPA Nonpoint Source Program and Grants
Guidelines for States and Territories are as follows:
1. Identification of causes of impairment and pollutant sources or groups of similar
sources that need to be controlled to achieve needed load reductions, and any other
goals identified in the watershed plan. Sources that need to be controlled should be
identified at the significant subcategory level along with estimates of the extent to
which they are present in the watershed
2. An estimate of the load reductions expected from management measures.
3. A description of the nonpoint source management measures that will need to be
implemented to achieve load reductions in element 2, and a description of the
critical areas in which those measures will be needed to implement this plan.
4. Estimate of the amounts of technical and financial assistance needed, associated
costs, and/or the sources and authorities that will be relied upon to implement this
plan.
5. An information and education component used to enhance public understanding of
the plan and encourage their early and continued participation in selecting,
designing, and implementing the nonpoint source management measures that will
be implemented.
6. Schedule for implementing the nonpoint source management measures identified
in this plan that is reasonably expeditious.
7. A description of interim measurable milestones for determining whether nonpoint
source management measures or other control actions are being implemented.
8. A set of criteria that can be used to determine whether loading reductions are
being achieved over time and substantial progress is being made toward attaining
water quality standards.
9. A monitoring component to evaluate the effectiveness of the implementation
efforts over time, measured against the criteria established under element 8.
4
1.4 Prior Studies, Projects, and Existing Resource Management and Comprehensive Plans
Various studies have been completed in the Lower Fox River Basin and Lake Michigan Basin
describing and analyzing conditions in the area. Management and Comprehensive plans as well
as monitoring programs have already been developed for the Lower Fox River Basin and Lake
Michigan Basin. A list of known studies, plans, and monitoring programs are listed below:
Total Maximum Daily Load & Watershed Plan for Total Phosphorus and Total Suspended Solids
in the Lower Fox River Basin and Lower Green Bay -2012
The TMDL & Watershed Plan for Total Phosphorus and Total Suspended Solids in the Lower
Fox River Basin and Lower Green Bay was prepared by the Cadmus Group for the EPA and
WDNR and was approved in 2012. This plan set a TMDL for the Lower Fox River and its
tributaries as well as estimated current pollutant loading and loading reductions needed to meet
the TMDL for each subwatershed in the Lower Fox River Basin.
Lower Fox River Watershed Monitoring Program
The Lower Fox River Watershed Monitoring Program is a watershed education and stream
monitoring program that involves coordination from university students and researchers from
University of Wisconsin-Green Bay, University of Wisconsin-Milwaukee, Green Bay
Metropolitan Sewerage District (GBMSD/New Water), Cofrin Center for Biological Diversity,
and the United States Geological Survey. The program also involves area high school teachers
and students.
Lake Michigan Lakewide Management Plan-2008
Plan developed by the Lake Michigan Technical Committee with assistance from the Lake
Michigan Forum and other agencies and organizations. The plan focuses on improving water
quality and habitat in the Lake Michigan basin including reducing pollutant loads from its
tributaries.
Lower Green Bay Remedial Action Plan-1993
The Lower Green Bay Remedial Action Plan is a long term strategy for restoring water quality to
the Lower Green Bay and Fox River. Two of the top five priorities for the Remedial Action Plan
are to reduce suspended sediments and phosphorus.
5
Hydrology, Phosphorus, and Suspended Solids in Five Agricultural Streams in the Lower Fox
River and Green Bay Watersheds, Wisconsin, Water Years 2004-2006
A 3-year study done by the U.S. Geological Survey and University of Wisconsin-Green Bay to
characterize water quality in agricultural streams in the Fox/Wolf watershed and provided
information to assist in the calibration of a watershed model for the area.
Nonpoint Source Control Plan for the Duck, Apple, and Ashwaubenon Creeks Priority
Watershed Project-1997
Nonpoint watershed plan developed for the Duck, Apple, and Ashwaubenon Creeks Watersheds
that focused on phosphorus and sediment reduction. The Wisconsin Nonpoint Source Water
Pollution Abatement Program provided cost sharing to landowners who voluntarily implemented
best management practices in priority watershed areas. Plan implementation began in 1997 and
ended in 2010. A moratorium on signing agreements for non-structural practices was placed on
September 5, 2001 which put the upland sediment goal of the plan out of reach. A final project
report also concluded that the watershed would also benefit from more buffered areas between
cropland and streams.
Temporal Assessment of Management Practices and Water Quality in the Duck Creek
Watershed, Wisconsin-2010
A study completed by the University of Wisconsin-Green Bay for the Oneida Nation of
Wisconsin. The study was conducted to determine progress in reducing phosphorus and
sediment in Duck Creek from implementation of best management practices during the Duck,
Apple, and Ashwaubenon Creeks Priority Watershed Project. The study analyzed 20 years of
water quality data broken down into three time periods (1989-1995), (1996-2003), and (2004-
2008). Analysis of suspended solids data was not achievable with this study due to different
laboratory processing methods. Four of the statistical procedures in the study led to the general
conclusion that both TP and DP concentrations decreased significantly during the 20 year time
period, with decreases occurring primarily in the beginning (1989-1995).
Phosphorus and TSS Trends in Duck Creek, Northeastern Wisconsin-2014
Study completed by the University of Wisconsin-Green Bay to determine phosphorus and TSS
trends in Duck Creek from the most recent period (2004-2013). Evidence indicates TP, DP, and
TSS concentrations declined during the 2004 to 2013 period. Median concentration of TP was
0.179 mg/l from June 2010 to October 2013, still well above TMDL target of 0.075 mg/l.
6
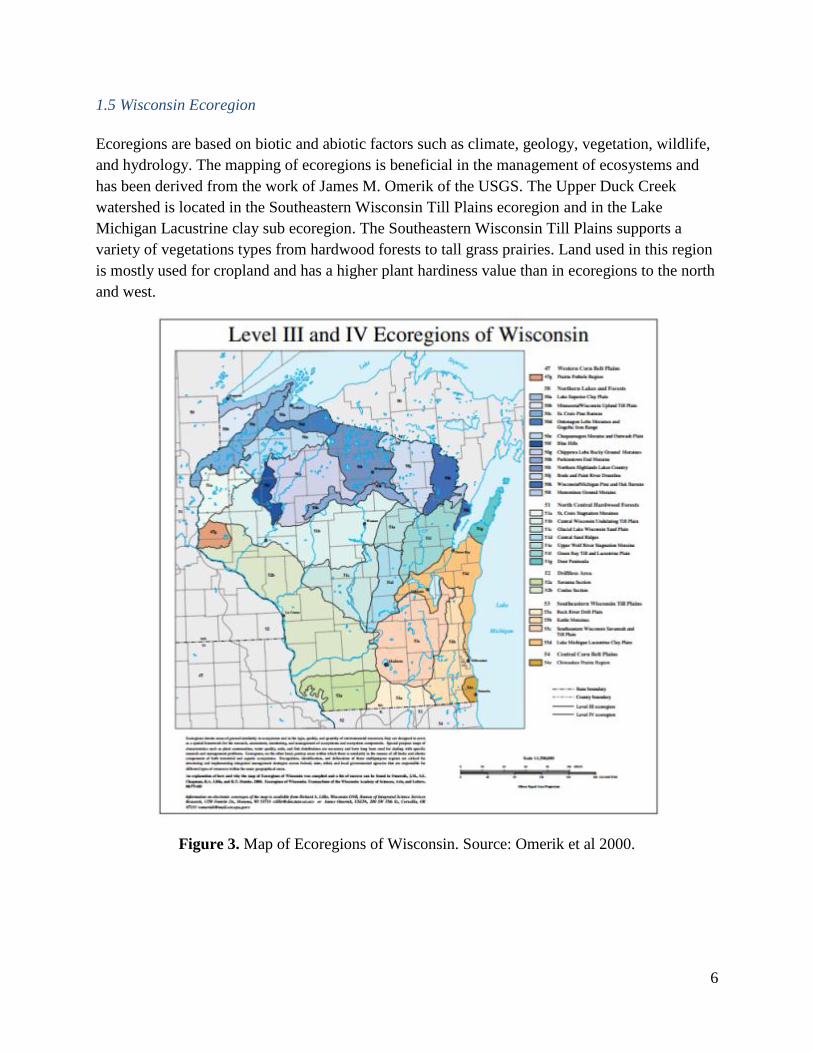
1.5 Wisconsin Ecoregion
Ecoregions are based on biotic and abiotic factors such as climate, geology, vegetation, wildlife,
and hydrology. The mapping of ecoregions is beneficial in the management of ecosystems and
has been derived from the work of James M. Omerik of the USGS. The Upper Duck Creek
watershed is located in the Southeastern Wisconsin Till Plains ecoregion and in the Lake
Michigan Lacustrine clay sub ecoregion. The Southeastern Wisconsin Till Plains supports a
variety of vegetations types from hardwood forests to tall grass prairies. Land used in this region
is mostly used for cropland and has a higher plant hardiness value than in ecoregions to the north
and west.
Figure 3. Map of Ecoregions of Wisconsin. Source: Omerik et al 2000.
7
1.6 Climate
Wisconsin has a continental climate that is affected by Lake Michigan and Lake Superior.
Wisconsin typically has cold, snowy winters and warm summers. The average annual
temperature ranges from 39oF in the north to about 50
oF in the south. Temperatures can reach
minus 30oF or colder in the winter and above 90
oF in the summer. Average annual precipitation
is about 30 inches a year in the watershed area. The climate in central and southern Wisconsin is
favorable for dairy farming, where corn, small grains, hay, and vegetables are the primary crops.
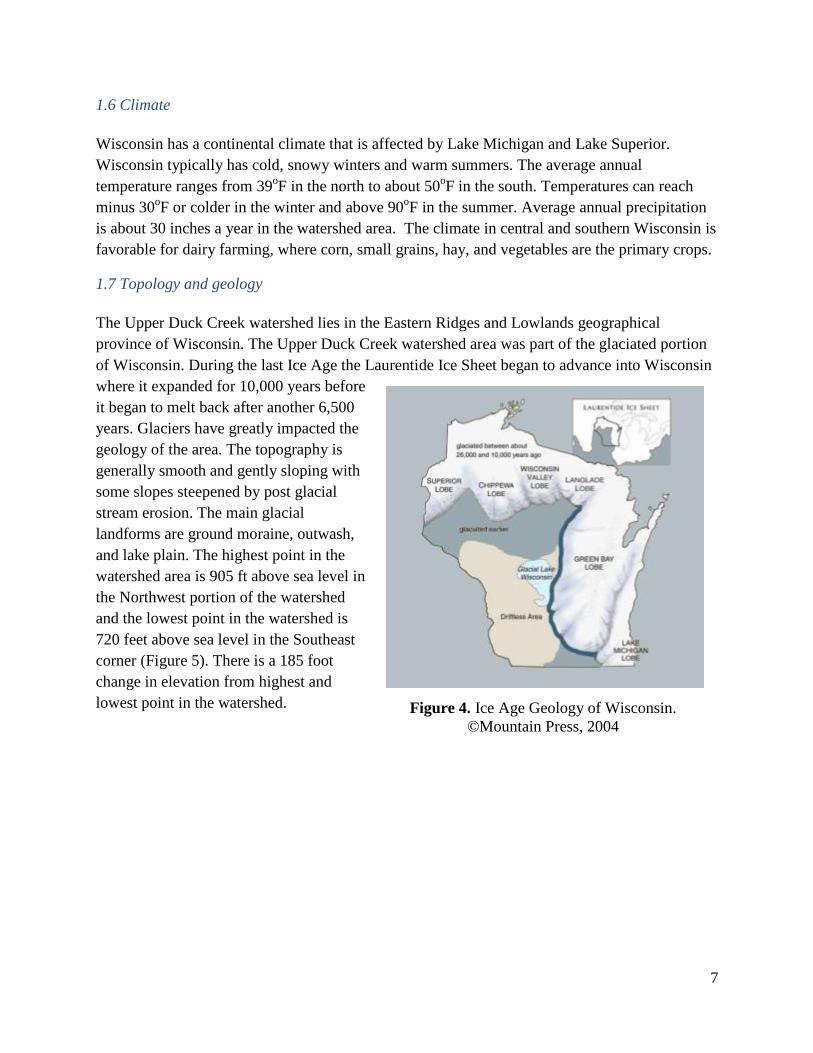
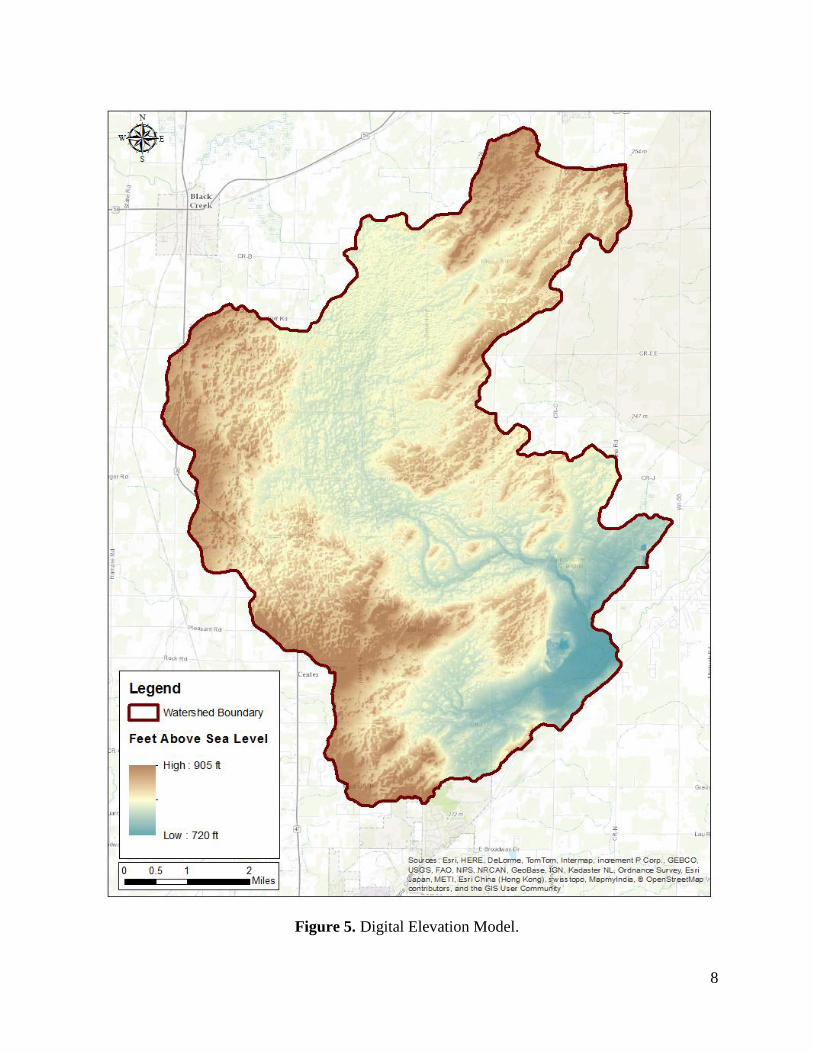
1.7 Topology and geology
The Upper Duck Creek watershed lies in the Eastern Ridges and Lowlands geographical
province of Wisconsin. The Upper Duck Creek watershed area was part of the glaciated portion
of Wisconsin. During the last Ice Age the Laurentide Ice Sheet began to advance into Wisconsin
where it expanded for 10,000 years before
it began to melt back after another 6,500
years. Glaciers have greatly impacted the
geology of the area. The topography is
generally smooth and gently sloping with
some slopes steepened by post glacial
stream erosion. The main glacial
landforms are ground moraine, outwash,
and lake plain. The highest point in the
watershed area is 905 ft above sea level in
the Northwest portion of the watershed
and the lowest point in the watershed is
720 feet above sea level in the Southeast
corner (Figure 5). There is a 185 foot
change in elevation from highest and
lowest point in the watershed. Figure 4. Ice Age Geology of Wisconsin.
©Mountain Press, 2004
8
Figure 5. Digital Elevation Model.
9
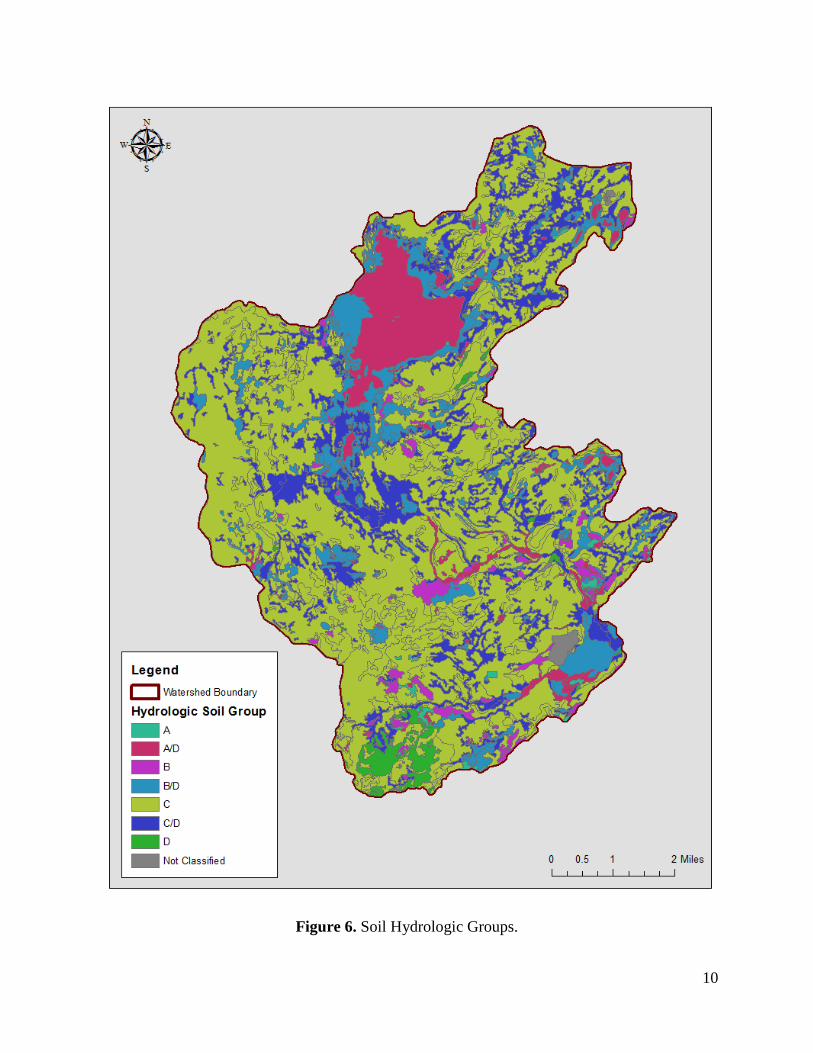
1.8 Soil Characteristics
Soil data for the watershed was obtained from the Natural Resources Conservation Service
(SSURGO) database. The type of soil and its characteristics are important for planning
management practices in a watershed. Factors such as erodibility, hydric group, slope, and hydric
rating are important in estimating erosion and runoff in a watershed.
The dominant soil types in the watershed are Hortonville silt loam (52.94%), Symco silt loam
(14.60 %), and Carbondale muck (5.6%).
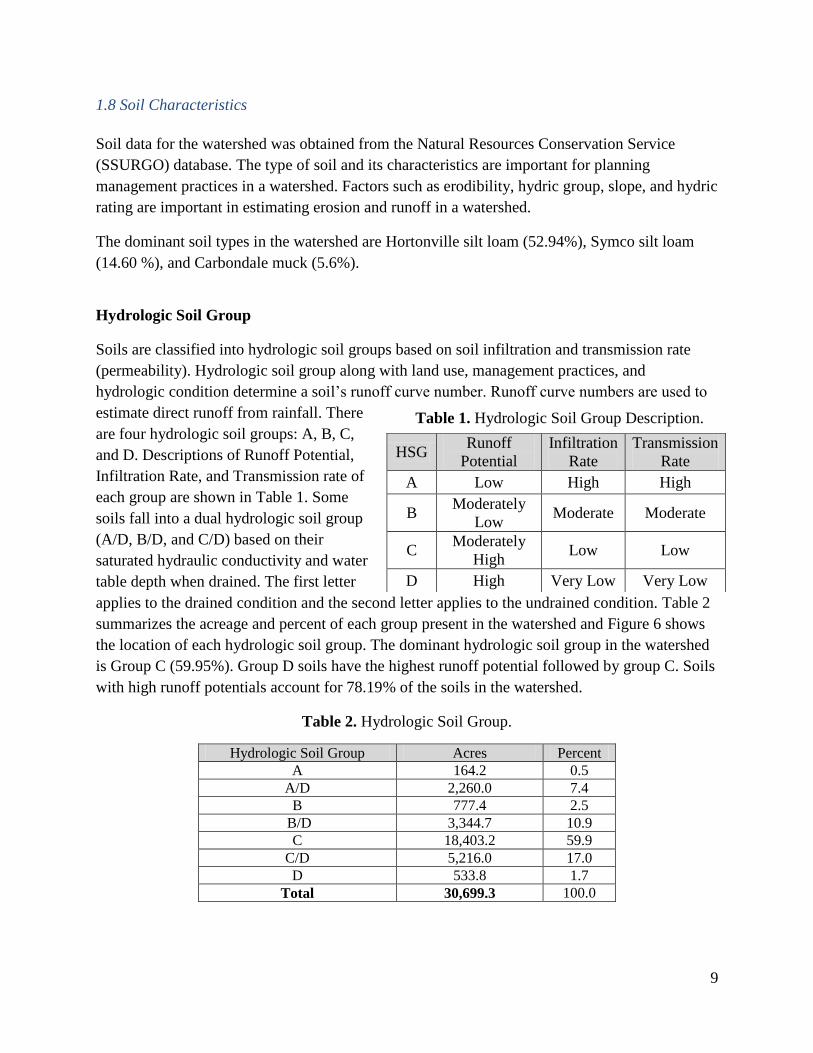
Hydrologic Soil Group
Soils are classified into hydrologic soil groups based on soil infiltration and transmission rate
(permeability). Hydrologic soil group along with land use, management practices, and
hydrologic condition determine a soil’s runoff curve number. Runoff curve numbers are used to
estimate direct runoff from rainfall. There
are four hydrologic soil groups: A, B, C,
and D. Descriptions of Runoff Potential,
Infiltration Rate, and Transmission rate of
each group are shown in Table 1. Some
soils fall into a dual hydrologic soil group
(A/D, B/D, and C/D) based on their
saturated hydraulic conductivity and water
table depth when drained. The first letter
applies to the drained condition and the second letter applies to the undrained condition. Table 2
summarizes the acreage and percent of each group present in the watershed and Figure 6 shows
the location of each hydrologic soil group. The dominant hydrologic soil group in the watershed
is Group C (59.95%). Group D soils have the highest runoff potential followed by group C. Soils
with high runoff potentials account for 78.19% of the soils in the watershed.
Table 2. Hydrologic Soil Group.
Hydrologic Soil Group Acres Percent
A 164.2 0.5
A/D 2,260.0 7.4
B 777.4 2.5
B/D 3,344.7 10.9
C 18,403.2 59.9
C/D 5,216.0 17.0
D 533.8 1.7
Total 30,699.3 100.0
HSG Runoff
Potential
Infiltration
Rate
Transmission
Rate
A Low High High
B Moderately
Low Moderate Moderate
C Moderately
High Low Low
D High Very Low Very Low
Table 1. Hydrologic Soil Group Description.
Hydrologic Soil Groups Description.
10
Figure 6. Soil Hydrologic Groups.
11
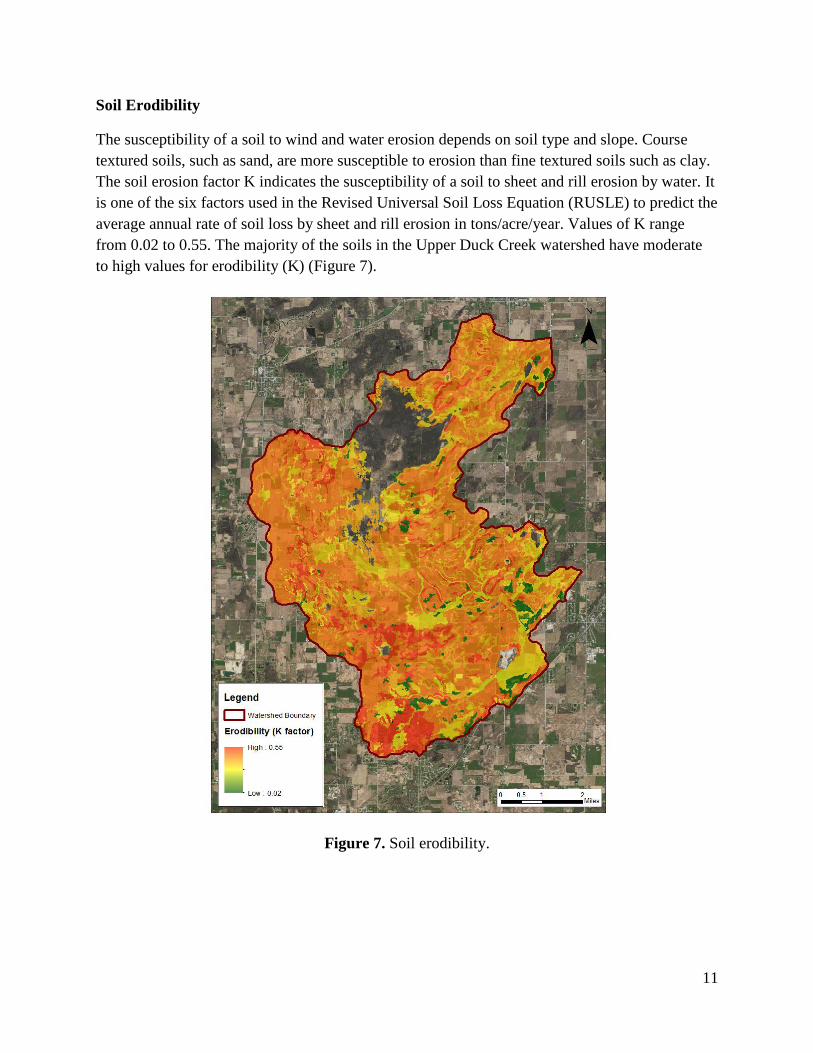
Soil Erodibility
The susceptibility of a soil to wind and water erosion depends on soil type and slope. Course
textured soils, such as sand, are more susceptible to erosion than fine textured soils such as clay.
The soil erosion factor K indicates the susceptibility of a soil to sheet and rill erosion by water. It
is one of the six factors used in the Revised Universal Soil Loss Equation (RUSLE) to predict the
average annual rate of soil loss by sheet and rill erosion in tons/acre/year. Values of K range
from 0.02 to 0.55. The majority of the soils in the Upper Duck Creek watershed have moderate
to high values for erodibility (K) (Figure 7).
Figure 7. Soil erodibility.
12
(This page intentionally left blank)
13
2.0 Watershed Jurisdictions, Demographics, and Transportation Network
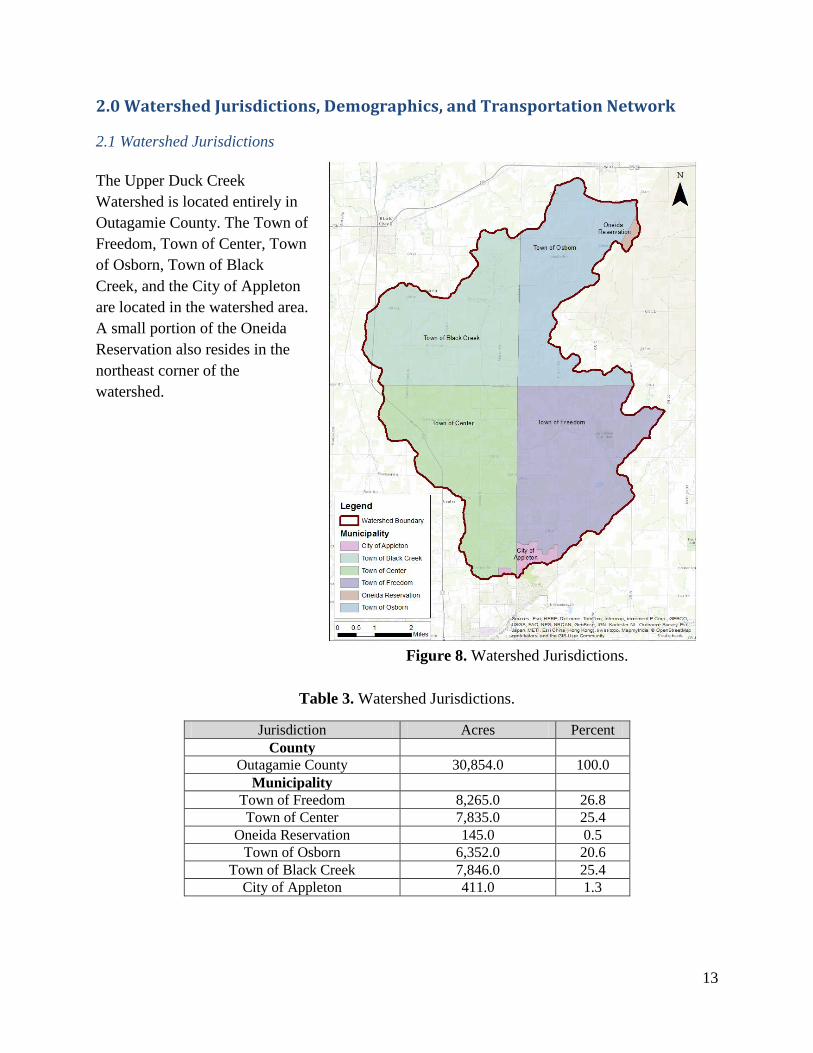
2.1 Watershed Jurisdictions
The Upper Duck Creek
Watershed is located entirely in
Outagamie County. The Town of
Freedom, Town of Center, Town
of Osborn, Town of Black
Creek, and the City of Appleton
are located in the watershed area.
A small portion of the Oneida
Reservation also resides in the
northeast corner of the
watershed.
Table 3. Watershed Jurisdictions.
Jurisdiction Acres Percent
County
Outagamie County 30,854.0 100.0
Municipality
Town of Freedom 8,265.0 26.8
Town of Center 7,835.0 25.4
Oneida Reservation 145.0 0.5
Town of Osborn 6,352.0 20.6
Town of Black Creek 7,846.0 25.4
City of Appleton 411.0 1.3
Figure 8. Watershed Jurisdictions.
14
2.2 Jurisdictional Roles and Responsibilities
Natural resources in the United States are protected to some extent under federal, state, and local
law. The Clean Water Act is the strongest regulating tool at the national level. In Wisconsin, the
Wisconsin Department of Natural Resources has the authority to administer the provisions of the
Clean Water Act. The U.S. Fish and Wildlife Service and U.S. Army Corps of Engineers work
with the WDNR to protect natural areas, wetlands, and threatened and endangered species. The
Safe Drinking Water Act also protects surface and groundwater resources.
Counties and other local municipalities in the watershed area have already established ordinances
regulating land development and protecting surface waters. Outagamie County has ordinances
relating to Shoreland and Wetland Zoning, Animal Waste Management & Runoff management,
Erosion Control, and Stormwater. The Oneida Reservation is governed by its own set of rules
and regulations. In addition to county-level regulations, each municipality has their own
regulations. Municipalities may or may not provide additional watershed protection above and
beyond existing watershed ordinances under local municipal codes.
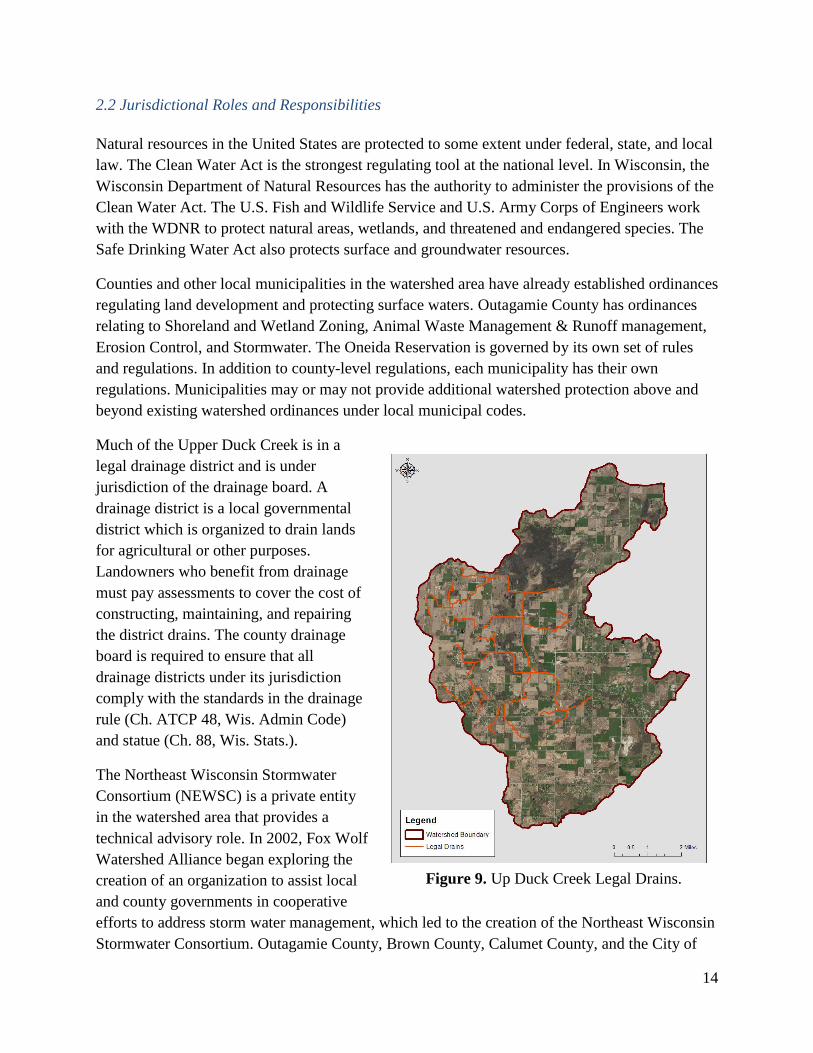
Much of the Upper Duck Creek is in a
legal drainage district and is under
jurisdiction of the drainage board. A
drainage district is a local governmental
district which is organized to drain lands
for agricultural or other purposes.
Landowners who benefit from drainage
must pay assessments to cover the cost of
constructing, maintaining, and repairing
the district drains. The county drainage
board is required to ensure that all
drainage districts under its jurisdiction
comply with the standards in the drainage
rule (Ch. ATCP 48, Wis. Admin Code)
and statue (Ch. 88, Wis. Stats.).
The Northeast Wisconsin Stormwater
Consortium (NEWSC) is a private entity
in the watershed area that provides a
technical advisory role. In 2002, Fox Wolf
Watershed Alliance began exploring the
creation of an organization to assist local
and county governments in cooperative
efforts to address storm water management, which led to the creation of the Northeast Wisconsin
Stormwater Consortium. Outagamie County, Brown County, Calumet County, and the City of
Figure 9. Up Duck Creek Legal Drains.
15
Kaukauna have representatives in the organization. Northeast Wisconsin Stormwater Consortium
facilitates efficient implementation of stormwater programs that meet DNR and EPA regulatory
requirements and maximize the benefit of stormwater activities to the watershed by fostering
partnerships, and by providing technical, administrative, and financial assistance to its members.
Other governmental and private entities with watershed jurisdictional or technical advisory roles
include: Natural Resources Conservation Service, Department of Agriculture, Trade, and
Consumer Protection, East Central Wisconsin Regional Planning Commission, Department of
Transportation.
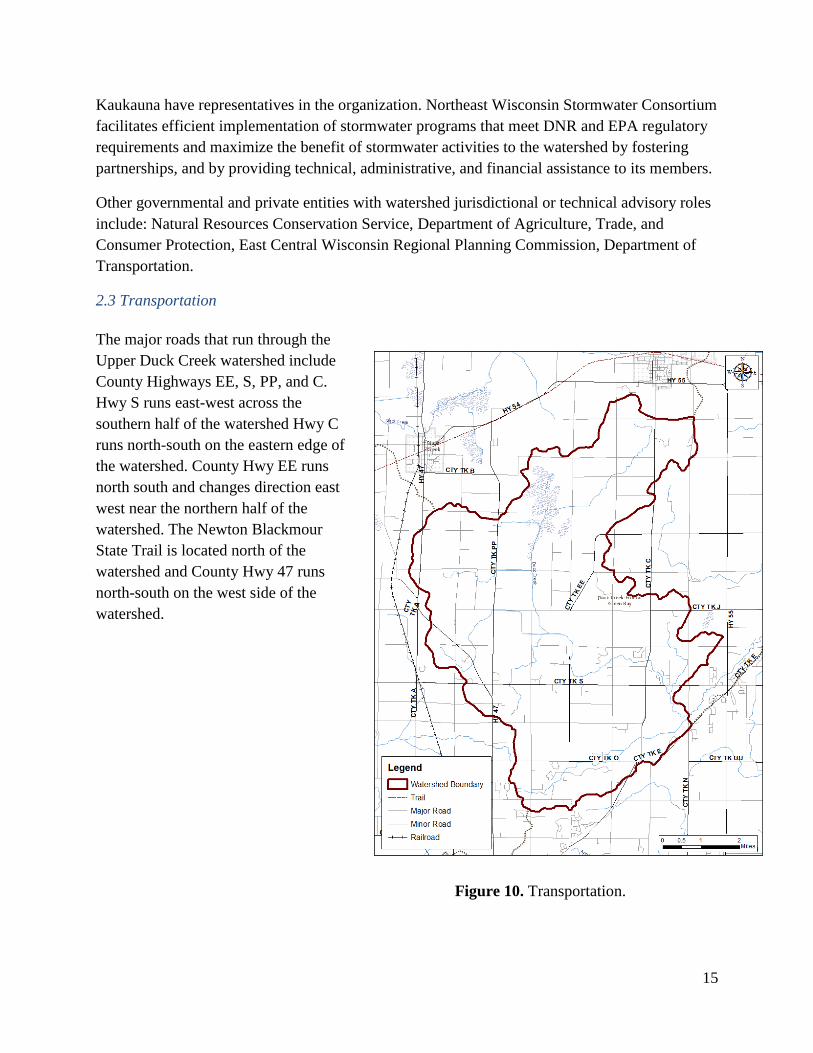
2.3 Transportation
The major roads that run through the
Upper Duck Creek watershed include
County Highways EE, S, PP, and C.
Hwy S runs east-west across the
southern half of the watershed Hwy C
runs north-south on the eastern edge of
the watershed. County Hwy EE runs
north south and changes direction east
west near the northern half of the
watershed. The Newton Blackmour
State Trail is located north of the
watershed and County Hwy 47 runs
north-south on the west side of the
watershed.
Figure 10. Transportation.
16
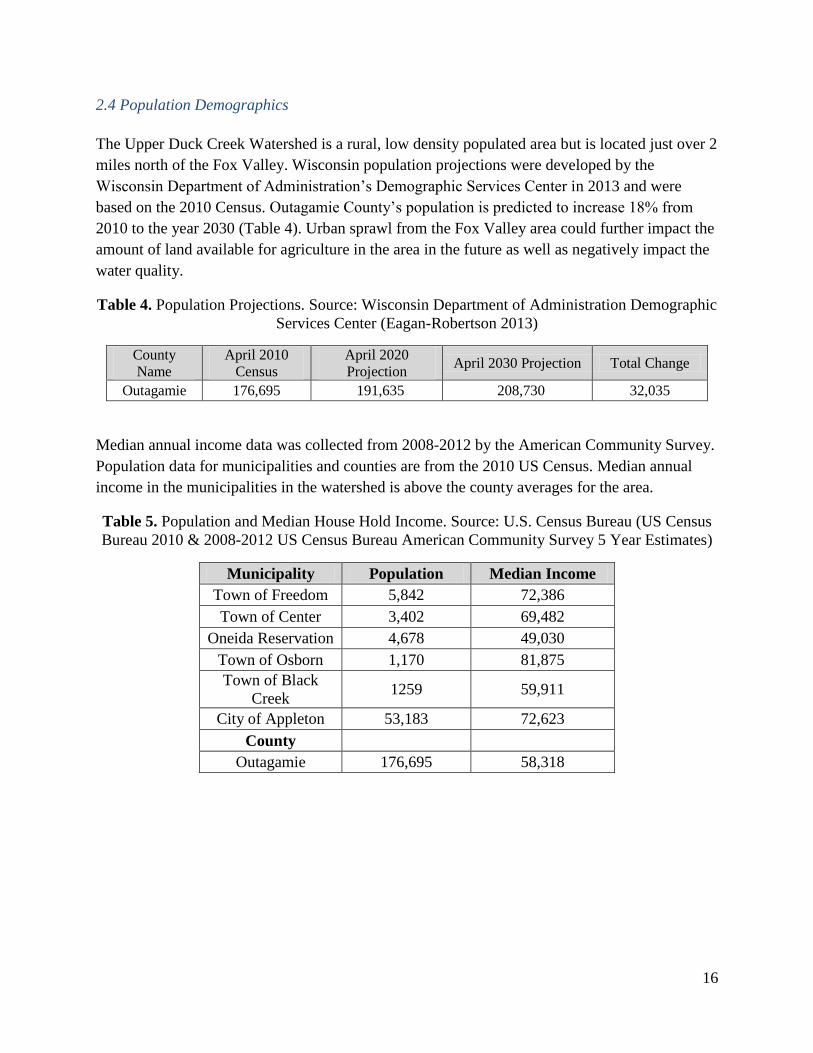
2.4 Population Demographics
The Upper Duck Creek Watershed is a rural, low density populated area but is located just over 2
miles north of the Fox Valley. Wisconsin population projections were developed by the
Wisconsin Department of Administration’s Demographic Services Center in 2013 and were
based on the 2010 Census. Outagamie County’s population is predicted to increase 18% from
2010 to the year 2030 (Table 4). Urban sprawl from the Fox Valley area could further impact the
amount of land available for agriculture in the area in the future as well as negatively impact the
water quality.
Table 4. Population Projections. Source: Wisconsin Department of Administration Demographic
Services Center (Eagan-Robertson 2013)
County
Name
April 2010
Census
April 2020
Projection April 2030 Projection Total Change
Outagamie 176,695 191,635 208,730 32,035
Median annual income data was collected from 2008-2012 by the American Community Survey.
Population data for municipalities and counties are from the 2010 US Census. Median annual
income in the municipalities in the watershed is above the county averages for the area.
Table 5. Population and Median House Hold Income. Source: U.S. Census Bureau (US Census
Bureau 2010 & 2008-2012 US Census Bureau American Community Survey 5 Year Estimates)
Municipality Population Median Income
Town of Freedom 5,842 72,386
Town of Center 3,402 69,482
Oneida Reservation 4,678 49,030
Town of Osborn 1,170 81,875
Town of Black
Creek 1259 59,911
City of Appleton 53,183 72,623
County
Outagamie 176,695 58,318
17
3.0 Land Use/Land Cover
3.1 Existing Land Use/Land Cover
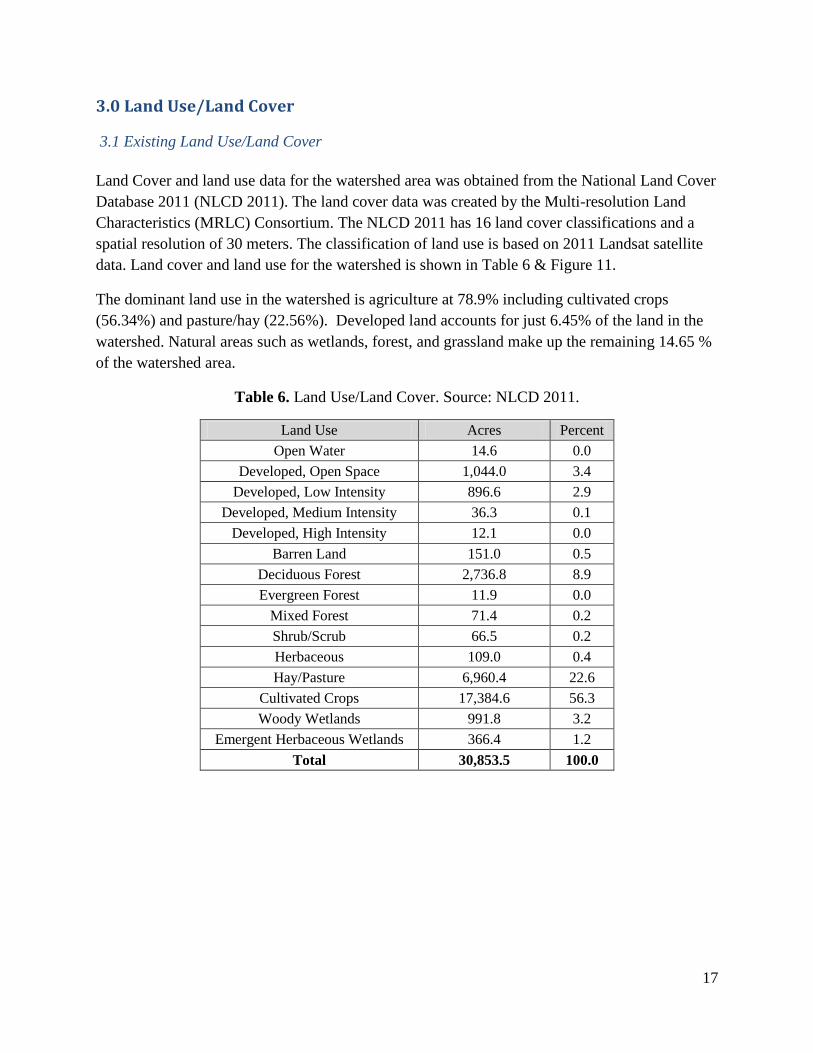
Land Cover and land use data for the watershed area was obtained from the National Land Cover
Database 2011 (NLCD 2011). The land cover data was created by the Multi-resolution Land
Characteristics (MRLC) Consortium. The NLCD 2011 has 16 land cover classifications and a
spatial resolution of 30 meters. The classification of land use is based on 2011 Landsat satellite
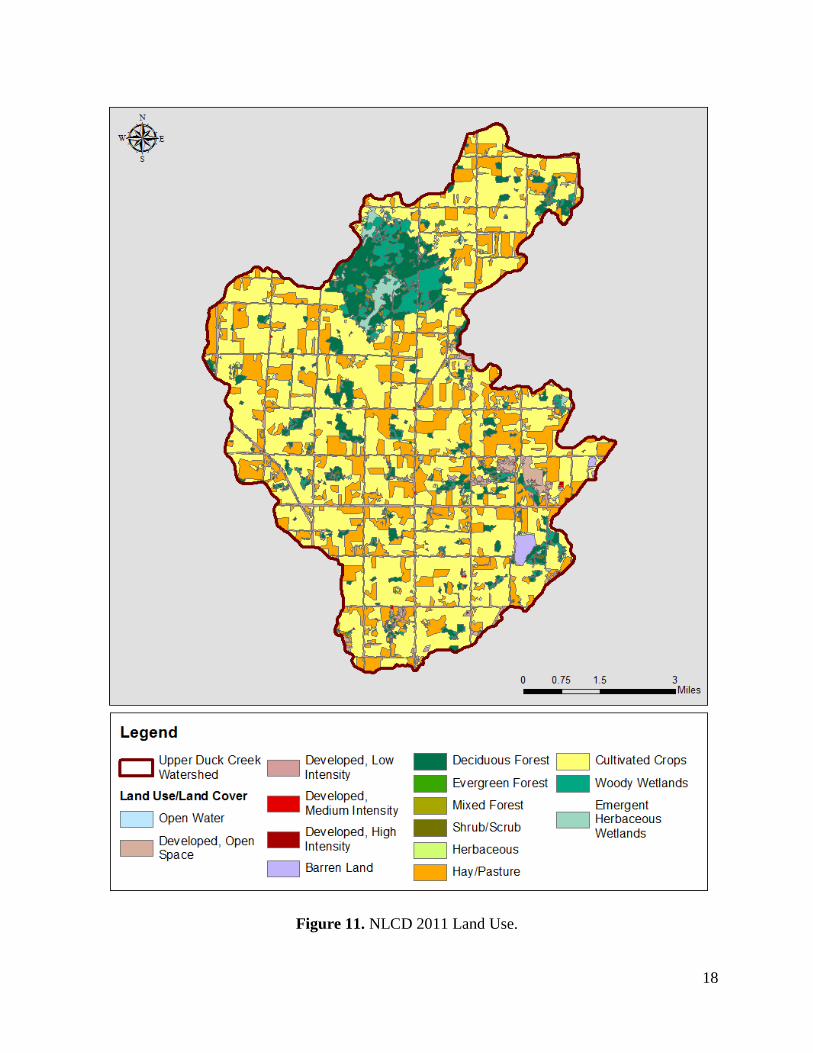
data. Land cover and land use for the watershed is shown in Table 6 & Figure 11.
The dominant land use in the watershed is agriculture at 78.9% including cultivated crops
(56.34%) and pasture/hay (22.56%). Developed land accounts for just 6.45% of the land in the
watershed. Natural areas such as wetlands, forest, and grassland make up the remaining 14.65 %
of the watershed area.
Table 6. Land Use/Land Cover. Source: NLCD 2011.
Land Use Acres Percent
Open Water 14.6 0.0
Developed, Open Space 1,044.0 3.4
Developed, Low Intensity 896.6 2.9
Developed, Medium Intensity 36.3 0.1
Developed, High Intensity 12.1 0.0
Barren Land 151.0 0.5
Deciduous Forest 2,736.8 8.9
Evergreen Forest 11.9 0.0
Mixed Forest 71.4 0.2
Shrub/Scrub 66.5 0.2
Herbaceous 109.0 0.4
Hay/Pasture 6,960.4 22.6
Cultivated Crops 17,384.6 56.3
Woody Wetlands 991.8 3.2
Emergent Herbaceous Wetlands 366.4 1.2
Total 30,853.5 100.0
18
Figure 11. NLCD 2011 Land Use.
19
3.2 Crop Rotation
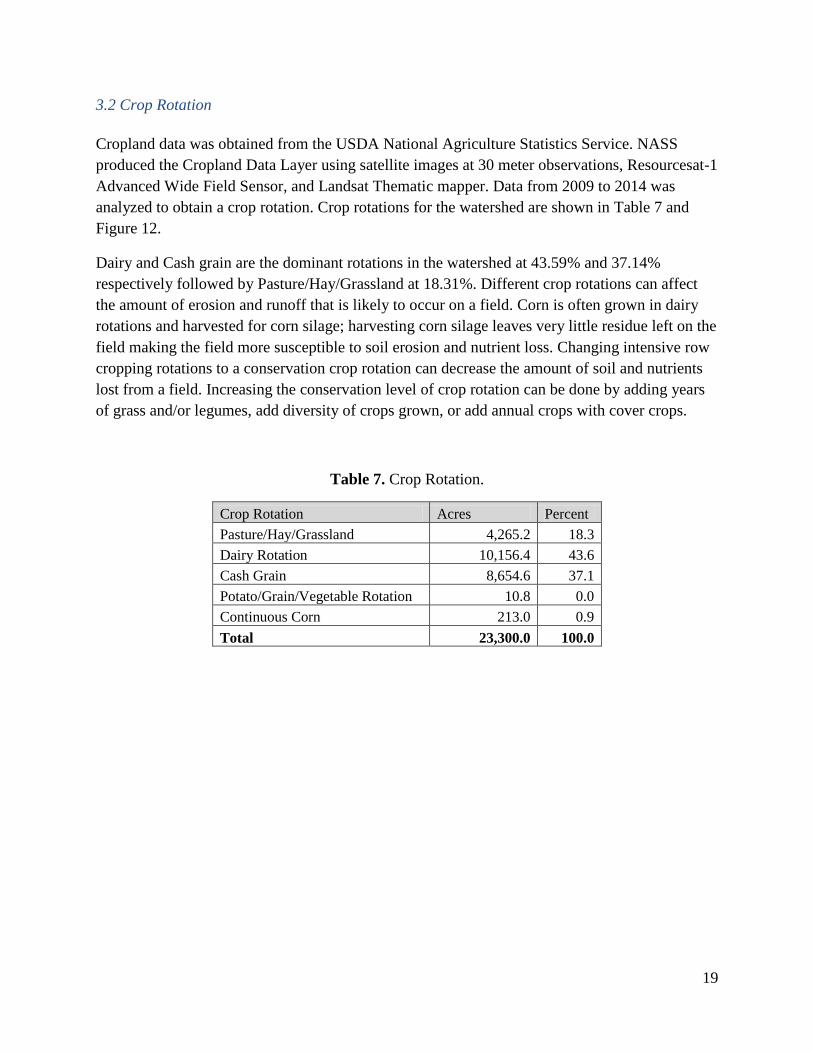
Cropland data was obtained from the USDA National Agriculture Statistics Service. NASS
produced the Cropland Data Layer using satellite images at 30 meter observations, Resourcesat-1
Advanced Wide Field Sensor, and Landsat Thematic mapper. Data from 2009 to 2014 was
analyzed to obtain a crop rotation. Crop rotations for the watershed are shown in Table 7 and
Figure 12.
Dairy and Cash grain are the dominant rotations in the watershed at 43.59% and 37.14%
respectively followed by Pasture/Hay/Grassland at 18.31%. Different crop rotations can affect
the amount of erosion and runoff that is likely to occur on a field. Corn is often grown in dairy
rotations and harvested for corn silage; harvesting corn silage leaves very little residue left on the
field making the field more susceptible to soil erosion and nutrient loss. Changing intensive row
cropping rotations to a conservation crop rotation can decrease the amount of soil and nutrients
lost from a field. Increasing the conservation level of crop rotation can be done by adding years
of grass and/or legumes, add diversity of crops grown, or add annual crops with cover crops.
Table 7. Crop Rotation.
Crop Rotation Acres Percent
Pasture/Hay/Grassland 4,265.2 18.3
Dairy Rotation 10,156.4 43.6
Cash Grain 8,654.6 37.1
Potato/Grain/Vegetable Rotation 10.8 0.0
Continuous Corn 213.0 0.9
Total 23,300.0 100.0
20
Figure 12. Crop rotation in Upper Duck Creek Watershed 2009-2014.
21
4.0 Water Quality
The federal Clean Water Act requires states to adopt water quality criteria that the EPA publishes
under 304 (a) of the Clean Water Act, modify 304 (a) criteria to reflect sit-specific conditions, or
adopt criteria based on other scientifically defensible methods. Water quality standards require
assigning a designated use to the water body.
4.1 Designated Use and Impairments
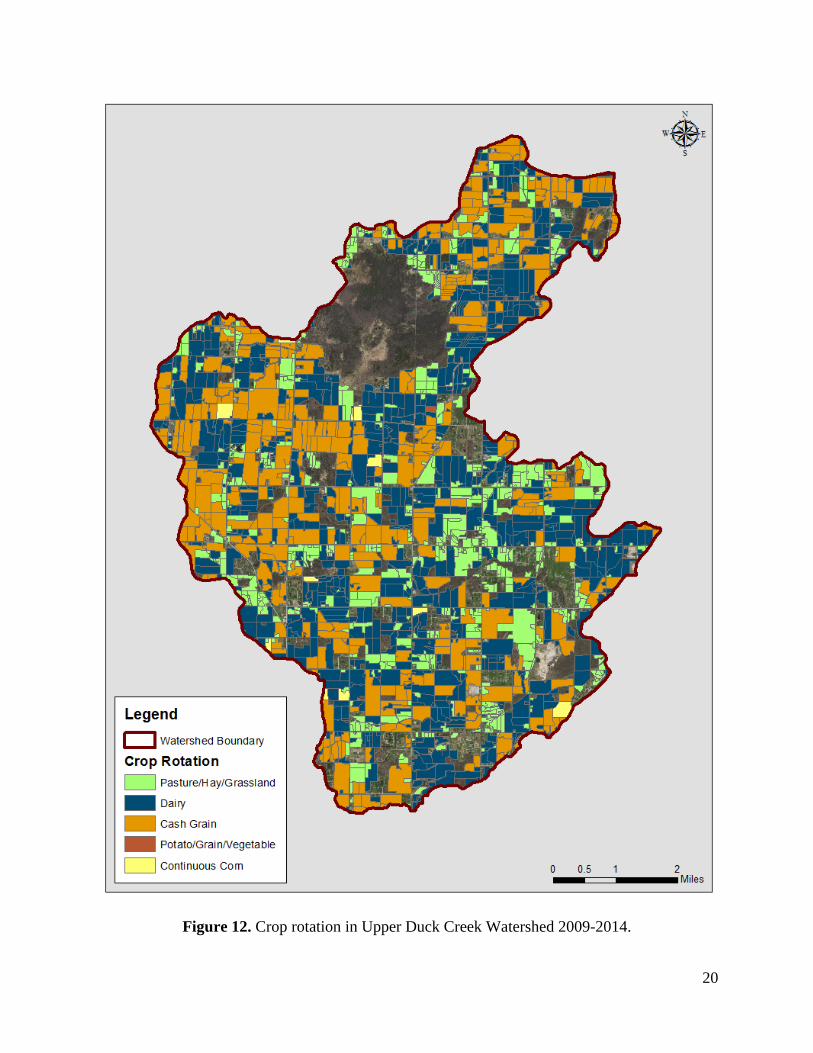
A 303 (d) list is comprised of waters impaired or threatened by a pollutant, and needing a
TMDL. States submit a separate 303 (b) report on conditions of all waters. EPA recommends
that the states combine the threatened and impaired waters list, 303(d) report, with the 303(b)
report to create an “integrated report”. Duck Creek was first listed as an impaired waterway in
1998. Duck Creek is impaired due to excess phosphorus, sediment loading, and mercury. The
Lower Fox River TMDL only addresses phosphorus and sediment loading in the Lower Fox
River tributaries. Figure 13 shows stream
segments in the Upper Duck Creek
watershed listed as impaired.
Streams and Rivers in Wisconsin are
assessed for the following use
designations: Fish and Aquatic Life,
Recreational Use, Fish Consumption
(Public Health and Welfare), and General
Uses. The Upper Duck Creek is
designated for Fish and Aquatic Life. The
Fish and Aquatic Life (FAL) designations
for streams and rivers are categorized into
subcategories. Upper Duck Creek is
currently designated to the Warmwater
Forage Fish (WWFF) Community but is
capable of attaining Warm Water Sport
Fish (WWSF) category. Streams in the
WWFF category are capable of supporting
a warm water dependent forage fishery.
Aquatic life communities in this category
usually require cool or warm temperatures
and concentrations of Dissolved Oxygen
(DO) that do not drop below 5 mg/l. Figure 13. Impaired stream segments.
22
Streams and rivers are also being evaluated for placement in a revised aquatic life use
classification system where the subclasses are referred to as Natural Communities. Duck Creek’s
natural community is not yet identified under the state’s Natural Community Determinations.
4.2 Point Sources
Point sources of pollution are discharges that come from a pipe or point of discharge that can be
attributed to a specific source. In Wisconsin, the Wisconsin Pollutant Discharge Elimination
System (WPDES) regulates and enforces water pollution control measures. The WI DNR Bureau
of Water Quality issues the permits with oversight of the US EPA. There are four types of
WPDES permits: Individual, General, Stormwater, and Agricultural permits.
Individual permits are issued to municipal and industrial waste water treatment facilities that
discharge to surface and/or groundwater. WPDES permits include limits that are consistent with
the approved TMDL Waste Load Allocations. There are no Municipal or Industrial WPDES
permit holders in the Upper Duck Creek Watershed.
To meet the requirements of the federal Clean Water Act, the DNR developed a state Storm
Water Permits Program under Wisconsin Administrative Coded NR 216. A Municipal Separate
Storm Sewer System (MS4) permit is required for a municipality that is either located within a
federally designated urbanized area, has a population of 10,000 or more, or the DNR designates
the municipality for permit coverage. Municipal permits require storm water management
programs to reduce polluted storm water runoff. Outagamie County has a general MS4 permit #
WI-S050075-2. The general permit requires an MS4 holder to develop, maintain, and implement
storm water management programs to prevent pollutants from the MS4 from entering state
waters. Examples of stormwater best management practices used by municipalities to meet
permits include: detention basins, street sweeping, filter strips, and rain gardens.
4.3 Nonpoint Sources
The majority of pollutants in the Upper Duck Creek watershed come from nonpoint sources. A
nonpoint source cannot be traced back to a point of discharge. Runoff from agricultural and
urban areas is an example of non point source. Agriculture is the dominant land use in the Upper
Duck Creek watershed and accounts for approximately 90% of the total phosphorus loading and
total suspended sediment loading. Other nonpoint sources in the watershed include erosion from
stream banks and construction sites as well as runoff from lawns and impervious surfaces.
In 2010, new state regulations in Wisconsin went into effect that restricts the use, sale, and
display of turf fertilizer that is labeled as containing phosphorus or available phosphorus
(Wis.Stats.94.643) The law states that turf fertilizer that is labeled containing phosphorus or
available phosphate cannot be applied to residential properties, golf courses, or publicly owned
land that is planted in closely mowed or managed grass. The exceptions to the rule are as
follows:
23
Fertilizer that is labeled as containing phosphorus or available phosphate can be used for
new lawns during the growing season in which the grass is established.
Fertilizer that is labeled as containing phosphorus or available phosphate can be used if
the soil is deficient in phosphorus, as shown by a soil test performed no more than 36
months before the fertilizer is applied. The soil test must be done by a soil testing
laboratory.
Fertilizer that is labeled as containing phosphorus or available phosphate can be applied
to pastures, land used to grow grass for sod or any other land used for agricultural
production.
Wisconsin also has state standards pertaining to agricultural runoff. Wisconsin State Standards,
Chapter NR 151 subchapter II describes Agricultural Performance Standards and Prohibitions.
This chapter describes regulations relating to phosphorus index, manure storage & management,
nutrient management, soil erosion, tillage setback as well as implementation and enforcement
procedures for the regulations.
24
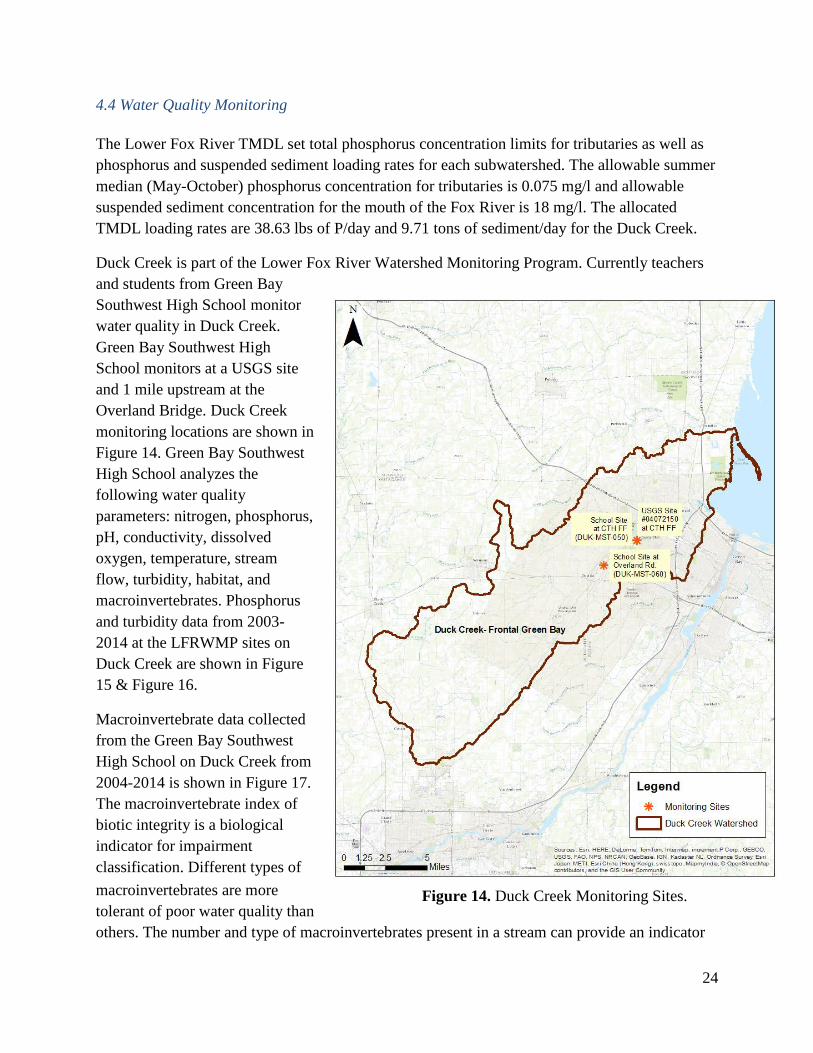
4.4 Water Quality Monitoring
The Lower Fox River TMDL set total phosphorus concentration limits for tributaries as well as
phosphorus and suspended sediment loading rates for each subwatershed. The allowable summer
median (May-October) phosphorus concentration for tributaries is 0.075 mg/l and allowable
suspended sediment concentration for the mouth of the Fox River is 18 mg/l. The allocated
TMDL loading rates are 38.63 lbs of P/day and 9.71 tons of sediment/day for the Duck Creek.
Duck Creek is part of the Lower Fox River Watershed Monitoring Program. Currently teachers
and students from Green Bay
Southwest High School monitor
water quality in Duck Creek.
Green Bay Southwest High
School monitors at a USGS site
and 1 mile upstream at the
Overland Bridge. Duck Creek
monitoring locations are shown in
Figure 14. Green Bay Southwest
High School analyzes the
following water quality
parameters: nitrogen, phosphorus,
pH, conductivity, dissolved
oxygen, temperature, stream
flow, turbidity, habitat, and
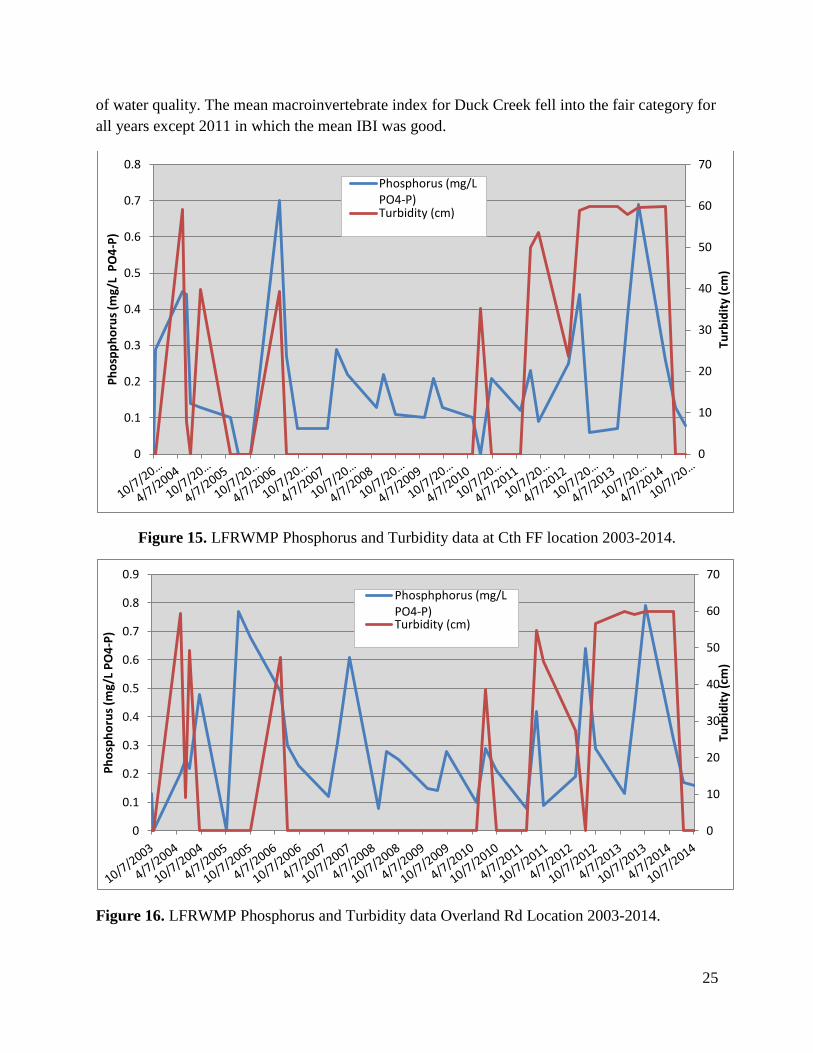
macroinvertebrates. Phosphorus
and turbidity data from 2003-
2014 at the LFRWMP sites on
Duck Creek are shown in Figure
15 & Figure 16.
Macroinvertebrate data collected
from the Green Bay Southwest
High School on Duck Creek from
2004-2014 is shown in Figure 17.
The macroinvertebrate index of
biotic integrity is a biological
indicator for impairment
classification. Different types of
macroinvertebrates are more
tolerant of poor water quality than
others. The number and type of macroinvertebrates present in a stream can provide an indicator
Figure 14. Duck Creek Monitoring Sites.
25
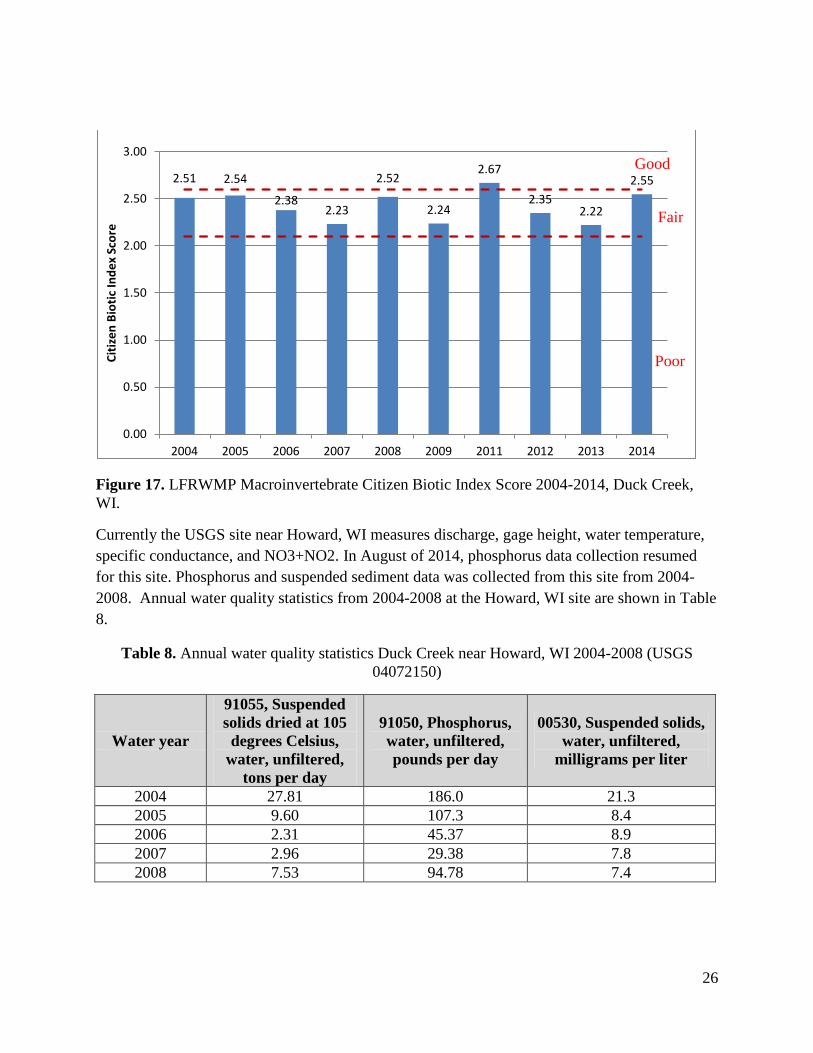
of water quality. The mean macroinvertebrate index for Duck Creek fell into the fair category for
all years except 2011 in which the mean IBI was good.
Figure 15. LFRWMP Phosphorus and Turbidity data at Cth FF location 2003-2014.
Figure 16. LFRWMP Phosphorus and Turbidity data Overland Rd Location 2003-2014.
0
10
20
30
40
50
60
70
0
0.1
0.2
0.3
0.4
0.5
0.6
0.7
0.8
Turb
idit
y (c
m)
Ph
osp
ph
oru
s (m
g/L
PO
4-P
)
Phosphorus (mg/L PO4-P) Turbidity (cm)
0
10
20
30
40
50
60
70
0
0.1
0.2
0.3
0.4
0.5
0.6
0.7
0.8
0.9
Turb
idit
y (c
m)
Ph
osp
ho
rus
(mg/
L P
O4
-P)
Phosphphorus (mg/L PO4-P) Turbidity (cm)
26
Figure 17. LFRWMP Macroinvertebrate Citizen Biotic Index Score 2004-2014, Duck Creek,
WI.
Currently the USGS site near Howard, WI measures discharge, gage height, water temperature,
specific conductance, and NO3+NO2. In August of 2014, phosphorus data collection resumed
for this site. Phosphorus and suspended sediment data was collected from this site from 2004-
2008. Annual water quality statistics from 2004-2008 at the Howard, WI site are shown in Table
8.
Table 8. Annual water quality statistics Duck Creek near Howard, WI 2004-2008 (USGS
04072150)
Water year
91055, Suspended
solids dried at 105
degrees Celsius,
water, unfiltered,
tons per day
91050, Phosphorus,
water, unfiltered,
pounds per day
00530, Suspended solids,
water, unfiltered,
milligrams per liter
2004 27.81 186.0 21.3
2005 9.60 107.3 8.4
2006 2.31 45.37 8.9
2007 2.96 29.38 7.8
2008 7.53 94.78 7.4
2.51 2.54
2.38 2.23
2.52
2.24
2.67
2.35 2.22
2.55
0.00
0.50
1.00
1.50
2.00
2.50
3.00
2004 2005 2006 2007 2008 2009 2011 2012 2013 2014
Cit
ize
n B
ioti
c In
de
x Sc
ore
Good
Fair
Poor
27
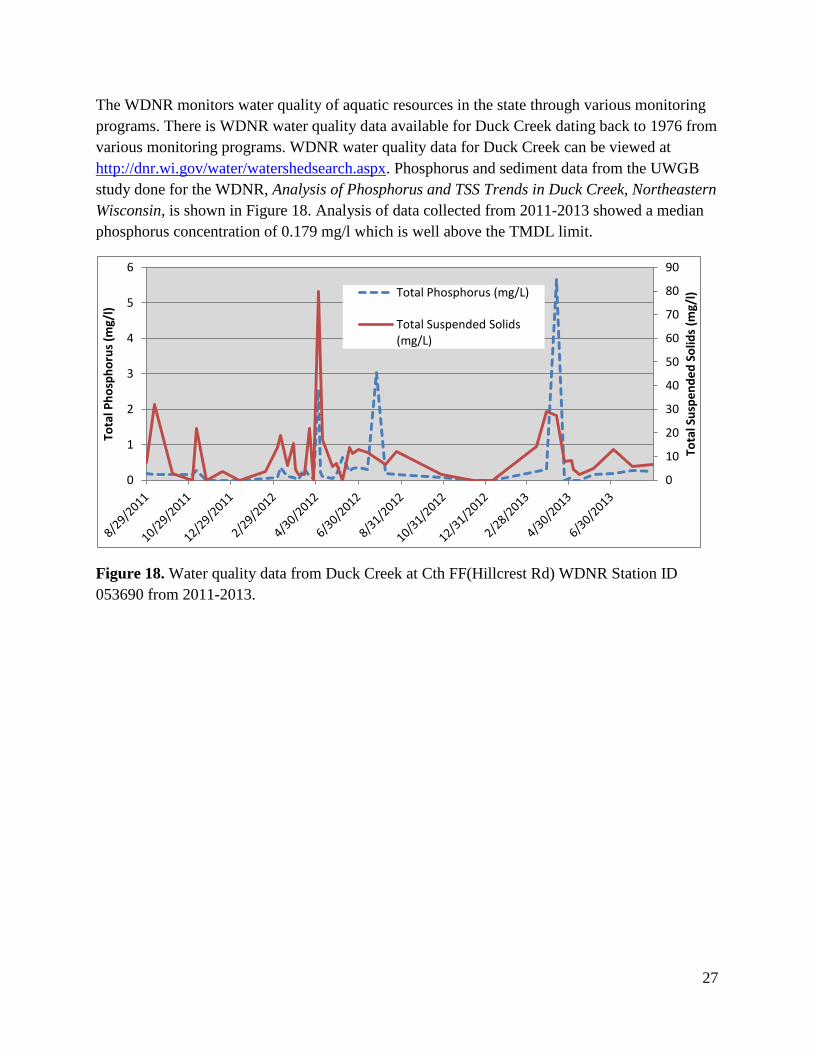
The WDNR monitors water quality of aquatic resources in the state through various monitoring
programs. There is WDNR water quality data available for Duck Creek dating back to 1976 from
various monitoring programs. WDNR water quality data for Duck Creek can be viewed at
http://dnr.wi.gov/water/watershedsearch.aspx. Phosphorus and sediment data from the UWGB
study done for the WDNR, Analysis of Phosphorus and TSS Trends in Duck Creek, Northeastern
Wisconsin, is shown in Figure 18. Analysis of data collected from 2011-2013 showed a median
phosphorus concentration of 0.179 mg/l which is well above the TMDL limit.
Figure 18. Water quality data from Duck Creek at Cth FF(Hillcrest Rd) WDNR Station ID
053690 from 2011-2013.
0
10
20
30
40
50
60
70
80
90
0
1
2
3
4
5
6
Tota
l Su
spe
nd
ed
So
lids
(mg/
l)
Tota
l Ph
osp
ho
rus
(mg/
l)
Total Phosphorus (mg/L)
Total Suspended Solids (mg/L)

28
(This page intentionally left blank)
29
5.0 Pollutant Loading Model
The developers of the Lower Fox River TMDL plan ran the Soil and Water Assessment Tool
(SWAT) for all subwatersheds in the Lower Fox River Basin. The SWAT model is able to
predict the impact of land use management on the transport of nutrients, water, sediment, and
pesticides. Actual cropping, tillage and nutrient management practices typical to Wisconsin were
input into the model. Other data inputs into the model include: climate data, hydrography, soil
types, elevation, land use, contours, political/municipal boundaries, MS4 boundaries, vegetated
buffer strips, wetlands, point source loads, and WDNR-Enhanced USGS 1:24K DRG
topographic maps. The model was calibrated with water quality data taken at USGS sites from
the East River, Duck Creek, Baird Creek, Ashwaubenon Creek, and Apple Creek in the Lower
Fox River Basin.
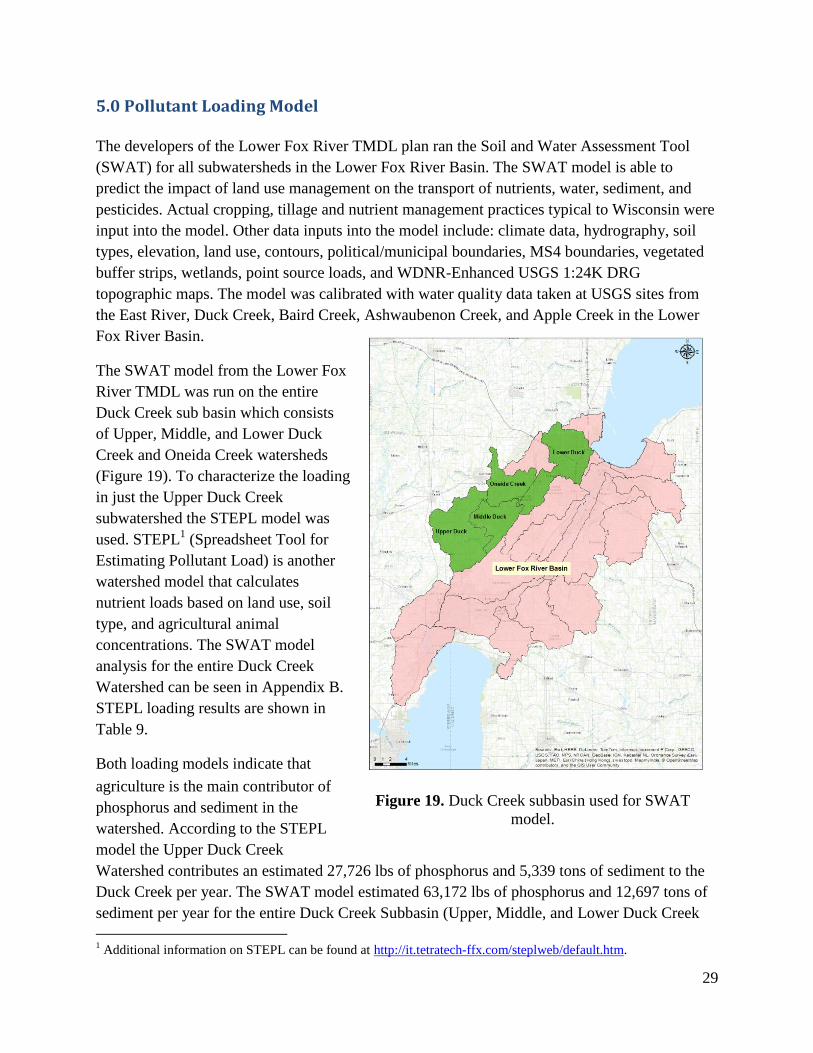
The SWAT model from the Lower Fox
River TMDL was run on the entire
Duck Creek sub basin which consists
of Upper, Middle, and Lower Duck
Creek and Oneida Creek watersheds
(Figure 19). To characterize the loading
in just the Upper Duck Creek
subwatershed the STEPL model was
used. STEPL1 (Spreadsheet Tool for
Estimating Pollutant Load) is another
watershed model that calculates
nutrient loads based on land use, soil
type, and agricultural animal
concentrations. The SWAT model
analysis for the entire Duck Creek
Watershed can be seen in Appendix B.
STEPL loading results are shown in
Table 9.
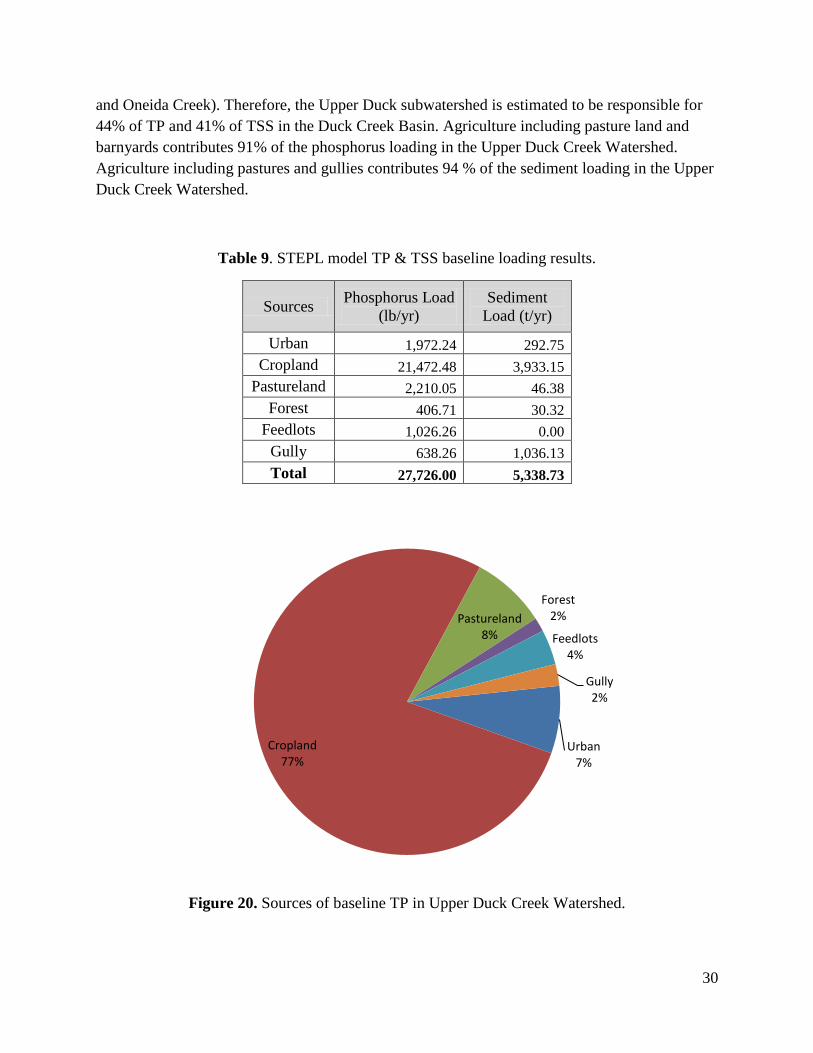
Both loading models indicate that
agriculture is the main contributor of
phosphorus and sediment in the
watershed. According to the STEPL
model the Upper Duck Creek
Watershed contributes an estimated 27,726 lbs of phosphorus and 5,339 tons of sediment to the
Duck Creek per year. The SWAT model estimated 63,172 lbs of phosphorus and 12,697 tons of
sediment per year for the entire Duck Creek Subbasin (Upper, Middle, and Lower Duck Creek
1 Additional information on STEPL can be found at http://it.tetratech-ffx.com/steplweb/default.htm.
Figure 19. Duck Creek subbasin used for SWAT
model.
30
and Oneida Creek). Therefore, the Upper Duck subwatershed is estimated to be responsible for
44% of TP and 41% of TSS in the Duck Creek Basin. Agriculture including pasture land and
barnyards contributes 91% of the phosphorus loading in the Upper Duck Creek Watershed.
Agriculture including pastures and gullies contributes 94 % of the sediment loading in the Upper
Duck Creek Watershed.
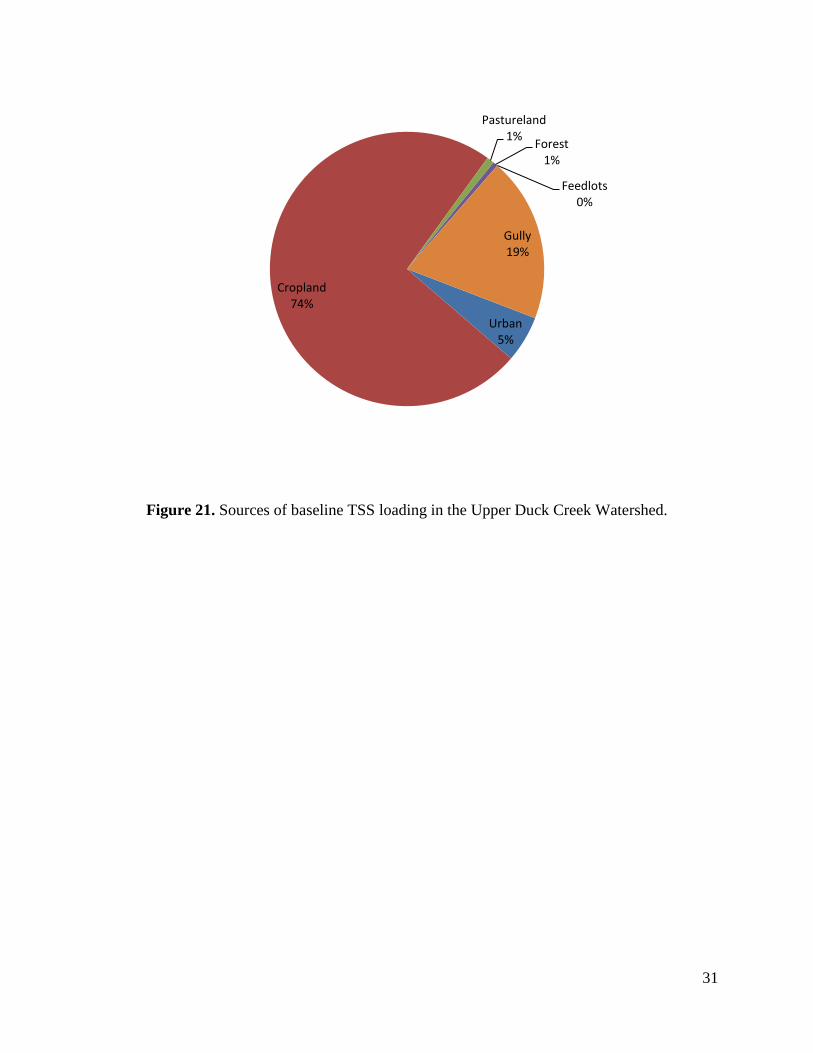
Table 9. STEPL model TP & TSS baseline loading results.
Sources Phosphorus Load
(lb/yr)
Sediment
Load (t/yr)
Urban 1,972.24 292.75
Cropland 21,472.48 3,933.15
Pastureland 2,210.05 46.38
Forest 406.71 30.32
Feedlots 1,026.26 0.00
Gully 638.26 1,036.13
Total 27,726.00 5,338.73
Figure 20. Sources of baseline TP in Upper Duck Creek Watershed.
Urban 7%
Cropland 77%
Pastureland 8%
Forest 2%
Feedlots 4%
Gully 2%
31
Figure 21. Sources of baseline TSS loading in the Upper Duck Creek Watershed.
Urban 5%
Cropland 74%
Pastureland 1%
Forest 1%
Feedlots 0%
Gully 19%

32
(This page intentionally left blank)
33
6.0 Watershed Inventory
6.1 Barnyard Inventory Results
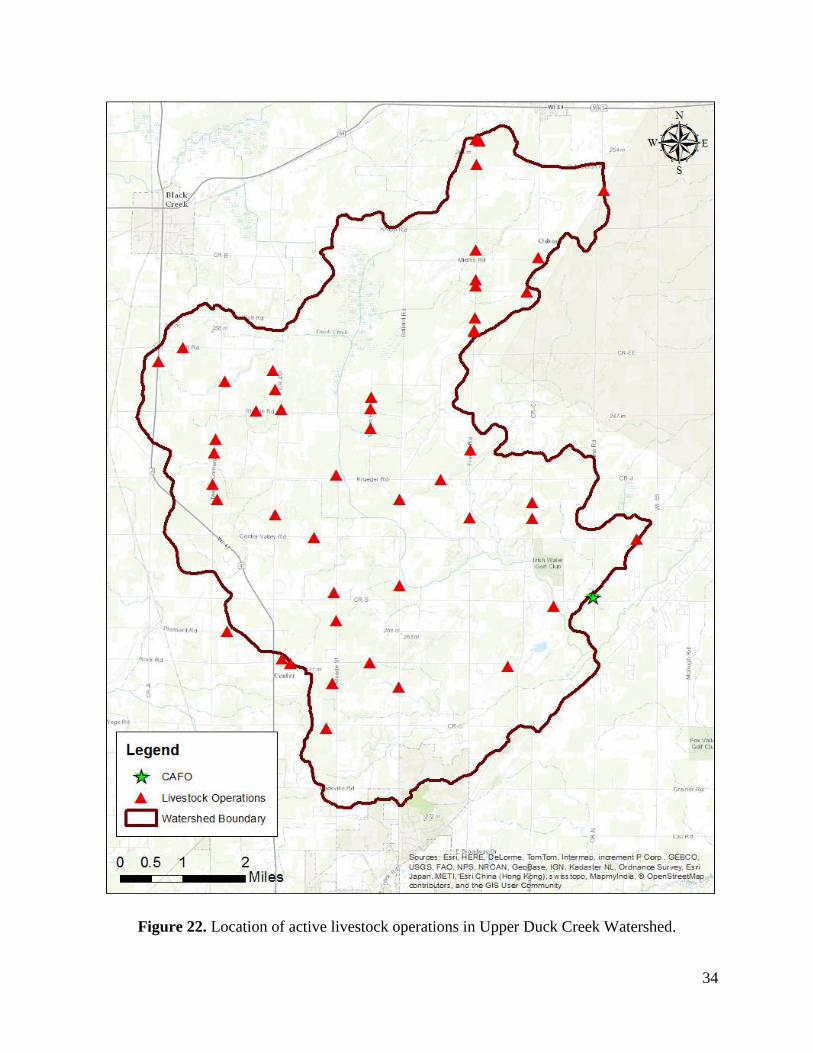
Location and data on current livestock operations was compiled through existing Land
Conservation Department data, air photo interpretation, and windshield surveys. Additional
barnyard data was collected by meetings with farm owners. There are a total of 49 active
livestock operations with an estimated 4,700 livestock animals including dairy, beef, swine, and
veal farms. There is one CAFO in the southeast edge of the watershed. All CAFO’s were
assumed to have zero discharge from their production area. Locations of livestock operations in
the watershed are shown in Figure 22.
Barnyard data was entered in to the NRCS BARNY
spreadsheet tool to estimate phosphorus loading.
According to the BARNY calculations an estimated
967 lbs of phosphorus per year can be attributed to
barnyard runoff. STEPL model loading estimates
barnyard phosphorus loading slightly higher at
1,227 lbs of phosphorus. Barnyard runoff accounts
for approximately 4% of the total phosphorus
loading from agriculture. Many farm sites have
already had runoff management measures and waste
storage installed during the Duck, Apple,
Ashwaubenon Priority Watershed Project that ended
in 2010. Barnyard runoff is not a significant source
of phosphorus in this watershed. Barnyards that
exceed the annual phosphorus discharge limit of 15
lbs/year will be eligible for cost share assistance to
obtain necessary reductions in phosphorus loading.
Estimated phosphorus loadings per farm site over 15
lbs P/year are shown in Table 10.
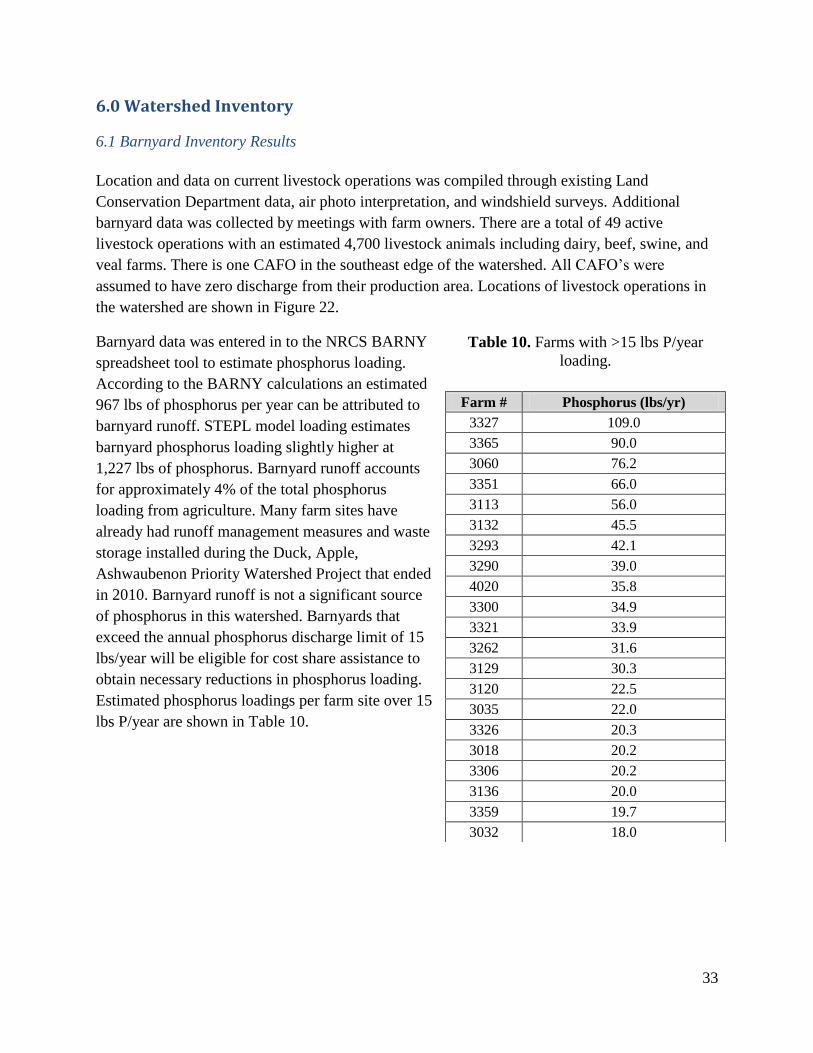
Table 10. Farms with >15 lbs P/year
loading.
Farm # Phosphorus (lbs/yr)
3327 109.0
3365 90.0
3060 76.2
3351 66.0
3113 56.0
3132 45.5
3293 42.1
3290 39.0
4020 35.8
3300 34.9
3321 33.9
3262 31.6
3129 30.3
3120 22.5
3035 22.0
3326 20.3
3018 20.2
3306 20.2
3136 20.0
3359 19.7
3032 18.0
34
Figure 22. Location of active livestock operations in Upper Duck Creek Watershed.
35
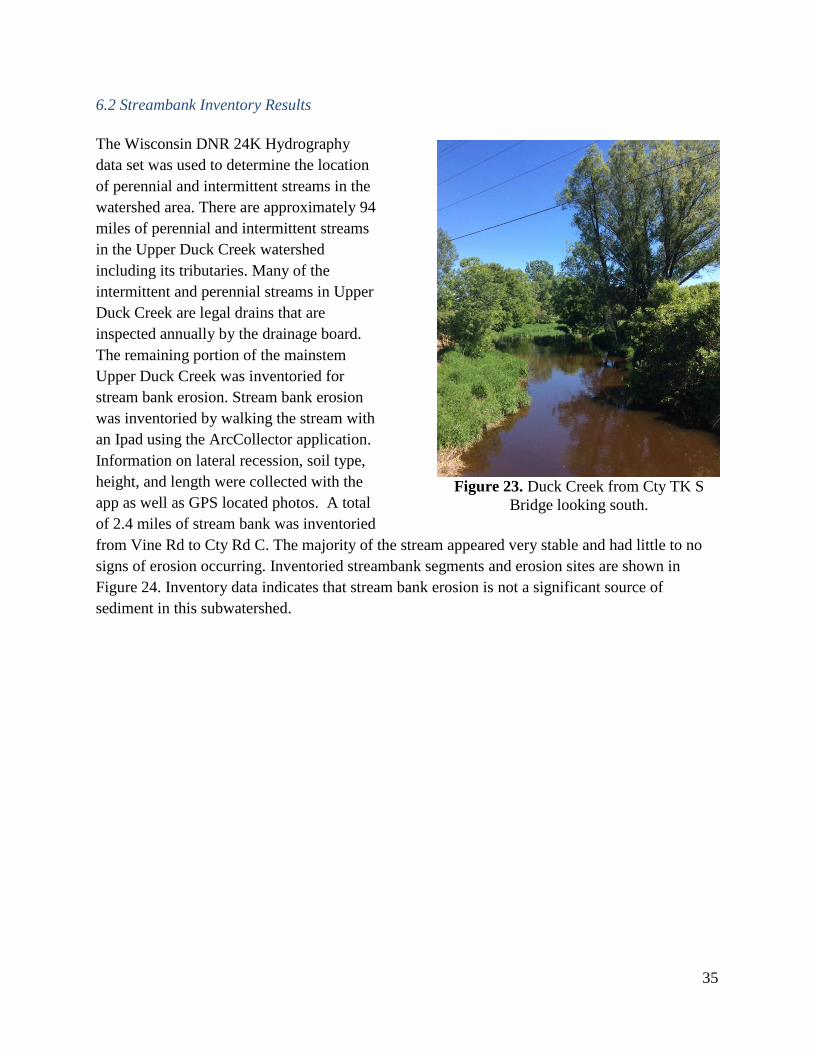
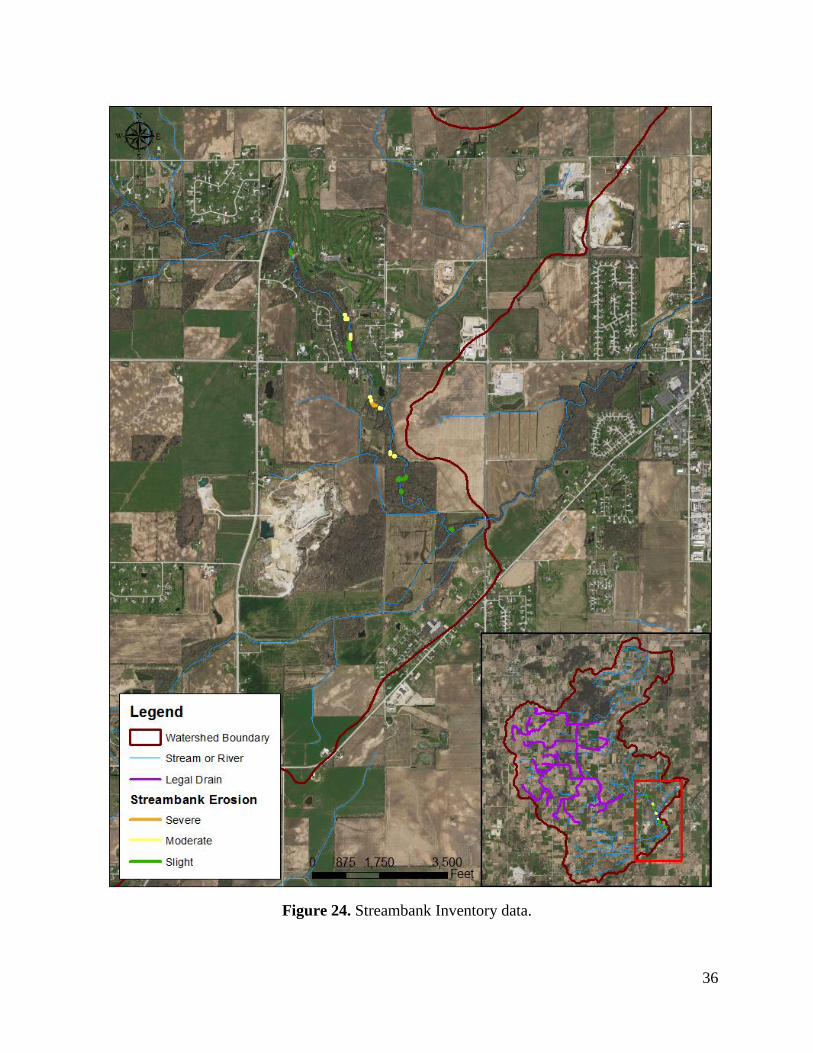
6.2 Streambank Inventory Results
The Wisconsin DNR 24K Hydrography
data set was used to determine the location
of perennial and intermittent streams in the
watershed area. There are approximately 94
miles of perennial and intermittent streams
in the Upper Duck Creek watershed
including its tributaries. Many of the
intermittent and perennial streams in Upper
Duck Creek are legal drains that are
inspected annually by the drainage board.
The remaining portion of the mainstem
Upper Duck Creek was inventoried for
stream bank erosion. Stream bank erosion
was inventoried by walking the stream with
an Ipad using the ArcCollector application.
Information on lateral recession, soil type,
height, and length were collected with the
app as well as GPS located photos. A total
of 2.4 miles of stream bank was inventoried
from Vine Rd to Cty Rd C. The majority of the stream appeared very stable and had little to no
signs of erosion occurring. Inventoried streambank segments and erosion sites are shown in
Figure 24. Inventory data indicates that stream bank erosion is not a significant source of
sediment in this subwatershed.
Figure 23. Duck Creek from Cty TK S
Bridge looking south.
36
Figure 24. Streambank Inventory data.
37
6.3 Upland Inventory
Agricultural uplands were inventoried by windshield survey, use of GIS data and tools, and with
aerial photography. The use of a tool developed by the WDNR called EVAAL (Erosion
Vulnerability Assessment for Agricultural Lands) and its data sets were used to determine
priority areas for best management practices in the watershed. The tool estimates the
vulnerability of a field to erosion and can be used to determine internally draining areas,
potential for gully erosion, and potential for sheet and rill erosion. Other GIS methods also used
to determine priority areas include the Compound Topographic Wetness Index and Normalized
Difference Tillage Index.
Tillage Practices and Residue Management
Data was analyzed from the Conservation Technology Information Center (CTIC) Conservation
Tillage Reports (Transect Surveys) from Brown, Outagamie, Calumet, and Winnebago Counties
to determine primary tillage practices for the SWAT model input for the Lower Fox River
TMDL. Baseline tillage conditions were based on data averages from 1999, 2000, and 2002. The
baseline tillage conditions for a dairy rotation were determined to be 83.1% Conventional
Tillage, 15.2 % Mulch Till, and 1.7% No till and 75.9 % Conventional Tillage, 20.2 % Mulch
Till, and 3.9% No till for Cash Crop Rotation (WDNR 2012).
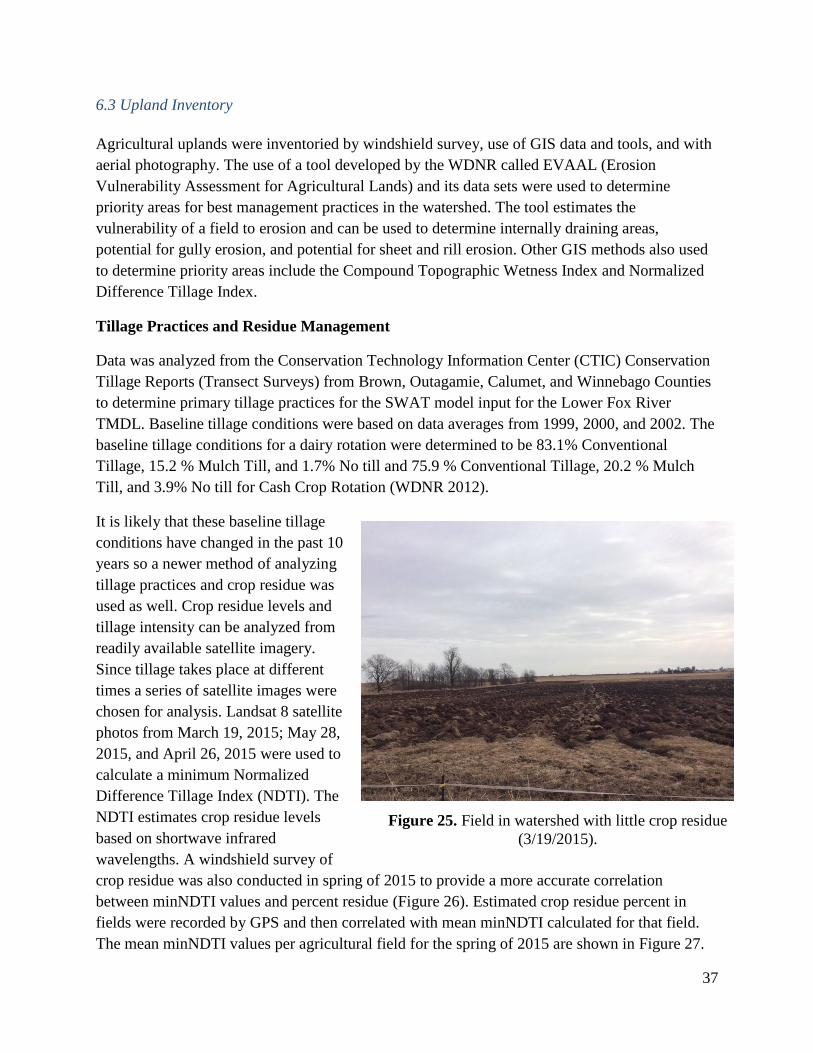
It is likely that these baseline tillage
conditions have changed in the past 10
years so a newer method of analyzing
tillage practices and crop residue was
used as well. Crop residue levels and
tillage intensity can be analyzed from
readily available satellite imagery.
Since tillage takes place at different
times a series of satellite images were
chosen for analysis. Landsat 8 satellite
photos from March 19, 2015; May 28,
2015, and April 26, 2015 were used to
calculate a minimum Normalized
Difference Tillage Index (NDTI). The
NDTI estimates crop residue levels
based on shortwave infrared
wavelengths. A windshield survey of
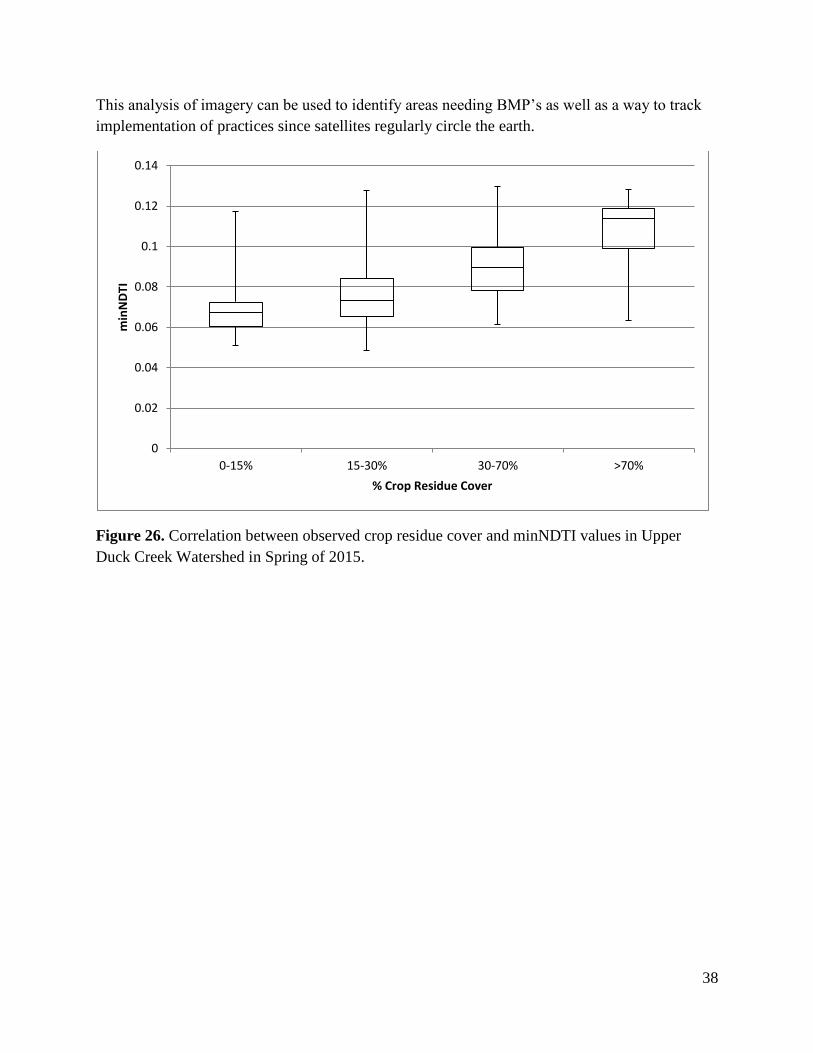
crop residue was also conducted in spring of 2015 to provide a more accurate correlation
between minNDTI values and percent residue (Figure 26). Estimated crop residue percent in
fields were recorded by GPS and then correlated with mean minNDTI calculated for that field.
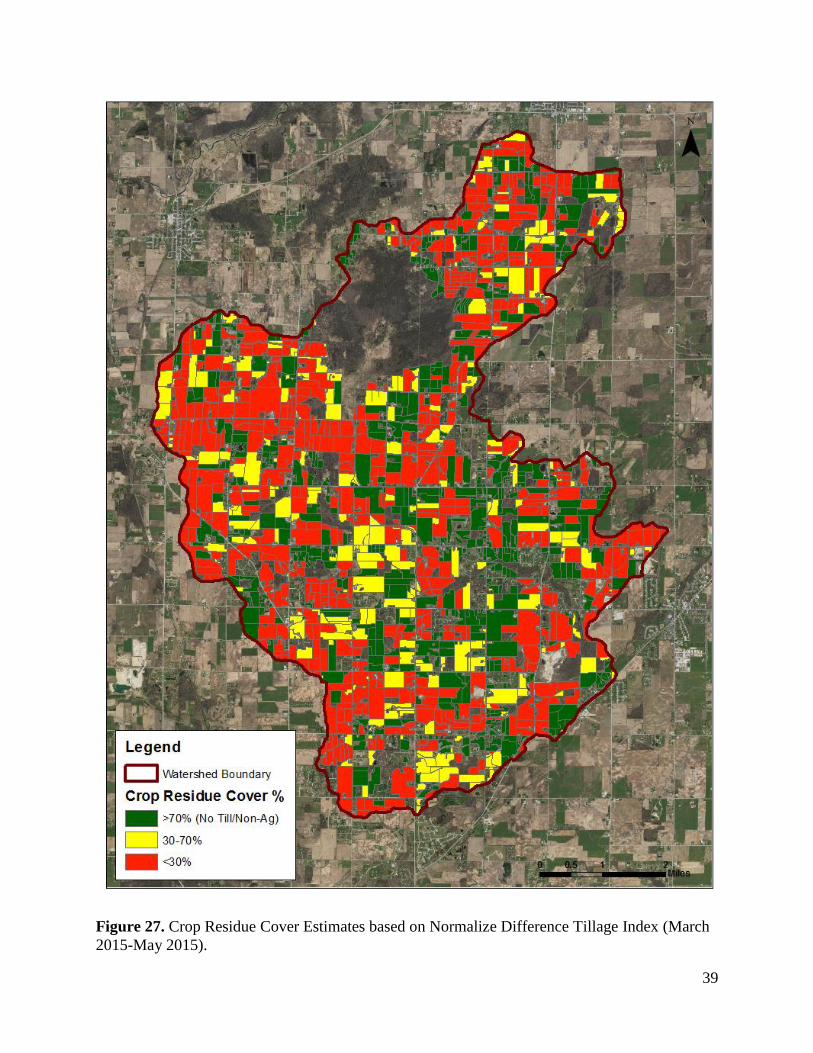
The mean minNDTI values per agricultural field for the spring of 2015 are shown in Figure 27.
Figure 25. Field in watershed with little crop residue
(3/19/2015).
38
This analysis of imagery can be used to identify areas needing BMP’s as well as a way to track
implementation of practices since satellites regularly circle the earth.
Figure 26. Correlation between observed crop residue cover and minNDTI values in Upper
Duck Creek Watershed in Spring of 2015.
0
0.02
0.04
0.06
0.08
0.1
0.12
0.14
0-15% 15-30% 30-70% >70%
min
ND
TI
% Crop Residue Cover
39
Figure 27. Crop Residue Cover Estimates based on Normalize Difference Tillage Index (March
2015-May 2015).
40
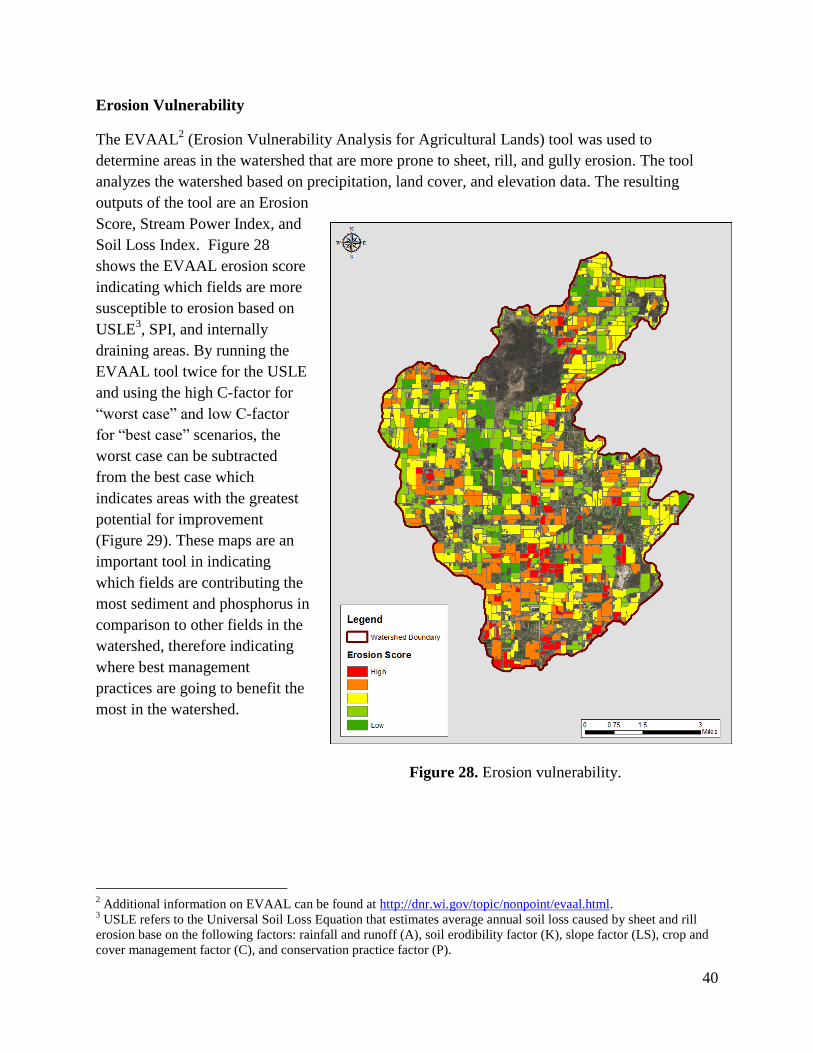
Erosion Vulnerability
The EVAAL2 (Erosion Vulnerability Analysis for Agricultural Lands) tool was used to
determine areas in the watershed that are more prone to sheet, rill, and gully erosion. The tool
analyzes the watershed based on precipitation, land cover, and elevation data. The resulting
outputs of the tool are an Erosion
Score, Stream Power Index, and
Soil Loss Index. Figure 28
shows the EVAAL erosion score
indicating which fields are more
susceptible to erosion based on
USLE3, SPI, and internally
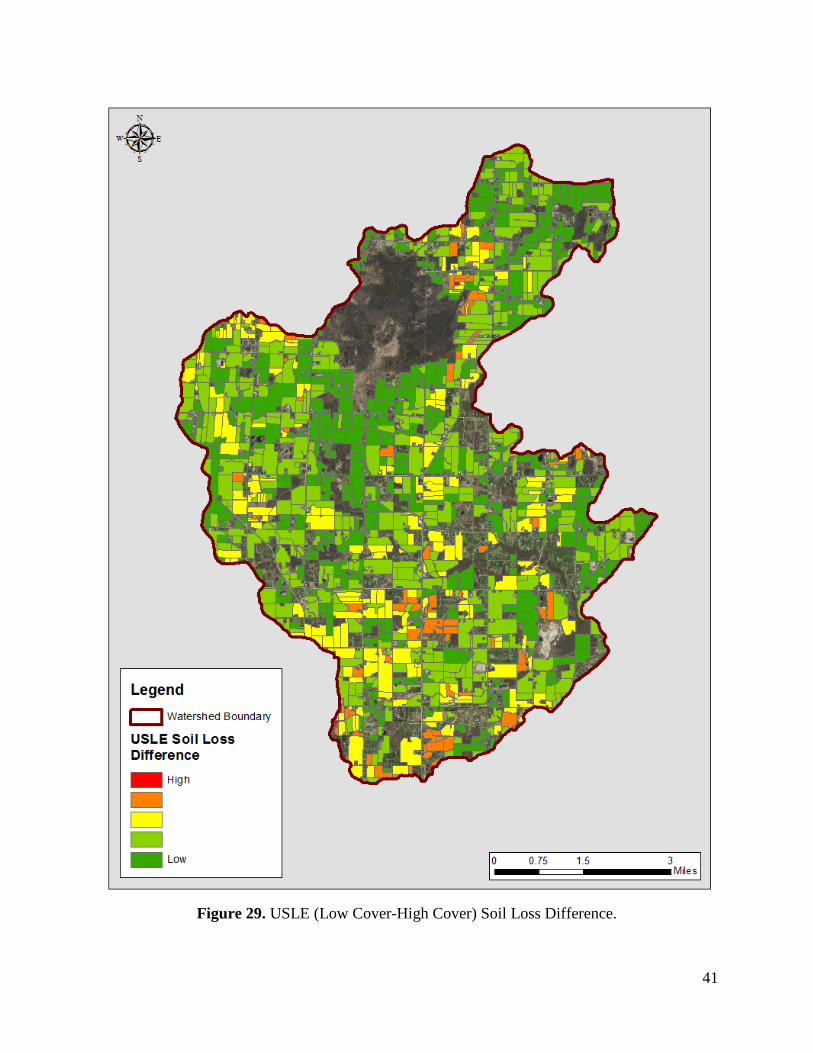
draining areas. By running the
EVAAL tool twice for the USLE
and using the high C-factor for
“worst case” and low C-factor
for “best case” scenarios, the
worst case can be subtracted
from the best case which
indicates areas with the greatest
potential for improvement
(Figure 29). These maps are an
important tool in indicating
which fields are contributing the
most sediment and phosphorus in
comparison to other fields in the
watershed, therefore indicating
where best management
practices are going to benefit the
most in the watershed.
2 Additional information on EVAAL can be found at http://dnr.wi.gov/topic/nonpoint/evaal.html.
3 USLE refers to the Universal Soil Loss Equation that estimates average annual soil loss caused by sheet and rill
erosion base on the following factors: rainfall and runoff (A), soil erodibility factor (K), slope factor (LS), crop and
cover management factor (C), and conservation practice factor (P).
Figure 28. Erosion vulnerability.
41
Figure 29. USLE (Low Cover-High Cover) Soil Loss Difference.
42
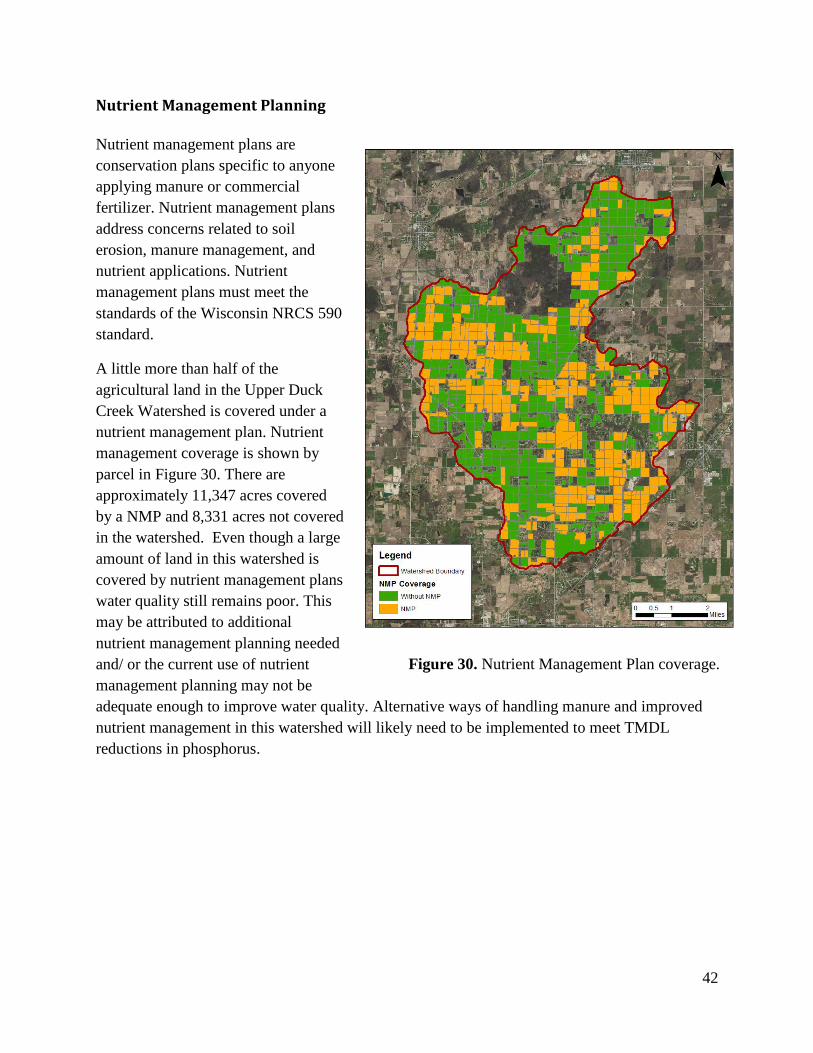
Nutrient Management Planning
Nutrient management plans are
conservation plans specific to anyone
applying manure or commercial
fertilizer. Nutrient management plans
address concerns related to soil
erosion, manure management, and
nutrient applications. Nutrient
management plans must meet the
standards of the Wisconsin NRCS 590
standard.
A little more than half of the
agricultural land in the Upper Duck
Creek Watershed is covered under a
nutrient management plan. Nutrient
management coverage is shown by
parcel in Figure 30. There are
approximately 11,347 acres covered
by a NMP and 8,331 acres not covered
in the watershed. Even though a large
amount of land in this watershed is
covered by nutrient management plans
water quality still remains poor. This
may be attributed to additional
nutrient management planning needed
and/ or the current use of nutrient
management planning may not be
adequate enough to improve water quality. Alternative ways of handling manure and improved
nutrient management in this watershed will likely need to be implemented to meet TMDL
reductions in phosphorus.
Figure 30. Nutrient Management Plan coverage.
43
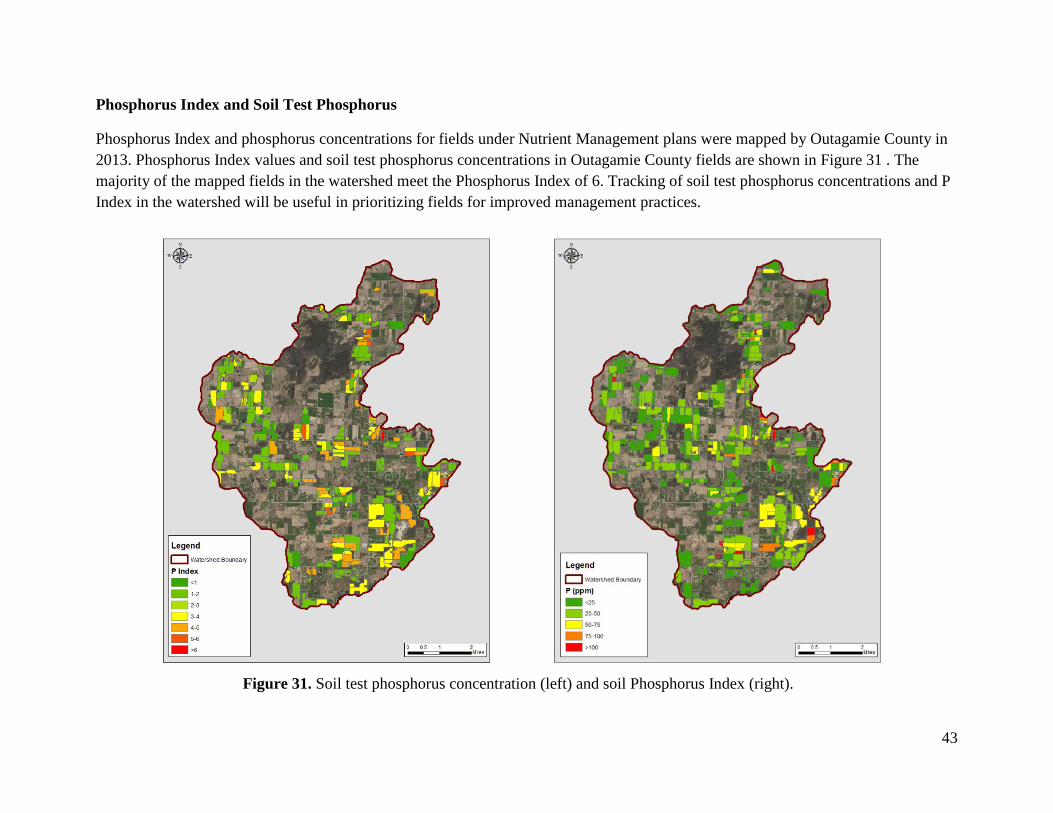
Phosphorus Index and Soil Test Phosphorus
Phosphorus Index and phosphorus concentrations for fields under Nutrient Management plans were mapped by Outagamie County in
2013. Phosphorus Index values and soil test phosphorus concentrations in Outagamie County fields are shown in Figure 31 . The
majority of the mapped fields in the watershed meet the Phosphorus Index of 6. Tracking of soil test phosphorus concentrations and P
Index in the watershed will be useful in prioritizing fields for improved management practices.
Figure 31. Soil test phosphorus concentration (left) and soil Phosphorus Index (right).
44
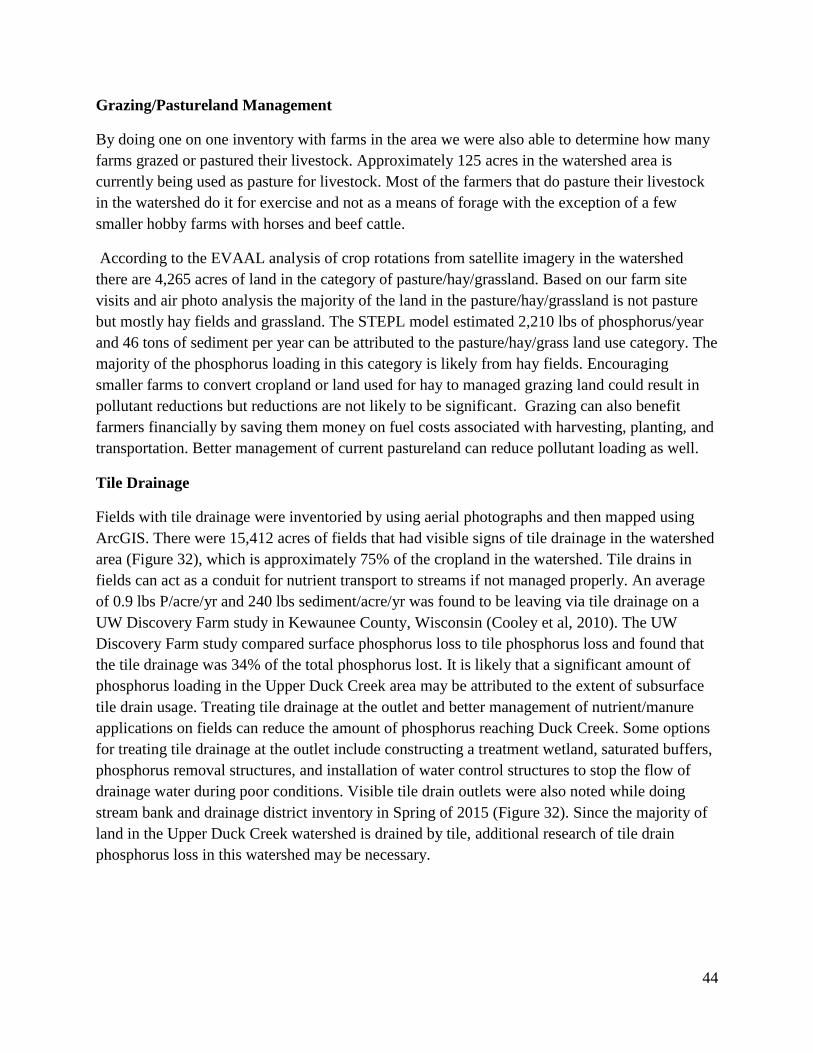
Grazing/Pastureland Management
By doing one on one inventory with farms in the area we were also able to determine how many
farms grazed or pastured their livestock. Approximately 125 acres in the watershed area is
currently being used as pasture for livestock. Most of the farmers that do pasture their livestock
in the watershed do it for exercise and not as a means of forage with the exception of a few
smaller hobby farms with horses and beef cattle.
According to the EVAAL analysis of crop rotations from satellite imagery in the watershed
there are 4,265 acres of land in the category of pasture/hay/grassland. Based on our farm site
visits and air photo analysis the majority of the land in the pasture/hay/grassland is not pasture
but mostly hay fields and grassland. The STEPL model estimated 2,210 lbs of phosphorus/year
and 46 tons of sediment per year can be attributed to the pasture/hay/grass land use category. The
majority of the phosphorus loading in this category is likely from hay fields. Encouraging
smaller farms to convert cropland or land used for hay to managed grazing land could result in
pollutant reductions but reductions are not likely to be significant. Grazing can also benefit
farmers financially by saving them money on fuel costs associated with harvesting, planting, and
transportation. Better management of current pastureland can reduce pollutant loading as well.
Tile Drainage
Fields with tile drainage were inventoried by using aerial photographs and then mapped using
ArcGIS. There were 15,412 acres of fields that had visible signs of tile drainage in the watershed
area (Figure 32), which is approximately 75% of the cropland in the watershed. Tile drains in
fields can act as a conduit for nutrient transport to streams if not managed properly. An average
of 0.9 lbs P/acre/yr and 240 lbs sediment/acre/yr was found to be leaving via tile drainage on a
UW Discovery Farm study in Kewaunee County, Wisconsin (Cooley et al, 2010). The UW
Discovery Farm study compared surface phosphorus loss to tile phosphorus loss and found that
the tile drainage was 34% of the total phosphorus lost. It is likely that a significant amount of
phosphorus loading in the Upper Duck Creek area may be attributed to the extent of subsurface
tile drain usage. Treating tile drainage at the outlet and better management of nutrient/manure
applications on fields can reduce the amount of phosphorus reaching Duck Creek. Some options
for treating tile drainage at the outlet include constructing a treatment wetland, saturated buffers,
phosphorus removal structures, and installation of water control structures to stop the flow of
drainage water during poor conditions. Visible tile drain outlets were also noted while doing
stream bank and drainage district inventory in Spring of 2015 (Figure 32). Since the majority of
land in the Upper Duck Creek watershed is drained by tile, additional research of tile drain
phosphorus loss in this watershed may be necessary.
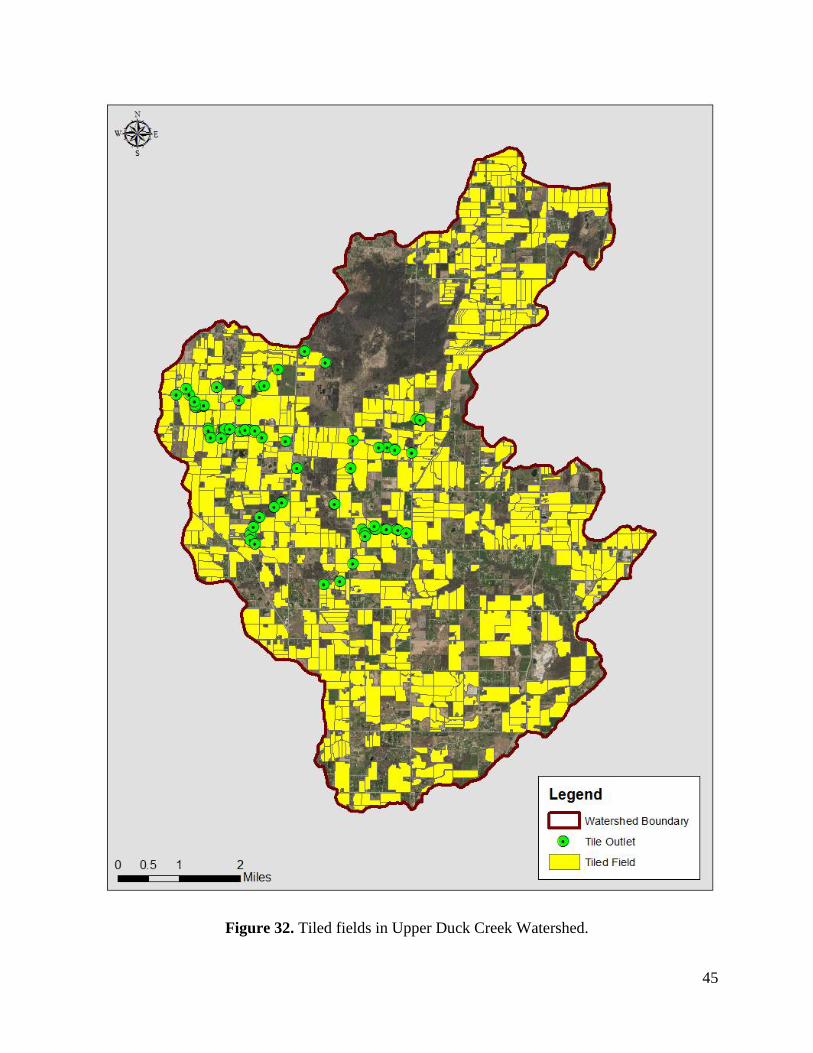
45
Figure 32. Tiled fields in Upper Duck Creek Watershed.
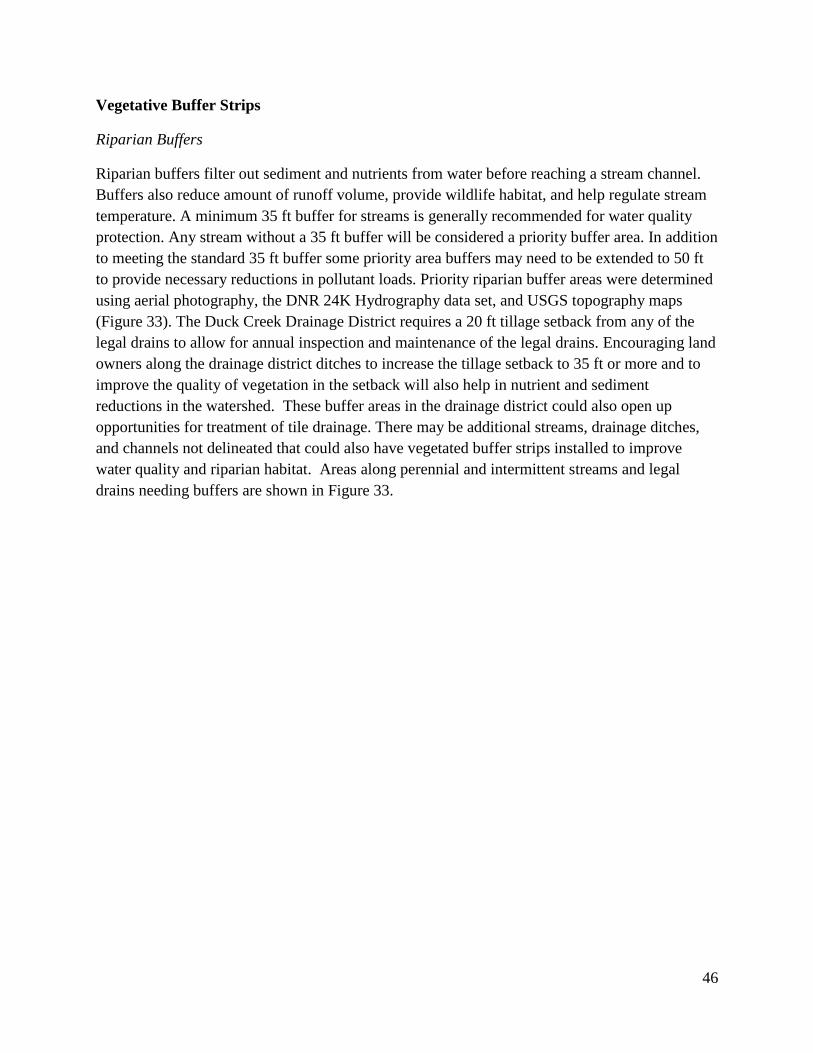
46
Vegetative Buffer Strips
Riparian Buffers
Riparian buffers filter out sediment and nutrients from water before reaching a stream channel.
Buffers also reduce amount of runoff volume, provide wildlife habitat, and help regulate stream
temperature. A minimum 35 ft buffer for streams is generally recommended for water quality
protection. Any stream without a 35 ft buffer will be considered a priority buffer area. In addition
to meeting the standard 35 ft buffer some priority area buffers may need to be extended to 50 ft
to provide necessary reductions in pollutant loads. Priority riparian buffer areas were determined
using aerial photography, the DNR 24K Hydrography data set, and USGS topography maps
(Figure 33). The Duck Creek Drainage District requires a 20 ft tillage setback from any of the
legal drains to allow for annual inspection and maintenance of the legal drains. Encouraging land
owners along the drainage district ditches to increase the tillage setback to 35 ft or more and to
improve the quality of vegetation in the setback will also help in nutrient and sediment
reductions in the watershed. These buffer areas in the drainage district could also open up
opportunities for treatment of tile drainage. There may be additional streams, drainage ditches,
and channels not delineated that could also have vegetated buffer strips installed to improve
water quality and riparian habitat. Areas along perennial and intermittent streams and legal
drains needing buffers are shown in Figure 33.
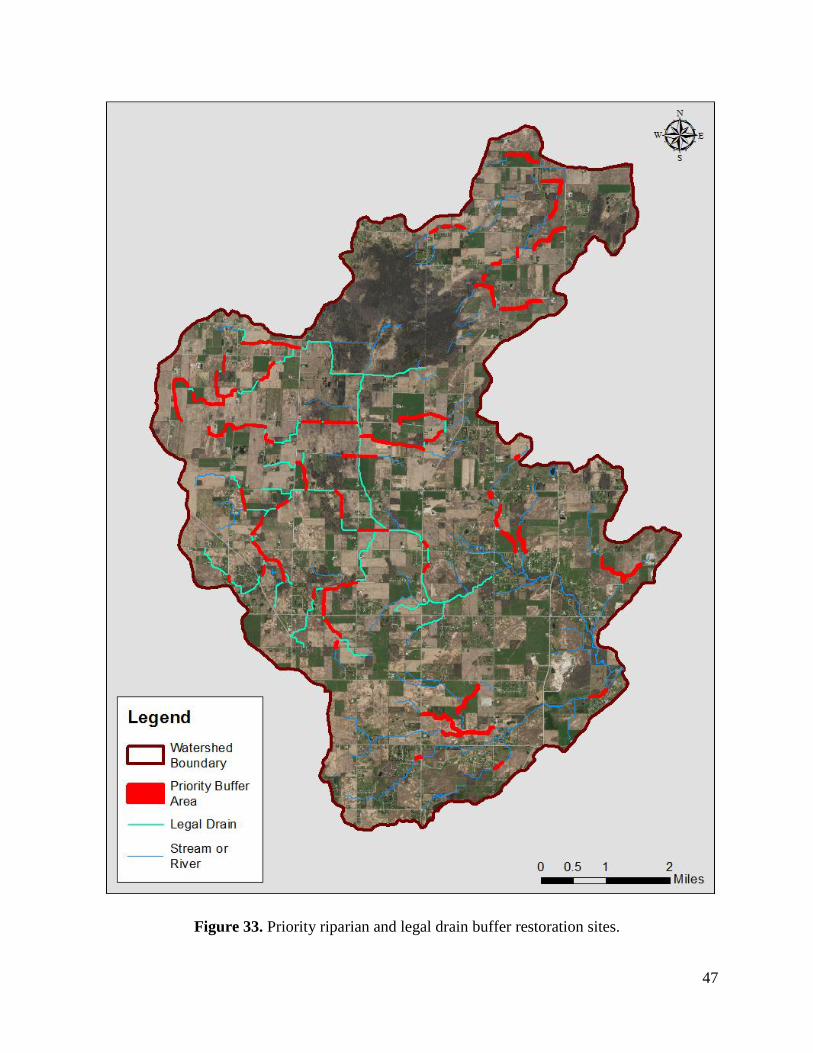
47
Figure 33. Priority riparian and legal drain buffer restoration sites.
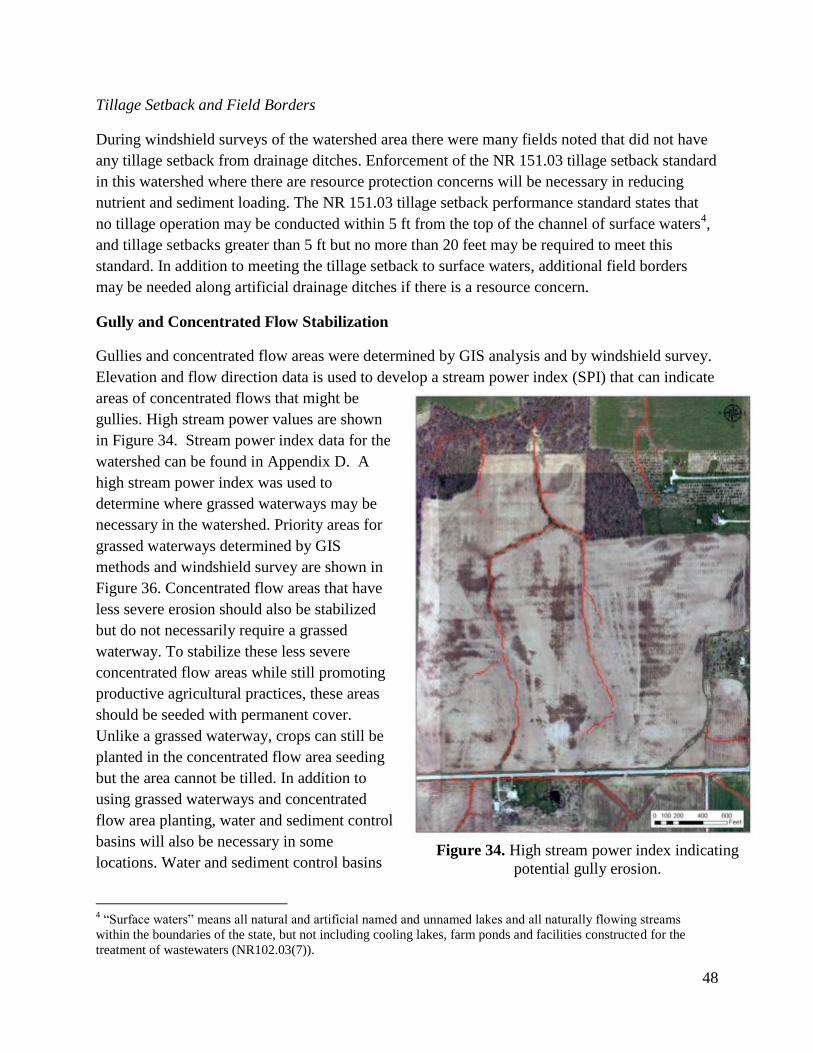
48
Tillage Setback and Field Borders
During windshield surveys of the watershed area there were many fields noted that did not have
any tillage setback from drainage ditches. Enforcement of the NR 151.03 tillage setback standard
in this watershed where there are resource protection concerns will be necessary in reducing
nutrient and sediment loading. The NR 151.03 tillage setback performance standard states that
no tillage operation may be conducted within 5 ft from the top of the channel of surface waters4,
and tillage setbacks greater than 5 ft but no more than 20 feet may be required to meet this
standard. In addition to meeting the tillage setback to surface waters, additional field borders
may be needed along artificial drainage ditches if there is a resource concern.
Gully and Concentrated Flow Stabilization
Gullies and concentrated flow areas were determined by GIS analysis and by windshield survey.
Elevation and flow direction data is used to develop a stream power index (SPI) that can indicate
areas of concentrated flows that might be
gullies. High stream power values are shown
in Figure 34. Stream power index data for the
watershed can be found in Appendix D. A
high stream power index was used to
determine where grassed waterways may be
necessary in the watershed. Priority areas for
grassed waterways determined by GIS
methods and windshield survey are shown in
Figure 36. Concentrated flow areas that have
less severe erosion should also be stabilized
but do not necessarily require a grassed
waterway. To stabilize these less severe
concentrated flow areas while still promoting
productive agricultural practices, these areas
should be seeded with permanent cover.
Unlike a grassed waterway, crops can still be
planted in the concentrated flow area seeding
but the area cannot be tilled. In addition to
using grassed waterways and concentrated
flow area planting, water and sediment control
basins will also be necessary in some
locations. Water and sediment control basins
4 “Surface waters” means all natural and artificial named and unnamed lakes and all naturally flowing streams
within the boundaries of the state, but not including cooling lakes, farm ponds and facilities constructed for the
treatment of wastewaters (NR102.03(7)).
Figure 34. High stream power index indicating
potential gully erosion.
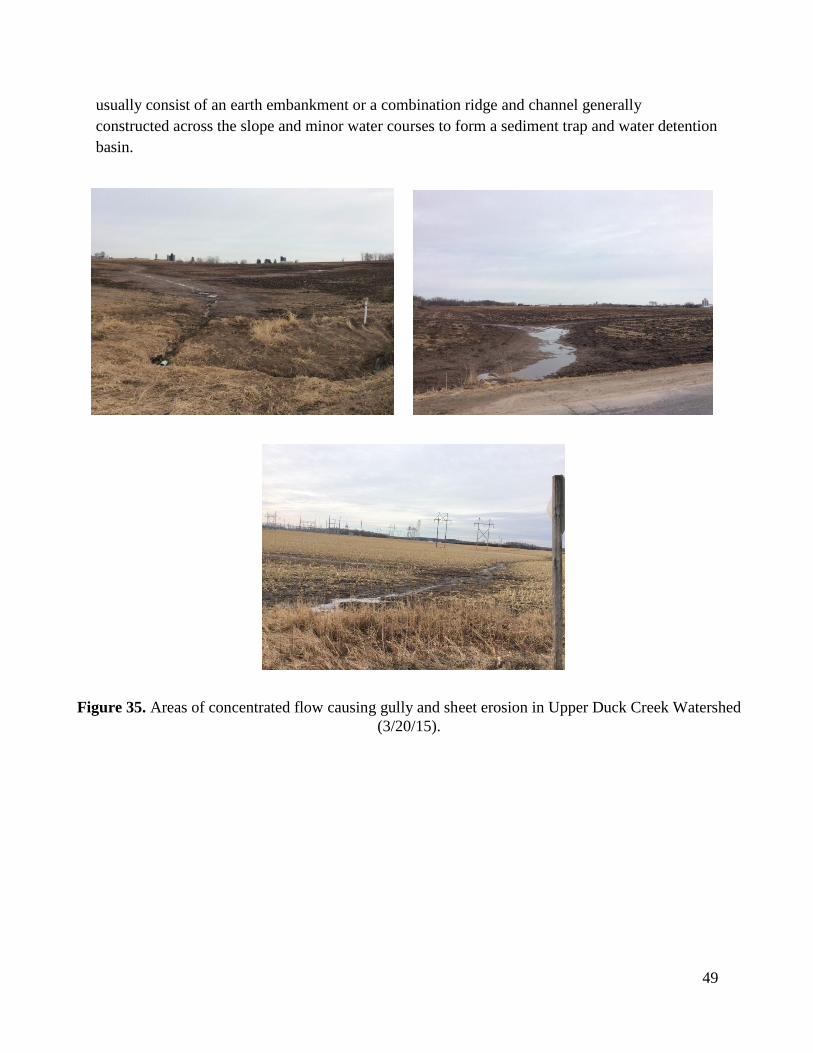
49
usually consist of an earth embankment or a combination ridge and channel generally
constructed across the slope and minor water courses to form a sediment trap and water detention
basin.
Figure 35. Areas of concentrated flow causing gully and sheet erosion in Upper Duck Creek Watershed
(3/20/15).
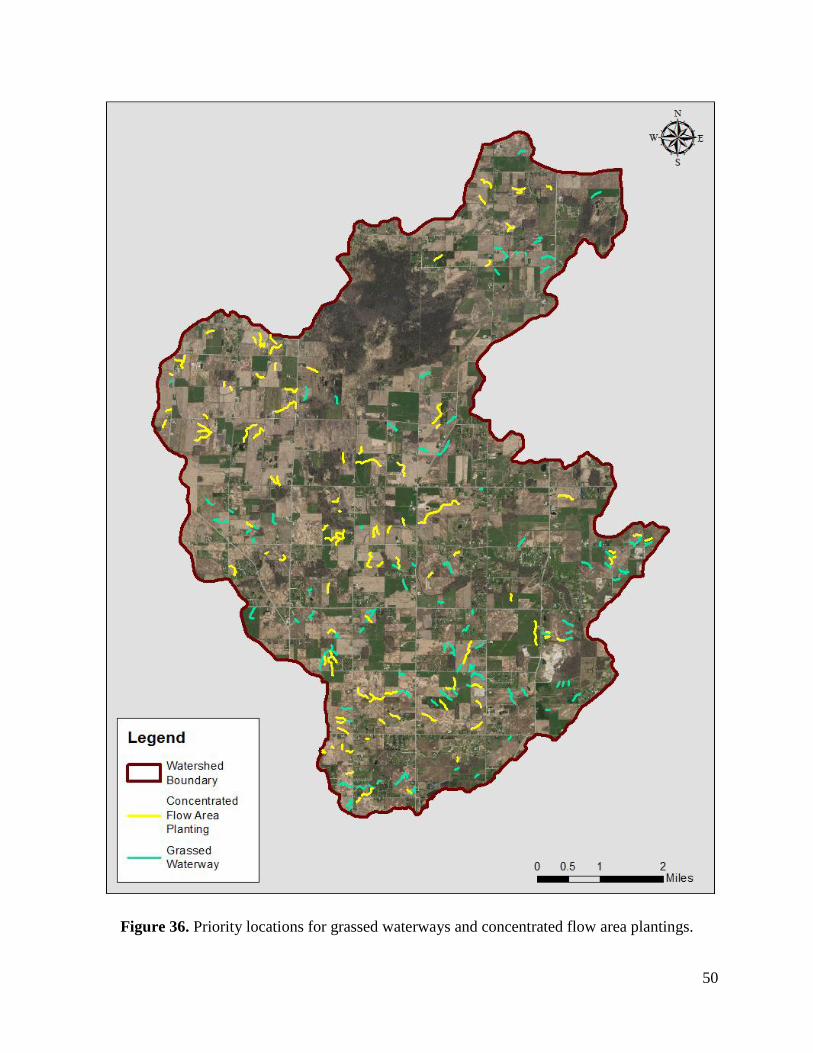
50
Figure 36. Priority locations for grassed waterways and concentrated flow area plantings.
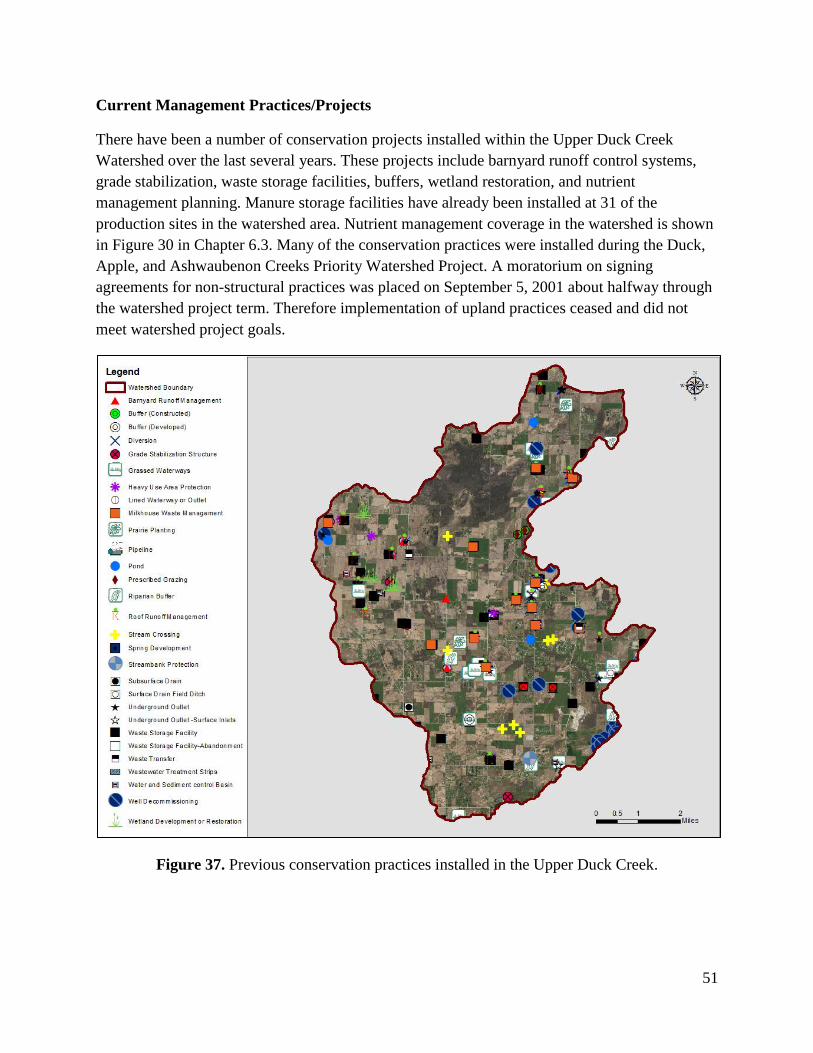
51
Current Management Practices/Projects
There have been a number of conservation projects installed within the Upper Duck Creek
Watershed over the last several years. These projects include barnyard runoff control systems,
grade stabilization, waste storage facilities, buffers, wetland restoration, and nutrient
management planning. Manure storage facilities have already been installed at 31 of the
production sites in the watershed area. Nutrient management coverage in the watershed is shown
in Figure 30 in Chapter 6.3. Many of the conservation practices were installed during the Duck,
Apple, and Ashwaubenon Creeks Priority Watershed Project. A moratorium on signing
agreements for non-structural practices was placed on September 5, 2001 about halfway through
the watershed project term. Therefore implementation of upland practices ceased and did not
meet watershed project goals.
Figure 37. Previous conservation practices installed in the Upper Duck Creek.
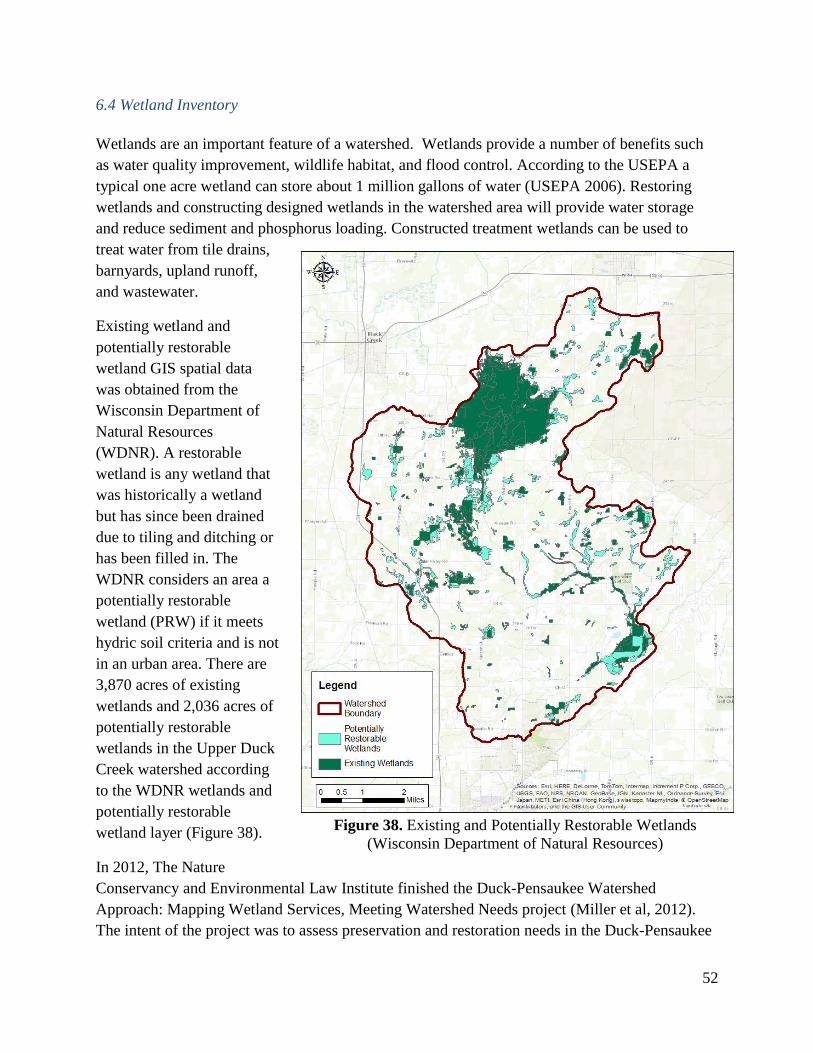
52
6.4 Wetland Inventory
Wetlands are an important feature of a watershed. Wetlands provide a number of benefits such
as water quality improvement, wildlife habitat, and flood control. According to the USEPA a
typical one acre wetland can store about 1 million gallons of water (USEPA 2006). Restoring
wetlands and constructing designed wetlands in the watershed area will provide water storage
and reduce sediment and phosphorus loading. Constructed treatment wetlands can be used to
treat water from tile drains,
barnyards, upland runoff,
and wastewater.
Existing wetland and
potentially restorable
wetland GIS spatial data
was obtained from the
Wisconsin Department of
Natural Resources
(WDNR). A restorable
wetland is any wetland that
was historically a wetland
but has since been drained
due to tiling and ditching or
has been filled in. The
WDNR considers an area a
potentially restorable
wetland (PRW) if it meets
hydric soil criteria and is not
in an urban area. There are
3,870 acres of existing
wetlands and 2,036 acres of
potentially restorable
wetlands in the Upper Duck
Creek watershed according
to the WDNR wetlands and
potentially restorable
wetland layer (Figure 38).
In 2012, The Nature
Conservancy and Environmental Law Institute finished the Duck-Pensaukee Watershed
Approach: Mapping Wetland Services, Meeting Watershed Needs project (Miller et al, 2012).
The intent of the project was to assess preservation and restoration needs in the Duck-Pensaukee
Figure 38. Existing and Potentially Restorable Wetlands
(Wisconsin Department of Natural Resources)
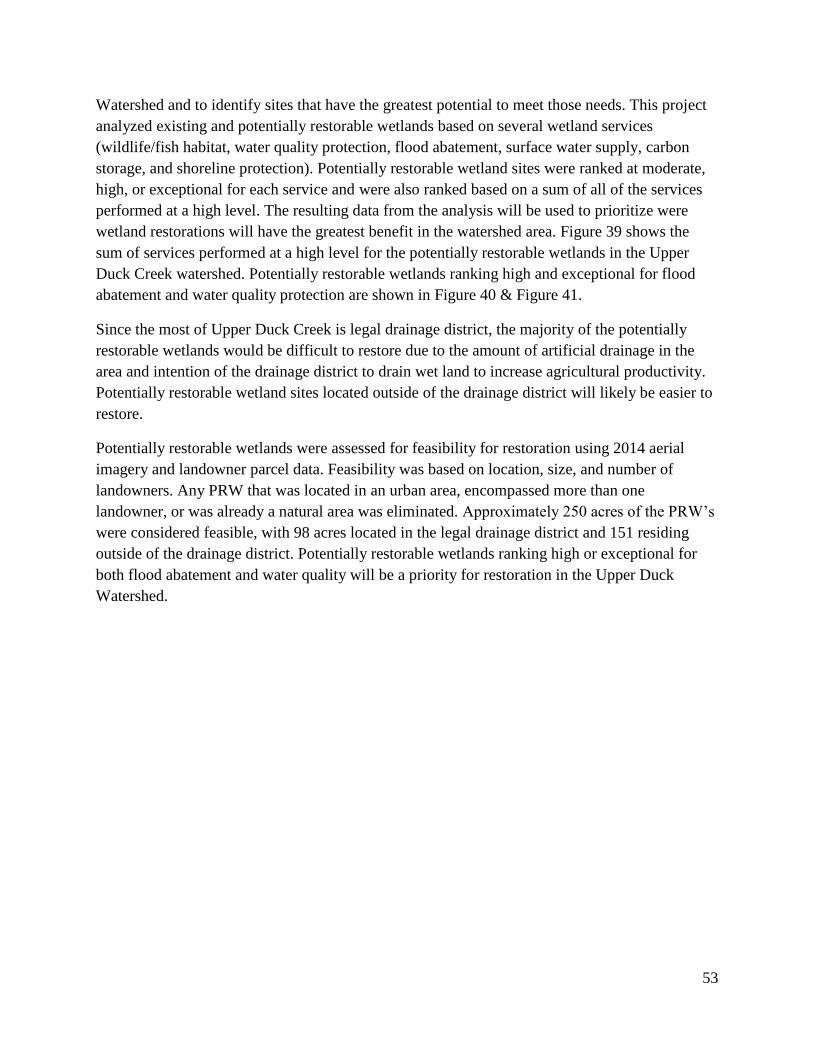
53
Watershed and to identify sites that have the greatest potential to meet those needs. This project
analyzed existing and potentially restorable wetlands based on several wetland services
(wildlife/fish habitat, water quality protection, flood abatement, surface water supply, carbon
storage, and shoreline protection). Potentially restorable wetland sites were ranked at moderate,
high, or exceptional for each service and were also ranked based on a sum of all of the services
performed at a high level. The resulting data from the analysis will be used to prioritize were
wetland restorations will have the greatest benefit in the watershed area. Figure 39 shows the
sum of services performed at a high level for the potentially restorable wetlands in the Upper
Duck Creek watershed. Potentially restorable wetlands ranking high and exceptional for flood
abatement and water quality protection are shown in Figure 40 & Figure 41.
Since the most of Upper Duck Creek is legal drainage district, the majority of the potentially
restorable wetlands would be difficult to restore due to the amount of artificial drainage in the
area and intention of the drainage district to drain wet land to increase agricultural productivity.
Potentially restorable wetland sites located outside of the drainage district will likely be easier to
restore.
Potentially restorable wetlands were assessed for feasibility for restoration using 2014 aerial
imagery and landowner parcel data. Feasibility was based on location, size, and number of
landowners. Any PRW that was located in an urban area, encompassed more than one
landowner, or was already a natural area was eliminated. Approximately 250 acres of the PRW’s
were considered feasible, with 98 acres located in the legal drainage district and 151 residing
outside of the drainage district. Potentially restorable wetlands ranking high or exceptional for
both flood abatement and water quality will be a priority for restoration in the Upper Duck
Watershed.
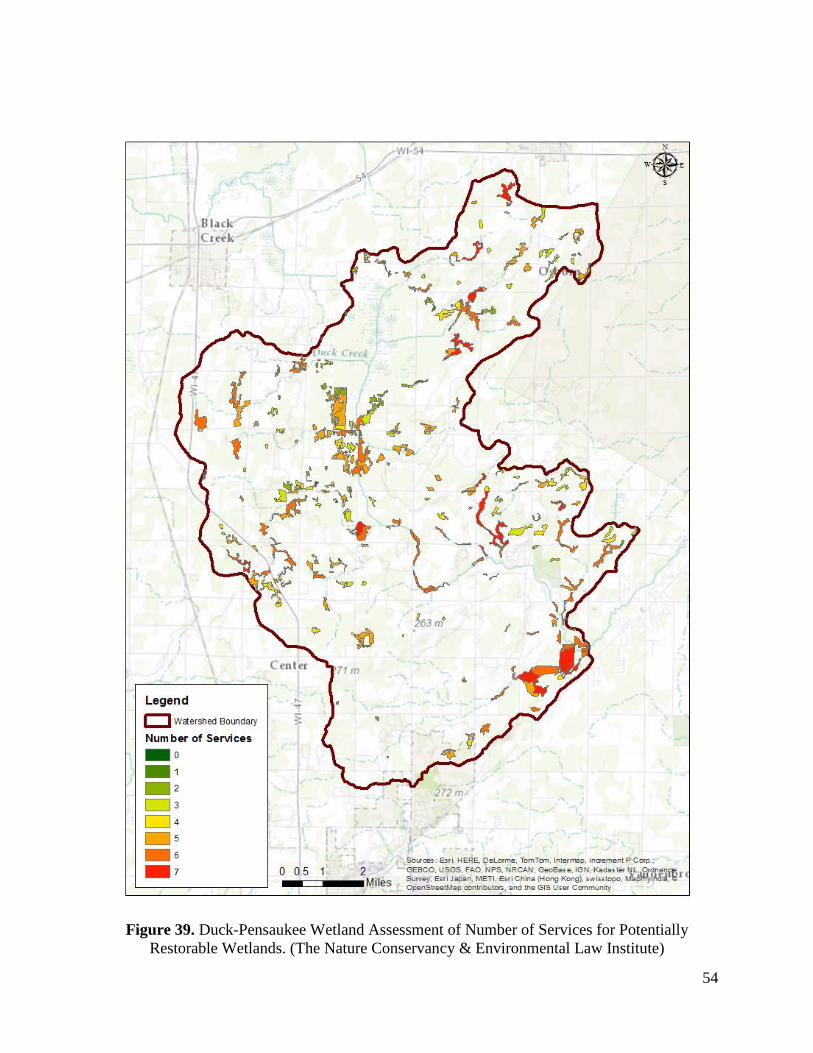
54
Figure 39. Duck-Pensaukee Wetland Assessment of Number of Services for Potentially
Restorable Wetlands. (The Nature Conservancy & Environmental Law Institute)
55
Figure 40. Duck-Pensaukee Wetland assessment of flood abatement services for potentially
restorable wetlands. (The Nature Conservancy & Environmental Law Institute)
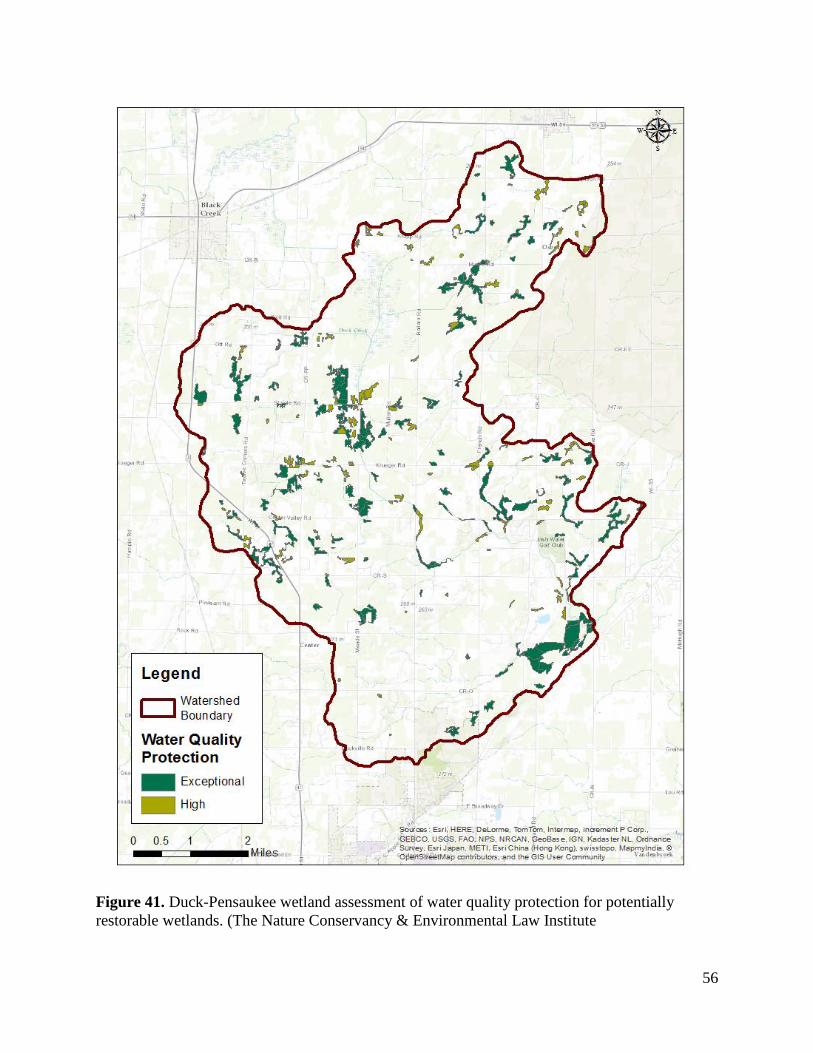
56
Figure 41. Duck-Pensaukee wetland assessment of water quality protection for potentially
restorable wetlands. (The Nature Conservancy & Environmental Law Institute
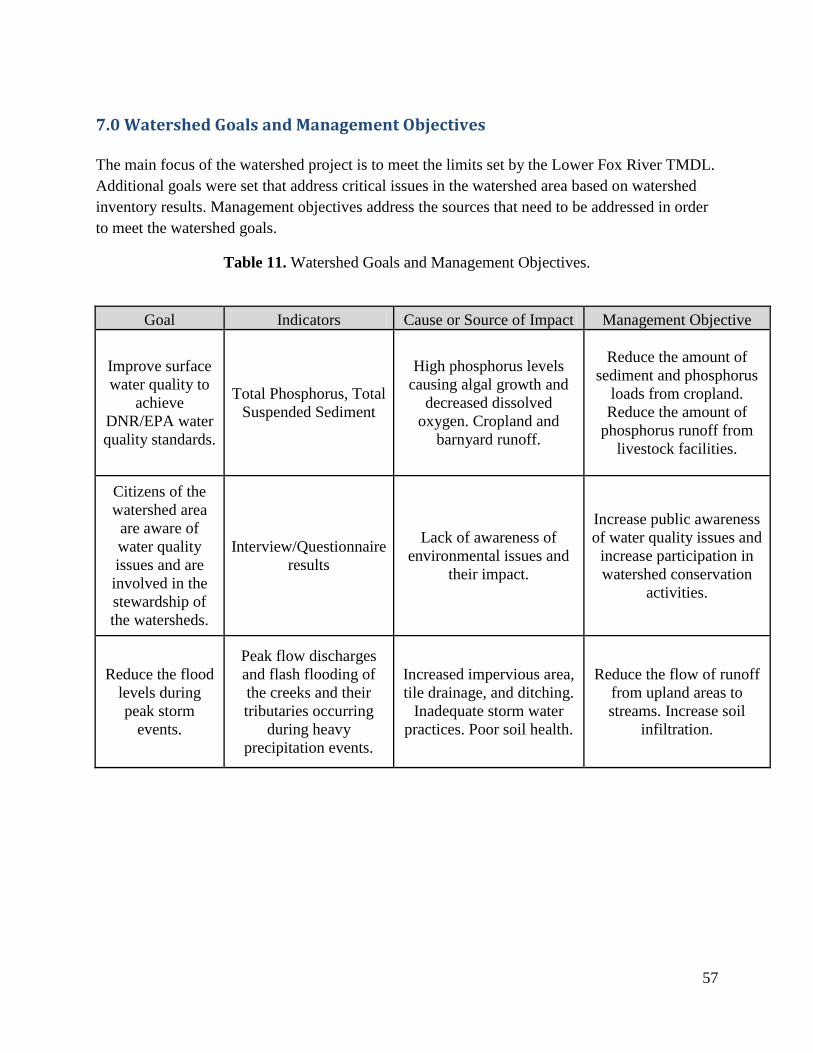
57
7.0 Watershed Goals and Management Objectives
The main focus of the watershed project is to meet the limits set by the Lower Fox River TMDL.
Additional goals were set that address critical issues in the watershed area based on watershed
inventory results. Management objectives address the sources that need to be addressed in order
to meet the watershed goals.
Table 11. Watershed Goals and Management Objectives.
Goal Indicators Cause or Source of Impact Management Objective
Improve surface
water quality to
achieve
DNR/EPA water
quality standards.
Total Phosphorus, Total
Suspended Sediment
High phosphorus levels
causing algal growth and
decreased dissolved
oxygen. Cropland and
barnyard runoff.
Reduce the amount of
sediment and phosphorus
loads from cropland.
Reduce the amount of
phosphorus runoff from
livestock facilities.
Citizens of the
watershed area
are aware of
water quality
issues and are
involved in the
stewardship of
the watersheds.
Interview/Questionnaire
results
Lack of awareness of
environmental issues and
their impact.
Increase public awareness
of water quality issues and
increase participation in
watershed conservation
activities.
Reduce the flood
levels during
peak storm
events.
Peak flow discharges
and flash flooding of
the creeks and their
tributaries occurring
during heavy
precipitation events.
Increased impervious area,
tile drainage, and ditching.
Inadequate storm water
practices. Poor soil health.
Reduce the flow of runoff
from upland areas to
streams. Increase soil
infiltration.

58
(This page intentionally left blank)
59
8.0 Management Measures Implementation
The Upper Duck Creek Watershed plan presents the following recommended plan of actions
needed over the next 10 years in order to achieve water quality targets and watershed goals. The
plan implementation matrix provides a guideline to what kinds of practices are needed in the
watershed and to what extent they are needed to achieve the watershed goals. The plan provides
a timeline for which practices should be completed, possible funding sources, and agencies
responsible for implementation.
Existing runoff management standards have been established by the State of Wisconsin. Chapter
NR 151 provides runoff management standards and prohibitions for agriculture. This plan
recommends enforcement of the state runoff standards when implementing the plan. NR 151.005
(Performance standard for total maximum daily loads) states that a crop producer or livestock
producer subject to this chapter shall reduce discharges of pollutants from a livestock facility or
cropland to surface waters if necessary to meet a load allocation in a US EPA and state approved
TMDL. Local ordinances and regulations will also be used to implement conservation practices
and compliance. County Land Conservation and NRCS departments will work with landowners
to implement conservation practices. Landowners will be educated on programs and funding
available to them as well as current state and local agricultural regulations.
Many alternative and new conservation technologies and methods are currently being developed
and evaluated. Incorporation of new and alternative technologies and management methods into
the implementation plan will be necessary to achieve desired water quality targets. Newer
practices will need to be evaluated for effectiveness and feasibility before incorporation into the
plan. Examples of new technologies and methods that may be needed to reach reduction goals in
the Upper Duck include the following, but are not limited to:
Application of soil amendments to fields such as Gypsum, Fly ash, or
Polyacryamide (PAM): Soil amendments can reduce phosphorus solubility.
ROWBOT: Small robot that can travel between corn rows that can apply fertilizer
in sync with corn needs, inter-seed cover crops into tall corn, and collect data.
Saturated Buffer: Diversion of tile drainage to riparian buffer area reducing
nutrient loading.
Phosphorus removal structures: A large landscape scale filter intended to trap
dissolved phosphorus. The structure contains a solid phosphorus sorption material
that is able to be removed and replaced after it is no longer effective.
Constructed Treatment Wetlands.
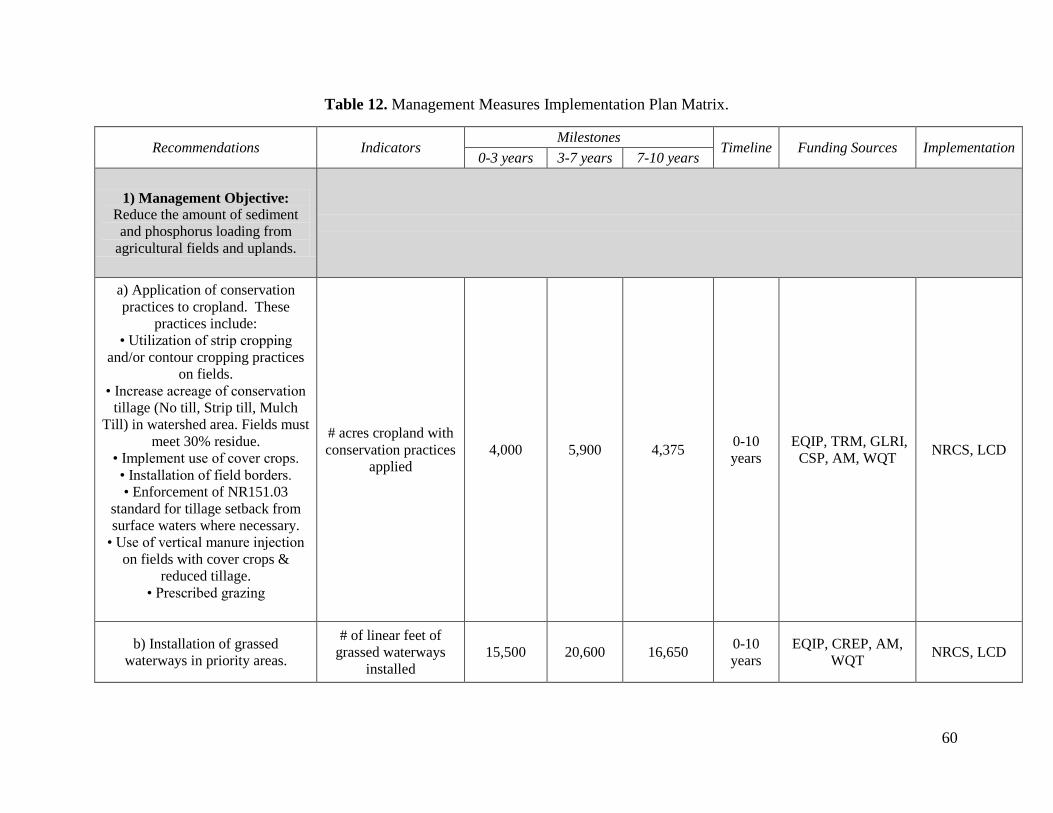
60
Table 12. Management Measures Implementation Plan Matrix.
Recommendations Indicators Milestones
Timeline Funding Sources Implementation 0-3 years 3-7 years 7-10 years
1) Management Objective: Reduce the amount of sediment
and phosphorus loading from
agricultural fields and uplands.
a) Application of conservation
practices to cropland. These
practices include:
• Utilization of strip cropping
and/or contour cropping practices
on fields.
• Increase acreage of conservation
tillage (No till, Strip till, Mulch
Till) in watershed area. Fields must
meet 30% residue.
• Implement use of cover crops.
• Installation of field borders.
• Enforcement of NR151.03
standard for tillage setback from
surface waters where necessary.
• Use of vertical manure injection
on fields with cover crops &
reduced tillage.
• Prescribed grazing
# acres cropland with
conservation practices
applied
4,000 5,900 4,375 0-10
years
EQIP, TRM, GLRI,
CSP, AM, WQT NRCS, LCD
b) Installation of grassed
waterways in priority areas.
# of linear feet of
grassed waterways
installed
15,500 20,600 16,650 0-10
years
EQIP, CREP, AM,
WQT NRCS, LCD
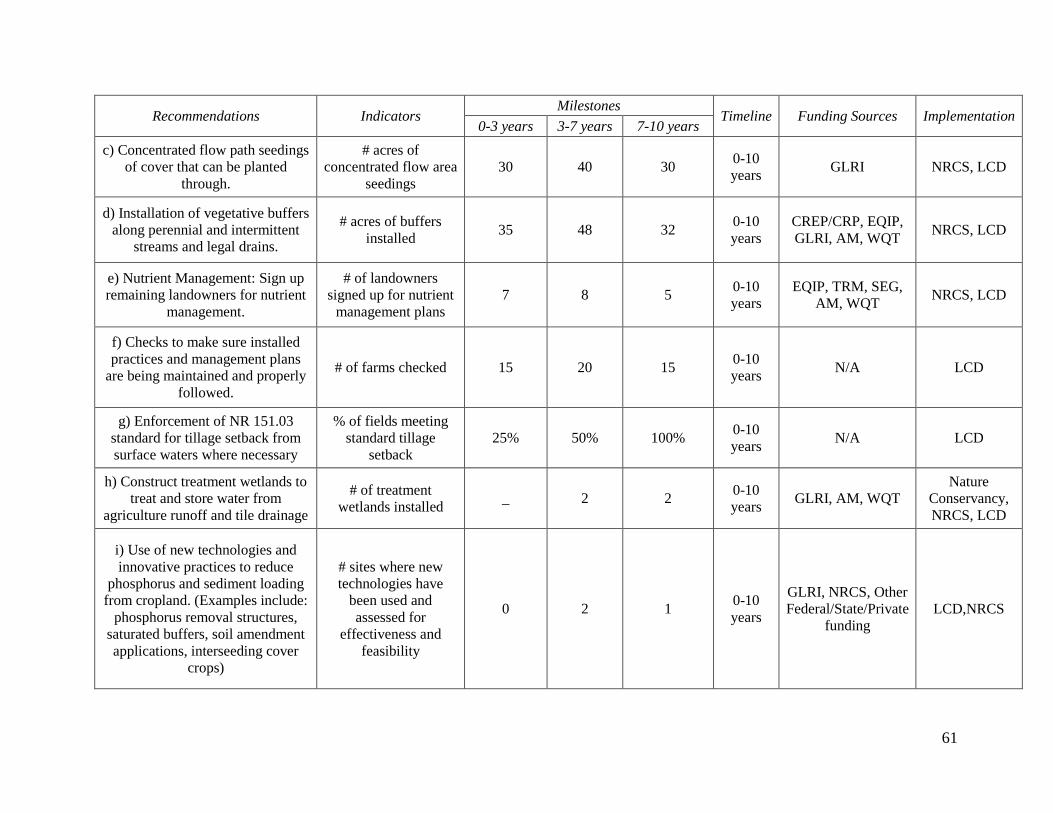
61
Recommendations Indicators Milestones
Timeline Funding Sources Implementation 0-3 years 3-7 years 7-10 years
c) Concentrated flow path seedings
of cover that can be planted
through.
# acres of
concentrated flow area
seedings
30 40 30 0-10
years GLRI NRCS, LCD
d) Installation of vegetative buffers
along perennial and intermittent
streams and legal drains.
# acres of buffers
installed 35 48 32
0-10
years
CREP/CRP, EQIP,
GLRI, AM, WQT NRCS, LCD
e) Nutrient Management: Sign up
remaining landowners for nutrient
management.
# of landowners
signed up for nutrient
management plans
7 8 5 0-10
years
EQIP, TRM, SEG,
AM, WQT NRCS, LCD
f) Checks to make sure installed
practices and management plans
are being maintained and properly
followed.
# of farms checked 15 20 15 0-10
years N/A LCD
g) Enforcement of NR 151.03
standard for tillage setback from
surface waters where necessary
% of fields meeting
standard tillage
setback
25% 50% 100% 0-10
years N/A LCD
h) Construct treatment wetlands to
treat and store water from
agriculture runoff and tile drainage
# of treatment
wetlands installed _ 2 2
0-10
years GLRI, AM, WQT
Nature
Conservancy,
NRCS, LCD
i) Use of new technologies and
innovative practices to reduce
phosphorus and sediment loading
from cropland. (Examples include:
phosphorus removal structures,
saturated buffers, soil amendment
applications, interseeding cover
crops)
# sites where new
technologies have
been used and
assessed for
effectiveness and
feasibility
0 2 1 0-10
years
GLRI, NRCS, Other
Federal/State/Private
funding
LCD,NRCS
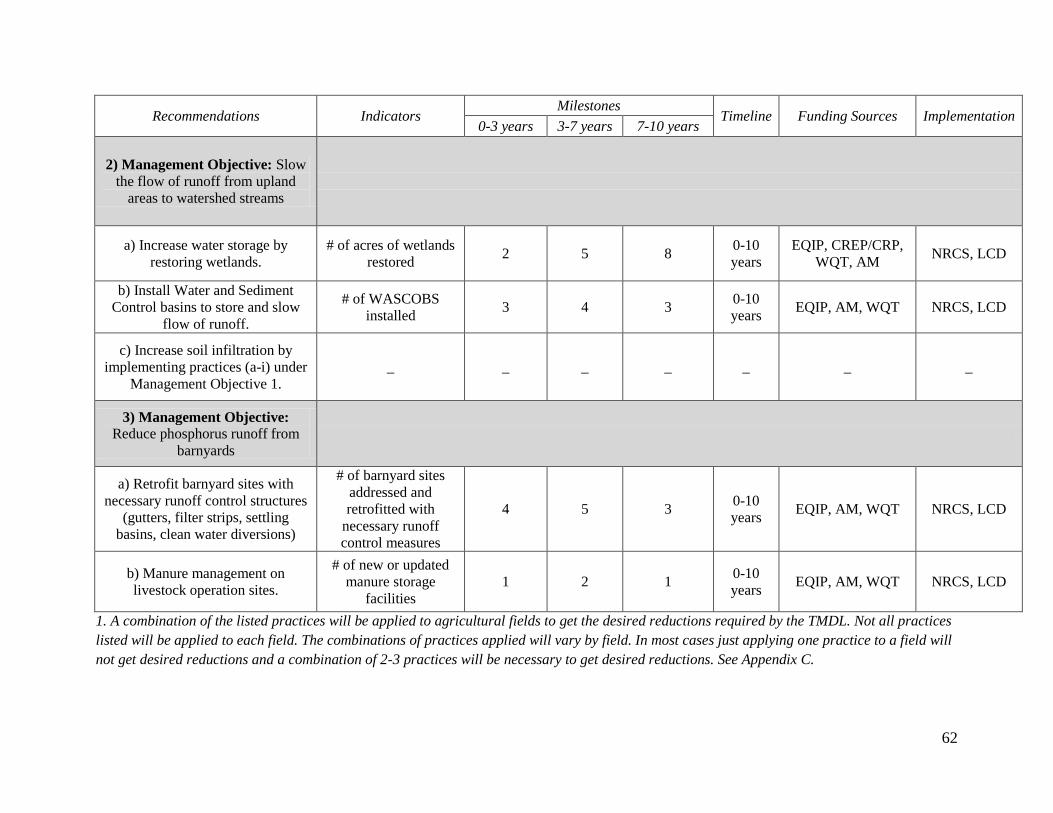
62
Recommendations Indicators Milestones
Timeline Funding Sources Implementation 0-3 years 3-7 years 7-10 years
2) Management Objective: Slow
the flow of runoff from upland
areas to watershed streams
a) Increase water storage by
restoring wetlands.
# of acres of wetlands
restored 2 5 8
0-10
years
EQIP, CREP/CRP,
WQT, AM NRCS, LCD
b) Install Water and Sediment
Control basins to store and slow
flow of runoff.
# of WASCOBS
installed 3 4 3
0-10
years EQIP, AM, WQT NRCS, LCD
c) Increase soil infiltration by
implementing practices (a-i) under
Management Objective 1.
_ _ _ _ _ _ _
3) Management Objective: Reduce phosphorus runoff from
barnyards
a) Retrofit barnyard sites with
necessary runoff control structures
(gutters, filter strips, settling
basins, clean water diversions)
# of barnyard sites
addressed and
retrofitted with
necessary runoff
control measures
4 5 3 0-10
years EQIP, AM, WQT NRCS, LCD
b) Manure management on
livestock operation sites.
# of new or updated
manure storage
facilities
1 2 1 0-10
years EQIP, AM, WQT NRCS, LCD
1. A combination of the listed practices will be applied to agricultural fields to get the desired reductions required by the TMDL. Not all practices
listed will be applied to each field. The combinations of practices applied will vary by field. In most cases just applying one practice to a field will
not get desired reductions and a combination of 2-3 practices will be necessary to get desired reductions. See Appendix C.
63
9.0 Load Reductions
Load reductions for agricultural best management practices were estimated using STEPL
(Spreadsheet Tool for Estimating Pollutant Loading) and load reductions from barnyards were
estimated using the BARNY model. Percent reduction was based on the STEPL model
agricultural baseline loading of 25,347 lbs TP/yr and 5,016 tons TSS/year. The Lower Fox River
TMDL calls for 58.6 % reduction of TSS and 76.9% reduction of TP from agriculture in the
Duck Creek Watershed. An estimated 56% reduction in TP and 65% reduction in TSS are
expected for planned management measures in the Upper Duck Creek watershed. Expected load
reductions from planned activities are shown in Table 13.
These estimated reductions show that the TMDL suspended sediment reduction goal is likely to
be achieved but phosphorus reductions fall short of the TMDL goal. Recent studies are showing
that significant amounts of phosphorus are leaving via tile drainage where in the past only
nitrogen leaving tile drainage was a concern. A study comparing 4 UW Discovery Farm sites
showed that tile drainage can represent between 17 and 52% of the total phosphorus loss from a
field (Ruark et al, 2012). Since the majority of cropland in the Upper Duck Creek is tile drained,
it is likely that significant amount of phosphorus loss in this watershed may be attributed to tile
drainage. Additional innovative practices will need to be researched and implemented in the
watershed to address tile drainage if reduction goals are to be achieved. See Appendix E for
strategy to achieve the phosphorus reduction needed.
Another challenge that presents itself is legacy phosphorus in the soil and in stream. In recent
years scientists and watershed managers are finding that water quality is not responding as well
as expected to implemented conservation practices (Sharpley et al 2013). They are attributing
this slower and smaller response to legacy phosphorus. Legacy phosphorus is used to describe
the accumulated phosphorus that can serve as a long- term source of P to surface waters. Legacy
phosphorus in a soil occurs when phosphorus in soils builds up much more rapidly than the
decline due to crop uptake. In stream channels, legacy phosphorus can result from sediment
deposition of particulate phosphorus, sorption of dissolved phosphorus onto riverbed sediments
or suspended sediments, or by incorporation into the water column (Sharpley et al 2013).
Therefore, water quality may not respond to implementation of conservation practices in a
watershed as quickly as expected due to remobilization of legacy phosphorus hot spots.
Land use changes in the future could also further exacerbate phosphorus loading in the
watershed. In a study done by Duan et al (2013), significantly higher particulate phosphorus
loads were found in watershed effluent following residential development of agricultural land. If
urbanization were to increase in the Upper Duck Creek watershed it is likely that water quality
conditions could decline or remain stagnant despite implementing conservation practices on
agricultural land.
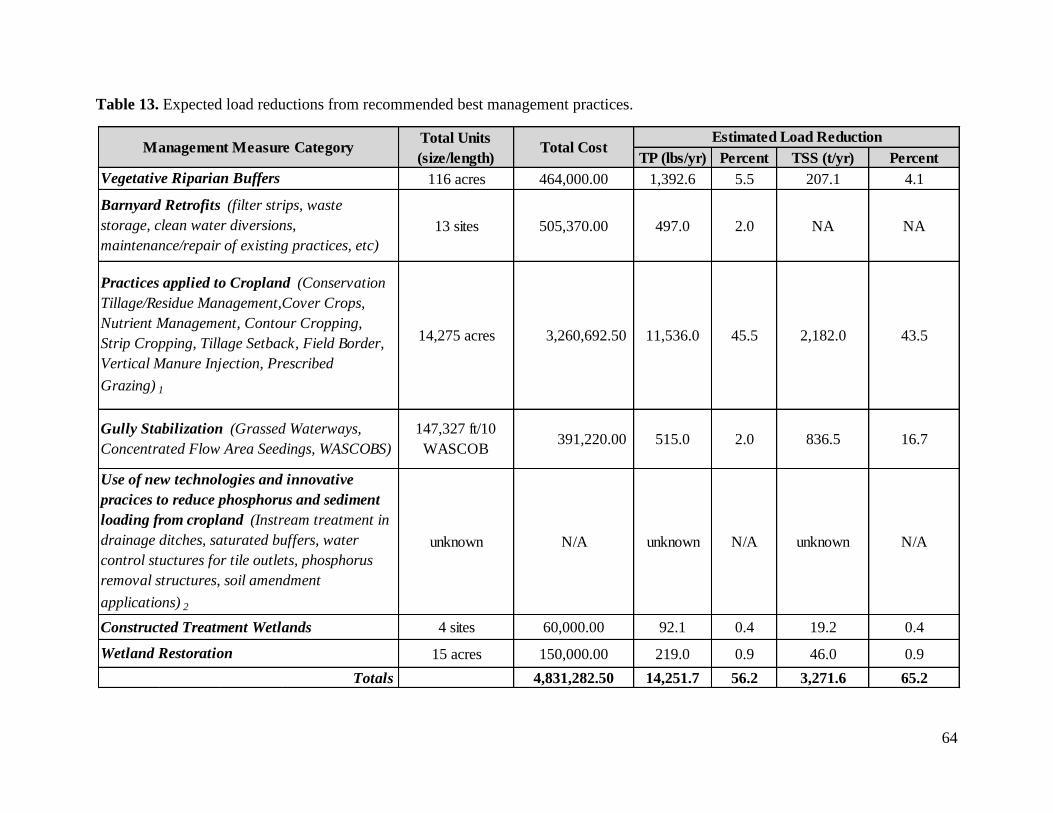
64
Table 13. Expected load reductions from recommended best management practices.
TP (lbs/yr) Percent TSS (t/yr) Percent
116 acres 464,000.00 1,392.6 5.5 207.1 4.1
13 sites 505,370.00 497.0 2.0 NA NA
14,275 acres 3,260,692.50 11,536.0 45.5 2,182.0 43.5
unknown N/A unknown N/A unknown N/A
4 sites 60,000.00 92.1 0.4 19.2 0.4
15 acres 150,000.00 219.0 0.9 46.0 0.9
4,831,282.50 14,251.7 56.2 3,271.6 65.2
16.7147,327 ft/10
WASCOB515.0 836.5
Gully Stabilization (Grassed Waterways,
Concentrated Flow Area Seedings, WASCOBS)
Totals
Wetland Restoration
Constructed Treatment Wetlands
Vegetative Riparian Buffers
391,220.00
Barnyard Retrofits (filter strips, waste
storage, clean water diversions,
maintenance/repair of existing practices, etc)
Use of new technologies and innovative
pracices to reduce phosphorus and sediment
loading from cropland (Instream treatment in
drainage ditches, saturated buffers, water
control stuctures for tile outlets, phosphorus
removal structures, soil amendment
applications) 2
2.0
Estimated Load ReductionManagement Measure Category Total Cost
Total Units
(size/length)
Practices applied to Cropland (Conservation
Tillage/Residue Management,Cover Crops,
Nutrient Management, Contour Cropping,
Strip Cropping, Tillage Setback, Field Border,
Vertical Manure Injection, Prescribed
Grazing) 1
65
1. This category does not indicate that all these practices will be applied to all 14,275 acres of cropland. A combination of
conservation practices applied to a majority of the cropland in the watershed is necessary to get the desired pollutant load
reductions suggested by the TMDL. It is also important to note that not all fields will need to apply more than one practice to
meet desired reduction goals. The BMP Efficiency Calculator was used to determined efficiencies of different combinations of
practices such as Reduced Tillage & Cover Crops or the use of a Field Border and Reduced Tillage. A weighted average
pollutant reduction efficiency was determined for this category based on expected implementation rates of combinations of
practices. See Appendix C.
2. The amount of new technologies and management measures needed has not been determined, as well as, expected load
reductions and cost. If new management measures/technologies prove effective and feasible they will be incorporated into the
plan with more accurate load reductions, cost, and amount needed. Depending on the efficiencies realized by new innovative
practices, the number or combinations of other field practices required may be reduced.

66
(This page intentionally left blank)
67
10.0 Information and Education
This information and education plan is designed to increase participation in conservation
programs and implementation of conservation practices by informing the landowners of
assistance and tools available to them and providing information on linkages between land
management and downstream effects on water quality.
10.1 Alliance for the Great Lakes Survey
The Alliance for the Great Lakes developed an interview and questionnaire that was given to
landowners in the Lower Fox River Watershed area in Spring and Summer of 2014 by County
Land and Water Conservation Departments and local agronomists. Data from the questionnaires
and interviews was analyzed by subwatershed. The survey and questionnaire gathered
information on the knowledge of conservation and water quality issues, willingness to participate
in conservation programs, and where landowners obtain their information. Moreover, many
landowners of all farm sizes did not recognize the severity of water quality issues impacting the
Lower Fox River Basin and the extent to which agricultural sources contribute to nutrient and
sediment loadings to the River and the Bay of Green Bay. Providing information on available
conservation programs, technical assistance, and education will be a very critical component of
implementing the management plan.
Selected Results from Survey
Knowledge and Thoughts on Current Conservation Programs:
One of the interview questions asked respondents to reflect on the conservation programs
currently being offered. The responses were organized by themes and further by subwatersheds
to gain a better understanding of what landowners think about conservation programs and
whether responses differ across different areas of the Lower Fox River watershed. A total of 28
themes were identified (ranging from “Willing to try them” to “More exist than necessary”) with
the most frequently mentioned theme being “Not familiar with programs” as shown in Figure 42
below. This is in contrast to the most frequently mentioned themes by the other subwatersheds.
For comparison, among respondents in Duck/Trout Creeks subwatershed most frequently
mentioned theme was “involved in them”, in Apple/Ashwaubenon/Dutchman Creeks, it was
“going well-good programs”, and in East River/Baird/Bower Creeks, both “involved in them”
and going well-good programs” were both at the top of the list.
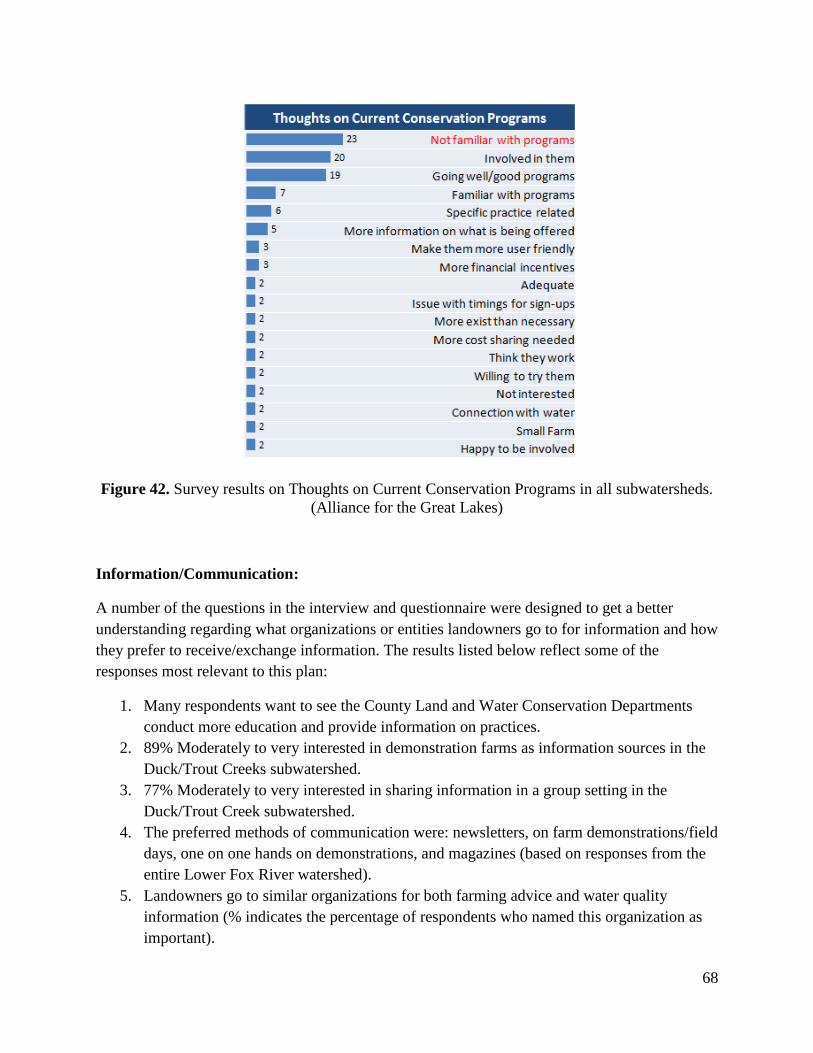
68
Figure 42. Survey results on Thoughts on Current Conservation Programs in all subwatersheds.
(Alliance for the Great Lakes)
Information/Communication:
A number of the questions in the interview and questionnaire were designed to get a better
understanding regarding what organizations or entities landowners go to for information and how
they prefer to receive/exchange information. The results listed below reflect some of the
responses most relevant to this plan:
1. Many respondents want to see the County Land and Water Conservation Departments
conduct more education and provide information on practices.
2. 89% Moderately to very interested in demonstration farms as information sources in the
Duck/Trout Creeks subwatershed.
3. 77% Moderately to very interested in sharing information in a group setting in the
Duck/Trout Creek subwatershed.
4. The preferred methods of communication were: newsletters, on farm demonstrations/field
days, one on one hands on demonstrations, and magazines (based on responses from the
entire Lower Fox River watershed).
5. Landowners go to similar organizations for both farming advice and water quality
information (% indicates the percentage of respondents who named this organization as
important).
69
a. For agronomic information in Duck/Trout Creeks watersheds, these include:
Local Farm Cooperatives/Crop Consultants (72%); NRCS (67%); County Land
and Water Conservation Department (56%)
b. For water quality information in Duck/Trout Creeks watersheds, these include:
Local Farm Cooperatives/Crop Consultants (93%); County Land and Water
Conservation Department (86%); NRCS (57%)
Severity of sources of pollution in your area:
The survey asked several questions related to water quality in the Lower Fox River watershed
and Green Bay, specifically on impacts, particular pollutants, and sources of the pollutants.
Overall, consequences of poor water quality in the area were mostly rated as slight to moderate
problems. Similarly, among the sources listed, most were perceived to be slightly or moderately
problematic. Notably:
Respondents perceived the most serious source of water pollution coming from non-
agricultural sources.
o 65 % identified “excessive use of lawn fertilizers and pesticides” as a moderate to
severe problem
o Next three most problematic pollutant sources were stormwater runoff from urban
areas, discharges from sewage treatment plants, and discharges from industry.
Of the six agricultural pollution sources, the one perceived as most severe was “soil
erosion from fields” with 37% followed by “land application of animal waste” with 19%.
By comparison, 31% identified waterfowl droppings as a moderate to severe problem.
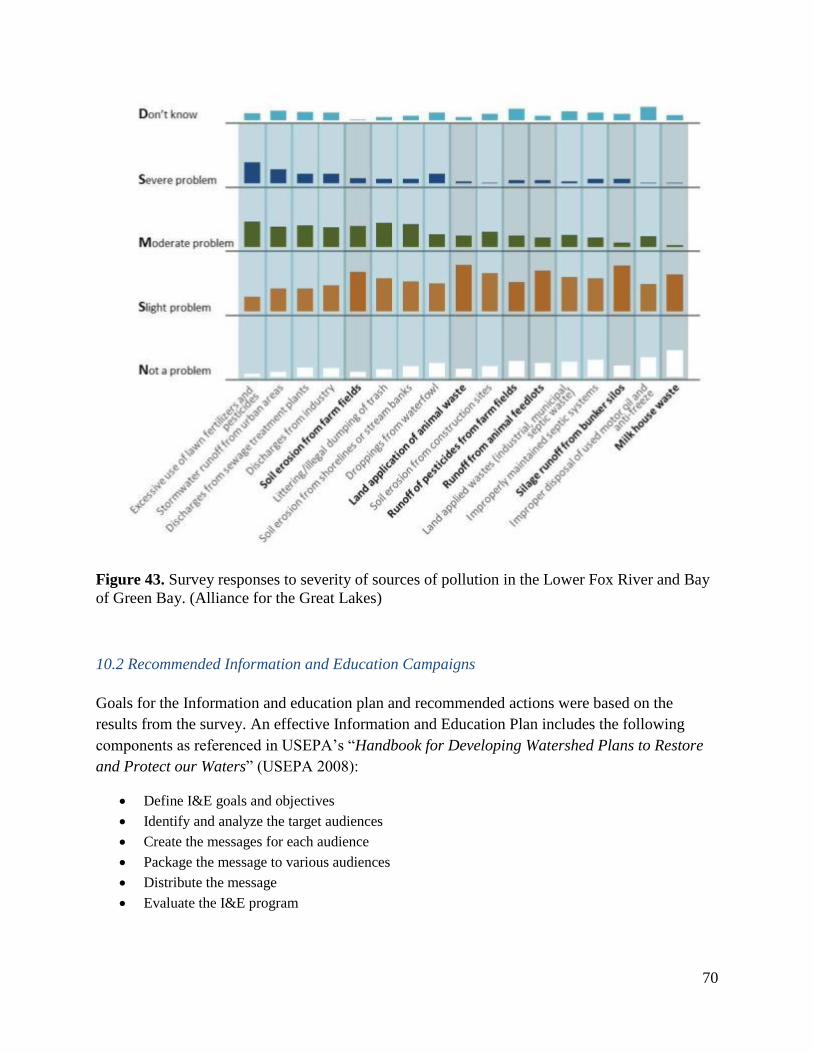
70
Figure 43. Survey responses to severity of sources of pollution in the Lower Fox River and Bay
of Green Bay. (Alliance for the Great Lakes)
10.2 Recommended Information and Education Campaigns
Goals for the Information and education plan and recommended actions were based on the
results from the survey. An effective Information and Education Plan includes the following
components as referenced in USEPA’s “Handbook for Developing Watershed Plans to Restore
and Protect our Waters” (USEPA 2008):
Define I&E goals and objectives
Identify and analyze the target audiences
Create the messages for each audience
Package the message to various audiences
Distribute the message
Evaluate the I&E program
71
Goals of the information and education plan: Create public awareness of water quality issues in
the watershed, increase public involvement in watershed stewardship, and increase
communication and coordination among municipal officials, businesses, and agricultural
community.
Objectives
Educate local officials about the watershed plan. Encourage amendments to municipal
comprehensive plans, codes, and ordinances.
Develop targeted educational materials to appropriate audience in the watershed.
Host workshops, meetings, and events that landowners can attend to learn about
conservation practices.
Increase landowners’ adoption of conservation practices.
Inform public of current water quality issues in the Lower Fox River Watershed basin
and how the Upper Duck Creek watershed contributes.
Get local high schools and colleges involved in watershed activities.
Target Audience
There are multiple target audiences that will need to be addressed in this watershed. Target
audiences in this watershed will be agricultural land owners and operators, local government
officials, agricultural businesses and organizations, urban home owners, and schools. Focused
attention will be on agricultural land owners and operators since the main source of pollutant
loading in the watershed is from agricultural land. Non-operator agricultural landowners are an
important subset of this group as they are usually not focused on and are less likely to participate
in conservation programs. The 1999 Agricultural Economics and Land Ownership survey
showed that 34 % of farmland in Wisconsin was owned by non-operator landlords (USDA
1999). Studies have shown that non-operators tend to be older, less likely to live on the farm, and
less likely to participate in conservation programs (Nickerson et al 2012). Non-operator land
owners in the watershed area need to be addressed as they control a significant amount of
agricultural land but tend to leave the management of the land up to the tenant.
Existing Education Campaigns:
Fox- Wolf Watershed Alliance: A nonprofit organization that identifies issues and advocates
effective policies and actions to protect and restore the water resources of Wisconsin’s Fox-Wolf
River watershed. They hold events such as river clean-ups, workshops, presentations at Annual
Watershed Conferences, and meetings with other organizations to outreach to the public.
Northeast Wisconsin Stormwater Consortium: A subsidiary of the Fox-Wolf Watershed Alliance
composed of municipal members and business partners working to address stormwater issues
and to educate residents on best management practices, ordinances and other storm water
concerns and programs.
72
Demonstration Farm Project: Currently there is a demonstration farm project to establish 4
demonstration farms in the Lower Fox River Watershed. The goal of the demonstration project is
to test new conservation methods and to educate other farmers. The demonstration farm project
holds field days for local farmers and agency members to learn about the different practices
being tested.
Silver Creek Adaptive Management Project: NEW Water formerly, Green Bay Metropolitan
Sewerage District, is working on a phosphorus reduction plan to reduce its discharges to the Fox
River. NEW Water is implementing a pilot adaptive management project in the Silver Creek
Subwatershed.
I&E Plan Recommended Actions
An Information and Education Plan matrix (Table 14) was developed as a tool to help implement
the I&E plan. The matrix includes recommended action campaigns, target audience, package for
delivery of message, schedule, outcomes, estimated costs, and supporting organizations.
Evaluation
The I&E plan should be evaluated regularly to provide feedback regarding the effectiveness of
the outreach campaigns. Section 13.3 describes milestones related to watershed education
activities that can be used to evaluate the I&E plan implementation efforts.
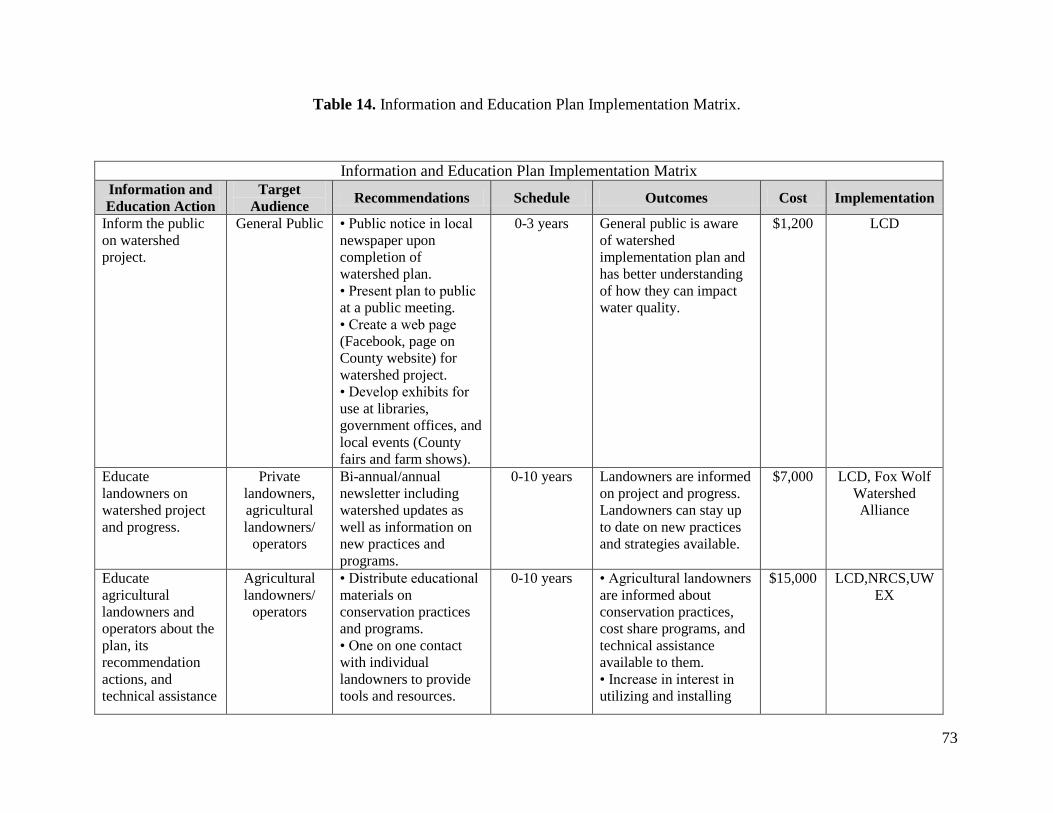
73
Table 14. Information and Education Plan Implementation Matrix.
Information and Education Plan Implementation Matrix
Information and
Education Action
Target
Audience Recommendations Schedule Outcomes Cost Implementation
Inform the public
on watershed
project.
General Public • Public notice in local
newspaper upon
completion of
watershed plan.
• Present plan to public
at a public meeting.
• Create a web page
(Facebook, page on
County website) for
watershed project.
• Develop exhibits for
use at libraries,
government offices, and
local events (County
fairs and farm shows).
0-3 years General public is aware
of watershed
implementation plan and
has better understanding
of how they can impact
water quality.
$1,200 LCD
Educate
landowners on
watershed project
and progress.
Private
landowners,
agricultural
landowners/
operators
Bi-annual/annual
newsletter including
watershed updates as
well as information on
new practices and
programs.
0-10 years Landowners are informed
on project and progress.
Landowners can stay up
to date on new practices
and strategies available.
$7,000 LCD, Fox Wolf
Watershed
Alliance
Educate
agricultural
landowners and
operators about the
plan, its
recommendation
actions, and
technical assistance
Agricultural
landowners/
operators
• Distribute educational
materials on
conservation practices
and programs.
• One on one contact
with individual
landowners to provide
tools and resources.
0-10 years
• Agricultural landowners
are informed about
conservation practices,
cost share programs, and
technical assistance
available to them.
• Increase in interest in
utilizing and installing
$15,000 LCD,NRCS,UW
EX
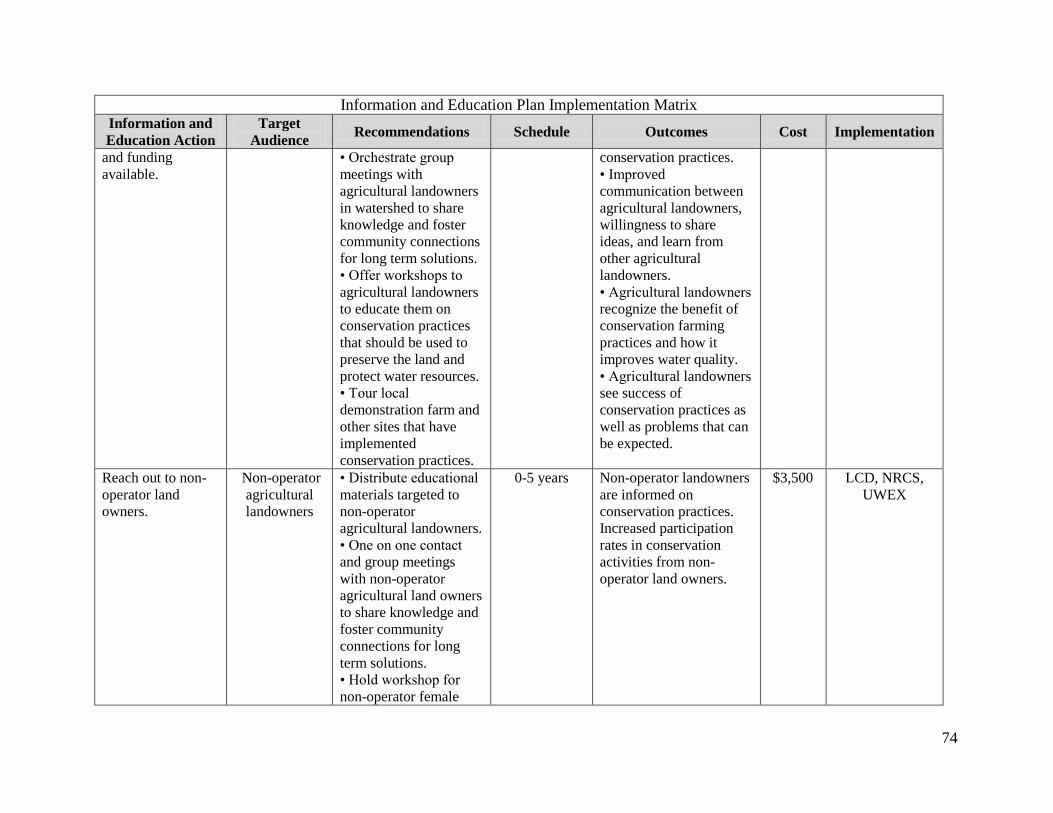
74
Information and Education Plan Implementation Matrix
Information and
Education Action
Target
Audience Recommendations Schedule Outcomes Cost Implementation
and funding
available.
• Orchestrate group
meetings with
agricultural landowners
in watershed to share
knowledge and foster
community connections
for long term solutions.
• Offer workshops to
agricultural landowners
to educate them on
conservation practices
that should be used to
preserve the land and
protect water resources.
• Tour local
demonstration farm and
other sites that have
implemented
conservation practices.
conservation practices.
• Improved
communication between
agricultural landowners,
willingness to share
ideas, and learn from
other agricultural
landowners.
• Agricultural landowners
recognize the benefit of
conservation farming
practices and how it
improves water quality.
• Agricultural landowners
see success of
conservation practices as
well as problems that can
be expected.
Reach out to non-
operator land
owners.
Non-operator
agricultural
landowners
• Distribute educational
materials targeted to
non-operator
agricultural landowners.
• One on one contact
and group meetings
with non-operator
agricultural land owners
to share knowledge and
foster community
connections for long
term solutions.
• Hold workshop for
non-operator female
0-5 years Non-operator landowners
are informed on
conservation practices.
Increased participation
rates in conservation
activities from non-
operator land owners.
$3,500 LCD, NRCS,
UWEX
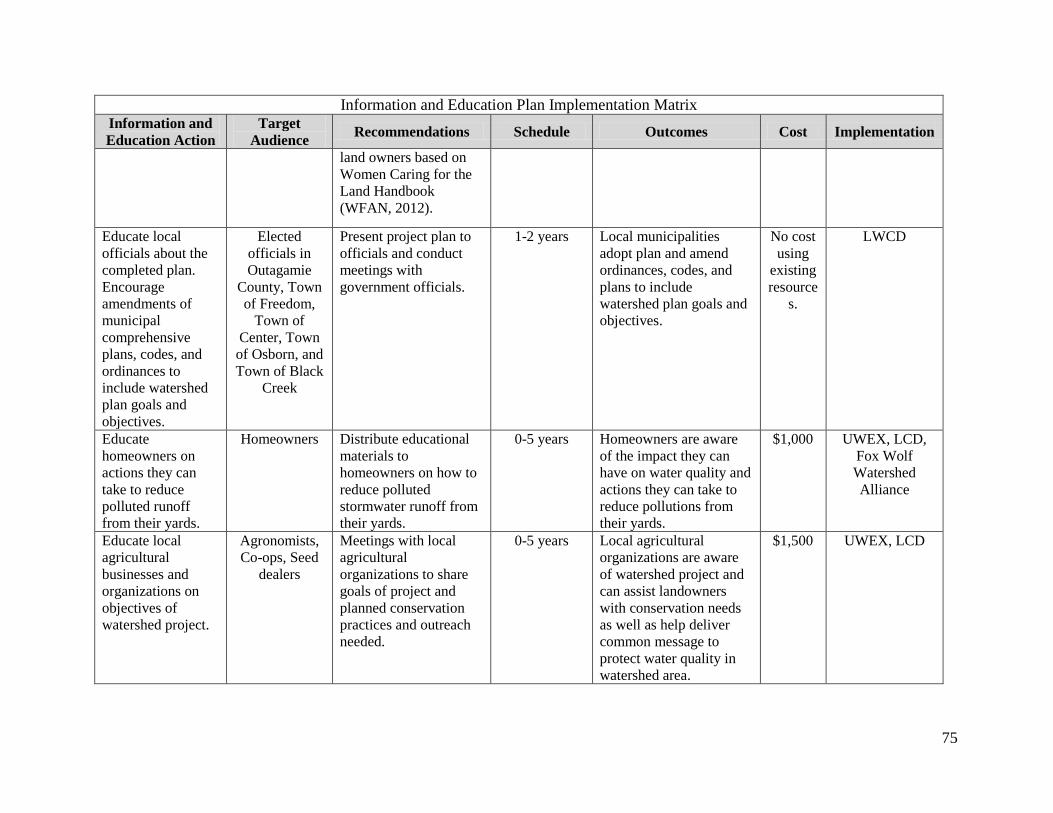
75
Information and Education Plan Implementation Matrix
Information and
Education Action
Target
Audience Recommendations Schedule Outcomes Cost Implementation
land owners based on
Women Caring for the
Land Handbook
(WFAN, 2012).
Educate local
officials about the
completed plan.
Encourage
amendments of
municipal
comprehensive
plans, codes, and
ordinances to
include watershed
plan goals and
objectives.
Elected
officials in
Outagamie
County, Town
of Freedom,
Town of
Center, Town
of Osborn, and
Town of Black
Creek
Present project plan to
officials and conduct
meetings with
government officials.
1-2 years Local municipalities
adopt plan and amend
ordinances, codes, and
plans to include
watershed plan goals and
objectives.
No cost
using
existing
resource
s.
LWCD
Educate
homeowners on
actions they can
take to reduce
polluted runoff
from their yards.
Homeowners Distribute educational
materials to
homeowners on how to
reduce polluted
stormwater runoff from
their yards.
0-5 years Homeowners are aware
of the impact they can
have on water quality and
actions they can take to
reduce pollutions from
their yards.
$1,000 UWEX, LCD,
Fox Wolf
Watershed
Alliance
Educate local
agricultural
businesses and
organizations on
objectives of
watershed project.
Agronomists,
Co-ops, Seed
dealers
Meetings with local
agricultural
organizations to share
goals of project and
planned conservation
practices and outreach
needed.
0-5 years Local agricultural
organizations are aware
of watershed project and
can assist landowners
with conservation needs
as well as help deliver
common message to
protect water quality in
watershed area.
$1,500 UWEX, LCD
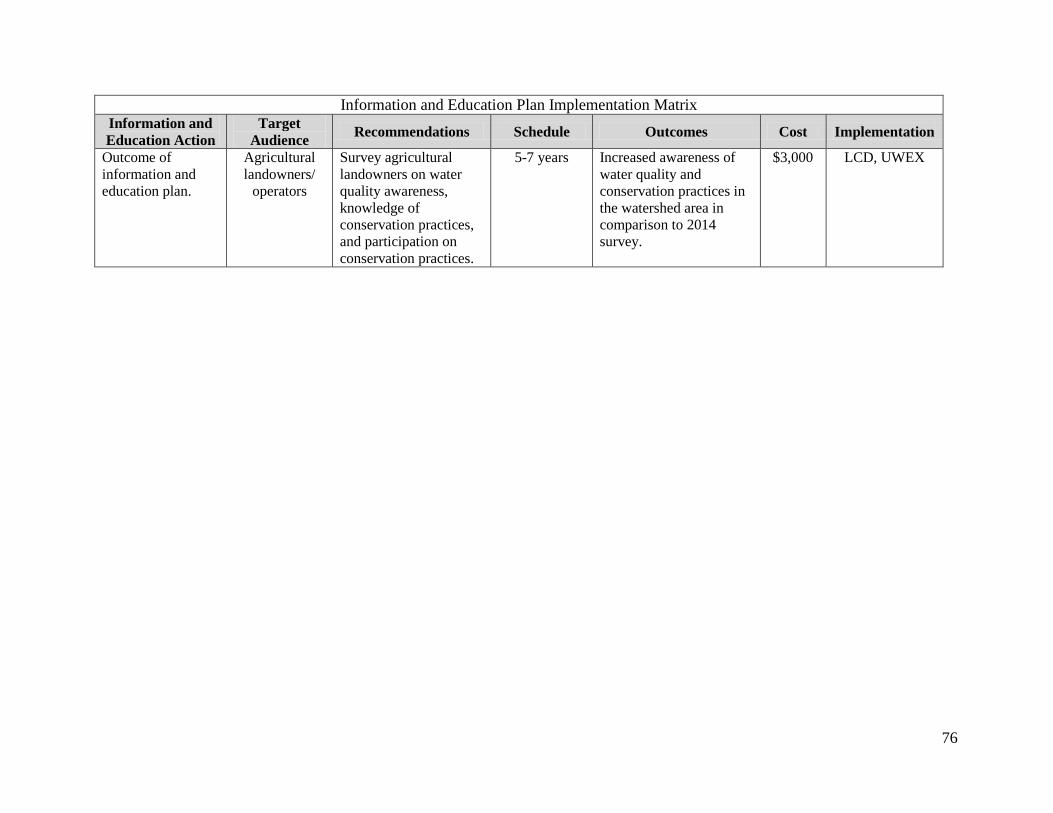
76
Information and Education Plan Implementation Matrix
Information and
Education Action
Target
Audience Recommendations Schedule Outcomes Cost Implementation
Outcome of
information and
education plan.
Agricultural
landowners/
operators
Survey agricultural
landowners on water
quality awareness,
knowledge of
conservation practices,
and participation on
conservation practices.
5-7 years Increased awareness of
water quality and
conservation practices in
the watershed area in
comparison to 2014
survey.
$3,000 LCD, UWEX
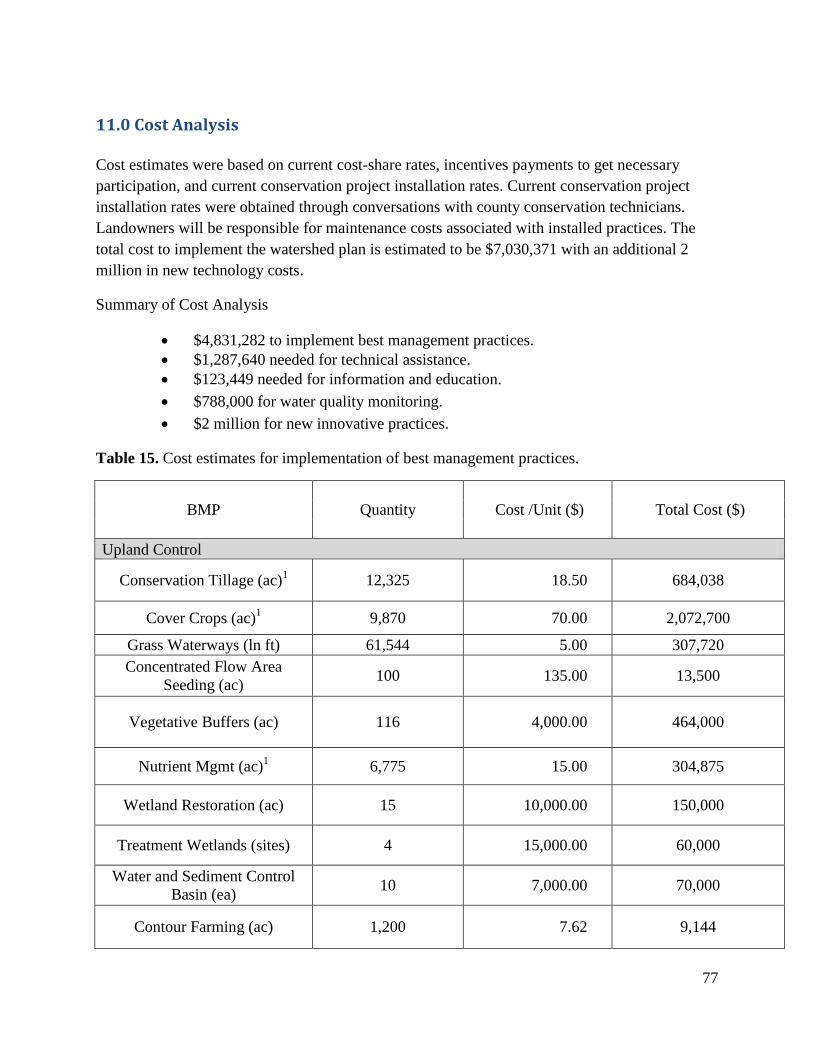
77
11.0 Cost Analysis
Cost estimates were based on current cost-share rates, incentives payments to get necessary
participation, and current conservation project installation rates. Current conservation project
installation rates were obtained through conversations with county conservation technicians.
Landowners will be responsible for maintenance costs associated with installed practices. The
total cost to implement the watershed plan is estimated to be $7,030,371 with an additional 2
million in new technology costs.
Summary of Cost Analysis
$4,831,282 to implement best management practices.
$1,287,640 needed for technical assistance.
$123,449 needed for information and education.
$788,000 for water quality monitoring.
$2 million for new innovative practices.
Table 15. Cost estimates for implementation of best management practices.
BMP Quantity Cost /Unit ($) Total Cost ($)
Upland Control
Conservation Tillage (ac)1 12,325 18.50 684,038
Cover Crops (ac)1 9,870 70.00 2,072,700
Grass Waterways (ln ft) 61,544 5.00 307,720
Concentrated Flow Area
Seeding (ac) 100 135.00 13,500
Vegetative Buffers (ac) 116 4,000.00 464,000
Nutrient Mgmt (ac)1 6,775 15.00 304,875
Wetland Restoration (ac) 15 10,000.00 150,000
Treatment Wetlands (sites) 4 15,000.00 60,000
Water and Sediment Control
Basin (ea) 10 7,000.00 70,000
Contour Farming (ac) 1,200 7.62 9,144
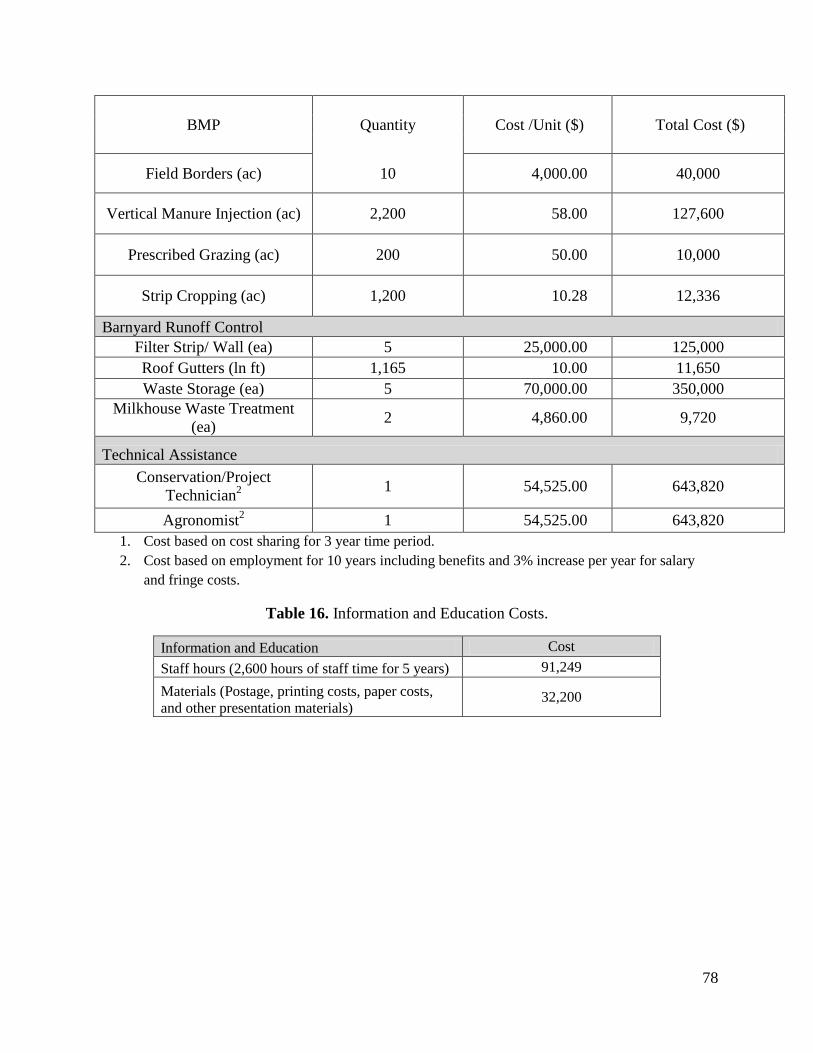
78
BMP Quantity Cost /Unit ($) Total Cost ($)
Field Borders (ac) 10 4,000.00 40,000
Vertical Manure Injection (ac) 2,200 58.00 127,600
Prescribed Grazing (ac) 200 50.00 10,000
Strip Cropping (ac) 1,200 10.28 12,336
Barnyard Runoff Control
Filter Strip/ Wall (ea) 5 25,000.00 125,000
Roof Gutters (ln ft) 1,165 10.00 11,650
Waste Storage (ea) 5 70,000.00 350,000
Milkhouse Waste Treatment
(ea) 2 4,860.00 9,720
Technical Assistance
Conservation/Project
Technician2
1 54,525.00 643,820
Agronomist2 1 54,525.00 643,820
1. Cost based on cost sharing for 3 year time period.
2. Cost based on employment for 10 years including benefits and 3% increase per year for salary
and fringe costs.
Table 16. Information and Education Costs.
Information and Education Cost
Staff hours (2,600 hours of staff time for 5 years) 91,249
Materials (Postage, printing costs, paper costs,
and other presentation materials) 32,200
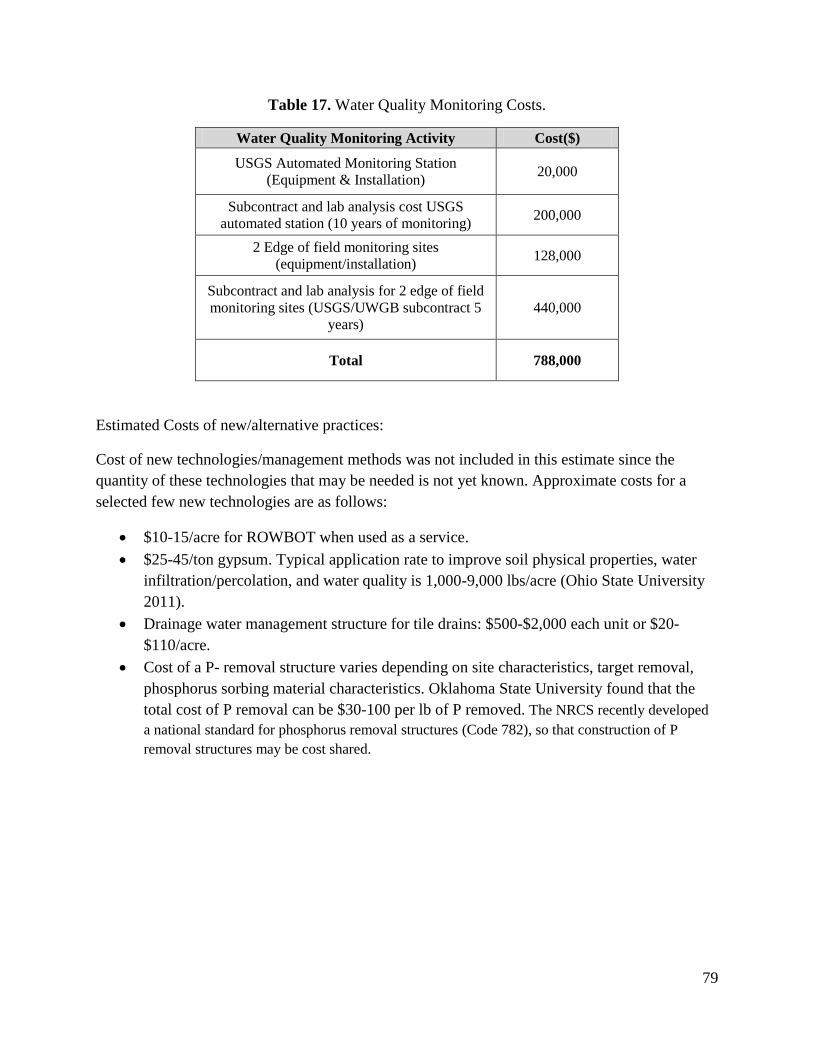
79
Table 17. Water Quality Monitoring Costs.
Water Quality Monitoring Activity Cost($)
USGS Automated Monitoring Station
(Equipment & Installation) 20,000
Subcontract and lab analysis cost USGS
automated station (10 years of monitoring) 200,000
2 Edge of field monitoring sites
(equipment/installation) 128,000
Subcontract and lab analysis for 2 edge of field
monitoring sites (USGS/UWGB subcontract 5
years)
440,000
Total 788,000
Estimated Costs of new/alternative practices:
Cost of new technologies/management methods was not included in this estimate since the
quantity of these technologies that may be needed is not yet known. Approximate costs for a
selected few new technologies are as follows:
$10-15/acre for ROWBOT when used as a service.
$25-45/ton gypsum. Typical application rate to improve soil physical properties, water
infiltration/percolation, and water quality is 1,000-9,000 lbs/acre (Ohio State University
2011).
Drainage water management structure for tile drains: $500-$2,000 each unit or $20-
$110/acre.
Cost of a P- removal structure varies depending on site characteristics, target removal,
phosphorus sorbing material characteristics. Oklahoma State University found that the
total cost of P removal can be $30-100 per lb of P removed. The NRCS recently developed
a national standard for phosphorus removal structures (Code 782), so that construction of P
removal structures may be cost shared.
80
Operation & Maintenance
This plan will require a land owner to agree to a 10 year maintenance period for practices such as
vegetated buffers, grassed waterways, water and sediment control basins, treatment wetlands,
wetland restoration, barnyard runoff control, manure storage, and streambank stabilization including
crossings and fencing. For annual practices that require re-installation of management each year such
as conservation tillage, cover crops, and nutrient management, landowners are required to maintain
the practice for each period that cost sharing is available. Therefore annual assistance may be
required for certain practices. Upon completion of the operation and maintenance period, point
sources may be able to work with operators and landowners to continue implementation of the
BMP’s under a pollutant trading agreement (non EPA 319 monies).
81
12.0 Funding Sources
There are many state and federal programs that currently provide funding sources for
conservation practices. Recently the option of adaptive management, water quality trading, and
phosphorus variance has become another option for funding of practices.
12.1 Federal and State Funding Sources
A brief description of current funding programs available and their acronyms are listed below:
Environmental Quality Incentives Program (EQIP) - Program provides financial and
technical assistance to implement conservation practices that address resource concerns. Farmers
receive flat rate payments for installing and implementing runoff management practices.
Conservation Reserve Program (CRP) - A land conservation program administered by the
Farm Service Agency. Farmers enrolled in the program receive a yearly rental payment for
environmentally sensitive land that they agree to remove from production. Contracts are 10-15
years in length. Eligible practices include buffers for wildlife habitat, wetlands buffer, riparian
buffer, wetland restoration, filter strips, grass waterways, shelter belts, living snow fences,
contour grass strips, and shallow water areas for wildlife.
Conservation Reserve Enhancement Program (CREP) - Program provides funding for the
installation, rental payments, and an installation incentive. A 15 year contract or perpetual
contract conservation easement can be entered into. Eligible practices include filter strips, buffer
strips, wetland restoration, tall grass prairie and oak savanna restoration, grassed waterway, and
permanent native grasses.
ACEP- Agricultural Conservation Easement Program - New program that consolidates three
former programs (Wetlands Reserve Program, Grassland Reserve Program, and Farm and
Ranchlands Protection Program). Under this program NRCS provides financial assistance to
eligible partners for purchasing Agricultural Land Easements that protect the agriculture use and
conservation values of eligible land.
Targeted Runoff Management Grant Program (TRM) - Program offers competitive grants
for local governments for controlling nonpoint source pollution. Grants reimburse costs for
agriculture or urban runoff management practices in critical areas with surface or groundwater
quality concerns. The cost-share rate for TRM projects is up to 70% of eligible costs.
Conservation Stewardship Program (CSP) – Program offers funding for participants that take
additional steps to improve resource condition. Program provides two types of funding through 5
year contracts; annual payments for installing new practices and maintaining existing practices as
well as supplemental payments for adopting a resource conserving crop rotation.
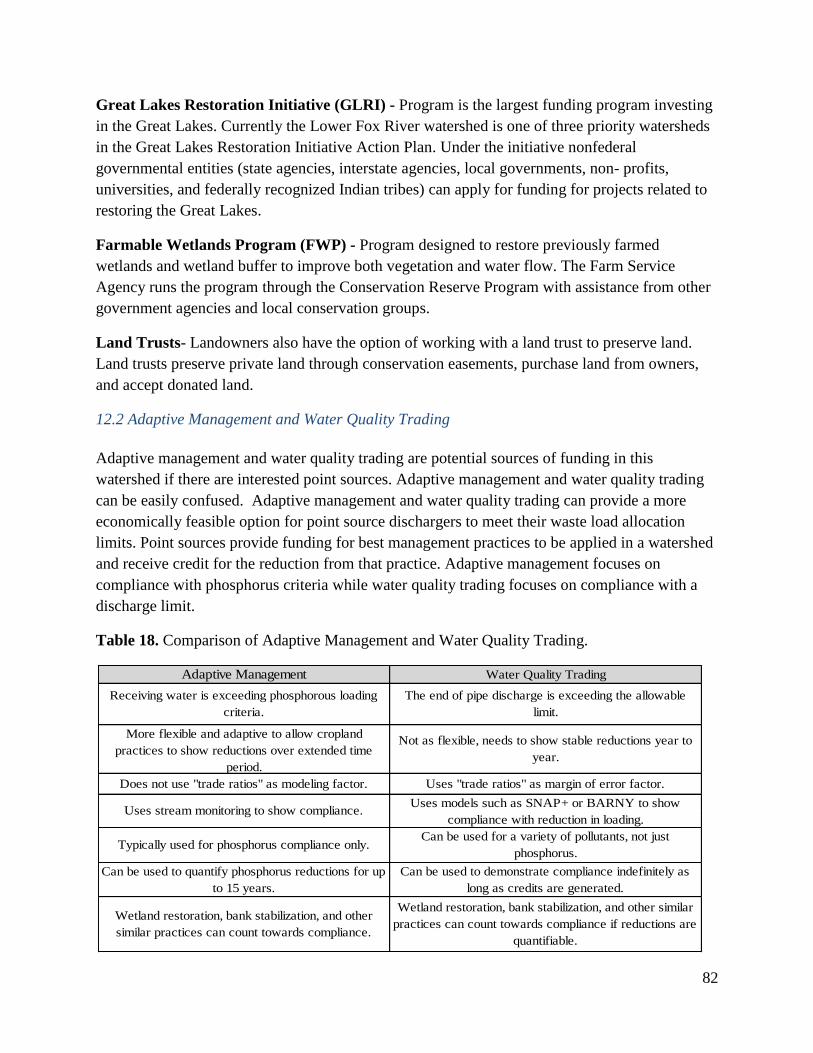
82
Great Lakes Restoration Initiative (GLRI) - Program is the largest funding program investing
in the Great Lakes. Currently the Lower Fox River watershed is one of three priority watersheds
in the Great Lakes Restoration Initiative Action Plan. Under the initiative nonfederal
governmental entities (state agencies, interstate agencies, local governments, non- profits,
universities, and federally recognized Indian tribes) can apply for funding for projects related to
restoring the Great Lakes.
Farmable Wetlands Program (FWP) - Program designed to restore previously farmed
wetlands and wetland buffer to improve both vegetation and water flow. The Farm Service
Agency runs the program through the Conservation Reserve Program with assistance from other
government agencies and local conservation groups.
Land Trusts- Landowners also have the option of working with a land trust to preserve land.
Land trusts preserve private land through conservation easements, purchase land from owners,
and accept donated land.
12.2 Adaptive Management and Water Quality Trading
Adaptive management and water quality trading are potential sources of funding in this
watershed if there are interested point sources. Adaptive management and water quality trading
can be easily confused. Adaptive management and water quality trading can provide a more
economically feasible option for point source dischargers to meet their waste load allocation
limits. Point sources provide funding for best management practices to be applied in a watershed
and receive credit for the reduction from that practice. Adaptive management focuses on
compliance with phosphorus criteria while water quality trading focuses on compliance with a
discharge limit.
Table 18. Comparison of Adaptive Management and Water Quality Trading.
Water Quality TradingAdaptive Management
Uses models such as SNAP+ or BARNY to show
compliance with reduction in loading.Uses stream monitoring to show compliance.
Can be used to quantify phosphorus reductions for up
to 15 years.
Can be used to demonstrate compliance indefinitely as
long as credits are generated.
Receiving water is exceeding phosphorous loading
criteria.
The end of pipe discharge is exceeding the allowable
limit.
More flexible and adaptive to allow cropland
practices to show reductions over extended time
period.
Not as flexible, needs to show stable reductions year to
year.
Does not use "trade ratios" as modeling factor. Uses "trade ratios" as margin of error factor.
Wetland restoration, bank stabilization, and other
similar practices can count towards compliance.
Wetland restoration, bank stabilization, and other similar
practices can count towards compliance if reductions are
quantifiable.
Typically used for phosphorus compliance only.Can be used for a variety of pollutants, not just
phosphorus.
83
12.3 Phosphorus Multi- Discharger Variance (Wisconsin Act 378)
In April of 2014, Act 378 was enacted; this act required the Wisconsin Department of
Administration in consultation with the Department of Natural Resources to determine if
applying with phosphorus causes Wisconsin substantial and economic hardship. If so, DNR will
work with the EPA to implement a phosphorus Multi-discharger Phosphorus Variance to help
point sources comply with phosphorus standards in a more economically viable way. A multi-
discharger variance extends the timeline for complying with low level phosphorus limits. In
exchange, point sources agree to step wise reduction of phosphorus within their effluent as well
as helping to address nonpoint source of phosphorus from farm fields, cities or natural areas by
paying $50 per pound to implement projects designed to improve water quality. A permittee that
chooses to make payments for phosphorus reduction will make payments to each county that is
participating in the program and has territory within the basin in which the point source is
located in proportion to the amount of territory each county has within the basin. A county will
then use the payments to provide cost sharing for projects to reduce the amount of phosphorus
entering the waters of the state, for staff to implement phosphorus reduction projects, and/or for
modeling or monitoring to evaluate the amount of phosphorus in the waters of the state for
planning purposes.

84
(This page intentionally left blank)
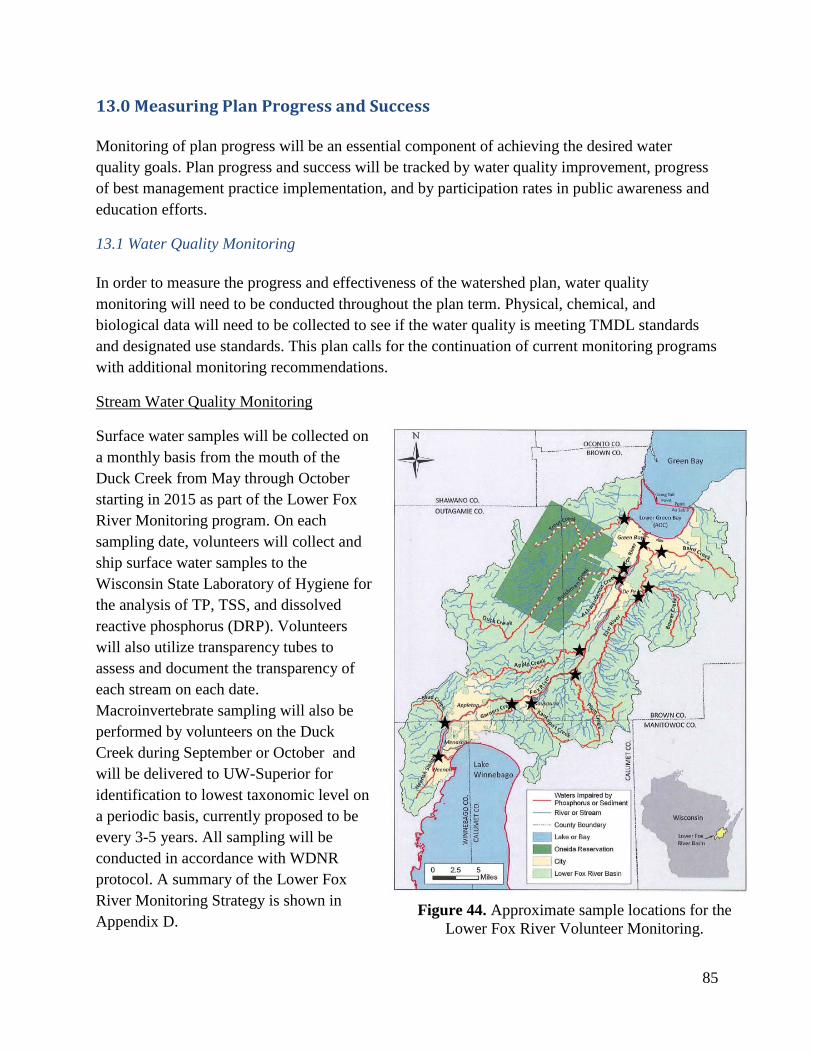
85
13.0 Measuring Plan Progress and Success
Monitoring of plan progress will be an essential component of achieving the desired water
quality goals. Plan progress and success will be tracked by water quality improvement, progress
of best management practice implementation, and by participation rates in public awareness and
education efforts.
13.1 Water Quality Monitoring
In order to measure the progress and effectiveness of the watershed plan, water quality
monitoring will need to be conducted throughout the plan term. Physical, chemical, and
biological data will need to be collected to see if the water quality is meeting TMDL standards
and designated use standards. This plan calls for the continuation of current monitoring programs
with additional monitoring recommendations.
Stream Water Quality Monitoring
Surface water samples will be collected on
a monthly basis from the mouth of the
Duck Creek from May through October
starting in 2015 as part of the Lower Fox
River Monitoring program. On each
sampling date, volunteers will collect and
ship surface water samples to the
Wisconsin State Laboratory of Hygiene for
the analysis of TP, TSS, and dissolved
reactive phosphorus (DRP). Volunteers
will also utilize transparency tubes to
assess and document the transparency of
each stream on each date.
Macroinvertebrate sampling will also be
performed by volunteers on the Duck
Creek during September or October and
will be delivered to UW-Superior for
identification to lowest taxonomic level on
a periodic basis, currently proposed to be
every 3-5 years. All sampling will be
conducted in accordance with WDNR
protocol. A summary of the Lower Fox
River Monitoring Strategy is shown in
Appendix D. Figure 44. Approximate sample locations for the
Lower Fox River Volunteer Monitoring.
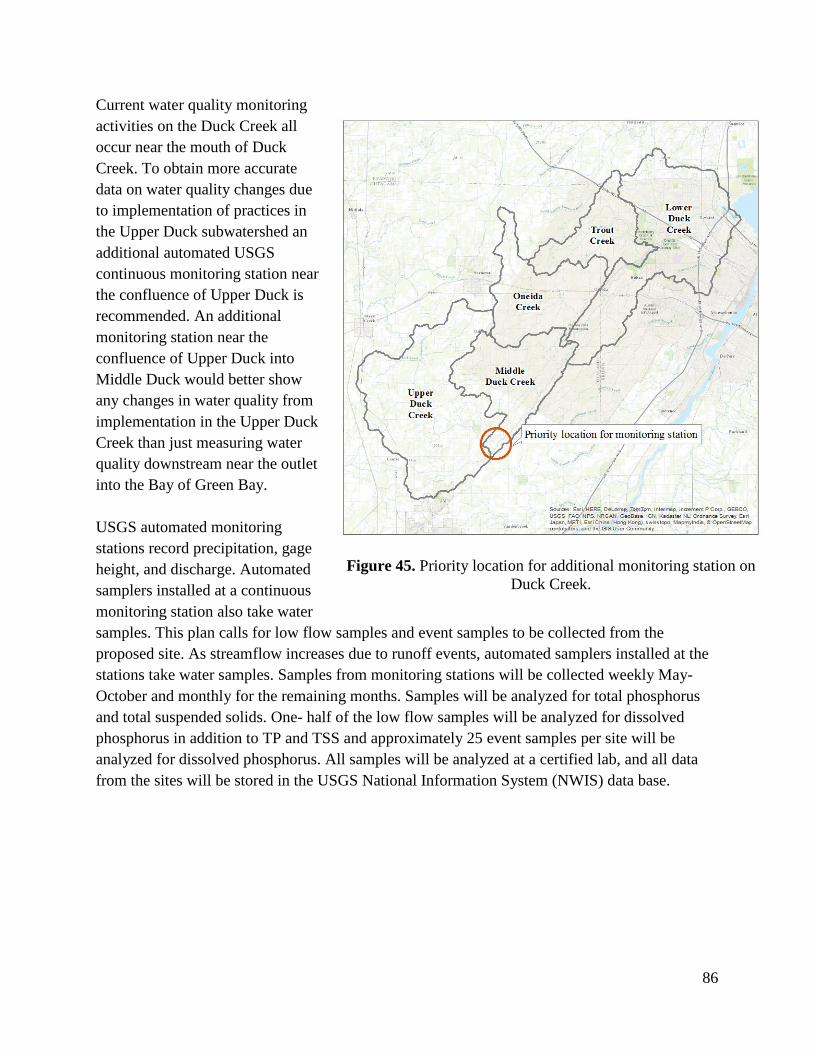
86
Current water quality monitoring
activities on the Duck Creek all
occur near the mouth of Duck
Creek. To obtain more accurate
data on water quality changes due
to implementation of practices in
the Upper Duck subwatershed an
additional automated USGS
continuous monitoring station near
the confluence of Upper Duck is
recommended. An additional
monitoring station near the
confluence of Upper Duck into
Middle Duck would better show
any changes in water quality from
implementation in the Upper Duck
Creek than just measuring water
quality downstream near the outlet
into the Bay of Green Bay.
USGS automated monitoring
stations record precipitation, gage
height, and discharge. Automated
samplers installed at a continuous
monitoring station also take water
samples. This plan calls for low flow samples and event samples to be collected from the
proposed site. As streamflow increases due to runoff events, automated samplers installed at the
stations take water samples. Samples from monitoring stations will be collected weekly May-
October and monthly for the remaining months. Samples will be analyzed for total phosphorus
and total suspended solids. One- half of the low flow samples will be analyzed for dissolved
phosphorus in addition to TP and TSS and approximately 25 event samples per site will be
analyzed for dissolved phosphorus. All samples will be analyzed at a certified lab, and all data
from the sites will be stored in the USGS National Information System (NWIS) data base.
Figure 45. Priority location for additional monitoring station on
Duck Creek.
87
Edge of Field Monitoring
A minimum of two edge of field sites in the watershed should be chosen for monitoring the
effectiveness of new tile drainage water treatment practices such as the use of saturated buffers,
phosphorus removal structures, or water control structures. Two constructed treatment wetlands
with water quality monitoring are planned in the Plum and Kankapot watersheds of the Lower
Fox, therefore other tile drainage water treatment methods should be tested in the Upper Duck
watershed. Discharge and water quality will be monitored at inlets and outlets of treatment
practices. Water quality and flow data will be used to compute daily phosphorus and suspended
sediment loads and to evaluate the treatment effectiveness of the practice. An appropriate quality
assurance plan will be developed for the edge of field monitoring work and samples will be
analyzed at a certified lab. Edge of field monitoring will begin once sites and desired practices
are identified and constructed, which shall occur within the first 2 years of implementation.
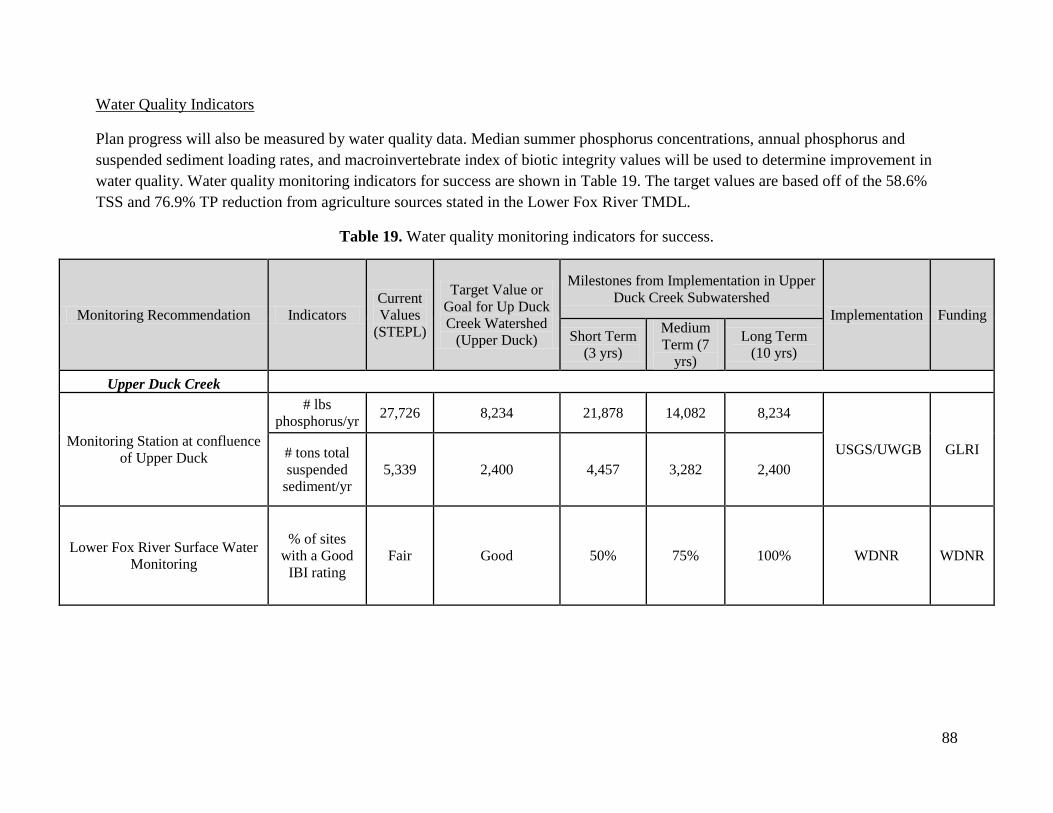
88
Water Quality Indicators
Plan progress will also be measured by water quality data. Median summer phosphorus concentrations, annual phosphorus and
suspended sediment loading rates, and macroinvertebrate index of biotic integrity values will be used to determine improvement in
water quality. Water quality monitoring indicators for success are shown in Table 19. The target values are based off of the 58.6%
TSS and 76.9% TP reduction from agriculture sources stated in the Lower Fox River TMDL.
Table 19. Water quality monitoring indicators for success.
Monitoring Recommendation Indicators
Current
Values
(STEPL)
Target Value or
Goal for Up Duck
Creek Watershed
(Upper Duck)
Milestones from Implementation in Upper
Duck Creek Subwatershed
Implementation Funding
Short Term
(3 yrs)
Medium
Term (7
yrs)
Long Term
(10 yrs)
Upper Duck Creek
Monitoring Station at confluence
of Upper Duck
# lbs
phosphorus/yr 27,726 8,234 21,878 14,082 8,234
USGS/UWGB GLRI # tons total
suspended
sediment/yr
5,339 2,400 4,457 3,282 2,400
Lower Fox River Surface Water
Monitoring
% of sites
with a Good
IBI rating
Fair Good 50% 75% 100% WDNR WDNR
89
13.2 Tracking of Progress and Success of Plan
Progress and success of the Upper Duck Creek Watershed Project will be tracked by the
following components:
1) Information and education activities and participation
2) Pollution reduction evaluation based on BMP’s installed
3) Water quality monitoring
4) Administrative review
Outagamie County Land Conservation Departments will be responsible for tracking progress of
the plan. Land Conservation departments will need to work with NRCS staff to track progress
and implement projects. Reports will be completed annually, and a final report will be prepared
at the end of the project.
1) Information and education reports will include:
a) Number of landowners/operators in the watershed plan area.
b) Number of eligible landowners/operators in the watershed plan area.
c) Number of landowners/operators contacted.
d) Number of cost-share agreements signed.
e) Number and type of information and education activities held, who lead the activity,
how many invited, how many attended, and any measurable results of I&E activities.
f) Number of informational flyers/brochures distributed per given time period.
g) Number of one on one contacts made with landowners in the watershed.
h) Number of municipalities that adopt municipal comprehensive plans, codes, and
ordinances, supportive of watershed plan goals and objectives.
i) Comments or suggestions for future activities.
2) Installed best management practices will be mapped using GIS. Pollution reductions from
completed projects will be evaluated using models and spreadsheet tools such as STEPL
and SNAP Plus5 for upland practices and the BARNY model for barnyard practices. The
annual report will include:
a) Planned and completed BMP’s.
b) Pollutant load reductions and percent of goal planned and achieved.
c) Cost-share funding source of planned and installed BMP’s.
d) Numbers of checks to make sure management plans (nutrient management, grazing
management) are being followed by landowners.
e) Number of checks to make sure practices are being operated and maintained properly.
5 SNAP (Soil Nutrient Application Planner) Plus is Wisconsin’s nutrient management software that calculates
potential soil and phosphorus runoff losses on field basis while assisting in the economic planning of manure and
fertilizer applications. Additional information can be found on the website http://snapplus.wisc.edu/.
90
f) The fields and practices selected and funded by a point source (adaptive management
or water quality trading) compliance options will be carefully tracked to assure that
Section 319 funds are not being used to implement practices that are part of a point
source permit compliance strategy.
g) Number of new and alternative technologies and management measures assessed for
feasibility, used, and incorporated into plan.
3) Water Quality Monitoring Reporting Parameters:
a) Annual summer median total phosphorus and total suspended solids concentrations
and loading values from USGS stream monitoring stations.
b) Annual mean discharge and peak flow discharge from USGS stream monitoring
stations.
c) Total phosphorus, dissolved reactive phosphorus, total suspended solids, and clarity
data from volunteer grab sampling (Lower Fox River Watershed Monitoring
Program).
d) Edge of field monitoring results.
e) Macroinvertebrate Index of Biotic Integrity.
4) Administrative Review tracking and reporting will include:
a) Status of grants relating to project.
b) Status of project administration including data management, staff training, and BMP
monitoring.
c) Status of nutrient management planning, and easement acquisition and development.
d) Number of cost-share agreements.
e) Total amount of money on cost-share agreements.
f) Total amount of landowner reimbursements made.
g) Staff salary and fringe benefits expenditures.
h) Staff travel expenditures.
i) Information and education expenditures.
j) Equipment, materials, and supply expenses.
k) Professional services and staff support costs.
l) Total expenditures for the county.
m) Total amount paid for installation of BMP’s and amount encumbered for cost-share
agreements.
n) Number of Water Quality Trading/Adaptive Management contracts.
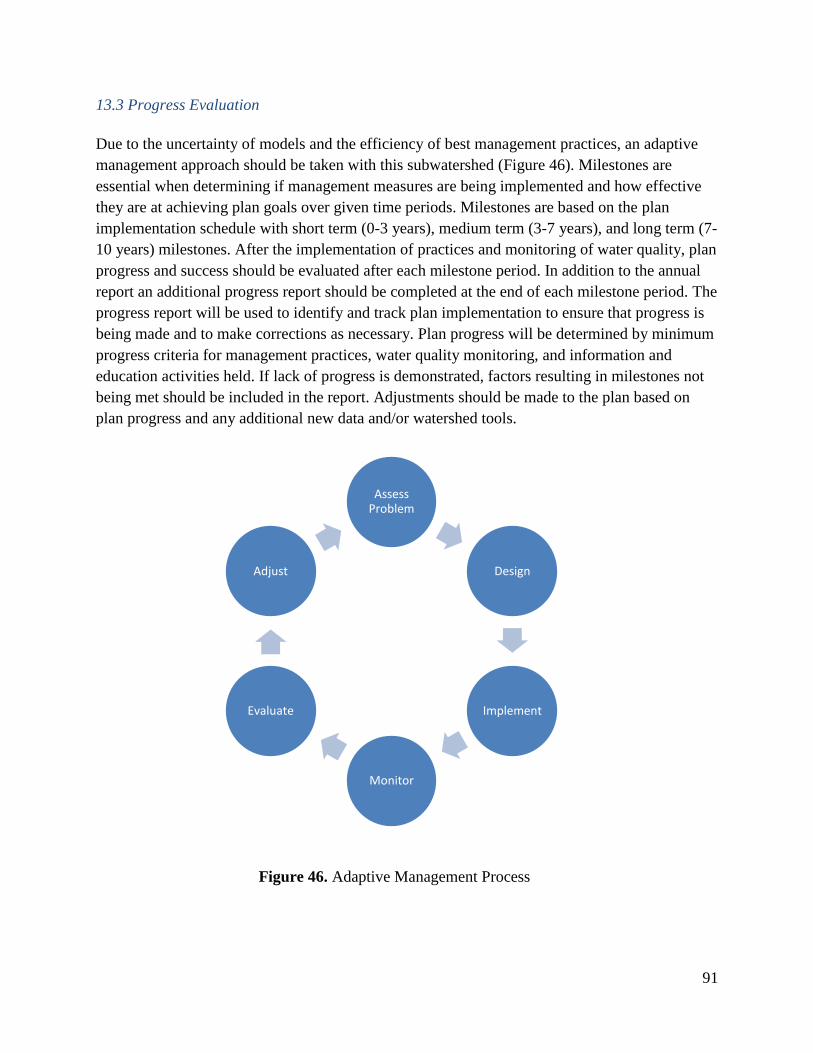
91
13.3 Progress Evaluation
Due to the uncertainty of models and the efficiency of best management practices, an adaptive
management approach should be taken with this subwatershed (Figure 46). Milestones are
essential when determining if management measures are being implemented and how effective
they are at achieving plan goals over given time periods. Milestones are based on the plan
implementation schedule with short term (0-3 years), medium term (3-7 years), and long term (7-
10 years) milestones. After the implementation of practices and monitoring of water quality, plan
progress and success should be evaluated after each milestone period. In addition to the annual
report an additional progress report should be completed at the end of each milestone period. The
progress report will be used to identify and track plan implementation to ensure that progress is
being made and to make corrections as necessary. Plan progress will be determined by minimum
progress criteria for management practices, water quality monitoring, and information and
education activities held. If lack of progress is demonstrated, factors resulting in milestones not
being met should be included in the report. Adjustments should be made to the plan based on
plan progress and any additional new data and/or watershed tools.
Assess Problem
Design
Implement
Monitor
Evaluate
Adjust
Figure 46. Adaptive Management Process
92
Water Quality Monitoring Progress Evaluation
This implementation plan recognizes that estimated pollutant load reductions and expected
improvement in water quality or aquatic habitat may not occur immediately following
implementation of practices due to several factors (described below) that will need to be taken
into consideration when evaluating water quality data. These factors can affect or mask progress
that plan implementation has made elsewhere. Consultation with the DNR and Water Quality
biologists will be critical when evaluating water quality or aquatic habitat monitoring results.
Milestones for pollutant load reductions are shown in Table 19. If the target values/goals for
water quality improvement for the milestone period are not being achieved, the water quality
targets or timetable for pollutant reduction will need to evaluated and adjusted as necessary.
The following criteria will be evaluated when water quality and aquatic habitat monitoring is
completed after implementation of practices:
Changes in land use or crop rotations within the same watershed where practices are
implemented. (Increase in cattle numbers, corn silage acres, and/or urban areas can negatively
impact stream quality and water quality efforts)
Location in watershed where land use changes or crop rotations occur. (Where are these changes
occurring in relation to implemented practices?)
Watershed size, location where practices are implemented and location of monitoring sites.
Climate, precipitation and soil conditions that occurred before and during monitoring periods.
(Climate and weather patterns can significantly affect growing season, soil conditions, and water
quality)
Frequency and timing of monitoring.
Percent of watershed area (acres) or facilities (number) meeting NR 151 performance standards
and prohibitions.
Percent of watershed area (acres) or facilities (number) that maintain implemented practices over
time.
Extent of gully erosion on crop fields within watershed over time. How many are maintained in
perennial vegetation vs. plowed under each year?
Stability of bank sediments and how much this sediment may be contributing P and TSS to the
stream
How “Legacy’ sediments already within the stream and watershed may be contributing P and
sediment loads to stream?
Presence and extent of drain tiles in watershed area in relation to monitoring locations. Do these
drainage systems contribute significant P and sediment loads to receiving streams?
Does monitored stream meet IBI and habitat criteria but does not meet TMDL water quality
criteria?
Are targets reasonable? Load reductions predicted by models could be overly optimist
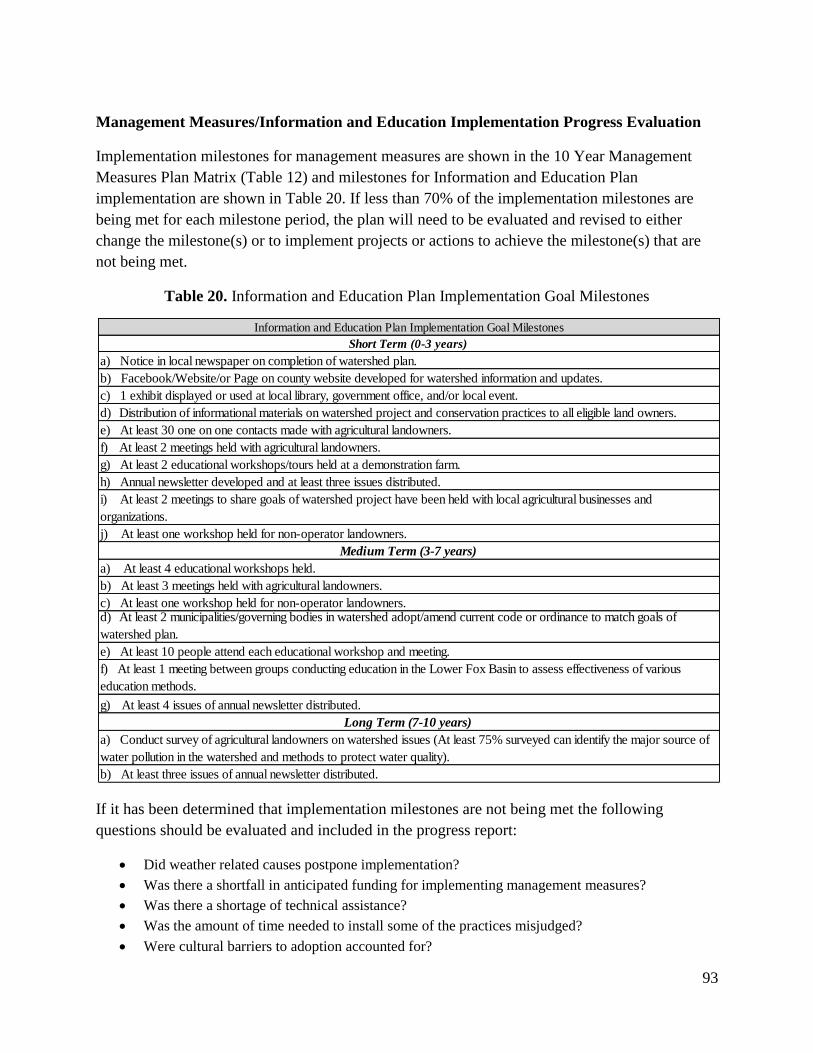
93
Management Measures/Information and Education Implementation Progress Evaluation
Implementation milestones for management measures are shown in the 10 Year Management
Measures Plan Matrix (Table 12) and milestones for Information and Education Plan
implementation are shown in Table 20. If less than 70% of the implementation milestones are
being met for each milestone period, the plan will need to be evaluated and revised to either
change the milestone(s) or to implement projects or actions to achieve the milestone(s) that are
not being met.
Table 20. Information and Education Plan Implementation Goal Milestones
If it has been determined that implementation milestones are not being met the following
questions should be evaluated and included in the progress report:
Did weather related causes postpone implementation?
Was there a shortfall in anticipated funding for implementing management measures?
Was there a shortage of technical assistance?
Was the amount of time needed to install some of the practices misjudged?
Were cultural barriers to adoption accounted for?
Information and Education Plan Implementation Goal Milestones
Short Term (0-3 years)
a) Notice in local newspaper on completion of watershed plan.
b) Facebook/Website/or Page on county website developed for watershed information and updates.
c) 1 exhibit displayed or used at local library, government office, and/or local event.
d) Distribution of informational materials on watershed project and conservation practices to all eligible land owners.
e) At least 30 one on one contacts made with agricultural landowners.
f) At least 2 meetings held with agricultural landowners.
g) At least 2 educational workshops/tours held at a demonstration farm.
h) Annual newsletter developed and at least three issues distributed.
i) At least 2 meetings to share goals of watershed project have been held with local agricultural businesses and
organizations.
j) At least one workshop held for non-operator landowners.
Medium Term (3-7 years)
a) At least 4 educational workshops held.
b) At least 3 meetings held with agricultural landowners.
c) At least one workshop held for non-operator landowners.d) At least 2 municipalities/governing bodies in watershed adopt/amend current code or ordinance to match goals of
watershed plan.
e) At least 10 people attend each educational workshop and meeting.
f) At least 1 meeting between groups conducting education in the Lower Fox Basin to assess effectiveness of various
education methods.
g) At least 4 issues of annual newsletter distributed.
Long Term (7-10 years)
a) Conduct survey of agricultural landowners on watershed issues (At least 75% surveyed can identify the major source of
water pollution in the watershed and methods to protect water quality).
b) At least three issues of annual newsletter distributed.

94
(This page intentionally left blank)
95
14.0 Literature Cited
Cibulka, Daniel, Paul Baumgart, and Kevin Fermanich. 2010. Temporal Assessment of
Management Practices and Water Quality in the Duck Creek Watershed, Wisconsin. A
report to the Environmental Health and Safety Division Oneida Tribe of Indians of
Wisconsin. University of Wisconsin Green Bay.
Cooley, Eric, Dennis Frame, and Aaron Wunderlin. 2010. Understanding Nutrient & Sediment
Loss at Pagel’s Ponderosa Dairy-Fact Sheet Series. University of Wisconsin-Discovery
Farms.
Chen, Liming, and Warren Dick. 2011 .Gypsum as an Agricultural Amendment, General Use
Guidelines. Ohio State University. Bulletin 945.
Dodds, W.K., W.W. Bouska, J.L. Eitzman, T.J. Pilger, K.L. Pitts, A.J. Riley, J.T. Schoesser, and
D.J. Thornbrugh. 2009. Eutrophication of U. S. freshwaters: analysis of potential
economic damages. Environmental Science and Technology 43: 12-19. doi:
10.1021/es801217q
Duan S., S.S. Kaushal, P.M. Groffman, L.E. Band, and K.T. Belt. 2012. Phosphorus export
across an urban to rural gradient in the Chesapeake Bay watershed. J. Geophys. Res. 117:
G0102510. Doi: 1029/2011JG001782.
Eagan-Robertson, David. December 2013. Wisconsin’s Future Population: Projections for the
State, its counties and municipalities, 2010-2040. Wisconsin Department of
Administration Demographic Services Center. Retrieved from
http://www.doa.state.wi.us/divisions/intergovernmental-relations/demographic-services-
center/projections
Jacobson, Marty, Kevin Fermanich, and Paul Baumgart. Phosphorus and TSS Trends in Duck
Creek, Northeastern Wisconsin. Presented at the Wisconsin AWRA Meeting,
Wisconsin Dells, March 13-14, 2014.
Miller, Nick, Tom Bernthal, John Wagner, Mike Grimm, Gary Casper, and Joanne Kline. March
2012. The Duck-Pensaukee Watershed Approach: Mapping Wetland Services, Meeting
Watershed Needs. The Nature Conservancy and Environmental Law Institute. Madison,
WI.
Nickerson, Cynthia, Mitchell Morehart, Todd Kuethe, Jayson Beckman, Jennifer Ifft, and Ryan
Williams. February 2012. Trends in U.S. Farmland Values and Ownership. EIB-92.
United States Department of Agriculture, Economic Research Service.
96
Omernik, J.M., S.S. Chapman, R.A. Lillie, and R.T. Dumke. 2000. “Ecoregions of Wisconsin.”
Transactions of the Wisconsin Academy of Sciences, Arts, and Letters. 88 :77-103.
Oklahoma State University. n.d. Phosphorus Removal Structures: A new best management
practice to help improve water quality [brochure]. Stillwater, Oklahoma. Retrieved from
http://phrog.okstate.edu/#Problem
Ruark, Matt, Allison Madison, Eric Cooley, Tott Stuntebeck, and Matt Komiskey. 2012.
Phosphorus Loss from Tile Drains: Should We Be Concerned? Proceedings of the 2012
Wisconsin Crop Management Conference.
Sharpley, Andrew, Helen Jarvie, Anthony Buda, Linda May, Bryan Spears, and Peter Kleinman.
2013. Phosphorus Legacy: Overcoming the Effects of Past Management Practices to
Mitigate Future Water Quality Impairment. J. Environ.Qual. 42. 1308-1326.
doi:10.2134/jeq2013.03.0098
U.S. Census Bureau/American Fact Finder. “DP-1-Profile of General Population and Housing
Characteristics: 2010.” 2010 Demographic Profile Data. U.S. Census Bureau, 2010.
Accessed September 8, 2014: http://factfinder2.census.gov
U.S. Census Bureau/ American Fact Finder. “S1901-Income in the Past 12 Months.” 2008-2012
American Community Survey 5-Year Estimates. U.S. Census Bureau’s American
Community Survey Office, 2012. Accessed September 8, 2014:
http://factfinder2.census.gov
U.S. Department of Agriculture National Agricultural Statistics Service (USDA NASS). 1999.
Agricultural Economics and Land Ownership Survey. Retrieved from
http://www.agcensus.usda.gov/Publications/1997/Agricultural_Economics_and_Land_O
wnership/
U.S. Environmental Protection Agency (USEPA). March 2008. Handbook for Developing
Watershed Plans to Restore and Protect Our Waters. EPA 841-B-08-002.
U.S. Environmental Protection Agency (USEPA). May 2006. Wetlands: Protecting Life and
Property from Flooding. EPA843-F-06-001. Retrieved from:
http://water.epa.gov/type/wetlands/outreach/upload/Flooding.pdf.
Wisconsin Department of Natural Resources (WDNR). March 2012. Total Maximum Daily
Load and Watershed Management Plan for Total Phosphorus and Total Suspended Solids
in the Lower Fox River Basin and Lower Green Bay. Wisconsin Department of Natural
Resources. Madison, WI
Wisconsin Department of Natural Resources (WDNR). September 2013. Wisconsin 2014
Consolidated Assessment and Listing Methodology (WisCALM).
97
Appendix A. Glossary of Terms and Acronyms.
BARNY- Wisconsin adapted version of the ARS feedlot runoff model that estimates amount of
phosphorus runoff from feedlots.
Baseline –An initial set of observations or data used for comparison or as a control.
Best Management Practice (BMP) – A method that has been determined to be the most
effective, practical means of preventing or reducing pollution from nonpoint sources.
Cost-Sharing- Financial assistance provided to a landowner to install and/or use applicable best
management practices.
Ephemeral gully- Voided areas that occur in the same location every year that are crossable
with farm equipment and are often partially filled in by tillage.
Geographic Information System (GIS) – A tool that links spatial features commonly seen on
maps with information from various sources ranging from demographics to pollutant sources.
Index of Biotic Integrity – An indexing procedure commonly used by academia, agencies, and
groups to assess watershed condition based on the composition of a biological community in a
water body.
Lateral Recession Rate- the thickness of soil eroded from a bank surface (perpendicular to the
face) in an average year, given in feet per year.
Natural Resources Conservation Service (NRCS) - Provides technical expertise and
conservation planning for farmers, ranchers, and forest landowners wanting to make
conservation improvements to their land.
Phosphorus Index (PI) – The phosphorus index is used in nutrient management planning. It is
calculated by estimating average runoff phosphorus delivery from each field to the nearest
surface water in a year given the field’s soil conditions, crops, tillage, manure and fertilizer
applications, and long term weather patterns. The higher the number the greater the likely hood
that the field is contributing phosphorus to local water bodies.
Riparian – Relating to or located on the bank of a natural watercourse such as a river or
sometimes of a lake or tidewater
Soil Nutrient Application Manager (SNAP) – Wisconsin’s nutrient management planning
software.
98
Spreadsheet Tool for Estimating Pollutant Load (STEPL) - Model that calculates nutrient
loads (Phosphorus, Nitrogen, and Biological Oxygen Demand) by land use type and aggregated
by watershed.
Soil and Water Assessment Tool (SWAT) – A small watershed to river basin-scale model to
simulate the quality and quantity of surface and ground water and predict the environmental
impact of land use, land management practices, and climate change. Model is widely used in
assessing soil erosion prevention and control, non-point source pollution control and regional
management in watersheds.
Stream Power Index (SPI) – Measures the erosive power of overland flow as a function of local
slope and upstream drainage area.
Total Suspended Sediment (TSS) - The organic and inorganic material suspended in the water
column and greater than 0.45 micron in size.
Total Maximum Daily Load (TMDL) - A calculation of the maximum amount of pollutant that
a water body can receive and still meet water quality standards.
United States Geological Survey (USGS) – Science organization that collects, monitors,
analyzes, and provides scientific understanding about natural resource conditions, issues, and
problems.
United States Environmental Protection Agency (USEPA) – Government agency to protect
human health and the environment.
University of Wisconsin Extension (UWEX) – UW-Extension works with UW- System
campuses, Wisconsin counties, tribal governments, and other public and private organizations to
help address economic, social, and environmental issues.
Wisconsin Department of Natural Resources (WDNR) – State organization that works with
citizens and businesses to preserve and enhance the natural resources of Wisconsin.
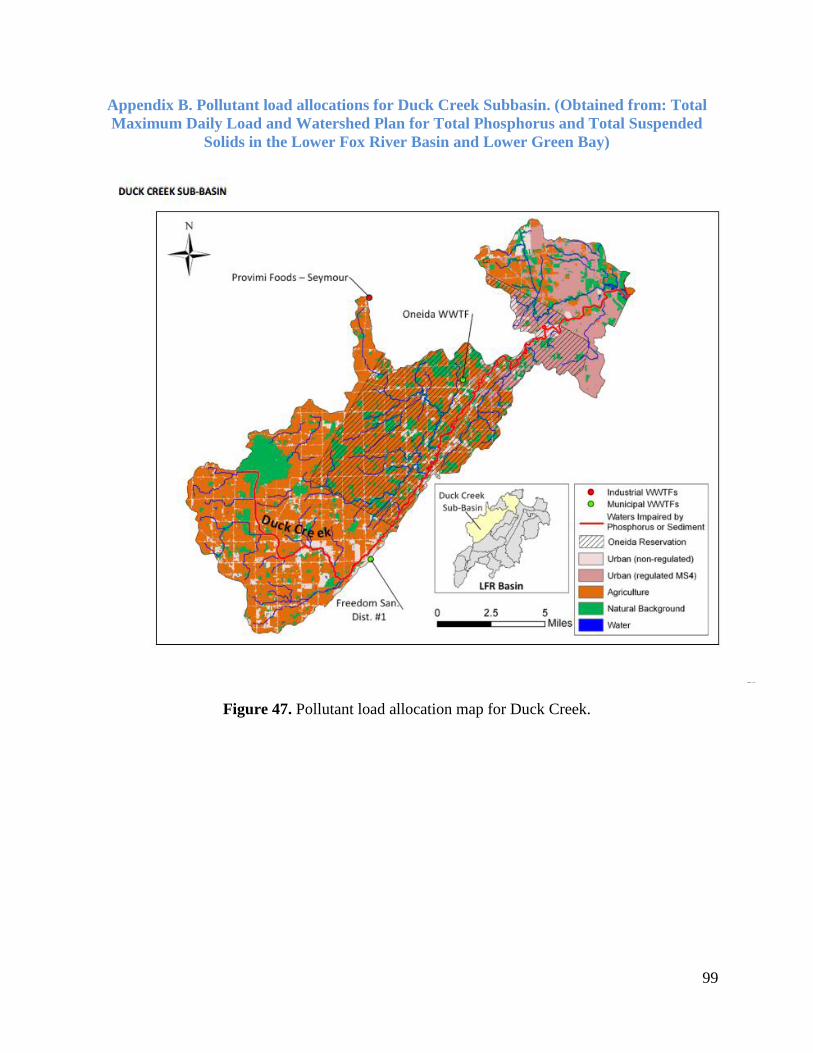
99
Appendix B. Pollutant load allocations for Duck Creek Subbasin. (Obtained from: Total
Maximum Daily Load and Watershed Plan for Total Phosphorus and Total Suspended
Solids in the Lower Fox River Basin and Lower Green Bay)
Figure 47. Pollutant load allocation map for Duck Creek.
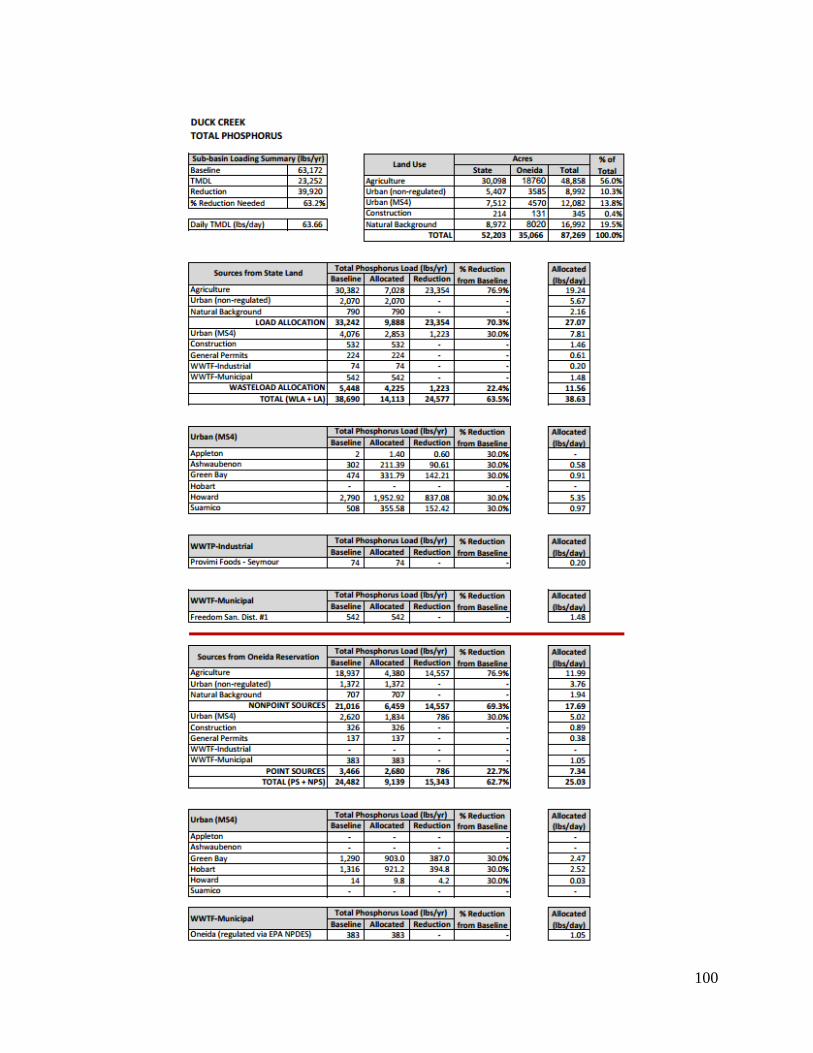
100
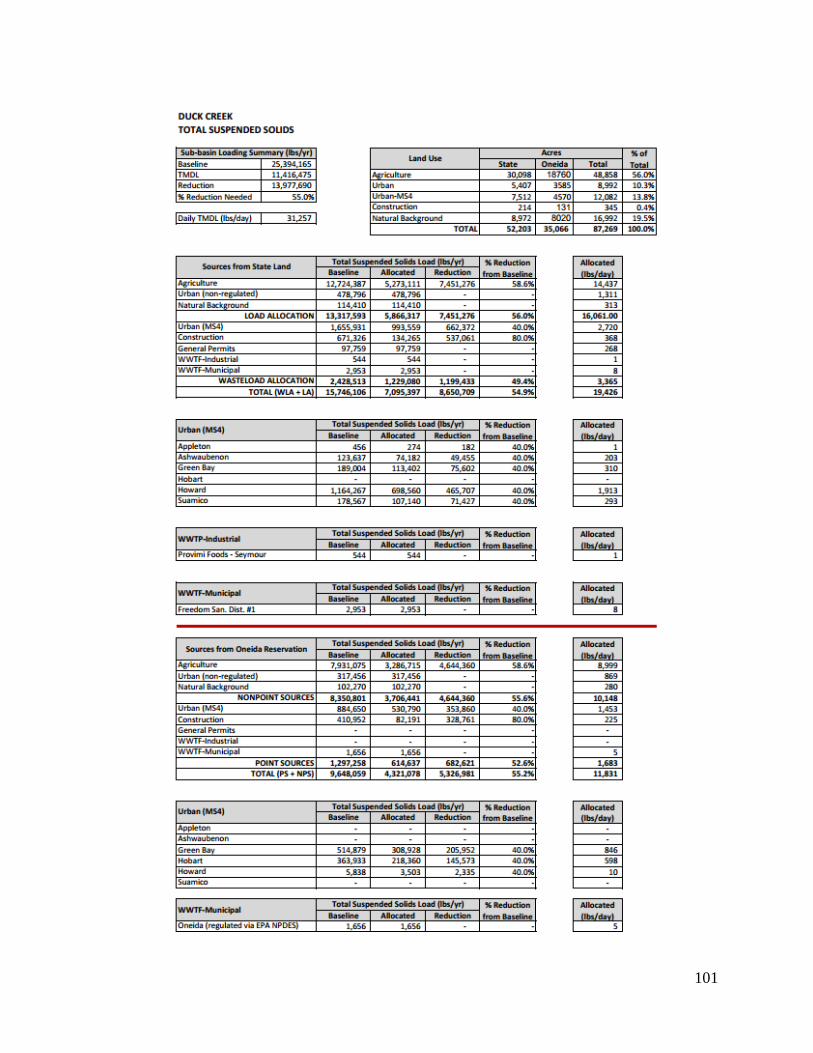
101
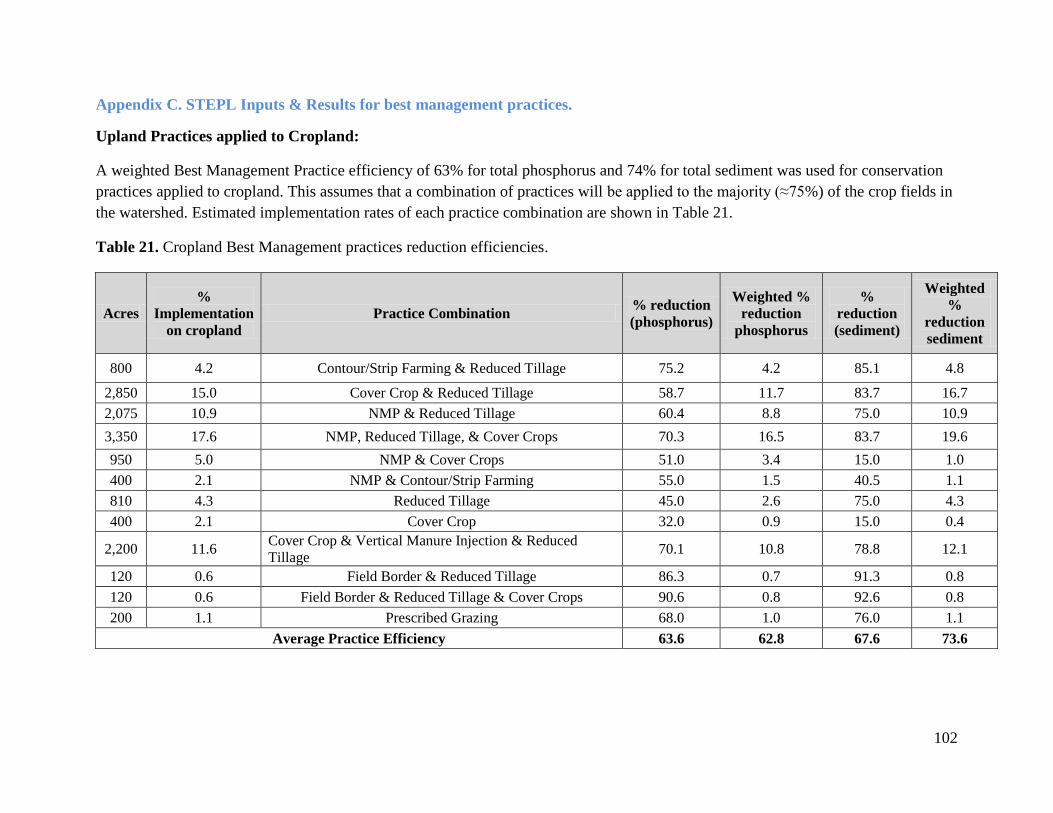
102
Appendix C. STEPL Inputs & Results for best management practices.
Upland Practices applied to Cropland:
A weighted Best Management Practice efficiency of 63% for total phosphorus and 74% for total sediment was used for conservation
practices applied to cropland. This assumes that a combination of practices will be applied to the majority (≈75%) of the crop fields in
the watershed. Estimated implementation rates of each practice combination are shown in Table 21.
Table 21. Cropland Best Management practices reduction efficiencies.
Acres
%
Implementation
on cropland
Practice Combination % reduction
(phosphorus)
Weighted %
reduction
phosphorus
%
reduction
(sediment)
Weighted
%
reduction
sediment
800 4.2 Contour/Strip Farming & Reduced Tillage 75.2 4.2 85.1 4.8
2,850 15.0 Cover Crop & Reduced Tillage 58.7 11.7 83.7 16.7
2,075 10.9 NMP & Reduced Tillage 60.4 8.8 75.0 10.9
3,350 17.6 NMP, Reduced Tillage, & Cover Crops 70.3 16.5 83.7 19.6
950 5.0 NMP & Cover Crops 51.0 3.4 15.0 1.0
400 2.1 NMP & Contour/Strip Farming 55.0 1.5 40.5 1.1
810 4.3 Reduced Tillage 45.0 2.6 75.0 4.3
400 2.1 Cover Crop 32.0 0.9 15.0 0.4
2,200 11.6 Cover Crop & Vertical Manure Injection & Reduced
Tillage 70.1 10.8 78.8 12.1
120 0.6 Field Border & Reduced Tillage 86.3 0.7 91.3 0.8
120 0.6 Field Border & Reduced Tillage & Cover Crops 90.6 0.8 92.6 0.8
200 1.1 Prescribed Grazing 68.0 1.0 76.0 1.1
Average Practice Efficiency 63.6 62.8 67.6 73.6
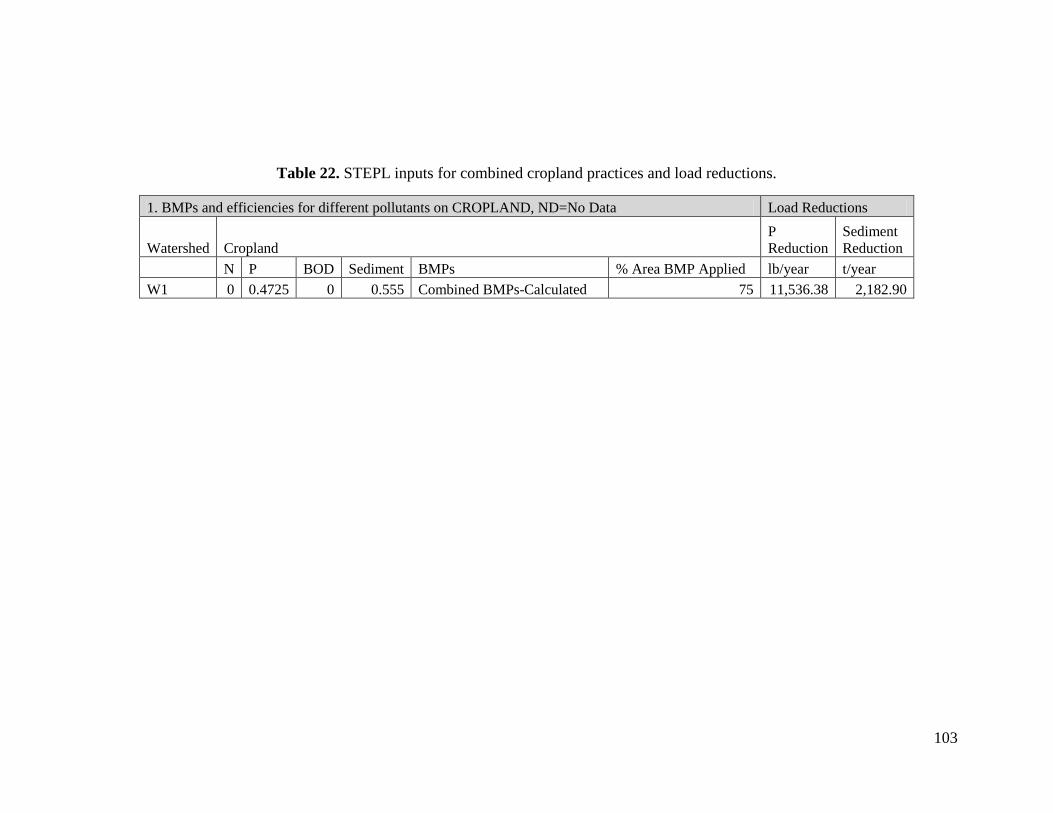
103
Table 22. STEPL inputs for combined cropland practices and load reductions.
1. BMPs and efficiencies for different pollutants on CROPLAND, ND=No Data Load Reductions
Watershed Cropland
P
Reduction
Sediment
Reduction
N P BOD Sediment BMPs % Area BMP Applied lb/year t/year
W1 0 0.4725 0 0.555 Combined BMPs-Calculated 75 11,536.38 2,182.90
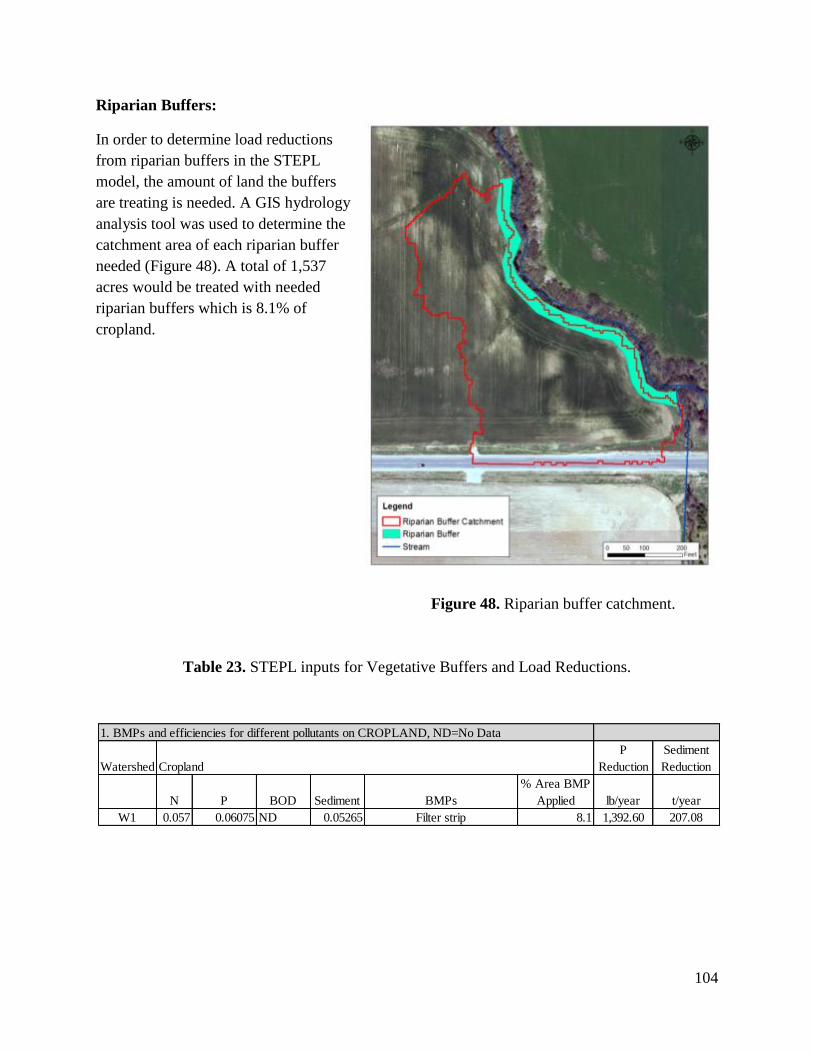
104
Riparian Buffers:
In order to determine load reductions
from riparian buffers in the STEPL
model, the amount of land the buffers
are treating is needed. A GIS hydrology
analysis tool was used to determine the
catchment area of each riparian buffer
needed (Figure 48). A total of 1,537
acres would be treated with needed
riparian buffers which is 8.1% of
cropland.
Figure 48. Riparian buffer catchment.
Table 23. STEPL inputs for Vegetative Buffers and Load Reductions.
Watershed
P
Reduction
Sediment
Reduction
N P BOD Sediment BMPs
% Area BMP
Applied lb/year t/year
W1 0.057 0.06075 ND 0.05265 Filter strip 8.1 1,392.60 207.08
Cropland
1. BMPs and efficiencies for different pollutants on CROPLAND, ND=No Data
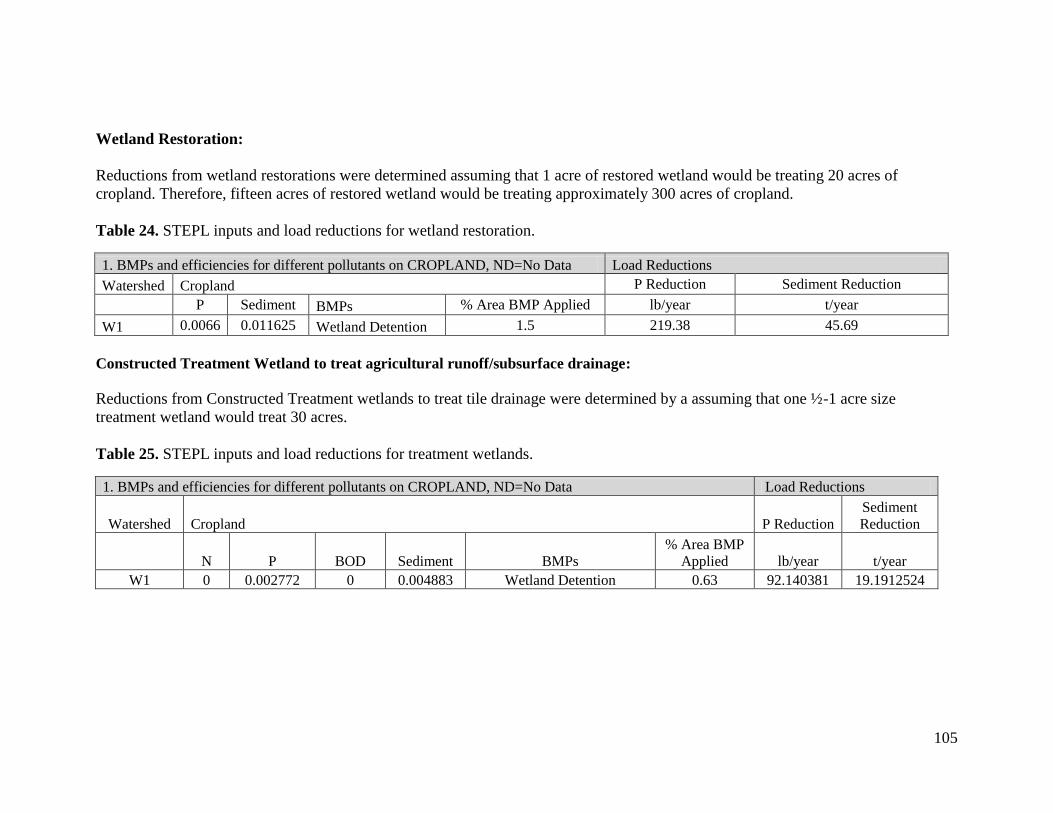
105
Wetland Restoration:
Reductions from wetland restorations were determined assuming that 1 acre of restored wetland would be treating 20 acres of
cropland. Therefore, fifteen acres of restored wetland would be treating approximately 300 acres of cropland.
Table 24. STEPL inputs and load reductions for wetland restoration.
1. BMPs and efficiencies for different pollutants on CROPLAND, ND=No Data Load Reductions
Watershed Cropland P Reduction Sediment Reduction
P Sediment BMPs % Area BMP Applied lb/year t/year
W1 0.0066 0.011625 Wetland Detention 1.5 219.38 45.69
Constructed Treatment Wetland to treat agricultural runoff/subsurface drainage:
Reductions from Constructed Treatment wetlands to treat tile drainage were determined by a assuming that one ½-1 acre size
treatment wetland would treat 30 acres.
Table 25. STEPL inputs and load reductions for treatment wetlands.
1. BMPs and efficiencies for different pollutants on CROPLAND, ND=No Data Load Reductions
Watershed Cropland P Reduction
Sediment
Reduction
N P BOD Sediment BMPs
% Area BMP
Applied lb/year t/year
W1 0 0.002772 0 0.004883 Wetland Detention 0.63 92.140381 19.1912524
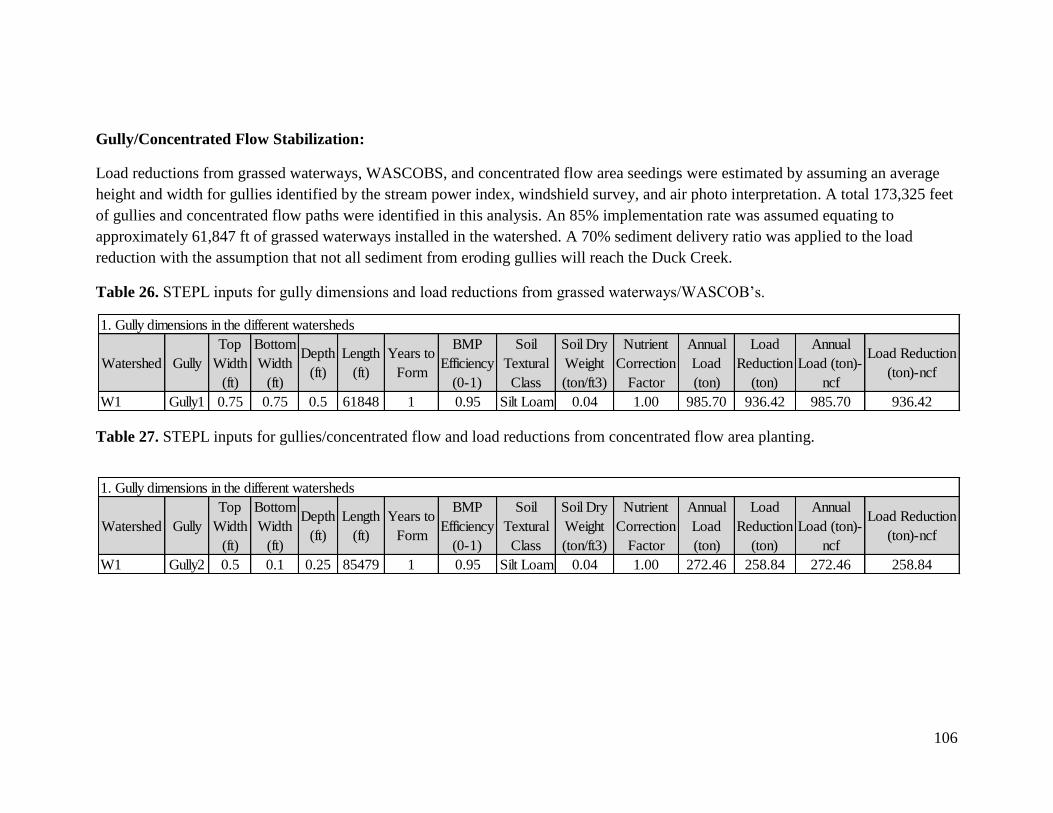
106
Gully/Concentrated Flow Stabilization:
Load reductions from grassed waterways, WASCOBS, and concentrated flow area seedings were estimated by assuming an average
height and width for gullies identified by the stream power index, windshield survey, and air photo interpretation. A total 173,325 feet
of gullies and concentrated flow paths were identified in this analysis. An 85% implementation rate was assumed equating to
approximately 61,847 ft of grassed waterways installed in the watershed. A 70% sediment delivery ratio was applied to the load
reduction with the assumption that not all sediment from eroding gullies will reach the Duck Creek.
Table 26. STEPL inputs for gully dimensions and load reductions from grassed waterways/WASCOB’s.
Table 27. STEPL inputs for gullies/concentrated flow and load reductions from concentrated flow area planting.
Watershed Gully
Top
Width
(ft)
Bottom
Width
(ft)
Depth
(ft)
Length
(ft)
Years to
Form
BMP
Efficiency
(0-1)
Soil
Textural
Class
Soil Dry
Weight
(ton/ft3)
Nutrient
Correction
Factor
Annual
Load
(ton)
Load
Reduction
(ton)
Annual
Load (ton)-
ncf
Load Reduction
(ton)-ncf
W1 Gully1 0.75 0.75 0.5 61848 1 0.95 Silt Loam 0.04 1.00 985.70 936.42 985.70 936.42
1. Gully dimensions in the different watersheds
Watershed Gully
Top
Width
(ft)
Bottom
Width
(ft)
Depth
(ft)
Length
(ft)
Years to
Form
BMP
Efficiency
(0-1)
Soil
Textural
Class
Soil Dry
Weight
(ton/ft3)
Nutrient
Correction
Factor
Annual
Load
(ton)
Load
Reduction
(ton)
Annual
Load (ton)-
ncf
Load Reduction
(ton)-ncf
W1 Gully2 0.5 0.1 0.25 85479 1 0.95 Silt Loam 0.04 1.00 272.46 258.84 272.46 258.84
1. Gully dimensions in the different watersheds
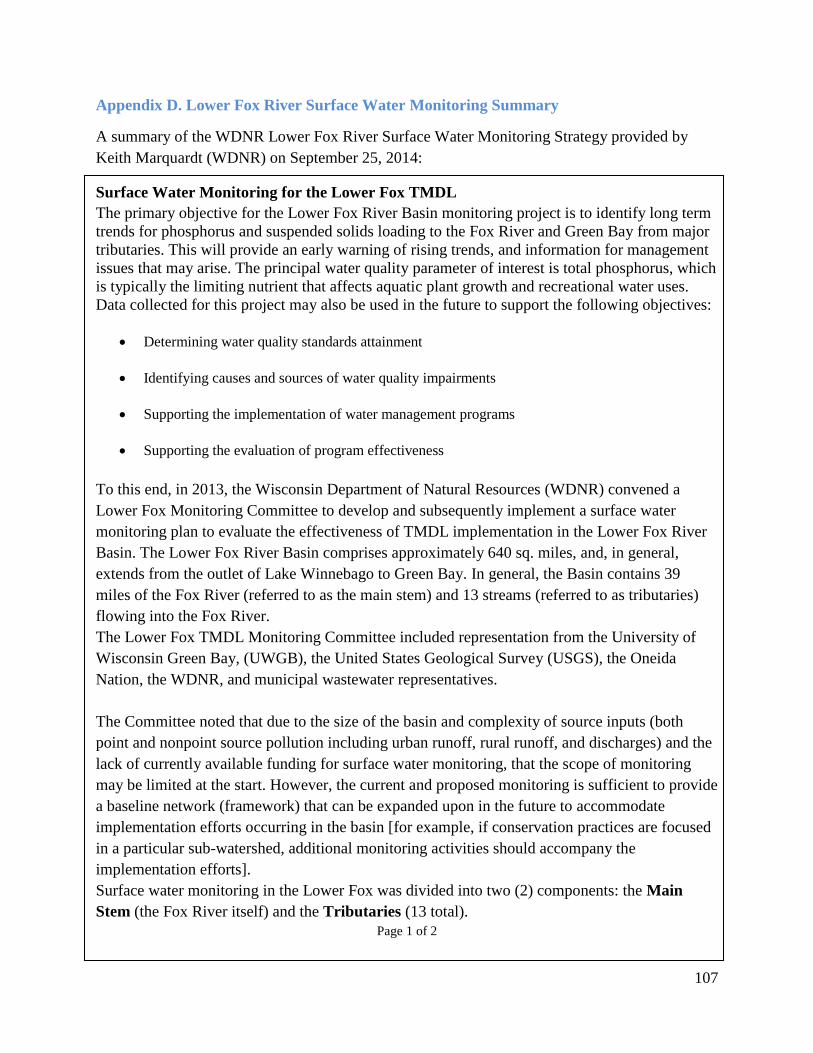
107
Appendix D. Lower Fox River Surface Water Monitoring Summary
A summary of the WDNR Lower Fox River Surface Water Monitoring Strategy provided by
Keith Marquardt (WDNR) on September 25, 2014:
Surface Water Monitoring for the Lower Fox TMDL
The primary objective for the Lower Fox River Basin monitoring project is to identify long term
trends for phosphorus and suspended solids loading to the Fox River and Green Bay from major
tributaries. This will provide an early warning of rising trends, and information for management
issues that may arise. The principal water quality parameter of interest is total phosphorus, which
is typically the limiting nutrient that affects aquatic plant growth and recreational water uses.
Data collected for this project may also be used in the future to support the following objectives:
Determining water quality standards attainment
Identifying causes and sources of water quality impairments
Supporting the implementation of water management programs
Supporting the evaluation of program effectiveness
To this end, in 2013, the Wisconsin Department of Natural Resources (WDNR) convened a
Lower Fox Monitoring Committee to develop and subsequently implement a surface water
monitoring plan to evaluate the effectiveness of TMDL implementation in the Lower Fox River
Basin. The Lower Fox River Basin comprises approximately 640 sq. miles, and, in general,
extends from the outlet of Lake Winnebago to Green Bay. In general, the Basin contains 39
miles of the Fox River (referred to as the main stem) and 13 streams (referred to as tributaries)
flowing into the Fox River.
The Lower Fox TMDL Monitoring Committee included representation from the University of
Wisconsin Green Bay, (UWGB), the United States Geological Survey (USGS), the Oneida
Nation, the WDNR, and municipal wastewater representatives.
The Committee noted that due to the size of the basin and complexity of source inputs (both
point and nonpoint source pollution including urban runoff, rural runoff, and discharges) and the
lack of currently available funding for surface water monitoring, that the scope of monitoring
may be limited at the start. However, the current and proposed monitoring is sufficient to provide
a baseline network (framework) that can be expanded upon in the future to accommodate
implementation efforts occurring in the basin [for example, if conservation practices are focused
in a particular sub-watershed, additional monitoring activities should accompany the
implementation efforts].
Surface water monitoring in the Lower Fox was divided into two (2) components: the Main
Stem (the Fox River itself) and the Tributaries (13 total).
Page 1 of 2
108
Main Stem
The Lower Fox River Main Stem monitoring includes the weekly collection of water samples
from 3 or 4 monitoring locations from roughly March through October for a total of 35 weeks.
Water samples will be analyzed at the Wisconsin State Laboratory of Hygiene (or a state
certified laboratory) for analysis of total suspended solids (TSS), total phosphorus (TP),
dissolved P, volatile organic solids, chlorophyll A, and dissolved oxygen (D.O.) . In addition,
flow data will be collected at each of the four (4) main stem locations. The four (4) monitoring
locations on the Main Stem include: the Lake Winnebago outlet (Neenah – Menasha dam), the
De Pere dam, the mouth of the Fox River, and a proposed location near Wrightstown bridge.
Tributaries
For the 13 streams flowing into the Fox River, surface water quality monitoring will be
conducted at one location at each of the 13 tributary sites on a monthly basis from May through
October 2015 (for a total of 6 monthly monitoring events at 13 locations).
On each sampling date, volunteers will collect and ship surface water samples to the Wisconsin
State Laboratory of Hygiene for the analysis of TP, TSS, and dissolved reactive phosphorus
(DRP). In addition, volunteers will utilize transparency tubes to assess and document the
transparency of each stream on each date.
See location map.
BIOLOGICAL ASSESSMENT and Secchi
Currently, volunteers are anticipated to perform Secchi depth and conduct submergent aquatic
vegetation surveys in Lower Green Bay on a periodic basis.
To assess the biological health of the streams, macroinvertebrate samples will be collected
during September or October and delivered to UW-Superior for identification to lowest
taxonomic level on a periodic basis, currently proposed to be every 3 to 5 years.
Other
When warranted, based on water quality results, additional monitoring may be required. The
WDNR will perform monitoring for confirmation prior to delisting the impaired water segments.
All sampling will be conducted in accordance with WDNR protocol.
Page 2 of 2
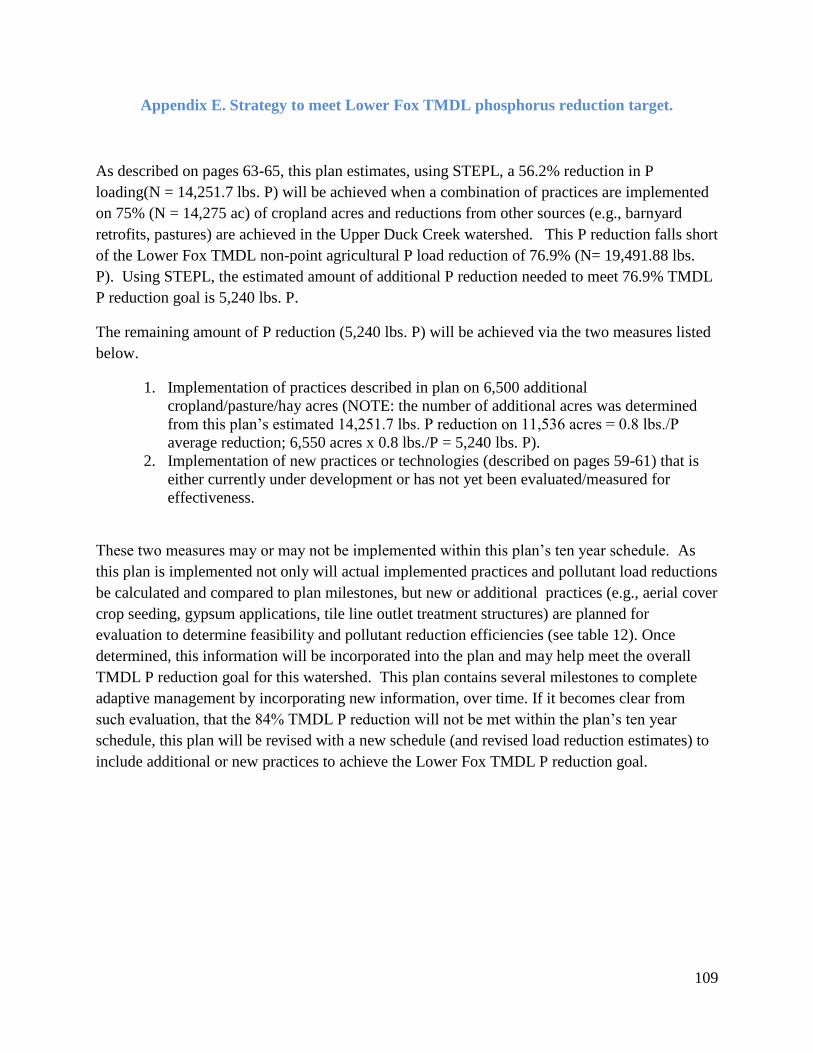
109
Appendix E. Strategy to meet Lower Fox TMDL phosphorus reduction target.
As described on pages 63-65, this plan estimates, using STEPL, a 56.2% reduction in P
loading(N = 14,251.7 lbs. P) will be achieved when a combination of practices are implemented
on 75% (N = 14,275 ac) of cropland acres and reductions from other sources (e.g., barnyard
retrofits, pastures) are achieved in the Upper Duck Creek watershed. This P reduction falls short
of the Lower Fox TMDL non-point agricultural P load reduction of 76.9% (N= 19,491.88 lbs.
P). Using STEPL, the estimated amount of additional P reduction needed to meet 76.9% TMDL
P reduction goal is 5,240 lbs. P.
The remaining amount of P reduction (5,240 lbs. P) will be achieved via the two measures listed
below.
1. Implementation of practices described in plan on 6,500 additional
cropland/pasture/hay acres (NOTE: the number of additional acres was determined
from this plan’s estimated 14,251.7 lbs. P reduction on 11,536 acres = 0.8 lbs./P
average reduction; 6,550 acres x 0.8 lbs./P = 5,240 lbs. P).
2. Implementation of new practices or technologies (described on pages 59-61) that is
either currently under development or has not yet been evaluated/measured for
effectiveness.
These two measures may or may not be implemented within this plan’s ten year schedule. As
this plan is implemented not only will actual implemented practices and pollutant load reductions
be calculated and compared to plan milestones, but new or additional practices (e.g., aerial cover
crop seeding, gypsum applications, tile line outlet treatment structures) are planned for
evaluation to determine feasibility and pollutant reduction efficiencies (see table 12). Once
determined, this information will be incorporated into the plan and may help meet the overall
TMDL P reduction goal for this watershed. This plan contains several milestones to complete
adaptive management by incorporating new information, over time. If it becomes clear from
such evaluation, that the 84% TMDL P reduction will not be met within the plan’s ten year
schedule, this plan will be revised with a new schedule (and revised load reduction estimates) to
include additional or new practices to achieve the Lower Fox TMDL P reduction goal.

110