Embed Size (px)
Citation preview
T e c h n i c a l R e p o r t
Upper Yuba River Watershed Chinook Salmon and Steelhead
Habitat Assessment
Prepared for
California Department of Water Resources
November 2007
Prepared by
Upper Yuba River Studies Program Study Team
T e c h n i c a l R e p o r t
Upper Yuba River Watershed Chinook Salmon and Steelhead
Habitat Assessment
Submitted to
California Department of Water Resources
November 2007
Prepared by
Upper Yuba River Studies Program Study Team
Contents
Chapter Page Acronyms and Abbreviations ........................................................................................................vii
Executive Summary...................................................................................................................... ES-1
1. Introduction.................................................................................................................................. 1-1 1.1 Background ................................................................................................................. 1-1
1.1.1 Scope and Background of the Habitat Analysis..................................... 1-1 1.1.2 Document Purpose ..................................................................................... 1-2
1.2 Watershed and Study Area ....................................................................................... 1-3 1.3 Species and Habitat Requirements .......................................................................... 1-4
1.3.1 Life History.................................................................................................. 1-4 1.3.2 Key Habitat Requirements ........................................................................ 1-6
2. Analysis Approach ...................................................................................................................... 2-1
3. Habitat Analysis: Current Water Operations (2004) ............................................................. 3-1 3.1 Thermally Suitable Reaches ...................................................................................... 3-1
3.1.1 Spring-run Chinook Salmon ..................................................................... 3-1 3.1.2 Steelhead ...................................................................................................... 3-7 3.1.3 Fall-run Chinook Salmon ........................................................................ 3-10
3.2 Number of Chinook Salmon and Steelhead Redds ............................................. 3-11 3.2.1 Spring-run Chinook Salmon ................................................................... 3-11 3.2.2 Steelhead .................................................................................................... 3-13 3.2.3 Fall-run Chinook Salmon ........................................................................ 3-15
3.3 Integration of Habitat Analyses for Other Life Stages ........................................ 3-15 3.3.1 Adult Upstream Migration ..................................................................... 3-15 3.3.2 Adult Holding........................................................................................... 3-16 3.3.3 Fry and Juvenile Rearing ......................................................................... 3-17
4. Habitat Analysis: Increased Flows........................................................................................... 4-1 4.1 Thermally Suitable Reaches ...................................................................................... 4-1
4.1.1 Spring-run Chinook Salmon ..................................................................... 4-1 4.1.2 Steelhead ...................................................................................................... 4-4 4.1.3 Fall-run Chinook Salmon .......................................................................... 4-6
4.2 Number of Chinook Salmon and Steelhead Redds ............................................... 4-6 4.2.1 Spring-run Chinook Salmon ..................................................................... 4-7 4.2.2 Steelhead ...................................................................................................... 4-9 4.2.3 Fall-run Chinook Salmon ........................................................................ 4-11
4.3 Integration of Habitat Analyses for Other Life Stages ........................................ 4-11 4.3.1 Adult Upstream Migration ..................................................................... 4-11 4.3.2 Adult Holding........................................................................................... 4-11 4.3.3 Fry and Juvenile Rearing ......................................................................... 4-12
iii
0BCONTENTS
5. Additional Considerations.........................................................................................................5-1 5.1 Water Temperature Modeling...................................................................................5-1
5.1.1 Variation in Meteorological Conditions...................................................5-1 5.1.2 Boundary Conditions for Increased Flow Scenarios..............................5-4 5.1.3 Water Temperatures in the South Yuba River ........................................5-4 5.1.4 Range of Suitable Water Temperatures ...................................................5-6
5.2 Flows Required to Overcome Passage Barriers ......................................................5-7 5.3 Rearing Habitat ...........................................................................................................5-7
5.3.1 Spring-run Chinook Salmon......................................................................5-7 5.3.2 Steelhead.......................................................................................................5-7
5.4 Populations Supported in Other Central Valley Streams .....................................5-8
6. Conclusion.....................................................................................................................................6-1
7. References......................................................................................................................................7-1
Appendixes A Water Temperature Modeling B Upper Yuba River Water Temperature Criteria of Chinook Salmon and Steelhead C Assessment of Adult Anadromous Salmonid Migration Barriers and Holding
Habitats in the Upper Yuba River D Spawning Habitats Evaluation E Upper Yuba River Chinook Salmon and Steelhead Rearing Habitat Assessment) F Water Temperature Monitoring G Middle and South Yuba Rainbow Trout (Oncorhynchus mykiss) Distribution and
Abundance Dive Counts August 2004
Table 2-1 Recommended Temperatures for Spring-run Chinook Salmon and Steelhead in the
Upper Yuba River Basin
Figures 1-1 Upper Yuba River Watershed and Study Area 1-2 Generalized Salmonid Life Cycle
2-1 Flow Chart Depicting the Systematic Approach to Evaluation of Habitat Suitability and Population Size
2-2 Observed Water Temperatures in the Middle Yuba River (2004) Compared to Water Temperature Tolerance of Holding Adult Spring-run Chinook Salmon
2-3 Predicted Water Temperatures in the Middle Yuba River Compared to Water Temperature Tolerance of Holding Adult Spring-run Chinook Salmon
3-1 Average Water Temperatures and Flow During the Adult Spring-run Chinook Salmon Migration Period in the Middle Yuba River Under Current Operations (2004)
3-2 Average Water Temperatures and Flow During the Adult Spring-run Chinook Salmon Migration Period in the South Yuba River Under Current Operations (2004)
3-3 Average Water Temperatures During the Adult Spring-run Chinook Salmon Holding Period in the Middle Yuba River Under Current Operations (2004)
iv
0BCONTENTS
3-4 River Reaches with Suitable Water Temperatures for Adult Spring-run Chinook Salmon Holding in the Middle and South Yuba Rivers Under Current Operations (2004)
3-5 River Reaches with Suitable Water Temperatures for Spring-run Chinook Salmon Spawning and Incubation in the Middle and South Yuba Rivers Under Current Operations (2004)
3-6 Average Water Temperatures During the Spring-run Chinook Salmon Rearing Period in the Middle Yuba River Under Current Operations (2004)
3-7 Average Water Temperatures During the Spring-run Chinook Salmon Rearing Period in the South Yuba River Under Current Operations (2004)
3-8 River Reaches with Suitable Water Temperatures for Spring-run Chinook Salmon Summer Rearing in the Middle and South Yuba Rivers Under Current Operations (2004)
3-9 River Reaches with Suitable Water Temperatures for Steelhead Spawning and Incubation in the Middle and South Yuba Rivers Under Current Operations (2004)
3-10 Average Water Temperatures During the Steelhead Rearing Period in the Middle Yuba River Under Current Operations (2004)
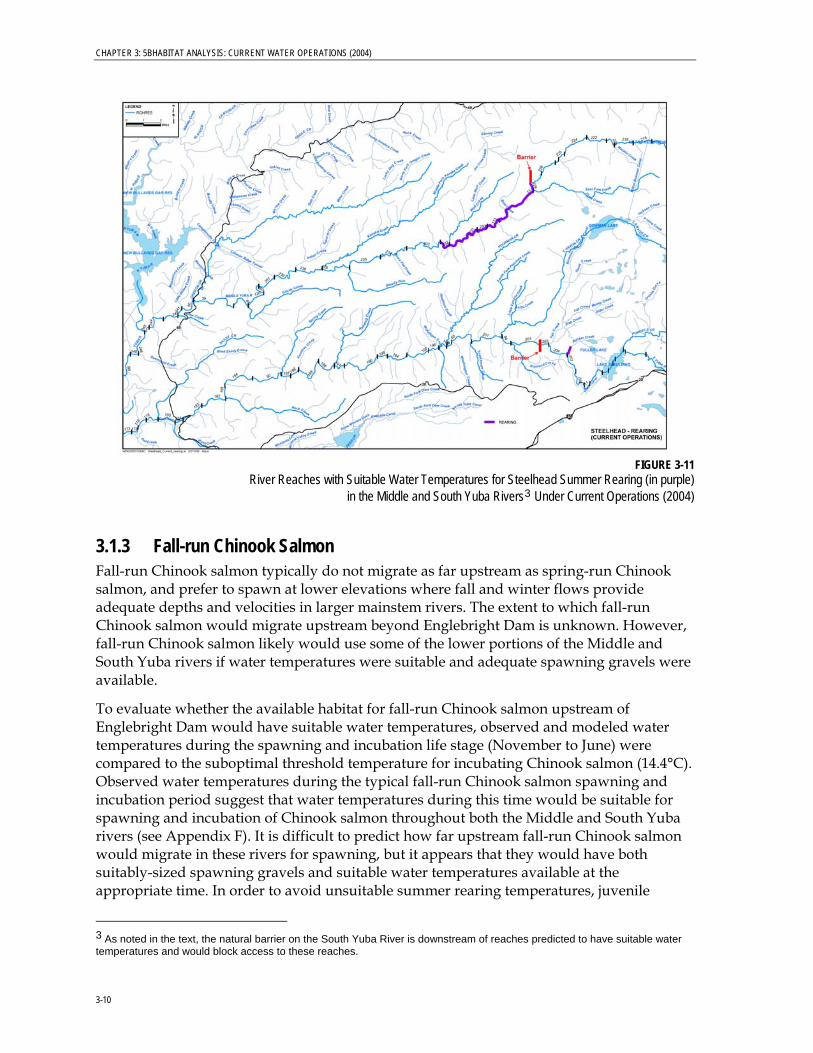
3-11 River Reaches with Suitable Water Temperatures for Steelhead Summer Rearing in the Middle and South Yuba Rivers Under Current Operations (2004)
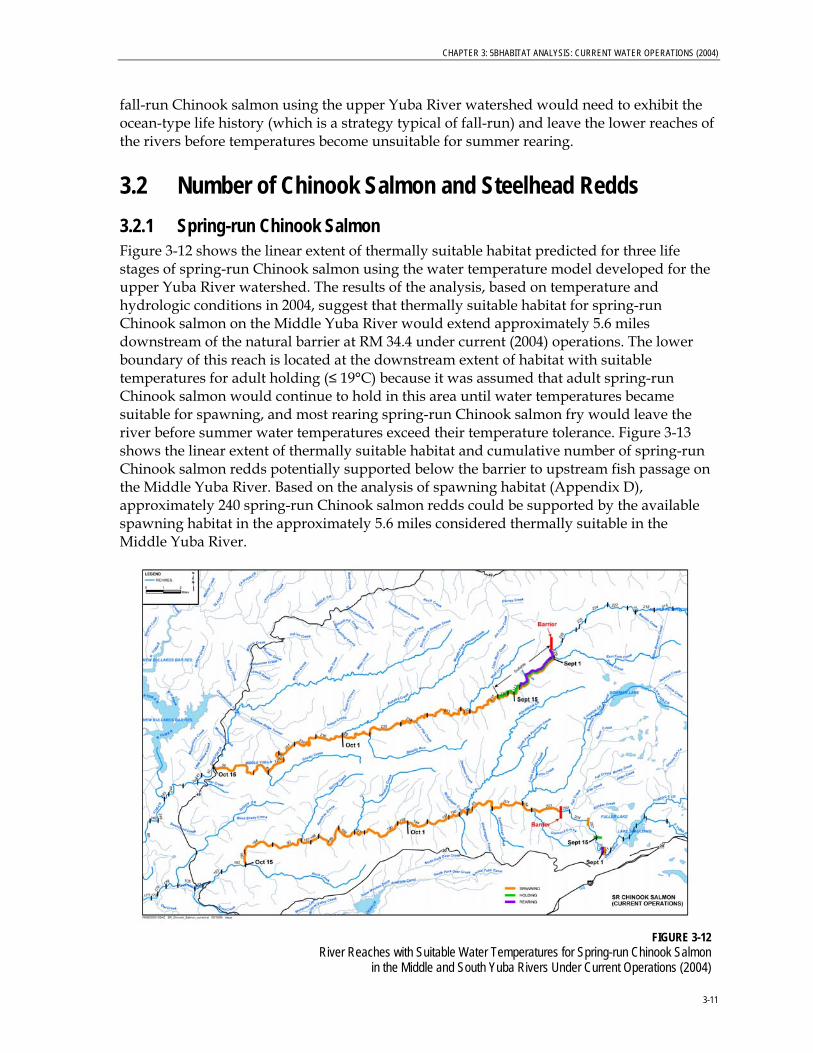
3-12 River Reaches with Suitable Water Temperatures for Spring-run Chinook Salmon in the Middle and South Yuba Rivers Under Current Operations (2004)
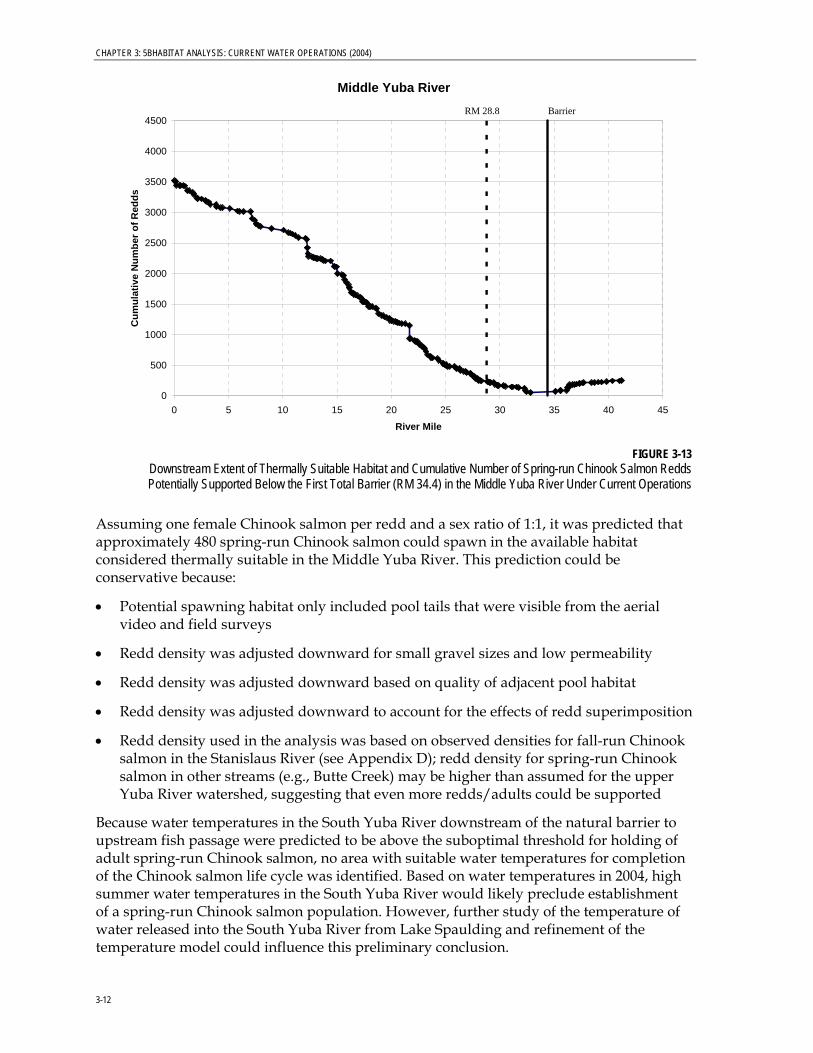
3-13 Downstream Extent of Thermally Suitable Habitat and Cumulative Number of Spring-run Chinook Salmon Redds Potentially Supported Below the First Total Barrier (RM 34.4) in the Middle Yuba River Under Current Operations (2004)
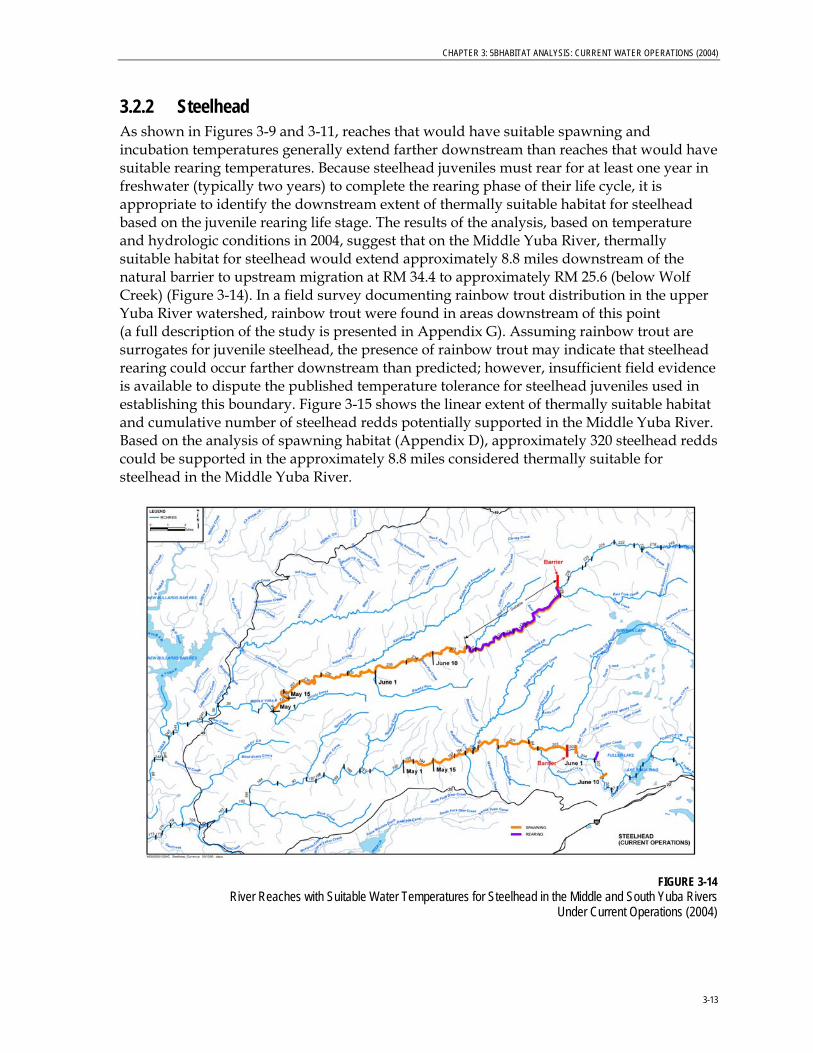
3-14 River Reaches with Suitable Water Temperatures for Steelhead in the Middle and South Yuba Rivers Under Current Operations (2004)
3-15 Downstream Extent of Thermally Suitable Habitat and Cumulative Number of Steelhead Redds Potentially Supported Below the First Total Barrier (RM 34.4) in the Middle Yuba River Under Current Operations (2004)
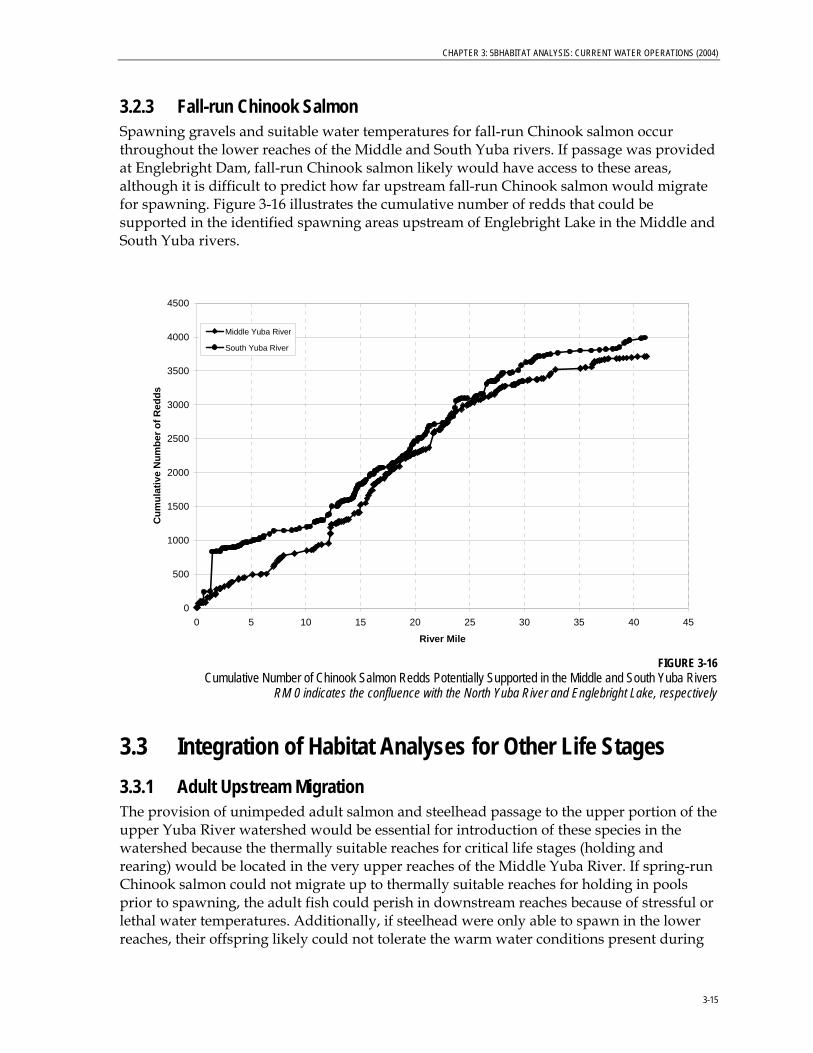
3-16 Cumulative Number of Chinook Salmon Redds Potentially Supported in the Middle and South Yuba Rivers
3-17 Predicted Summer Rearing Capacity of Spring-run Chinook Salmon Fry (age 0+) in Thermally Suitable Reaches of the Middle Yuba River Under Current (2004) and Increased Flows
3-18 Predicted Summer Rearing Capacity of Age 0+ Steelhead in Thermally Suitable Reaches of the Middle Yuba River Under Current (2004) and Increased Flows
3-19 Predicted Summer Rearing Capacity of Age 1+ and Older Steelhead in Thermally Suitable Reaches of the Middle Yuba River Under Current (2004) and Increased Flows
4-1 River Reaches with Suitable Water Temperatures for Adult Spring-run Chinook Salmon Holding in the Middle Yuba River Predicted with Increased Flows (50 cfs)
4-2 River Reaches with Suitable Water Temperatures for Spring-run Chinook Salmon Spawning and Incubation (in orange) in the Middle Yuba River Predicted with Increased Flows (50 cfs)
4-3 River Reaches with Suitable Water Temperatures for Spring-run Chinook Salmon Summer Rearing in the Middle Yuba River Predicted with Increased Flows (50 cfs)
4-4 River Reaches with Suitable Water Temperatures for Steelhead Spawning and Incubation in the Middle Yuba River Predicted with Increased Flows (50 cfs)
v
0BCONTENTS
vi
4-5 River Reaches with Suitable Water Temperatures for Steelhead Summer Rearing in the Middle Yuba River Predicted with Increased Flows (50 cfs)
4-6 River Reaches with Suitable Water Temperatures for Spring-run Chinook Salmon in the Middle Yuba River Predicted with Increased Flows (50 cfs)
4-7 Downstream Extent of Thermally Suitable Habitat and Cumulative Number of Spring-run Chinook Salmon Redds Potentially Supported Below the First Total Barrier (RM 34.4) in the Middle Yuba River Predicted with Increased Flow (50 cfs)
4-8 River Reaches with Suitable Water Temperatures for Steelhead in the Middle Yuba River Predicted with Increased Flows (50 cfs)
4-9 Downstream Extent of Thermally Suitable Habitat and Cumulative Number of Steelhead Redds Potentially Supported Below the First Total Barrier (RM 34.4) in the Middle Yuba River Predicted with Increased Flow (50 cfs)
5-1 Observed Water Temperatures in the Middle Yuba River Below Wolf Creek 5-2 Observed Water Temperatures in the South Yuba River Below Poorman Creek 5-3 Comparison of Predicted Water Temperatures in the Middle Yuba River Below Wolf
Creek Using 2003 and 2004 Met Data with 2004 Hydrology 5-4 River Reaches with Suitable Water Temperatures for Spring-run Chinook Salmon in
the Middle Yuba River Predicted Using 2003 Met Data 5-5 River Reaches with Suitable Water Temperatures for Steelhead in the Middle Yuba
River Predicted Using 2003 Met Data 5-6 Historical Run Size of Spring-run Chinook Salmon in Deer Creek Compared to the
Potential Number of Spawners in the Middle Yuba River 5-7 Historical Run Size of Spring-run Chinook Salmon in Mill Creek Compared to the
Potential Number of Spawners in the Middle Yuba River 5-8 Historical Run Size of Spring-run Chinook Salmon in Butte Creek Compared to the
Potential Number of Spawners in the Middle Yuba River
Acronyms and Abbreviations
°C degrees Celsius
Authority California Bay Delta Authority
cfs cubic feet per second
DWR Department of Water Resources
ERP Ecosystem Restoration Program
met data meteorological data
UYRSP Upper Yuba River Studies Program
Work Group Upper Yuba River Studies Program stakeholder work group
vii
Executive Summary
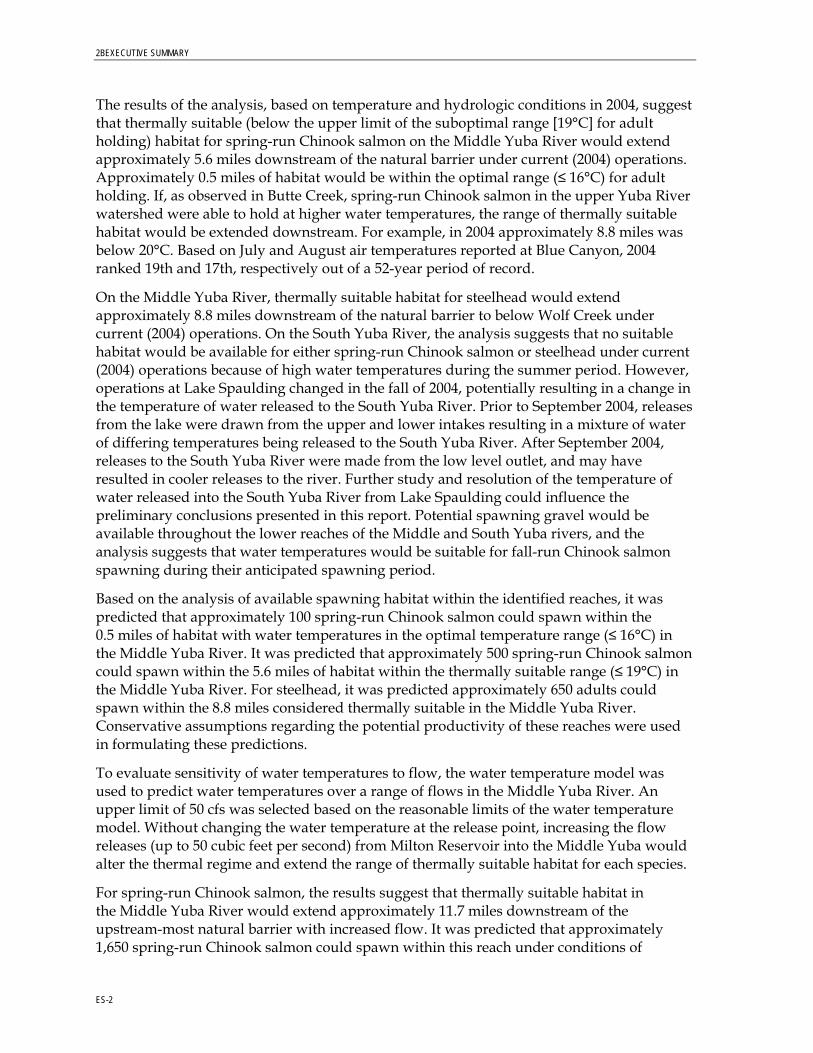
The Upper Yuba River Studies Program seeks to determine whether the introduction of wild Chinook salmon and steelhead to the upper Yuba River watershed is biologically, environmentally, and socio-economically feasible over the long term. In recognition that numerous factors will contribute to an ultimate determination of overall feasibility, the Upper Yuba Studies Program established and initiated a comprehensive study plan to evaluate the various aspects of feasibility, including factors related to habitat, water supply and hydropower, flood risk, water quality, sediment transport, and socio-economics. Studies associated with each of these issue areas were initiated simultaneously and conducted in parallel under the assumption that the upper Yuba River watershed contained habitat capable of supporting those fish species.
In 2003, results of field studies conducted in the upper Yuba River watershed as part of the study plan suggested that water temperatures could be sufficiently high to prevent or limit the use of the Middle and South Yuba rivers by Chinook salmon and steelhead, thereby potentially making introduction of those species infeasible. Based on this observation, continuation of other aspects of feasibility such as fish passage and socio-economic factors was postponed until additional focused analyses of water temperature and fish habitat could be conducted to determine whether there was sufficient habitat to warrant moving forward with the next steps in the overall evaluation.
The focused evaluation of habitat and temperature relied on habitat information collected as part of field studies in the Middle and South Yuba rivers, and generally available information on salmon and steelhead water temperature requirements and life history combined with the results of water temperature monitoring and modeling of the Middle and South Yuba rivers. The analysis narrowly focused on the capability of the habitat in the upper portion of these rivers to support fish under current operations, and assumed for the purpose of the analysis that fish would have unimpeded access to these areas. In addition to the evaluation of habitat and thermal conditions under current operations, the influence of increased flow on water temperatures was evaluated to provide an indication of how responsive habitat conditions might be to changes in flow. The capability of the habitat to support populations of salmon or steelhead was assessed by identifying the amount of potentially suitable habitat and developing rough predictions of the number of fish those areas could possibly support. To provide context, the predictions were compared to other streams that currently support self-sustaining populations of Chinook salmon and steelhead.
To define the extent of thermally suitable habitat, water temperatures recorded during the water temperature monitoring program were compared to the water temperature tolerances of the various life stages of Chinook salmon and steelhead. To better define the downstream extent of thermally suitable habitat, a water temperature model was developed for the upper Yuba River watershed and used to predict water temperatures at intermediate points between the widely spaced monitoring locations. The results for each life stage were integrated to identify the extent of each river that had the capability to support each species by providing both physical habitat and water temperatures suitable for completion of the species’ life cycle.
ES-1
2BEXECUTIVE SUMMARY
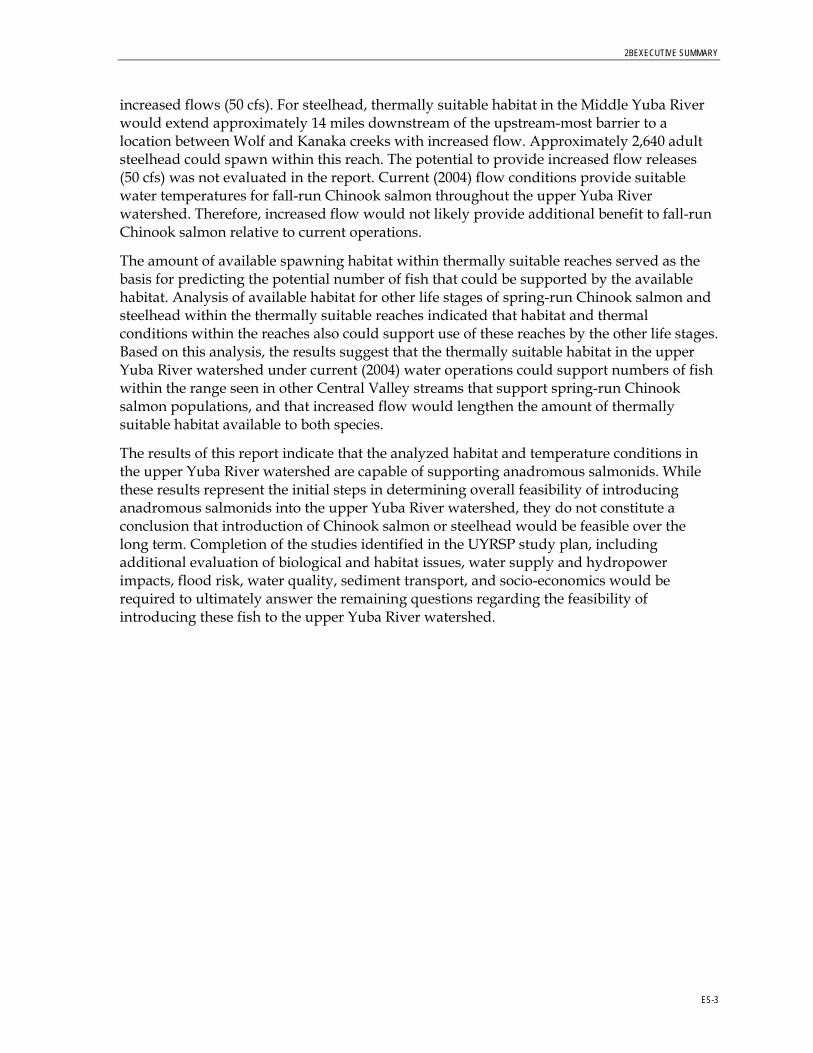
The results of the analysis, based on temperature and hydrologic conditions in 2004, suggest that thermally suitable (below the upper limit of the suboptimal range [19°C] for adult holding) habitat for spring-run Chinook salmon on the Middle Yuba River would extend approximately 5.6 miles downstream of the natural barrier under current (2004) operations. Approximately 0.5 miles of habitat would be within the optimal range (≤ 16°C) for adult holding. If, as observed in Butte Creek, spring-run Chinook salmon in the upper Yuba River watershed were able to hold at higher water temperatures, the range of thermally suitable habitat would be extended downstream. For example, in 2004 approximately 8.8 miles was below 20°C. Based on July and August air temperatures reported at Blue Canyon, 2004 ranked 19th and 17th, respectively out of a 52-year period of record.
On the Middle Yuba River, thermally suitable habitat for steelhead would extend approximately 8.8 miles downstream of the natural barrier to below Wolf Creek under current (2004) operations. On the South Yuba River, the analysis suggests that no suitable habitat would be available for either spring-run Chinook salmon or steelhead under current (2004) operations because of high water temperatures during the summer period. However, operations at Lake Spaulding changed in the fall of 2004, potentially resulting in a change in the temperature of water released to the South Yuba River. Prior to September 2004, releases from the lake were drawn from the upper and lower intakes resulting in a mixture of water of differing temperatures being released to the South Yuba River. After September 2004, releases to the South Yuba River were made from the low level outlet, and may have resulted in cooler releases to the river. Further study and resolution of the temperature of water released into the South Yuba River from Lake Spaulding could influence the preliminary conclusions presented in this report. Potential spawning gravel would be available throughout the lower reaches of the Middle and South Yuba rivers, and the analysis suggests that water temperatures would be suitable for fall-run Chinook salmon spawning during their anticipated spawning period.
Based on the analysis of available spawning habitat within the identified reaches, it was predicted that approximately 100 spring-run Chinook salmon could spawn within the 0.5 miles of habitat with water temperatures in the optimal temperature range (≤ 16°C) in the Middle Yuba River. It was predicted that approximately 500 spring-run Chinook salmon could spawn within the 5.6 miles of habitat within the thermally suitable range (≤ 19°C) in the Middle Yuba River. For steelhead, it was predicted approximately 650 adults could spawn within the 8.8 miles considered thermally suitable in the Middle Yuba River. Conservative assumptions regarding the potential productivity of these reaches were used in formulating these predictions.
To evaluate sensitivity of water temperatures to flow, the water temperature model was used to predict water temperatures over a range of flows in the Middle Yuba River. An upper limit of 50 cfs was selected based on the reasonable limits of the water temperature model. Without changing the water temperature at the release point, increasing the flow releases (up to 50 cubic feet per second) from Milton Reservoir into the Middle Yuba would alter the thermal regime and extend the range of thermally suitable habitat for each species.
For spring-run Chinook salmon, the results suggest that thermally suitable habitat in the Middle Yuba River would extend approximately 11.7 miles downstream of the upstream-most natural barrier with increased flow. It was predicted that approximately 1,650 spring-run Chinook salmon could spawn within this reach under conditions of
ES-2
2BEXECUTIVE SUMMARY
ES-3
increased flows (50 cfs). For steelhead, thermally suitable habitat in the Middle Yuba River would extend approximately 14 miles downstream of the upstream-most barrier to a location between Wolf and Kanaka creeks with increased flow. Approximately 2,640 adult steelhead could spawn within this reach. The potential to provide increased flow releases (50 cfs) was not evaluated in the report. Current (2004) flow conditions provide suitable water temperatures for fall-run Chinook salmon throughout the upper Yuba River watershed. Therefore, increased flow would not likely provide additional benefit to fall-run Chinook salmon relative to current operations.
The amount of available spawning habitat within thermally suitable reaches served as the basis for predicting the potential number of fish that could be supported by the available habitat. Analysis of available habitat for other life stages of spring-run Chinook salmon and steelhead within the thermally suitable reaches indicated that habitat and thermal conditions within the reaches also could support use of these reaches by the other life stages. Based on this analysis, the results suggest that the thermally suitable habitat in the upper Yuba River watershed under current (2004) water operations could support numbers of fish within the range seen in other Central Valley streams that support spring-run Chinook salmon populations, and that increased flow would lengthen the amount of thermally suitable habitat available to both species.
The results of this report indicate that the analyzed habitat and temperature conditions in the upper Yuba River watershed are capable of supporting anadromous salmonids. While these results represent the initial steps in determining overall feasibility of introducing anadromous salmonids into the upper Yuba River watershed, they do not constitute a conclusion that introduction of Chinook salmon or steelhead would be feasible over the long term. Completion of the studies identified in the UYRSP study plan, including additional evaluation of biological and habitat issues, water supply and hydropower impacts, flood risk, water quality, sediment transport, and socio-economics would be required to ultimately answer the remaining questions regarding the feasibility of introducing these fish to the upper Yuba River watershed.
CHAPTER 1
Introduction
1.1 Background The California Bay Delta Authority (Authority), formerly known as the CALFED Ecosystem Restoration Program (ERP), is mandated to maintain, improve, and increase aquatic and terrestrial habitats and improve ecological functions in the Bay-Delta to support sustainable populations of diverse and valuable plant and animal species. Specific goals of the Authority include recovering at-risk native species in the Bay-Delta and the watershed above the estuary; rehabilitating natural processes related to hydrology, stream channels, sediment, floodplains, and ecosystem water quality; and improving and maintaining water and sediment quality to better support ecosystem health and allow species to flourish.
The Upper Yuba River Studies Program (UYRSP) began in 1998 and evolved as a collaborative effort between local stakeholders and the Authority “to determine if the introduction of wild Chinook salmon and steelhead to the upper Yuba River watershed is biologically, environmentally, and socioeconomically feasible over the long term.” Providing Chinook salmon and steelhead access to potential habitat in the reaches of the upper Yuba River that are currently blocked by Englebright Dam would potentially contribute to achieving the Authority’s environmental goals.
The 55-member stakeholder work group (Work Group) represents local water, business, and environmental interests, and includes the state and federal resource agencies that comprise CALFED. The Work Group identified six study areas as critical to answering the feasibility question: (1) upstream and downstream habitat; (2) sediment; (3) water quality; (4) water supply and hydropower; (5) socioeconomics; and (6) flood management. The Department of Water Resources (DWR), with the support of the Work Group, contracted a study team composed of technical consultants led by CH2M HILL to investigate each of the technical study areas.
The desired outcome of the UYRSP is a recommendation by the Work Group to the Authority regarding the feasibility of introducing wild Chinook salmon and steelhead into the upper Yuba River watershed.
1.1.1 Scope and Background of the Habitat Analysis During 2003, existing conditions in the watershed were characterized for each of the technical study areas, including fish habitat. The results of this initial characterization were presented in an interim report (DWR, 2003) that was reviewed by the Work Group and members of a Technical Review Panel convened by CALFED, which was composed of scientists and experts in the technical disciplines covered under the UYRSP. The results of field studies conducted in the upper Yuba River watershed as part of the study plan suggested that water temperatures could be sufficiently high to prevent or limit the use of the Middle and South Yuba rivers by Chinook salmon and steelhead, thereby potentially making introduction of those species infeasible.
1-1
CHAPTER 1: 3BINTRODUCTION
Based on this observation, and with guidance from the Technical Review Panel, continuation of other aspects of feasibility, such as fish passage and socio-economic factors, was postponed until additional focused analyses of water temperature and fish habitat could be conducted to determine whether there was sufficient habitat to warrant moving forward with the next steps in the overall evaluation. The focused evaluation of habitat and temperature relied on habitat information collected as part of field studies in the Middle and South Yuba rivers, generally available information on salmon and steelhead water temperature requirements and life history, and the results of water temperature monitoring and modeling of the Middle and South Yuba rivers. The analysis was narrowly focused on the capability of the habitat in the upper portion of these rivers to support Chinook salmon and steelhead under current operations, and assumed for the purpose of the analysis that fish would have unimpeded access to those areas. The uppermost natural barriers on the Middle and South Yuba rivers were used to define the upstream boundary of fish access.
The capability of the habitat to support populations of salmon or steelhead was assessed by identifying the amount of potentially suitable habitat and developing rough predictions of the number of fish those areas could possibly support. To provide context, the predictions were compared to other streams that currently support self-sustaining populations of Chinook salmon and steelhead.
To aid in the analysis, a planning-level water temperature model was developed for the Middle and South Yuba rivers and calibrated using data from 2004. A description of the water temperature model is presented in Appendix A. The model allowed an assessment of the relationship between water flow and water temperature to determine whether increased flows from Milton Reservoir would have a significant effect on water temperatures and the availability and suitability of habitat for Chinook salmon and steelhead in the Middle Yuba River.
1.1.2 Document Purpose This document presents the results of data collection, field studies, and modeling conducted by the study team to characterize current habitat conditions in the upper Yuba River watershed and assesses whether the available habitat upstream of Englebright Dam is capable of supporting Chinook salmon and steelhead. The objectives of this document are to:
• Convey the results of additional habitat analyses in the watershed (based on review of the literature and study results) to the Work Group
• Provide technical background on the methods, analyses, and results of the studies that were conducted on habitat elements for Chinook salmon and steelhead
• Convey results on the extent of thermally suitable habitat (i.e., reaches of the river that contain suitable water temperatures) available for Chinook salmon and steelhead in the upper Yuba River watershed under current water operations
• Integrate the results of the habitat technical studies to assess the capability of the habitat to support salmon or steelhead and develop rough predictions of the number of fish those areas could possibly support.
1-2
CHAPTER 1: 3BINTRODUCTION
• Evaluate the influence of increased flows on the amount of thermally suitable habitat for Chinook salmon and steelhead in the upper Yuba River watershed
• Provide the technical basis from which the Work Group could determine whether moving forward with the next steps in the evaluation is justified
This report presents the most current information available on existing conditions in the upper Yuba River watershed. Determining the extent and quality of habitat potentially available to Chinook salmon and steelhead required synthesis and interpretation of field data, information from the scientific literature and modeling results. The determination of whether the available habitat is capable of supporting Chinook salmon and steelhead under existing watershed conditions reflects the consensus of the habitat study team.
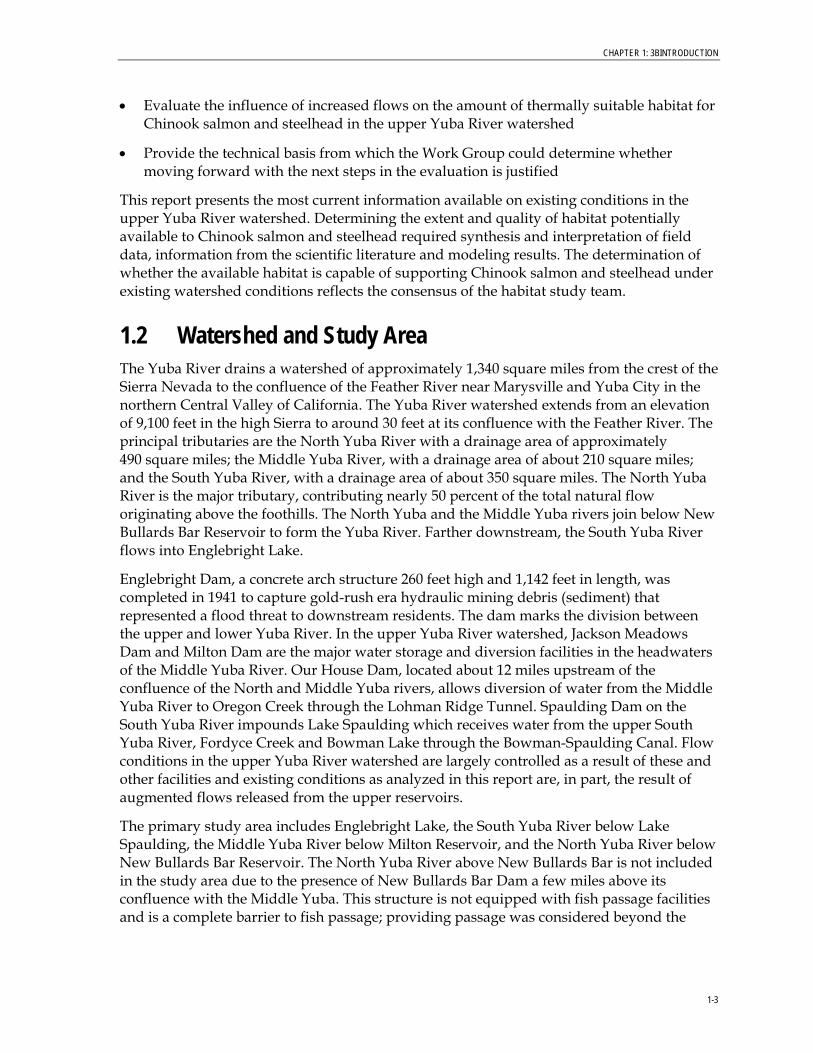
1.2 Watershed and Study Area The Yuba River drains a watershed of approximately 1,340 square miles from the crest of the Sierra Nevada to the confluence of the Feather River near Marysville and Yuba City in the northern Central Valley of California. The Yuba River watershed extends from an elevation of 9,100 feet in the high Sierra to around 30 feet at its confluence with the Feather River. The principal tributaries are the North Yuba River with a drainage area of approximately 490 square miles; the Middle Yuba River, with a drainage area of about 210 square miles; and the South Yuba River, with a drainage area of about 350 square miles. The North Yuba River is the major tributary, contributing nearly 50 percent of the total natural flow originating above the foothills. The North Yuba and the Middle Yuba rivers join below New Bullards Bar Reservoir to form the Yuba River. Farther downstream, the South Yuba River flows into Englebright Lake.
Englebright Dam, a concrete arch structure 260 feet high and 1,142 feet in length, was completed in 1941 to capture gold-rush era hydraulic mining debris (sediment) that represented a flood threat to downstream residents. The dam marks the division between the upper and lower Yuba River. In the upper Yuba River watershed, Jackson Meadows Dam and Milton Dam are the major water storage and diversion facilities in the headwaters of the Middle Yuba River. Our House Dam, located about 12 miles upstream of the confluence of the North and Middle Yuba rivers, allows diversion of water from the Middle Yuba River to Oregon Creek through the Lohman Ridge Tunnel. Spaulding Dam on the South Yuba River impounds Lake Spaulding which receives water from the upper South Yuba River, Fordyce Creek and Bowman Lake through the Bowman-Spaulding Canal. Flow conditions in the upper Yuba River watershed are largely controlled as a result of these and other facilities and existing conditions as analyzed in this report are, in part, the result of augmented flows released from the upper reservoirs.
The primary study area includes Englebright Lake, the South Yuba River below Lake Spaulding, the Middle Yuba River below Milton Reservoir, and the North Yuba River below New Bullards Bar Reservoir. The North Yuba River above New Bullards Bar is not included in the study area due to the presence of New Bullards Bar Dam a few miles above its confluence with the Middle Yuba. This structure is not equipped with fish passage facilities and is a complete barrier to fish passage; providing passage was considered beyond the
1-3
CHAPTER 1: 3BINTRODUCTION
scope of the feasibility analysis. The upper Yuba River watershed, including the study area is depicted in Figure 1-1.
FIGURE 1-1
Upper Yuba River Watershed and Study Area
1.3 Species and Habitat Requirements All species require specific physical and biological conditions in order to survive and reproduce. Collectively, these conditions are considered “habitat.” Often, throughout the year and over time, these conditions change as a result of fluctuations in flow, local weather, and regional climate. Required habitat elements also change over the life cycle of the species, with different life history stages requiring different habitats. For species to complete their life cycle (i.e., survive and successfully reproduce), there must be adequate habitat for all life stages. A lack of required habitat elements for even one life-stage can preclude a species from completing its life cycle and, ultimately, threaten survival of the population.
For the introduction of Chinook salmon and steelhead into the upper Yuba River to be biologically feasible, suitable habitat conditions must exist for each fresh water life-history stage, leading to successful completion of each species’ life cycle. This section summarizes the life histories of Chinook salmon and steelhead and describes the general physical habitat requirements for each species’ freshwater life stage.
1.3.1 Life History Chinook salmon and steelhead spend most of their lives in the ocean and migrate to freshwater to spawn. This type of life history is termed “anadromous.” Chinook salmon and
1-4
CHAPTER 1: 3BINTRODUCTION
steelhead belong to the family Salmonidae (members of which are referred to as “salmonids”); hence, Chinook salmon and steelhead are considered anadromous salmonids. Only the freshwater portion of Chinook salmon and steelhead life histories are described in detail below.
Chinook Salmon Races (also called “runs”) of Chinook salmon are designated by the time of year that adults migrate into the river. The Sacramento River basin contains four distinct runs of Chinook salmon: fall, late-fall, winter, and spring. The Yuba River, a sub-watershed in the Sacramento River basin, historically supported both fall-run and spring-run Chinook salmon. Access to the areas historically available to spring-run Chinook salmon in the Yuba River has been blocked by Englebright Dam. Currently, Chinook salmon return to the lower Yuba River at times characteristic of both fall-run and spring-run fish.
Chinook salmon have diverse life histories that are highly variable among races and geography. Fall-run Chinook salmon return to their natal streams in the fall, a few days or weeks before spawning. Spring-run Chinook salmon return to their natal streams in the spring and early summer, several months prior to spawning, and “hold” over the summer in deep pools before spawning in the late summer and fall. Spring-run Chinook salmon typically migrate into the upper reaches of a watershed, whereas fall-run Chinook salmon typically use the lower elevation reaches.
Chinook salmon do not feed following entry into freshwater or during their spawning migration. Spawning takes place in nests or “redds,” which are constructed by females of the species in riffle areas, typically at the tail (downstream) end of pools. Eggs are deposited, fertilized, and covered with loose clean gravel. The developing eggs remain in the redds until hatching. Newly hatched alevin (fry with a yolk sac) emerge from the substrate, finish absorbing the remaining yolk sac, and disperse in the river. During a period of active feeding and growth, the fry continue to disperse, and settle into slower moving rearing habitats along the stream margin. Fall-run Chinook salmon in the Central Valley of California generally are “ocean-type” populations, migrating to ocean during the first year of life, often within three months after emergence. Spring-run Chinook salmon in the Central Valley are typically “stream-type” populations, spending several months in freshwater before migrating to the ocean as yearlings, although some young spring-run Chinook migrate shortly after hatching. For all races of Chinook salmon, adults die shortly after spawning.
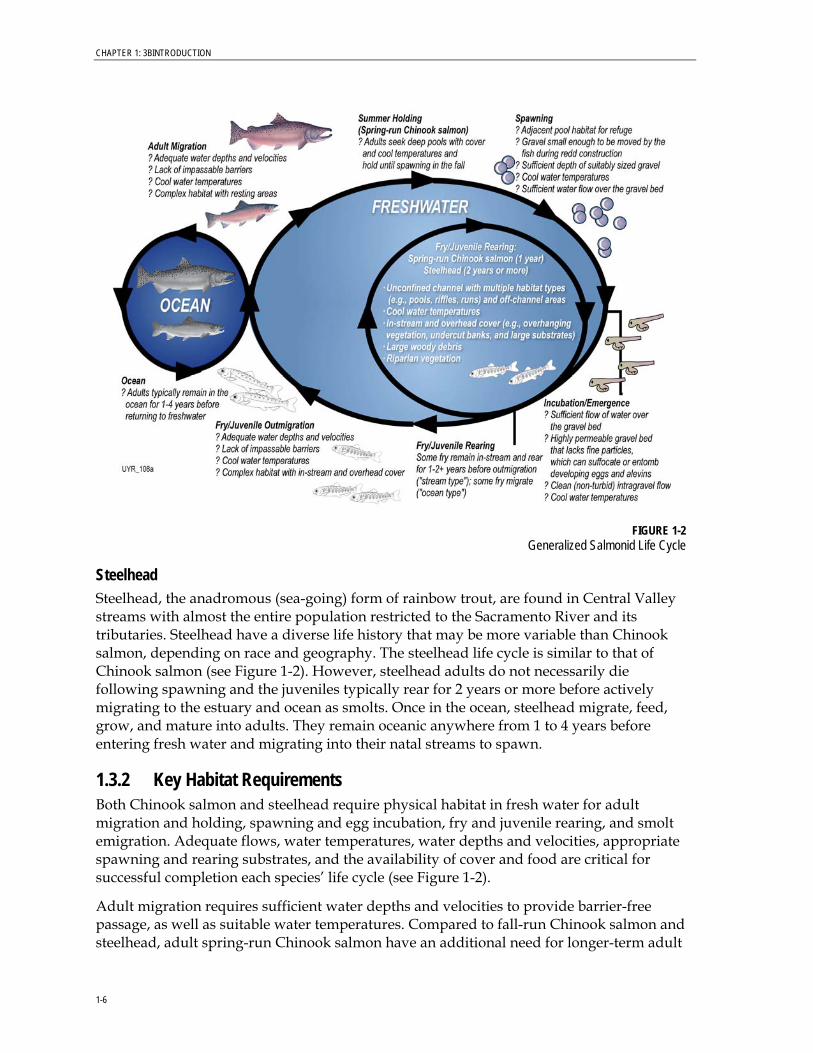
Following several weeks or months of rearing, larger-sized juveniles begin an active emigration (i.e., downstream migration) and eventually enter estuaries as smolts (juveniles physiologically adapted for life in saltwater). Fall-run Chinook salmon smolts from the Sacramento River basin generally spend up to 2 months in the freshwater portion of the Sacramento-San Joaquin Delta estuary before migrating into the saltwater portion of the estuary and ocean. Once in the ocean, Chinook salmon migrate, feed, grow, and mature into adults, remaining oceanic for 2 to 4 years or more before entering fresh water and migrating into their natal streams to spawn. Figure 1-2 depicts the life cycle of anadromous salmonids (Chinook salmon and steelhead).
1-5
CHAPTER 1: 3BINTRODUCTION
FIGURE 1-2 Generalized Salmonid Life Cycle
Steelhead Steelhead, the anadromous (sea-going) form of rainbow trout, are found in Central Valley streams with almost the entire population restricted to the Sacramento River and its tributaries. Steelhead have a diverse life history that may be more variable than Chinook salmon, depending on race and geography. The steelhead life cycle is similar to that of Chinook salmon (see Figure 1-2). However, steelhead adults do not necessarily die following spawning and the juveniles typically rear for 2 years or more before actively migrating to the estuary and ocean as smolts. Once in the ocean, steelhead migrate, feed, grow, and mature into adults. They remain oceanic anywhere from 1 to 4 years before entering fresh water and migrating into their natal streams to spawn.
1.3.2 Key Habitat Requirements Both Chinook salmon and steelhead require physical habitat in fresh water for adult migration and holding, spawning and egg incubation, fry and juvenile rearing, and smolt emigration. Adequate flows, water temperatures, water depths and velocities, appropriate spawning and rearing substrates, and the availability of cover and food are critical for successful completion each species’ life cycle (see Figure 1-2).
Adult migration requires sufficient water depths and velocities to provide barrier-free passage, as well as suitable water temperatures. Compared to fall-run Chinook salmon and steelhead, adult spring-run Chinook salmon have an additional need for longer-term adult
1-6
CHAPTER 1: 3BINTRODUCTION
1-7
holding habitat, in which pool size and depth, temperature, and proximity to cover and spawning areas are important. Successful spawning requires suitable depths, water velocities, temperatures, and substrate sizes. Egg and alevin (yolk-sac fry) incubation requires suitable temperatures and adequate intra-gravel flow (i.e., gravel permeability) in the redds. Newly emerged alevins, fry, and juvenile salmon seek lower-velocity rearing habitats, with suitable substrates and water temperatures, and an adequate food supply. Because of their extended rearing period in fresh water, juvenile steelhead require suitable rearing habitat throughout the year. Dispersal of pre-smolts and active migration of smolts to the estuary and ocean require sufficient water depths and temperatures, adequate transport flows, and barrier-free passage.
Habitat needs for Chinook salmon and steelhead are generally similar, although steelhead differ somewhat in their freshwater habitat requirements. Specific habitat requirements for the various species and life stages and current habitat conditions in the upper Yuba River watershed are described in the following appendices to this report:
• Appendix B (Water Temperature Criteria of Chinook Salmon and Steelhead)
• Appendix C (Assessment of Adult Anadromous Salmonid Migration Barriers and Holding Habitats in the Upper Yuba River)
• Appendix D (Spawning Habitat Evaluation)
• Appendix E (Upper Yuba River Chinook Salmon and Steelhead Rearing Habitat Assessment)
2-1
CHAPTER 2
Analysis Approach
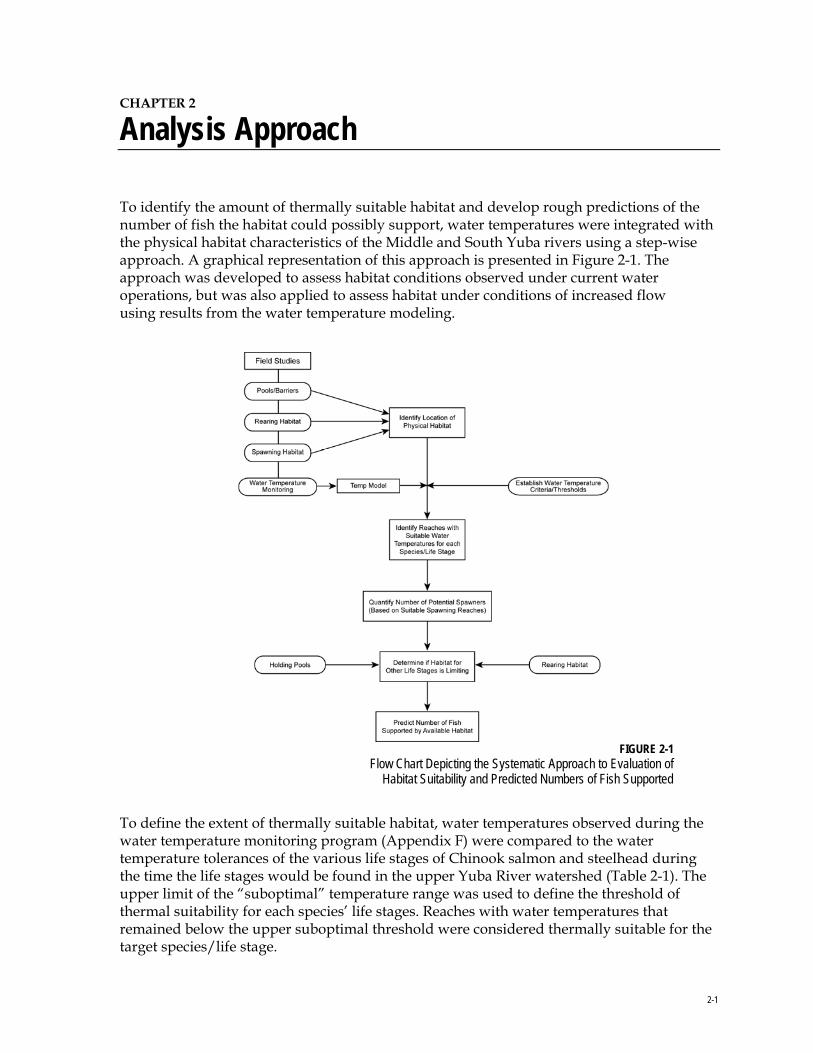
To identify the amount of thermally suitable habitat and develop rough predictions of the number of fish the habitat could possibly support, water temperatures were integrated with the physical habitat characteristics of the Middle and South Yuba rivers using a step-wise approach. A graphical representation of this approach is presented in Figure 2-1. The approach was developed to assess habitat conditions observed under current water operations, but was also applied to assess habitat under conditions of increased flow using results from the water temperature modeling.
FIGURE 2-1
Flow Chart Depicting the Systematic Approach to Evaluation of Habitat Suitability and Predicted Numbers of Fish Supported
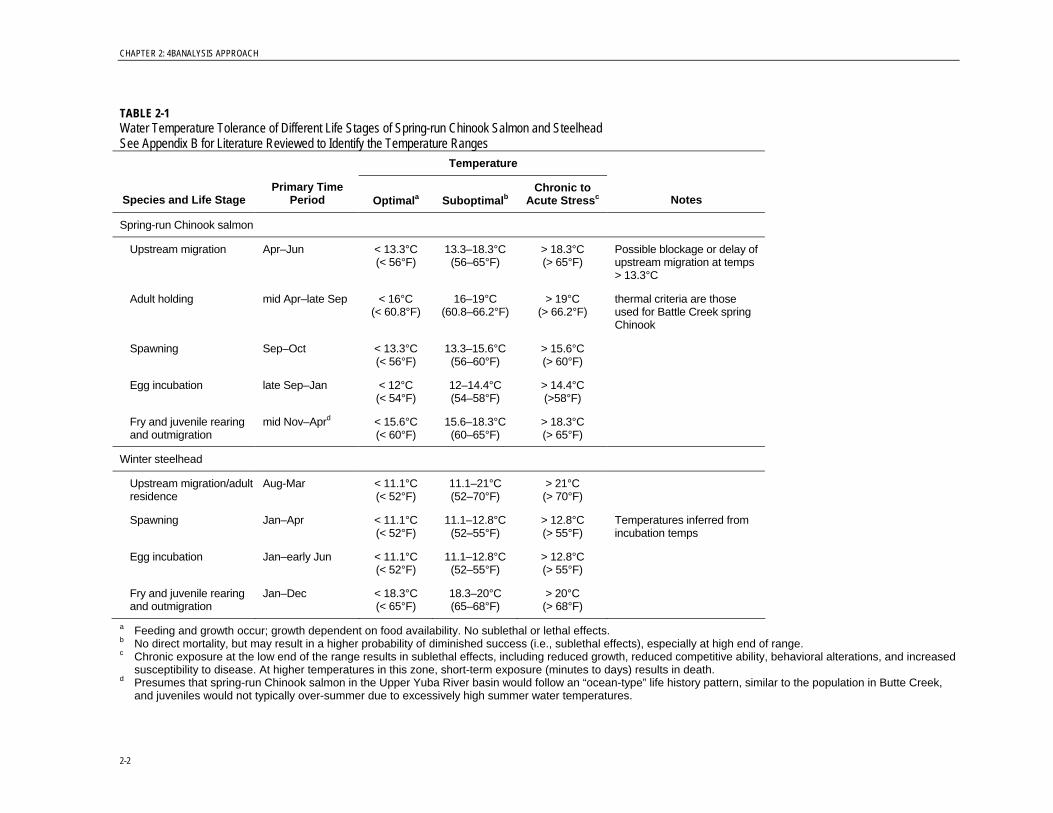
To define the extent of thermally suitable habitat, water temperatures observed during the water temperature monitoring program (Appendix F) were compared to the water temperature tolerances of the various life stages of Chinook salmon and steelhead during the time the life stages would be found in the upper Yuba River watershed (Table 2-1). The upper limit of the “suboptimal” temperature range was used to define the threshold of thermal suitability for each species’ life stages. Reaches with water temperatures that remained below the upper suboptimal threshold were considered thermally suitable for the target species/life stage.
CHAPTER 2: 4BANALYSIS APPROACH
TABLE 2-1 Water Temperature Tolerance of Different Life Stages of Spring-run Chinook Salmon and Steelhead See Appendix B for Literature Reviewed to Identify the Temperature Ranges
Temperature
Species and Life Stage Primary Time
Period Optimala Suboptimalb Chronic to
Acute Stressc Notes
Spring-run Chinook salmon
Upstream migration Apr–Jun < 13.3°C (< 56°F)
13.3–18.3°C (56–65°F)
> 18.3°C (> 65°F)
Possible blockage or delay of upstream migration at temps > 13.3°C
Adult holding mid Apr–late Sep < 16°C (< 60.8°F)
16–19°C (60.8–66.2°F)
> 19°C (> 66.2°F)
thermal criteria are those used for Battle Creek spring Chinook
Spawning Sep–Oct < 13.3°C (< 56°F)
13.3–15.6°C(56–60°F)
> 15.6°C (> 60°F)
Egg incubation late Sep–Jan < 12°C (< 54°F)
12–14.4°C (54–58°F)
> 14.4°C (>58°F)
Fry and juvenile rearing and outmigration
mid Nov–Aprd < 15.6°C (< 60°F)
15.6–18.3°C(60–65°F)
> 18.3°C (> 65°F)
Winter steelhead
Upstream migration/adult residence
Aug-Mar < 11.1°C (< 52°F)
11.1–21°C (52–70°F)
> 21°C (> 70°F)
Spawning Jan–Apr < 11.1°C (< 52°F)
11.1–12.8°C(52–55°F)
> 12.8°C (> 55°F)
Temperatures inferred from incubation temps
Egg incubation Jan–early Jun < 11.1°C (< 52°F)
11.1–12.8°C(52–55°F)
> 12.8°C (> 55°F)
Fry and juvenile rearing and outmigration
Jan–Dec < 18.3°C (< 65°F)
18.3–20°C (65–68°F)
> 20°C (> 68°F)
a Feeding and growth occur; growth dependent on food availability. No sublethal or lethal effects. b No direct mortality, but may result in a higher probability of diminished success (i.e., sublethal effects), especially at high end of range. c Chronic exposure at the low end of the range results in sublethal effects, including reduced growth, reduced competitive ability, behavioral alterations, and increased
susceptibility to disease. At higher temperatures in this zone, short-term exposure (minutes to days) results in death. d Presumes that spring-run Chinook salmon in the Upper Yuba River basin would follow an “ocean-type” life history pattern, similar to the population in Butte Creek,
and juveniles would not typically over-summer due to excessively high summer water temperatures.
2-2
CHAPTER 2: 4BANALYSIS APPROACH
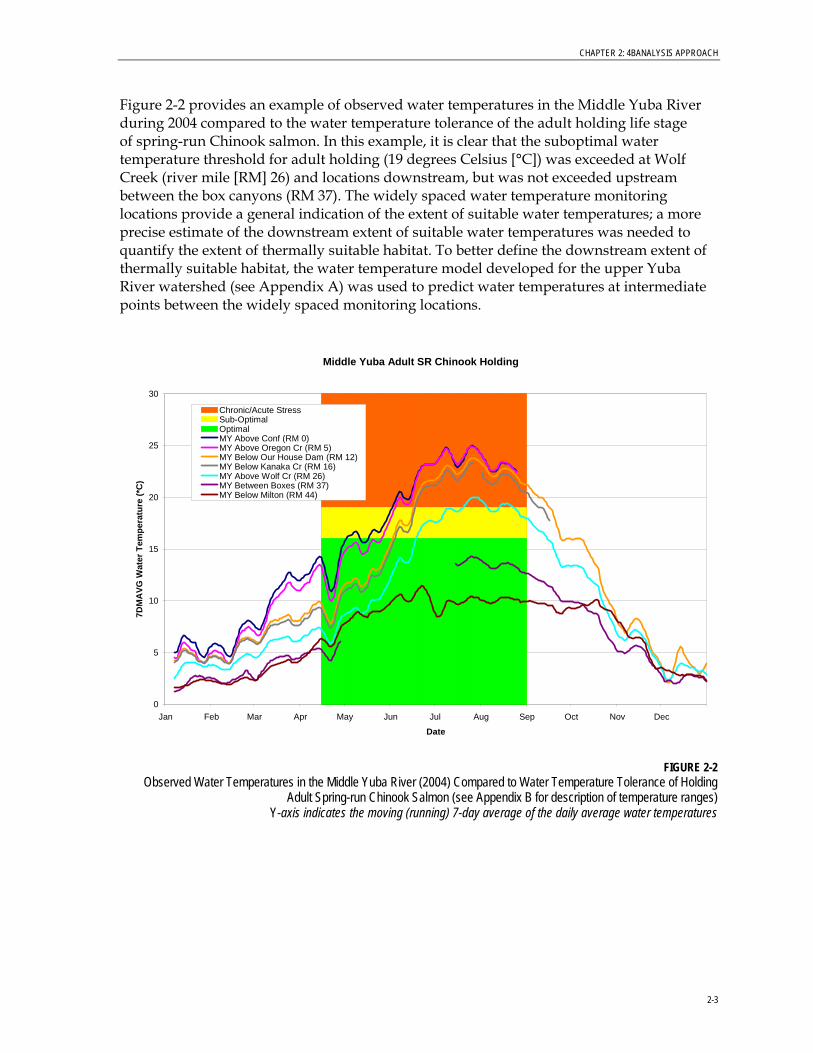
Figure 2-2 provides an example of observed water temperatures in the Middle Yuba River during 2004 compared to the water temperature tolerance of the adult holding life stage of spring-run Chinook salmon. In this example, it is clear that the suboptimal water temperature threshold for adult holding (19 degrees Celsius [°C]) was exceeded at Wolf Creek (river mile [RM] 26) and locations downstream, but was not exceeded upstream between the box canyons (RM 37). The widely spaced water temperature monitoring locations provide a general indication of the extent of suitable water temperatures; a more precise estimate of the downstream extent of suitable water temperatures was needed to quantify the extent of thermally suitable habitat. To better define the downstream extent of thermally suitable habitat, the water temperature model developed for the upper Yuba River watershed (see Appendix A) was used to predict water temperatures at intermediate points between the widely spaced monitoring locations.
Middle Yuba Adult SR Chinook Holding
0
5
10
15
20
25
30
Jan Feb Mar Apr May Jun Jul Aug Sep Oct Nov Dec
Date
7DM
AVG
Wat
er T
empe
ratu
re (*
C)
Chronic/Acute StressSub-OptimalOptimalMY Above Conf (RM 0)MY Above Oregon Cr (RM 5)MY Below Our House Dam (RM 12)MY Below Kanaka Cr (RM 16)MY Above Wolf Cr (RM 26)MY Between Boxes (RM 37)MY Below Milton (RM 44)
FIGURE 2-2
Observed Water Temperatures in the Middle Yuba River (2004) Compared to Water Temperature Tolerance of Holding Adult Spring-run Chinook Salmon (see Appendix B for description of temperature ranges)
Y-axis indicates the moving (running) 7-day average of the daily average water temperatures
2-3
CHAPTER 2: 4BANALYSIS APPROACH
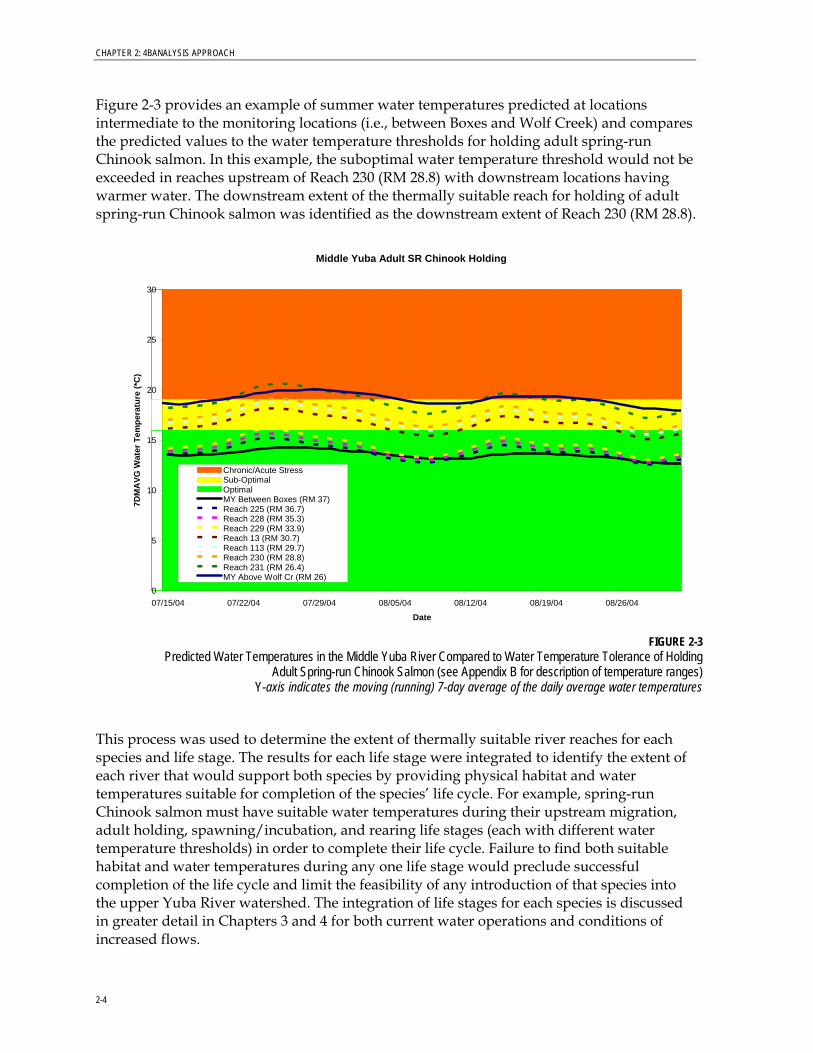
Figure 2-3 provides an example of summer water temperatures predicted at locations intermediate to the monitoring locations (i.e., between Boxes and Wolf Creek) and compares the predicted values to the water temperature thresholds for holding adult spring-run Chinook salmon. In this example, the suboptimal water temperature threshold would not be exceeded in reaches upstream of Reach 230 (RM 28.8) with downstream locations having warmer water. The downstream extent of the thermally suitable reach for holding of adult spring-run Chinook salmon was identified as the downstream extent of Reach 230 (RM 28.8).
Middle Yuba Adult SR Chinook Holding
0
5
10
15
20
25
30
07/15/04 07/22/04 07/29/04 08/05/04 08/12/04 08/19/04 08/26/04
Date
7DM
AVG
Wat
er T
empe
ratu
re (*
C)
Chronic/Acute StressSub-OptimalOptimalMY Between Boxes (RM 37)Reach 225 (RM 36.7)Reach 228 (RM 35.3)Reach 229 (RM 33.9)Reach 13 (RM 30.7)Reach 113 (RM 29.7)Reach 230 (RM 28.8)Reach 231 (RM 26.4)MY Above Wolf Cr (RM 26)
FIGURE 2-3
Predicted Water Temperatures in the Middle Yuba River Compared to Water Temperature Tolerance of Holding Adult Spring-run Chinook Salmon (see Appendix B for description of temperature ranges)
Y-axis indicates the moving (running) 7-day average of the daily average water temperatures
This process was used to determine the extent of thermally suitable river reaches for each species and life stage. The results for each life stage were integrated to identify the extent of each river that would support both species by providing physical habitat and water temperatures suitable for completion of the species’ life cycle. For example, spring-run Chinook salmon must have suitable water temperatures during their upstream migration, adult holding, spawning/incubation, and rearing life stages (each with different water temperature thresholds) in order to complete their life cycle. Failure to find both suitable habitat and water temperatures during any one life stage would preclude successful completion of the life cycle and limit the feasibility of any introduction of that species into the upper Yuba River watershed. The integration of life stages for each species is discussed in greater detail in Chapters 3 and 4 for both current water operations and conditions of increased flows.
2-4
CHAPTER 3
Habitat Analysis: Current Water Operations (2004)
3.1 Thermally Suitable Reaches Instream temperatures were monitored at several locations in the North, Middle and South Yuba rivers for the purpose of documenting temperatures in the rivers and providing the data necessary for developing a water temperature model. A full description of the methods and results of the instream temperature monitoring program is presented in Appendix F. The temperature monitoring data were compared to the temperature thresholds identified in Table 2-1 for Chinook salmon and steelhead in order to determine the river reaches that had suitable water temperatures for each species and life stage under current operations. The water temperature model described in Appendix A was used to predict water temperatures at intermediate points between the monitoring nodes, allowing the extent of thermally suitable reaches to be more accurately described. Only reaches available to spring-run Chinook salmon and steelhead (i.e., below the first total barrier to upstream migration) were assessed for thermal suitability. The following section presents the results of the analysis and identifies the thermally suitable reaches available for each life stage of spring-run Chinook salmon and steelhead based on data collected in and modeling results for 2004 water operations.
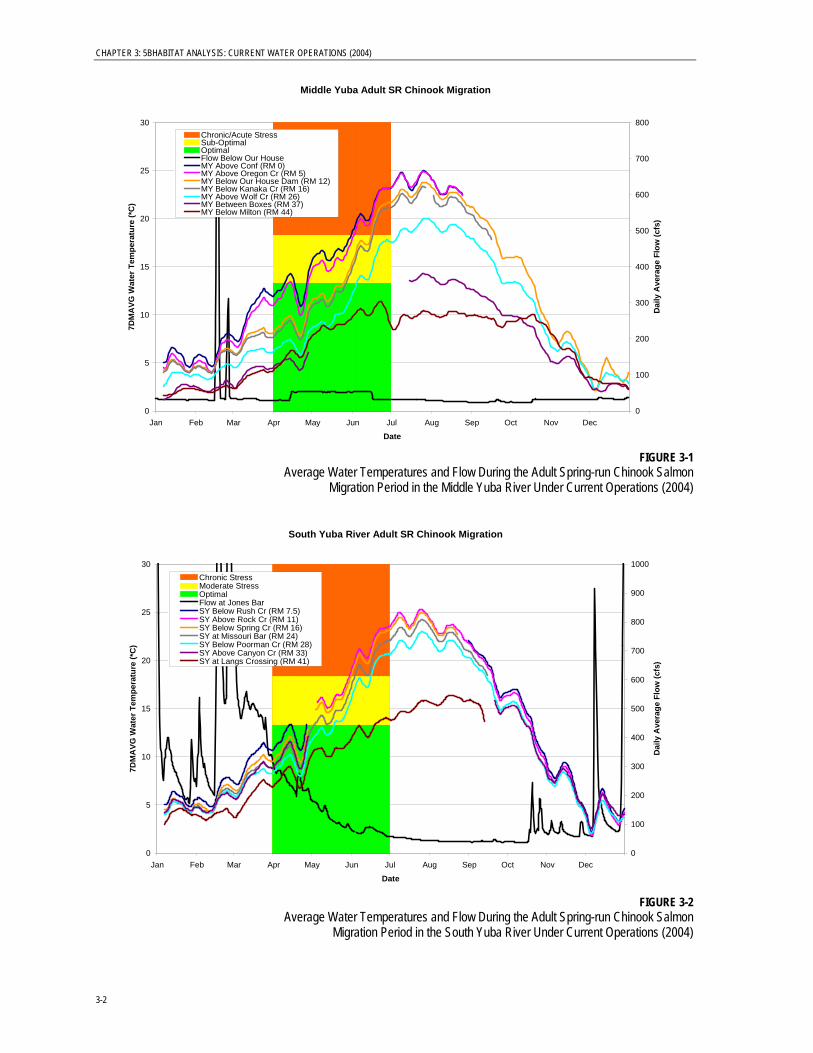
3.1.1 Spring-run Chinook Salmon Migration Based on the known life history strategy of historic and existing spring-run Chinook salmon occurring within the Sacramento River watershed, adult spring-run Chinook salmon would be expected to migrate through the Middle and South Yuba rivers during the spring and early summer when water temperatures are typically low. Figures 3-1 and 3-2 show average water temperatures in the Middle and South Yuba rivers during 2004 compared to the temperature tolerances of migrating adult spring-run Chinook salmon. Water temperatures at this time generally remained below the suboptimal threshold for migration (18.3°C) in all reaches of the Middle Yuba River above Our House Dam and above Poorman Creek on the South Yuba River until late in the migration period. Water temperatures in the lower reaches of both rivers exceeded the suboptimal threshold during the later portion of the migration period (June). However, water temperatures were suitable for the majority of the expected migration period, suggesting that water temperature during the migration period would not limit the distribution of spring-run Chinook salmon in the upper Yuba River watershed.
3-1
CHAPTER 3: 5BHABITAT ANALYSIS: CURRENT WATER OPERATIONS (2004)
Middle Yuba Adult SR Chinook Migration
0
5
10
15
20
25
30
Jan Feb Mar Apr May Jun Jul Aug Sep Oct Nov Dec
Date
7DM
AVG
Wat
er T
empe
ratu
re (*
C)
0
100
200
300
400
500
600
700
800
Dai
ly A
vera
ge F
low
(cfs
)
Chronic/Acute StressSub-OptimalOptimalFlow Below Our HouseMY Above Conf (RM 0)MY Above Oregon Cr (RM 5)MY Below Our House Dam (RM 12)MY Below Kanaka Cr (RM 16)MY Above Wolf Cr (RM 26)MY Between Boxes (RM 37)MY Below Milton (RM 44)
FIGURE 3-1
Average Water Temperatures and Flow During the Adult Spring-run Chinook Salmon Migration Period in the Middle Yuba River Under Current Operations (2004)
South Yuba River Adult SR Chinook Migration
0
5
10
15
20
25
30
Jan Feb Mar Apr May Jun Jul Aug Sep Oct Nov Dec
Date
7DM
AVG
Wat
er T
empe
ratu
re (*
C)
0
100
200
300
400
500
600
700
800
900
1000
Dai
ly A
vera
ge F
low
(cfs
)
Chronic StressModerate StressOptimalFlow at Jones BarSY Below Rush Cr (RM 7.5)SY Above Rock Cr (RM 11)SY Below Spring Cr (RM 16)SY at Missouri Bar (RM 24)SY Below Poorman Cr (RM 28)SY Above Canyon Cr (RM 33)SY at Langs Crossing (RM 41)
FIGURE 3-2
Average Water Temperatures and Flow During the Adult Spring-run Chinook Salmon Migration Period in the South Yuba River Under Current Operations (2004)
3-2
CHAPTER 3: 5BHABITAT ANALYSIS: CURRENT WATER OPERATIONS (2004)
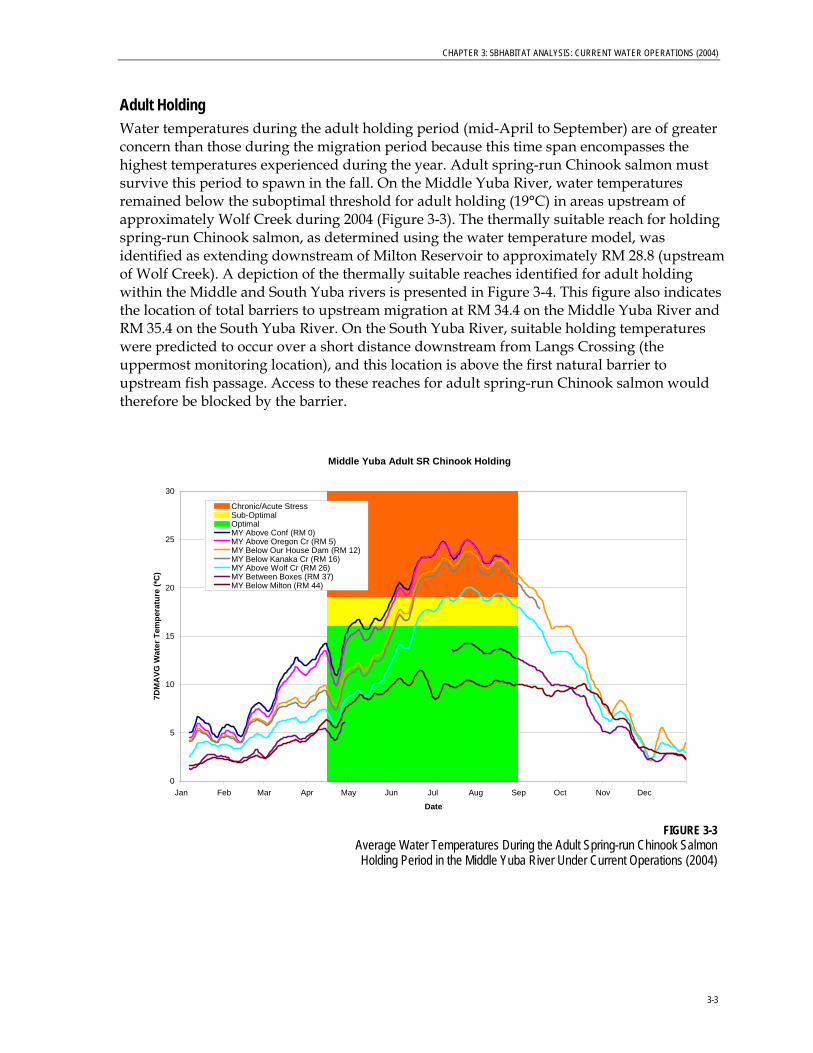
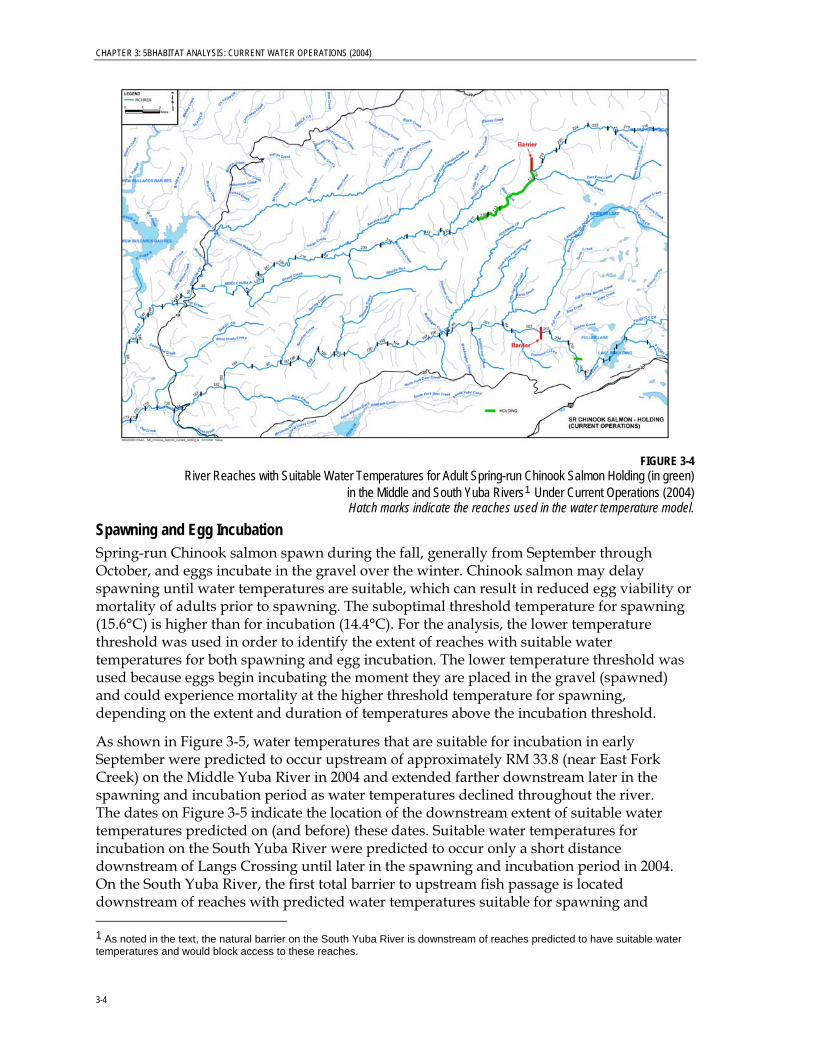
Adult Holding Water temperatures during the adult holding period (mid-April to September) are of greater concern than those during the migration period because this time span encompasses the highest temperatures experienced during the year. Adult spring-run Chinook salmon must survive this period to spawn in the fall. On the Middle Yuba River, water temperatures remained below the suboptimal threshold for adult holding (19°C) in areas upstream of approximately Wolf Creek during 2004 (Figure 3-3). The thermally suitable reach for holding spring-run Chinook salmon, as determined using the water temperature model, was identified as extending downstream of Milton Reservoir to approximately RM 28.8 (upstream of Wolf Creek). A depiction of the thermally suitable reaches identified for adult holding within the Middle and South Yuba rivers is presented in Figure 3-4. This figure also indicates the location of total barriers to upstream migration at RM 34.4 on the Middle Yuba River and RM 35.4 on the South Yuba River. On the South Yuba River, suitable holding temperatures were predicted to occur over a short distance downstream from Langs Crossing (the uppermost monitoring location), and this location is above the first natural barrier to upstream fish passage. Access to these reaches for adult spring-run Chinook salmon would therefore be blocked by the barrier.
Middle Yuba Adult SR Chinook Holding
0
5
10
15
20
25
30
Jan Feb Mar Apr May Jun Jul Aug Sep Oct Nov Dec
Date
7DM
AVG
Wat
er T
empe
ratu
re (*
C)
Chronic/Acute StressSub-OptimalOptimalMY Above Conf (RM 0)MY Above Oregon Cr (RM 5)MY Below Our House Dam (RM 12)MY Below Kanaka Cr (RM 16)MY Above Wolf Cr (RM 26)MY Between Boxes (RM 37)MY Below Milton (RM 44)
FIGURE 3-3
Average Water Temperatures During the Adult Spring-run Chinook Salmon Holding Period in the Middle Yuba River Under Current Operations (2004)
3-3
CHAPTER 3: 5BHABITAT ANALYSIS: CURRENT WATER OPERATIONS (2004)
FIGURE 3-4 River Reaches with Suitable Water Temperatures for Adult Spring-run Chinook Salmon Holding (in green)
in the Middle and South Yuba Rivers1 Under Current Operations (2004) Hatch marks indicate the reaches used in the water temperature model.
Spawning and Egg Incubation Spring-run Chinook salmon spawn during the fall, generally from September through October, and eggs incubate in the gravel over the winter. Chinook salmon may delay spawning until water temperatures are suitable, which can result in reduced egg viability or mortality of adults prior to spawning. The suboptimal threshold temperature for spawning (15.6°C) is higher than for incubation (14.4°C). For the analysis, the lower temperature threshold was used in order to identify the extent of reaches with suitable water temperatures for both spawning and egg incubation. The lower temperature threshold was used because eggs begin incubating the moment they are placed in the gravel (spawned) and could experience mortality at the higher threshold temperature for spawning, depending on the extent and duration of temperatures above the incubation threshold.
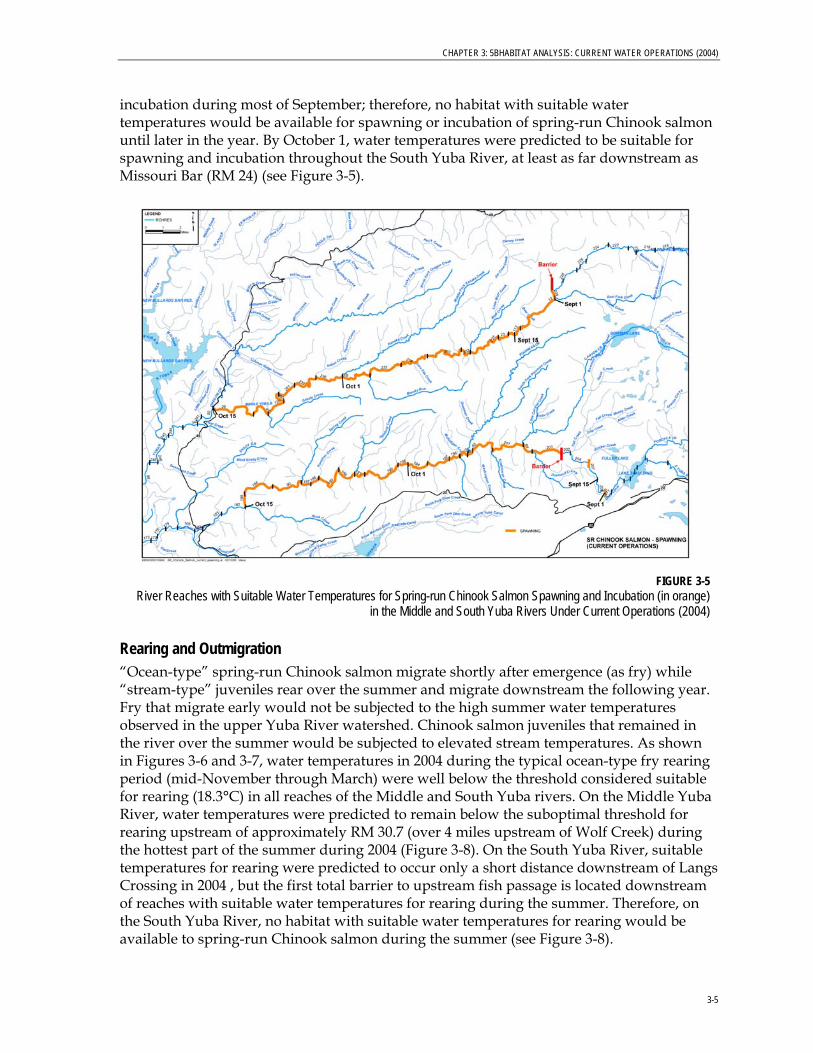
As shown in Figure 3-5, water temperatures that are suitable for incubation in early September were predicted to occur upstream of approximately RM 33.8 (near East Fork Creek) on the Middle Yuba River in 2004 and extended farther downstream later in the spawning and incubation period as water temperatures declined throughout the river. The dates on Figure 3-5 indicate the location of the downstream extent of suitable water temperatures predicted on (and before) these dates. Suitable water temperatures for incubation on the South Yuba River were predicted to occur only a short distance downstream of Langs Crossing until later in the spawning and incubation period in 2004. On the South Yuba River, the first total barrier to upstream fish passage is located downstream of reaches with predicted water temperatures suitable for spawning and 1 As noted in the text, the natural barrier on the South Yuba River is downstream of reaches predicted to have suitable water temperatures and would block access to these reaches.
3-4
CHAPTER 3: 5BHABITAT ANALYSIS: CURRENT WATER OPERATIONS (2004)
incubation during most of September; therefore, no habitat with suitable water temperatures would be available for spawning or incubation of spring-run Chinook salmon until later in the year. By October 1, water temperatures were predicted to be suitable for spawning and incubation throughout the South Yuba River, at least as far downstream as Missouri Bar (RM 24) (see Figure 3-5).
FIGURE 3-5 River Reaches with Suitable Water Temperatures for Spring-run Chinook Salmon Spawning and Incubation (in orange)
in the Middle and South Yuba Rivers Under Current Operations (2004)
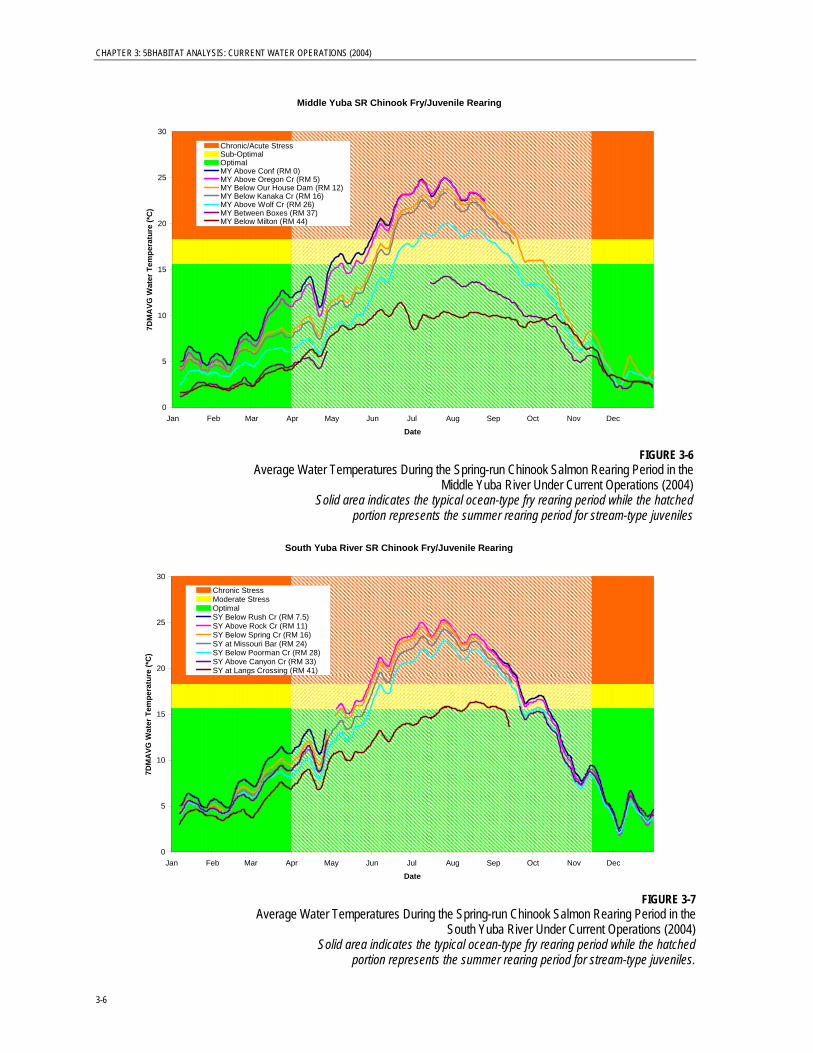
Rearing and Outmigration “Ocean-type” spring-run Chinook salmon migrate shortly after emergence (as fry) while “stream-type” juveniles rear over the summer and migrate downstream the following year. Fry that migrate early would not be subjected to the high summer water temperatures observed in the upper Yuba River watershed. Chinook salmon juveniles that remained in the river over the summer would be subjected to elevated stream temperatures. As shown in Figures 3-6 and 3-7, water temperatures in 2004 during the typical ocean-type fry rearing period (mid-November through March) were well below the threshold considered suitable for rearing (18.3°C) in all reaches of the Middle and South Yuba rivers. On the Middle Yuba River, water temperatures were predicted to remain below the suboptimal threshold for rearing upstream of approximately RM 30.7 (over 4 miles upstream of Wolf Creek) during the hottest part of the summer during 2004 (Figure 3-8). On the South Yuba River, suitable temperatures for rearing were predicted to occur only a short distance downstream of Langs Crossing in 2004 , but the first total barrier to upstream fish passage is located downstream of reaches with suitable water temperatures for rearing during the summer. Therefore, on the South Yuba River, no habitat with suitable water temperatures for rearing would be available to spring-run Chinook salmon during the summer (see Figure 3-8).
3-5
CHAPTER 3: 5BHABITAT ANALYSIS: CURRENT WATER OPERATIONS (2004)
Middle Yuba SR Chinook Fry/Juvenile Rearing
0
5
10
15
20
25
30
Jan Feb Mar Apr May Jun Jul Aug Sep Oct Nov Dec
Date
7DM
AVG
Wat
er T
empe
ratu
re (*
C)
Chronic/Acute StressSub-OptimalOptimalMY Above Conf (RM 0)MY Above Oregon Cr (RM 5)MY Below Our House Dam (RM 12)MY Below Kanaka Cr (RM 16)MY Above Wolf Cr (RM 26)MY Between Boxes (RM 37)MY Below Milton (RM 44)
FIGURE 3-6
Average Water Temperatures During the Spring-run Chinook Salmon Rearing Period in the Middle Yuba River Under Current Operations (2004)
Solid area indicates the typical ocean-type fry rearing period while the hatched portion represents the summer rearing period for stream-type juveniles
South Yuba River SR Chinook Fry/Juvenile Rearing
0
5
10
15
20
25
30
Jan Feb Mar Apr May Jun Jul Aug Sep Oct Nov Dec
Date
7DM
AVG
Wat
er T
empe
ratu
re (*
C)
Chronic StressModerate StressOptimalSY Below Rush Cr (RM 7.5)SY Above Rock Cr (RM 11)SY Below Spring Cr (RM 16)SY at Missouri Bar (RM 24)SY Below Poorman Cr (RM 28)SY Above Canyon Cr (RM 33)SY at Langs Crossing (RM 41)
FIGURE 3-7
Average Water Temperatures During the Spring-run Chinook Salmon Rearing Period in the South Yuba River Under Current Operations (2004)
Solid area indicates the typical ocean-type fry rearing period while the hatched portion represents the summer rearing period for stream-type juveniles.
3-6
CHAPTER 3: 5BHABITAT ANALYSIS: CURRENT WATER OPERATIONS (2004)
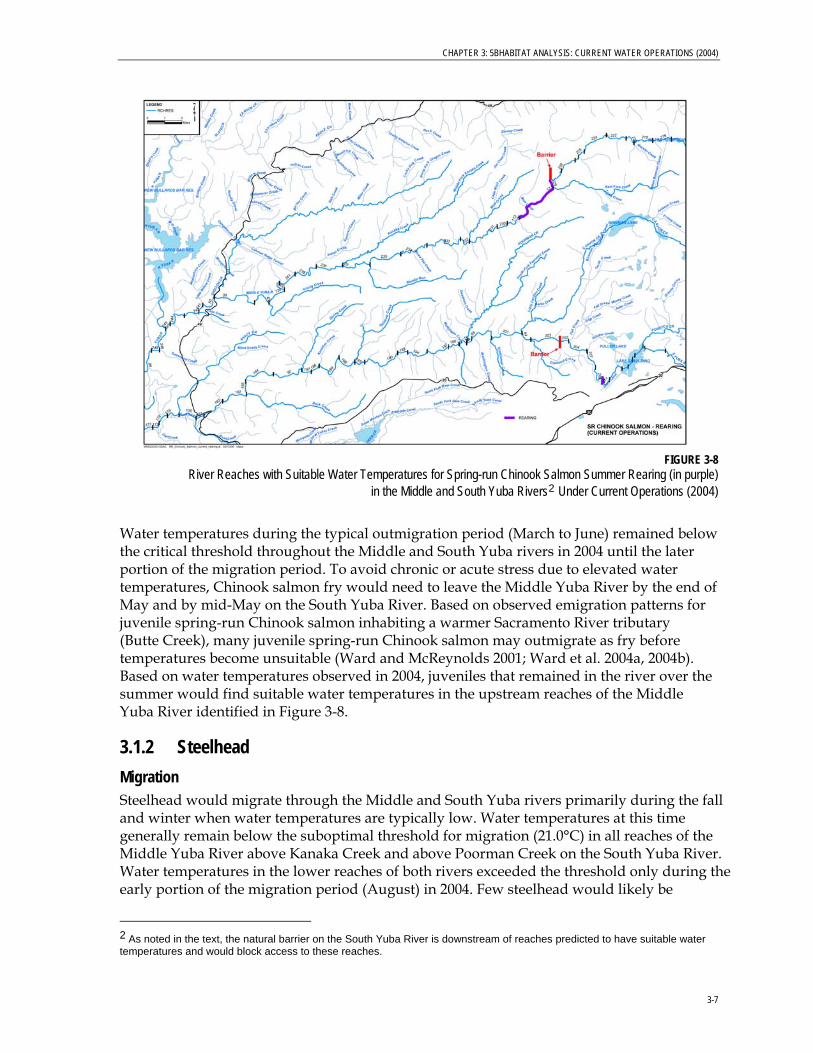
FIGURE 3-8 River Reaches with Suitable Water Temperatures for Spring-run Chinook Salmon Summer Rearing (in purple)
in the Middle and South Yuba Rivers2 Under Current Operations (2004)
Water temperatures during the typical outmigration period (March to June) remained below the critical threshold throughout the Middle and South Yuba rivers in 2004 until the later portion of the migration period. To avoid chronic or acute stress due to elevated water temperatures, Chinook salmon fry would need to leave the Middle Yuba River by the end of May and by mid-May on the South Yuba River. Based on observed emigration patterns for juvenile spring-run Chinook salmon inhabiting a warmer Sacramento River tributary (Butte Creek), many juvenile spring-run Chinook salmon may outmigrate as fry before temperatures become unsuitable (Ward and McReynolds 2001; Ward et al. 2004a, 2004b). Based on water temperatures observed in 2004, juveniles that remained in the river over the summer would find suitable water temperatures in the upstream reaches of the Middle Yuba River identified in Figure 3-8.
3.1.2 Steelhead Migration Steelhead would migrate through the Middle and South Yuba rivers primarily during the fall and winter when water temperatures are typically low. Water temperatures at this time generally remain below the suboptimal threshold for migration (21.0°C) in all reaches of the Middle Yuba River above Kanaka Creek and above Poorman Creek on the South Yuba River. Water temperatures in the lower reaches of both rivers exceeded the threshold only during the early portion of the migration period (August) in 2004. Few steelhead would likely be
2 As noted in the text, the natural barrier on the South Yuba River is downstream of reaches predicted to have suitable water temperatures and would block access to these reaches.
3-7
CHAPTER 3: 5BHABITAT ANALYSIS: CURRENT WATER OPERATIONS (2004)
migrating upstream at this time because the peak migration time for Central Valley steelhead is generally later in the fall. Steelhead migrating during the early portion of the migration period would be subject to elevated water temperatures that could result in mortality or reduced egg viability, but it is more likely that adult steelhead would delay migration until later when water temperatures are generally suitable. Timing of annual upstream adult migration is influenced by weather (rainfall), hydrologic conditions, and water temperatures. These factors suggest that water temperatures during the migration period would not limit the distribution of steelhead in the upper Yuba River watershed.
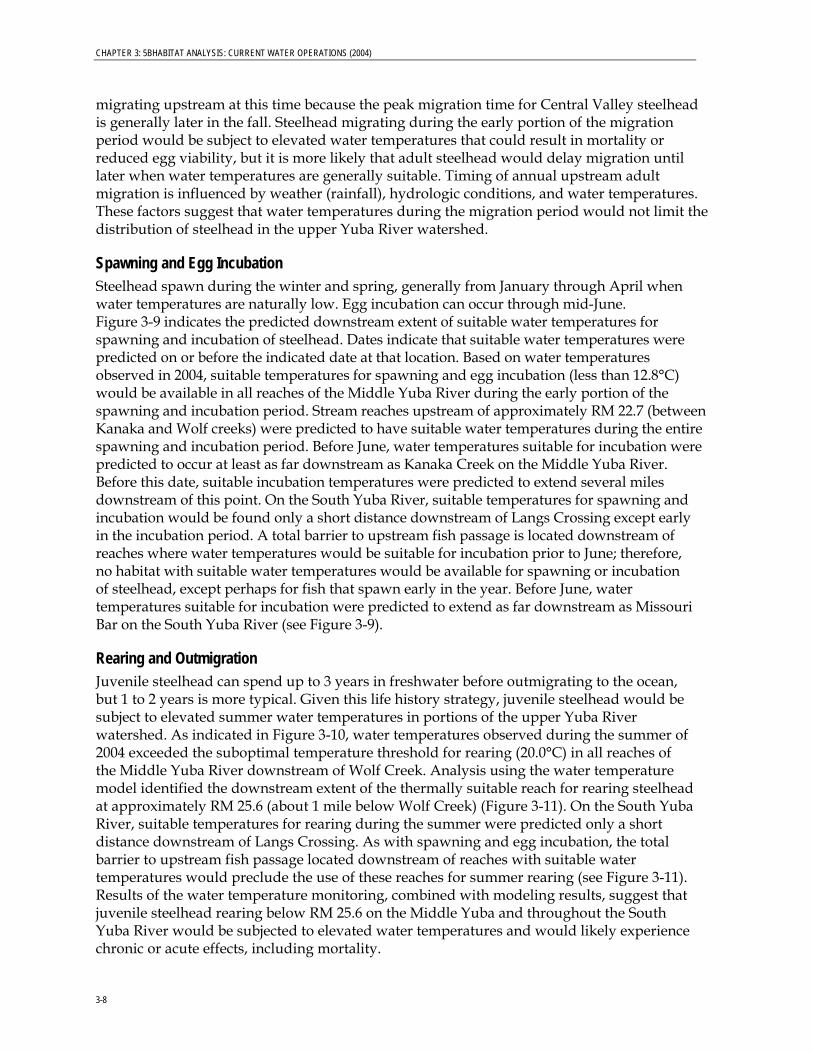
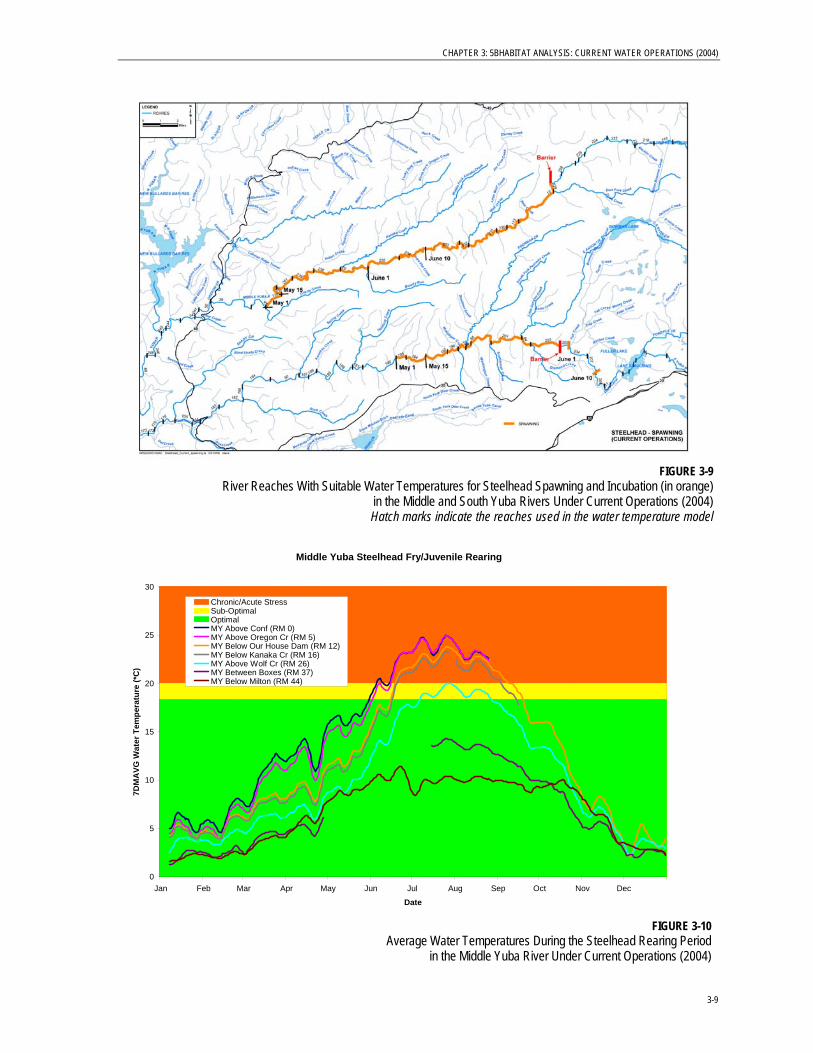
Spawning and Egg Incubation Steelhead spawn during the winter and spring, generally from January through April when water temperatures are naturally low. Egg incubation can occur through mid-June. Figure 3-9 indicates the predicted downstream extent of suitable water temperatures for spawning and incubation of steelhead. Dates indicate that suitable water temperatures were predicted on or before the indicated date at that location. Based on water temperatures observed in 2004, suitable temperatures for spawning and egg incubation (less than 12.8°C) would be available in all reaches of the Middle Yuba River during the early portion of the spawning and incubation period. Stream reaches upstream of approximately RM 22.7 (between Kanaka and Wolf creeks) were predicted to have suitable water temperatures during the entire spawning and incubation period. Before June, water temperatures suitable for incubation were predicted to occur at least as far downstream as Kanaka Creek on the Middle Yuba River. Before this date, suitable incubation temperatures were predicted to extend several miles downstream of this point. On the South Yuba River, suitable temperatures for spawning and incubation would be found only a short distance downstream of Langs Crossing except early in the incubation period. A total barrier to upstream fish passage is located downstream of reaches where water temperatures would be suitable for incubation prior to June; therefore, no habitat with suitable water temperatures would be available for spawning or incubation of steelhead, except perhaps for fish that spawn early in the year. Before June, water temperatures suitable for incubation were predicted to extend as far downstream as Missouri Bar on the South Yuba River (see Figure 3-9).
Rearing and Outmigration Juvenile steelhead can spend up to 3 years in freshwater before outmigrating to the ocean, but 1 to 2 years is more typical. Given this life history strategy, juvenile steelhead would be subject to elevated summer water temperatures in portions of the upper Yuba River watershed. As indicated in Figure 3-10, water temperatures observed during the summer of 2004 exceeded the suboptimal temperature threshold for rearing (20.0°C) in all reaches of the Middle Yuba River downstream of Wolf Creek. Analysis using the water temperature model identified the downstream extent of the thermally suitable reach for rearing steelhead at approximately RM 25.6 (about 1 mile below Wolf Creek) (Figure 3-11). On the South Yuba River, suitable temperatures for rearing during the summer were predicted only a short distance downstream of Langs Crossing. As with spawning and egg incubation, the total barrier to upstream fish passage located downstream of reaches with suitable water temperatures would preclude the use of these reaches for summer rearing (see Figure 3-11). Results of the water temperature monitoring, combined with modeling results, suggest that juvenile steelhead rearing below RM 25.6 on the Middle Yuba and throughout the South Yuba River would be subjected to elevated water temperatures and would likely experience chronic or acute effects, including mortality.
3-8
CHAPTER 3: 5BHABITAT ANALYSIS: CURRENT WATER OPERATIONS (2004)
FIGURE 3-9
River Reaches With Suitable Water Temperatures for Steelhead Spawning and Incubation (in orange) in the Middle and South Yuba Rivers Under Current Operations (2004)Hatch marks indicate the reaches used in the water temperature model
Middle Yuba Steelhead Fry/Juvenile Rearing
0
5
10
15
20
25
30
Jan Feb Mar Apr May Jun Jul Aug Sep Oct Nov Dec
Date
7DM
AVG
Wat
er T
empe
ratu
re (*
C)
Chronic/Acute StressSub-OptimalOptimalMY Above Conf (RM 0)MY Above Oregon Cr (RM 5)MY Below Our House Dam (RM 12)MY Below Kanaka Cr (RM 16)MY Above Wolf Cr (RM 26)MY Between Boxes (RM 37)MY Below Milton (RM 44)
FIGURE 3-10
Average Water Temperatures During the Steelhead Rearing Period in the Middle Yuba River Under Current Operations (2004)
3-9
CHAPTER 3: 5BHABITAT ANALYSIS: CURRENT WATER OPERATIONS (2004)
FIGURE 3-11 River Reaches with Suitable Water Temperatures for Steelhead Summer Rearing (in purple)
in the Middle and South Yuba Rivers3 Under Current Operations (2004)
3.1.3 Fall-run Chinook Salmon Fall-run Chinook salmon typically do not migrate as far upstream as spring-run Chinook salmon, and prefer to spawn at lower elevations where fall and winter flows provide adequate depths and velocities in larger mainstem rivers. The extent to which fall-run Chinook salmon would migrate upstream beyond Englebright Dam is unknown. However, fall-run Chinook salmon likely would use some of the lower portions of the Middle and South Yuba rivers if water temperatures were suitable and adequate spawning gravels were available.
To evaluate whether the available habitat for fall-run Chinook salmon upstream of Englebright Dam would have suitable water temperatures, observed and modeled water temperatures during the spawning and incubation life stage (November to June) were compared to the suboptimal threshold temperature for incubating Chinook salmon (14.4°C). Observed water temperatures during the typical fall-run Chinook salmon spawning and incubation period suggest that water temperatures during this time would be suitable for spawning and incubation of Chinook salmon throughout both the Middle and South Yuba rivers (see Appendix F). It is difficult to predict how far upstream fall-run Chinook salmon would migrate in these rivers for spawning, but it appears that they would have both suitably-sized spawning gravels and suitable water temperatures available at the appropriate time. In order to avoid unsuitable summer rearing temperatures, juvenile
3 As noted in the text, the natural barrier on the South Yuba River is downstream of reaches predicted to have suitable water temperatures and would block access to these reaches.
3-10
CHAPTER 3: 5BHABITAT ANALYSIS: CURRENT WATER OPERATIONS (2004)
fall-run Chinook salmon using the upper Yuba River watershed would need to exhibit the ocean-type life history (which is a strategy typical of fall-run) and leave the lower reaches of the rivers before temperatures become unsuitable for summer rearing.
3.2 Number of Chinook Salmon and Steelhead Redds 3.2.1 Spring-run Chinook Salmon Figure 3-12 shows the linear extent of thermally suitable habitat predicted for three life stages of spring-run Chinook salmon using the water temperature model developed for the upper Yuba River watershed. The results of the analysis, based on temperature and hydrologic conditions in 2004, suggest that thermally suitable habitat for spring-run Chinook salmon on the Middle Yuba River would extend approximately 5.6 miles downstream of the natural barrier at RM 34.4 under current (2004) operations. The lower boundary of this reach is located at the downstream extent of habitat with suitable temperatures for adult holding (≤ 19°C) because it was assumed that adult spring-run Chinook salmon would continue to hold in this area until water temperatures became suitable for spawning, and most rearing spring-run Chinook salmon fry would leave the river before summer water temperatures exceed their temperature tolerance. Figure 3-13 shows the linear extent of thermally suitable habitat and cumulative number of spring-run Chinook salmon redds potentially supported below the barrier to upstream fish passage on the Middle Yuba River. Based on the analysis of spawning habitat (Appendix D), approximately 240 spring-run Chinook salmon redds could be supported by the available spawning habitat in the approximately 5.6 miles considered thermally suitable in the Middle Yuba River.
FIGURE 3-12
River Reaches with Suitable Water Temperatures for Spring-run Chinook Salmon in the Middle and South Yuba Rivers Under Current Operations (2004)
3-11
CHAPTER 3: 5BHABITAT ANALYSIS: CURRENT WATER OPERATIONS (2004)
Middle Yuba River
0
500
1000
1500
2000
2500
3000
3500
4000
4500
0 5 10 15 20 25 30 35 40 45
River Mile
Cum
ulat
ive
Num
ber o
f Red
ds
BarrierRM 28.8
FIGURE 3-13
Downstream Extent of Thermally Suitable Habitat and Cumulative Number of Spring-run Chinook Salmon Redds Potentially Supported Below the First Total Barrier (RM 34.4) in the Middle Yuba River Under Current Operations
Assuming one female Chinook salmon per redd and a sex ratio of 1:1, it was predicted that approximately 480 spring-run Chinook salmon could spawn in the available habitat considered thermally suitable in the Middle Yuba River. This prediction could be conservative because:
• Potential spawning habitat only included pool tails that were visible from the aerial video and field surveys
• Redd density was adjusted downward for small gravel sizes and low permeability
• Redd density was adjusted downward based on quality of adjacent pool habitat
• Redd density was adjusted downward to account for the effects of redd superimposition
• Redd density used in the analysis was based on observed densities for fall-run Chinook salmon in the Stanislaus River (see Appendix D); redd density for spring-run Chinook salmon in other streams (e.g., Butte Creek) may be higher than assumed for the upper Yuba River watershed, suggesting that even more redds/adults could be supported
Because water temperatures in the South Yuba River downstream of the natural barrier to upstream fish passage were predicted to be above the suboptimal threshold for holding of adult spring-run Chinook salmon, no area with suitable water temperatures for completion of the Chinook salmon life cycle was identified. Based on water temperatures in 2004, high summer water temperatures in the South Yuba River would likely preclude establishment of a spring-run Chinook salmon population. However, further study of the temperature of water released into the South Yuba River from Lake Spaulding and refinement of the temperature model could influence this preliminary conclusion.
3-12
CHAPTER 3: 5BHABITAT ANALYSIS: CURRENT WATER OPERATIONS (2004)
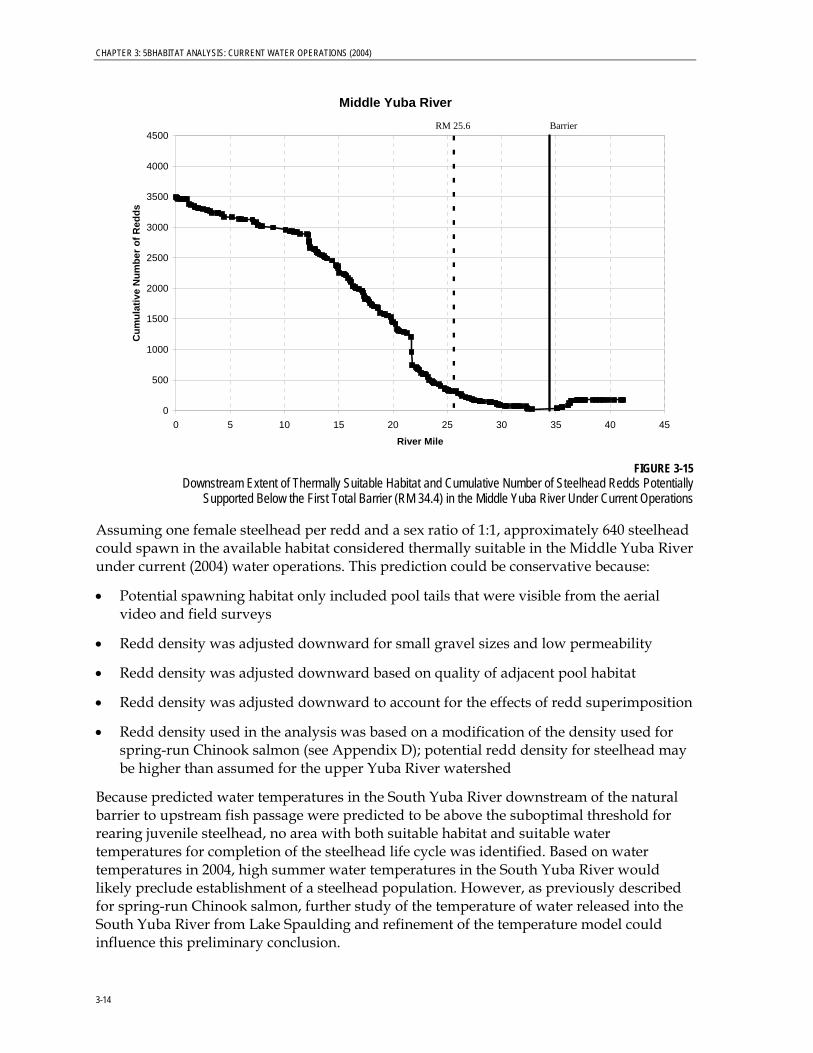
3.2.2 Steelhead As shown in Figures 3-9 and 3-11, reaches that would have suitable spawning and incubation temperatures generally extend farther downstream than reaches that would have suitable rearing temperatures. Because steelhead juveniles must rear for at least one year in freshwater (typically two years) to complete the rearing phase of their life cycle, it is appropriate to identify the downstream extent of thermally suitable habitat for steelhead based on the juvenile rearing life stage. The results of the analysis, based on temperature and hydrologic conditions in 2004, suggest that on the Middle Yuba River, thermally suitable habitat for steelhead would extend approximately 8.8 miles downstream of the natural barrier to upstream migration at RM 34.4 to approximately RM 25.6 (below Wolf Creek) (Figure 3-14). In a field survey documenting rainbow trout distribution in the upper Yuba River watershed, rainbow trout were found in areas downstream of this point (a full description of the study is presented in Appendix G). Assuming rainbow trout are surrogates for juvenile steelhead, the presence of rainbow trout may indicate that steelhead rearing could occur farther downstream than predicted; however, insufficient field evidence is available to dispute the published temperature tolerance for steelhead juveniles used in establishing this boundary. Figure 3-15 shows the linear extent of thermally suitable habitat and cumulative number of steelhead redds potentially supported in the Middle Yuba River. Based on the analysis of spawning habitat (Appendix D), approximately 320 steelhead redds could be supported in the approximately 8.8 miles considered thermally suitable for steelhead in the Middle Yuba River.
FIGURE 3-14 River Reaches with Suitable Water Temperatures for Steelhead in the Middle and South Yuba Rivers
Under Current Operations (2004)
3-13
CHAPTER 3: 5BHABITAT ANALYSIS: CURRENT WATER OPERATIONS (2004)
Middle Yuba River
0
500
1000
1500
2000
2500
3000
3500
4000
4500
0 5 10 15 20 25 30 35 40 45
River Mile
Cum
ulat
ive
Num
ber o
f Red
dsBarrierRM 25.6
FIGURE 3-15
Downstream Extent of Thermally Suitable Habitat and Cumulative Number of Steelhead Redds Potentially Supported Below the First Total Barrier (RM 34.4) in the Middle Yuba River Under Current Operations
Assuming one female steelhead per redd and a sex ratio of 1:1, approximately 640 steelhead could spawn in the available habitat considered thermally suitable in the Middle Yuba River under current (2004) water operations. This prediction could be conservative because:
• Potential spawning habitat only included pool tails that were visible from the aerial video and field surveys
• Redd density was adjusted downward for small gravel sizes and low permeability
• Redd density was adjusted downward based on quality of adjacent pool habitat
• Redd density was adjusted downward to account for the effects of redd superimposition
• Redd density used in the analysis was based on a modification of the density used for spring-run Chinook salmon (see Appendix D); potential redd density for steelhead may be higher than assumed for the upper Yuba River watershed
Because predicted water temperatures in the South Yuba River downstream of the natural barrier to upstream fish passage were predicted to be above the suboptimal threshold for rearing juvenile steelhead, no area with both suitable habitat and suitable water temperatures for completion of the steelhead life cycle was identified. Based on water temperatures in 2004, high summer water temperatures in the South Yuba River would likely preclude establishment of a steelhead population. However, as previously described for spring-run Chinook salmon, further study of the temperature of water released into the South Yuba River from Lake Spaulding and refinement of the temperature model could influence this preliminary conclusion.
3-14
CHAPTER 3: 5BHABITAT ANALYSIS: CURRENT WATER OPERATIONS (2004)
3.2.3 Fall-run Chinook Salmon Spawning gravels and suitable water temperatures for fall-run Chinook salmon occur throughout the lower reaches of the Middle and South Yuba rivers. If passage was provided at Englebright Dam, fall-run Chinook salmon likely would have access to these areas, although it is difficult to predict how far upstream fall-run Chinook salmon would migrate for spawning. Figure 3-16 illustrates the cumulative number of redds that could be supported in the identified spawning areas upstream of Englebright Lake in the Middle and South Yuba rivers.
0
500
1000
1500
2000
2500
3000
3500
4000
4500
0 5 10 15 20 25 30 35 40 45
River Mile
Cum
ulat
ive
Num
ber o
f Red
ds
Middle Yuba River
South Yuba River
FIGURE 3-16
Cumulative Number of Chinook Salmon Redds Potentially Supported in the Middle and South Yuba Rivers RM 0 indicates the confluence with the North Yuba River and Englebright Lake, respectively
3.3 Integration of Habitat Analyses for Other Life Stages 3.3.1 Adult Upstream Migration The provision of unimpeded adult salmon and steelhead passage to the upper portion of the upper Yuba River watershed would be essential for introduction of these species in the watershed because the thermally suitable reaches for critical life stages (holding and rearing) would be located in the very upper reaches of the Middle Yuba River. If spring-run Chinook salmon could not migrate up to thermally suitable reaches for holding in pools prior to spawning, the adult fish could perish in downstream reaches because of stressful or lethal water temperatures. Additionally, if steelhead were only able to spawn in the lower reaches, their offspring likely could not tolerate the warm water conditions present during
3-15
CHAPTER 3: 5BHABITAT ANALYSIS: CURRENT WATER OPERATIONS (2004)
the summer months. The study team used aerial videography and field surveys to identify potential barriers for adult fish upstream migration. For the purpose of this analysis, it was assumed that passage would be provided at man-made barriers such as Our House Dam on the Middle Yuba River and at the natural low-flow barriers that exist in both rivers. Details of the passage analysis are included as Appendix C of this report.
The hydraulic factors that contribute to a fish migration barrier (stream flow combined with channel geometry) vary seasonally. The field surveys were conducted during seasonally low-flow conditions in the summer; therefore, the analysis examined historical daily flow records during the period when spring-run Chinook would migrate upstream (April to July). Because flows are naturally variable, conditions were categorized by hydrologic wet, above-normal, below-normal, dry, and critically dry water years. Based on the hydrologic analyses, fish passage at the low-flow barriers would not be impeded during wet and above-normal hydrologic conditions, but could be at least partially impeded during below-normal, dry, and critically dry conditions when average daily flows may be insufficient to ensure unimpeded fish passage. In some years, flows decline during the period of spring-run Chinook salmon migration and could block passage of later migrating fish to suitable habitats upstream of the barriers. However, even in drier years, there could be short periods of increased flows providing suitable migration conditions for Chinook salmon (due to rainfall events or water management).
Fish passage at the low-flow barriers could also be challenging for adult steelhead during the fall when flows are typically low. Although steelhead are stronger leapers than Chinook salmon, the fish would still have difficulty migrating past the barriers during low-flows during below-normal or drier hydrologic conditions. Steelhead migrating later during the winter would have a higher likelihood of successful passage when flows may be higher due to rainfall and increased runoff.
Through alteration of physical characteristics and/or altered hydrologic conditions, adequate passage for migrating adult spring-run Chinook salmon and steelhead could be provided at the natural barriers in most years. The physical alterations could include moving large boulders, modifying the localized channel gradient, and raising the elevation of plunge pools at the base of the obstruction. Physical alteration of the low-flow barriers to accommodate fish passage may be more feasible than flow augmentation. If anadromous salmonids are introduced to the upper Yuba River watershed, periodic maintenance of some sites may be necessary to ensure suitable fish passage conditions because the river channel may change periodically through bedload movement or rock slides, altering passage conditions. The habitat and water temperature analysis assumed that passage would be provided at man-made barriers such as Our House Dam and at the natural low-flow barriers. Passage options at these features would need to be considered in determining the overall feasibility of introduction of salmon and steelhead in the upper Yuba River watershed.
3.3.2 Adult Holding Because naturally occurring stream flows are typically low and ambient air temperatures are high in Central Valley streams during the summer, spring-run Chinook salmon require thermal refugia (areas with cooler water) in which to hold prior to spawning. To support spring-run Chinook salmon in the Middle Yuba River, a thermally suitable reach containing
3-16
CHAPTER 3: 5BHABITAT ANALYSIS: CURRENT WATER OPERATIONS (2004)
a sufficient amount of holding habitat must be available. Attributes of Spring-run Chinook salmon holding habitat include deep pools, cover, proximity to spawning gravels, and cool water with adequate levels of dissolved oxygen. Cover may be provided by overhanging and submerged bedrock ledges, large submerged boulders, and bubble curtains (areas of turbulent, aerated water).
The study team used aerial videography followed by field verification of specific areas to identify suitable holding habitat in the Middle Yuba River (see Appendix C). Within the reach considered thermally suitable for spring-run Chinook salmon in the Middle Yuba River (see Figure 3-12), 15 pools were identified with habitat characteristics suitable for holding of adult spring-run Chinook salmon. Each holding pool would support at least 50 to 100 adult spring-run Chinook salmon, based on observations of adult spring-run Chinook salmon holding in Mill, Deer, and Butte creeks. Based on the size and configuration of the available pools, a minimum of 750 to 1,500 adult spring-run Chinook salmon could hold in this reach. Substantially higher numbers of adult spring-run Chinook salmon have been observed holding in pools in Butte Creek, so this estimate could be conservative. The analysis suggests that adequate holding habitat would exist within the thermally suitable reach on the Middle Yuba River for the predicted number of adult spring-run Chinook salmon that could potentially spawn within this reach (approximately 500 spawners). Holding habitat capacity for spring-run Chinook salmon was not predicted for the South Yuba River because no thermally suitable habitat was identified downstream of the passage barrier.
Some localized areas in the upper Yuba River watershed that were not identifiable through aerial videography or field verification could contain suitable holding habitat for spring-run Chinook salmon. These include pools not visible from the air and areas where physical characteristics would significantly change with increased stream flows. Even though many other pools are present in the Middle Yuba River, they were not considered suitable holding habitat because other necessary features were not present (e.g., shade, overhanging cover, and bubble curtain). Depending on site-specific conditions, stream flows higher than those observed during the surveys would be expected to improve habitat attributes such as water depth and bubble curtains in some pools, providing additional holding habitat.
If spring-run Chinook salmon were introduced to the upper Yuba watershed, the fish may hold in higher densities than assumed or use additional pools beyond those identified as having suitable characteristics in this assessment; therefore, the predicted holding capacity presented here should be considered conservative. The amount of holding habitat identified appears to be adequate to support the predicted number of adults that could spawn in the thermally suitable reach. Results of the holding habitat analysis suggest that holding habitat for spring-run Chinook salmon would not limit the number of spring-run Chinook salmon that could spawn in the upper Yuba River watershed under current (2004) operations.
3.3.3 Fry and Juvenile Rearing The final step in evaluating habitat suitability for Chinook salmon and steelhead in the upper Yuba River watershed was determining whether the available rearing habitat could support the number of fry and juveniles that could be produced by the potential number of adults that could spawn in the thermally suitable reaches. This section describes the results of the evaluation for the fry life stage of Chinook salmon and steelhead (also referred to as
3-17
CHAPTER 3: 5BHABITAT ANALYSIS: CURRENT WATER OPERATIONS (2004)
young-of-year [YOY], or age 0+ fish), and the juvenile (age 1+ or older) steelhead life stage based on data collected during the initial phase of the studies program. Details of the field study on rearing habitat are included as Appendix E of this report.
The evaluation of potential fry and juvenile rearing capacity is especially important for steelhead, which typically rear in their natal stream for at least one summer and winter before outmigrating to the ocean. Because of their extended freshwater life history and the density-dependent population constraints often encountered by rearing steelhead, the production of steelhead smolts is frequently limited by the quality and quantity of rearing habitat (Stillwater Sciences, 2006). In contrast, Chinook salmon that adopt an ocean-type life history strategy (outmigrating as fry in their first winter or spring) are subject to fewer density-dependent effects that may limit population success during their short fresh water residence. Although spring-run Chinook salmon typically adopt a stream type life history strategy whereby they rear in fresh water for a year or more, high stream temperatures may cause Chinook salmon to abandon this strategy and outmigrate sooner (Nicholas and Hankin, 1989). Similar to what has been observed in Butte Creek (Ward et al., 2004a, b), Chinook salmon introduced into the upper Yuba River watershed may exhibit an ocean-type life history strategy due to the relatively high summer stream temperatures.
The number of Chinook salmon and steelhead that could rear over the summer in thermally suitable reaches of the Middle and South Yuba rivers was predicted by multiplying observed habitat-specific rearing densities (fish per unit area) for each species by the amount of habitat area available in these reaches. The rearing densities for spring-run Chinook salmon fry used in the analysis were derived from snorkel survey data collected in 1992 in Deer Creek, Lassen National Forest, California (USDA Forest Service, unpubl. data). Steelhead rearing densities used in the analysis were derived from rainbow trout snorkel survey data collected by T.R. Payne and Associates in the Middle and South Yuba rivers in summer 2004 (Appendix G). The amount of rearing habitat available for each species under current (2004) operations was estimated using data collected during the rearing habitat investigation (Appendix E). Predicted rearing capacities for each habitat type (e.g., pool, riffle, run) were summed to derive the total predicted rearing capacity for Chinook salmon and steelhead in each thermally suitable reach.
Spring-run Chinook Salmon Under current (2004) operations, it was predicted that approximately 5.6 miles of thermally suitable habitat for spring-run Chinook salmon would be present in the Middle Yuba River downstream of the barrier at RM 34.4 (see Figure 3-12) if the fry outmigrate during the winter or spring and avoid high summer water temperatures. Spring-run Chinook salmon fry remaining to rear in the Middle Yuba River during summer would be restricted by high water temperatures to the 3.7 mile reach upstream of RM 30.7. However, because water temperatures in the Middle Yuba River would not be expected to exceed the 18.3°C critical rearing threshold at any location until late May or early June (see Figure 3-6), thermally suitable rearing habitat for spring-run Chinook salmon would be present throughout the river until this time. Chinook salmon fry that do not remain to rear in the upper reach where they hatched could still rear and outmigrate successfully if they left the river by the end of May.
3-18
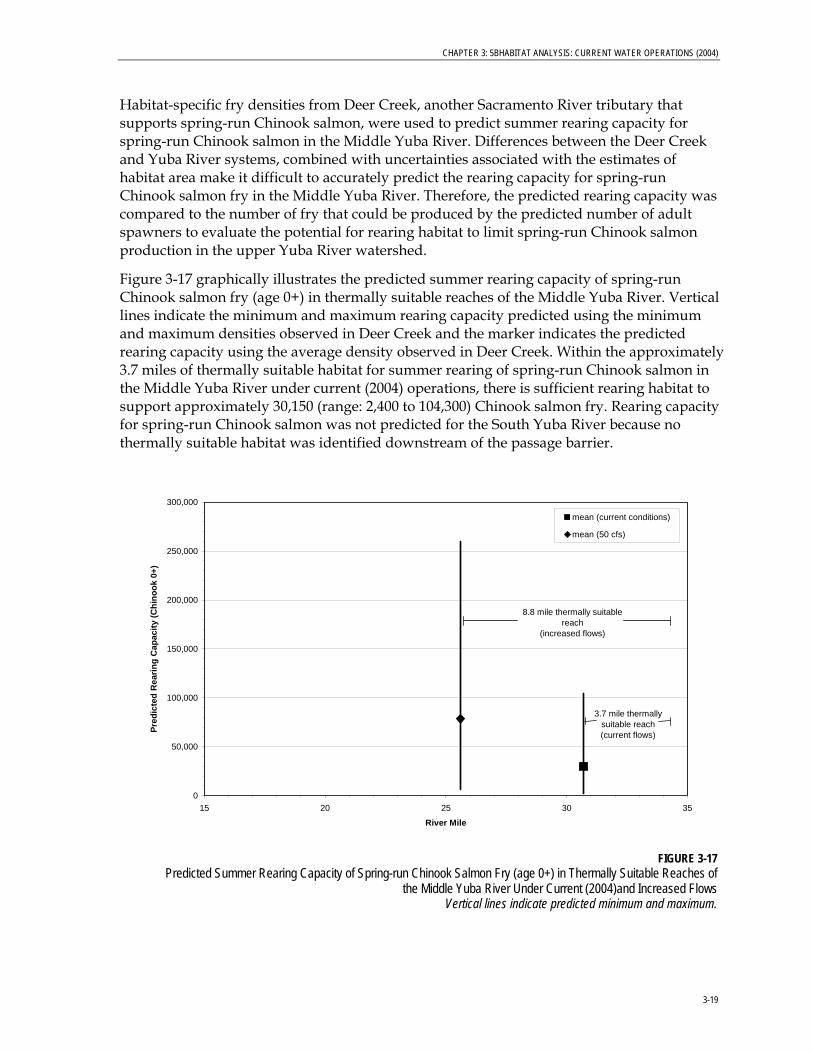
CHAPTER 3: 5BHABITAT ANALYSIS: CURRENT WATER OPERATIONS (2004)
Habitat-specific fry densities from Deer Creek, another Sacramento River tributary that supports spring-run Chinook salmon, were used to predict summer rearing capacity for spring-run Chinook salmon in the Middle Yuba River. Differences between the Deer Creek and Yuba River systems, combined with uncertainties associated with the estimates of habitat area make it difficult to accurately predict the rearing capacity for spring-run Chinook salmon fry in the Middle Yuba River. Therefore, the predicted rearing capacity was compared to the number of fry that could be produced by the predicted number of adult spawners to evaluate the potential for rearing habitat to limit spring-run Chinook salmon production in the upper Yuba River watershed.
Figure 3-17 graphically illustrates the predicted summer rearing capacity of spring-run Chinook salmon fry (age 0+) in thermally suitable reaches of the Middle Yuba River. Vertical lines indicate the minimum and maximum rearing capacity predicted using the minimum and maximum densities observed in Deer Creek and the marker indicates the predicted rearing capacity using the average density observed in Deer Creek. Within the approximately 3.7 miles of thermally suitable habitat for summer rearing of spring-run Chinook salmon in the Middle Yuba River under current (2004) operations, there is sufficient rearing habitat to support approximately 30,150 (range: 2,400 to 104,300) Chinook salmon fry. Rearing capacity for spring-run Chinook salmon was not predicted for the South Yuba River because no thermally suitable habitat was identified downstream of the passage barrier.
0
50,000
100,000
150,000
200,000
250,000
300,000
15 20 25 30 35
River Mile
Pred
icte
d R
earin
g C
apac
ity (C
hino
ok 0
+)
mean (current conditions)
mean (50 cfs)
8.8 mile thermally suitable reach
(increased flows)
3.7 mile thermally suitable reach (current flows)
FIGURE 3-17 Predicted Summer Rearing Capacity of Spring-run Chinook Salmon Fry (age 0+) in Thermally Suitable Reaches of
the Middle Yuba River Under Current (2004)and Increased Flows Vertical lines indicate predicted minimum and maximum.
3-19
CHAPTER 3: 5BHABITAT ANALYSIS: CURRENT WATER OPERATIONS (2004)
The predicted number of emergent fry that could be produced from the number of adults potentially spawning in this reach of the Middle Yuba River is approximately 570,000. This calculation assumes a fecundity of 5,000 eggs per female (Moyle, 2002) and a predicted survival-to-emergence of 76 percent (based on gravel permeability measurements4 [Appendix D]). Comparison to the predicted number of juveniles that could rear over the summer in the identified thermally suitable reach under existing conditions (30,150) suggests that the number of emergent fry would far exceed the summer rearing capacity of the thermally suitable habitat in the Middle Yuba River. If many spring-run Chinook salmon fry adopted an ocean-type strategy and began migrating downstream shortly after emergence, leaving the Middle Yuba River before water temperatures become limiting in the downstream reaches, then rearing habitat would not be a factor limiting spring-run Chinook salmon production. Rearing habitat capacity could be a limiting factor on the number of spring-run Chinook salmon that could be supported in the Middle Yuba River if juvenile salmon remained in the river over the summer.
The predicted rearing capacity is based on the best available information, but may be conservative because:
• The GIS analysis and limited field verification used to derive estimates of available rearing habitat may have underestimated the amount of habitat
• Potential Chinook salmon rearing densities in the upper Yuba River watershed may be higher than the densities observed in Deer Creek and used in this analysis
Available information is insufficient to conclusively determine whether the available habitat in the thermally suitable reaches would support a sufficient number of fry or juveniles, which would ultimately return as adult spawners, to maintain a naturally self-sustaining population. However, because juvenile spring-run Chinook salmon could adopt an ocean-type strategy and leave the river before water temperatures become limiting, summer rearing habitat for spring-run Chinook salmon juveniles may not be a factor limiting production in the upper Yuba River watershed. A more sophisticated analysis using a population model incorporating time series analysis may be necessary to gain further resolution on whether the predicted number of adult spawners could be sustained over the long term.
Steelhead It was predicted that suitable summer rearing temperatures for steelhead in the Middle Yuba River under current (2004) water operations would extend about 8.8 miles downstream of the natural barrier at RM 34.4 (see Figure 3-14). Although water temperatures during the remainder of the year (late September to May) are expected to remain below the suboptimal rearing temperature threshold of 20°C (see Figure 3-10), steelhead moving downstream to rear during this cooler time period would have to emigrate from the system before water temperatures again reached the critical threshold the following summer or return to upstream areas with cooler water to avoid being subjected to the stressful and potentially lethal effects of the high downstream temperatures. Due to the presence of low-flow migration barriers in downstream reaches of the Middle Yuba River (Appendix C) it was assumed that upstream movement by rearing steelhead would be
4 Measured permeability rates can be converted into an index of predicted survival rates from egg deposition to fry emergence (i.e., survival-to-emergence rates) using relationships derived from field observations of redds with differing permeabilities (Tagart 1976) and studies where the permeability of artificial redds was manipulated experimentally (McCuddin 1977).
3-20
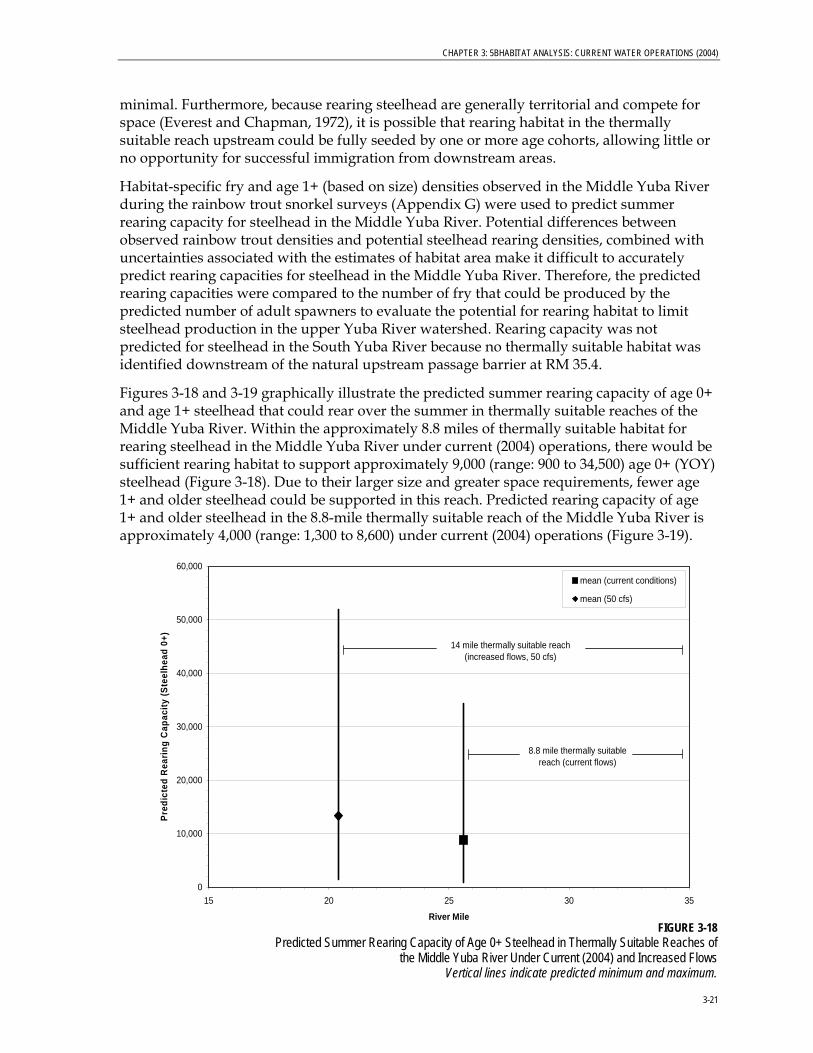
CHAPTER 3: 5BHABITAT ANALYSIS: CURRENT WATER OPERATIONS (2004)
minimal. Furthermore, because rearing steelhead are generally territorial and compete for space (Everest and Chapman, 1972), it is possible that rearing habitat in the thermally suitable reach upstream could be fully seeded by one or more age cohorts, allowing little or no opportunity for successful immigration from downstream areas.
Habitat-specific fry and age 1+ (based on size) densities observed in the Middle Yuba River during the rainbow trout snorkel surveys (Appendix G) were used to predict summer rearing capacity for steelhead in the Middle Yuba River. Potential differences between observed rainbow trout densities and potential steelhead rearing densities, combined with uncertainties associated with the estimates of habitat area make it difficult to accurately predict rearing capacities for steelhead in the Middle Yuba River. Therefore, the predicted rearing capacities were compared to the number of fry that could be produced by the predicted number of adult spawners to evaluate the potential for rearing habitat to limit steelhead production in the upper Yuba River watershed. Rearing capacity was not predicted for steelhead in the South Yuba River because no thermally suitable habitat was identified downstream of the natural upstream passage barrier at RM 35.4.
Figures 3-18 and 3-19 graphically illustrate the predicted summer rearing capacity of age 0+ and age 1+ steelhead that could rear over the summer in thermally suitable reaches of the Middle Yuba River. Within the approximately 8.8 miles of thermally suitable habitat for rearing steelhead in the Middle Yuba River under current (2004) operations, there would be sufficient rearing habitat to support approximately 9,000 (range: 900 to 34,500) age 0+ (YOY) steelhead (Figure 3-18). Due to their larger size and greater space requirements, fewer age 1+ and older steelhead could be supported in this reach. Predicted rearing capacity of age 1+ and older steelhead in the 8.8-mile thermally suitable reach of the Middle Yuba River is approximately 4,000 (range: 1,300 to 8,600) under current (2004) operations (Figure 3-19).
0
10,000
20,000
30,000
40,000
50,000
60,000
15 20 25 30 35
River Mile
Pred
icte
d R
earin
g C
apac
ity (S
teel
head
0+)
mean (current conditions)
mean (50 cfs)
8.8 mile thermally suitablereach (current flows)
14 mile thermally suitable reach (increased flows, 50 cfs)
FIGURE 3-18
Predicted Summer Rearing Capacity of Age 0+ Steelhead in Thermally Suitable Reaches of the Middle Yuba River Under Current (2004) and Increased Flows
Vertical lines indicate predicted minimum and maximum.
3-21
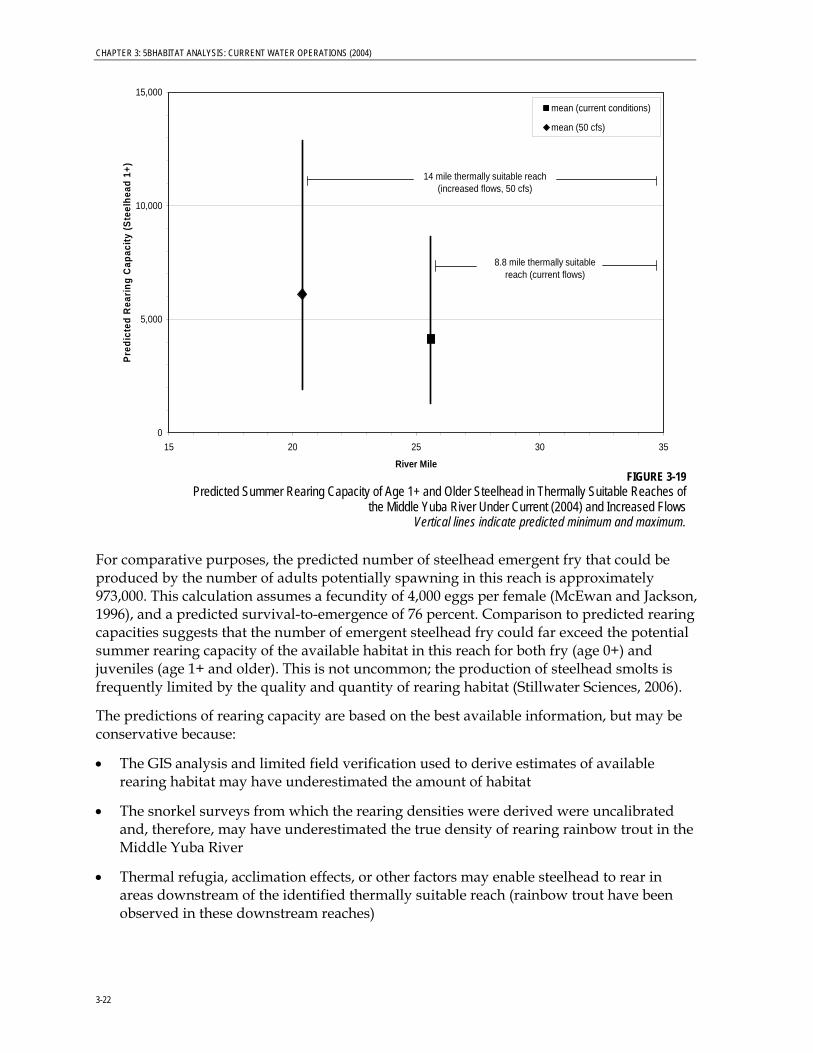
CHAPTER 3: 5BHABITAT ANALYSIS: CURRENT WATER OPERATIONS (2004)
0
5,000
10,000
15,000
15 20 25 30 35
River Mile
Pred
icte
d R
earin
g C
apac
ity (S
teel
head
1+)
mean (current conditions)
mean (50 cfs)
8.8 mile thermally suitable reach (current flows)
14 mile thermally suitable reach (increased flows, 50 cfs)
FIGURE 3-19
Predicted Summer Rearing Capacity of Age 1+ and Older Steelhead in Thermally Suitable Reaches of the Middle Yuba River Under Current (2004) and Increased Flows
Vertical lines indicate predicted minimum and maximum.
For comparative purposes, the predicted number of steelhead emergent fry that could be produced by the number of adults potentially spawning in this reach is approximately 973,000. This calculation assumes a fecundity of 4,000 eggs per female (McEwan and Jackson, 1996), and a predicted survival-to-emergence of 76 percent. Comparison to predicted rearing capacities suggests that the number of emergent steelhead fry could far exceed the potential summer rearing capacity of the available habitat in this reach for both fry (age 0+) and juveniles (age 1+ and older). This is not uncommon; the production of steelhead smolts is frequently limited by the quality and quantity of rearing habitat (Stillwater Sciences, 2006).
The predictions of rearing capacity are based on the best available information, but may be conservative because:
• The GIS analysis and limited field verification used to derive estimates of available rearing habitat may have underestimated the amount of habitat
• The snorkel surveys from which the rearing densities were derived were uncalibrated and, therefore, may have underestimated the true density of rearing rainbow trout in the Middle Yuba River
• Thermal refugia, acclimation effects, or other factors may enable steelhead to rear in areas downstream of the identified thermally suitable reach (rainbow trout have been observed in these downstream reaches)
3-22

CHAPTER 3: 5BHABITAT ANALYSIS: CURRENT WATER OPERATIONS (2004)
3-23
Insufficient information exists to conclusively determine whether the available habitat in the thermally suitable reaches would support a sufficient number of fry and juvenile steelhead to maintain a naturally self-sustaining population. However, due to the conservative nature of the predictions and the uncertainties described above, results of the rearing habitat analysis suggest that summer rearing habitat would not limit production of adult steelhead in the upper Yuba River watershed. A more sophisticated analysis using a population model incorporating time series analysis may be necessary to gain further resolution on whether the predicted number of adult spawners could be sustained over the long term.
CHAPTER 4
Habitat Analysis: Increased Flows
The water temperature model was used as a preliminary screening tool to evaluate the effect of incremental flow increases on water temperatures during summer base flow conditions. The water temperature model described in Appendix A was used to predict the effect of increased releases from Jackson Meadows Reservoir through Milton Reservoir on water temperatures in the Middle Yuba River. No change in water temperature at the release point was modeled. This analysis was conducted to assess the sensitivity of water temperature to stream flow and to evaluate whether increased flows could provide additional thermally suitable habitat for spring-run Chinook salmon and steelhead in the Upper Yuba River watershed. The range of increased flows was chosen based on the reasonable limits of the water temperature model, and was not intended to be used as recommendations for minimum flow requirements.
Because of the uncertainty regarding the temperature of water released from Lake Spaulding under an increased flow scenario and the potential influence of water entering the South Yuba from Jordan Creek (see Section 5.1.2), no modeling of increased flows was conducted on the South Yuba River. As additional information on the temperature of water released from Lake Spaulding and in Jordan Creek becomes available, the water temperature model could be extended above Langs Crossing to examine the potential for increased flows from Lake Spaulding to provide additional habitat with suitable water temperatures for Chinook salmon and steelhead in the South Yuba River.
Output from the water temperature model was used to identify river reaches that would have suitable water temperatures at the highest modeled flow (50 cfs). While intermediate flows (i.e., 10, 20, 30, and 40 cfs) were modeled, only results from model runs with the highest flow (50 cfs) are reported here. The downstream extent of thermally suitable reaches with intermediate flows would be between those identified under current (2004) operations and those identified here for release flows of 50 cfs. Only reaches available to spring-run Chinook salmon and steelhead (i.e., below the first total barrier to upstream migration) were assessed for thermal suitability. The following section presents the results of the analysis and identifies the thermally suitable reaches available for each life stage of spring-run Chinook salmon and steelhead, and the predicted number of spring-run Chinook salmon and steelhead that could be supported in the thermally suitable habitat.
4.1 Thermally Suitable Reaches 4.1.1 Spring-run Chinook Salmon Because water temperatures are naturally cool during the upstream migration period and were not considered limiting under current water operations, thermally suitable habitat was evaluated only for the adult holding, spawning and incubation, and juvenile rearing life stages of spring-run Chinook salmon with increased flows.
4-1
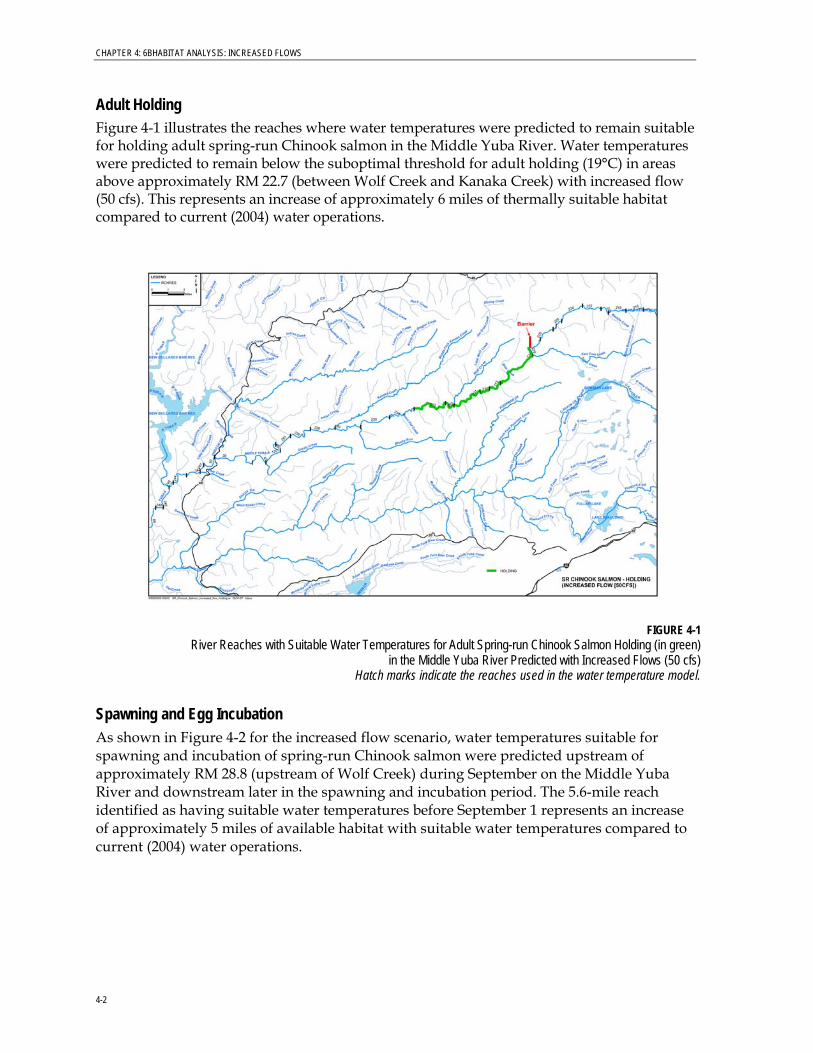
CHAPTER 4: 6BHABITAT ANALYSIS: INCREASED FLOWS
Adult Holding Figure 4-1 illustrates the reaches where water temperatures were predicted to remain suitable for holding adult spring-run Chinook salmon in the Middle Yuba River. Water temperatures were predicted to remain below the suboptimal threshold for adult holding (19°C) in areas above approximately RM 22.7 (between Wolf Creek and Kanaka Creek) with increased flow (50 cfs). This represents an increase of approximately 6 miles of thermally suitable habitat compared to current (2004) water operations.
FIGURE 4-1 River Reaches with Suitable Water Temperatures for Adult Spring-run Chinook Salmon Holding (in green)
in the Middle Yuba River Predicted with Increased Flows (50 cfs) Hatch marks indicate the reaches used in the water temperature model.
Spawning and Egg Incubation As shown in Figure 4-2 for the increased flow scenario, water temperatures suitable for spawning and incubation of spring-run Chinook salmon were predicted upstream of approximately RM 28.8 (upstream of Wolf Creek) during September on the Middle Yuba River and downstream later in the spawning and incubation period. The 5.6-mile reach identified as having suitable water temperatures before September 1 represents an increase of approximately 5 miles of available habitat with suitable water temperatures compared to current (2004) water operations.
4-2
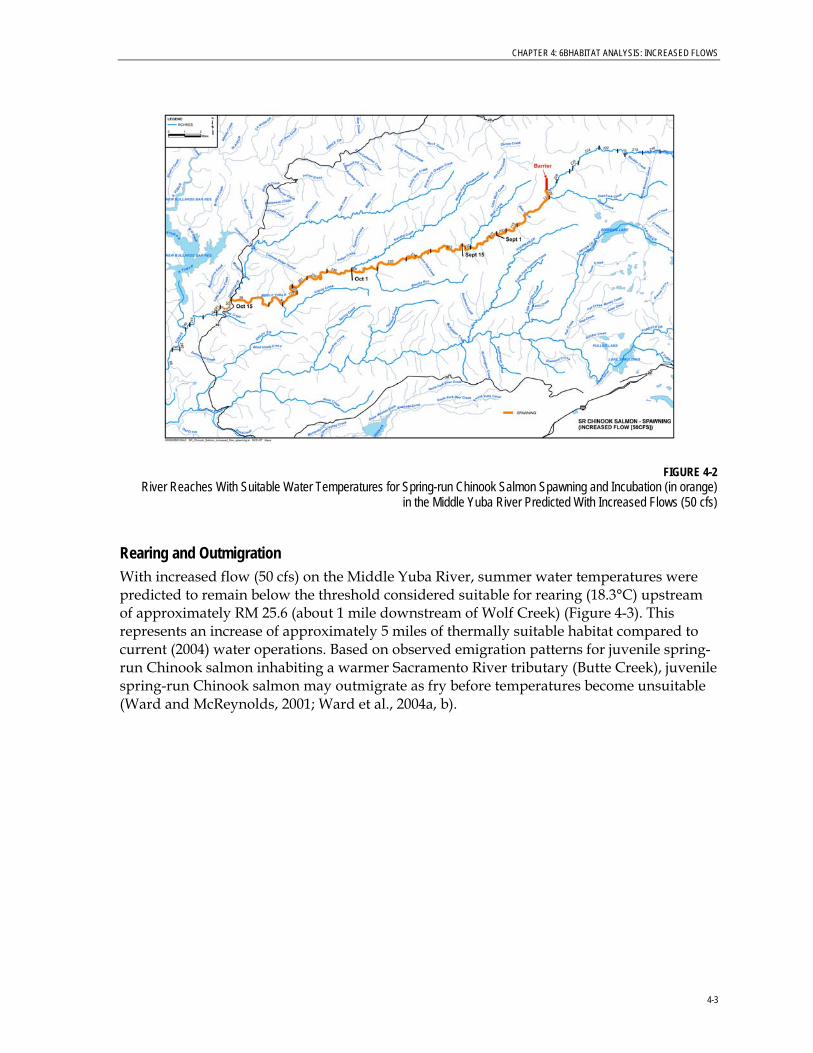
CHAPTER 4: 6BHABITAT ANALYSIS: INCREASED FLOWS
FIGURE 4-2 River Reaches With Suitable Water Temperatures for Spring-run Chinook Salmon Spawning and Incubation (in orange)
in the Middle Yuba River Predicted With Increased Flows (50 cfs)
Rearing and Outmigration With increased flow (50 cfs) on the Middle Yuba River, summer water temperatures were predicted to remain below the threshold considered suitable for rearing (18.3°C) upstream of approximately RM 25.6 (about 1 mile downstream of Wolf Creek) (Figure 4-3). This represents an increase of approximately 5 miles of thermally suitable habitat compared to current (2004) water operations. Based on observed emigration patterns for juvenile spring-run Chinook salmon inhabiting a warmer Sacramento River tributary (Butte Creek), juvenile spring-run Chinook salmon may outmigrate as fry before temperatures become unsuitable (Ward and McReynolds, 2001; Ward et al., 2004a, b).
4-3
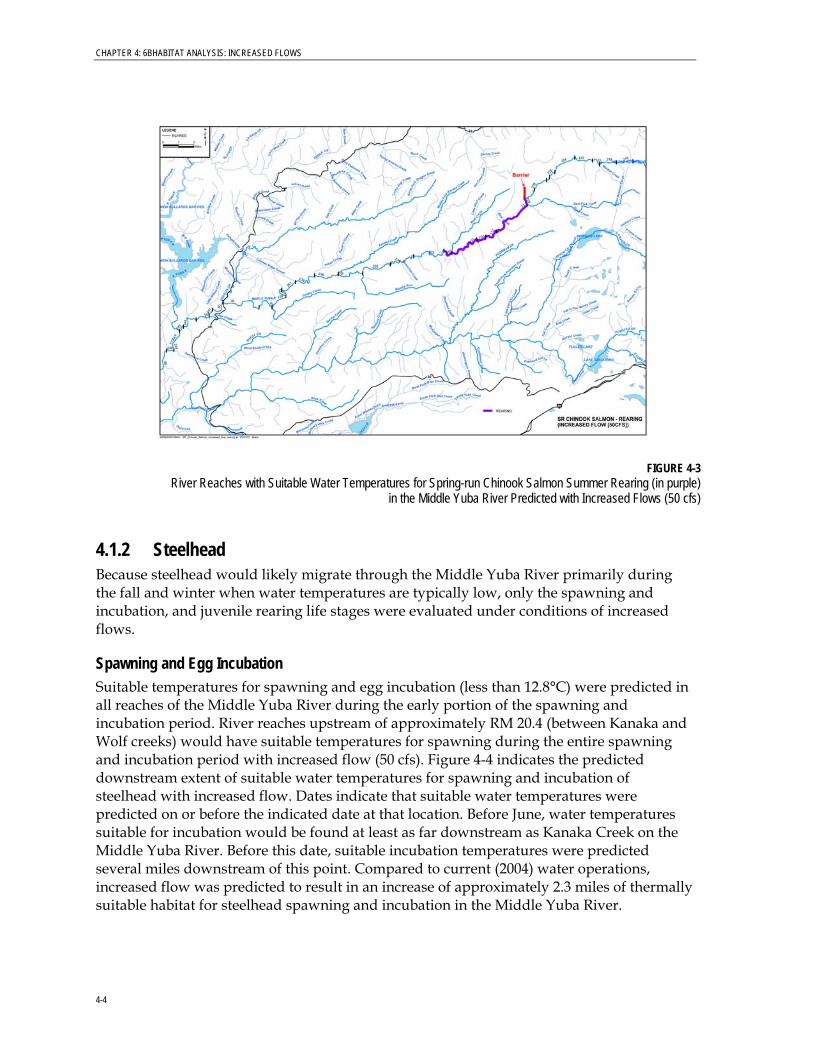
CHAPTER 4: 6BHABITAT ANALYSIS: INCREASED FLOWS
FIGURE 4-3 River Reaches with Suitable Water Temperatures for Spring-run Chinook Salmon Summer Rearing (in purple)
in the Middle Yuba River Predicted with Increased Flows (50 cfs)
4.1.2 Steelhead Because steelhead would likely migrate through the Middle Yuba River primarily during the fall and winter when water temperatures are typically low, only the spawning and incubation, and juvenile rearing life stages were evaluated under conditions of increased flows.
Spawning and Egg Incubation Suitable temperatures for spawning and egg incubation (less than 12.8°C) were predicted in all reaches of the Middle Yuba River during the early portion of the spawning and incubation period. River reaches upstream of approximately RM 20.4 (between Kanaka and Wolf creeks) would have suitable temperatures for spawning during the entire spawning and incubation period with increased flow (50 cfs). Figure 4-4 indicates the predicted downstream extent of suitable water temperatures for spawning and incubation of steelhead with increased flow. Dates indicate that suitable water temperatures were predicted on or before the indicated date at that location. Before June, water temperatures suitable for incubation would be found at least as far downstream as Kanaka Creek on the Middle Yuba River. Before this date, suitable incubation temperatures were predicted several miles downstream of this point. Compared to current (2004) water operations, increased flow was predicted to result in an increase of approximately 2.3 miles of thermally suitable habitat for steelhead spawning and incubation in the Middle Yuba River.
4-4
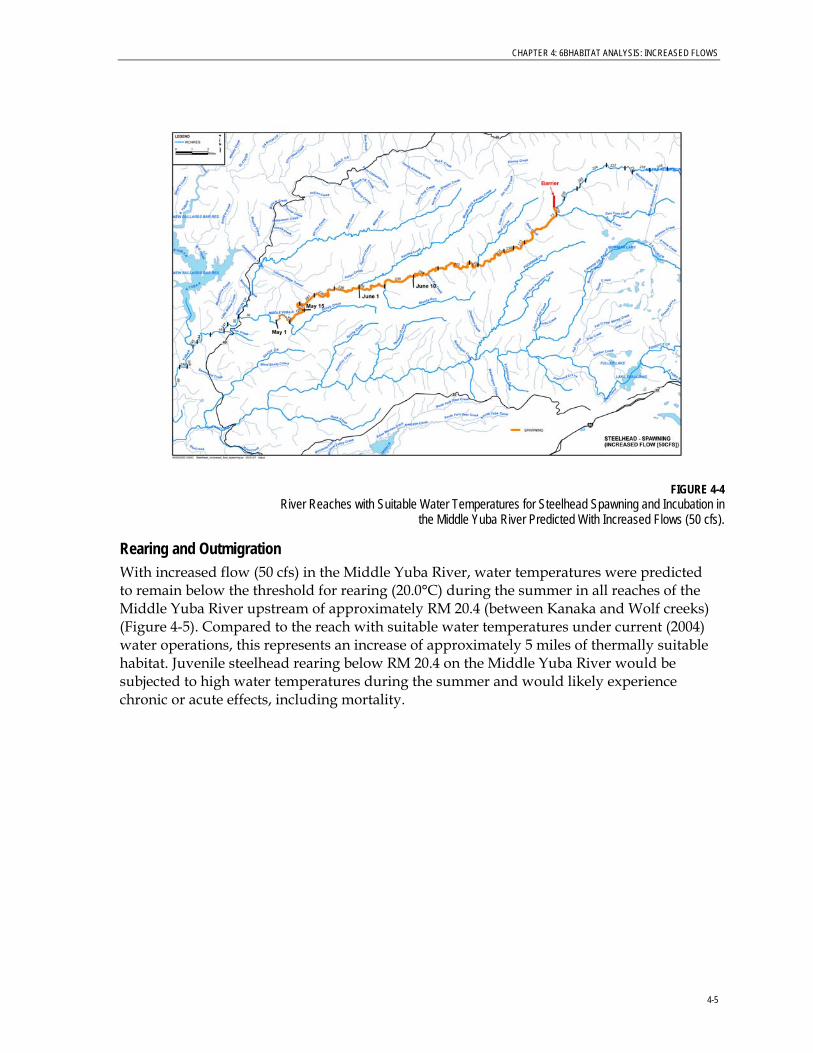
CHAPTER 4: 6BHABITAT ANALYSIS: INCREASED FLOWS
FIGURE 4-4 River Reaches with Suitable Water Temperatures for Steelhead Spawning and Incubation in
the Middle Yuba River Predicted With Increased Flows (50 cfs). Rearing and Outmigration With increased flow (50 cfs) in the Middle Yuba River, water temperatures were predicted to remain below the threshold for rearing (20.0°C) during the summer in all reaches of the Middle Yuba River upstream of approximately RM 20.4 (between Kanaka and Wolf creeks) (Figure 4-5). Compared to the reach with suitable water temperatures under current (2004) water operations, this represents an increase of approximately 5 miles of thermally suitable habitat. Juvenile steelhead rearing below RM 20.4 on the Middle Yuba River would be subjected to high water temperatures during the summer and would likely experience chronic or acute effects, including mortality.
4-5
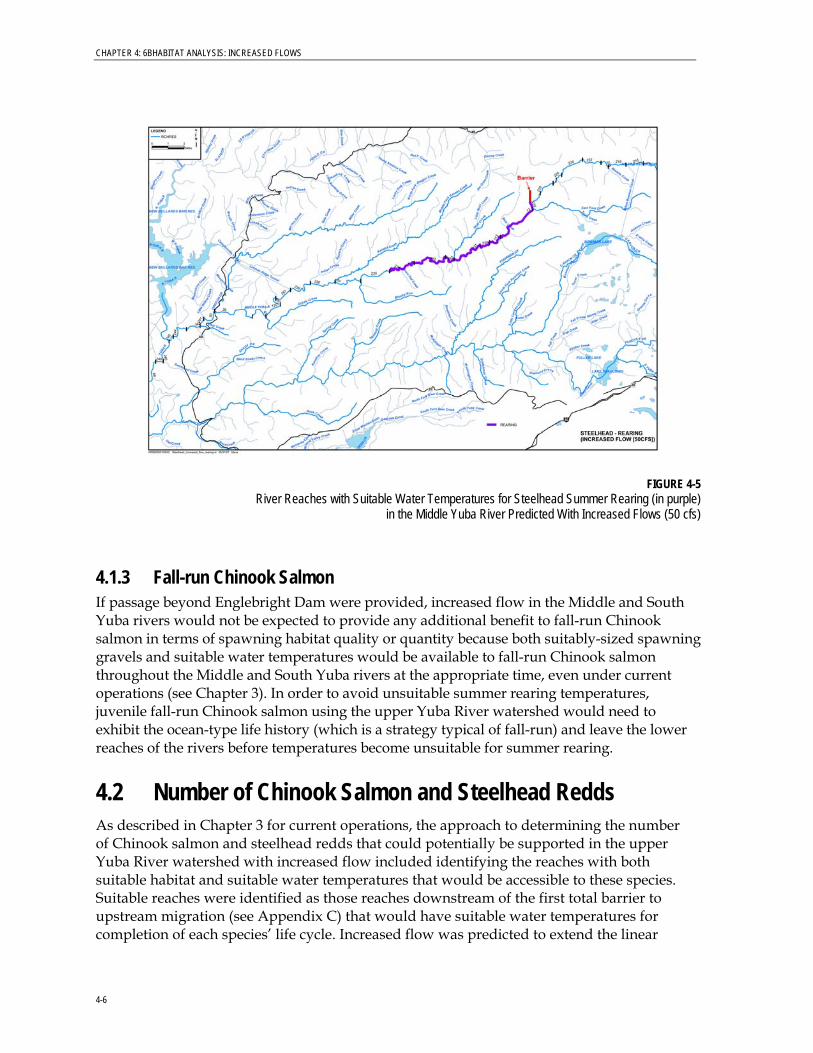
CHAPTER 4: 6BHABITAT ANALYSIS: INCREASED FLOWS
FIGURE 4-5 River Reaches with Suitable Water Temperatures for Steelhead Summer Rearing (in purple)
in the Middle Yuba River Predicted With Increased Flows (50 cfs)
4.1.3 Fall-run Chinook Salmon If passage beyond Englebright Dam were provided, increased flow in the Middle and South Yuba rivers would not be expected to provide any additional benefit to fall-run Chinook salmon in terms of spawning habitat quality or quantity because both suitably-sized spawning gravels and suitable water temperatures would be available to fall-run Chinook salmon throughout the Middle and South Yuba rivers at the appropriate time, even under current operations (see Chapter 3). In order to avoid unsuitable summer rearing temperatures, juvenile fall-run Chinook salmon using the upper Yuba River watershed would need to exhibit the ocean-type life history (which is a strategy typical of fall-run) and leave the lower reaches of the rivers before temperatures become unsuitable for summer rearing.
4.2 Number of Chinook Salmon and Steelhead Redds As described in Chapter 3 for current operations, the approach to determining the number of Chinook salmon and steelhead redds that could potentially be supported in the upper Yuba River watershed with increased flow included identifying the reaches with both suitable habitat and suitable water temperatures that would be accessible to these species. Suitable reaches were identified as those reaches downstream of the first total barrier to upstream migration (see Appendix C) that would have suitable water temperatures for completion of each species’ life cycle. Increased flow was predicted to extend the linear
4-6
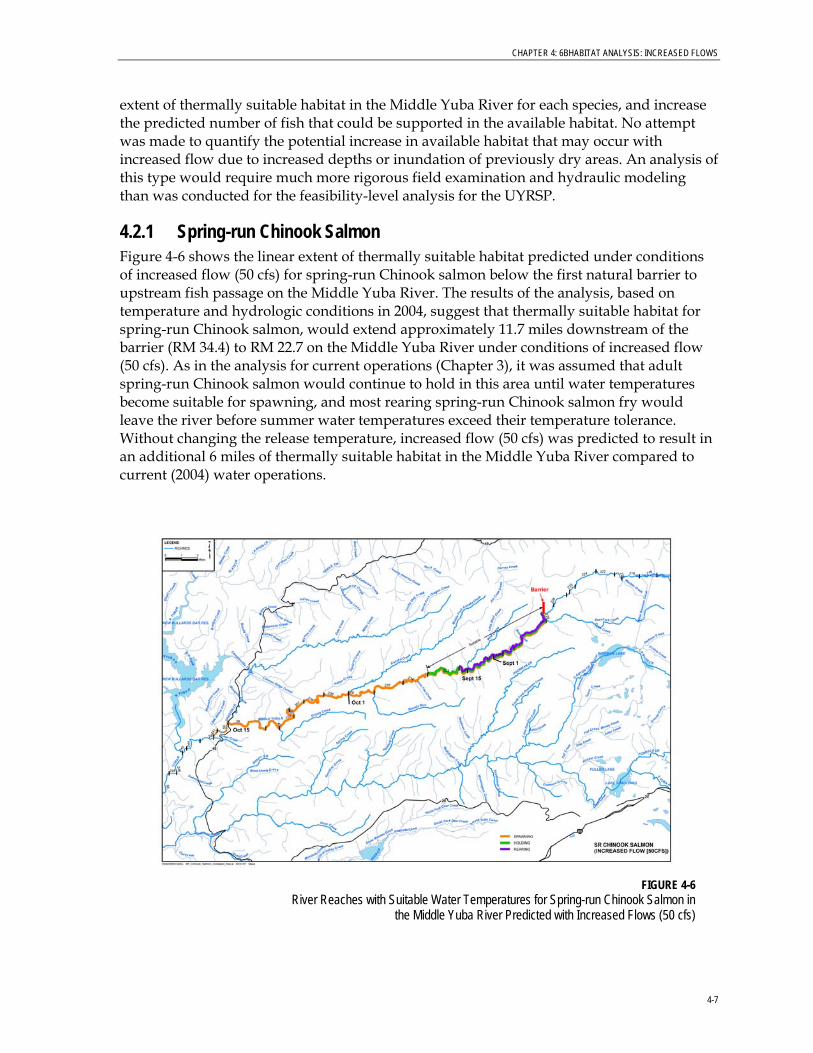
CHAPTER 4: 6BHABITAT ANALYSIS: INCREASED FLOWS
extent of thermally suitable habitat in the Middle Yuba River for each species, and increase the predicted number of fish that could be supported in the available habitat. No attempt was made to quantify the potential increase in available habitat that may occur with increased flow due to increased depths or inundation of previously dry areas. An analysis of this type would require much more rigorous field examination and hydraulic modeling than was conducted for the feasibility-level analysis for the UYRSP.
4.2.1 Spring-run Chinook Salmon Figure 4-6 shows the linear extent of thermally suitable habitat predicted under conditions of increased flow (50 cfs) for spring-run Chinook salmon below the first natural barrier to upstream fish passage on the Middle Yuba River. The results of the analysis, based on temperature and hydrologic conditions in 2004, suggest that thermally suitable habitat for spring-run Chinook salmon, would extend approximately 11.7 miles downstream of the barrier (RM 34.4) to RM 22.7 on the Middle Yuba River under conditions of increased flow (50 cfs). As in the analysis for current operations (Chapter 3), it was assumed that adult spring-run Chinook salmon would continue to hold in this area until water temperatures become suitable for spawning, and most rearing spring-run Chinook salmon fry would leave the river before summer water temperatures exceed their temperature tolerance. Without changing the release temperature, increased flow (50 cfs) was predicted to result in an additional 6 miles of thermally suitable habitat in the Middle Yuba River compared to current (2004) water operations.
FIGURE 4-6
River Reaches with Suitable Water Temperatures for Spring-run Chinook Salmon in the Middle Yuba River Predicted with Increased Flows (50 cfs)
4-7
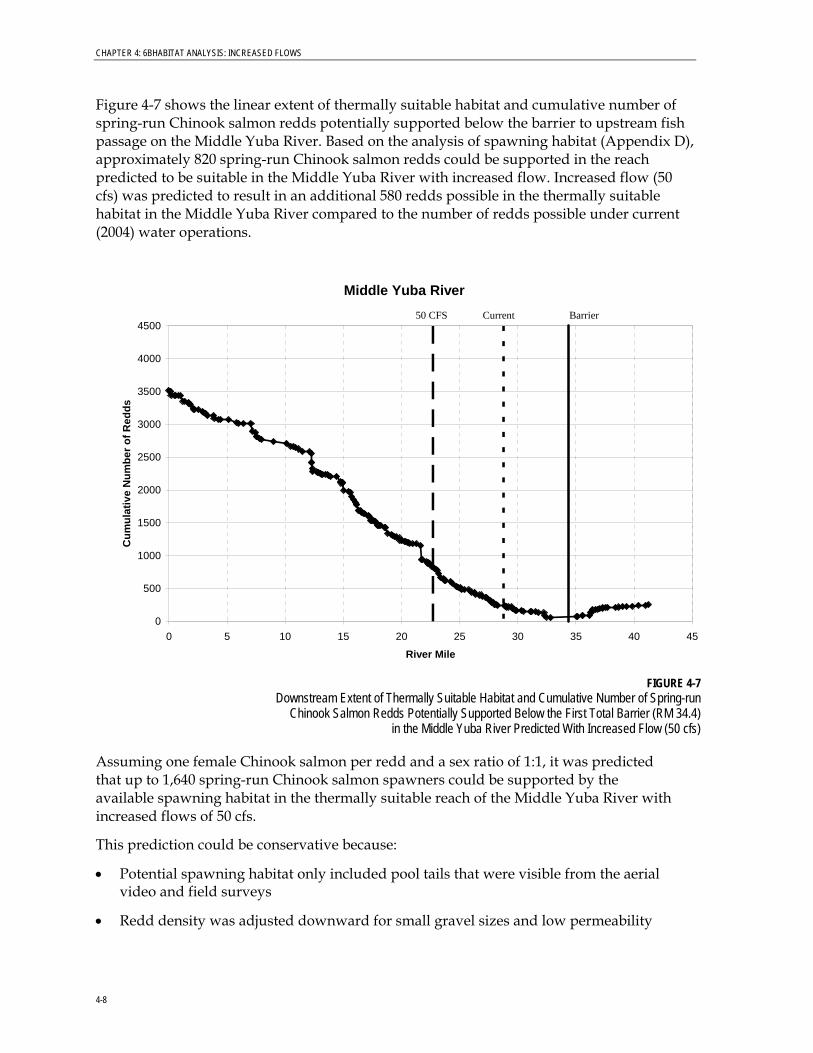
CHAPTER 4: 6BHABITAT ANALYSIS: INCREASED FLOWS
Figure 4-7 shows the linear extent of thermally suitable habitat and cumulative number of spring-run Chinook salmon redds potentially supported below the barrier to upstream fish passage on the Middle Yuba River. Based on the analysis of spawning habitat (Appendix D), approximately 820 spring-run Chinook salmon redds could be supported in the reach predicted to be suitable in the Middle Yuba River with increased flow. Increased flow (50 cfs) was predicted to result in an additional 580 redds possible in the thermally suitable habitat in the Middle Yuba River compared to the number of redds possible under current (2004) water operations.
Middle Yuba River
0
500
1000
1500
2000
2500
3000
3500
4000
4500
0 5 10 15 20 25 30 35 40 45
River Mile
Cum
ulat
ive
Num
ber o
f Red
ds
BarrierCurrent50 CFS
FIGURE 4-7
Downstream Extent of Thermally Suitable Habitat and Cumulative Number of Spring-run Chinook Salmon Redds Potentially Supported Below the First Total Barrier (RM 34.4)
in the Middle Yuba River Predicted With Increased Flow (50 cfs)
Assuming one female Chinook salmon per redd and a sex ratio of 1:1, it was predicted that up to 1,640 spring-run Chinook salmon spawners could be supported by the available spawning habitat in the thermally suitable reach of the Middle Yuba River with increased flows of 50 cfs.
This prediction could be conservative because:
• Potential spawning habitat only included pool tails that were visible from the aerial video and field surveys
• Redd density was adjusted downward for small gravel sizes and low permeability
4-8
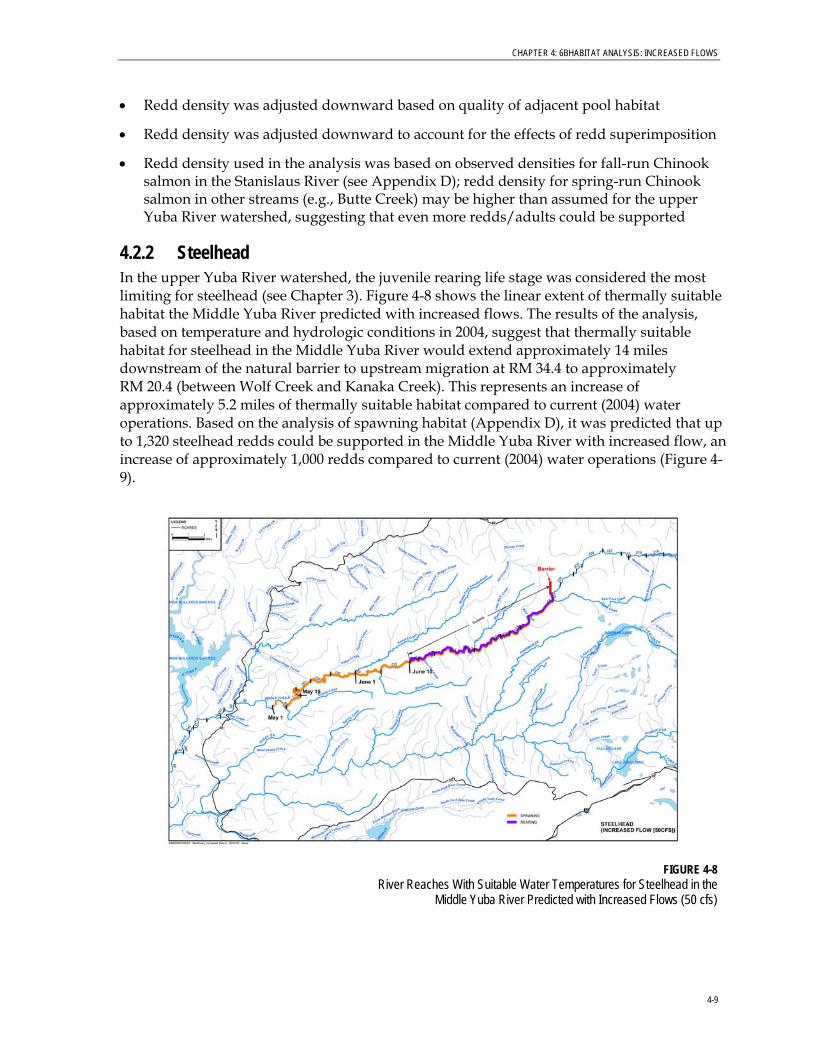
CHAPTER 4: 6BHABITAT ANALYSIS: INCREASED FLOWS
• Redd density was adjusted downward based on quality of adjacent pool habitat
• Redd density was adjusted downward to account for the effects of redd superimposition
• Redd density used in the analysis was based on observed densities for fall-run Chinook salmon in the Stanislaus River (see Appendix D); redd density for spring-run Chinook salmon in other streams (e.g., Butte Creek) may be higher than assumed for the upper Yuba River watershed, suggesting that even more redds/adults could be supported
4.2.2 Steelhead In the upper Yuba River watershed, the juvenile rearing life stage was considered the most limiting for steelhead (see Chapter 3). Figure 4-8 shows the linear extent of thermally suitable habitat the Middle Yuba River predicted with increased flows. The results of the analysis, based on temperature and hydrologic conditions in 2004, suggest that thermally suitable habitat for steelhead in the Middle Yuba River would extend approximately 14 miles downstream of the natural barrier to upstream migration at RM 34.4 to approximately RM 20.4 (between Wolf Creek and Kanaka Creek). This represents an increase of approximately 5.2 miles of thermally suitable habitat compared to current (2004) water operations. Based on the analysis of spawning habitat (Appendix D), it was predicted that up to 1,320 steelhead redds could be supported in the Middle Yuba River with increased flow, an increase of approximately 1,000 redds compared to current (2004) water operations (Figure 4-9).
FIGURE 4-8 River Reaches With Suitable Water Temperatures for Steelhead in the
Middle Yuba River Predicted with Increased Flows (50 cfs)
4-9
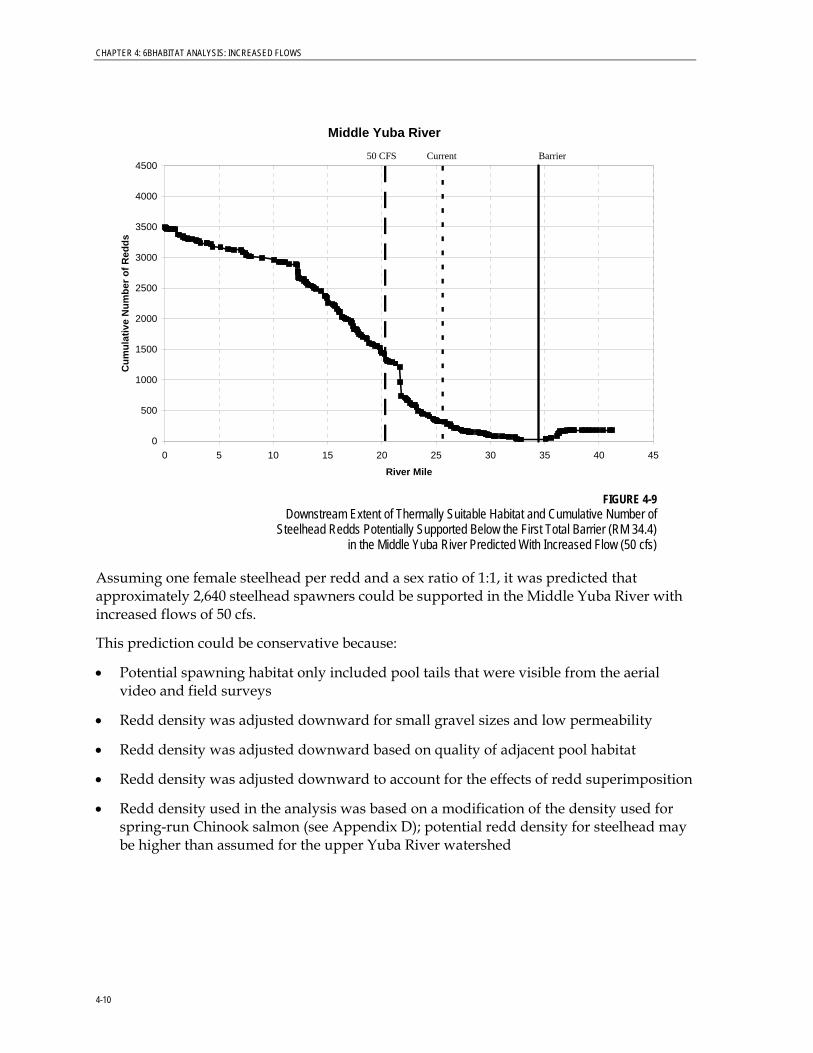
CHAPTER 4: 6BHABITAT ANALYSIS: INCREASED FLOWS
Middle Yuba River
0
500
1000
1500
2000
2500
3000
3500
4000
4500
0 5 10 15 20 25 30 35 40 45
River Mile
Cum
ulat
ive
Num
ber o
f Red
ds
BarrierCurrent50 CFS
FIGURE 4-9 Downstream Extent of Thermally Suitable Habitat and Cumulative Number of
Steelhead Redds Potentially Supported Below the First Total Barrier (RM 34.4) in the Middle Yuba River Predicted With Increased Flow (50 cfs)
Assuming one female steelhead per redd and a sex ratio of 1:1, it was predicted that approximately 2,640 steelhead spawners could be supported in the Middle Yuba River with increased flows of 50 cfs.
This prediction could be conservative because:
• Potential spawning habitat only included pool tails that were visible from the aerial video and field surveys
• Redd density was adjusted downward for small gravel sizes and low permeability
• Redd density was adjusted downward based on quality of adjacent pool habitat
• Redd density was adjusted downward to account for the effects of redd superimposition
• Redd density used in the analysis was based on a modification of the density used for spring-run Chinook salmon (see Appendix D); potential redd density for steelhead may be higher than assumed for the upper Yuba River watershed
4-10
CHAPTER 4: 6BHABITAT ANALYSIS: INCREASED FLOWS
4.2.3 Fall-run Chinook Salmon Increased flow in the Middle and South Yuba rivers would not provide any additional benefit to fall-run Chinook salmon because both suitably-sized spawning gravels and suitable water temperatures would be available to fall-run Chinook salmon throughout the Middle and South Yuba rivers at the appropriate time under current operations (see Chapter 3). Thus, no additional production of fall-run Chinook salmon would be expected at the higher flows.
4.3 Integration of Habitat Analyses for Other Life Stages 4.3.1 Adult Upstream Migration Increased flows of 50 cfs during the upstream migration period of spring-run Chinook salmon might improve conditions for fish passage at low-flow barriers in the upper Yuba River watershed. The potential benefits would depend on hydrologic and site-specific conditions at each barrier. The increased flow might not assure fish passage during below-normal, dry, and critically dry annual hydrologic conditions. As discussed in Chapter 3 for current operations, the low-flow barriers could be physically altered to ensure fish passage regardless of hydrologic conditions. The physical alterations could include moving large boulders, modifying the localized channel gradient, and raising the elevation of plunge pools at the base of the obstruction. Physical alteration of the low-flow barriers to accommodate fish passage may be more feasible than flow augmentation. Fish passage at the high flow barriers could only be accomplished by physical alteration or the provision of fish passage facilities. The habitat and water temperature analysis assumed that passage would be provided at man-made barriers such as Our House Dam and at the natural low-flow barriers. Passage options at these features would need to be considered in determining the overall feasibility of introduction of salmon and steelhead in the upper Yuba River watershed.
4.3.2 Adult Holding Because increased flows would extend the thermally suitable reach for holding adult spring-run Chinook salmon in the Middle Yuba River by over 6 miles, there would be more pools available for holding spring-run Chinook salmon. Based on surveys performed by the study team, approximately 18 additional pools suitable for holding spring-run Chinook salmon would be provided in the expanded reach. Each holding pool would support at least 50 to 100 adult spring-run Chinook salmon, based on observations of adult spring-run Chinook salmon holding in Mill, Deer, and Butte creeks. Based on the size and configuration of the available pools, the additional pool habitat in the Middle Yuba River was predicted to support at least 900 to 1,800 more adult spring-run Chinook salmon than under current (2004) operations for a total of 1,650 to 3,300 adult salmon.
Additionally, the increased flow would likely enhance the quality of holding pools due to improved habitat attributes such as greater bubble curtains for cover, increased oxygenation, and increased depths. The amount of holding habitat appears to be adequate to support the predicted number of adults that could spawn in the thermally suitable reach (approximately 1,600) on the Middle Yuba River with increased flows. Results of holding
4-11
CHAPTER 4: 6BHABITAT ANALYSIS: INCREASED FLOWS
habitat analysis suggest that holding habitat for spring-run Chinook salmon would not limit the number of spring-run Chinook salmon that could spawn in the Middle Yuba River with increased flows.
4.3.3 Fry and Juvenile Rearing Predicted rearing capacity with increased flow was based on the increase in the length of the reach with suitable water temperatures. No attempt was made to quantify the potential increase in rearing habitat that could occur with increased flow due to increased depths or inundation of previously dry areas (i.e., lateral expansion of the wetted channel). An analysis of this type would require a much more rigorous evaluation, including field studies and hydraulic modeling, than was possible for the feasibility-level scope of the UYRSP.
Spring-run Chinook Salmon With increased flows of 50 cfs, approximately 11.7 miles of thermally suitable habitat for spring-run Chinook salmon would be present in the Middle Yuba River downstream of the barrier at RM 34.4 (see Figure 4-6) if the fry outmigrate during the winter or spring and avoid high summer water temperatures. Spring-run Chinook salmon fry remaining to rear in the Middle Yuba River during the summer would be restricted by high water temperatures to an 8.8-mile reach upstream of RM 25.6. However, because water temperatures in the Middle Yuba River likely would not exceed the 18.3°C critical rearing threshold at any location until late May or early June, thermally suitable rearing habitat for spring-run Chinook salmon would be present throughout the river until this time. Chinook salmon fry that do not remain to rear in the upper reach where they hatched could still rear and outmigrate successfully if they left the river by the end of May.
As described in Chapter 3 for current operations, habitat-specific fry densities from Deer Creek, another Sacramento River tributary that supports spring-run Chinook salmon, were used to predict summer rearing capacity for spring-run Chinook salmon in the Middle Yuba River. Differences between the Deer Creek and Yuba River systems, combined with uncertainties associated with the estimates of habitat area, make it difficult to accurately predict the rearing capacity for spring-run Chinook salmon fry in the Middle Yuba River. Therefore, the predicted rearing capacity was compared to the number of fry that could be produced by the predicted spawning population to evaluate the potential for rearing habitat to limit spring-run Chinook salmon production in the Middle Yuba River with increased flows.
Figure 3-17 graphically illustrates the predicted summer rearing capacity of spring-run Chinook salmon fry (age 0+) in thermally suitable reaches of the Middle Yuba River under current (2004) operations and with increased flows. Within the approximately 8.8 miles of habitat predicted to be thermally suitable for summer rearing of spring-run Chinook salmon in the Middle Yuba River with increased flows, there would be sufficient rearing habitat to support approximately 78,700 (range: 5,800 to 260,000) Chinook salmon fry. This represents an increase in Chinook salmon fry rearing capacity of approximately 120 percent over current (2004) operations in the Middle Yuba River.
Using the same assumptions regarding fecundity and survival described for current operations, the predicted number of emergent fry that could be produced by the number of adults potentially spawning in this 8.8-mile thermally suitable reach of the Middle Yuba
4-12
CHAPTER 4: 6BHABITAT ANALYSIS: INCREASED FLOWS
River would be approximately 1.8 million. Comparison to the predicted number of juveniles that could rear over the summer in the identified thermally suitable reach with increased flow (78,700) suggests that the number of emergent fry could far exceed the summer rearing capacity of the available habitat in the Middle Yuba. If many spring-run Chinook salmon fry adopted an ocean-type strategy and began migrating downstream shortly after emergence, leaving the Middle Yuba River before water temperatures become limiting in the downstream reaches, then rearing habitat would not be a factor limiting spring-run Chinook salmon production. Rearing habitat capacity could be a limiting factor on the number of spring-run Chinook salmon that could be supported in the Middle Yuba River if juvenile salmon remained in the river over the summer.
As previously described, available information is insufficient to conclusively determine whether the available habitat in the thermally suitable reaches would support a sufficient number of fry or juveniles that would ultimately return as adult spawners. However, because juvenile spring-run Chinook salmon could adopt an ocean-type strategy and leave the river before water temperatures become limiting, summer rearing habitat for spring-run Chinook salmon juveniles may not be a factor limiting production in the upper Yuba River watershed.
Steelhead Habitat-specific fry and age 1+ (based on size) densities observed in the Middle Yuba River during the rainbow trout snorkel surveys (Appendix G) were used to predict summer rearing capacity for steelhead in the Middle Yuba River. Potential differences between observed rainbow trout densities and potential steelhead rearing densities, combined with uncertainties associated with the estimates of habitat area, make it difficult to accurately predict rearing capacities for steelhead in the Middle Yuba River. Therefore, the predicted rearing capacities were compared to the number of fry that could be produced by the predicted spawning population to evaluate the potential for rearing habitat to limit steelhead production in the upper Yuba River watershed.
Figures 3-18 and 3-19 graphically illustrate the predicted summer rearing capacity of age 0+ and age 1+ steelhead in thermally suitable reaches of the Middle Yuba River under current (2004) operations and with increased flows of 50 cfs. Vertical lines indicate the minimum and maximum rearing capacity predicted using the minimum and maximum densities observed in the Middle Yuba River. The marker indicates the predicted rearing capacity using the average rainbow trout density observed in the Middle Yuba River. Within the approximately 14 miles of thermally suitable habitat for rearing steelhead in the Middle Yuba River with increased flows of 50 cfs, there would be sufficient rearing habitat to support approximately 13,000 (range: 1,300 to 52,000) age 0+ steelhead (Figure 3-18). Due to their larger size and greater space requirements, fewer age 1+ and older steelhead could be supported in this reach. Predicted rearing capacity of age 1+ and older steelhead in the 14-mile thermally suitable reach of the Middle Yuba River is approximately 6,000 (range: 1,900 to 13,000) (Figure 3-19).
With increased flows in the Middle Yuba River, gains in potential spawning habitat would be proportionally larger than the potential gains in rearing habitat, leading to production of an even greater number of emergent fry. Using the same assumptions regarding fecundity and survival described previously for current operations, it was predicted that
4-13
CHAPTER 4: 6BHABITAT ANALYSIS: INCREASED FLOWS
4-14
approximately 4 million emergent fry could be produced by the 2,640 adult steelhead potentially supported in the thermally suitable reach. Therefore, the number of emergent steelhead fry could far exceed the potential rearing capacity of the available habitat in this reach for both fry (age 0+) and juveniles (age 1+ and older) steelhead.
Insufficient information exists to conclusively determine whether the available habitat in the thermally suitable reaches with increased flows would support a sufficient number of fry and juvenile steelhead to maintain a naturally self-sustaining population. However, due to the conservative nature of the predictions and because rearing habitat capacity would be increased relative to current operations, results of the rearing habitat analysis suggest that summer rearing habitat would not limit production of adult steelhead in the upper Yuba River watershed.
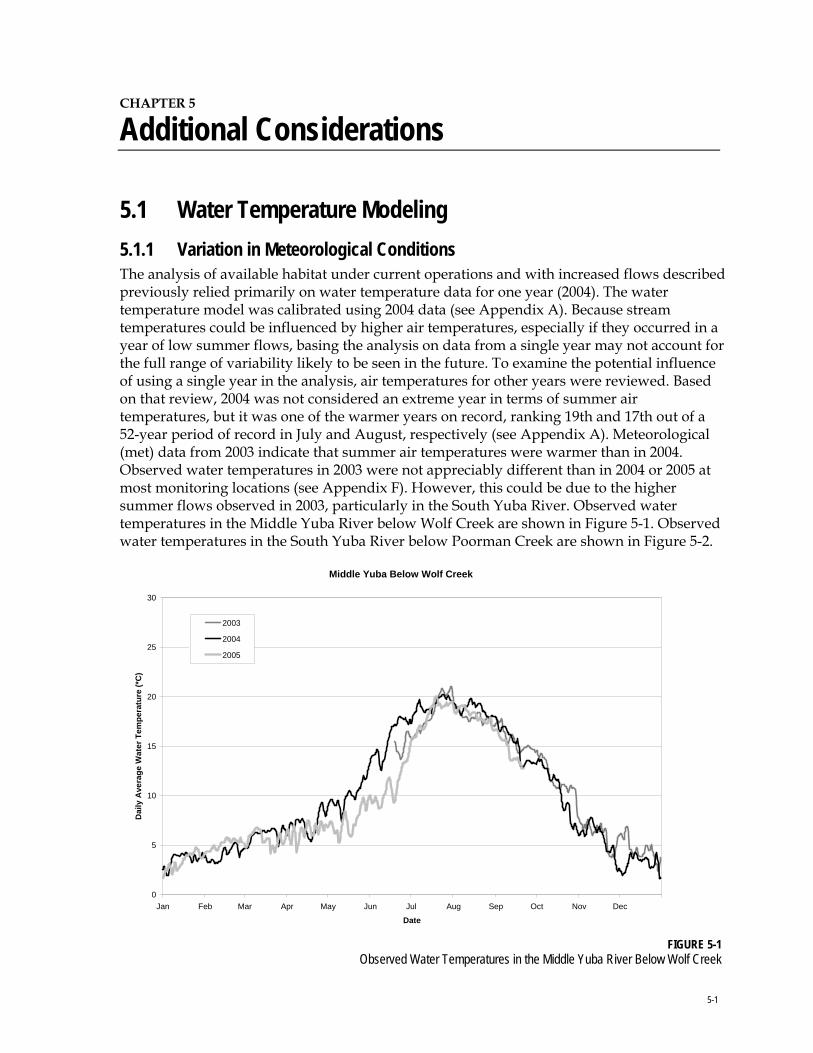
CHAPTER 5
Additional Considerations
5.1 Water Temperature Modeling 5.1.1 Variation in Meteorological Conditions The analysis of available habitat under current operations and with increased flows described previously relied primarily on water temperature data for one year (2004). The water temperature model was calibrated using 2004 data (see Appendix A). Because stream temperatures could be influenced by higher air temperatures, especially if they occurred in a year of low summer flows, basing the analysis on data from a single year may not account for the full range of variability likely to be seen in the future. To examine the potential influence of using a single year in the analysis, air temperatures for other years were reviewed. Based on that review, 2004 was not considered an extreme year in terms of summer air temperatures, but it was one of the warmer years on record, ranking 19th and 17th out of a 52-year period of record in July and August, respectively (see Appendix A). Meteorological (met) data from 2003 indicate that summer air temperatures were warmer than in 2004. Observed water temperatures in 2003 were not appreciably different than in 2004 or 2005 at most monitoring locations (see Appendix F). However, this could be due to the higher summer flows observed in 2003, particularly in the South Yuba River. Observed water temperatures in the Middle Yuba River below Wolf Creek are shown in Figure 5-1. Observed water temperatures in the South Yuba River below Poorman Creek are shown in Figure 5-2.
Middle Yuba Below Wolf Creek
0
5
10
15
20
25
30
Jan Feb Mar Apr May Jun Jul Aug Sep Oct Nov Dec
Date
Dai
ly A
vera
ge W
ater
Tem
pera
ture
(*C
)
2003
2004
2005
FIGURE 5-1
Observed Water Temperatures in the Middle Yuba River Below Wolf Creek
5-1
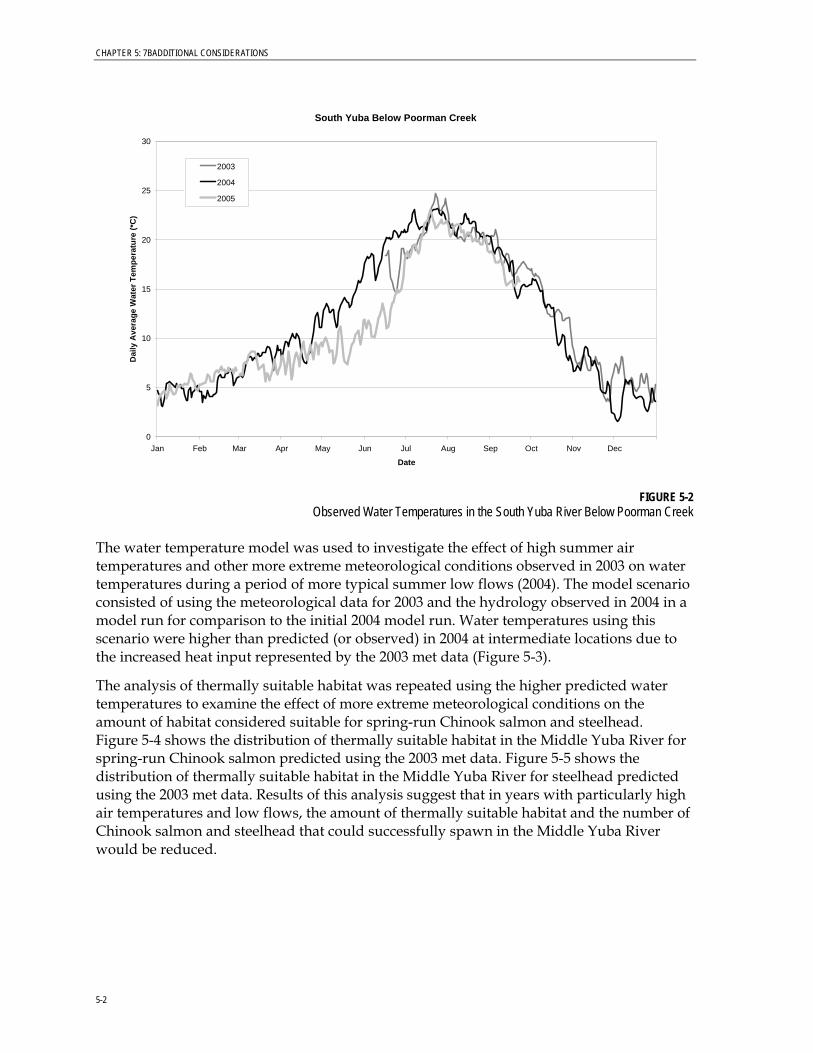
CHAPTER 5: 7BADDITIONAL CONSIDERATIONS
South Yuba Below Poorman Creek
0
5
10
15
20
25
30
Jan Feb Mar Apr May Jun Jul Aug Sep Oct Nov Dec
Date
Dai
ly A
vera
ge W
ater
Tem
pera
ture
(*C
)
2003
2004
2005
FIGURE 5-2 Observed Water Temperatures in the South Yuba River Below Poorman Creek
The water temperature model was used to investigate the effect of high summer air temperatures and other more extreme meteorological conditions observed in 2003 on water temperatures during a period of more typical summer low flows (2004). The model scenario consisted of using the meteorological data for 2003 and the hydrology observed in 2004 in a model run for comparison to the initial 2004 model run. Water temperatures using this scenario were higher than predicted (or observed) in 2004 at intermediate locations due to the increased heat input represented by the 2003 met data (Figure 5-3).
The analysis of thermally suitable habitat was repeated using the higher predicted water temperatures to examine the effect of more extreme meteorological conditions on the amount of habitat considered suitable for spring-run Chinook salmon and steelhead. Figure 5-4 shows the distribution of thermally suitable habitat in the Middle Yuba River for spring-run Chinook salmon predicted using the 2003 met data. Figure 5-5 shows the distribution of thermally suitable habitat in the Middle Yuba River for steelhead predicted using the 2003 met data. Results of this analysis suggest that in years with particularly high air temperatures and low flows, the amount of thermally suitable habitat and the number of Chinook salmon and steelhead that could successfully spawn in the Middle Yuba River would be reduced.
5-2
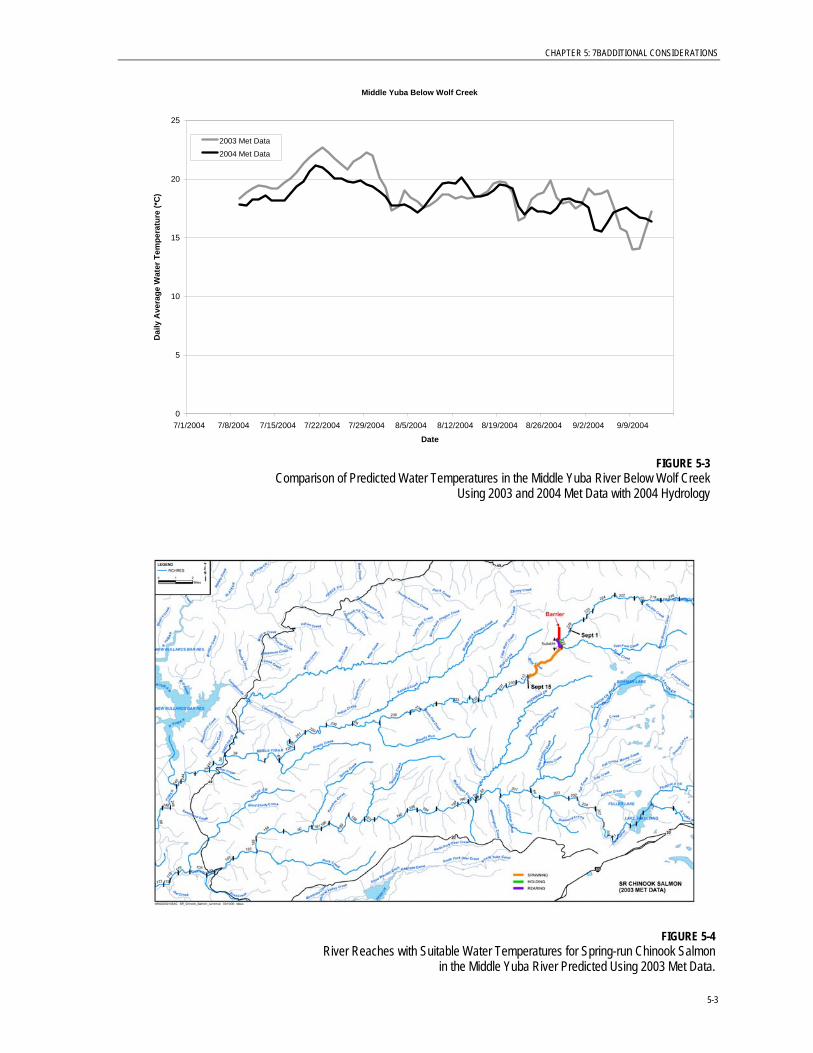
CHAPTER 5: 7BADDITIONAL CONSIDERATIONS
Middle Yuba Below Wolf Creek
0
5
10
15
20
25
7/1/2004 7/8/2004 7/15/2004 7/22/2004 7/29/2004 8/5/2004 8/12/2004 8/19/2004 8/26/2004 9/2/2004 9/9/2004
Date
Dai
ly A
vera
ge W
ater
Tem
pera
ture
(*C
)
2003 Met Data
2004 Met Data
FIGURE 5-3
Comparison of Predicted Water Temperatures in the Middle Yuba River Below Wolf Creek Using 2003 and 2004 Met Data with 2004 Hydrology
FIGURE 5-4 River Reaches with Suitable Water Temperatures for Spring-run Chinook Salmon
in the Middle Yuba River Predicted Using 2003 Met Data.
5-3
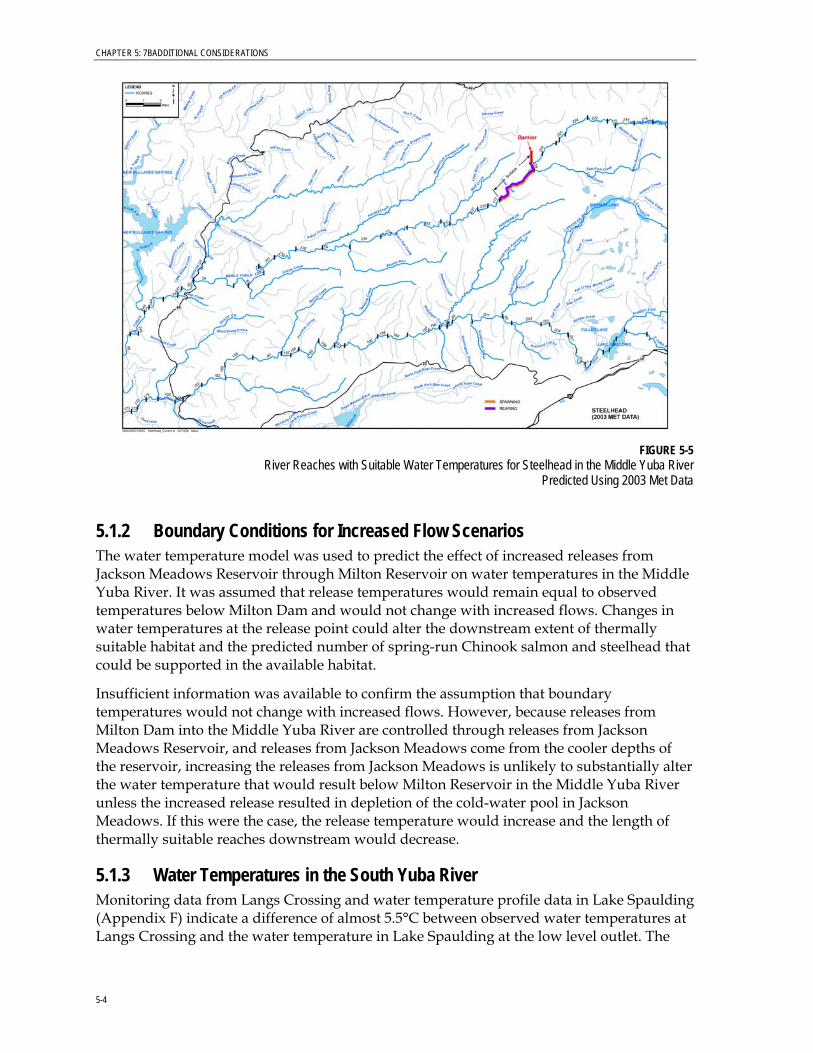
CHAPTER 5: 7BADDITIONAL CONSIDERATIONS
FIGURE 5-5 River Reaches with Suitable Water Temperatures for Steelhead in the Middle Yuba River
Predicted Using 2003 Met Data
5.1.2 Boundary Conditions for Increased Flow Scenarios The water temperature model was used to predict the effect of increased releases from Jackson Meadows Reservoir through Milton Reservoir on water temperatures in the Middle Yuba River. It was assumed that release temperatures would remain equal to observed temperatures below Milton Dam and would not change with increased flows. Changes in water temperatures at the release point could alter the downstream extent of thermally suitable habitat and the predicted number of spring-run Chinook salmon and steelhead that could be supported in the available habitat.
Insufficient information was available to confirm the assumption that boundary temperatures would not change with increased flows. However, because releases from Milton Dam into the Middle Yuba River are controlled through releases from Jackson Meadows Reservoir, and releases from Jackson Meadows come from the cooler depths of the reservoir, increasing the releases from Jackson Meadows is unlikely to substantially alter the water temperature that would result below Milton Reservoir in the Middle Yuba River unless the increased release resulted in depletion of the cold-water pool in Jackson Meadows. If this were the case, the release temperature would increase and the length of thermally suitable reaches downstream would decrease.
5.1.3 Water Temperatures in the South Yuba River Monitoring data from Langs Crossing and water temperature profile data in Lake Spaulding (Appendix F) indicate a difference of almost 5.5°C between observed water temperatures at Langs Crossing and the water temperature in Lake Spaulding at the low level outlet. The
5-4
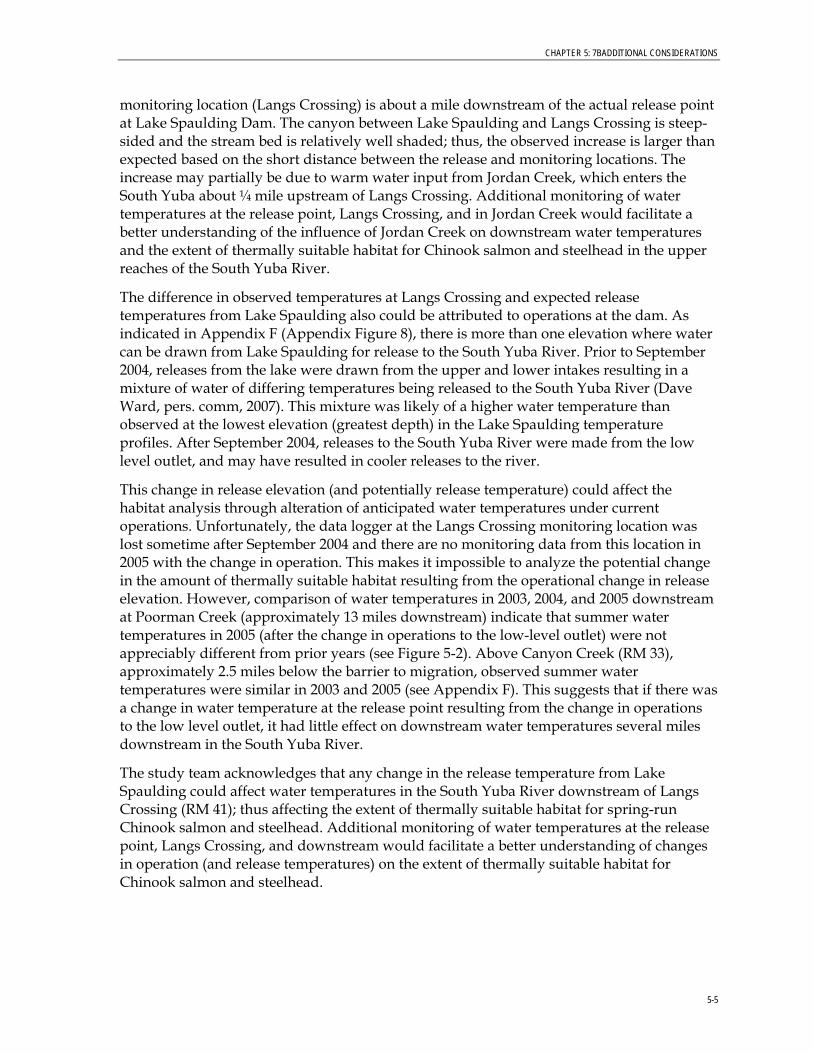
CHAPTER 5: 7BADDITIONAL CONSIDERATIONS
monitoring location (Langs Crossing) is about a mile downstream of the actual release point at Lake Spaulding Dam. The canyon between Lake Spaulding and Langs Crossing is steep-sided and the stream bed is relatively well shaded; thus, the observed increase is larger than expected based on the short distance between the release and monitoring locations. The increase may partially be due to warm water input from Jordan Creek, which enters the South Yuba about ¼ mile upstream of Langs Crossing. Additional monitoring of water temperatures at the release point, Langs Crossing, and in Jordan Creek would facilitate a better understanding of the influence of Jordan Creek on downstream water temperatures and the extent of thermally suitable habitat for Chinook salmon and steelhead in the upper reaches of the South Yuba River.
The difference in observed temperatures at Langs Crossing and expected release temperatures from Lake Spaulding also could be attributed to operations at the dam. As indicated in Appendix F (Appendix Figure 8), there is more than one elevation where water can be drawn from Lake Spaulding for release to the South Yuba River. Prior to September 2004, releases from the lake were drawn from the upper and lower intakes resulting in a mixture of water of differing temperatures being released to the South Yuba River (Dave Ward, pers. comm, 2007). This mixture was likely of a higher water temperature than observed at the lowest elevation (greatest depth) in the Lake Spaulding temperature profiles. After September 2004, releases to the South Yuba River were made from the low level outlet, and may have resulted in cooler releases to the river.
This change in release elevation (and potentially release temperature) could affect the habitat analysis through alteration of anticipated water temperatures under current operations. Unfortunately, the data logger at the Langs Crossing monitoring location was lost sometime after September 2004 and there are no monitoring data from this location in 2005 with the change in operation. This makes it impossible to analyze the potential change in the amount of thermally suitable habitat resulting from the operational change in release elevation. However, comparison of water temperatures in 2003, 2004, and 2005 downstream at Poorman Creek (approximately 13 miles downstream) indicate that summer water temperatures in 2005 (after the change in operations to the low-level outlet) were not appreciably different from prior years (see Figure 5-2). Above Canyon Creek (RM 33), approximately 2.5 miles below the barrier to migration, observed summer water temperatures were similar in 2003 and 2005 (see Appendix F). This suggests that if there was a change in water temperature at the release point resulting from the change in operations to the low level outlet, it had little effect on downstream water temperatures several miles downstream in the South Yuba River.
The study team acknowledges that any change in the release temperature from Lake Spaulding could affect water temperatures in the South Yuba River downstream of Langs Crossing (RM 41); thus affecting the extent of thermally suitable habitat for spring-run Chinook salmon and steelhead. Additional monitoring of water temperatures at the release point, Langs Crossing, and downstream would facilitate a better understanding of changes in operation (and release temperatures) on the extent of thermally suitable habitat for Chinook salmon and steelhead.
5-5
CHAPTER 5: 7BADDITIONAL CONSIDERATIONS
5.1.4 Range of Suitable Water Temperatures Based on a review of available information (Appendix B), water temperature criteria (thresholds) were developed for each life stage of Chinook salmon and steelhead in the Upper Yuba River basin (see Table 2-1). Three thermal zones were defined, corresponding to expected physiological responses of each species and life stage: optimal, suboptimal, and chronic to acute stress. The water temperatures identified as the upper limits of the “optimal” range were intended to be used as threshold values that will avoid lethal and sublethal temperature effects. The upper limits of the “suboptimal” range were used to define thermal suitability for each life stage.
Since the extent of suitable habitat was determined using the relationship between stream temperatures (MWAT) and the threshold values for the upper end of the suboptimal range, it was desirable to understand the sensitivity of the analysis to the chosen criteria. To examine the sensitivity of the habitat analysis to the choice of criteria, the analysis was repeated for the adult holding life stage of spring-run Chinook salmon with temperature criteria of 16°C and 20°C. The lower criteria represents the upper limit of the “optimal” range and the higher criteria of 20°C represents the water temperatures commonly experienced by holding adult spring-run Chinook salmon in Butte Creek (CDFG Unpubl. data). Neither of these criteria are intended to describe the precise thermal tolerance of spring-run Chinook salmon or to indicate regulatory criteria that would be applied if salmon and steelhead were introduced into the upper Yuba River watershed. Rather, they are used to illustrate the sensitivity of the habitat analysis to a range of criteria for suitability.
Use of the higher temperature criteria (20°C) would extend the range of thermally-suitable habitat predicted in the Middle Yuba River under current (2004) operations to approximately RM 25.6 (below Wolf Creek). Use of the more restrictive criteria based on optimal water temperatures (16°C) would limit thermally suitable habitat in the Middle Yuba River to reaches upstream of approximately RM 33.9 under current (2004) operations. Neither of these criteria would alter the conclusion that thermally-suitable habitat on the South Yuba River is limited to the area above the total barrier at RM 35.4. Based on the analysis of spawning habitat (Appendix D), approximately 50 and 480 spring-run Chinook salmon redds could be supported by the available spawning habitat in the thermally-suitable reaches of the Middle Yuba River defined using 16°C and 20°C, respectively under current (2004) water operations. Assuming one female Chinook salmon per redd and a sex ratio of 1:1, approximately 100 to 950 adult spring-run Chinook salmon could spawn in the thermally suitable reaches of the Middle Yuba River defined using these criteria. As described above, these estimates are likely conservative for a number of reasons.
The analysis of thermally suitable habitat using the 2003 meteorological data and the 2004 hydrology was repeated using the higher and lower holding criteria to examine the effect of more extreme meteorological conditions on the amount of habitat considered suitable for spring-run Chinook salmon and steelhead with the alternative criteria. The downstream extent of thermally suitable habitat in the Middle Yuba River using the 2003 met data and the higher temperature criteria (20°C) was predicted to occur at approximately RM 30.7 (over 4 miles upstream Wolf Creek). Approximately 150 spring-run Chinook salmon redds could be supported in this reach. Use of the more restrictive criteria based on optimal water temperatures (16°C) would limit thermally suitable habitat in the
5-6
CHAPTER 5: 7BADDITIONAL CONSIDERATIONS
Middle Yuba River to reaches upstream of approximately RM 40, above the total barrier to upstream migration. Results of this analysis suggest that in years with particularly high air temperatures and low flows, the amount of thermally suitable habitat in the Middle Yuba River would be reduced, potentially to zero.
5.2 Flows Required to Overcome Passage Barriers The number of barriers identified represents the minimum number because the study team was not able to access all of the sites and, in some instances, was not able to see a barrier adequately in the aerial video because of line-of-site limitations (e.g., shadows, canyon walls), air speed, or videotape clarity. Barriers were identified either low flow or total (high and low flow) barriers based on the predicted interaction of the channel geometry and stream flow (barrier hydraulic conditions), combined with the known leaping abilities of salmon and steelhead. Of particular importance in this assessment were factors such as estimated height of the barriers, plunge pool characteristics, and physical configuration of the barriers (e.g., single or multiple falls, complexity of the falls, chutes, or cascades, fish passage routes, etc.). Not all of these variables could be accurately assessed from the aerial video, and flows at the time of migration could differ from flows at the time of the field surveys. However, based on field examination of several of the low-flow barriers, it was estimated that flows of 100 to 200 cfs would likely provide passage at these barriers. Further detailed, site-specific data and analyses (e.g., channel geometry surveys and hydraulic measurements) would be needed to accurately determine flows required to provide successful fish passage. Physical alteration of the low-flow barriers to accommodate fish passage may be a more feasible than flow augmentation.
5.3 Rearing Habitat The success of any introduction into the upper Yuba River watershed would depend, in large part, on the ability of juvenile salmonids to successfully rear and emigrate from the system. The number of juvenile salmon or steelhead produced from a basin, and ultimately the number of smolts reaching the ocean, is a direct indicator of the ability of the population to sustain itself. Survival of a given life stage, including downstream migration, ocean residence, and upstream migration, varies considerably and is dependent on a number of factors that are not easily quantified.
5.3.1 Spring-run Chinook Salmon It is unknown whether juvenile spring-run Chinook salmon would adopt a stream-type rearing strategy and rear in the river for several months before emigrating, or adopt an ocean-type strategy and outmigrate as fry, spending only a few days to a few weeks in the river. Based on observations in Butte Creek (Ward et al., 2004a, b), spring-run Chinook salmon introduced into the Upper Yuba River watershed may emigrate as fry and not rear over the summer due to the relatively high summer stream temperatures.
5.3.2 Steelhead Steelhead, on the other hand, would be expected to spend at least one summer and winter in the river before migrating downstream to the Delta and ocean. Reaches with suitable
5-7
CHAPTER 5: 7BADDITIONAL CONSIDERATIONS
water temperatures were defined based on literature values for the range of temperatures anticipated to be chronically or acutely stressful to rearing juvenile steelhead. However, rainbow trout occupy reaches of both the Middle and South Yuba rivers outside of the identified thermally suitable reaches. It is unclear whether the observed individuals (see Appendix G) represent trout that were resident at those locations or were merely present at the locations due to displacement from upstream areas, migration, or chance at the time of the surveys. Despite the observations of rainbow trout, it is possible that conditions at the locations where rainbow trout were observed outside of the identified thermally suitable reaches would be unsuitable to support juvenile steelhead. Insufficient information exists to conclusively determine whether juvenile steelhead could rear outside of the areas identified as thermally suitable. However, if juvenile steelhead were able to rear in reaches downstream of the identified thermally suitable reaches, juvenile steelhead rearing in these additional reaches could contribute an additional increment to the production of steelhead in the watershed.
5.4 Populations Supported in Other Central Valley Streams To establish the context for the predicted number of spring-run Chinook salmon and steelhead that could spawn in the thermally suitable habitat available in the upper Yuba River watershed, the predicted number of spring-run Chinook salmon that could potentially spawn in the upper Yuba River watershed was compared to other streams supporting these species in the Central Valley of California. Since steelhead migrate and spawn during time periods that make enumeration difficult in most streams, few data are available on steelhead population numbers in the Central Valley and elsewhere. Therefore, no comparison of steelhead numbers was possible. Therefore, only the predicted number of spring-run Chinook salmon in the upper Yuba River watershed was compared to other streams.
Central Valley streams thought to support self-sustaining populations of spring-run Chinook salmon include Deer, Mill, and Butte creeks. Spring-run Chinook salmon are occasionally observed in other streams such as Antelope and Big Chico creeks, but these populations are smaller, intermittent, and are not considered viable populations by the National Oceanic and Atmospheric Administration (NOAA Fisheries). Figures 5-6, 5-7, and 5-8 provide a comparison of the predicted number of adult spring-run Chinook salmon that could spawn in the upper Yuba River watershed (i.e., the Middle Yuba River) with historical estimates of the number of spawners in Deer, Mill, and Butte creeks.
5-8
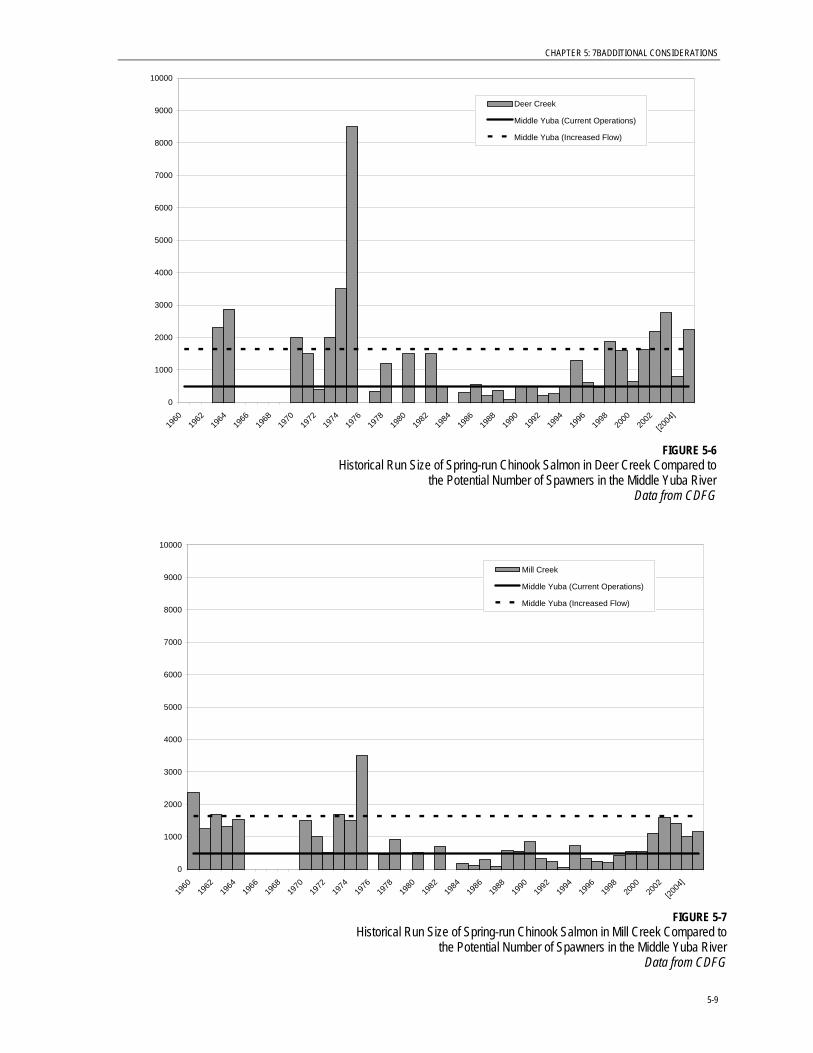
CHAPTER 5: 7BADDITIONAL CONSIDERATIONS
0
1000
2000
3000
4000
5000
6000
7000
8000
9000
1960
1962
1964
1966
1968
1970
1972
1974
1976
1978
1980
1982
1984
1986
1988
1990
1992
1994
1996
1998
2000
2002
[2004
]
10000
Deer Creek
Middle Yuba (Current Operations)
Middle Yuba (Increased Flow)
FIGURE 5-6
Historical Run Size of Spring-run Chinook Salmon in Deer Creek Compared to the Potential Number of Spawners in the Middle Yuba River
Data from CDFG
0
1000
2000
3000
4000
5000
6000
7000
8000
9000
10000
1960
1962
1964
1966
1968
1970
1972
1974
1976
1978
1980
1982
1984
1986
1988
1990
1992
1994
1996
1998
2000
2002
[2004
]
Mill Creek
Middle Yuba (Current Operations)
Middle Yuba (Increased Flow)
FIGURE 5-7
Historical Run Size of Spring-run Chinook Salmon in Mill Creek Compared to the Potential Number of Spawners in the Middle Yuba River
Data from CDFG
5-9
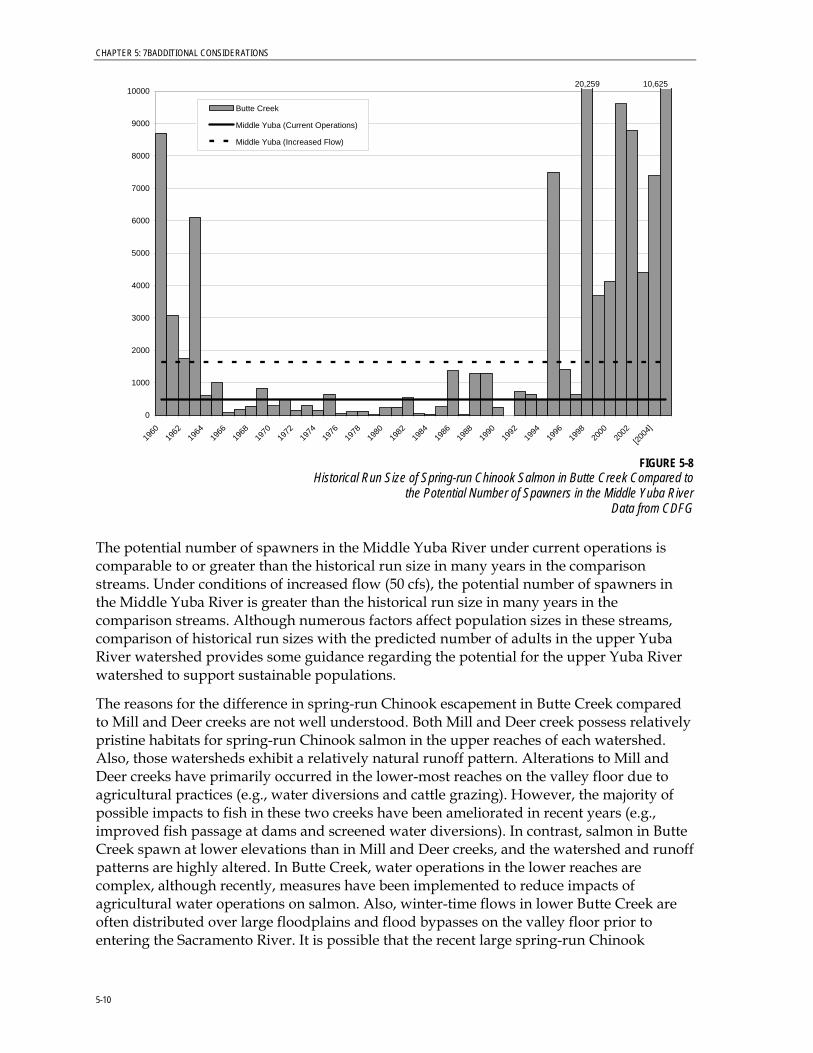
CHAPTER 5: 7BADDITIONAL CONSIDERATIONS
0
1000
2000
3000
4000
5000
6000
7000
8000
9000
10000
1960
1962
1964
1966
1968
1970
1972
1974
1976
1978
1980
1982
1984
1986
1988
1990
1992
1994
1996
1998
2000
2002
[2004
]
Butte Creek
Middle Yuba (Current Operations)
Middle Yuba (Increased Flow)
20,259 10,625
FIGURE 5-8
Historical Run Size of Spring-run Chinook Salmon in Butte Creek Compared to the Potential Number of Spawners in the Middle Yuba River
Data from CDFG
The potential number of spawners in the Middle Yuba River under current operations is comparable to or greater than the historical run size in many years in the comparison streams. Under conditions of increased flow (50 cfs), the potential number of spawners in the Middle Yuba River is greater than the historical run size in many years in the comparison streams. Although numerous factors affect population sizes in these streams, comparison of historical run sizes with the predicted number of adults in the upper Yuba River watershed provides some guidance regarding the potential for the upper Yuba River watershed to support sustainable populations.
The reasons for the difference in spring-run Chinook escapement in Butte Creek compared to Mill and Deer creeks are not well understood. Both Mill and Deer creek possess relatively pristine habitats for spring-run Chinook salmon in the upper reaches of each watershed. Also, those watersheds exhibit a relatively natural runoff pattern. Alterations to Mill and Deer creeks have primarily occurred in the lower-most reaches on the valley floor due to agricultural practices (e.g., water diversions and cattle grazing). However, the majority of possible impacts to fish in these two creeks have been ameliorated in recent years (e.g., improved fish passage at dams and screened water diversions). In contrast, salmon in Butte Creek spawn at lower elevations than in Mill and Deer creeks, and the watershed and runoff patterns are highly altered. In Butte Creek, water operations in the lower reaches are complex, although recently, measures have been implemented to reduce impacts of agricultural water operations on salmon. Also, winter-time flows in lower Butte Creek are often distributed over large floodplains and flood bypasses on the valley floor prior to entering the Sacramento River. It is possible that the recent large spring-run Chinook
5-10

CHAPTER 5: 7BADDITIONAL CONSIDERATIONS
5-11
salmon runs in Butte Creek can be, at least partially, attributed to improved survival during outmigration due to juvenile rearing on floodplains. Recent studies of juvenile salmon rearing in flood plains elsewhere in the Central Valley suggest that fish survival and growth may be enhanced in those areas (Sommer et al., 2001a, b).
CHAPTER 6
Conclusion
As described in the previous chapters, results of the field studies on physical habitat elements were integrated with what is known about water temperatures in the upper Yuba River watershed and the temperature tolerances of Chinook salmon and steelhead to evaluate the ability of available habitat in the Middle and South Yuba rivers to support these species. There is inherent uncertainty associated with this analysis, especially given that the habitat evaluated is not currently occupied by these species. Therefore, this analysis attempts to provide a logical and objective basis for using the available information to draw preliminary conclusions regarding the availability of suitable habitat for Chinook salmon and steelhead upstream of Englebright Dam and the capability of this habitat to support these species. The analysis required the use of informed assumptions to arrive at the preliminary predictions. Where possible, conservative assumptions were used in the analyses to ensure that:
• The amount of suitable habitat and the number of fish it could support was not overestimated
• The abilities of salmonids to repopulate new habitat areas through straying, acclimation, and behavioral adaptation was given full consideration
• Results of the analyses would be robust enough to be applicable under a range of conditions, given the level of variability inherent in biological systems
• Uncertainty in the analyses would not materially alter the conclusion regarding potential use of the upper Yuba River watershed by Chinook salmon and steelhead
The results of the habitat analyses, based on temperature and hydrologic conditions in 2004 and a number of conservative assumptions, suggest that a small number of spring-run Chinook salmon (100 to 950 adults) could spawn in the available habitat on the Middle Yuba River under current (2004) operations. The predicted number of spawners in the Middle Yuba River is comparable to or greater than the historical run size in many years in other Central Valley streams. Results also suggest that a similar number of steelhead (approximately 650 adults) could spawn in the available habitat on the Middle Yuba River under current (2004) operations. However, the analysis suggests that the South Yuba River could not support spring-run Chinook salmon or steelhead under current (2004) operations due to summer water temperatures that exceeded the selected temperature thresholds for the holding (Chinook) and rearing (steelhead) life history stages.
Additional flow released from Milton Reservoir at the top of the Middle Yuba River would increase the linear extent of reaches with suitable water temperatures for spring-run Chinook salmon and steelhead. This increased area could potentially support a higher number of spring-run Chinook salmon and steelhead adults than under current operations. Additional flow could also aid in providing passage at the low-flow barriers, increase the amount of rearing habitat, and increase the likelihood that introductions would be
6-1
CHAPTER 6: 8BCONCLUSION
6-2
successful. The availability of cold water in the upstream reservoirs was not addressed in this analysis.
Whether the amount of available thermally suitable habitat under current operations or with increased flows could support self sustaining populations of spring-run Chinook salmon or steelhead over the long term is dependent on a number of factors that were not examined during the field studies conducted for the UYRSP including:
• Annual variability in meteorological and hydrologic conditions that could affect the amount of thermally suitable habitat available
• The genetic structure of potential broodstock from the lower Yuba River and elsewhere
• Potential losses of juvenile salmonids at existing water diversions
• Pre-spawn mortality of adults migrating upstream to thermally suitable reaches
• Potential mortality of juvenile salmonids due to predation in the rivers and Englebright Lake
• Potential passage-related mortality of adult and juvenile salmonids
These and other factors could be examined in future studies to refine the predicted number of salmon and steelhead that could be supported in the available habitat and help determine the likelihood that populations would be self sustaining over the long term.
The results of this analysis represent the initial steps in determining overall feasibility and provide the technical basis for determining whether moving forward with the next steps in the overall evaluation is justified. These results alone do not constitute a conclusion that introduction of Chinook salmon or steelhead would be biologically feasible over the long term. Completion of the additional studies identified in the UYRSP study plan, and additional evaluation of biological and habitat issues would be required to ultimately determine the feasibility of introducing Chinook salmon and steelhead into the upper Yuba River watershed.
Additional analyses that could help to resolve several of the biological and habitat issues that affect the feasibility of introduction could include:
• Site surveys of the low-flow barriers to determine the flows required to provide upstream passage for adult Chinook salmon and steelhead
• Continued water temperature monitoring to evaluate annual variability and how changing operations may affect water temperatures and the amount of thermally suitable habitat
• Evaluation of cold water availability in the upper reservoirs and assessment of flow availability using the water supply model
• Characterization of the reach between Lake Spaulding and Langs Crossing to better define the boundary conditions and effects of increased releases into the South Yuba River
• Population-level modeling to help determine if the predicted number of adults represents a population that would be self-sustaining over the long term
CHAPTER 7
References
California Department of Water Resources (DWR). 2003. Interim Report, Summary of Current Conditions ion the Yuba River Watershed. Prepared by the Upper Yuba River Studies Program Study Team.
Everest, F.H., and D.W. Chapman. 1972. “Habitat Selection and Spatial Interaction by Juvenile Chinook Salmon and Steelhead Trout in Two Idaho Streams.” Journal of the Fisheries Research Board of Canada. 29: 91-100.
McCuddin, M.E. 1977. Survival of Salmon and Trout Embryos and Fry in Gravel-Sand Mixtures. Master’s thesis. University of Idaho, Moscow.
McEwan, D., and T.A. Jackson. 1996. Steelhead Restoration and Management Plan for California. California Department of Fish and Game, Inland Fisheries Division, Sacramento, Management Report.
Moyle, P.B. 2002. Inland Fishes of California. Revised edition. University of California Press, Berkeley.
Nicholas, J.W., and D.G. Hankin. 1989. Chinook Salmon Populations in Oregon Coastal River Basins: Descriptions of Life Histories and Assessment of Recent Trends in Run Strengths. Report EM 8402. Oregon Department of Fish and Wildlife, Research and Development Section, Corvallis.
Sommer, T.R., M.L. Nobriga, W.C. Harrell, W. Batham, and W.J. Kimmerer. 2001a. “Floodplain Rearing of Juvenile Chinook Salmon: Evidence of Enhanced Growth and Survival.” Canadian Journal of Fisheries and Aquatic Sciences. 58: 325-333.
Sommer, T., B. Harrell, M. Nobriga, R. Brown, P. Moyle, W. Kimmerer, and L. Schemel. 2001b. “California’s Yolo Bypass: Evidence that Flood Control Can Be Compatible With Fisheries, Wetlands, Wildlife, and Agriculture.” Fisheries 26: 6-16.
Stillwater Sciences. 2006. Upper Penitencia Creek Limiting Factors Analysis. Final technical report. Prepared by Stillwater Sciences, Berkeley, California for Santa Clara Valley Urban Runoff Pollution Prevention Program, Oakland, California.
Tagart, J.V. 1976. The Survival from Egg Deposition to Emergence of Coho Salmon in the Clearwater River, Jefferson County, Washington. Master’s thesis. University of Washington, Seattle.
Ward, P.D., and T.R. McReynolds. 2001. Butte and Big Chico Creeks Spring-run Chinook Salmon, Oncorhynchus tshawytscha, Life History Investigation 1998-2000. CDFG Inland Fisheries Administrative Report No. 2001-2. 61 pp.
Ward, P.D., T. R. McReynolds and C. E.Garman. 2004a. Butte Creek and Big Chico Creeks Spring-run Chinook Salmon, Oncorhynchus tshawytscha, Life History Investigation, 2000-2001. Calif. Dept. of Fish and Game, Inland Fisheries Admin. Report No. 2004-3. 47 pp.
7-1

CHAPTER 7: 9BREFERENCES
7-2
Ward, P.D., T.R. McReynolds and C.E. Garman. 2004b. Butte Creek and Big Chico Creeks Spring-run Chinook Salmon, Oncorhynchus tshawytscha, Life History Investigation, 2002-2003. Calif. Dept. of Fish and Game, Inland Fisheries Admin. Report No. 2004-6. 43 pp.
Ward, Dave. (Generation Supervisor, PG&E). 2007. Personal communication. Conversations via phone and e-mail with Neil Nikirk (CH2M HILL) during May 2007.

APPENDIX A
Water Temperature Modeling
T E C H N I C A L M E M O R A N D U M
Water Temperature Modeling PREPARED FOR: Upper Yuba River Studies Program
PREPARED BY: Rob Tull, CH2M HILL/SAC Niels Riegels, CH2M HILL/SAC Neil Nikirk
DATE: November, 2006
Introduction Water temperature conditions are an important consideration in evaluating the feasibility of introducing Chinook salmon and steelhead above Englebright Dam. This temperature model was developed as a preliminary screening tool to evaluate the effect of incremental flow increases on water temperatures during summer base flow conditions. The model is intended for use as a tool to estimate the effect of increased releases from Jackson Meadows Reservoir on temperatures in the Middle Yuba River, and predict water temperatures at locations between the monitoring nodes in both the Middle and South Yuba rivers..
The preliminary results presented in this technical memorandum are for the Middle Yuba River from Milton Dam to approximately 2 miles below Kanaka Creek for both current (2004) and increased flow scenarios, and for the South Yuba River from Langs Crossing to Missouri Bar for current (2004) operations.
Model Description The temperature model simulates the flow of water and the accompanying heating and cooling that occur as water moves downstream. Temperature monitoring data collected by the Upper Yuba River Studies Program (UYRSP) are used to characterize the temperatures of releases from Milton Dam on the Middle Yuba River and at Langs Crossing on the South Yuba River. A number of tributary creeks contribute to the flow of both the Middle Yuba and South Yuba rivers downstream of Milton Dam and Langs Crossing, respectively, and the contributing flows of these creeks have also been included in the model. The simulated physical processes affecting the temperature of water include shortwave solar radiation, longwave radiation, evaporation, and conductive heat transfer across the air-water interface.
The Hydrologic Simulation Program—FORTRAN (HSPF) was used to develop the temperature model for this project. HSPF was selected in order to take advantage of previous work by the U.S. Geological Survey (USGS), which has already developed an HSPF model of the Middle Yuba and South Yuba rivers for the purpose of modeling sediment transport. The input data set for the USGS sediment transport model was used as the basis for the development of the temperature model for this project. HSPF is supported by the U.S. Environmental Protection Agency and is widely accepted in professional practice.
1
WATER TEMPERATURE MODELING
2
In the HSPF model framework, a river is segmented into linked reaches and flow is simulated by passing water from reach to reach on a user-specified time step. Each reach is assumed to be completely mixed (the temperature is uniform throughout) and is characterized by a uniform channel geometry that relates depth, volume, flow, and surface area. Reach lengths in the model range from 0.52 miles to 3.13 miles, with the average reach length equal to about 1.5 miles. A schematic of the Middle Yuba River representation is shown in Figure 1, and a schematic of the South Yuba River representation is shown in Figure 2.
HSPF simulates the heating and cooling of water by simulating physical processes including shortwave solar radiation, longwave radiation (including both radiation emitted from the water surface and radiation absorbed by the water surface from the atmosphere), evaporation, and conduction across the air-water interface. Meteorological data required to simulate these processes include solar radiation, air temperature, dew point temperature, wind speed, and cloud cover.
Modeling Approach The temperature model was developed to estimate the effect of incremental flow increases on water temperatures in the Middle Yuba and South Yuba rivers during summer base flow conditions. The model development process included the following steps.
1. Review of available data and selection of summer 2004 as model calibration period
2. Coordination with USGS to use USGS sediment transport model as basis for development of temperature model
3. Development of water balance and estimation of summer 2004 tributary inflows to Middle Yuba and South Yuba rivers
4. Development of summer 2004 meteorological data set
5. Characterization of physical system, including cross-sections and elevation profile
6. Field work to check physical system assumptions
7. Calibration of model using observed stream temperature data
A number of challenges were encountered in the model development process. First, both the Middle Yuba and South Yuba rivers receive significant tributary inflows with unknown flows and temperatures that must be estimated. Second, the hydrology of both rivers can vary significantly from year to year. Finally, the physical system is highly variable. The channel gradient is locally very steep, resulting in wide variation in flow characteristics such as velocity and depth, while the channel morphology is highly variable, with a wide distribution of riffles, runs, pools, and cascades.
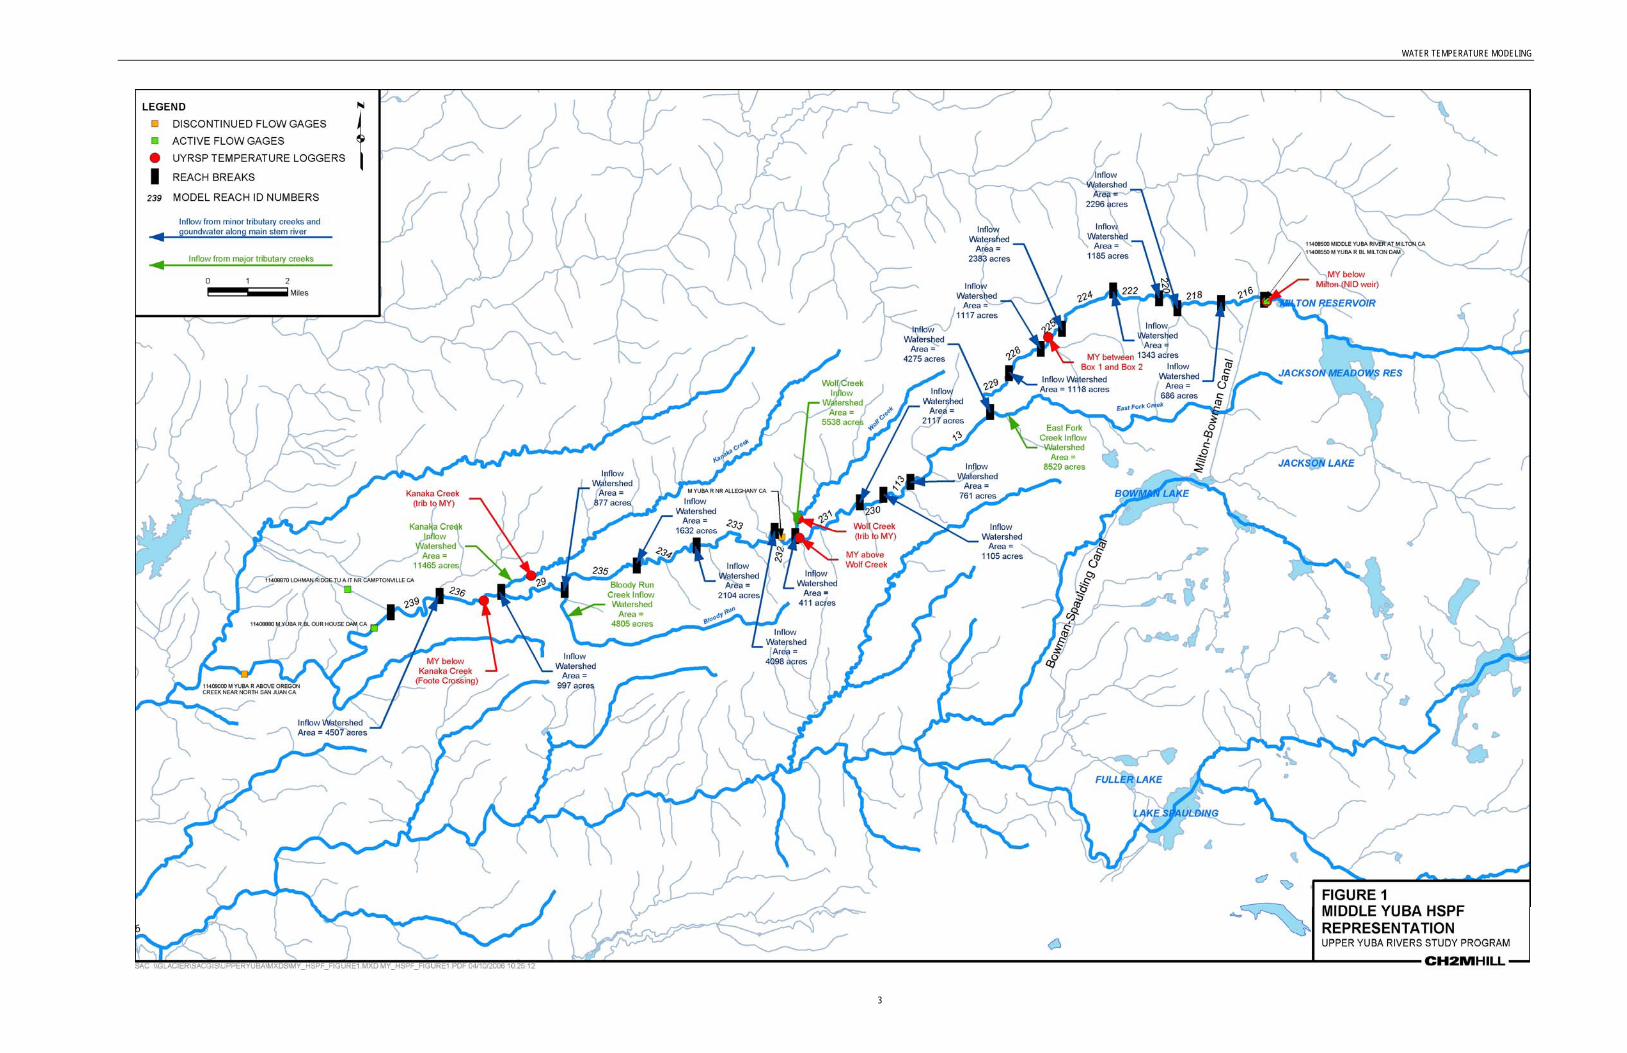
WATER TEMPERATURE MODELING
3
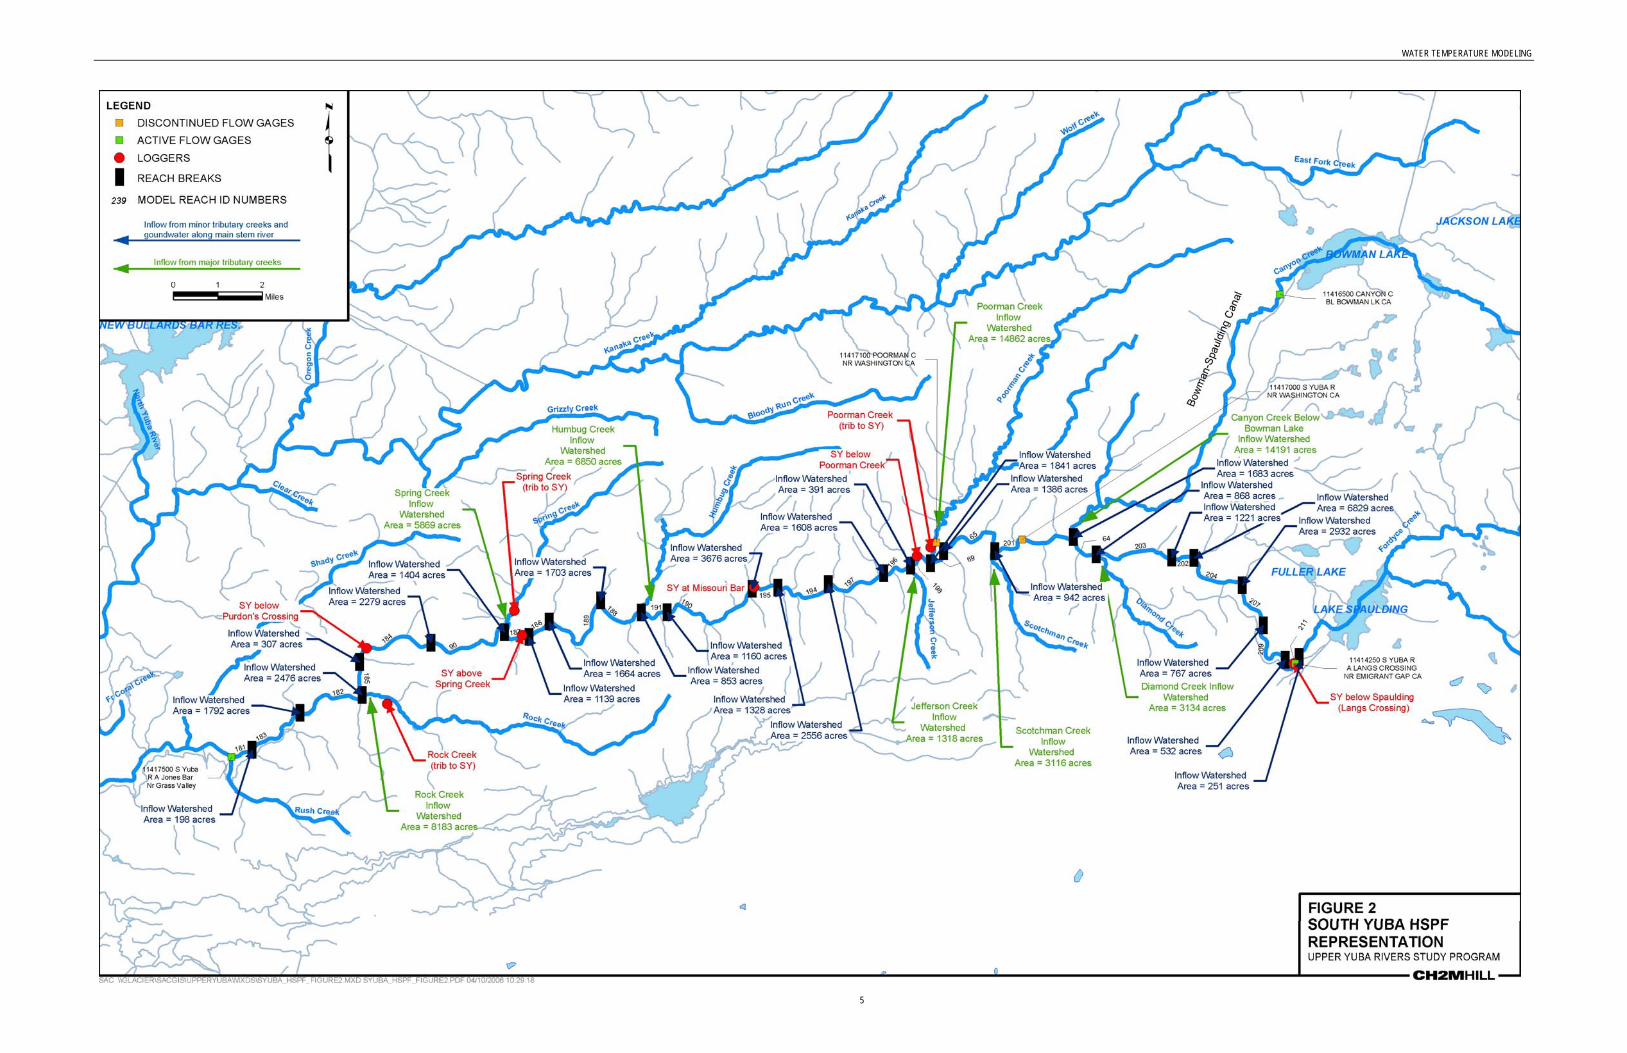
5
WATER TEMPERATURE MODELING
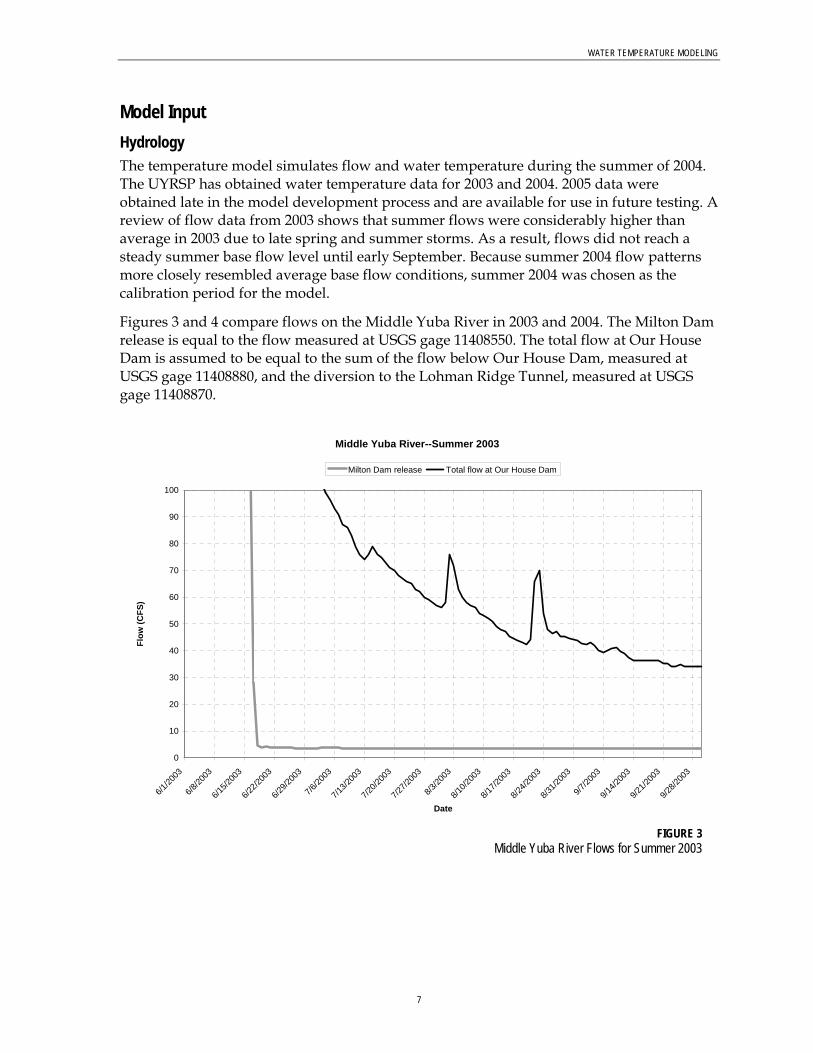
WATER TEMPERATURE MODELING
Model Input Hydrology The temperature model simulates flow and water temperature during the summer of 2004. The UYRSP has obtained water temperature data for 2003 and 2004. 2005 data were obtained late in the model development process and are available for use in future testing. A review of flow data from 2003 shows that summer flows were considerably higher than average in 2003 due to late spring and summer storms. As a result, flows did not reach a steady summer base flow level until early September. Because summer 2004 flow patterns more closely resembled average base flow conditions, summer 2004 was chosen as the calibration period for the model.
Figures 3 and 4 compare flows on the Middle Yuba River in 2003 and 2004. The Milton Dam release is equal to the flow measured at USGS gage 11408550. The total flow at Our House Dam is assumed to be equal to the sum of the flow below Our House Dam, measured at USGS gage 11408880, and the diversion to the Lohman Ridge Tunnel, measured at USGS gage 11408870.
Middle Yuba River--Summer 2003
0
10
20
30
40
50
60
70
80
90
100
6/1/20
03
6/8/20
03
6/15/2
003
6/22/2
003
6/29/2
003
7/6/20
03
7/13/2
003
7/20/2
003
7/27/2
003
8/3/20
03
8/10/2
003
8/17/2
003
8/24/2
003
8/31/2
003
9/7/20
03
9/14/2
003
9/21/2
003
9/28/2
003
Date
Flow
(CFS
)
Milton Dam release Total flow at Our House Dam
FIGURE 3 Middle Yuba River Flows for Summer 2003
7
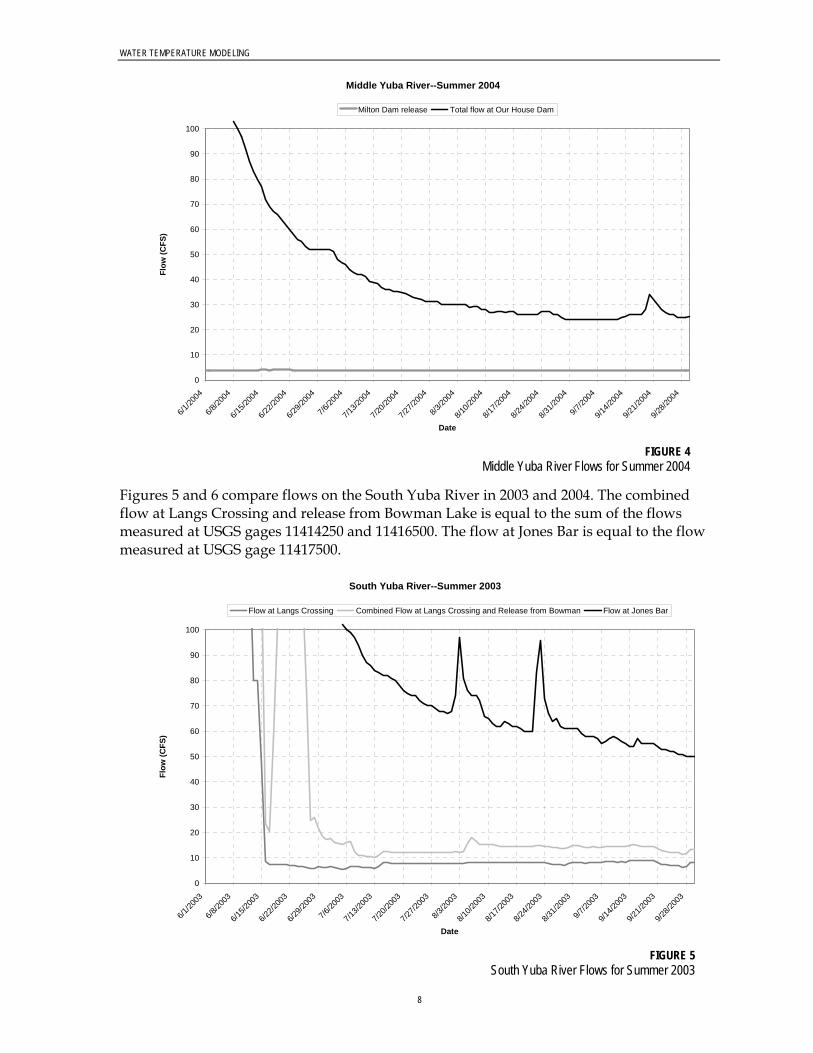
WATER TEMPERATURE MODELING
Middle Yuba River--Summer 2004
0
10
20
30
40
50
60
70
80
90
100
6/1/20
04
6/8/20
04
6/15/2
004
6/22/2
004
6/29/2
004
7/6/20
04
7/13/2
004
7/20/2
004
7/27/2
004
8/3/20
04
8/10/2
004
8/17/2
004
8/24/2
004
8/31/2
004
9/7/20
04
9/14/2
004
9/21/2
004
9/28/2
004
Date
Flow
(CFS
)
Milton Dam release Total flow at Our House Dam
FIGURE 4
Middle Yuba River Flows for Summer 2004
Figures 5 and 6 compare flows on the South Yuba River in 2003 and 2004. The combined flow at Langs Crossing and release from Bowman Lake is equal to the sum of the flows measured at USGS gages 11414250 and 11416500. The flow at Jones Bar is equal to the flow measured at USGS gage 11417500.
South Yuba River--Summer 2003
0
10
20
30
40
50
60
70
80
90
100
6/1/20
03
6/8/20
03
6/15/2
003
6/22/2
003
6/29/2
003
7/6/20
03
7/13/2
003
7/20/2
003
7/27/2
003
8/3/20
03
8/10/2
003
8/17/2
003
8/24/2
003
8/31/2
003
9/7/20
03
9/14/2
003
9/21/2
003
9/28/2
003
Date
Flow
(CFS
)
Flow at Langs Crossing Combined Flow at Langs Crossing and Release from Bowman Flow at Jones Bar
FIGURE 5
South Yuba River Flows for Summer 2003
8
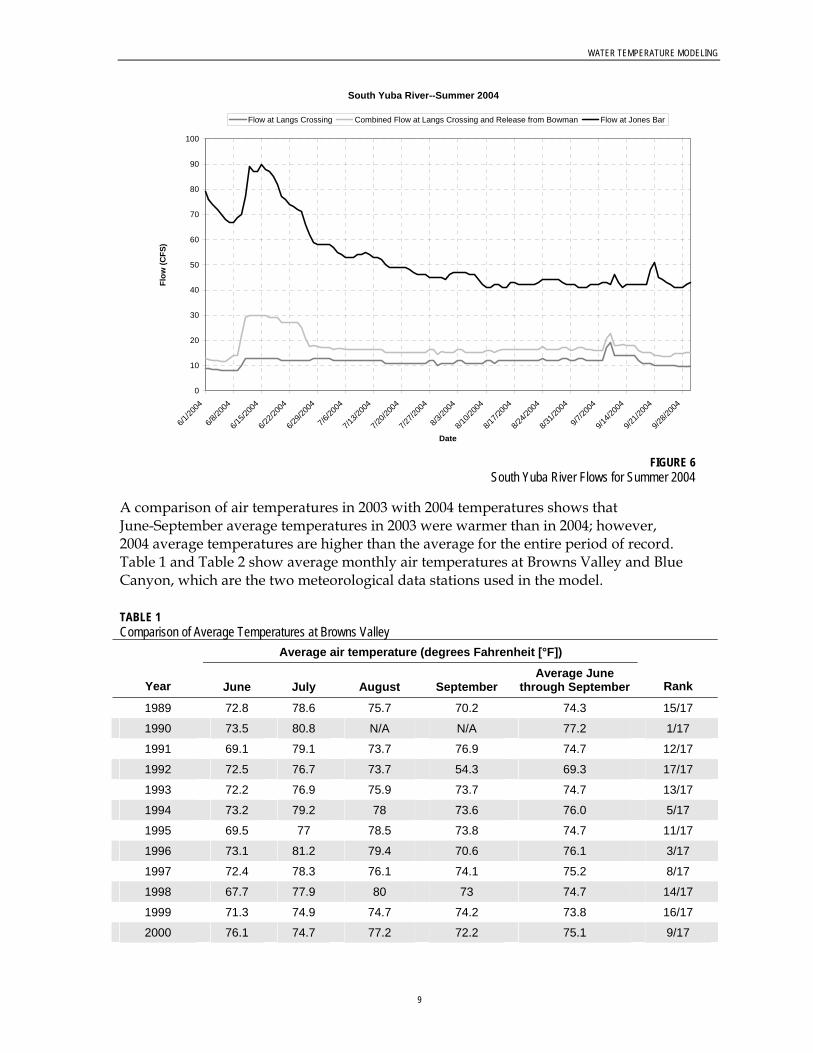
WATER TEMPERATURE MODELING
South Yuba River--Summer 2004
0
10
20
30
40
50
60
70
80
90
100
6/1/20
04
6/8/20
04
6/15/2
004
6/22/2
004
6/29/2
004
7/6/20
04
7/13/2
004
7/20/2
004
7/27/2
004
8/3/20
04
8/10/2
004
8/17/2
004
8/24/2
004
8/31/2
004
9/7/20
04
9/14/2
004
9/21/2
004
9/28/2
004
Date
Flow
(CFS
)
Flow at Langs Crossing Combined Flow at Langs Crossing and Release from Bowman Flow at Jones Bar
FIGURE 6
South Yuba River Flows for Summer 2004
A comparison of air temperatures in 2003 with 2004 temperatures shows that June-September average temperatures in 2003 were warmer than in 2004; however, 2004 average temperatures are higher than the average for the entire period of record. Table 1 and Table 2 show average monthly air temperatures at Browns Valley and Blue Canyon, which are the two meteorological data stations used in the model.
TABLE 1 Comparison of Average Temperatures at Browns Valley
Average air temperature (degrees Fahrenheit [°F])
Year June July August September Average June
through September Rank
1989 72.8 78.6 75.7 70.2 74.3 15/17
1990 73.5 80.8 N/A N/A 77.2 1/17
1991 69.1 79.1 73.7 76.9 74.7 12/17
1992 72.5 76.7 73.7 54.3 69.3 17/17
1993 72.2 76.9 75.9 73.7 74.7 13/17
1994 73.2 79.2 78 73.6 76.0 5/17
1995 69.5 77 78.5 73.8 74.7 11/17
1996 73.1 81.2 79.4 70.6 76.1 3/17
1997 72.4 78.3 76.1 74.1 75.2 8/17
1998 67.7 77.9 80 73 74.7 14/17
1999 71.3 74.9 74.7 74.2 73.8 16/17
2000 76.1 74.7 77.2 72.2 75.1 9/17
9
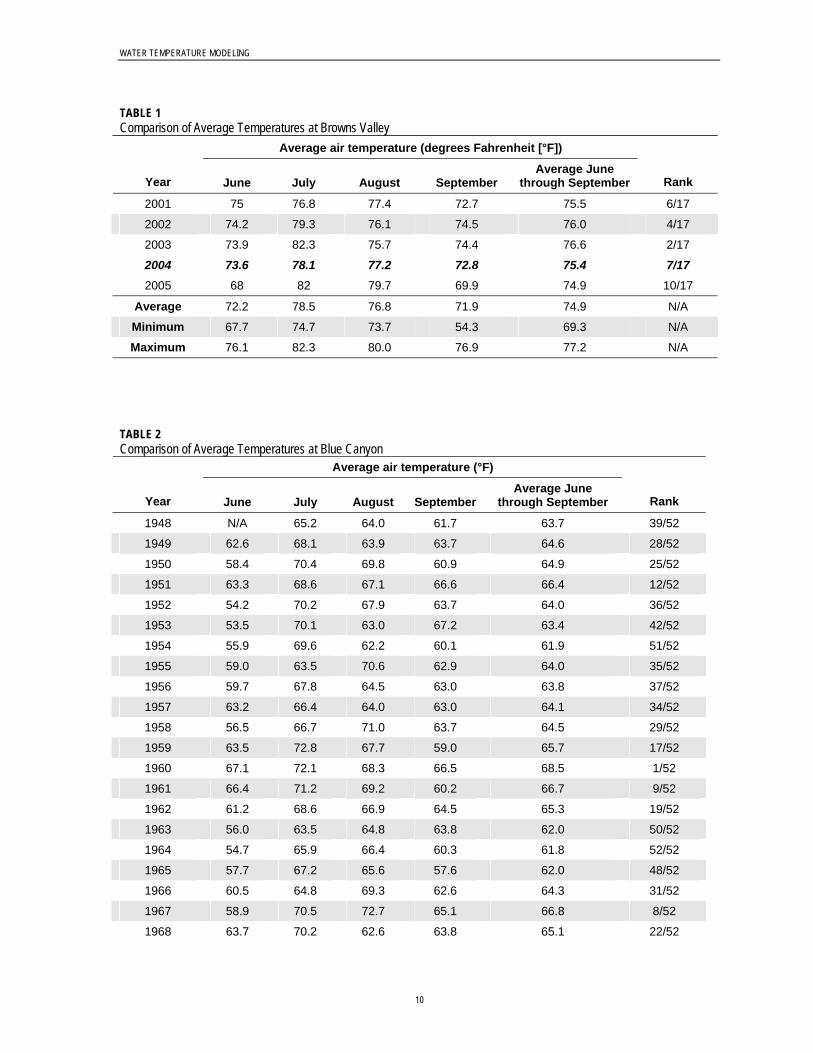
WATER TEMPERATURE MODELING
TABLE 1 Comparison of Average Temperatures at Browns Valley
Average air temperature (degrees Fahrenheit [°F])
Year June July August September Average June
through September Rank
2001 75 76.8 77.4 72.7 75.5 6/17
2002 74.2 79.3 76.1 74.5 76.0 4/17
2003 73.9 82.3 75.7 74.4 76.6 2/17
2004 73.6 78.1 77.2 72.8 75.4 7/17 2005 68 82 79.7 69.9 74.9 10/17
Average 72.2 78.5 76.8 71.9 74.9 N/A
Minimum 67.7 74.7 73.7 54.3 69.3 N/A
Maximum 76.1 82.3 80.0 76.9 77.2 N/A
TABLE 2 Comparison of Average Temperatures at Blue Canyon
Average air temperature (°F)
Year June July August September Average June
through September Rank
1948 N/A 65.2 64.0 61.7 63.7 39/52
1949 62.6 68.1 63.9 63.7 64.6 28/52
1950 58.4 70.4 69.8 60.9 64.9 25/52
1951 63.3 68.6 67.1 66.6 66.4 12/52
1952 54.2 70.2 67.9 63.7 64.0 36/52
1953 53.5 70.1 63.0 67.2 63.4 42/52
1954 55.9 69.6 62.2 60.1 61.9 51/52
1955 59.0 63.5 70.6 62.9 64.0 35/52
1956 59.7 67.8 64.5 63.0 63.8 37/52
1957 63.2 66.4 64.0 63.0 64.1 34/52
1958 56.5 66.7 71.0 63.7 64.5 29/52
1959 63.5 72.8 67.7 59.0 65.7 17/52
1960 67.1 72.1 68.3 66.5 68.5 1/52
1961 66.4 71.2 69.2 60.2 66.7 9/52
1962 61.2 68.6 66.9 64.5 65.3 19/52
1963 56.0 63.5 64.8 63.8 62.0 50/52
1964 54.7 65.9 66.4 60.3 61.8 52/52
1965 57.7 67.2 65.6 57.6 62.0 48/52
1966 60.5 64.8 69.3 62.6 64.3 31/52
1967 58.9 70.5 72.7 65.1 66.8 8/52
1968 63.7 70.2 62.6 63.8 65.1 22/52
10
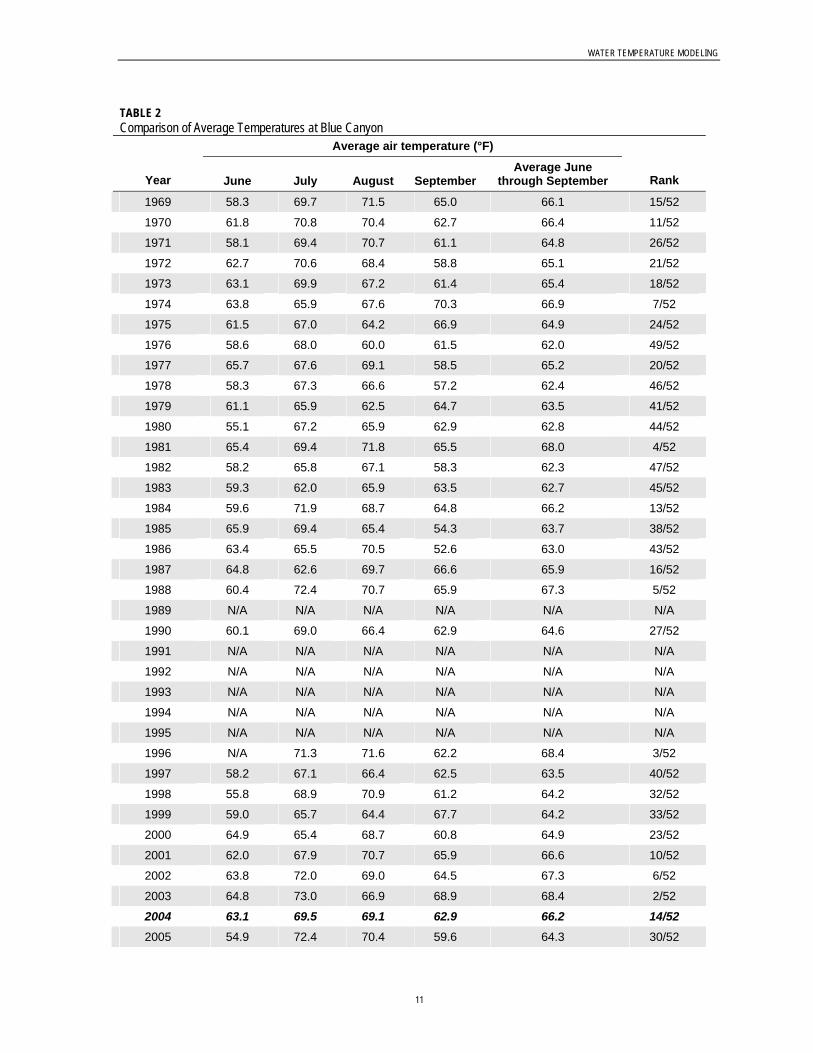
WATER TEMPERATURE MODELING
TABLE 2 Comparison of Average Temperatures at Blue Canyon
Average air temperature (°F)
Year June July August September Average June
through September Rank
1969 58.3 69.7 71.5 65.0 66.1 15/52
1970 61.8 70.8 70.4 62.7 66.4 11/52
1971 58.1 69.4 70.7 61.1 64.8 26/52
1972 62.7 70.6 68.4 58.8 65.1 21/52
1973 63.1 69.9 67.2 61.4 65.4 18/52
1974 63.8 65.9 67.6 70.3 66.9 7/52
1975 61.5 67.0 64.2 66.9 64.9 24/52
1976 58.6 68.0 60.0 61.5 62.0 49/52
1977 65.7 67.6 69.1 58.5 65.2 20/52
1978 58.3 67.3 66.6 57.2 62.4 46/52
1979 61.1 65.9 62.5 64.7 63.5 41/52
1980 55.1 67.2 65.9 62.9 62.8 44/52
1981 65.4 69.4 71.8 65.5 68.0 4/52
1982 58.2 65.8 67.1 58.3 62.3 47/52
1983 59.3 62.0 65.9 63.5 62.7 45/52
1984 59.6 71.9 68.7 64.8 66.2 13/52
1985 65.9 69.4 65.4 54.3 63.7 38/52
1986 63.4 65.5 70.5 52.6 63.0 43/52
1987 64.8 62.6 69.7 66.6 65.9 16/52
1988 60.4 72.4 70.7 65.9 67.3 5/52
1989 N/A N/A N/A N/A N/A N/A
1990 60.1 69.0 66.4 62.9 64.6 27/52
1991 N/A N/A N/A N/A N/A N/A
1992 N/A N/A N/A N/A N/A N/A
1993 N/A N/A N/A N/A N/A N/A
1994 N/A N/A N/A N/A N/A N/A
1995 N/A N/A N/A N/A N/A N/A
1996 N/A 71.3 71.6 62.2 68.4 3/52
1997 58.2 67.1 66.4 62.5 63.5 40/52
1998 55.8 68.9 70.9 61.2 64.2 32/52
1999 59.0 65.7 64.4 67.7 64.2 33/52
2000 64.9 65.4 68.7 60.8 64.9 23/52
2001 62.0 67.9 70.7 65.9 66.6 10/52
2002 63.8 72.0 69.0 64.5 67.3 6/52
2003 64.8 73.0 66.9 68.9 68.4 2/52
2004 63.1 69.5 69.1 62.9 66.2 14/52 2005 54.9 72.4 70.4 59.6 64.3 30/52
11
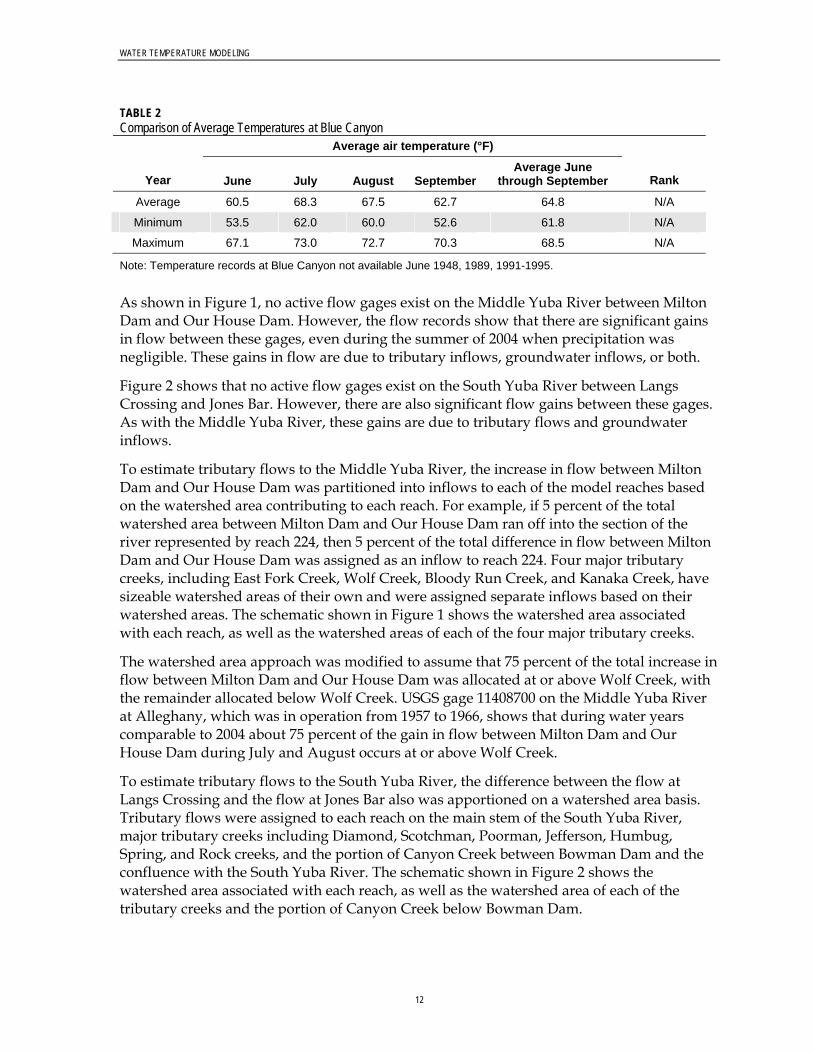
WATER TEMPERATURE MODELING
TABLE 2 Comparison of Average Temperatures at Blue Canyon
Average air temperature (°F)
Year June July August September Average June
through September Rank
Average 60.5 68.3 67.5 62.7 64.8 N/A
Minimum 53.5 62.0 60.0 52.6 61.8 N/A
Maximum 67.1 73.0 72.7 70.3 68.5 N/A
Note: Temperature records at Blue Canyon not available June 1948, 1989, 1991-1995.
As shown in Figure 1, no active flow gages exist on the Middle Yuba River between Milton Dam and Our House Dam. However, the flow records show that there are significant gains in flow between these gages, even during the summer of 2004 when precipitation was negligible. These gains in flow are due to tributary inflows, groundwater inflows, or both.
Figure 2 shows that no active flow gages exist on the South Yuba River between Langs Crossing and Jones Bar. However, there are also significant flow gains between these gages. As with the Middle Yuba River, these gains are due to tributary flows and groundwater inflows.
To estimate tributary flows to the Middle Yuba River, the increase in flow between Milton Dam and Our House Dam was partitioned into inflows to each of the model reaches based on the watershed area contributing to each reach. For example, if 5 percent of the total watershed area between Milton Dam and Our House Dam ran off into the section of the river represented by reach 224, then 5 percent of the total difference in flow between Milton Dam and Our House Dam was assigned as an inflow to reach 224. Four major tributary creeks, including East Fork Creek, Wolf Creek, Bloody Run Creek, and Kanaka Creek, have sizeable watershed areas of their own and were assigned separate inflows based on their watershed areas. The schematic shown in Figure 1 shows the watershed area associated with each reach, as well as the watershed areas of each of the four major tributary creeks.
The watershed area approach was modified to assume that 75 percent of the total increase in flow between Milton Dam and Our House Dam was allocated at or above Wolf Creek, with the remainder allocated below Wolf Creek. USGS gage 11408700 on the Middle Yuba River at Alleghany, which was in operation from 1957 to 1966, shows that during water years comparable to 2004 about 75 percent of the gain in flow between Milton Dam and Our House Dam during July and August occurs at or above Wolf Creek.
To estimate tributary flows to the South Yuba River, the difference between the flow at Langs Crossing and the flow at Jones Bar also was apportioned on a watershed area basis. Tributary flows were assigned to each reach on the main stem of the South Yuba River, major tributary creeks including Diamond, Scotchman, Poorman, Jefferson, Humbug, Spring, and Rock creeks, and the portion of Canyon Creek between Bowman Dam and the confluence with the South Yuba River. The schematic shown in Figure 2 shows the watershed area associated with each reach, as well as the watershed area of each of the tributary creeks and the portion of Canyon Creek below Bowman Dam.
12
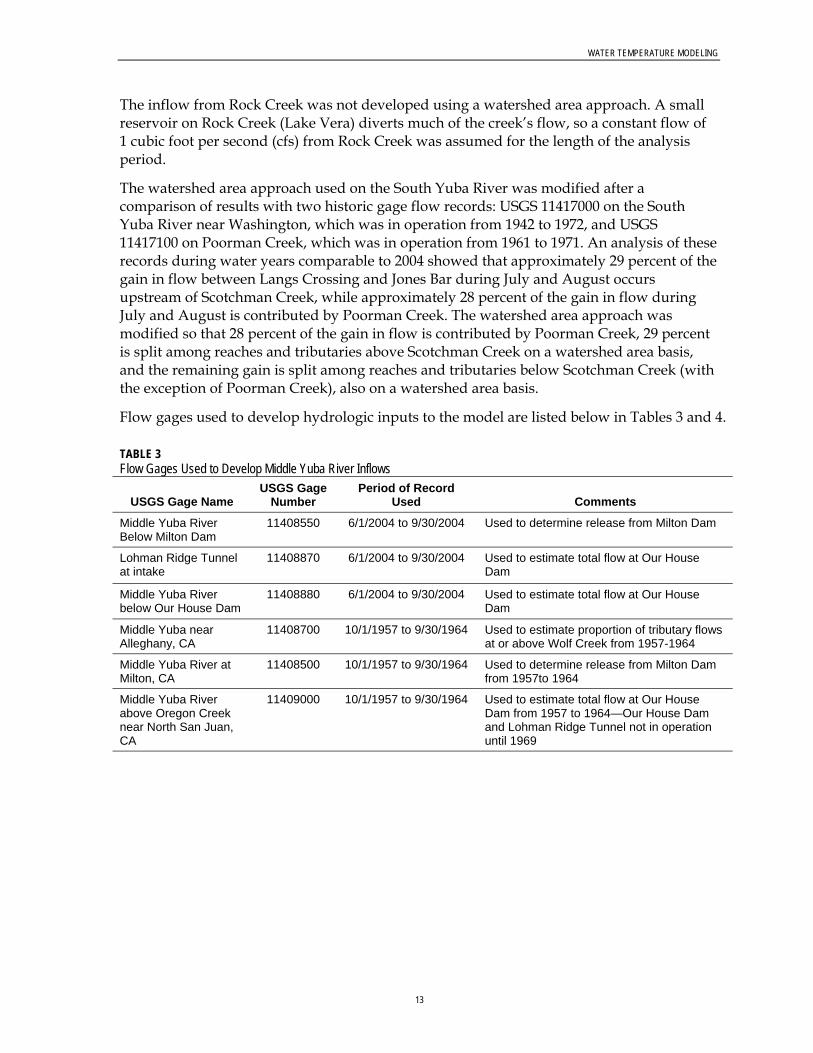
WATER TEMPERATURE MODELING
The inflow from Rock Creek was not developed using a watershed area approach. A small reservoir on Rock Creek (Lake Vera) diverts much of the creek’s flow, so a constant flow of 1 cubic foot per second (cfs) from Rock Creek was assumed for the length of the analysis period.
The watershed area approach used on the South Yuba River was modified after a comparison of results with two historic gage flow records: USGS 11417000 on the South Yuba River near Washington, which was in operation from 1942 to 1972, and USGS 11417100 on Poorman Creek, which was in operation from 1961 to 1971. An analysis of these records during water years comparable to 2004 showed that approximately 29 percent of the gain in flow between Langs Crossing and Jones Bar during July and August occurs upstream of Scotchman Creek, while approximately 28 percent of the gain in flow during July and August is contributed by Poorman Creek. The watershed area approach was modified so that 28 percent of the gain in flow is contributed by Poorman Creek, 29 percent is split among reaches and tributaries above Scotchman Creek on a watershed area basis, and the remaining gain is split among reaches and tributaries below Scotchman Creek (with the exception of Poorman Creek), also on a watershed area basis.
Flow gages used to develop hydrologic inputs to the model are listed below in Tables 3 and 4.
TABLE 3 Flow Gages Used to Develop Middle Yuba River Inflows
USGS Gage Name USGS Gage
Number Period of Record
Used Comments
Middle Yuba River Below Milton Dam
11408550 6/1/2004 to 9/30/2004 Used to determine release from Milton Dam
Lohman Ridge Tunnel at intake
11408870 6/1/2004 to 9/30/2004 Used to estimate total flow at Our House Dam
Middle Yuba River below Our House Dam
11408880 6/1/2004 to 9/30/2004 Used to estimate total flow at Our House Dam
Middle Yuba near Alleghany, CA
11408700 10/1/1957 to 9/30/1964 Used to estimate proportion of tributary flows at or above Wolf Creek from 1957-1964
Middle Yuba River at Milton, CA
11408500 10/1/1957 to 9/30/1964 Used to determine release from Milton Dam from 1957to 1964
Middle Yuba River above Oregon Creek near North San Juan, CA
11409000 10/1/1957 to 9/30/1964 Used to estimate total flow at Our House Dam from 1957 to 1964—Our House Dam and Lohman Ridge Tunnel not in operation until 1969
13
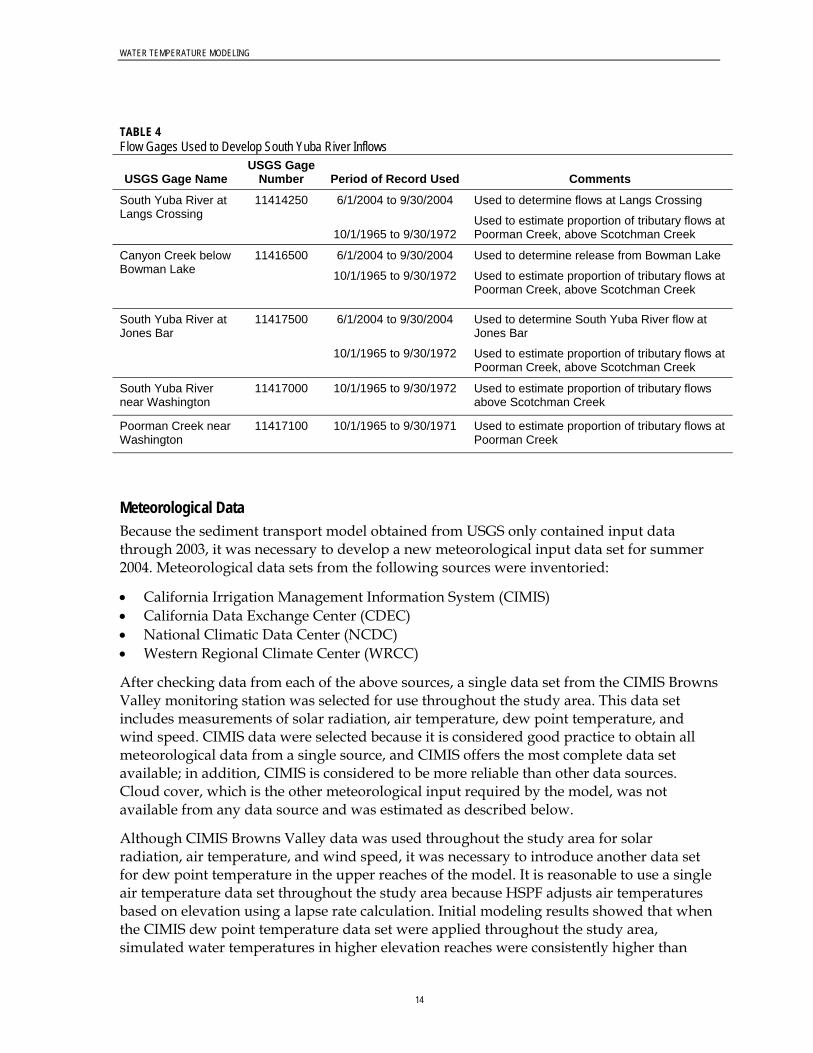
WATER TEMPERATURE MODELING
TABLE 4 Flow Gages Used to Develop South Yuba River Inflows
USGS Gage Name USGS Gage
Number Period of Record Used Comments
South Yuba River at Langs Crossing
11414250 6/1/2004 to 9/30/2004
10/1/1965 to 9/30/1972
Used to determine flows at Langs Crossing
Used to estimate proportion of tributary flows at Poorman Creek, above Scotchman Creek
Canyon Creek below Bowman Lake
11416500 6/1/2004 to 9/30/2004
10/1/1965 to 9/30/1972
Used to determine release from Bowman Lake
Used to estimate proportion of tributary flows at Poorman Creek, above Scotchman Creek
South Yuba River at Jones Bar
11417500 6/1/2004 to 9/30/2004
10/1/1965 to 9/30/1972
Used to determine South Yuba River flow at Jones Bar
Used to estimate proportion of tributary flows at Poorman Creek, above Scotchman Creek
South Yuba River near Washington
11417000 10/1/1965 to 9/30/1972 Used to estimate proportion of tributary flows above Scotchman Creek
Poorman Creek near Washington
11417100 10/1/1965 to 9/30/1971 Used to estimate proportion of tributary flows at Poorman Creek
Meteorological Data Because the sediment transport model obtained from USGS only contained input data through 2003, it was necessary to develop a new meteorological input data set for summer 2004. Meteorological data sets from the following sources were inventoried:
• California Irrigation Management Information System (CIMIS) • California Data Exchange Center (CDEC) • National Climatic Data Center (NCDC) • Western Regional Climate Center (WRCC)
After checking data from each of the above sources, a single data set from the CIMIS Browns Valley monitoring station was selected for use throughout the study area. This data set includes measurements of solar radiation, air temperature, dew point temperature, and wind speed. CIMIS data were selected because it is considered good practice to obtain all meteorological data from a single source, and CIMIS offers the most complete data set available; in addition, CIMIS is considered to be more reliable than other data sources. Cloud cover, which is the other meteorological input required by the model, was not available from any data source and was estimated as described below.
Although CIMIS Browns Valley data was used throughout the study area for solar radiation, air temperature, and wind speed, it was necessary to introduce another data set for dew point temperature in the upper reaches of the model. It is reasonable to use a single air temperature data set throughout the study area because HSPF adjusts air temperatures based on elevation using a lapse rate calculation. Initial modeling results showed that when the CIMIS dew point temperature data set were applied throughout the study area, simulated water temperatures in higher elevation reaches were consistently higher than
14
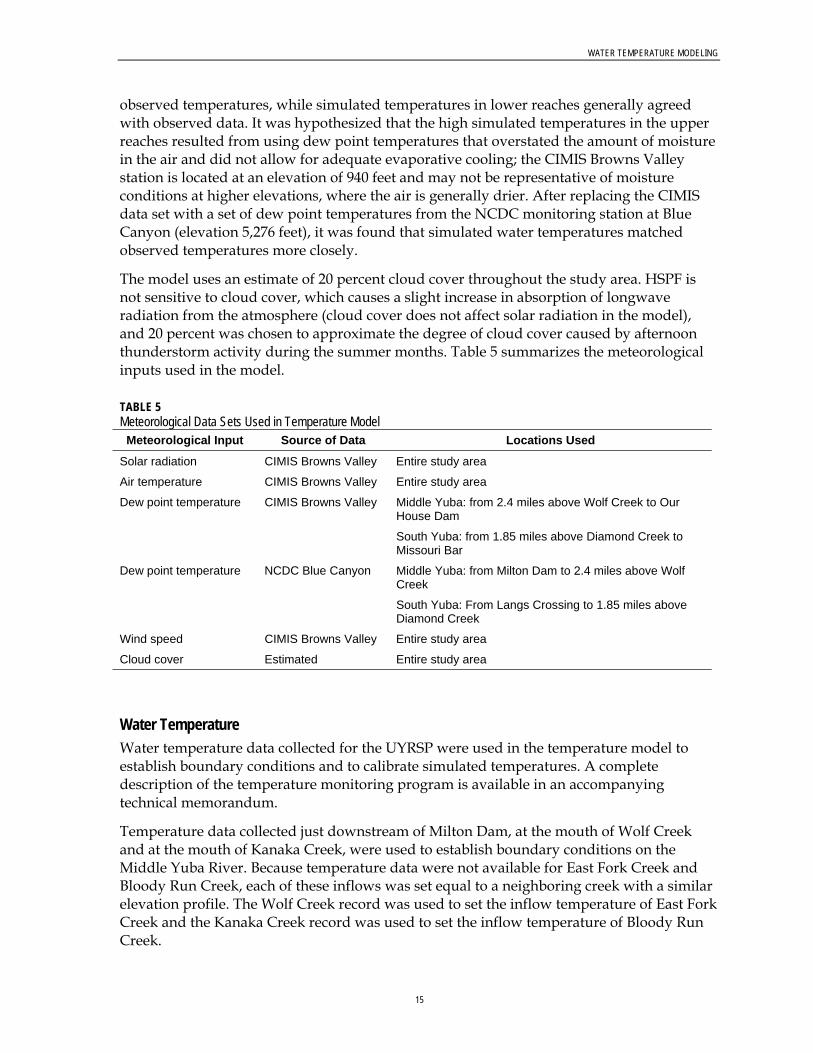
WATER TEMPERATURE MODELING
observed temperatures, while simulated temperatures in lower reaches generally agreed with observed data. It was hypothesized that the high simulated temperatures in the upper reaches resulted from using dew point temperatures that overstated the amount of moisture in the air and did not allow for adequate evaporative cooling; the CIMIS Browns Valley station is located at an elevation of 940 feet and may not be representative of moisture conditions at higher elevations, where the air is generally drier. After replacing the CIMIS data set with a set of dew point temperatures from the NCDC monitoring station at Blue Canyon (elevation 5,276 feet), it was found that simulated water temperatures matched observed temperatures more closely.
The model uses an estimate of 20 percent cloud cover throughout the study area. HSPF is not sensitive to cloud cover, which causes a slight increase in absorption of longwave radiation from the atmosphere (cloud cover does not affect solar radiation in the model), and 20 percent was chosen to approximate the degree of cloud cover caused by afternoon thunderstorm activity during the summer months. Table 5 summarizes the meteorological inputs used in the model.
TABLE 5 Meteorological Data Sets Used in Temperature Model Meteorological Input Source of Data Locations Used
Solar radiation CIMIS Browns Valley Entire study area
Air temperature CIMIS Browns Valley Entire study area
Dew point temperature CIMIS Browns Valley Middle Yuba: from 2.4 miles above Wolf Creek to Our House Dam
South Yuba: from 1.85 miles above Diamond Creek to Missouri Bar
Dew point temperature NCDC Blue Canyon Middle Yuba: from Milton Dam to 2.4 miles above Wolf Creek
South Yuba: From Langs Crossing to 1.85 miles above Diamond Creek
Wind speed CIMIS Browns Valley Entire study area
Cloud cover Estimated Entire study area
Water Temperature Water temperature data collected for the UYRSP were used in the temperature model to establish boundary conditions and to calibrate simulated temperatures. A complete description of the temperature monitoring program is available in an accompanying technical memorandum.
Temperature data collected just downstream of Milton Dam, at the mouth of Wolf Creek and at the mouth of Kanaka Creek, were used to establish boundary conditions on the Middle Yuba River. Because temperature data were not available for East Fork Creek and Bloody Run Creek, each of these inflows was set equal to a neighboring creek with a similar elevation profile. The Wolf Creek record was used to set the inflow temperature of East Fork Creek and the Kanaka Creek record was used to set the inflow temperature of Bloody Run Creek.
15
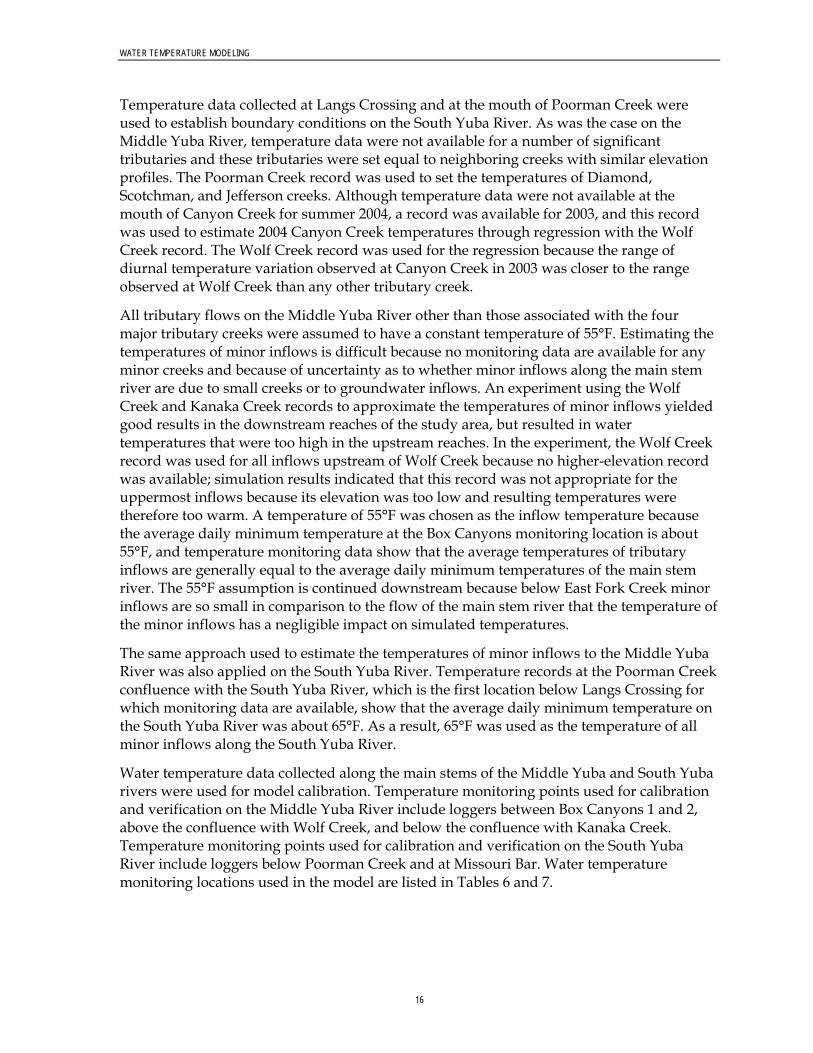
WATER TEMPERATURE MODELING
Temperature data collected at Langs Crossing and at the mouth of Poorman Creek were used to establish boundary conditions on the South Yuba River. As was the case on the Middle Yuba River, temperature data were not available for a number of significant tributaries and these tributaries were set equal to neighboring creeks with similar elevation profiles. The Poorman Creek record was used to set the temperatures of Diamond, Scotchman, and Jefferson creeks. Although temperature data were not available at the mouth of Canyon Creek for summer 2004, a record was available for 2003, and this record was used to estimate 2004 Canyon Creek temperatures through regression with the Wolf Creek record. The Wolf Creek record was used for the regression because the range of diurnal temperature variation observed at Canyon Creek in 2003 was closer to the range observed at Wolf Creek than any other tributary creek.
All tributary flows on the Middle Yuba River other than those associated with the four major tributary creeks were assumed to have a constant temperature of 55°F. Estimating the temperatures of minor inflows is difficult because no monitoring data are available for any minor creeks and because of uncertainty as to whether minor inflows along the main stem river are due to small creeks or to groundwater inflows. An experiment using the Wolf Creek and Kanaka Creek records to approximate the temperatures of minor inflows yielded good results in the downstream reaches of the study area, but resulted in water temperatures that were too high in the upstream reaches. In the experiment, the Wolf Creek record was used for all inflows upstream of Wolf Creek because no higher-elevation record was available; simulation results indicated that this record was not appropriate for the uppermost inflows because its elevation was too low and resulting temperatures were therefore too warm. A temperature of 55°F was chosen as the inflow temperature because the average daily minimum temperature at the Box Canyons monitoring location is about 55°F, and temperature monitoring data show that the average temperatures of tributary inflows are generally equal to the average daily minimum temperatures of the main stem river. The 55°F assumption is continued downstream because below East Fork Creek minor inflows are so small in comparison to the flow of the main stem river that the temperature of the minor inflows has a negligible impact on simulated temperatures.
The same approach used to estimate the temperatures of minor inflows to the Middle Yuba River was also applied on the South Yuba River. Temperature records at the Poorman Creek confluence with the South Yuba River, which is the first location below Langs Crossing for which monitoring data are available, show that the average daily minimum temperature on the South Yuba River was about 65°F. As a result, 65°F was used as the temperature of all minor inflows along the South Yuba River.
Water temperature data collected along the main stems of the Middle Yuba and South Yuba rivers were used for model calibration. Temperature monitoring points used for calibration and verification on the Middle Yuba River include loggers between Box Canyons 1 and 2, above the confluence with Wolf Creek, and below the confluence with Kanaka Creek. Temperature monitoring points used for calibration and verification on the South Yuba River include loggers below Poorman Creek and at Missouri Bar. Water temperature monitoring locations used in the model are listed in Tables 6 and 7.
16
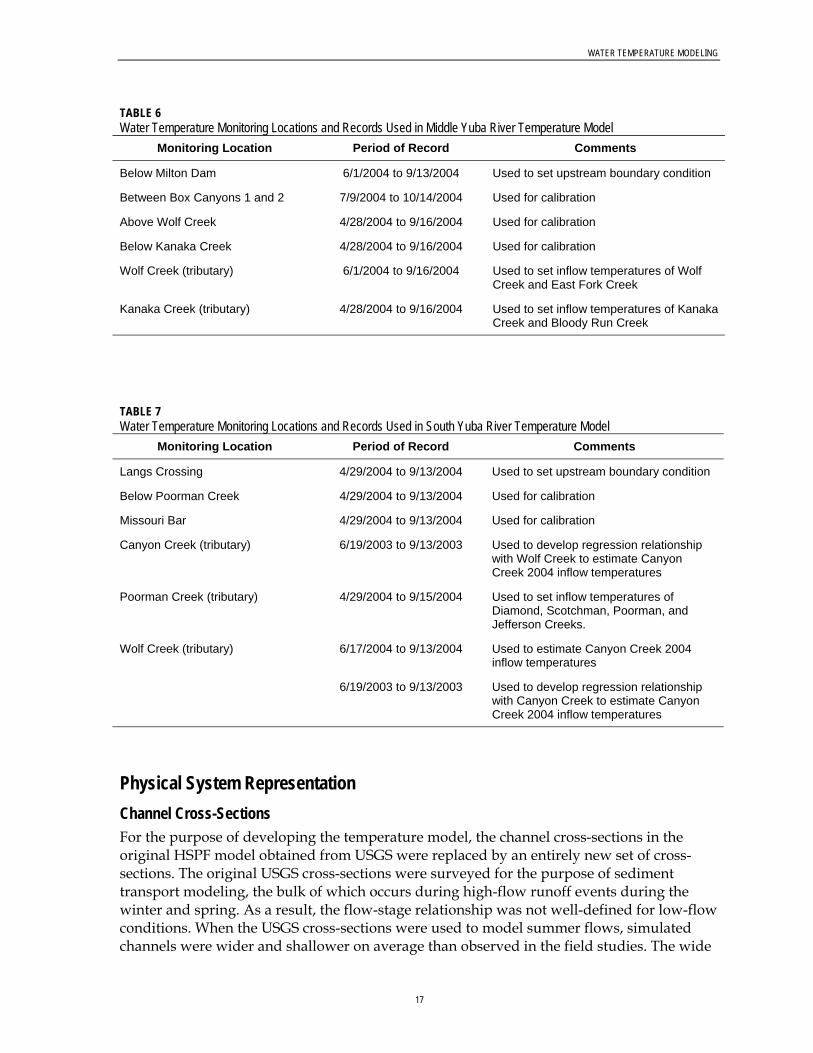
WATER TEMPERATURE MODELING
TABLE 6 Water Temperature Monitoring Locations and Records Used in Middle Yuba River Temperature Model
Monitoring Location Period of Record Comments
Below Milton Dam 6/1/2004 to 9/13/2004 Used to set upstream boundary condition
Between Box Canyons 1 and 2 7/9/2004 to 10/14/2004 Used for calibration
Above Wolf Creek 4/28/2004 to 9/16/2004 Used for calibration
Below Kanaka Creek 4/28/2004 to 9/16/2004 Used for calibration
Wolf Creek (tributary) 6/1/2004 to 9/16/2004 Used to set inflow temperatures of Wolf Creek and East Fork Creek
Kanaka Creek (tributary) 4/28/2004 to 9/16/2004 Used to set inflow temperatures of Kanaka Creek and Bloody Run Creek
TABLE 7 Water Temperature Monitoring Locations and Records Used in South Yuba River Temperature Model
Monitoring Location Period of Record Comments
Langs Crossing 4/29/2004 to 9/13/2004 Used to set upstream boundary condition
Below Poorman Creek 4/29/2004 to 9/13/2004 Used for calibration
Missouri Bar 4/29/2004 to 9/13/2004 Used for calibration
Canyon Creek (tributary) 6/19/2003 to 9/13/2003 Used to develop regression relationship with Wolf Creek to estimate Canyon Creek 2004 inflow temperatures
Poorman Creek (tributary) 4/29/2004 to 9/15/2004 Used to set inflow temperatures of Diamond, Scotchman, Poorman, and Jefferson Creeks.
Wolf Creek (tributary) 6/17/2004 to 9/13/2004
6/19/2003 to 9/13/2003
Used to estimate Canyon Creek 2004 inflow temperatures
Used to develop regression relationship with Canyon Creek to estimate Canyon Creek 2004 inflow temperatures
Physical System Representation Channel Cross-Sections For the purpose of developing the temperature model, the channel cross-sections in the original HSPF model obtained from USGS were replaced by an entirely new set of cross-sections. The original USGS cross-sections were surveyed for the purpose of sediment transport modeling, the bulk of which occurs during high-flow runoff events during the winter and spring. As a result, the flow-stage relationship was not well-defined for low-flow conditions. When the USGS cross-sections were used to model summer flows, simulated channels were wider and shallower on average than observed in the field studies. The wide
17
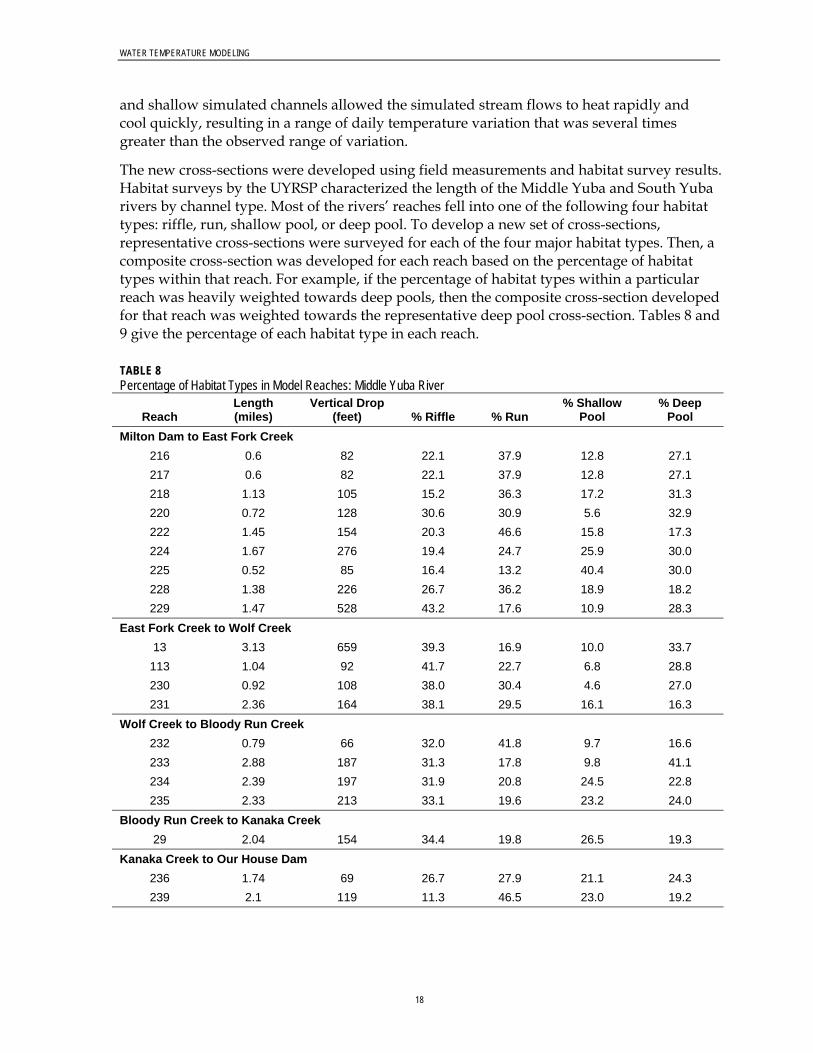
WATER TEMPERATURE MODELING
and shallow simulated channels allowed the simulated stream flows to heat rapidly and cool quickly, resulting in a range of daily temperature variation that was several times greater than the observed range of variation.
The new cross-sections were developed using field measurements and habitat survey results. Habitat surveys by the UYRSP characterized the length of the Middle Yuba and South Yuba rivers by channel type. Most of the rivers’ reaches fell into one of the following four habitat types: riffle, run, shallow pool, or deep pool. To develop a new set of cross-sections, representative cross-sections were surveyed for each of the four major habitat types. Then, a composite cross-section was developed for each reach based on the percentage of habitat types within that reach. For example, if the percentage of habitat types within a particular reach was heavily weighted towards deep pools, then the composite cross-section developed for that reach was weighted towards the representative deep pool cross-section. Tables 8 and 9 give the percentage of each habitat type in each reach.
TABLE 8 Percentage of Habitat Types in Model Reaches: Middle Yuba River
Reach Length (miles)
Vertical Drop (feet) % Riffle % Run
% Shallow Pool
% Deep Pool
Milton Dam to East Fork Creek 216 0.6 82 22.1 37.9 12.8 27.1 217 0.6 82 22.1 37.9 12.8 27.1 218 1.13 105 15.2 36.3 17.2 31.3 220 0.72 128 30.6 30.9 5.6 32.9 222 1.45 154 20.3 46.6 15.8 17.3 224 1.67 276 19.4 24.7 25.9 30.0 225 0.52 85 16.4 13.2 40.4 30.0 228 1.38 226 26.7 36.2 18.9 18.2 229 1.47 528 43.2 17.6 10.9 28.3
East Fork Creek to Wolf Creek 13 3.13 659 39.3 16.9 10.0 33.7
113 1.04 92 41.7 22.7 6.8 28.8 230 0.92 108 38.0 30.4 4.6 27.0 231 2.36 164 38.1 29.5 16.1 16.3
Wolf Creek to Bloody Run Creek 232 0.79 66 32.0 41.8 9.7 16.6 233 2.88 187 31.3 17.8 9.8 41.1 234 2.39 197 31.9 20.8 24.5 22.8 235 2.33 213 33.1 19.6 23.2 24.0
Bloody Run Creek to Kanaka Creek 29 2.04 154 34.4 19.8 26.5 19.3
Kanaka Creek to Our House Dam 236 1.74 69 26.7 27.9 21.1 24.3 239 2.1 119 11.3 46.5 23.0 19.2
18
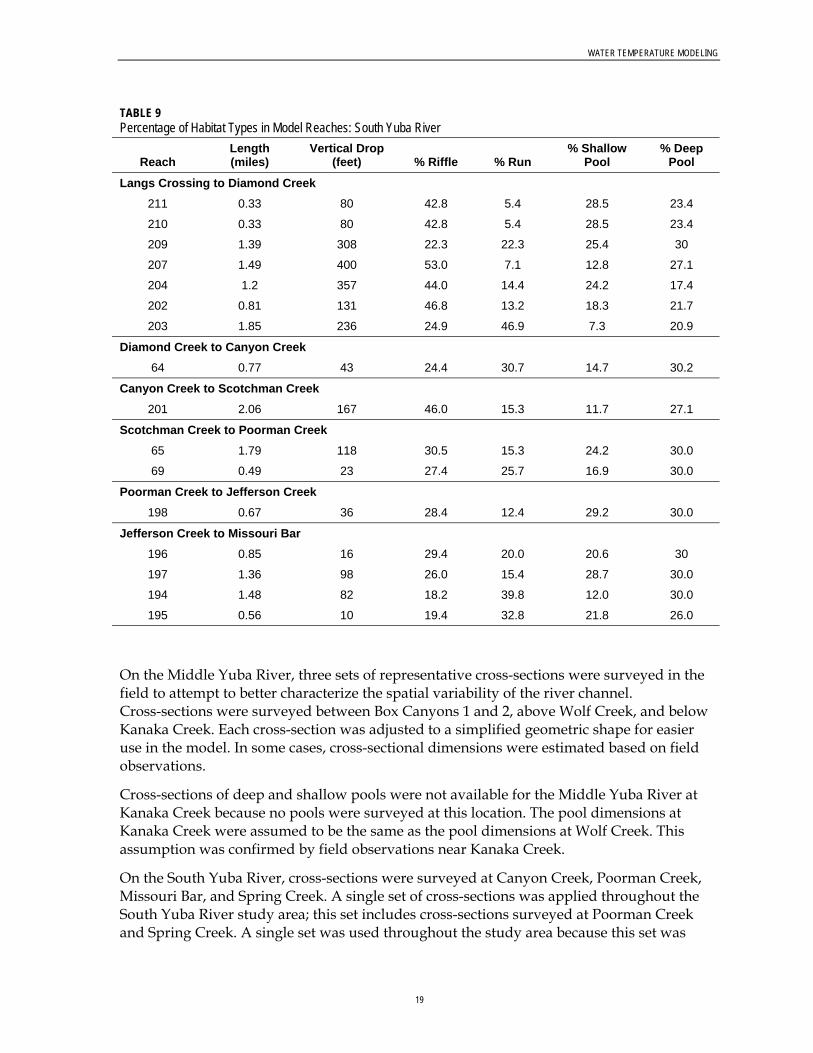
WATER TEMPERATURE MODELING
TABLE 9 Percentage of Habitat Types in Model Reaches: South Yuba River
Reach Length (miles)
Vertical Drop (feet) % Riffle % Run
% Shallow Pool
% Deep Pool
Langs Crossing to Diamond Creek 211 0.33 80 42.8 5.4 28.5 23.4
210 0.33 80 42.8 5.4 28.5 23.4
209 1.39 308 22.3 22.3 25.4 30
207 1.49 400 53.0 7.1 12.8 27.1
204 1.2 357 44.0 14.4 24.2 17.4
202 0.81 131 46.8 13.2 18.3 21.7
203 1.85 236 24.9 46.9 7.3 20.9
Diamond Creek to Canyon Creek 64 0.77 43 24.4 30.7 14.7 30.2
Canyon Creek to Scotchman Creek 201 2.06 167 46.0 15.3 11.7 27.1
Scotchman Creek to Poorman Creek 65 1.79 118 30.5 15.3 24.2 30.0
69 0.49 23 27.4 25.7 16.9 30.0
Poorman Creek to Jefferson Creek 198 0.67 36 28.4 12.4 29.2 30.0
Jefferson Creek to Missouri Bar 196 0.85 16 29.4 20.0 20.6 30
197 1.36 98 26.0 15.4 28.7 30.0
194 1.48 82 18.2 39.8 12.0 30.0
195 0.56 10 19.4 32.8 21.8 26.0
On the Middle Yuba River, three sets of representative cross-sections were surveyed in the field to attempt to better characterize the spatial variability of the river channel. Cross-sections were surveyed between Box Canyons 1 and 2, above Wolf Creek, and below Kanaka Creek. Each cross-section was adjusted to a simplified geometric shape for easier use in the model. In some cases, cross-sectional dimensions were estimated based on field observations.
Cross-sections of deep and shallow pools were not available for the Middle Yuba River at Kanaka Creek because no pools were surveyed at this location. The pool dimensions at Kanaka Creek were assumed to be the same as the pool dimensions at Wolf Creek. This assumption was confirmed by field observations near Kanaka Creek.
On the South Yuba River, cross-sections were surveyed at Canyon Creek, Poorman Creek, Missouri Bar, and Spring Creek. A single set of cross-sections was applied throughout the South Yuba River study area; this set includes cross-sections surveyed at Poorman Creek and Spring Creek. A single set was used throughout the study area because this set was
19
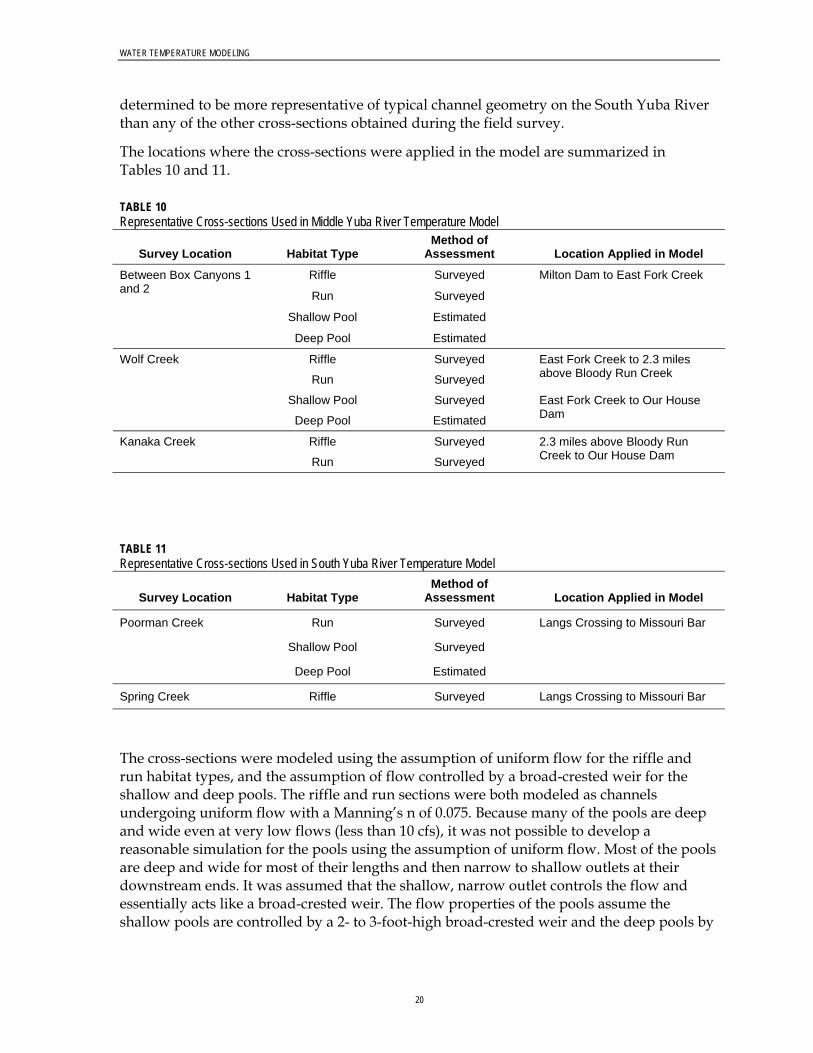
WATER TEMPERATURE MODELING
determined to be more representative of typical channel geometry on the South Yuba River than any of the other cross-sections obtained during the field survey.
The locations where the cross-sections were applied in the model are summarized in Tables 10 and 11.
TABLE 10 Representative Cross-sections Used in Middle Yuba River Temperature Model
Survey Location Habitat Type Method of
Assessment Location Applied in Model
Riffle Surveyed
Run Surveyed
Shallow Pool Estimated
Between Box Canyons 1 and 2
Deep Pool Estimated
Milton Dam to East Fork Creek
Riffle Surveyed
Run Surveyed
East Fork Creek to 2.3 miles above Bloody Run Creek
Shallow Pool Surveyed
Wolf Creek
Deep Pool Estimated
East Fork Creek to Our House Dam
Riffle Surveyed Kanaka Creek
Run Surveyed
2.3 miles above Bloody Run Creek to Our House Dam
TABLE 11 Representative Cross-sections Used in South Yuba River Temperature Model
Survey Location Habitat Type Method of
Assessment Location Applied in Model
Run Surveyed
Shallow Pool Surveyed
Poorman Creek
Deep Pool Estimated
Langs Crossing to Missouri Bar
Spring Creek Riffle Surveyed Langs Crossing to Missouri Bar
The cross-sections were modeled using the assumption of uniform flow for the riffle and run habitat types, and the assumption of flow controlled by a broad-crested weir for the shallow and deep pools. The riffle and run sections were both modeled as channels undergoing uniform flow with a Manning’s n of 0.075. Because many of the pools are deep and wide even at very low flows (less than 10 cfs), it was not possible to develop a reasonable simulation for the pools using the assumption of uniform flow. Most of the pools are deep and wide for most of their lengths and then narrow to shallow outlets at their downstream ends. It was assumed that the shallow, narrow outlet controls the flow and essentially acts like a broad-crested weir. The flow properties of the pools assume the shallow pools are controlled by a 2- to 3-foot-high broad-crested weir and the deep pools by
20
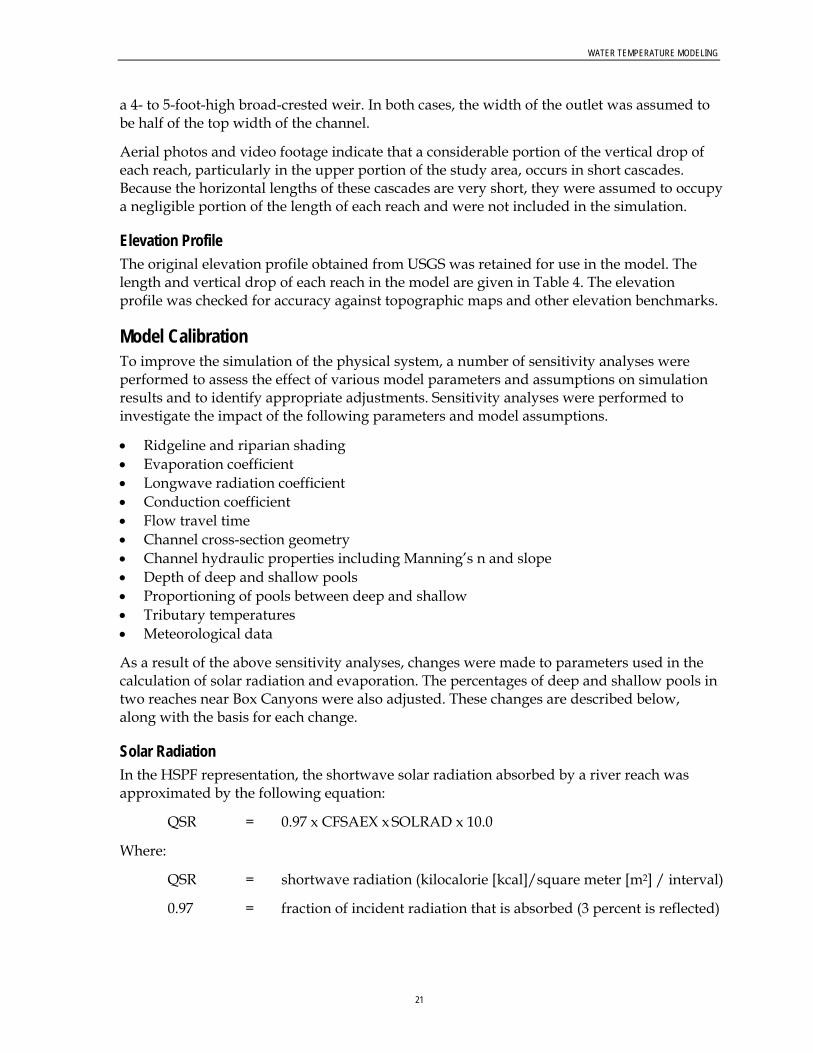
WATER TEMPERATURE MODELING
a 4- to 5-foot-high broad-crested weir. In both cases, the width of the outlet was assumed to be half of the top width of the channel.
Aerial photos and video footage indicate that a considerable portion of the vertical drop of each reach, particularly in the upper portion of the study area, occurs in short cascades. Because the horizontal lengths of these cascades are very short, they were assumed to occupy a negligible portion of the length of each reach and were not included in the simulation.
Elevation Profile The original elevation profile obtained from USGS was retained for use in the model. The length and vertical drop of each reach in the model are given in Table 4. The elevation profile was checked for accuracy against topographic maps and other elevation benchmarks.
Model Calibration To improve the simulation of the physical system, a number of sensitivity analyses were performed to assess the effect of various model parameters and assumptions on simulation results and to identify appropriate adjustments. Sensitivity analyses were performed to investigate the impact of the following parameters and model assumptions.
• Ridgeline and riparian shading • Evaporation coefficient • Longwave radiation coefficient • Conduction coefficient • Flow travel time • Channel cross-section geometry • Channel hydraulic properties including Manning’s n and slope • Depth of deep and shallow pools • Proportioning of pools between deep and shallow • Tributary temperatures • Meteorological data
As a result of the above sensitivity analyses, changes were made to parameters used in the calculation of solar radiation and evaporation. The percentages of deep and shallow pools in two reaches near Box Canyons were also adjusted. These changes are described below, along with the basis for each change.
Solar Radiation In the HSPF representation, the shortwave solar radiation absorbed by a river reach was approximated by the following equation:
QSR = 0.97 x CFSAEX x SOLRAD x 10.0
Where:
QSR = shortwave radiation (kilocalorie [kcal]/square meter [m2] / interval)
0.97 = fraction of incident radiation that is absorbed (3 percent is reflected)
21
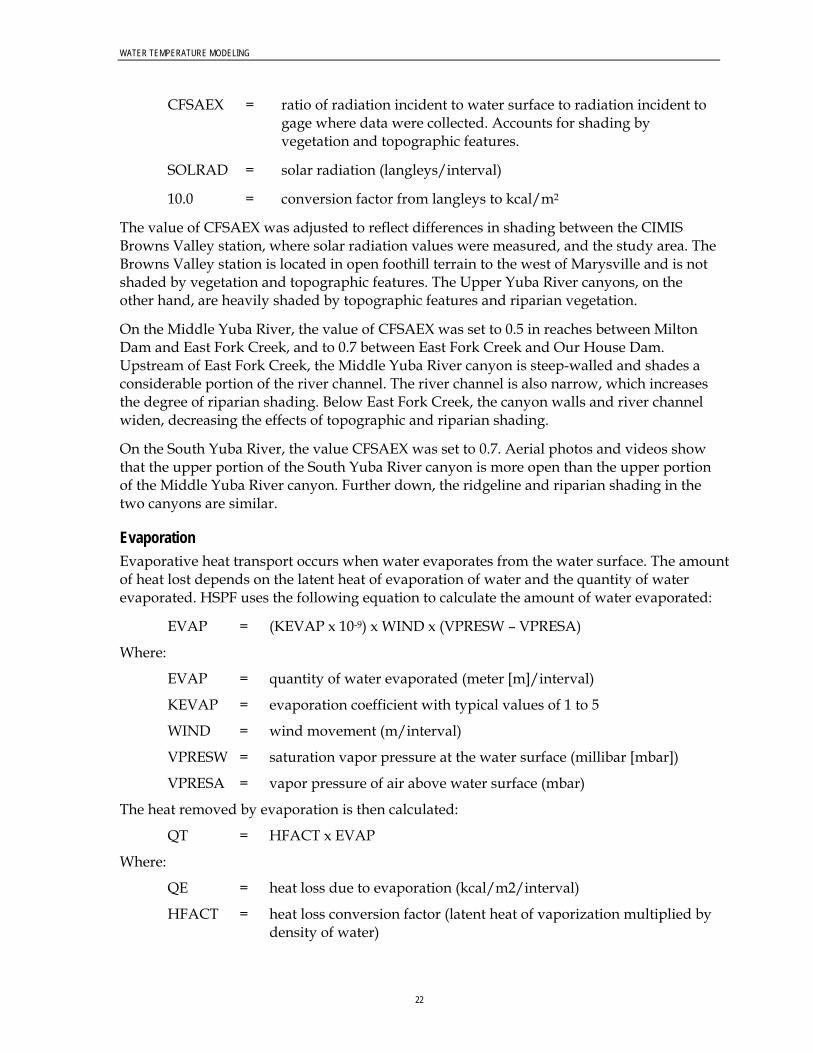
WATER TEMPERATURE MODELING
CFSAEX = ratio of radiation incident to water surface to radiation incident to gage where data were collected. Accounts for shading by vegetation and topographic features.
SOLRAD = solar radiation (langleys/interval)
10.0 = conversion factor from langleys to kcal/m2
The value of CFSAEX was adjusted to reflect differences in shading between the CIMIS Browns Valley station, where solar radiation values were measured, and the study area. The Browns Valley station is located in open foothill terrain to the west of Marysville and is not shaded by vegetation and topographic features. The Upper Yuba River canyons, on the other hand, are heavily shaded by topographic features and riparian vegetation.
On the Middle Yuba River, the value of CFSAEX was set to 0.5 in reaches between Milton Dam and East Fork Creek, and to 0.7 between East Fork Creek and Our House Dam. Upstream of East Fork Creek, the Middle Yuba River canyon is steep-walled and shades a considerable portion of the river channel. The river channel is also narrow, which increases the degree of riparian shading. Below East Fork Creek, the canyon walls and river channel widen, decreasing the effects of topographic and riparian shading.
On the South Yuba River, the value CFSAEX was set to 0.7. Aerial photos and videos show that the upper portion of the South Yuba River canyon is more open than the upper portion of the Middle Yuba River canyon. Further down, the ridgeline and riparian shading in the two canyons are similar.
Evaporation Evaporative heat transport occurs when water evaporates from the water surface. The amount of heat lost depends on the latent heat of evaporation of water and the quantity of water evaporated. HSPF uses the following equation to calculate the amount of water evaporated:
EVAP = (KEVAP x 10-9) x WIND x (VPRESW – VPRESA)
Where:
EVAP = quantity of water evaporated (meter [m]/interval)
KEVAP = evaporation coefficient with typical values of 1 to 5
WIND = wind movement (m/interval)
VPRESW = saturation vapor pressure at the water surface (millibar [mbar])
VPRESA = vapor pressure of air above water surface (mbar)
The heat removed by evaporation is then calculated:
QT = HFACT x EVAP
Where:
QE = heat loss due to evaporation (kcal/m2/interval)
HFACT = heat loss conversion factor (latent heat of vaporization multiplied by density of water)
22
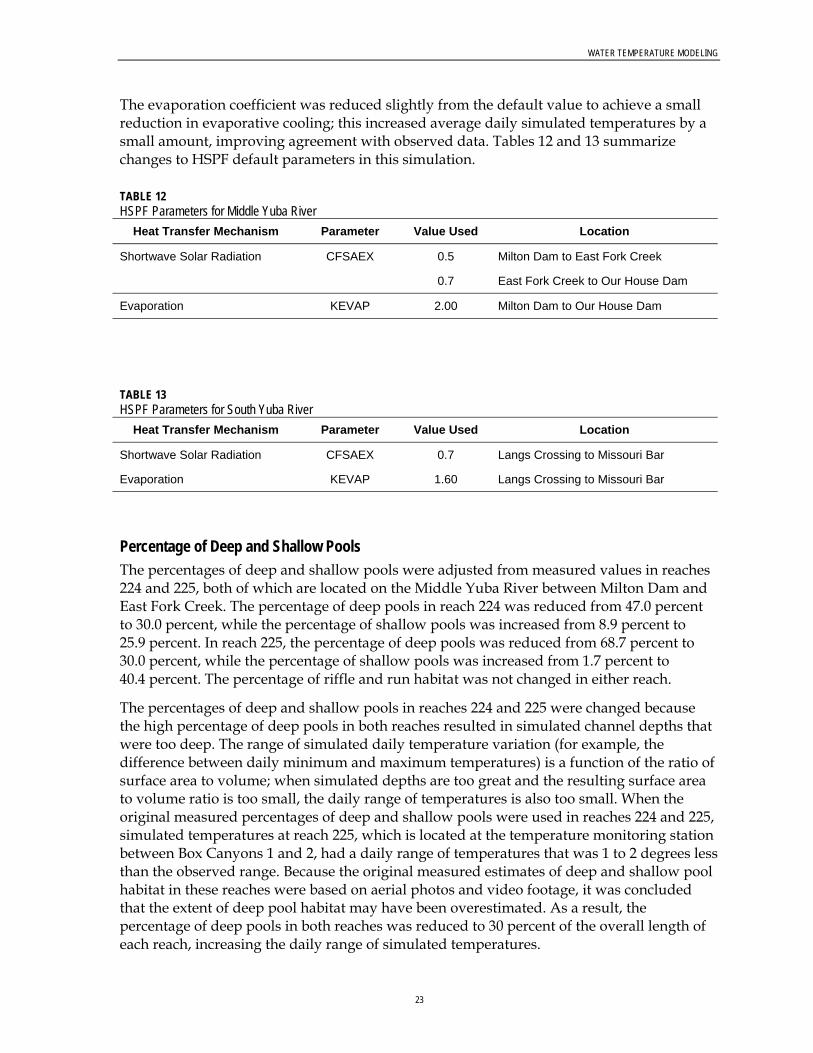
WATER TEMPERATURE MODELING
The evaporation coefficient was reduced slightly from the default value to achieve a small reduction in evaporative cooling; this increased average daily simulated temperatures by a small amount, improving agreement with observed data. Tables 12 and 13 summarize changes to HSPF default parameters in this simulation.
TABLE 12 HSPF Parameters for Middle Yuba River
Heat Transfer Mechanism Parameter Value Used Location
0.5 Milton Dam to East Fork Creek Shortwave Solar Radiation CFSAEX
0.7 East Fork Creek to Our House Dam
Evaporation KEVAP 2.00 Milton Dam to Our House Dam
TABLE 13 HSPF Parameters for South Yuba River
Heat Transfer Mechanism Parameter Value Used Location
Shortwave Solar Radiation CFSAEX 0.7 Langs Crossing to Missouri Bar
Evaporation KEVAP 1.60 Langs Crossing to Missouri Bar
Percentage of Deep and Shallow Pools The percentages of deep and shallow pools were adjusted from measured values in reaches 224 and 225, both of which are located on the Middle Yuba River between Milton Dam and East Fork Creek. The percentage of deep pools in reach 224 was reduced from 47.0 percent to 30.0 percent, while the percentage of shallow pools was increased from 8.9 percent to 25.9 percent. In reach 225, the percentage of deep pools was reduced from 68.7 percent to 30.0 percent, while the percentage of shallow pools was increased from 1.7 percent to 40.4 percent. The percentage of riffle and run habitat was not changed in either reach.
The percentages of deep and shallow pools in reaches 224 and 225 were changed because the high percentage of deep pools in both reaches resulted in simulated channel depths that were too deep. The range of simulated daily temperature variation (for example, the difference between daily minimum and maximum temperatures) is a function of the ratio of surface area to volume; when simulated depths are too great and the resulting surface area to volume ratio is too small, the daily range of temperatures is also too small. When the original measured percentages of deep and shallow pools were used in reaches 224 and 225, simulated temperatures at reach 225, which is located at the temperature monitoring station between Box Canyons 1 and 2, had a daily range of temperatures that was 1 to 2 degrees less than the observed range. Because the original measured estimates of deep and shallow pool habitat in these reaches were based on aerial photos and video footage, it was concluded that the extent of deep pool habitat may have been overestimated. As a result, the percentage of deep pools in both reaches was reduced to 30 percent of the overall length of each reach, increasing the daily range of simulated temperatures.
23
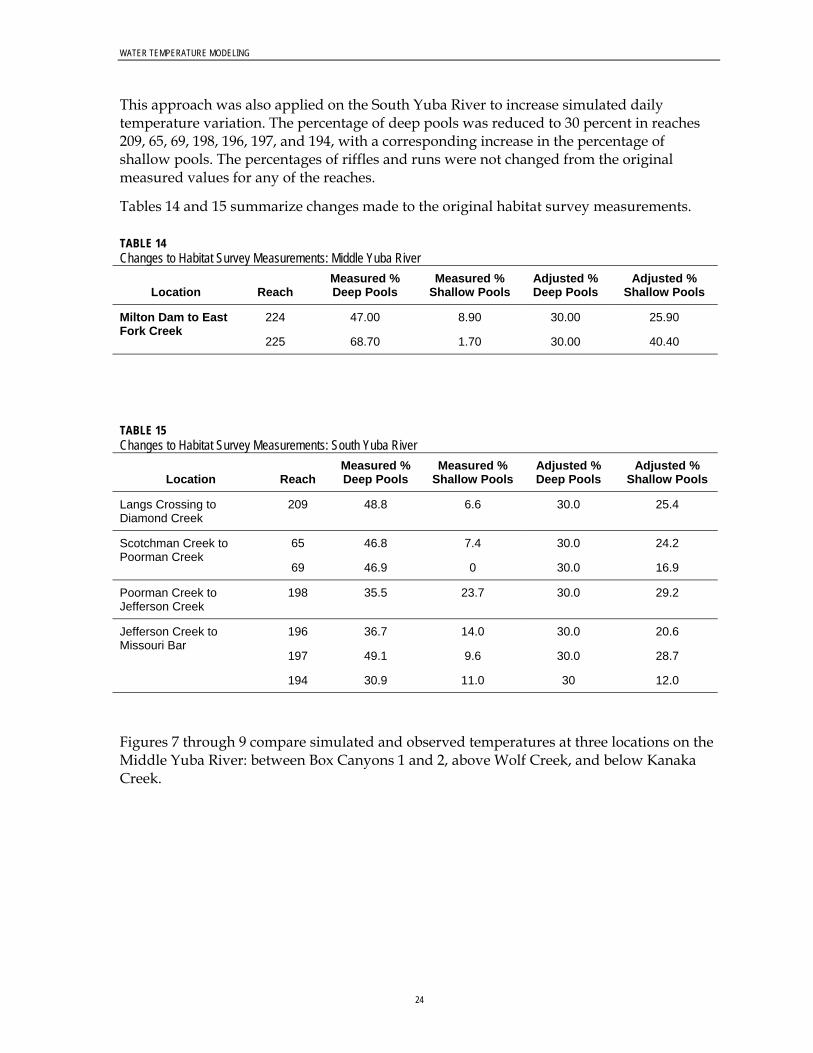
WATER TEMPERATURE MODELING
This approach was also applied on the South Yuba River to increase simulated daily temperature variation. The percentage of deep pools was reduced to 30 percent in reaches 209, 65, 69, 198, 196, 197, and 194, with a corresponding increase in the percentage of shallow pools. The percentages of riffles and runs were not changed from the original measured values for any of the reaches.
Tables 14 and 15 summarize changes made to the original habitat survey measurements.
TABLE 14 Changes to Habitat Survey Measurements: Middle Yuba River
Location Reach Measured % Deep Pools
Measured % Shallow Pools
Adjusted % Deep Pools
Adjusted % Shallow Pools
224 47.00 8.90 30.00 25.90 Milton Dam to East Fork Creek
225 68.70 1.70 30.00 40.40
TABLE 15 Changes to Habitat Survey Measurements: South Yuba River
Location Reach Measured % Deep Pools
Measured % Shallow Pools
Adjusted % Deep Pools
Adjusted % Shallow Pools
Langs Crossing to Diamond Creek
209 48.8 6.6 30.0 25.4
65 46.8 7.4 30.0 24.2 Scotchman Creek to Poorman Creek
69 46.9 0 30.0 16.9
Poorman Creek to Jefferson Creek
198 35.5 23.7 30.0 29.2
196 36.7 14.0 30.0 20.6
197 49.1 9.6 30.0 28.7
Jefferson Creek to Missouri Bar
194 30.9 11.0 30 12.0
Figures 7 through 9 compare simulated and observed temperatures at three locations on the Middle Yuba River: between Box Canyons 1 and 2, above Wolf Creek, and below Kanaka Creek.
24
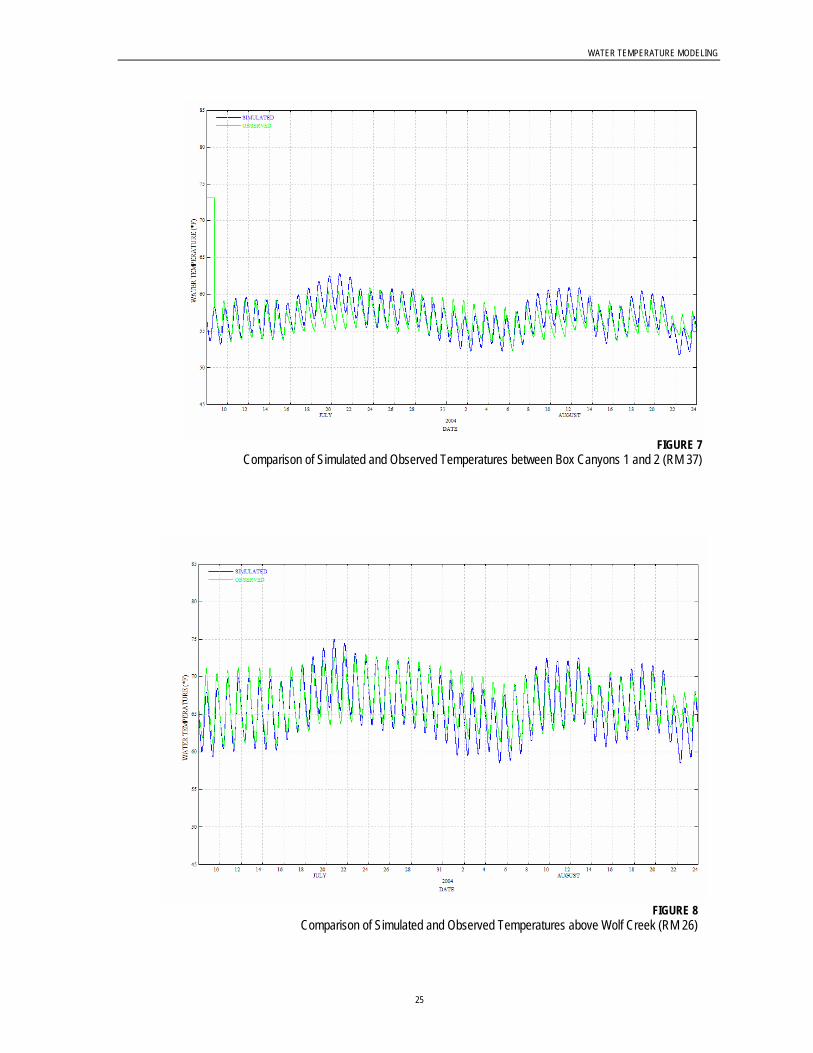
WATER TEMPERATURE MODELING
FIGURE 7
Comparison of Simulated and Observed Temperatures between Box Canyons 1 and 2 (RM 37)
FIGURE 8 Comparison of Simulated and Observed Temperatures above Wolf Creek (RM 26)
25
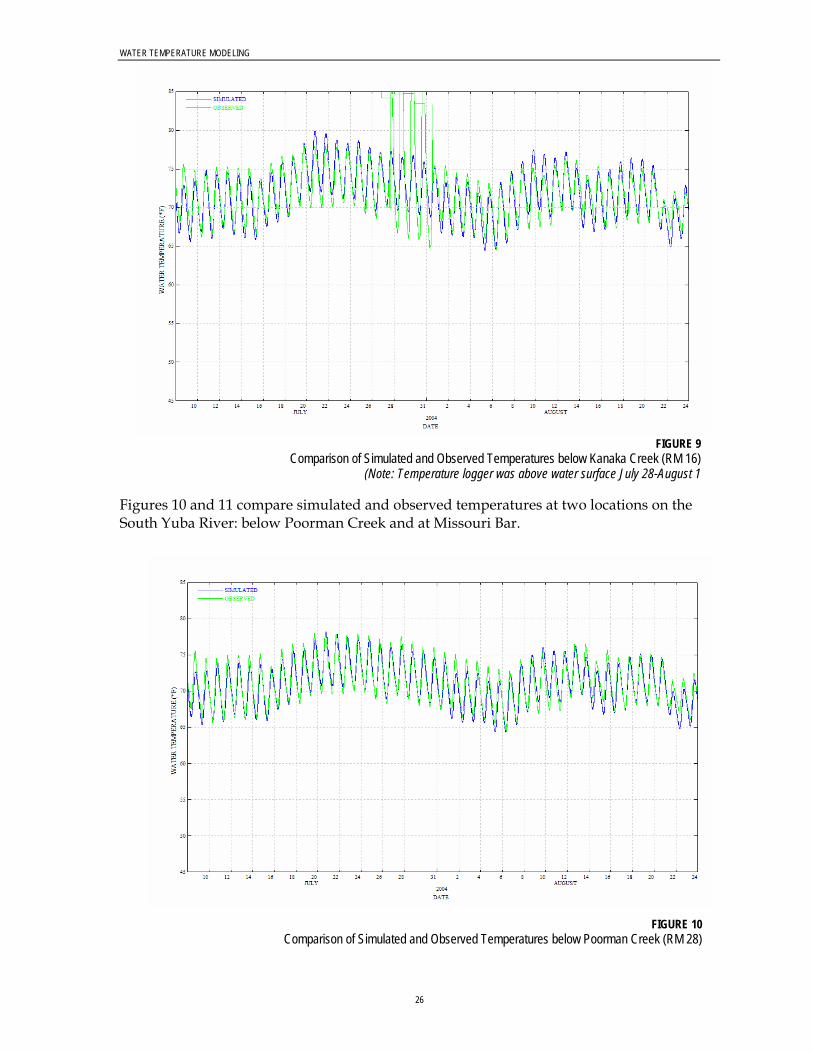
WATER TEMPERATURE MODELING
FIGURE 9 Comparison of Simulated and Observed Temperatures below Kanaka Creek (RM 16)
(Note: Temperature logger was above water surface July 28-August 1
Figures 10 and 11 compare simulated and observed temperatures at two locations on the South Yuba River: below Poorman Creek and at Missouri Bar.
FIGURE 10 Comparison of Simulated and Observed Temperatures below Poorman Creek (RM 28)
26
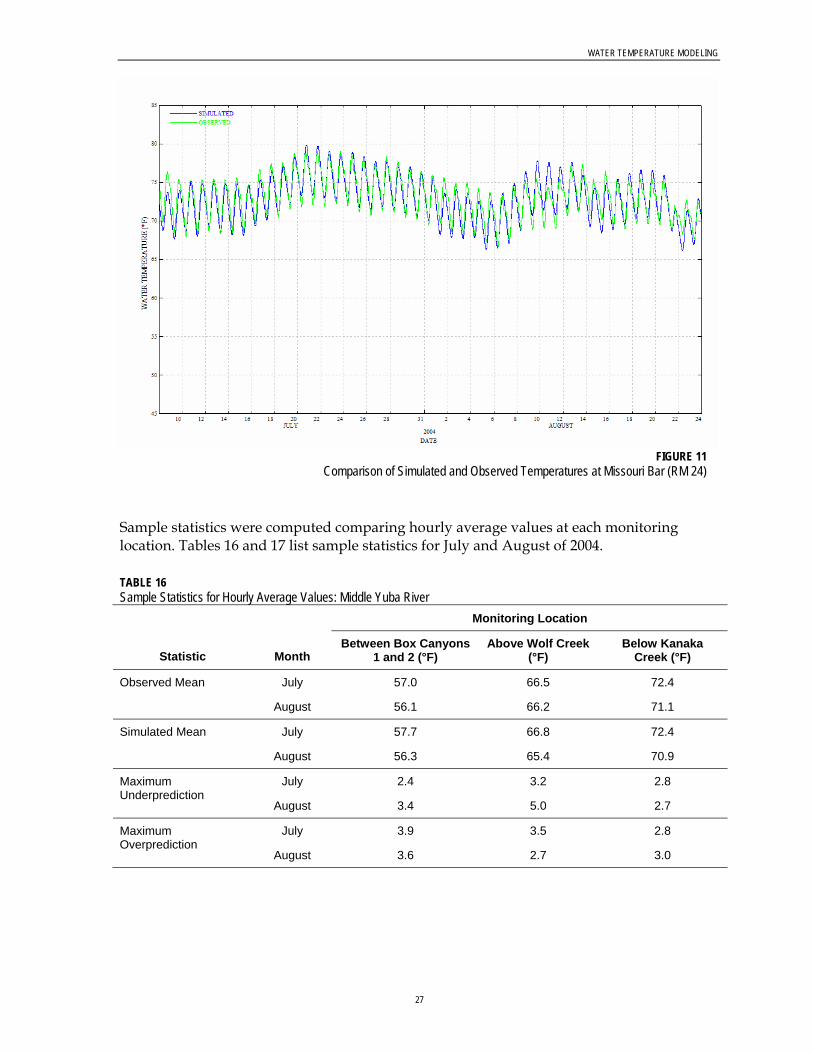
WATER TEMPERATURE MODELING
FIGURE 11 Comparison of Simulated and Observed Temperatures at Missouri Bar (RM 24)
Sample statistics were computed comparing hourly average values at each monitoring location. Tables 16 and 17 list sample statistics for July and August of 2004.
TABLE 16 Sample Statistics for Hourly Average Values: Middle Yuba River
Monitoring Location
Statistic Month Between Box Canyons
1 and 2 (°F) Above Wolf Creek
(°F) Below Kanaka
Creek (°F)
July 57.0 66.5 72.4 Observed Mean
August 56.1 66.2 71.1
July 57.7 66.8 72.4 Simulated Mean
August 56.3 65.4 70.9
July 2.4 3.2 2.8 Maximum Underprediction
August 3.4 5.0 2.7
July 3.9 3.5 2.8 Maximum Overprediction
August 3.6 2.7 3.0
27
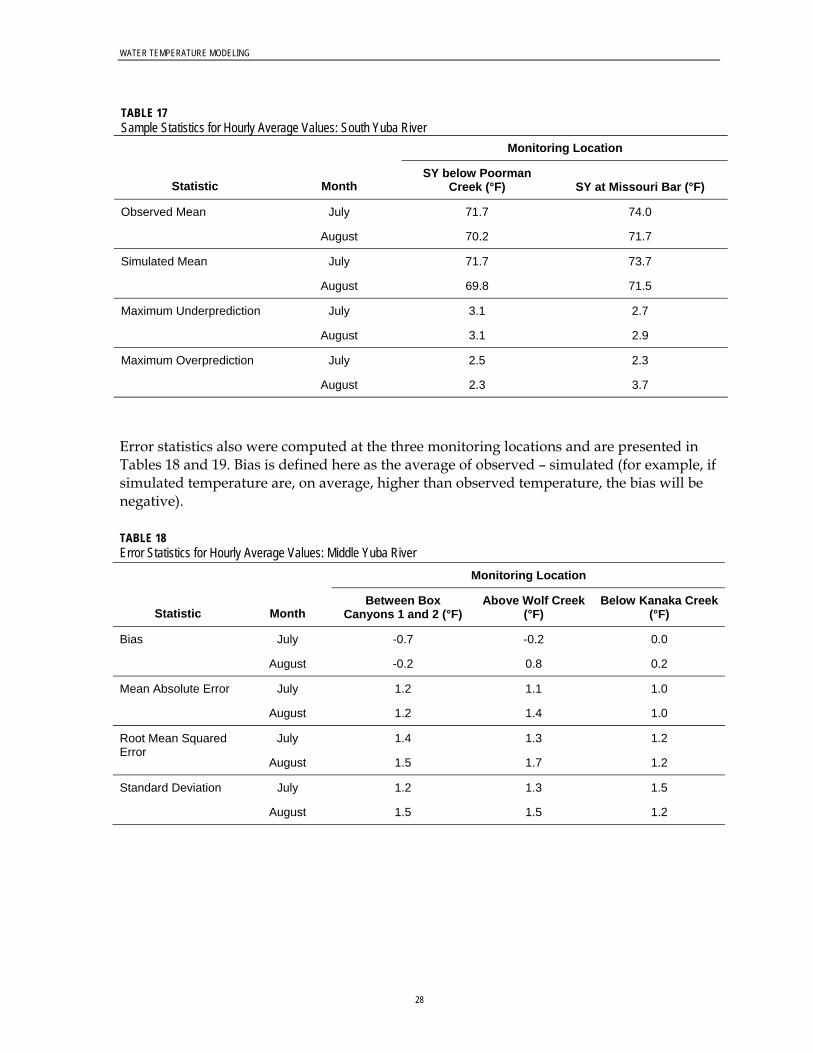
WATER TEMPERATURE MODELING
TABLE 17 Sample Statistics for Hourly Average Values: South Yuba River
Monitoring Location
Statistic Month SY below Poorman
Creek (°F) SY at Missouri Bar (°F)
Observed Mean July 71.7 74.0
August 70.2 71.7
Simulated Mean July 71.7 73.7
August 69.8 71.5
Maximum Underprediction July 3.1 2.7
August 3.1 2.9
Maximum Overprediction July 2.5 2.3
August 2.3 3.7
Error statistics also were computed at the three monitoring locations and are presented in Tables 18 and 19. Bias is defined here as the average of observed – simulated (for example, if simulated temperature are, on average, higher than observed temperature, the bias will be negative).
TABLE 18 Error Statistics for Hourly Average Values: Middle Yuba River
Monitoring Location
Statistic Month Between Box
Canyons 1 and 2 (°F) Above Wolf Creek
(°F) Below Kanaka Creek
(°F)
July -0.7 -0.2 0.0 Bias
August -0.2 0.8 0.2
July 1.2 1.1 1.0 Mean Absolute Error
August 1.2 1.4 1.0
July 1.4 1.3 1.2 Root Mean Squared Error
August 1.5 1.7 1.2
July 1.2 1.3 1.5 Standard Deviation
August 1.5 1.5 1.2
28
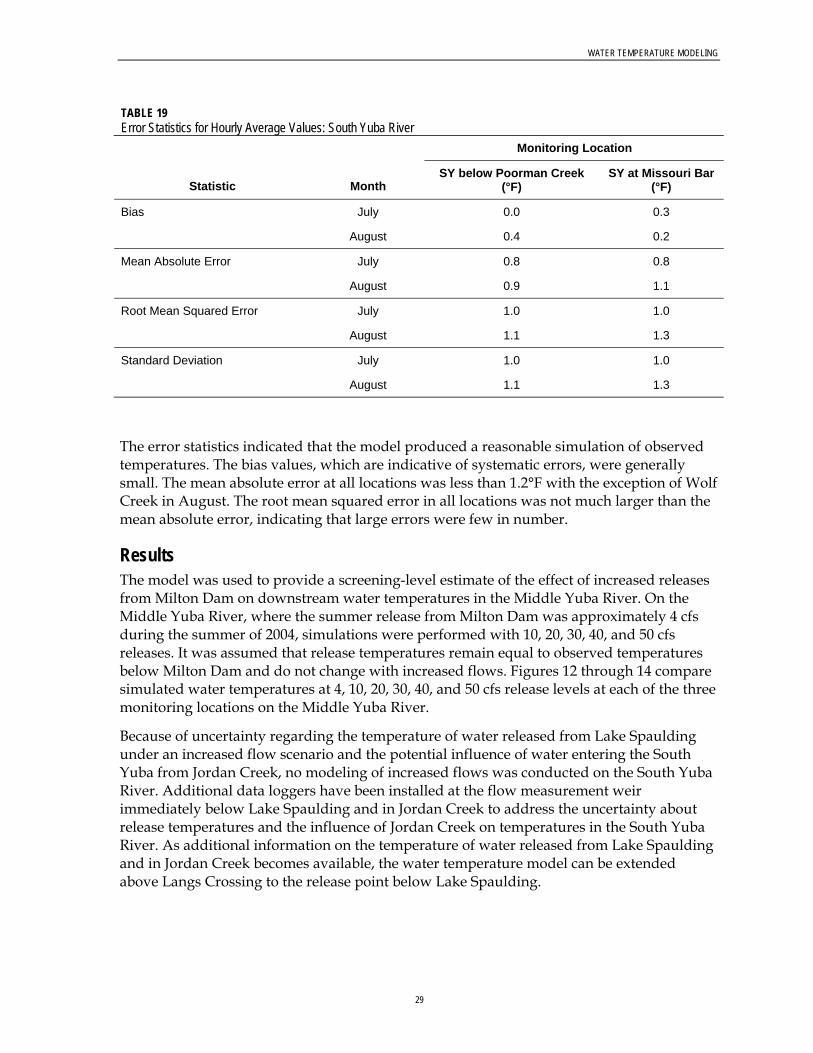
WATER TEMPERATURE MODELING
TABLE 19 Error Statistics for Hourly Average Values: South Yuba River
Monitoring Location
Statistic Month SY below Poorman Creek
(°F) SY at Missouri Bar
(°F)
July 0.0 0.3 Bias
August 0.4 0.2
July 0.8 0.8 Mean Absolute Error
August 0.9 1.1
July 1.0 1.0 Root Mean Squared Error
August 1.1 1.3
July 1.0 1.0 Standard Deviation
August 1.1 1.3
The error statistics indicated that the model produced a reasonable simulation of observed temperatures. The bias values, which are indicative of systematic errors, were generally small. The mean absolute error at all locations was less than 1.2°F with the exception of Wolf Creek in August. The root mean squared error in all locations was not much larger than the mean absolute error, indicating that large errors were few in number.
Results The model was used to provide a screening-level estimate of the effect of increased releases from Milton Dam on downstream water temperatures in the Middle Yuba River. On the Middle Yuba River, where the summer release from Milton Dam was approximately 4 cfs during the summer of 2004, simulations were performed with 10, 20, 30, 40, and 50 cfs releases. It was assumed that release temperatures remain equal to observed temperatures below Milton Dam and do not change with increased flows. Figures 12 through 14 compare simulated water temperatures at 4, 10, 20, 30, 40, and 50 cfs release levels at each of the three monitoring locations on the Middle Yuba River.
Because of uncertainty regarding the temperature of water released from Lake Spaulding under an increased flow scenario and the potential influence of water entering the South Yuba from Jordan Creek, no modeling of increased flows was conducted on the South Yuba River. Additional data loggers have been installed at the flow measurement weir immediately below Lake Spaulding and in Jordan Creek to address the uncertainty about release temperatures and the influence of Jordan Creek on temperatures in the South Yuba River. As additional information on the temperature of water released from Lake Spaulding and in Jordan Creek becomes available, the water temperature model can be extended above Langs Crossing to the release point below Lake Spaulding.
29
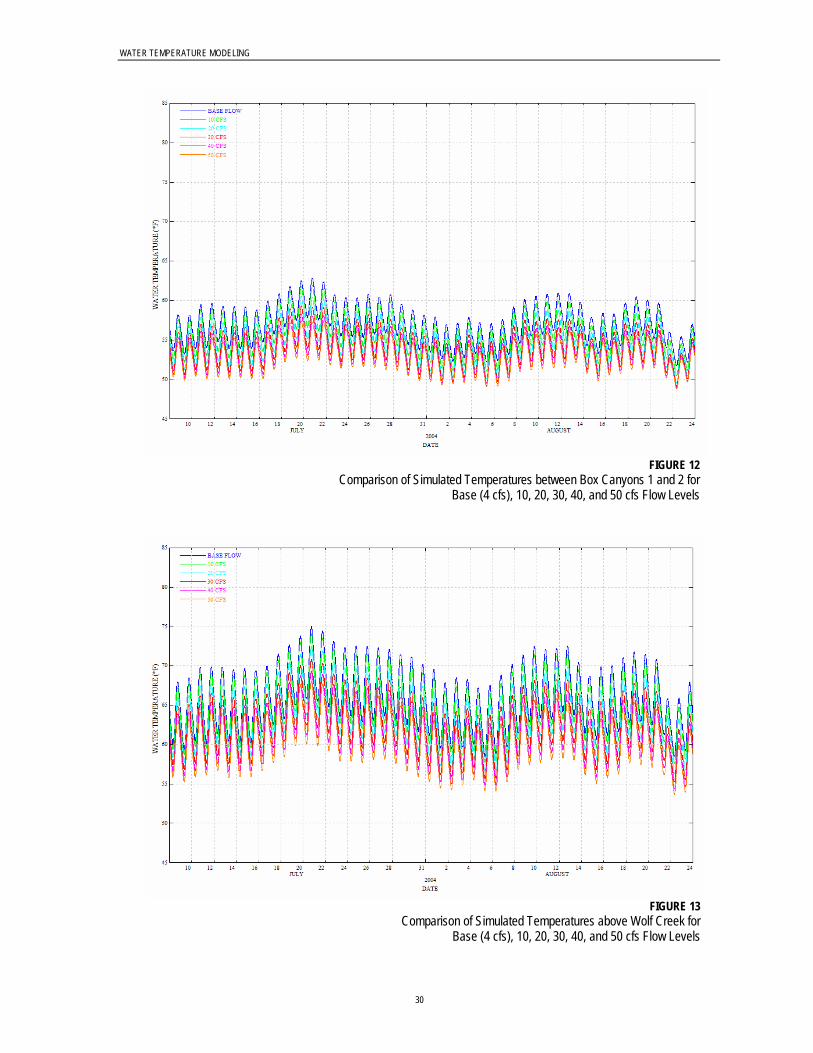
WATER TEMPERATURE MODELING
FIGURE 12
Comparison of Simulated Temperatures between Box Canyons 1 and 2 for Base (4 cfs), 10, 20, 30, 40, and 50 cfs Flow Levels
FIGURE 13
Comparison of Simulated Temperatures above Wolf Creek for Base (4 cfs), 10, 20, 30, 40, and 50 cfs Flow Levels
30
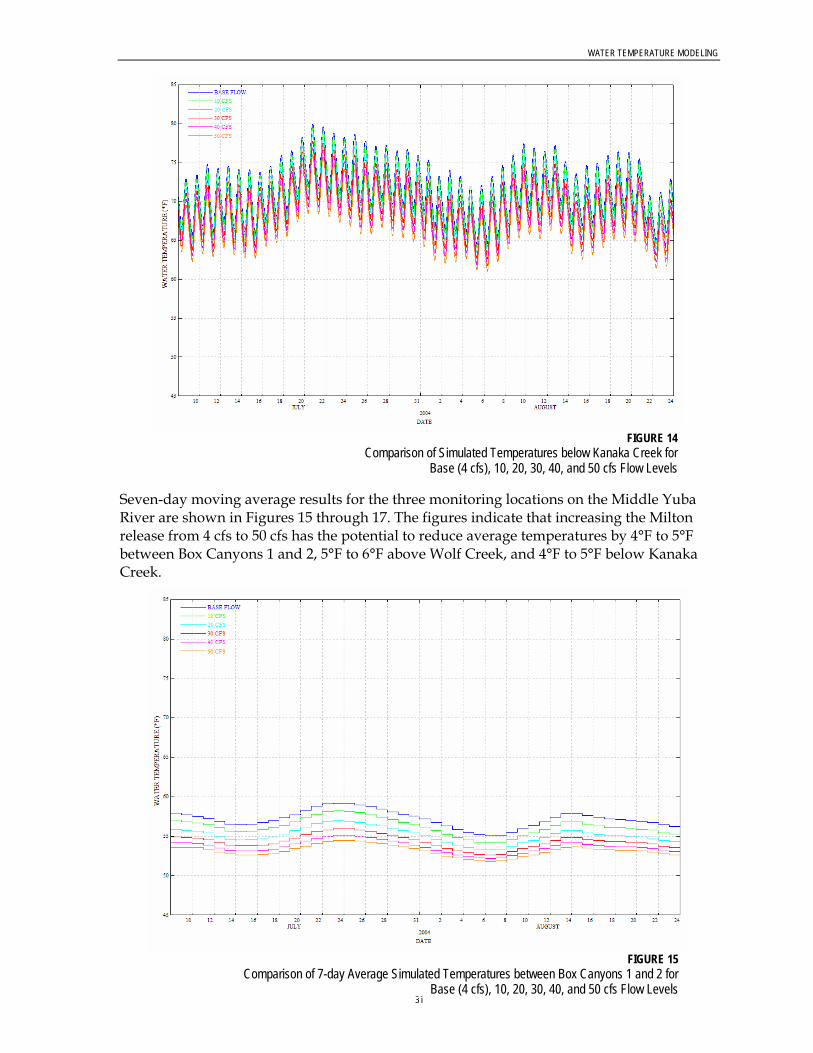
WATER TEMPERATURE MODELING
Seven-day moving average results for the three monitoring locations on the Middle Yuba River are shown in Figures 15 through 17. The figures indicate that increasing the Milton release from 4 cfs to 50 cfs has the potential to reduce average temperatures by 4°F to 5°F between Box Canyons 1 and 2, 5°F to 6°F above Wolf Creek, and 4°F to 5°F below Kanaka Creek.
FIGURE 14
Comparison of Simulated Temperatures below Kanaka Creek for Base (4 cfs), 10, 20, 30, 40, and 50 cfs Flow Levels
31
FIGURE 15 Comparison of 7-day Average Simulated Temperatures between Box Canyons 1 and 2 for
Base (4 cfs), 10, 20, 30, 40, and 50 cfs Flow Levels
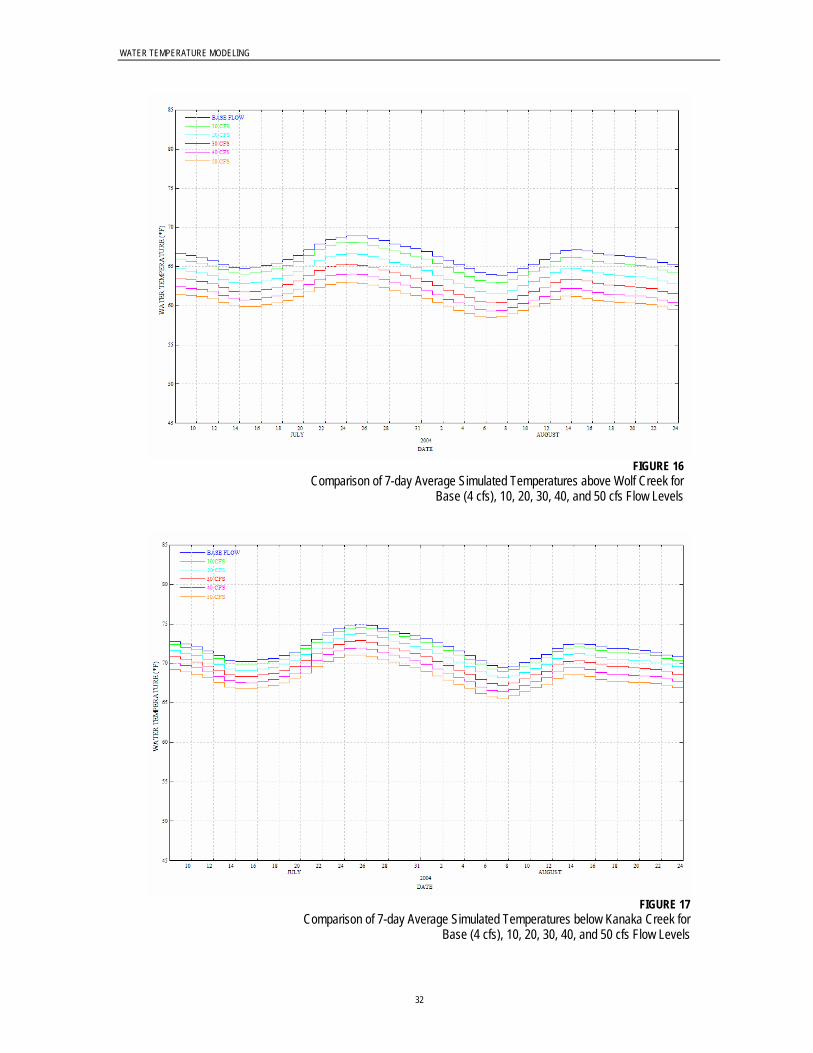
WATER TEMPERATURE MODELING
FIGURE 16
Comparison of 7-day Average Simulated Temperatures above Wolf Creek for Base (4 cfs), 10, 20, 30, 40, and 50 cfs Flow Levels
FIGURE 17
Comparison of 7-day Average Simulated Temperatures below Kanaka Creek for Base (4 cfs), 10, 20, 30, 40, and 50 cfs Flow Levels
32
APPENDIX B
Upper Yuba River Water Temperature Criteria for Chinook Salmon and Steelhead
Upper Yuba River Water Temperature Criteria for Chinook Salmon and Steelhead Technical Appendix
Prepared for CH2M HILL
2485 Natomas Park Drive, Suite 600 Sacramento, CA 95833
Prepared by Stillwater Sciences
2855 Telegraph Avenue, Suite 400 Berkeley, CA 94705
June 2006
Water Temperature Criteria Upper Yuba River Studies Program for Chinook Salmon and Steelhead
Table of Contents
1 Introduction and Background ................................................................................................1
2 Review of Water Temperature Tolerances of Chinook Salmon and Steelhead .................3
3 Water Temperature Indices, Thresholds, and Standards....................................................4
3.1 Indices ............................................................................................................................ 4 3.2 Thresholds...................................................................................................................... 5 3.3 Standards........................................................................................................................ 6
4 Water Temperature Standards for Determining Suitability for Chinook Salmon and Steelhead in the Upper Yuba River Basin .............................................................................8
5 Literature Cited .....................................................................................................................14
Tables Table 1. Summary of Chinook salmon temperature tolerance by life stage. .......................... 9 Table 2. Summary of steelhead temperature tolerance by life stage. .................................... 11 Table 3. Recommended temperatures for spring-run Chinook salmon and steelhead in the
Upper Yuba River basin. .................................................................................................... 13 Figures Figure 1. General biological effects of temperature on salmonids, as influenced by duration
of exposure (from Sullivan et al. 2000). ............................................................................... 2
Water Temperature Criteria Upper Yuba River Studies Program for Chinook Salmon and Steelhead
1 INTRODUCTION AND BACKGROUND
The Upper Yuba River Studies Program (UYRSP) seeks to determine the feasibility of introducing wild Chinook salmon and steelhead into the upper Yuba River upstream of Engelbright Dam. One objective of the UYRSP feasibility evaluation is to determine the suitability of aquatic habitat in the upper watershed and its ability to support salmon and steelhead. Water temperature is an important factor in that evaluation. Water temperature determines the spatial extent and seasonal timing of suitable habitat for Chinook salmon and steelhead in the upper Yuba River watershed, but it is only one of several factors evaluated in determining the biological feasibility of introducing these species into the upper watershed. The objective of this report is to describe the recommended water temperature criteria for use in evaluating habitat suitability in the upper Yuba River watershed and the technical basis for those recommendations. For the purposes of this evaluation, “suitability” refers to the environmental conditions that enable Chinook salmon and steelhead to persist (i.e., that support these species) without causing or contributing to stresses that would significantly reduce the probability of survival, reproduction, or the viability of gametes. Suitable water temperatures, then, are those which do not cause or contribute to acute or chronic stresses that would significantly reduce survival or reproductive success of these species in the upper Yuba River watershed. Most fish maintain body temperatures that closely match their environment (Moyle 1993). As a result, water temperature has a strong influence on almost every salmonid life history stage (Berman 1998), including metabolism, growth and development, timing of life history events such as adult migration and emergence from the redd, and susceptibility to disease (Groot et al. 1995). Exposure to high temperatures can have a variety of adverse effects on the physiology and physical performance of salmonids (Figure 1). Temperature can affect growth, behavior, competitive interactions, habitat requirements, and susceptibility to disease. These effects may vary depending on a fish’s prior thermal history (i.e., acclimation).
28 June 2006 Stillwater Sciences
1
Water Temperature Criteria Upper Yuba River Studies Program for Chinook Salmon and Steelhead
Figure 1. General biological effects of temperature on salmonids, as influenced by duration of exposure (from Sullivan et al. 2000).
Temperature effects on salmonids include both lethal and sublethal effects, depending on the magnitude and duration of exposure (Sullivan et al. 2000). Short-term (minutes to days) lethal effects are referred to as acute temperature effects, whereas long-term (weeks to months) thermal stresses are termed chronic effects (Sullivan et al. 2000). Numerous studies (e.g., Elliott 1976, Brett et al. 1982, Thomas et al. 1986) have shown that fish respond to water temperature with behavioral and physiological adjustments that depend on the magnitude and duration of exposure (Sullivan et al. 2000). Indirect effects of temperature can also influence growth and survival of salmonids. Elevated water temperature can increase the infectiousness and virulence of waterborne pathogens, and may also increase vulnerability to predation (Myrick and Cech 2001). Water temperature can effectively determine the amount and location of suitable habitat available for a given salmonid freshwater life stage. This effect varies seasonally, and is influenced by latitude, elevation, and other factors. Spatial variation in temperature-driven habitat suitability is closely tied to seasonal effects, which in California’s Mediterranean climate are typically associated with unsuitably high temperatures. Stream habitat that would otherwise support salmonids may be rendered unsuitable (i.e., too warm) for periods ranging from days to the entire summer season. In addition to temporal variations in habitat suitability, patterns of temperature-related habitat suitability may often be spatially patchy. This is typically due to cold water inputs such as springs, tributaries, or groundwater that provide cold water refugia. In watersheds such as the upper Yuba River watershed that experience wide fluctuations in annual air and water temperature, an understanding of stream temperature is a key requirement for assessing habitat suitability for salmonids.
28 June 2006 Stillwater Sciences
2
Water Temperature Criteria Upper Yuba River Studies Program for Chinook Salmon and Steelhead
2 REVIEW OF WATER TEMPERATURE TOLERANCES OF CHINOOK SALMON AND STEELHEAD
As a first step in identifying temperature tolerances for Chinook salmon and steelhead, we reviewed published literature and unpublished reports, focusing on temperature tolerances of spring-run Chinook salmon and winter steelhead in the Sacramento River basin. Temperature tolerances compiled from the literature are summarized by life stage for Chinook salmon in Table 1 and for steelhead in Table 2. Although it is unclear what ecotype (run) of each species might have existed historically in the Upper Yuba River basin and how the runs may have been spatially distributed, spring-run Chinook salmon and winter steelhead were chosen because (1) these ecotypes currently occur in the lower Yuba River and other Sacramento River tributaries, and (2) they are the species identified for possible introduction into the upper Yuba River watershed through the UYRSP. In preparing these summaries we reviewed pertinent information from laboratory studies and field investigations of water temperatures used by wild fish during each freshwater life stage. A considerable body of information is available on temperature tolerances, preferences, thresholds, and recommendations for Chinook salmon and steelhead. We report temperature thresholds or ranges as given in the literature we reviewed (Tables 1 and 2). Descriptors of the temperatures reported in the literature are many and varied, and include “optimum” (or “optimal”), “preferred,” “suitable,” “stressful,” “maximum,” “lethal” (often as the upper incipient lethal temperature, or UILT), and various observed averages and ranges. Very few studies use comparable evaluation methods or produce equivalent standards or recommendations. Even fewer studies have been conducted with a focus on Sacramento River spring-run Chinook salmon and winter steelhead. Therefore, while every attempt was made to preferentially report regionally- and population-specific data, general information was reported when it was the only information available. It is well known that thermal tolerance is dependent on acclimation temperature and exposure time (Myrick and Cech 2001). Fishes acclimated to higher temperatures generally have a higher temperature tolerance than fish acclimated to lower temperatures (Becker and Genoway 1979; Threader and Houston 1983, as cited in Myrick and Cech 2001). However, this information is not consistently reported in the literature sources we reviewed. For laboratory studies, we report acclimation temperatures if the information is available. Susceptibility to disease is another temperature-related variable that was rarely addressed in the literature we reviewed. Although elevated water temperature is known to be positively correlated with disease susceptibility of salmon and steelhead, the information summarized in Tables 1 and 2 does not specifically consider this effect. However, some studies for which lethal temperature effects are reported herein may include disease as a mortality component.
28 June 2006 Stillwater Sciences
3
Water Temperature Criteria Upper Yuba River Studies Program for Chinook Salmon and Steelhead
3 WATER TEMPERATURE INDICES, THRESHOLDS, AND STANDARDS
For the purposes of our temperature analyses in the Upper Yuba River watershed we define an index as a means of summarizing temperature data (measured or modeled) over specific time periods of interest (i.e., a life stage). We define a threshold as the value of an index that temperature must remain below to avoid specified (i.e., adverse) impacts. Standards are defined as a combination of an index and threshold(s), which are used to determine the suitability of observed (or modeled) temperatures within identified river reaches.
3.1 Indices
Commonly encountered temperature indices are summarized below. Daily average temperature is the average temperature for a single 24-hour period based on regular and periodic measurements. Daily maximum temperature is the maximum instantaneous temperature in a single 24-hour period based on regular and periodic measurements. Seasonal average temperature is the average temperature for the entirety of a designated seasonal period. An alternative time period of concern (e.g., the duration of a fish life stage) may often be used in place of season. Annual maximum temperature is the maximum daily temperature that occurs each year. The annual maximum temperature index is typically used to develop temperature standards to protect against short-term temperature increases that can result in direct mortality. Weekly average temperature, or 7-day mean of the daily average temperatures (7DMAVG), is the moving (running) 7-day average of the daily average temperatures. This index reflects the average temperatures that an organism experiences during a 7-day period, but may not account for short-term maxima that may approach or exceed lethal limits. The 7DMAVG is commonly confused with MWAT, which uses the maximum value of the 7DMAVG over a defined time period to set an upper protective limit (i.e., standard). Use of the MWAT standard is described in more detail in Section 3.3 below. Weekly average maximum temperature, or 7-day mean of the daily maximum temperatures (7DMMax), is the moving (running) 7-day average of the daily maximum temperatures. This index reflects a stream’s maximum temperatures without undue bias by the temperature of a single day (USEPA 2003). This index, however, due to its emphasis on maximum temperatures that often occur only for short periods, may not accurately characterize chronic temperature conditions that affect growth. Therefore, the 7DMMax is best suited for use as part of a temperature standard that protects against acute (i.e., lethal) effects.
28 June 2006 Stillwater Sciences
4
Water Temperature Criteria Upper Yuba River Studies Program for Chinook Salmon and Steelhead
3.2 Thresholds
Based on a review of available information (Tables 1 and 2), we developed recommended water temperature criteria (thresholds) for each life stage of Chinook salmon and steelhead in the upper Yuba River watershed (Table 3). The review-based criteria listed in Table 3 are in most cases composites of multiple values reported by various sources. As such, the criteria were derived using various methods, including laboratory experiments and observations of temperatures experienced by wild fish in their natural environment. We attempted to focus our review on wild fish of Sacramento River basin origin, and whenever possible derived our recommendations accordingly. Recommended ranges, and the resultant threshold values, were initially chosen using a weight-of-evidence approach with the final selection based on review and consensus among the UYRSP Habitat Team members. In cases where multiple studies reported similar or identical values as defining a suitability category (e.g., optimal) for a given life stage, we used this value as the recommended threshold. If no single value was reported by more than one source, the threshold value was chosen from the study deemed to be most applicable from a regional, ecological, and methodological perspective. For example, temperature tolerances or preferences from investigations of wild spring-run Chinook salmon from the Sacramento River basin were chosen over values reported for Chinook salmon from hatchery stock, other major drainage basins, or other runs. Whenever possible, preference was also given to the use of temperature values reported by foundational laboratory or field studies rather than literature reviews. The expected timing of each life stage in the Yuba River watershed is also included in Table 3 to indicate the duration for which recommended temperature thresholds are applicable. Life stage timing was determined by iterative review and consensus among the UYRSP Habitat Team members, based on information initially compiled from published and unpublished sources for each species, run, and life stage in nearby (Sacramento River basin) streams that support these species and runs. Based on the available information, we define three thermal zones, which correspond to expected physiological responses of each species and life stage: Optimal, Suboptimal, and Chronic to Acute Stress (Table 3). The use of these thermal zones helps ameliorate the unrealistic limitations of a single, rigid temperature threshold around which the suitability of habitat drastically changes (e.g., “suitable” versus “unsuitable” in response to a small temperature change), and reflects the knowledge that physiological response occurs along a continuum of broader temperature ranges, each of which can generally be characterized by a related set of physiological responses. The three thermal zones are described below. Optimal: At optimal temperatures, feeding and growth occur, with growth generally dependent on food availability. Temperatures in this zone are within the range reported in the literature to include the physiological optimum, but do not account for potential confounding factors such as disease or habitat variability. No lethal or sublethal temperature effects occur in this zone. Suboptimal: Exposure to suboptimal temperatures does not cause direct mortality, but may result in a higher probability of diminished success of a particular life stage due to sublethal effects (e.g., reduced fitness, viability, competitive ability or growth, and increased susceptibility to disease) (Sullivan et al. 2000). This probability increases with increasing duration of exposure, particularly to temperatures at the high end of the range. Conversely, the probability of success is increased, up to a point, with increased acclimation time at temperatures in this zone.
28 June 2006 Stillwater Sciences
5
Water Temperature Criteria Upper Yuba River Studies Program for Chinook Salmon and Steelhead
Temperatures at the high end of this range may result in behavioral adjustments (i.e., behavioral thermoregulation) that are determined by the magnitude and duration of temperature exposure. Chronic to Acute Stress: In contrast to the Suboptimal zone, in which the likelihood of stress depends on which end of the range is encountered by a fish, all temperatures in the Chronic to Acute Stress zone are expected to result in stress. Exposure to temperatures at the low end of this range typically leads to sublethal (i.e., chronic) effects similar to those that may occur near the upper end of the Suboptimal zone. At higher temperatures in the Chronic to Acute Stress zone, exposure can result in acute (i.e., lethal) effects. Exposure to temperatures in this zone would require behavioral thermoregulation to avoid sublethal or lethal effects. Although acclimation to temperatures at the low end of this range can reduce the probability of sublethal or lethal effects, this range includes the chronic upper lethal limit (approximately 25°C [77°F] for Central Valley Chinook salmon and steelhead [Myrick and Cech 2001]), at which prolonged exposure results in mortality. The water temperatures identified as the upper limits of the Optimal range are intended to be used as threshold values that will avoid potential sublethal temperature effects such as reduced fitness, reduced gamete viability, reduced growth, and increased susceptibility to disease. The upper limits of the Suboptimal range are intended to be used as threshold values that will avoid chronic or acute temperature stresses that would be expected to severely reduce success of a particular life stage, potentially including mortality. Although it is recognized that the temperature zone (i.e., threshold) approach has inherent drawbacks, especially given the often undistinguishable effects at the upper and lower ends of adjacent zones, this approach was chosen by the UYRSP Habitat Team as the most appropriate means of identifying biologically meaningful temperature ranges that could be used to identify suitable habitat for Chinook salmon and steelhead in the upper Yuba River watershed.
3.3 Standards
Temperature standards can be categorized according to their objectives. Short-term temperature standards are generally developed to protect against acute effects (i.e., mortality), whereas long-term standards address chronic, sublethal effects such as reduced growth or reduced gamete viability. The most commonly used temperature thresholds used in setting short-term standards are the incipient lethal temperature (ILT): upper incipient lethal temperature (UILT) and lower incipient lethal temperature (LILT) (e.g., Armour 1991, Myrick and Cech 2001). The UILT and LILT can also be referred to as the short-term maximum survival temperature (STM) (Armour 1991). For temperatures above the UILT, sometimes referred to as the “zone of resistance” (Figure 1) (Armour 1991, Sullivan et al. 2000), mortality is a function of exposure time. Therefore, standards for maximum temperatures should address the duration of exposure. Perhaps the most widely used and commonly accepted long-term water temperature standard is the maximum weekly average temperature, or MWAT. The use of MWAT was first proposed by the National Academy of Sciences (NAS and NAE) in 1972 (NAS and NAE 1973) as a long-term standard for preventing chronic sublethal effects for a variety of fish species. MWAT is currently a convenient way to compare the results of researchers, and is the threshold most commonly used for establishing temperature standards for salmonids (e.g., Armour 1991, NMFS and USFWS 1997, Sullivan et al. 2000). The objective of the MWAT is to provide an upper
28 June 2006 Stillwater Sciences
6
Water Temperature Criteria Upper Yuba River Studies Program for Chinook Salmon and Steelhead
temperature threshold that is protective of a particular salmonid life stage, typically during the summer season. The scientific rationale for using MWAT as a temperature standard is based on experimental observations that fish can tolerate moderate temperature fluctuations as long as the ILT is not exceeded for prolonged periods (Sullivan et al. 2000). The use of MWAT also assumes that optimal temperatures are not necessary or realistic at all times to sustain viable fish populations (NAS and NAE 1973), and thus allows some environmental variability around any daily threshold value. MWAT is calculated as the maximum 7-day running average of the daily mean temperatures for the period of record or a time period of concern (e.g., a salmonid life stage) (Brungs and Jones 1977). The date of the 7-day averaging period may be any day in the period, but is typically the midpoint or end of the period. This threshold reflects the average temperatures that an organism experiences over the course of any 7-day period during the time period of concern, but may not account for short-term maxima that may approach or exceed lethal limits. Although fish can generally tolerate short-term exposure to critically high temperatures, repeated or prolonged exposure may negatively affect growth, fitness, or survival.
28 June 2006 Stillwater Sciences
7
Water Temperature Criteria Upper Yuba River Studies Program for Chinook Salmon and Steelhead
28 June 2006 Stillwater Sciences
8
4 WATER TEMPERATURE STANDARDS FOR DETERMINING SUITABILITY FOR CHINOOK SALMON AND STEELHEAD IN THE UPPER YUBA RIVER BASIN
Daily and seasonal variability in stream water temperatures, and changing responses at different stages of development, make it difficult to define water temperature standards that are fully protective of salmonids. It is even more difficult to identify temperature standards that protect against sublethal effects on salmonids, such as reduced growth (which is dependent on food availability). Although setting maximum temperature standards is crucial to protect against potential lethal temperature effects, the results of laboratory-based studies may not apply to site-specific situations in the natural environment. The temperatures at which fish in streams become susceptible to sublethal or lethal effects can be influenced by local genetic or physiological adaptations, food availability, acclimation temperatures, behavioral adaptations, or access to cool water refugia. The 7DMAVG is the recommended temperature index and MWAT is the water temperature standard we recommend for evaluation of water temperature data to determine the quantity, distribution, and seasonal availability of suitable habitat for Chinook salmon and steelhead in the upper Yuba River watershed. Comparison of water temperature data collected in the field and derived from water temperature modeling (7DMAVG) with the thresholds (Table 3) for each species and life stage will help determine the potential for the Middle Yuba and South Yuba rivers to support these species. If the maximum 7DMAVG (MWAT) water temperature exceeds the identified thresholds at any time during the time period a particular life stage would occupy the river, then it is assumed that water temperatures would have an adverse effect on that particular life stage. Exceeding an Optimal threshold would not necessarily indicate unsuitability, but would imply that there could be water temperature effects that could adversely affect the success of Chinook salmon or steelhead in the upper Yuba River watershed. If a Suboptimal upper threshold is exceeded, then it is assumed that water temperatures would have chronic or acute effects which would impair potential survival of Chinook salmon or steelhead given current habitat conditions. The water temperature recommendations in this report are intended to be used as one of several factors in the decision-making process to determine the feasibility of introducing Chinook salmon and steelhead into the upper Yuba River watershed. The information and recommendations presented here will primarily be useful in identifying the spatial extent and seasonal timing of suitable habitat for these species in the upper watershed. These recommendations, in and of themselves, are not sufficient to provide the basis for determining the feasibility of introduction. Completion of the studies identified in the UYRSP study plan, including additional evaluation of biological and habitat issues, water supply and hydropower impacts, flood risk, water quality, sediment transport, and socioeconomics will be required to ultimately answer the remaining questions regarding the feasibility of introducing these fish to the upper Yuba River watershed.
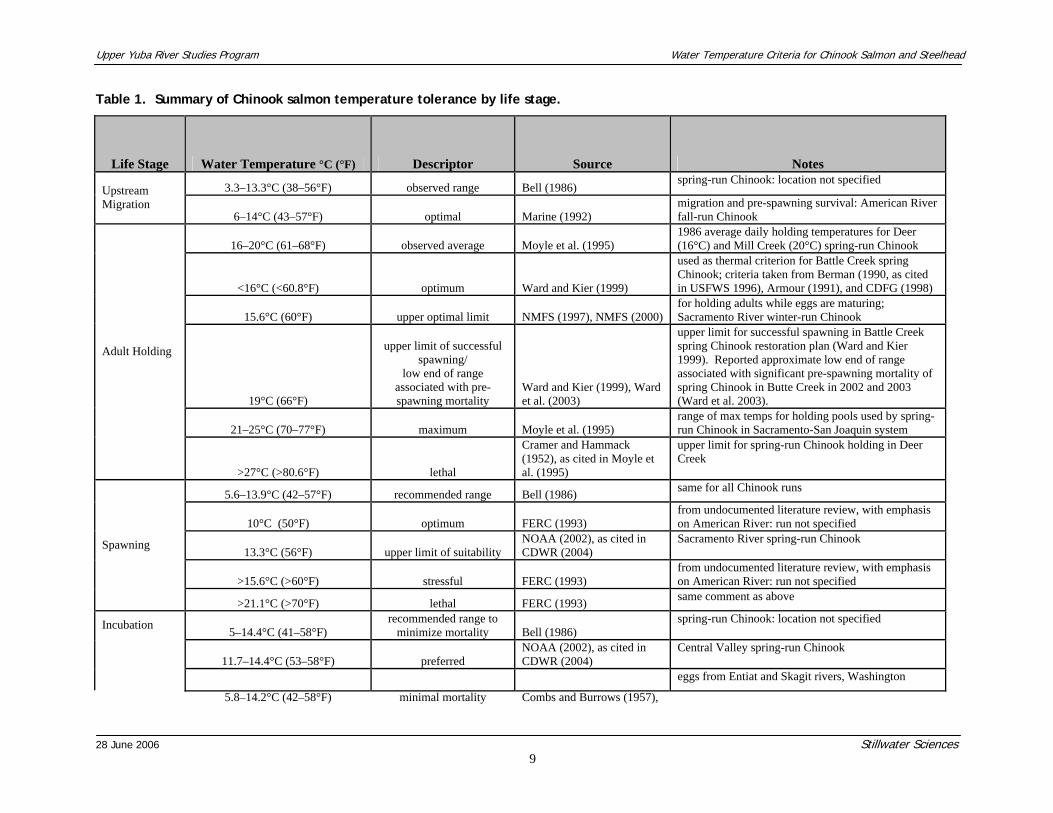
Upper Yuba River Studies Program Water Temperature Criteria for Chinook Salmon and Steelhead
Table 1. Summary of Chinook salmon temperature tolerance by life stage.
Life Stage Water Temperature °C (°F) Descriptor Source Notes
3.3–13.3°C (38–56°F) observed range Bell (1986) spring-run Chinook: location not specified
Upstream Migration
6–14°C (43–57°F) optimal Marine (1992) migration and pre-spawning survival: American River fall-run Chinook
16–20°C (61–68°F) observed average Moyle et al. (1995) 1986 average daily holding temperatures for Deer (16°C) and Mill Creek (20°C) spring-run Chinook
<16°C (<60.8°F) optimum Ward and Kier (1999)
used as thermal criterion for Battle Creek spring Chinook; criteria taken from Berman (1990, as cited in USFWS 1996), Armour (1991), and CDFG (1998)
15.6°C (60°F) upper optimal limit NMFS (1997), NMFS (2000) for holding adults while eggs are maturing; Sacramento River winter-run Chinook
19°C (66°F)
upper limit of successful spawning/
low end of range associated with pre-spawning mortality
Ward and Kier (1999), Ward et al. (2003)
upper limit for successful spawning in Battle Creek spring Chinook restoration plan (Ward and Kier 1999). Reported approximate low end of range associated with significant pre-spawning mortality of spring Chinook in Butte Creek in 2002 and 2003 (Ward et al. 2003).
21–25°C (70–77°F) maximum Moyle et al. (1995) range of max temps for holding pools used by spring-run Chinook in Sacramento-San Joaquin system
Adult Holding
>27°C (>80.6°F) lethal
Cramer and Hammack (1952), as cited in Moyle et al. (1995)
upper limit for spring-run Chinook holding in Deer Creek
5.6–13.9°C (42–57°F) recommended range Bell (1986) same for all Chinook runs
10°C (50°F) optimum FERC (1993) from undocumented literature review, with emphasis on American River: run not specified
13.3°C (56°F) upper limit of suitability NOAA (2002), as cited in CDWR (2004)
Sacramento River spring-run Chinook
>15.6°C (>60°F) stressful FERC (1993) from undocumented literature review, with emphasis on American River: run not specified
Spawning
>21.1°C (>70°F) lethal FERC (1993) same comment as above
5–14.4°C (41–58°F) recommended range to
minimize mortality Bell (1986) spring-run Chinook: location not specified
11.7–14.4°C (53–58°F) preferred NOAA (2002), as cited in CDWR (2004)
Central Valley spring-run Chinook
Incubation
5.8–14.2°C (42–58°F) minimal mortality Combs and Burrows (1957),
eggs from Entiat and Skagit rivers, Washington
28 June 2006 Stillwater Sciences
9
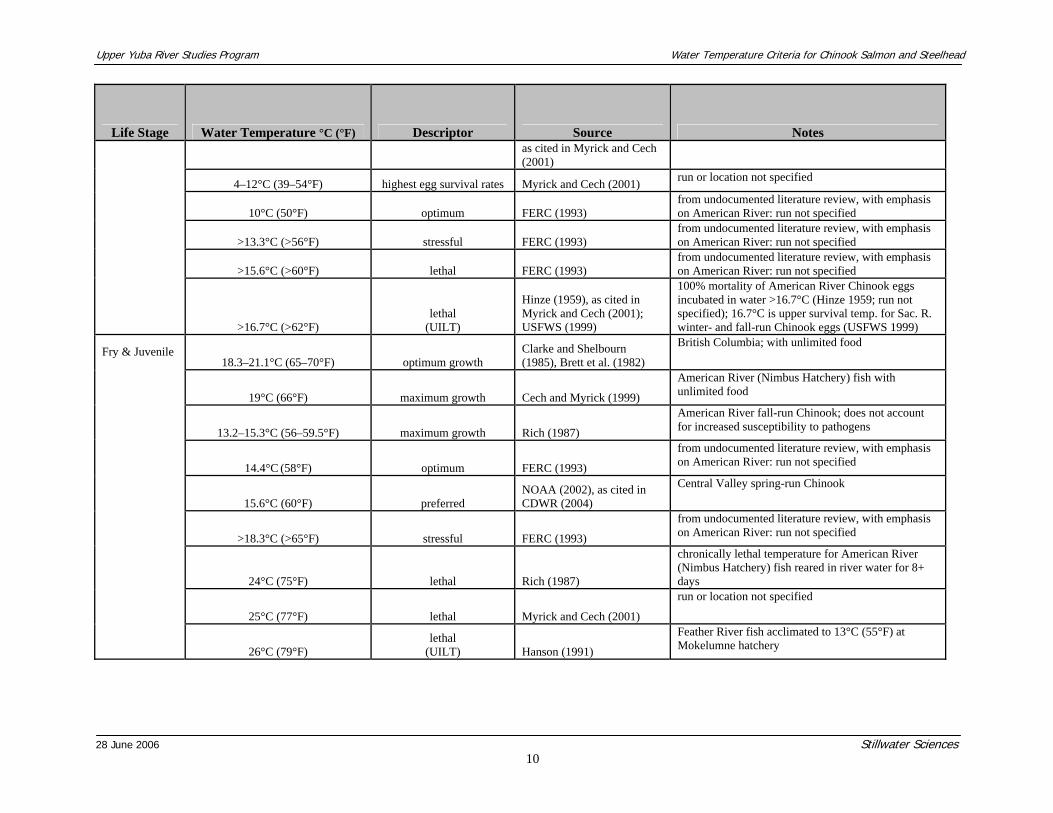
Upper Yuba River Studies Program Water Temperature Criteria for Chinook Salmon and Steelhead
28 June 2006 Stillwater Sciences
10
Life Stage Water Temperature °C (°F) Descriptor Source Notes as cited in Myrick and Cech (2001)
4–12°C (39–54°F) highest egg survival rates Myrick and Cech (2001) run or location not specified
10°C (50°F) optimum FERC (1993) from undocumented literature review, with emphasis on American River: run not specified
>13.3°C (>56°F) stressful FERC (1993) from undocumented literature review, with emphasis on American River: run not specified
>15.6°C (>60°F) lethal FERC (1993) from undocumented literature review, with emphasis on American River: run not specified
>16.7°C (>62°F) lethal
(UILT)
Hinze (1959), as cited in Myrick and Cech (2001); USFWS (1999)
100% mortality of American River Chinook eggs incubated in water >16.7°C (Hinze 1959; run not specified); 16.7°C is upper survival temp. for Sac. R. winter- and fall-run Chinook eggs (USFWS 1999)
18.3–21.1°C (65–70°F) optimum growth Clarke and Shelbourn (1985), Brett et al. (1982)
British Columbia; with unlimited food
19°C (66°F) maximum growth Cech and Myrick (1999)
American River (Nimbus Hatchery) fish with unlimited food
13.2–15.3°C (56–59.5°F) maximum growth Rich (1987)
American River fall-run Chinook; does not account for increased susceptibility to pathogens
14.4°C (58°F) optimum FERC (1993)
from undocumented literature review, with emphasis on American River: run not specified
15.6°C (60°F) preferred NOAA (2002), as cited in CDWR (2004)
Central Valley spring-run Chinook
>18.3°C (>65°F) stressful FERC (1993)
from undocumented literature review, with emphasis on American River: run not specified
24°C (75°F) lethal Rich (1987)
chronically lethal temperature for American River (Nimbus Hatchery) fish reared in river water for 8+ days
25°C (77°F) lethal Myrick and Cech (2001)
run or location not specified
Fry & Juvenile
26°C (79°F) lethal
(UILT) Hanson (1991)
Feather River fish acclimated to 13°C (55°F) at Mokelumne hatchery
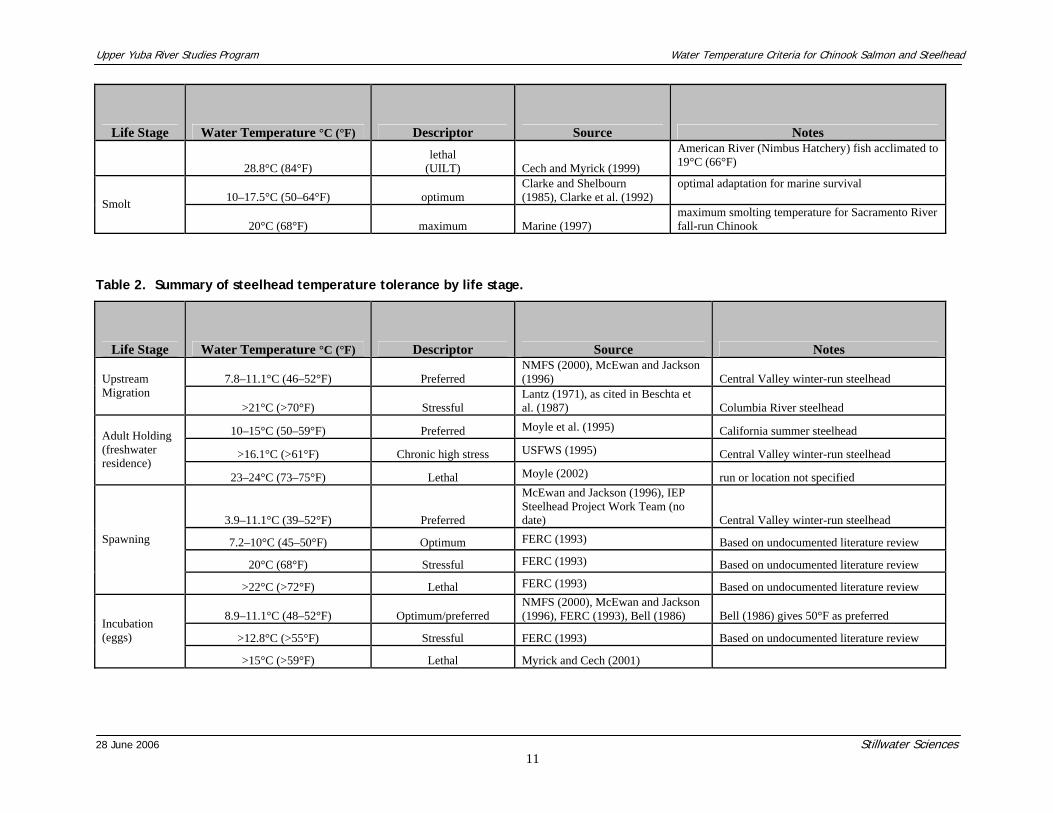
Upper Yuba River Studies Program Water Temperature Criteria for Chinook Salmon and Steelhead
28 June 2006 Stillwater Sciences
11
Life Stage Water Temperature °C (°F) Descriptor Source Notes
28.8°C (84°F) lethal
(UILT) Cech and Myrick (1999)
American River (Nimbus Hatchery) fish acclimated to 19°C (66°F)
10–17.5°C (50–64°F) optimum Clarke and Shelbourn (1985), Clarke et al. (1992)
optimal adaptation for marine survival
Smolt
20°C (68°F) maximum Marine (1997) maximum smolting temperature for Sacramento River fall-run Chinook
Table 2. Summary of steelhead temperature tolerance by life stage.
Life Stage Water Temperature °C (°F) Descriptor Source Notes
7.8–11.1°C (46–52°F) Preferred NMFS (2000), McEwan and Jackson (1996) Central Valley winter-run steelhead Upstream
Migration >21°C (>70°F) Stressful
Lantz (1971), as cited in Beschta et al. (1987) Columbia River steelhead
10–15°C (50–59°F) Preferred Moyle et al. (1995) California summer steelhead
>16.1°C (>61°F) Chronic high stress USFWS (1995) Central Valley winter-run steelhead Adult Holding (freshwater residence)
23–24°C (73–75°F) Lethal Moyle (2002) run or location not specified
3.9–11.1°C (39–52°F) Preferred
McEwan and Jackson (1996), IEP Steelhead Project Work Team (no date) Central Valley winter-run steelhead
7.2–10°C (45–50°F) Optimum FERC (1993) Based on undocumented literature review
20°C (68°F) Stressful FERC (1993) Based on undocumented literature review
Spawning
>22°C (>72°F) Lethal FERC (1993) Based on undocumented literature review
8.9–11.1°C (48–52°F) Optimum/preferred NMFS (2000), McEwan and Jackson (1996), FERC (1993), Bell (1986) Bell (1986) gives 50°F as preferred
>12.8°C (>55°F) Stressful FERC (1993) Based on undocumented literature review Incubation (eggs)
>15°C (>59°F) Lethal Myrick and Cech (2001)
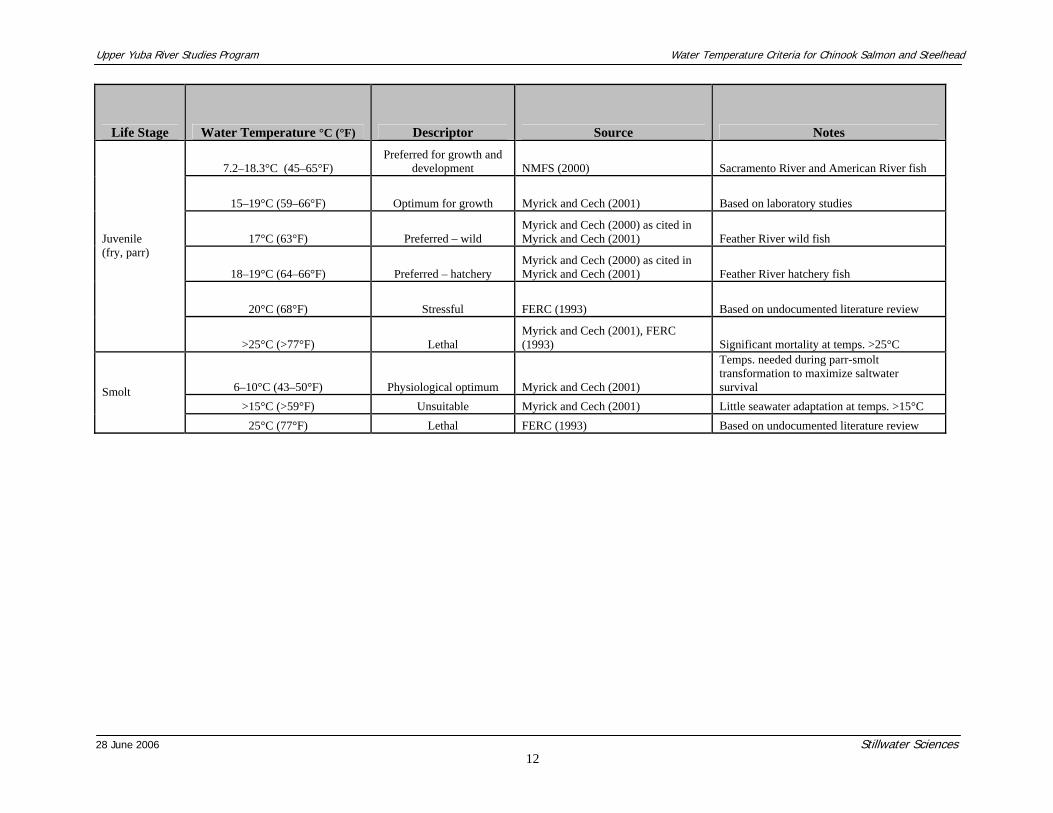
Upper Yuba River Studies Program Water Temperature Criteria for Chinook Salmon and Steelhead
28 June 2006 Stillwater Sciences
12
Life Stage Water Temperature °C (°F) Descriptor Source Notes
7.2–18.3°C (45–65°F) Preferred for growth and
development NMFS (2000) Sacramento River and American River fish
15–19°C (59–66°F) Optimum for growth Myrick and Cech (2001) Based on laboratory studies
17°C (63°F) Preferred – wild Myrick and Cech (2000) as cited in Myrick and Cech (2001) Feather River wild fish
18–19°C (64–66°F) Preferred – hatchery Myrick and Cech (2000) as cited in Myrick and Cech (2001) Feather River hatchery fish
20°C (68°F) Stressful FERC (1993) Based on undocumented literature review
Juvenile (fry, parr)
>25°C (>77°F) Lethal Myrick and Cech (2001), FERC (1993) Significant mortality at temps. >25°C
6–10°C (43–50°F) Physiological optimum Myrick and Cech (2001)
Temps. needed during parr-smolt transformation to maximize saltwater survival
>15°C (>59°F) Unsuitable Myrick and Cech (2001) Little seawater adaptation at temps. >15°C Smolt
25°C (77°F) Lethal FERC (1993) Based on undocumented literature review
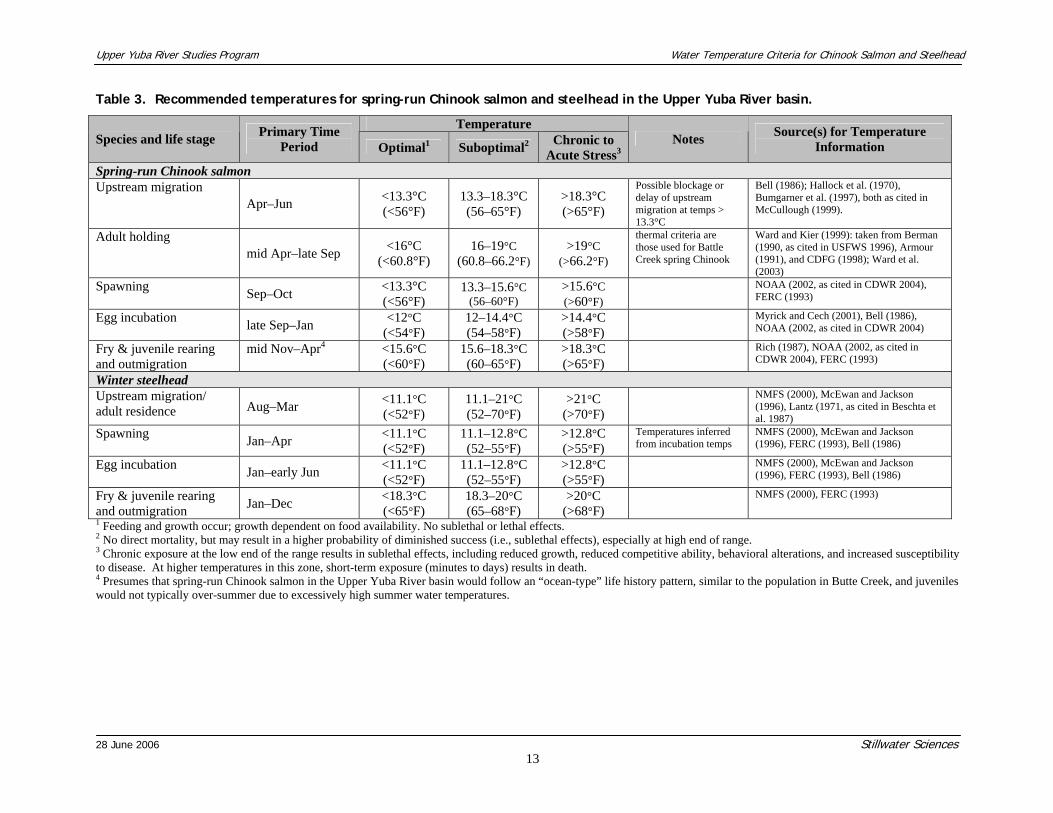
Upper Yuba River Studies Program Water Temperature Criteria for Chinook Salmon and Steelhead
28 June 2006 Stillwater Sciences
13
Table 3. Recommended temperatures for spring-run Chinook salmon and steelhead in the Upper Yuba River basin.
Temperature Species and life stage Primary Time
Period Optimal1 Suboptimal2 Chronic to Acute Stress3
Notes Source(s) for Temperature Information
Spring-run Chinook salmon Upstream migration
Apr–Jun <13.3°C (<56°F)
13.3–18.3°C (56–65°F)
>18.3°C (>65°F)
Possible blockage or delay of upstream migration at temps > 13.3°C
Bell (1986); Hallock et al. (1970), Bumgarner et al. (1997), both as cited in McCullough (1999).
Adult holding mid Apr–late Sep <16°C
(<60.8°F) 16–19°C
(60.8–66.2°F) >19°C
(>66.2°F)
thermal criteria are those used for Battle Creek spring Chinook
Ward and Kier (1999): taken from Berman (1990, as cited in USFWS 1996), Armour (1991), and CDFG (1998); Ward et al. (2003)
Spawning Sep–Oct <13.3°C (<56°F)
13.3–15.6°C (56–60°F)
>15.6°C (>60°F)
NOAA (2002, as cited in CDWR 2004), FERC (1993)
Egg incubation late Sep–Jan <12°C (<54°F)
12–14.4°C (54–58°F)
>14.4°C (>58°F)
Myrick and Cech (2001), Bell (1986), NOAA (2002, as cited in CDWR 2004)
Fry & juvenile rearing and outmigration
mid Nov–Apr4
<15.6°C (<60°F)
15.6–18.3°C (60–65°F)
>18.3°C (>65°F)
Rich (1987), NOAA (2002, as cited in CDWR 2004), FERC (1993)
Winter steelhead Upstream migration/ adult residence Aug–Mar <11.1°C
(<52°F) 11.1–21°C (52–70°F)
>21°C (>70°F)
NMFS (2000), McEwan and Jackson (1996), Lantz (1971, as cited in Beschta et al. 1987)
Spawning Jan–Apr <11.1°C (<52°F)
11.1–12.8°C (52–55°F)
>12.8°C (>55°F)
Temperatures inferred from incubation temps
NMFS (2000), McEwan and Jackson (1996), FERC (1993), Bell (1986)
Egg incubation Jan–early Jun <11.1°C (<52°F)
11.1–12.8°C (52–55°F)
>12.8°C (>55°F)
NMFS (2000), McEwan and Jackson (1996), FERC (1993), Bell (1986)
Fry & juvenile rearing and outmigration Jan–Dec <18.3°C
(<65°F) 18.3–20°C (65–68°F)
>20°C (>68°F)
NMFS (2000), FERC (1993)
1 Feeding and growth occur; growth dependent on food availability. No sublethal or lethal effects. 2 No direct mortality, but may result in a higher probability of diminished success (i.e., sublethal effects), especially at high end of range. 3 Chronic exposure at the low end of the range results in sublethal effects, including reduced growth, reduced competitive ability, behavioral alterations, and increased susceptibility to disease. At higher temperatures in this zone, short-term exposure (minutes to days) results in death. 4 Presumes that spring-run Chinook salmon in the Upper Yuba River basin would follow an “ocean-type” life history pattern, similar to the population in Butte Creek, and juveniles would not typically over-summer due to excessively high summer water temperatures.
Water Temperature Criteria Upper Yuba River Studies Program for Chinook Salmon and Steelhead
5 LITERATURE CITED
Armour, C. L. 1991. Guidance for evaluating and recommending temperature regimes to protect fish. Instream Flow Information Paper 28. Biological Report. 90 (22). U. S. Fish and Wildlife Service, National Ecology Research Center, Fort Collins, Colorado.
Bailey, E. D. 1954. Time pattern of 1953-54 migration of salmon and steelhead into the upper Sacramento River. Unpublished report. California Department of Fish and Game.
Becker, C. D., and R. G. Genoway. 1979. Evaluation of the critical thermal maximum for determining thermal tolerance of freshwater fish. Environmental Biology of Fishes 4:245-256.
Bell, M. C., editor. 1986. Fisheries handbook of engineering requirements and biological criteria. Report No. NTIS AD/A167-877. Fish Passage Development and Evaluation Program, U. S. Army Corps of Engineers, North Pacific Division, Portland, Oregon.
Berman, C. H. 1990. The effect of elevated holding temperatures on adult spring chinook salmon reproductive success. Master's thesis. University of Washington, Seattle.
Berman, C. 1998. Oregon temperature standard review. U. S. Environmental Protection Agency, Region 10, Seattle, Washington.
Beschta, R. L., R. E. Bilby, G. W. Brown, L. B. Holtby, and T. D. Hofstra. 1987. Stream temperature and aquatic habitat: fisheries and forestry interactions. Pages 191-232 in E. O. Salo, and T. W. Cundy, editors. Streamside management: forestry and fishery interactions. Contribution No. 57. College of Forest Resources, University of Washington, Seattle.
Brett, J. R., W. C. Clarke, and J. E. Shelbourn. 1982. Experiments on thermal requirements for growth and food conversion efficiency of juvenile chinook salmon Oncorhynchus tshawytscha. Canadian Technical Report of Fisheries and Aquatic Sciences. Report 1127. Department of Fisheries and Oceans, Fisheries Research Branch, Pacific Biological Station, Nanaimo, British Columbia.
Brungs, W. A., and B. R. Jones. 1977. Temperature criteria for freshwater fish: protocol and procedures. EPA-600/3-77-061. U. S. Environmental Protection Agency, Environmental Research Laboratory, Duluth, Minnesota.
Bumgarner, J., G. Mendel, D. Milks, L. Ross, M. Varney, and J. Dedloff. 1997. Tucannon River spring chinook hatchery evaluation. 1996 Annual report. Washington Department of Fish and Wildlife Hatcheries Program Assessment and Development Division. Report #H97-07. Produced for US Fish and Wildlife Service, Cooperative Agreement 14-48-0001-96539.
CDFG (California Department of Fish and Game). 1998. A status review of the spring-run Chinook salmon (Oncorhynchus tshawytscha) in the Sacramento River drainage. CDFG, Sacramento, Candidate Species Status Report 98-01.
CDWR (California Department of Water Resources). 2004. Matrix of life history and habitat requirements for Feather River fish species: Chinook salmon. CDWR, Sacramento, Oroville Facilities Relicensing, FERC Project No. 2100.
28 June 2006 Stillwater Sciences 14
Water Temperature Criteria Upper Yuba River Studies Program for Chinook Salmon and Steelhead
Clarke, W. C., and J. E. Shelbourn. 1985. Growth and development of seawater adaptability by juvenile fall chinook salmon (Oncorhynchus tshawytscha) in relation to temperature. Aquaculture 45:21-31.
Clarke, W. C., R. E. Withler, and J. E. Shelbourn. 1992. Genetic control of juvenile life history pattern in chinook salmon (Oncorhynchus tshawytscha). Canadian Journal of Fisheries and Aquatic Sciences 49:2300-2306.
Elliott, J. M. 1976. The energetics of feeding, metabolism and growth of brown trout (Salmo trutta L.) in relation to body weight, water temperature and ration size. Journal of Animal Ecology 45:923-948.
FERC (Federal Energy Regulatory Commission). 1993. Proposed modifications to the Lower Mokelumne River Project, California: FERC Project No. 2916-004 (Licensee: East Bay Municipal Utility District). FERC, Division of Project Compliance and Administration, Washington, D. C., Final Environmental Impact Statement.
Groot, C., L. Margolis, and W. C. Clarke, editors. 1995. Physiological ecology of Pacific salmon. University of British Columbia Press, Vancouver.
Hallock, R. J., W. F. Van Woert, and L. Shapovalov. 1961. An evaluation of stocking hatchery-reared steelhead rainbow trout (Salmo gairdnerii gairdnerii) in the Sacramento River system. Fish Bulletin. 114. California Department of Fish and Game.
Hallock, R.J., R.F. Elwell, and D.H. Fry. 1970. Migrations of adult kind salmon Oncorhynchus tshawytscha in the San Joaquin Delta as demonstrated by the use of sonic tags. California Dept. Fish Game Fish Bull. 151. 92 p.
Lantz, R. L. 1971. Influence of water temperature on fish survival, growth, and behavior. Pages 182-193 in J. T. Krygier, and J. D. Hall, editors. Forest land uses and stream environment: proceedings of a symposium. Oregon State University, Corvallis.
Marine, K. R. 1997. Effects of elevated water temperature on some aspects of the physiological and ecological performance of juvenile chinook salmon (Oncorhynchus tshawytscha): implications for management of California's Central Valley salmon stocks. Master's thesis. University of California, Davis.
McCullough, D. A. 1999. A review and synthesis of effects of alterations to the water temperature regime on freshwater life stages of salmonids, with special reference to chinook salmon. Columbia River Inter-Tribal Fish Commission, Portland, Oregon.
McEwan, D., and T. A. Jackson. 1996. Steelhead restoration and management plan for California. California Department of Fish and Game, Inland Fisheries Division, Sacramento, Management Report.
Mills, T. J., and F. Fisher. 1994. Central Valley anadromous sport fish annual run-size, harvest, and population estimates, 1967 through 1991. Inland Fisheries Technical Report. California Department of Fish and Game.
Moyle, P. B. 1993. Fish: an enthusiast's guide. University of California Press, Berkeley.
28 June 2006 Stillwater Sciences 15
Water Temperature Criteria Upper Yuba River Studies Program for Chinook Salmon and Steelhead
Moyle, P. B., R. M. Yoshiyama, J. E. Williams, and E. D. Wikramanayake. 1995. Fish species of special concern in California. Prepared by Department of Wildlife and Fisheries Biology, University of California, Davis for California Department of Fish and Game, Inland Fisheries Division, Rancho Cordova, Final Report.
Myrick, C. A., and J. J. Cech Jr. 2001. Temperature effects on Chinook salmon and steelhead: a review focusing on California's Central Valley populations. Prepared for the Bay-Delta Modeling Forum. http://www.sfei.org/modelingforum/.
NAS and NAE (National Academy of Sciences and National Academy of Engineering). 1973. Heat and temperature. Pages 151-171 and 205-207 in Water quality criteria 1972. A report of the Committee on Water Quality Criteria. Publication No. EPA-R3-73-033. U. S. Environmental Protection Agency, Washington, D. C.
NMFS and USFWS (National Marine Fisheries Service and U. S. Fish and Wildlife Service). 1997. Aquatic properly functioning condition matrix. NMFS, Southwest Region, Northern California Area Office, Santa Rosa and USFWS, Arcata, California.
NMFS (National Marine Fisheries Service). 2000. Biological opinion for the operation of the federal Central Valley Project and the California State Water Project from December 1, 1999 through March 31, 2000. NMFS, Southwest Region.
NOAA (National Oceanic and Atmospheric Administration). 2002. Biological Opinion on Interim Operations of the CVP and SWP Between April 2000 and March 2004 on Federally Listed Threatened Central Valley Spring-Run Chinook Salmon and Threatened Central Valley Steelhead in Accordance With Section 7 of the ESA.
Reynolds, F. L., T. J. Mills, R. Benthin, and A. Low. 1993. Restoring Central Valley streams: a plan for action. California Department of Fish and Game, Inland Fisheries Division, Sacramento.
Rich, A. A. 1987. Water temperatures which optimize growth and survival of the anadromous fishery resources of the lower American River. Prepared by A. A. Rich and Associates, San Rafael for McDonough, Holland, and Allen, Sacramento, California, Report.
Sullivan, K., D. J. Martin, R. D. Cardwell, J. E. Toll, and S. Duke. 2000. An analysis of the effects of temperature on salmonids of the Pacific Northwest with implications for selecting temperature criteria. Sustainable Ecosystems Institute, Portland, Oregon, Draft report.
Thomas, R. E., J. A. Gharrett, M. G. Carls, S. D. Rice, A. Moles, and S. Korn. 1986. Effects of fluctuating temperature on mortality, stress, and energy reserves of juvenile coho salmon. Transactions of the American Fisheries Society 115:52-59.
Threader, R. W., and A. H. Houston. 1983. Heat tolerance and resistance in juvenile rainbow trout acclimated to diurnally cycling temperatures. Comparative Biochemistry and Physiology 75A:153-155.
USEPA (U.S. Environmental Protection Agency). 2003. EPA Region 10 Guidance for Pacific Northwest state and tribal temperature water quality standards. EPA 910-B-03-002. Region 10 Office of Water, Seattle, Washington.
28 June 2006 Stillwater Sciences 16
Water Temperature Criteria Upper Yuba River Studies Program for Chinook Salmon and Steelhead
28 June 2006 Stillwater Sciences 17
USFWS (U. S. Fish and Wildlife Service). 1995. Working paper on restoration needs: habitat restoration actions to double natural production of anadromous fish in the Central Valley of California. Volume 2. May 9, 1995. Prepared for USFWS under the direction of the Anadromous Fish Restoration Program Core Group, Stockton, California.
USFWS (U. S. Fish and Wildlife Service). 1996. Draft temperature suitability criteria for three species of salmon: Trinity River. USFWS, Arcata, California.
Ward, M. B. and W. M. Kier. 1999. Battle Creek salmon and steelhead restoration plan. Prepared for the Battle Creek Working Group by Kier Associates, Sausalito, California. January.
Ward, P. D., T. R. McReynolds, and C. E. Garman. 2003. Butte Creek spring-run Chinook salmon, Oncorhynchus tshawytscha pre-spawn mortality evaluation. California Department of Fish and Game Inland Fisheries Administrative Report No. 2004-5.
APPENDIX C
Assessment of Adult Anadromous Salmonid Migration Barriers and Holding Habitats in the
Upper Yuba River
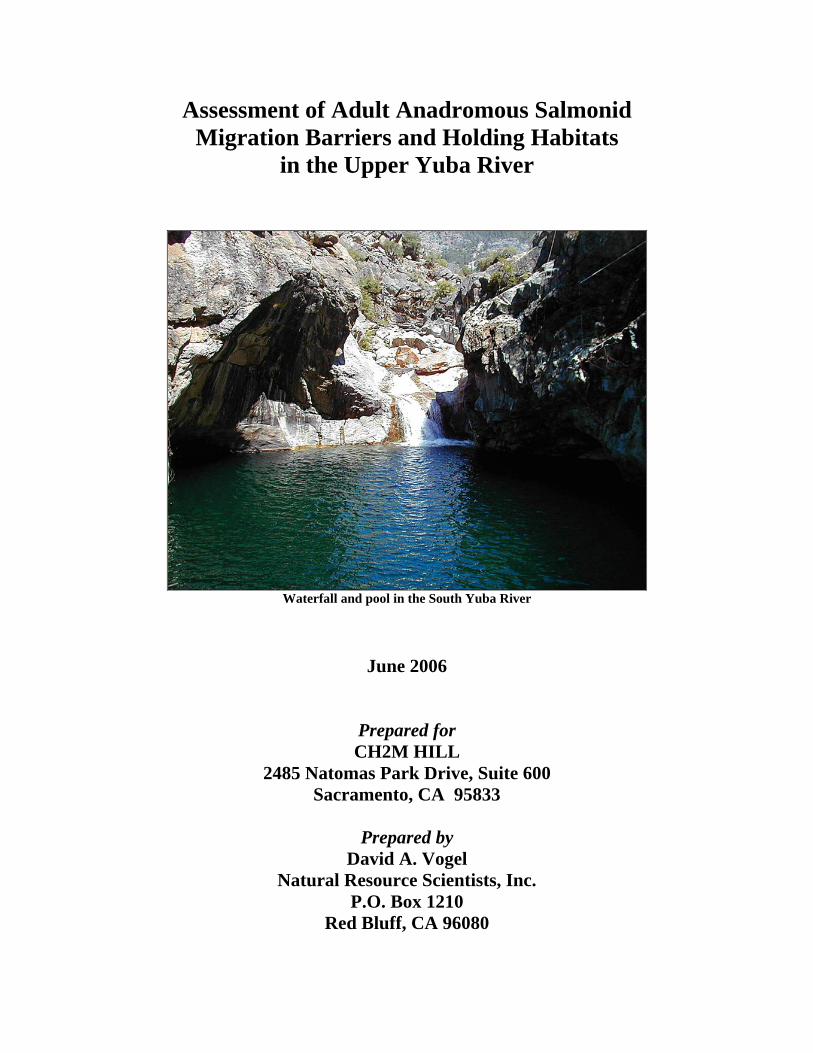
Assessment of Adult Anadromous Salmonid Migration Barriers and Holding Habitats
in the Upper Yuba River
Waterfall and pool in the South Yuba River
June 2006
Prepared for CH2M HILL
2485 Natomas Park Drive, Suite 600 Sacramento, CA 95833
Prepared by
David A. Vogel Natural Resource Scientists, Inc.
P.O. Box 1210 Red Bluff, CA 96080
TABLE OF CONTENTS
1.0 Introduction............................................................................................................. 1 2.0 Characteristics of Chinook Salmon and Steelhead Migration Barriers and Oversummering Holding Habitat........................................................................................ 1
2.1. Migration Barriers............................................................................................... 1 2.2 Holding Habitat................................................................................................... 4
2.2.1 Pool Depth .................................................................................................. 5 2.2.2 Cover........................................................................................................... 5 2.2.3 Spawning Gravels ....................................................................................... 6 2.2.4 Water Quality (Temperature and Dissolved Oxygen) ................................ 7
3.0 Assessment Methods............................................................................................... 8 3.1 Migration Barriers................................................................................................... 8
3.1.1 Flow Analysis ........................................................................................... 11 3.2 Adult Salmon Holding Habitats............................................................................ 12
4.0 Assessment Findings............................................................................................. 13 4.1 Migration Barriers............................................................................................. 13
4.1.1 Salmon Migration Timing and Seasonal Hydrology ................................ 17 4.2 Holding Habitat................................................................................................. 20
5.0 Literature Cited ..................................................................................................... 22
Assessment of Upper Yuba River Adult Salmonid Migration Barriers and Holding Habitats Page i
LIST OF FIGURES Figure 1. Leaping abilities of steelhead and Chinook salmon as related to the coefficient
of fish condition .......................................................................................................... 2 Figure 2. Some parameters that affect fish passage success at potential migration barriers
..................................................................................................................................... 3 Figure 3. Flow chart for analysis of fish passage barriers ................................................. 4 Figure 4. Example characteristics defining good spring-run Chinook salmon holding
habitat.......................................................................................................................... 6 Figure 5. Picture obtained by screen capture from the October 2002 aerial videography. 8 Figure 8. Member of the habitat assessment team measuring the height of a falls on the
South Yuba River...................................................................................................... 10 Figure 9. Member of the habitat assessment team examining the characteristics of a
plunge pool at a falls on the South Yuba River ........................................................ 10 Figure 10. Member of the habitat assessment team swimming to a barrier site when
stream-side access was not possible ......................................................................... 11 Figure 11. Member of the habitat assessment team snorkeling in a 17-foot deep pool in
the South Yuba River.................................................Error! Bookmark not defined. Figure 12. Potential barriers and holding pools in the upper Yuba River ....................... 15 Figure 13. Number of potential barriers to spring-run Chinook salmon migration on the
Middle and South Yuba rivers .................................................................................. 16 Figure 14. Falls on the Middle Yuba River (RM 0.4) estimated to be a low-flow barrier
because of a combination of height, channel configuration, shallow plunge pool, and conditions upstream of the falls ................................................................................ 16
Figure 15. Counts of adult spring-run Chinook salmon migrating upstream in Mill Creek, 1984 and 1986, and Deer Creek, 1986...................................................................... 17
Figure 16. Run timing for spring-run Chinook salmon as based on a composite of historical data from Mill and Deer creeks, Feather River, and the upper Sacramento River prior to the construction of Shasta Dam.......................................................... 18
Figure 17. Average daily flow (cfs) in the Middle Yuba River upstream of Our House Dam during wet (W), above-normal (AB), below-normal (BN), dry (D), and critically dry (C) hydrologic conditions.................................................................... 19
Figure 18. Average daily flow (cfs) in the South Yuba River at Jones Bar during wet (W), above-normal (AB), below-normal (BN), dry (D), and critically dry (C) hydrologic conditions................................................................................................ 20
Figure 19. Number of pools possessing spring-run Chinook salmon holding habitat characteristics (not accounting for water temperature) in the Middle and South Yuba rivers ......................................................................................................................... 21
Assessment of Upper Yuba Salmon and Steelhead Migration Barriers and Holding Habitats Page ii

Assessment of Upper Yuba Salmon and Steelhead Migration Barriers and Holding Habitats Page iii
LIST OF TABLES Table 1. Incomplete counts of spring-run Chinook in Deer Creek, 1940 – 1948............ 18 Appendix Table 1. Potential pools and barriers for spring-run Chinook salmon and
steelhead in the Middle Yuba River.......................................................................... 25 Appendix Table 2. Potential pools and barriers for spring-run Chinook salmon and
steelhead in the South Yuba River............................................................................ 31
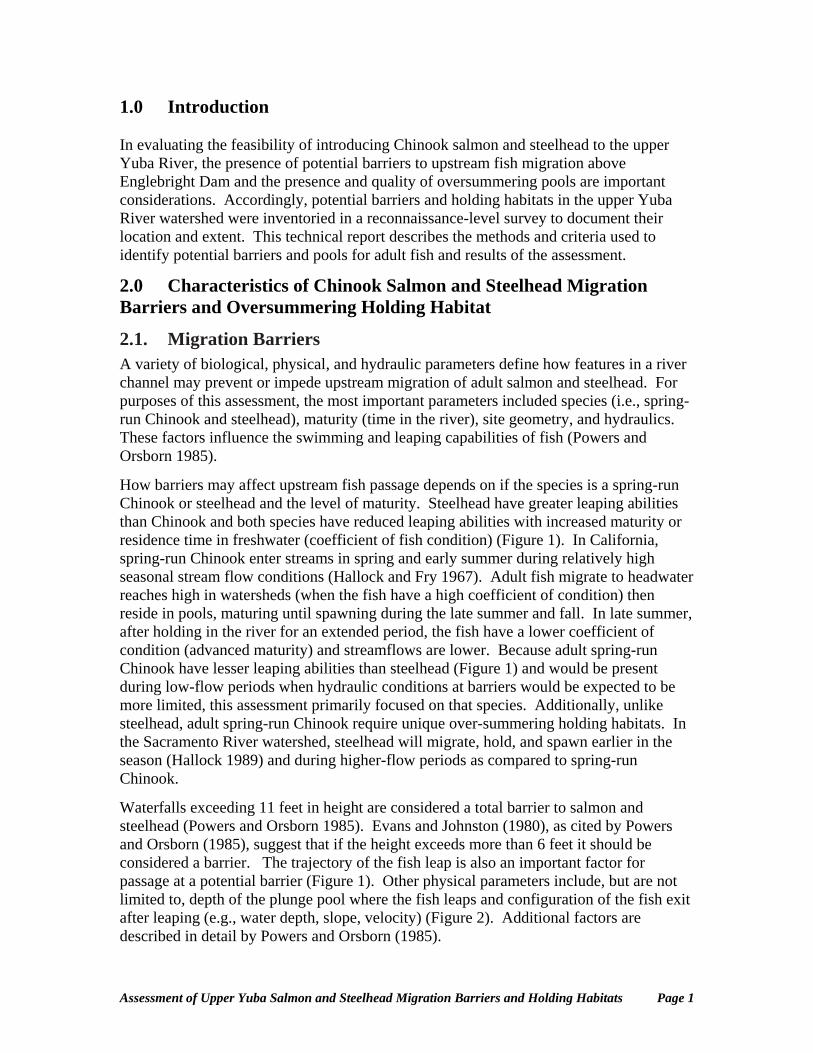
1.0 Introduction In evaluating the feasibility of introducing Chinook salmon and steelhead to the upper Yuba River, the presence of potential barriers to upstream fish migration above Englebright Dam and the presence and quality of oversummering pools are important considerations. Accordingly, potential barriers and holding habitats in the upper Yuba River watershed were inventoried in a reconnaissance-level survey to document their location and extent. This technical report describes the methods and criteria used to identify potential barriers and pools for adult fish and results of the assessment.
2.0 Characteristics of Chinook Salmon and Steelhead Migration Barriers and Oversummering Holding Habitat
2.1. Migration Barriers A variety of biological, physical, and hydraulic parameters define how features in a river channel may prevent or impede upstream migration of adult salmon and steelhead. For purposes of this assessment, the most important parameters included species (i.e., spring-run Chinook and steelhead), maturity (time in the river), site geometry, and hydraulics. These factors influence the swimming and leaping capabilities of fish (Powers and Orsborn 1985).
How barriers may affect upstream fish passage depends on if the species is a spring-run Chinook or steelhead and the level of maturity. Steelhead have greater leaping abilities than Chinook and both species have reduced leaping abilities with increased maturity or residence time in freshwater (coefficient of fish condition) (Figure 1). In California, spring-run Chinook enter streams in spring and early summer during relatively high seasonal stream flow conditions (Hallock and Fry 1967). Adult fish migrate to headwater reaches high in watersheds (when the fish have a high coefficient of condition) then reside in pools, maturing until spawning during the late summer and fall. In late summer, after holding in the river for an extended period, the fish have a lower coefficient of condition (advanced maturity) and streamflows are lower. Because adult spring-run Chinook have lesser leaping abilities than steelhead (Figure 1) and would be present during low-flow periods when hydraulic conditions at barriers would be expected to be more limited, this assessment primarily focused on that species. Additionally, unlike steelhead, adult spring-run Chinook require unique over-summering holding habitats. In the Sacramento River watershed, steelhead will migrate, hold, and spawn earlier in the season (Hallock 1989) and during higher-flow periods as compared to spring-run Chinook.
Waterfalls exceeding 11 feet in height are considered a total barrier to salmon and steelhead (Powers and Orsborn 1985). Evans and Johnston (1980), as cited by Powers and Orsborn (1985), suggest that if the height exceeds more than 6 feet it should be considered a barrier. The trajectory of the fish leap is also an important factor for passage at a potential barrier (Figure 1). Other physical parameters include, but are not limited to, depth of the plunge pool where the fish leaps and configuration of the fish exit after leaping (e.g., water depth, slope, velocity) (Figure 2). Additional factors are described in detail by Powers and Orsborn (1985).
Assessment of Upper Yuba Salmon and Steelhead Migration Barriers and Holding Habitats Page 1
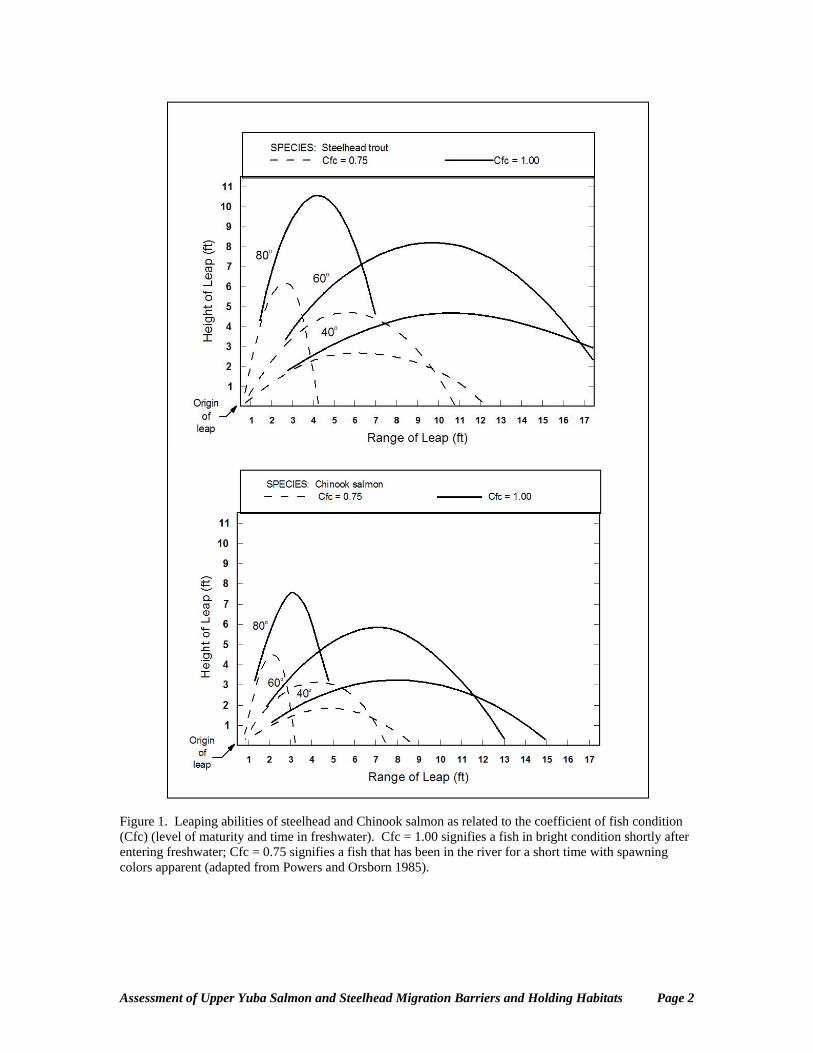
Figure 1. Leaping abilities of steelhead and Chinook salmon as related to the coefficient of fish condition (Cfc) (level of maturity and time in freshwater). Cfc = 1.00 signifies a fish in bright condition shortly after entering freshwater; Cfc = 0.75 signifies a fish that has been in the river for a short time with spawning colors apparent (adapted from Powers and Orsborn 1985).
Assessment of Upper Yuba Salmon and Steelhead Migration Barriers and Holding Habitats Page 2
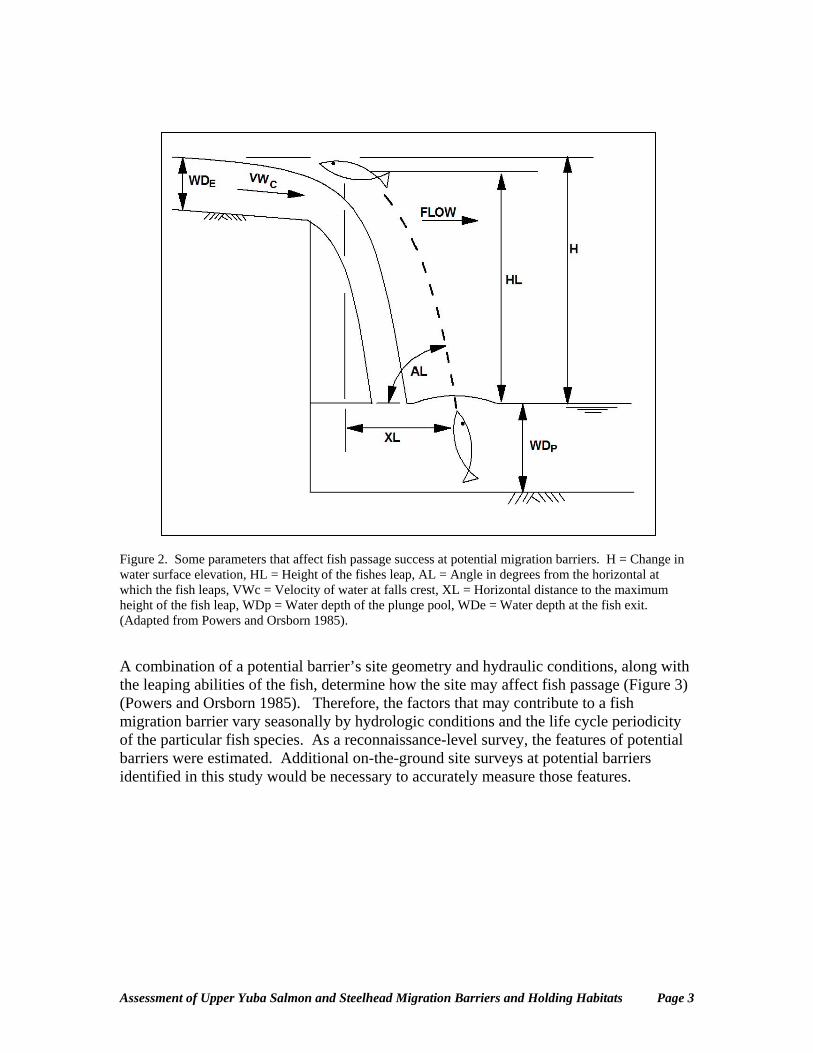
Figure 2. Some parameters that affect fish passage success at potential migration barriers. H = Change in water surface elevation, HL = Height of the fishes leap, AL = Angle in degrees from the horizontal at which the fish leaps, VWc = Velocity of water at falls crest, XL = Horizontal distance to the maximum height of the fish leap, WDp = Water depth of the plunge pool, WDe = Water depth at the fish exit. (Adapted from Powers and Orsborn 1985).
A combination of a potential barrier’s site geometry and hydraulic conditions, along with the leaping abilities of the fish, determine how the site may affect fish passage (Figure 3) (Powers and Orsborn 1985). Therefore, the factors that may contribute to a fish migration barrier vary seasonally by hydrologic conditions and the life cycle periodicity of the particular fish species. As a reconnaissance-level survey, the features of potential barriers were estimated. Additional on-the-ground site surveys at potential barriers identified in this study would be necessary to accurately measure those features.
Assessment of Upper Yuba Salmon and Steelhead Migration Barriers and Holding Habitats Page 3
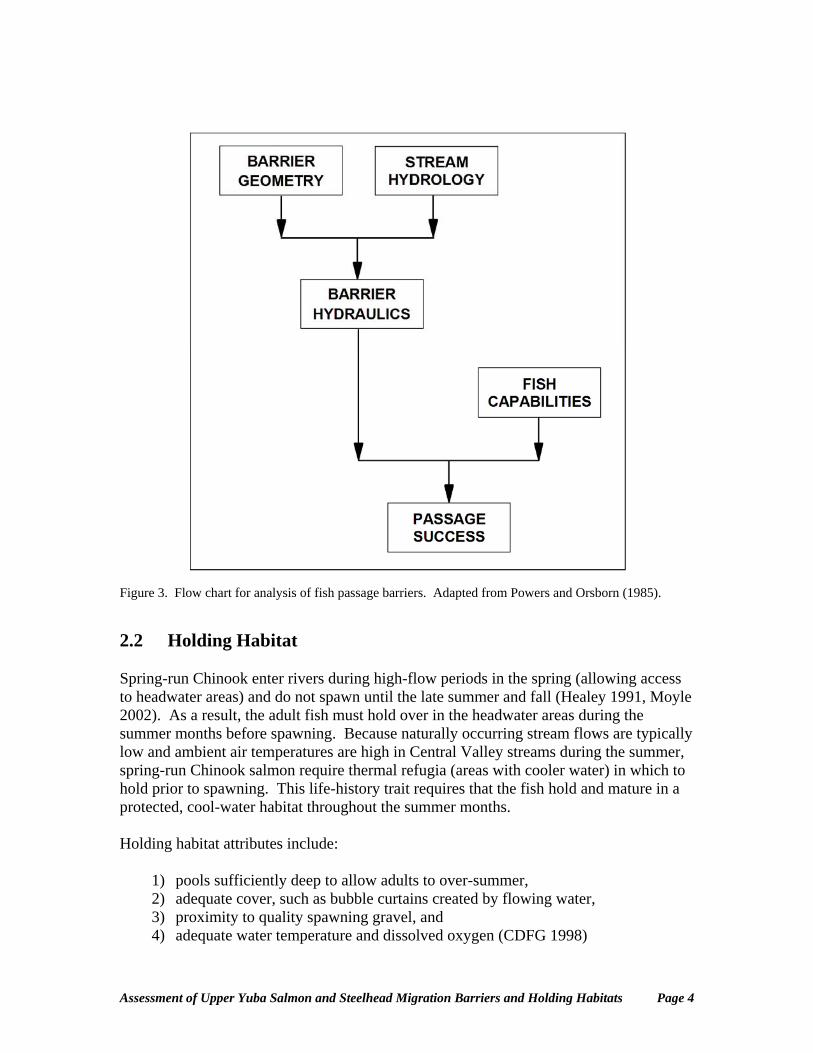
Figure 3. Flow chart for analysis of fish passage barriers. Adapted from Powers and Orsborn (1985).
2.2 Holding Habitat Spring-run Chinook enter rivers during high-flow periods in the spring (allowing access to headwater areas) and do not spawn until the late summer and fall (Healey 1991, Moyle 2002). As a result, the adult fish must hold over in the headwater areas during the summer months before spawning. Because naturally occurring stream flows are typically low and ambient air temperatures are high in Central Valley streams during the summer, spring-run Chinook salmon require thermal refugia (areas with cooler water) in which to hold prior to spawning. This life-history trait requires that the fish hold and mature in a protected, cool-water habitat throughout the summer months. Holding habitat attributes include:
1) pools sufficiently deep to allow adults to over-summer, 2) adequate cover, such as bubble curtains created by flowing water, 3) proximity to quality spawning gravel, and 4) adequate water temperature and dissolved oxygen (CDFG 1998)
Assessment of Upper Yuba Salmon and Steelhead Migration Barriers and Holding Habitats Page 4
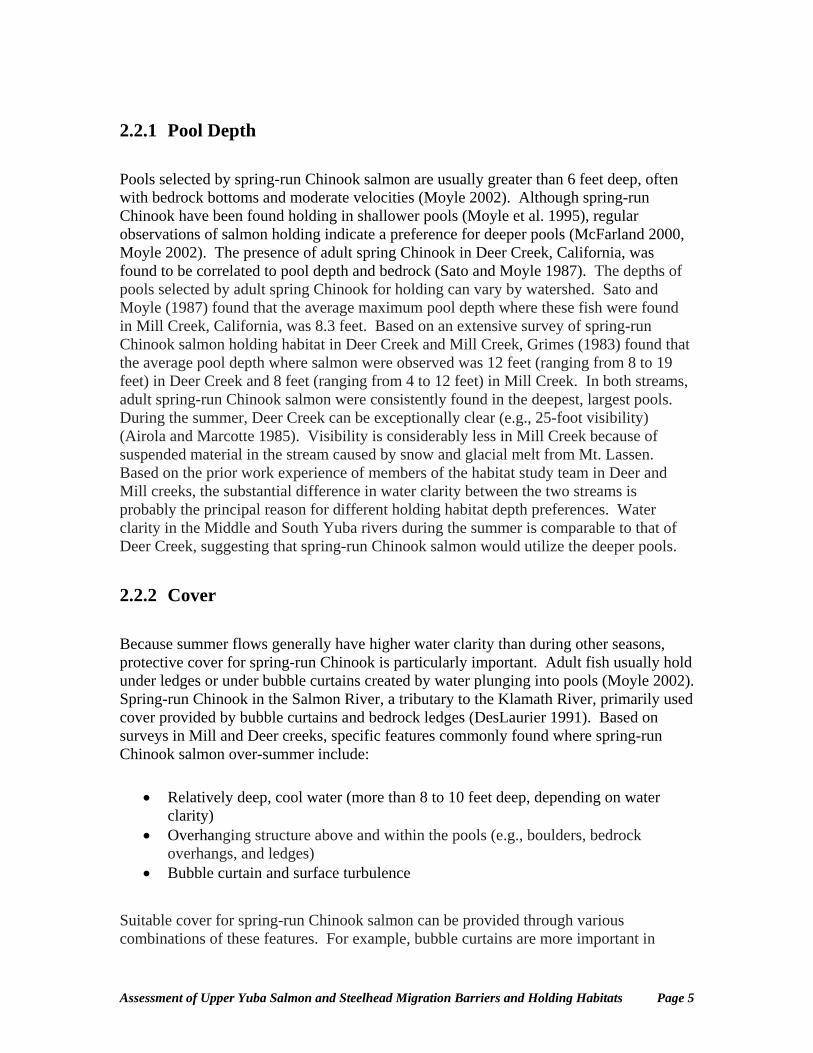
2.2.1 Pool Depth Pools selected by spring-run Chinook salmon are usually greater than 6 feet deep, often with bedrock bottoms and moderate velocities (Moyle 2002). Although spring-run Chinook have been found holding in shallower pools (Moyle et al. 1995), regular observations of salmon holding indicate a preference for deeper pools (McFarland 2000, Moyle 2002). The presence of adult spring Chinook in Deer Creek, California, was found to be correlated to pool depth and bedrock (Sato and Moyle 1987). The depths of pools selected by adult spring Chinook for holding can vary by watershed. Sato and Moyle (1987) found that the average maximum pool depth where these fish were found in Mill Creek, California, was 8.3 feet. Based on an extensive survey of spring-run Chinook salmon holding habitat in Deer Creek and Mill Creek, Grimes (1983) found that the average pool depth where salmon were observed was 12 feet (ranging from 8 to 19 feet) in Deer Creek and 8 feet (ranging from 4 to 12 feet) in Mill Creek. In both streams, adult spring-run Chinook salmon were consistently found in the deepest, largest pools. During the summer, Deer Creek can be exceptionally clear (e.g., 25-foot visibility) (Airola and Marcotte 1985). Visibility is considerably less in Mill Creek because of suspended material in the stream caused by snow and glacial melt from Mt. Lassen. Based on the prior work experience of members of the habitat study team in Deer and Mill creeks, the substantial difference in water clarity between the two streams is probably the principal reason for different holding habitat depth preferences. Water clarity in the Middle and South Yuba rivers during the summer is comparable to that of Deer Creek, suggesting that spring-run Chinook salmon would utilize the deeper pools.
2.2.2 Cover Because summer flows generally have higher water clarity than during other seasons, protective cover for spring-run Chinook is particularly important. Adult fish usually hold under ledges or under bubble curtains created by water plunging into pools (Moyle 2002). Spring-run Chinook in the Salmon River, a tributary to the Klamath River, primarily used cover provided by bubble curtains and bedrock ledges (DesLaurier 1991). Based on surveys in Mill and Deer creeks, specific features commonly found where spring-run Chinook salmon over-summer include:
• Relatively deep, cool water (more than 8 to 10 feet deep, depending on water clarity)
• Overhanging structure above and within the pools (e.g., boulders, bedrock overhangs, and ledges)
• Bubble curtain and surface turbulence
Suitable cover for spring-run Chinook salmon can be provided through various combinations of these features. For example, bubble curtains are more important in
Assessment of Upper Yuba Salmon and Steelhead Migration Barriers and Holding Habitats Page 5
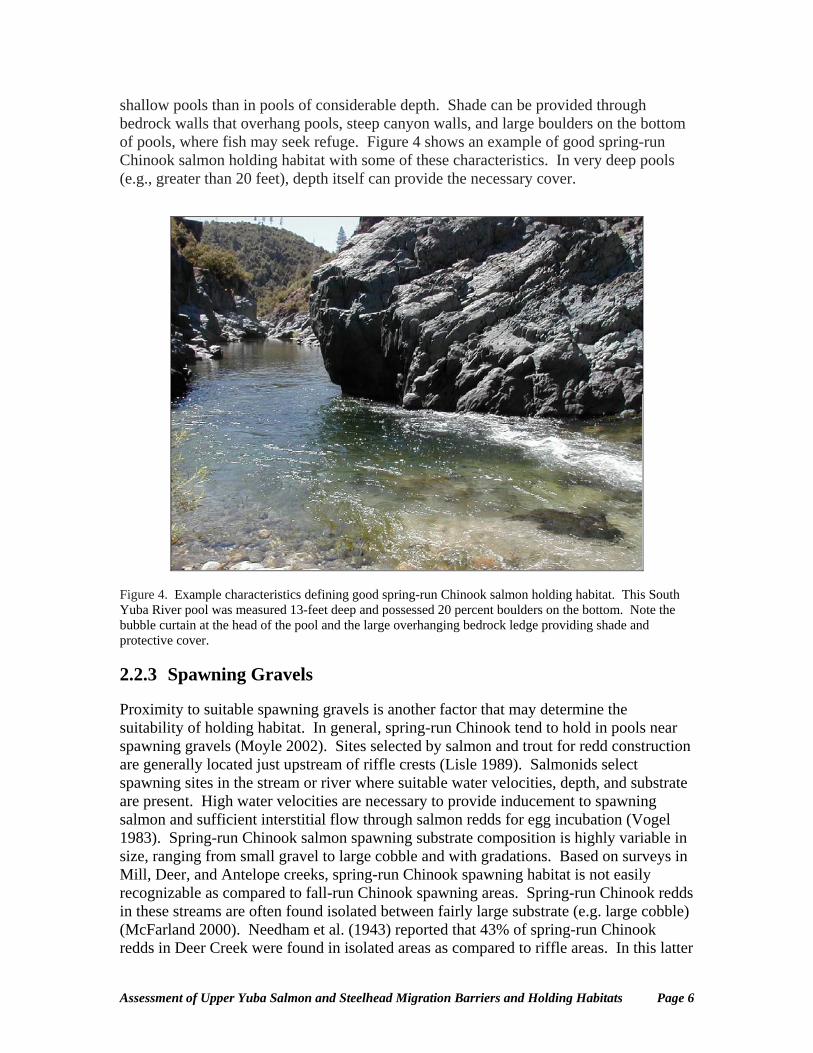
shallow pools than in pools of considerable depth. Shade can be provided through bedrock walls that overhang pools, steep canyon walls, and large boulders on the bottom of pools, where fish may seek refuge. Figure 4 shows an example of good spring-run Chinook salmon holding habitat with some of these characteristics. In very deep pools (e.g., greater than 20 feet), depth itself can provide the necessary cover.
Figure 4. Example characteristics defining good spring-run Chinook salmon holding habitat. This South Yuba River pool was measured 13-feet deep and possessed 20 percent boulders on the bottom. Note the bubble curtain at the head of the pool and the large overhanging bedrock ledge providing shade and protective cover. 2.2.3 Spawning Gravels Proximity to suitable spawning gravels is another factor that may determine the suitability of holding habitat. In general, spring-run Chinook tend to hold in pools near spawning gravels (Moyle 2002). Sites selected by salmon and trout for redd construction are generally located just upstream of riffle crests (Lisle 1989). Salmonids select spawning sites in the stream or river where suitable water velocities, depth, and substrate are present. High water velocities are necessary to provide inducement to spawning salmon and sufficient interstitial flow through salmon redds for egg incubation (Vogel 1983). Spring-run Chinook salmon spawning substrate composition is highly variable in size, ranging from small gravel to large cobble and with gradations. Based on surveys in Mill, Deer, and Antelope creeks, spring-run Chinook spawning habitat is not easily recognizable as compared to fall-run Chinook spawning areas. Spring-run Chinook redds in these streams are often found isolated between fairly large substrate (e.g. large cobble) (McFarland 2000). Needham et al. (1943) reported that 43% of spring-run Chinook redds in Deer Creek were found in isolated areas as compared to riffle areas. In this latter
Assessment of Upper Yuba Salmon and Steelhead Migration Barriers and Holding Habitats Page 6
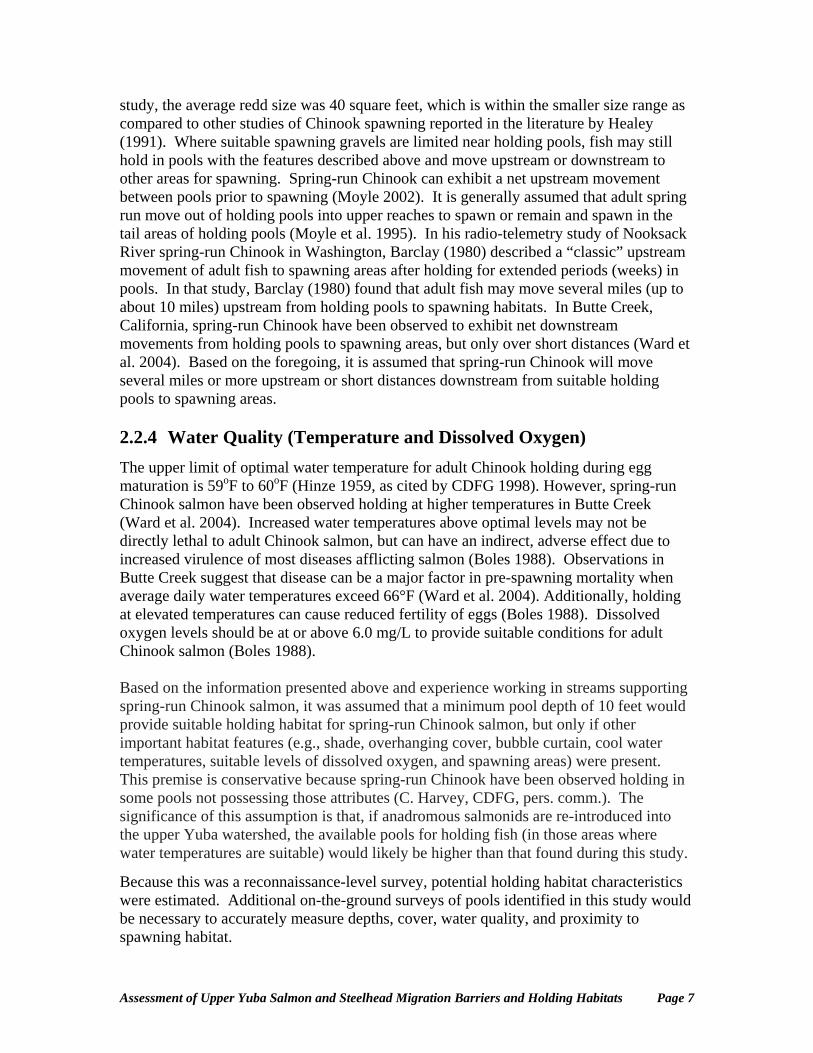
study, the average redd size was 40 square feet, which is within the smaller size range as compared to other studies of Chinook spawning reported in the literature by Healey (1991). Where suitable spawning gravels are limited near holding pools, fish may still hold in pools with the features described above and move upstream or downstream to other areas for spawning. Spring-run Chinook can exhibit a net upstream movement between pools prior to spawning (Moyle 2002). It is generally assumed that adult spring run move out of holding pools into upper reaches to spawn or remain and spawn in the tail areas of holding pools (Moyle et al. 1995). In his radio-telemetry study of Nooksack River spring-run Chinook in Washington, Barclay (1980) described a “classic” upstream movement of adult fish to spawning areas after holding for extended periods (weeks) in pools. In that study, Barclay (1980) found that adult fish may move several miles (up to about 10 miles) upstream from holding pools to spawning habitats. In Butte Creek, California, spring-run Chinook have been observed to exhibit net downstream movements from holding pools to spawning areas, but only over short distances (Ward et al. 2004). Based on the foregoing, it is assumed that spring-run Chinook will move several miles or more upstream or short distances downstream from suitable holding pools to spawning areas. 2.2.4 Water Quality (Temperature and Dissolved Oxygen) The upper limit of optimal water temperature for adult Chinook holding during egg maturation is 59oF to 60oF (Hinze 1959, as cited by CDFG 1998). However, spring-run Chinook salmon have been observed holding at higher temperatures in Butte Creek (Ward et al. 2004). Increased water temperatures above optimal levels may not be directly lethal to adult Chinook salmon, but can have an indirect, adverse effect due to increased virulence of most diseases afflicting salmon (Boles 1988). Observations in Butte Creek suggest that disease can be a major factor in pre-spawning mortality when average daily water temperatures exceed 66°F (Ward et al. 2004). Additionally, holding at elevated temperatures can cause reduced fertility of eggs (Boles 1988). Dissolved oxygen levels should be at or above 6.0 mg/L to provide suitable conditions for adult Chinook salmon (Boles 1988). Based on the information presented above and experience working in streams supporting spring-run Chinook salmon, it was assumed that a minimum pool depth of 10 feet would provide suitable holding habitat for spring-run Chinook salmon, but only if other important habitat features (e.g., shade, overhanging cover, bubble curtain, cool water temperatures, suitable levels of dissolved oxygen, and spawning areas) were present. This premise is conservative because spring-run Chinook have been observed holding in some pools not possessing those attributes (C. Harvey, CDFG, pers. comm.). The significance of this assumption is that, if anadromous salmonids are re-introduced into the upper Yuba watershed, the available pools for holding fish (in those areas where water temperatures are suitable) would likely be higher than that found during this study.
Because this was a reconnaissance-level survey, potential holding habitat characteristics were estimated. Additional on-the-ground surveys of pools identified in this study would be necessary to accurately measure depths, cover, water quality, and proximity to spawning habitat.
Assessment of Upper Yuba Salmon and Steelhead Migration Barriers and Holding Habitats Page 7
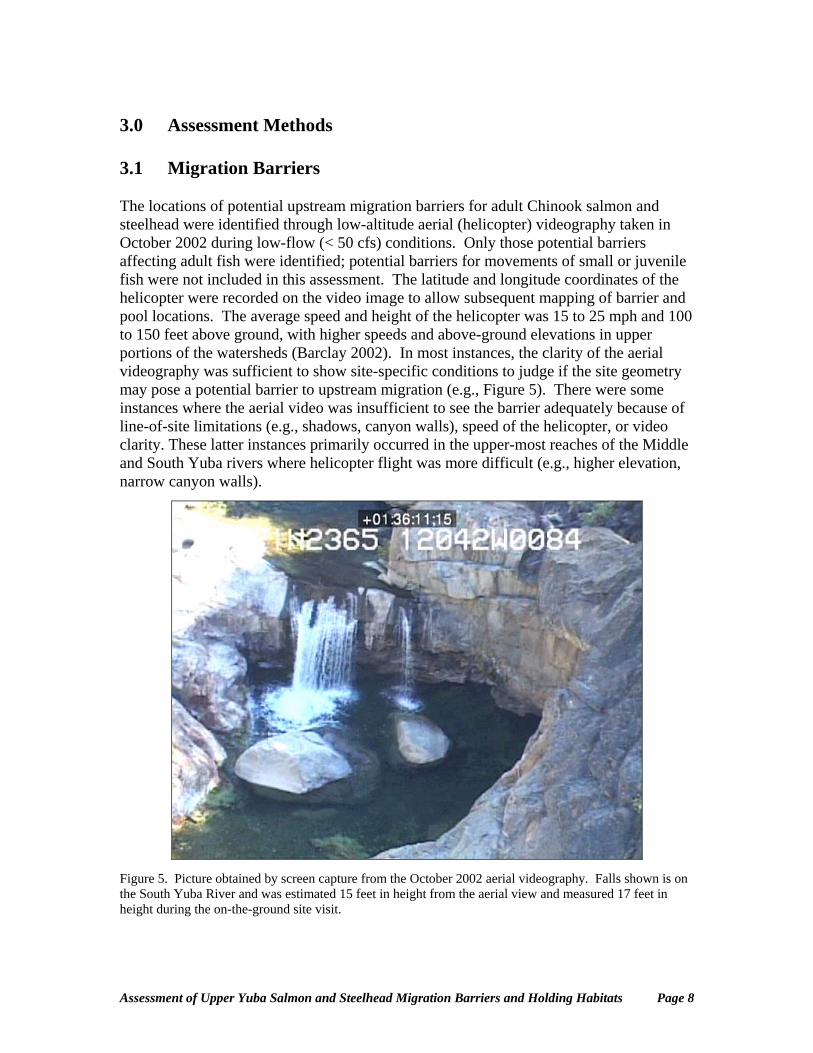
3.0 Assessment Methods 3.1 Migration Barriers The locations of potential upstream migration barriers for adult Chinook salmon and steelhead were identified through low-altitude aerial (helicopter) videography taken in October 2002 during low-flow (< 50 cfs) conditions. Only those potential barriers affecting adult fish were identified; potential barriers for movements of small or juvenile fish were not included in this assessment. The latitude and longitude coordinates of the helicopter were recorded on the video image to allow subsequent mapping of barrier and pool locations. The average speed and height of the helicopter was 15 to 25 mph and 100 to 150 feet above ground, with higher speeds and above-ground elevations in upper portions of the watersheds (Barclay 2002). In most instances, the clarity of the aerial videography was sufficient to show site-specific conditions to judge if the site geometry may pose a potential barrier to upstream migration (e.g., Figure 5). There were some instances where the aerial video was insufficient to see the barrier adequately because of line-of-site limitations (e.g., shadows, canyon walls), speed of the helicopter, or video clarity. These latter instances primarily occurred in the upper-most reaches of the Middle and South Yuba rivers where helicopter flight was more difficult (e.g., higher elevation, narrow canyon walls).
Figure 5. Picture obtained by screen capture from the October 2002 aerial videography. Falls shown is on the South Yuba River and was estimated 15 feet in height from the aerial view and measured 17 feet in height during the on-the-ground site visit.
Assessment of Upper Yuba Salmon and Steelhead Migration Barriers and Holding Habitats Page 8
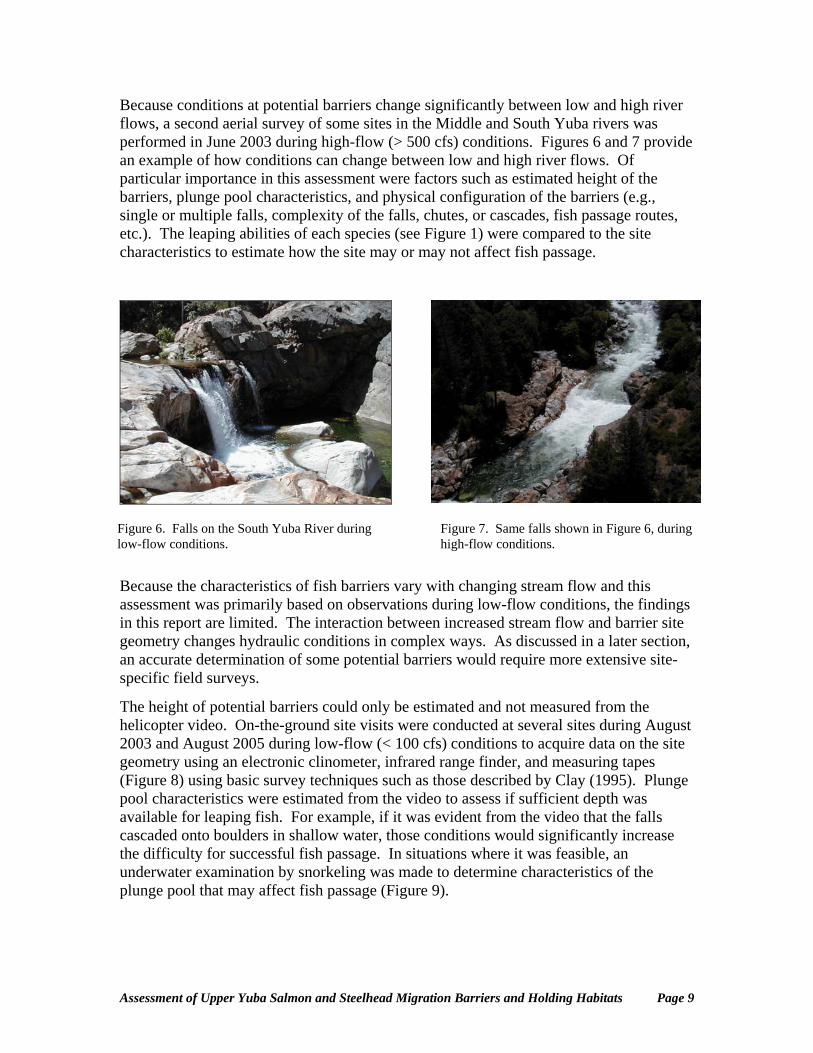
Because conditions at potential barriers change significantly between low and high river flows, a second aerial survey of some sites in the Middle and South Yuba rivers was performed in June 2003 during high-flow (> 500 cfs) conditions. Figures 6 and 7 provide an example of how conditions can change between low and high river flows. Of particular importance in this assessment were factors such as estimated height of the barriers, plunge pool characteristics, and physical configuration of the barriers (e.g., single or multiple falls, complexity of the falls, chutes, or cascades, fish passage routes, etc.). The leaping abilities of each species (see Figure 1) were compared to the site characteristics to estimate how the site may or may not affect fish passage.
Because the characteristics of fish barriers vary with changing stream flow and this assessment was primarily based on observations during low-flow conditions, the findings in this report are limited. The interaction between increased stream flow and barrier site geometry changes hydraulic conditions in complex ways. As discussed in a later section, an accurate determination of some potential barriers would require more extensive site-specific field surveys.
Figure 7. Same falls shown in Figure 6, during high-flow conditions.
Figure 6. Falls on the South Yuba River during low-flow conditions.
The height of potential barriers could only be estimated and not measured from the helicopter video. On-the-ground site visits were conducted at several sites during August 2003 and August 2005 during low-flow (< 100 cfs) conditions to acquire data on the site geometry using an electronic clinometer, infrared range finder, and measuring tapes (Figure 8) using basic survey techniques such as those described by Clay (1995). Plunge pool characteristics were estimated from the video to assess if sufficient depth was available for leaping fish. For example, if it was evident from the video that the falls cascaded onto boulders in shallow water, those conditions would significantly increase the difficulty for successful fish passage. In situations where it was feasible, an underwater examination by snorkeling was made to determine characteristics of the plunge pool that may affect fish passage (Figure 9).
Assessment of Upper Yuba Salmon and Steelhead Migration Barriers and Holding Habitats Page 9
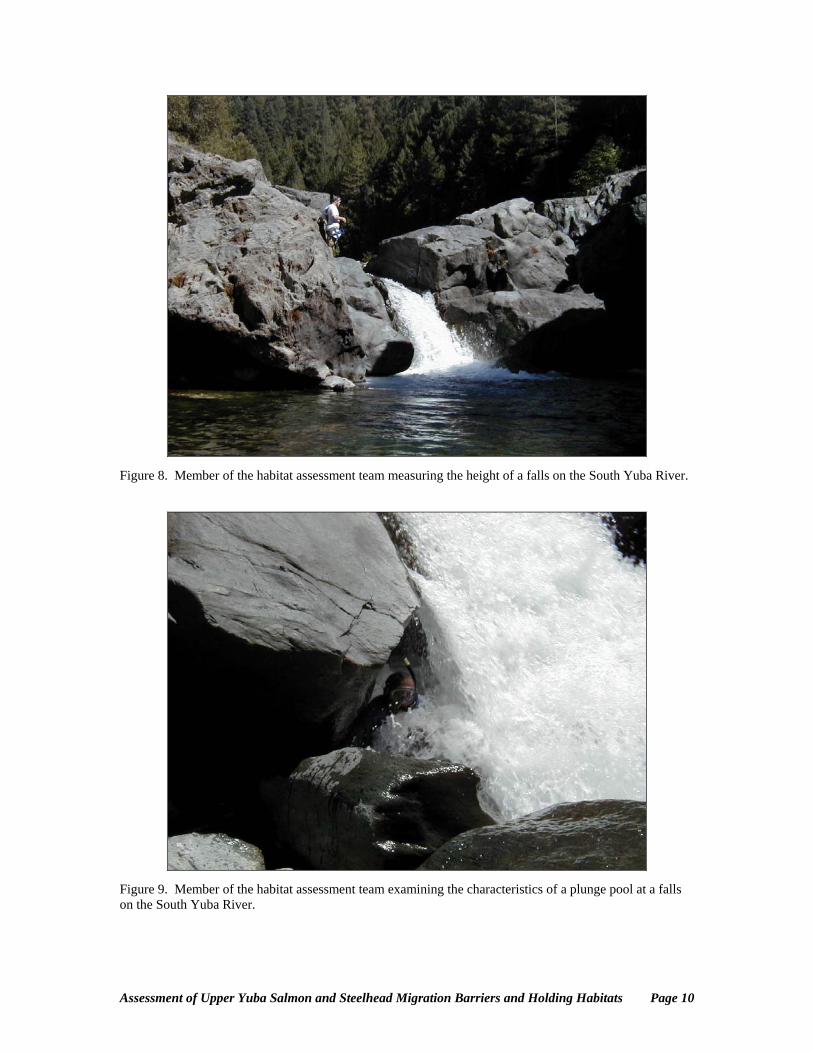
Figure 8. Member of the habitat assessment team measuring the height of a falls on the South Yuba River.
Figure 9. Member of the habitat assessment team examining the characteristics of a plunge pool at a falls on the South Yuba River.
Assessment of Upper Yuba Salmon and Steelhead Migration Barriers and Holding Habitats Page 10
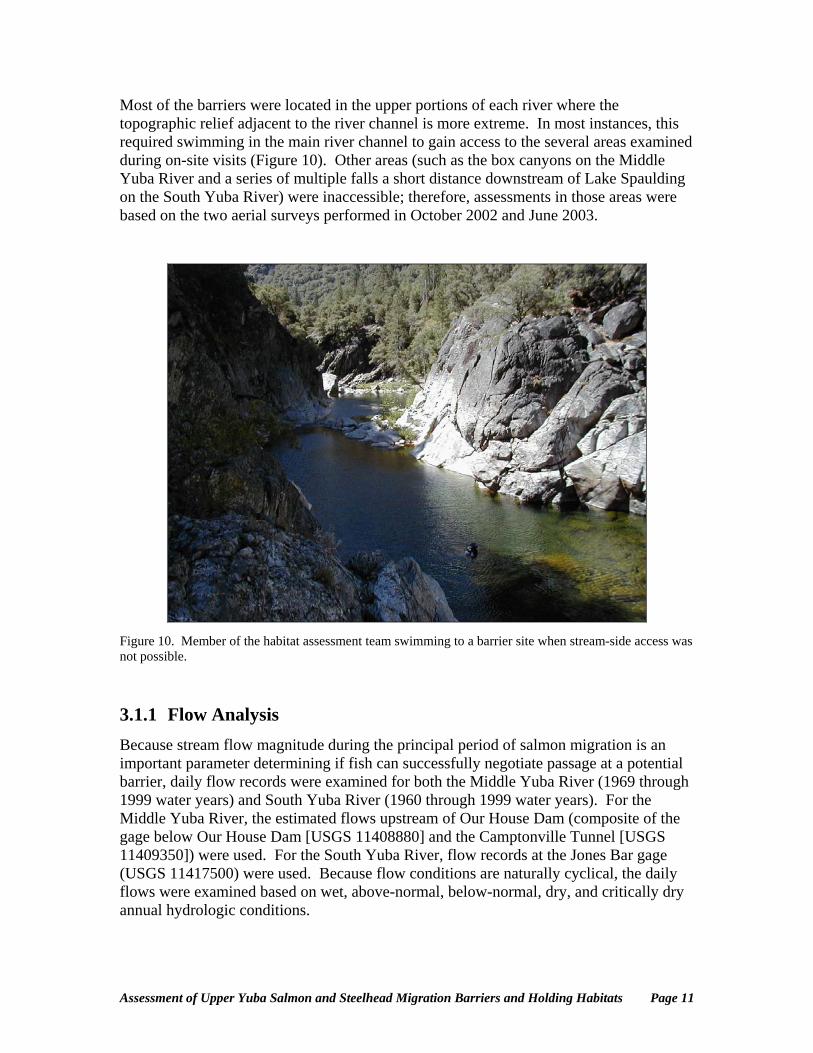
Most of the barriers were located in the upper portions of each river where the topographic relief adjacent to the river channel is more extreme. In most instances, this required swimming in the main river channel to gain access to the several areas examined during on-site visits (Figure 10). Other areas (such as the box canyons on the Middle Yuba River and a series of multiple falls a short distance downstream of Lake Spaulding on the South Yuba River) were inaccessible; therefore, assessments in those areas were based on the two aerial surveys performed in October 2002 and June 2003.
Figure 10. Member of the habitat assessment team swimming to a barrier site when stream-side access was not possible.
3.1.1 Flow Analysis Because stream flow magnitude during the principal period of salmon migration is an important parameter determining if fish can successfully negotiate passage at a potential barrier, daily flow records were examined for both the Middle Yuba River (1969 through 1999 water years) and South Yuba River (1960 through 1999 water years). For the Middle Yuba River, the estimated flows upstream of Our House Dam (composite of the gage below Our House Dam [USGS 11408880] and the Camptonville Tunnel [USGS 11409350]) were used. For the South Yuba River, flow records at the Jones Bar gage (USGS 11417500) were used. Because flow conditions are naturally cyclical, the daily flows were examined based on wet, above-normal, below-normal, dry, and critically dry annual hydrologic conditions.
Assessment of Upper Yuba Salmon and Steelhead Migration Barriers and Holding Habitats Page 11
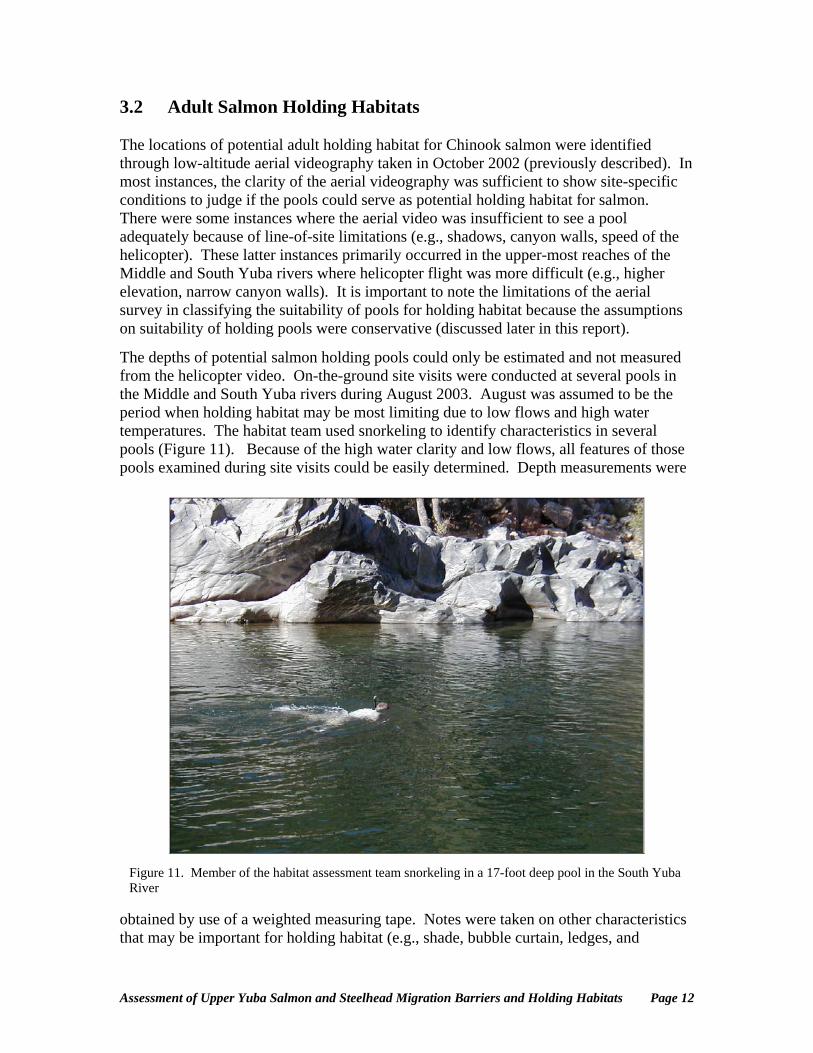
3.2 Adult Salmon Holding Habitats The locations of potential adult holding habitat for Chinook salmon were identified through low-altitude aerial videography taken in October 2002 (previously described). In most instances, the clarity of the aerial videography was sufficient to show site-specific conditions to judge if the pools could serve as potential holding habitat for salmon. There were some instances where the aerial video was insufficient to see a pool adequately because of line-of-site limitations (e.g., shadows, canyon walls, speed of the helicopter). These latter instances primarily occurred in the upper-most reaches of the Middle and South Yuba rivers where helicopter flight was more difficult (e.g., higher elevation, narrow canyon walls). It is important to note the limitations of the aerial survey in classifying the suitability of pools for holding habitat because the assumptions on suitability of holding pools were conservative (discussed later in this report).
The depths of potential salmon holding pools could only be estimated and not measured from the helicopter video. On-the-ground site visits were conducted at several pools in the Middle and South Yuba rivers during August 2003. August was assumed to be the period when holding habitat may be most limiting due to low flows and high water temperatures. The habitat team used snorkeling to identify characteristics in several pools (Figure 11). Because of the high water clarity and low flows, all features of those pools examined during site visits could be easily determined. Depth measurements were
obtained by use of a weighted measuring tape. Notes were taken on other characteristics that may be important for holding habitat (e.g., shade, bubble curtain, ledges, and
Figure 11. Member of the habitat assessment team snorkeling in a 17-foot deep pool in the South Yuba River
Assessment of Upper Yuba Salmon and Steelhead Migration Barriers and Holding Habitats Page 12
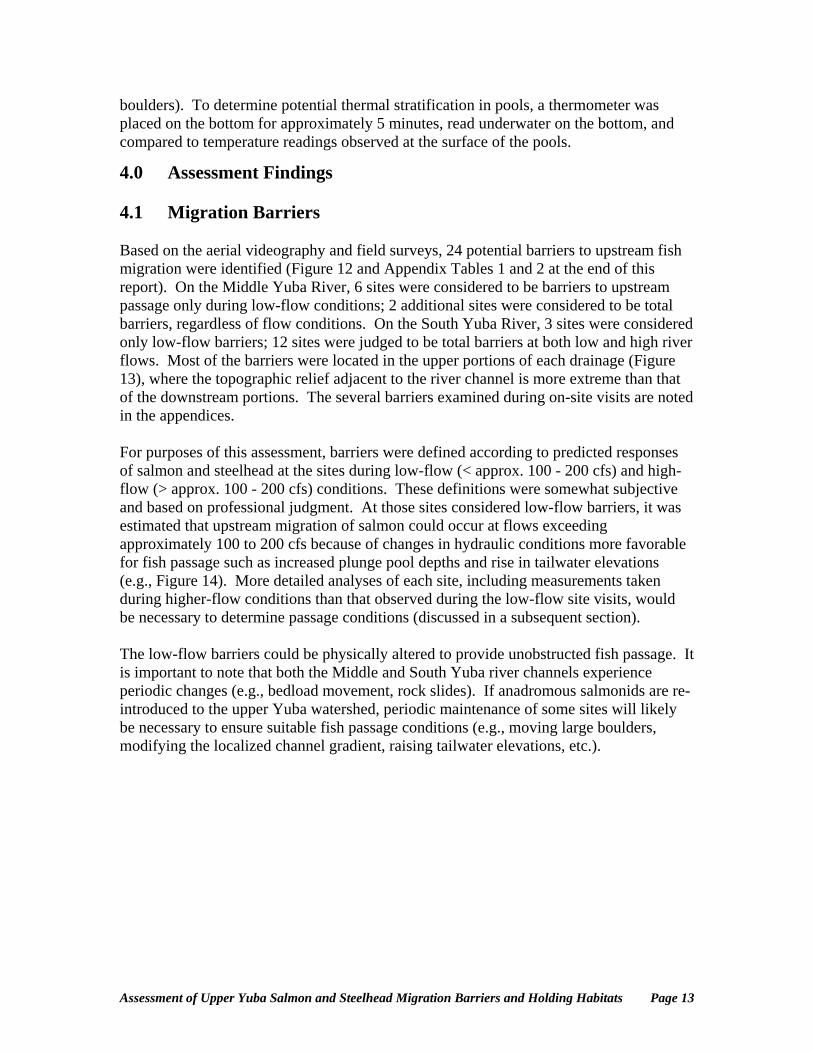
boulders). To determine potential thermal stratification in pools, a thermometer was placed on the bottom for approximately 5 minutes, read underwater on the bottom, and compared to temperature readings observed at the surface of the pools.
4.0 Assessment Findings 4.1 Migration Barriers Based on the aerial videography and field surveys, 24 potential barriers to upstream fish migration were identified (Figure 12 and Appendix Tables 1 and 2 at the end of this report). On the Middle Yuba River, 6 sites were considered to be barriers to upstream passage only during low-flow conditions; 2 additional sites were considered to be total barriers, regardless of flow conditions. On the South Yuba River, 3 sites were considered only low-flow barriers; 12 sites were judged to be total barriers at both low and high river flows. Most of the barriers were located in the upper portions of each drainage (Figure 13), where the topographic relief adjacent to the river channel is more extreme than that of the downstream portions. The several barriers examined during on-site visits are noted in the appendices. For purposes of this assessment, barriers were defined according to predicted responses of salmon and steelhead at the sites during low-flow (< approx. 100 - 200 cfs) and high-flow (> approx. 100 - 200 cfs) conditions. These definitions were somewhat subjective and based on professional judgment. At those sites considered low-flow barriers, it was estimated that upstream migration of salmon could occur at flows exceeding approximately 100 to 200 cfs because of changes in hydraulic conditions more favorable for fish passage such as increased plunge pool depths and rise in tailwater elevations (e.g., Figure 14). More detailed analyses of each site, including measurements taken during higher-flow conditions than that observed during the low-flow site visits, would be necessary to determine passage conditions (discussed in a subsequent section). The low-flow barriers could be physically altered to provide unobstructed fish passage. It is important to note that both the Middle and South Yuba river channels experience periodic changes (e.g., bedload movement, rock slides). If anadromous salmonids are re-introduced to the upper Yuba watershed, periodic maintenance of some sites will likely be necessary to ensure suitable fish passage conditions (e.g., moving large boulders, modifying the localized channel gradient, raising tailwater elevations, etc.).
Assessment of Upper Yuba Salmon and Steelhead Migration Barriers and Holding Habitats Page 13
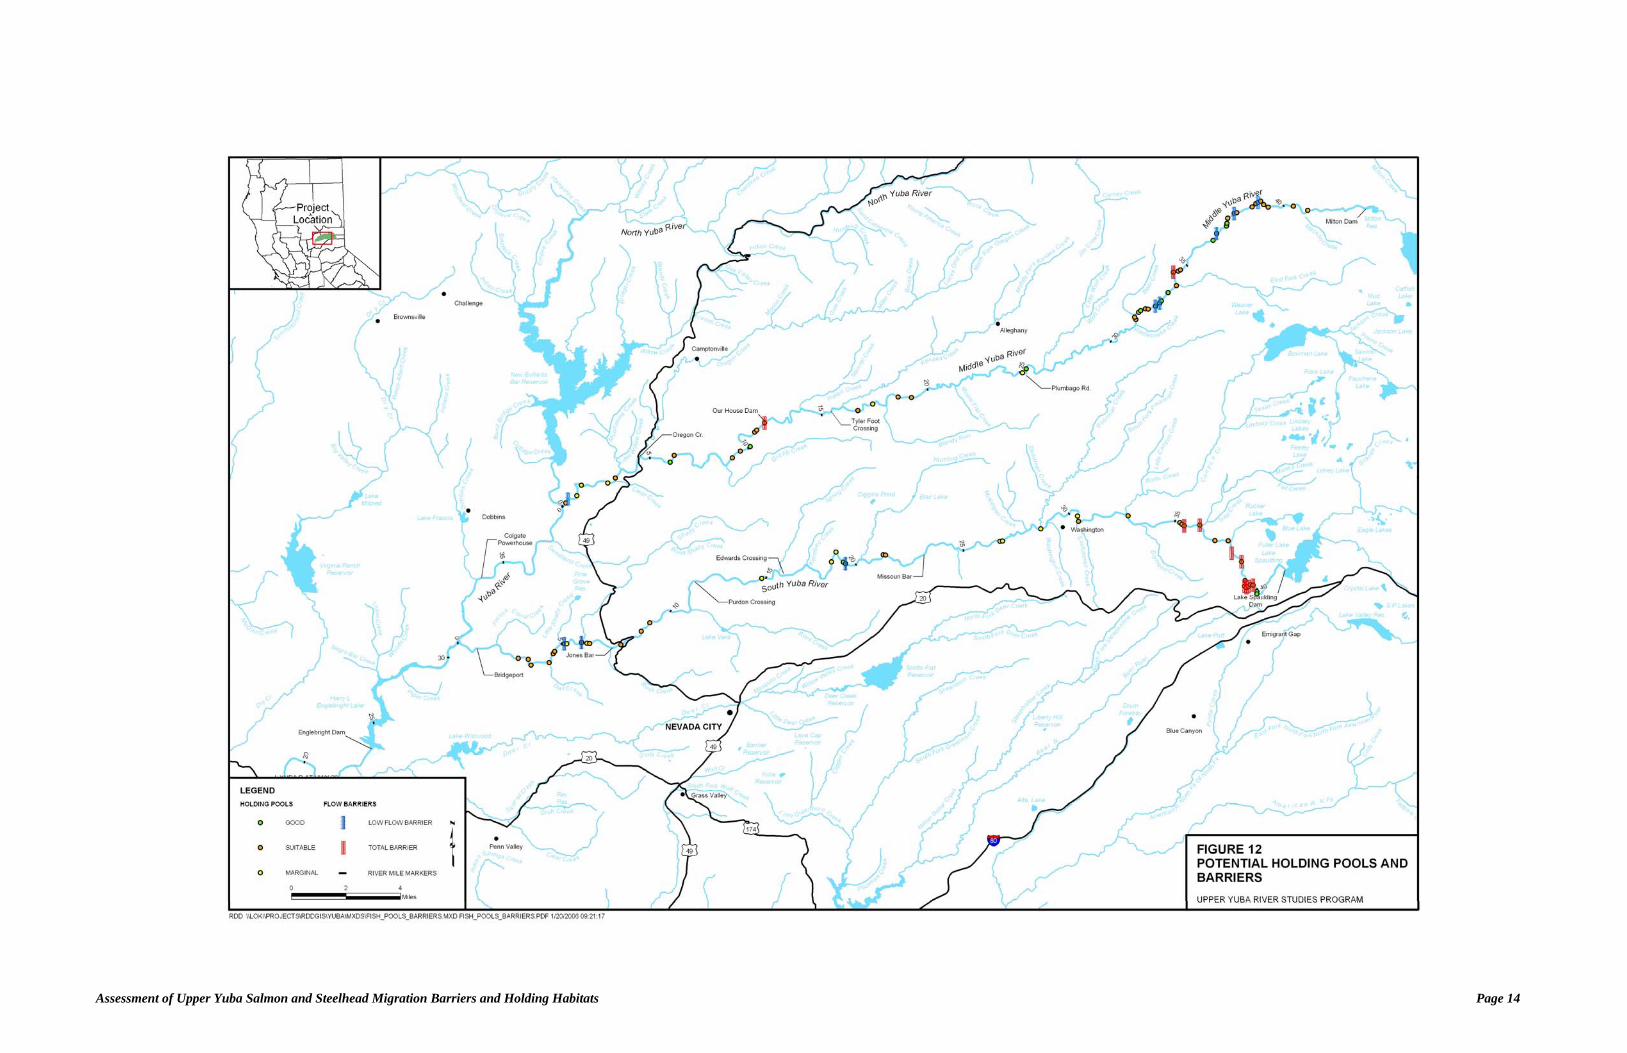
Assessment of Upper Yuba Salmon and Steelhead Migration Barriers and Holding Habitats Page 14
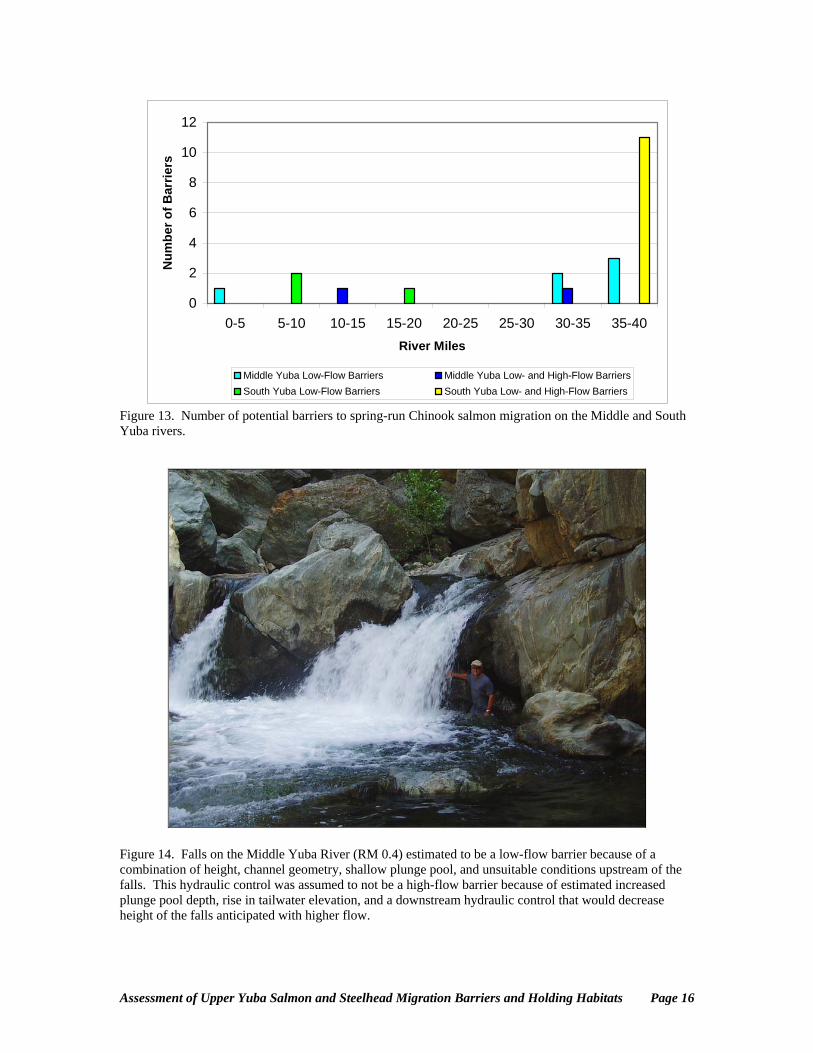
0
2
4
6
8
10
12
0-5 5-10 10-15 15-20 20-25 25-30 30-35 35-40River Miles
Num
ber o
f Bar
riers
Middle Yuba Low-Flow Barriers Middle Yuba Low- and High-Flow BarriersSouth Yuba Low-Flow Barriers South Yuba Low- and High-Flow Barriers
Figure 13. Number of potential barriers to spring-run Chinook salmon migration on the Middle and South Yuba rivers.
Figure 14. Falls on the Middle Yuba River (RM 0.4) estimated to be a low-flow barrier because of a combination of height, channel geometry, shallow plunge pool, and unsuitable conditions upstream of the falls. This hydraulic control was assumed to not be a high-flow barrier because of estimated increased plunge pool depth, rise in tailwater elevation, and a downstream hydraulic control that would decrease height of the falls anticipated with higher flow.
Assessment of Upper Yuba Salmon and Steelhead Migration Barriers and Holding Habitats Page 16
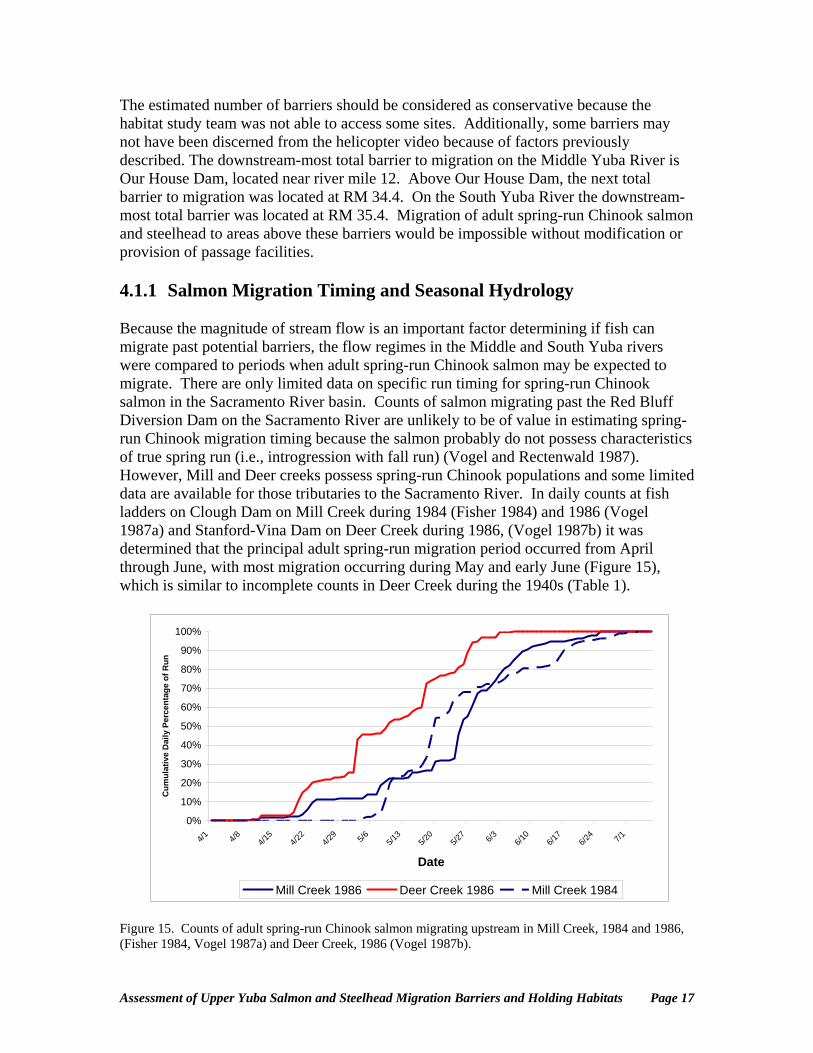
The estimated number of barriers should be considered as conservative because the habitat study team was not able to access some sites. Additionally, some barriers may not have been discerned from the helicopter video because of factors previously described. The downstream-most total barrier to migration on the Middle Yuba River is Our House Dam, located near river mile 12. Above Our House Dam, the next total barrier to migration was located at RM 34.4. On the South Yuba River the downstream-most total barrier was located at RM 35.4. Migration of adult spring-run Chinook salmon and steelhead to areas above these barriers would be impossible without modification or provision of passage facilities. 4.1.1 Salmon Migration Timing and Seasonal Hydrology Because the magnitude of stream flow is an important factor determining if fish can migrate past potential barriers, the flow regimes in the Middle and South Yuba rivers were compared to periods when adult spring-run Chinook salmon may be expected to migrate. There are only limited data on specific run timing for spring-run Chinook salmon in the Sacramento River basin. Counts of salmon migrating past the Red Bluff Diversion Dam on the Sacramento River are unlikely to be of value in estimating spring-run Chinook migration timing because the salmon probably do not possess characteristics of true spring run (i.e., introgression with fall run) (Vogel and Rectenwald 1987). However, Mill and Deer creeks possess spring-run Chinook populations and some limited data are available for those tributaries to the Sacramento River. In daily counts at fish ladders on Clough Dam on Mill Creek during 1984 (Fisher 1984) and 1986 (Vogel 1987a) and Stanford-Vina Dam on Deer Creek during 1986, (Vogel 1987b) it was determined that the principal adult spring-run migration period occurred from April through June, with most migration occurring during May and early June (Figure 15), which is similar to incomplete counts in Deer Creek during the 1940s (Table 1).
0%
10%
20%
30%
40%
50%
60%
70%
80%
90%
100%
Cum
ulat
ive
Dai
ly P
erce
ntag
e of
Run
4/1 4/8 4/15
4/22
4/29 5/6 5/1
35/2
05/2
7 6/3 6/10
6/17
6/24 7/1
Date
Mill Creek 1986 Deer Creek 1986 Mill Creek 1984 Figure 15. Counts of adult spring-run Chinook salmon migrating upstream in Mill Creek, 1984 and 1986, (Fisher 1984, Vogel 1987a) and Deer Creek, 1986 (Vogel 1987b).
Assessment of Upper Yuba Salmon and Steelhead Migration Barriers and Holding Habitats Page 17
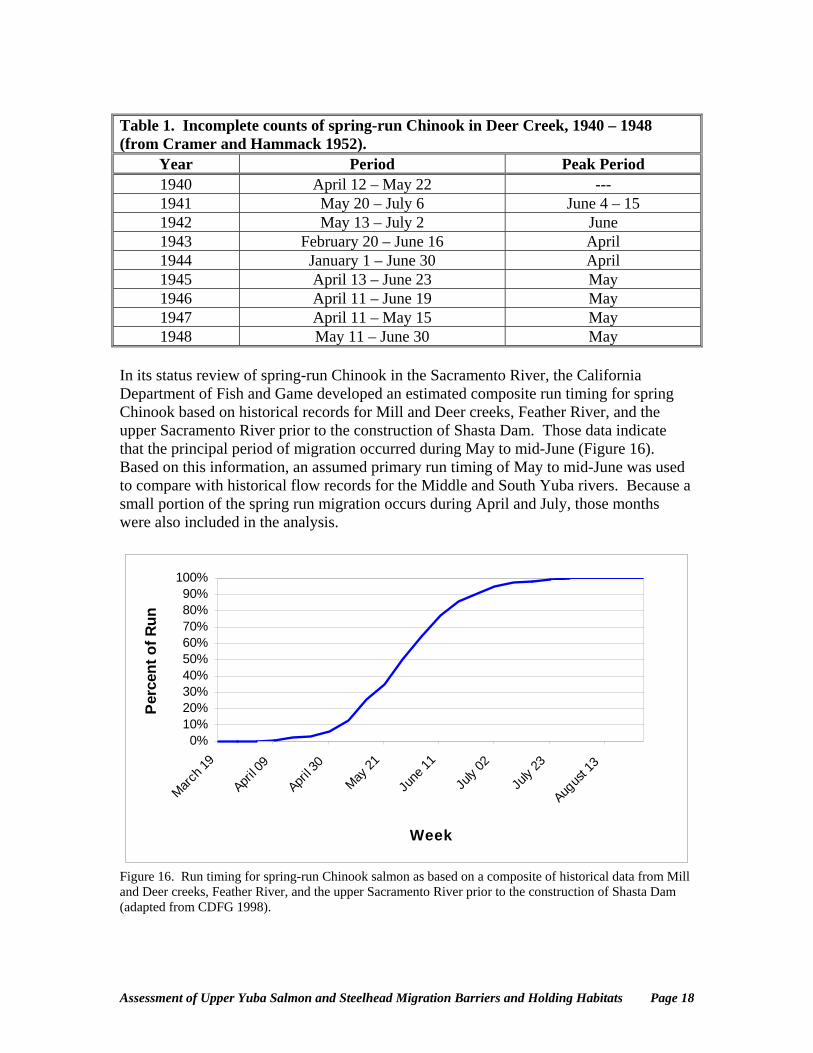
Table 1. Incomplete counts of spring-run Chinook in Deer Creek, 1940 – 1948 (from Cramer and Hammack 1952).
Year Period Peak Period 1940 April 12 – May 22 --- 1941 May 20 – July 6 June 4 – 15 1942 May 13 – July 2 June 1943 February 20 – June 16 April 1944 January 1 – June 30 April 1945 April 13 – June 23 May 1946 April 11 – June 19 May 1947 April 11 – May 15 May 1948 May 11 – June 30 May
In its status review of spring-run Chinook in the Sacramento River, the California Department of Fish and Game developed an estimated composite run timing for spring Chinook based on historical records for Mill and Deer creeks, Feather River, and the upper Sacramento River prior to the construction of Shasta Dam. Those data indicate that the principal period of migration occurred during May to mid-June (Figure 16). Based on this information, an assumed primary run timing of May to mid-June was used to compare with historical flow records for the Middle and South Yuba rivers. Because a small portion of the spring run migration occurs during April and July, those months were also included in the analysis.
0%10%20%30%40%50%60%70%80%90%
100%
March 1
9
April 0
9
April 3
0
May 21
June
11
July
02
July
23
Augus
t 13
Week
Perc
ent o
f Run
Figure 16. Run timing for spring-run Chinook salmon as based on a composite of historical data from Mill and Deer creeks, Feather River, and the upper Sacramento River prior to the construction of Shasta Dam (adapted from CDFG 1998).
Assessment of Upper Yuba Salmon and Steelhead Migration Barriers and Holding Habitats Page 18
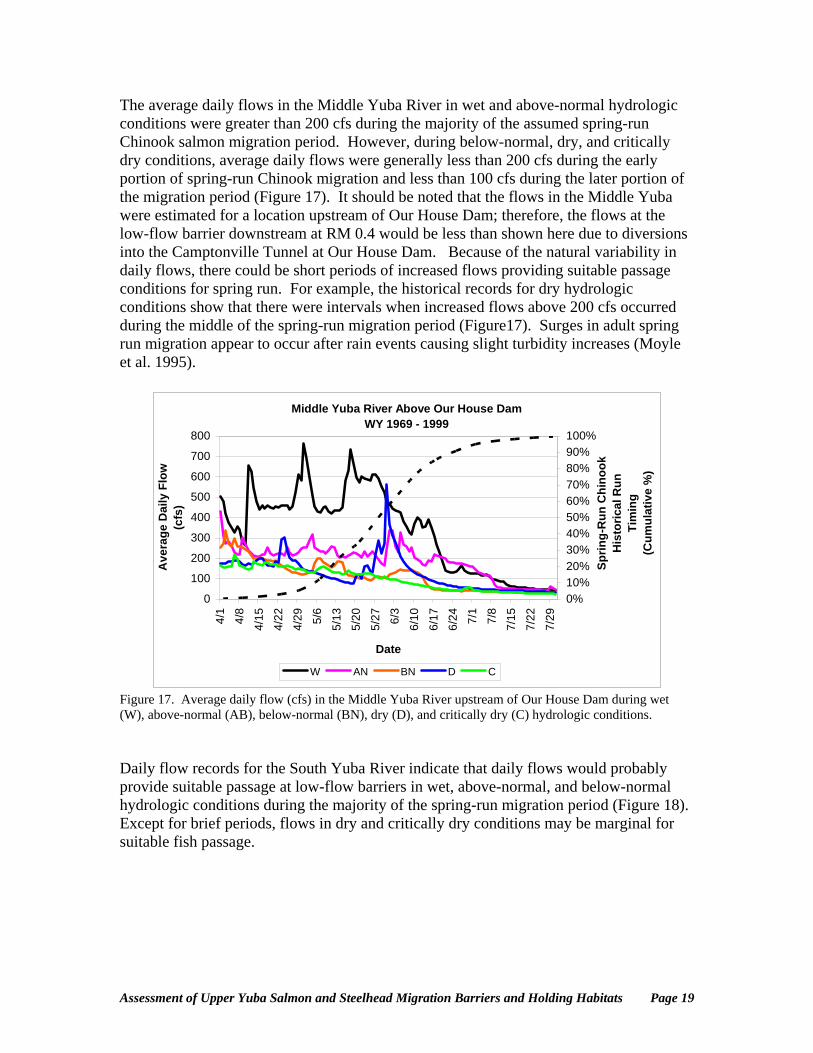
The average daily flows in the Middle Yuba River in wet and above-normal hydrologic conditions were greater than 200 cfs during the majority of the assumed spring-run Chinook salmon migration period. However, during below-normal, dry, and critically dry conditions, average daily flows were generally less than 200 cfs during the early portion of spring-run Chinook migration and less than 100 cfs during the later portion of the migration period (Figure 17). It should be noted that the flows in the Middle Yuba were estimated for a location upstream of Our House Dam; therefore, the flows at the low-flow barrier downstream at RM 0.4 would be less than shown here due to diversions into the Camptonville Tunnel at Our House Dam. Because of the natural variability in daily flows, there could be short periods of increased flows providing suitable passage conditions for spring run. For example, the historical records for dry hydrologic conditions show that there were intervals when increased flows above 200 cfs occurred during the middle of the spring-run migration period (Figure17). Surges in adult spring run migration appear to occur after rain events causing slight turbidity increases (Moyle et al. 1995).
Middle Yuba River Above Our House DamWY 1969 - 1999
0
100
200
300
400
500
600
700
800
Ave
rage
Dai
ly F
low
(c
fs)
0%10%20%30%40%50%60%70%80%90%100%
Sprin
g-R
un C
hino
ok
His
toric
al R
un
Tim
ing
(Cum
ulat
ive
%)
4/1
4/8
4/15
4/22
4/29 5/
6
5/13
5/20
5/27 6/
3
6/10
6/17
6/24 7/
1
7/8
7/15
7/22
7/29
Date
W AN BN D C
Figure 17. Average daily flow (cfs) in the Middle Yuba River upstream of Our House Dam during wet (W), above-normal (AB), below-normal (BN), dry (D), and critically dry (C) hydrologic conditions. Daily flow records for the South Yuba River indicate that daily flows would probably provide suitable passage at low-flow barriers in wet, above-normal, and below-normal hydrologic conditions during the majority of the spring-run migration period (Figure 18). Except for brief periods, flows in dry and critically dry conditions may be marginal for suitable fish passage.
Assessment of Upper Yuba Salmon and Steelhead Migration Barriers and Holding Habitats Page 19
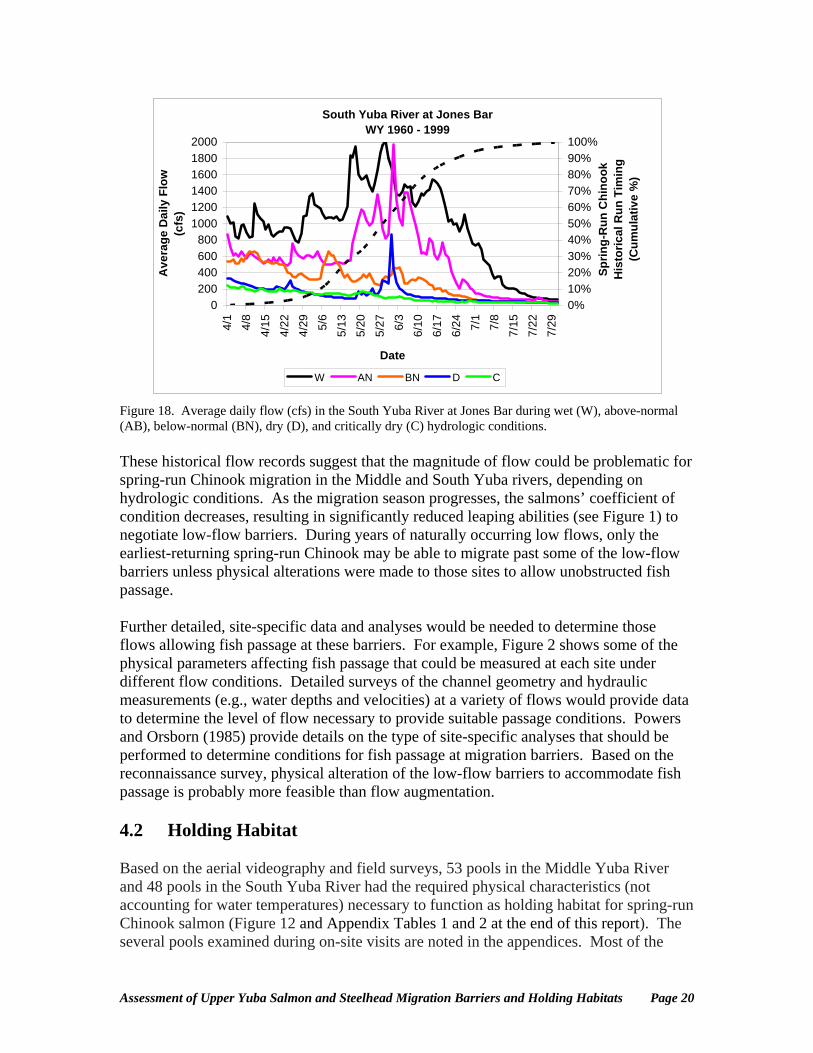
South Yuba River at Jones BarWY 1960 - 1999
0200400600800
100012001400160018002000
4/1
4/8
4/15
4/22
4/29 5/
65/
135/
205/
27 6/3
6/10
6/17
6/24 7/
17/
87/
157/
227/
29
Date
Ave
rage
Dai
ly F
low
(c
fs)
0%10%20%30%40%50%60%70%80%90%100%
Sprin
g-R
un C
hino
ok
His
toric
al R
un T
imin
g (C
umul
ativ
e %
)
W AN BN D C
Figure 18. Average daily flow (cfs) in the South Yuba River at Jones Bar during wet (W), above-normal (AB), below-normal (BN), dry (D), and critically dry (C) hydrologic conditions. These historical flow records suggest that the magnitude of flow could be problematic for spring-run Chinook migration in the Middle and South Yuba rivers, depending on hydrologic conditions. As the migration season progresses, the salmons’ coefficient of condition decreases, resulting in significantly reduced leaping abilities (see Figure 1) to negotiate low-flow barriers. During years of naturally occurring low flows, only the earliest-returning spring-run Chinook may be able to migrate past some of the low-flow barriers unless physical alterations were made to those sites to allow unobstructed fish passage. Further detailed, site-specific data and analyses would be needed to determine those flows allowing fish passage at these barriers. For example, Figure 2 shows some of the physical parameters affecting fish passage that could be measured at each site under different flow conditions. Detailed surveys of the channel geometry and hydraulic measurements (e.g., water depths and velocities) at a variety of flows would provide data to determine the level of flow necessary to provide suitable passage conditions. Powers and Orsborn (1985) provide details on the type of site-specific analyses that should be performed to determine conditions for fish passage at migration barriers. Based on the reconnaissance survey, physical alteration of the low-flow barriers to accommodate fish passage is probably more feasible than flow augmentation. 4.2 Holding Habitat Based on the aerial videography and field surveys, 53 pools in the Middle Yuba River and 48 pools in the South Yuba River had the required physical characteristics (not accounting for water temperatures) necessary to function as holding habitat for spring-run Chinook salmon (Figure 12 and Appendix Tables 1 and 2 at the end of this report). The several pools examined during on-site visits are noted in the appendices. Most of the
Assessment of Upper Yuba Salmon and Steelhead Migration Barriers and Holding Habitats Page 20
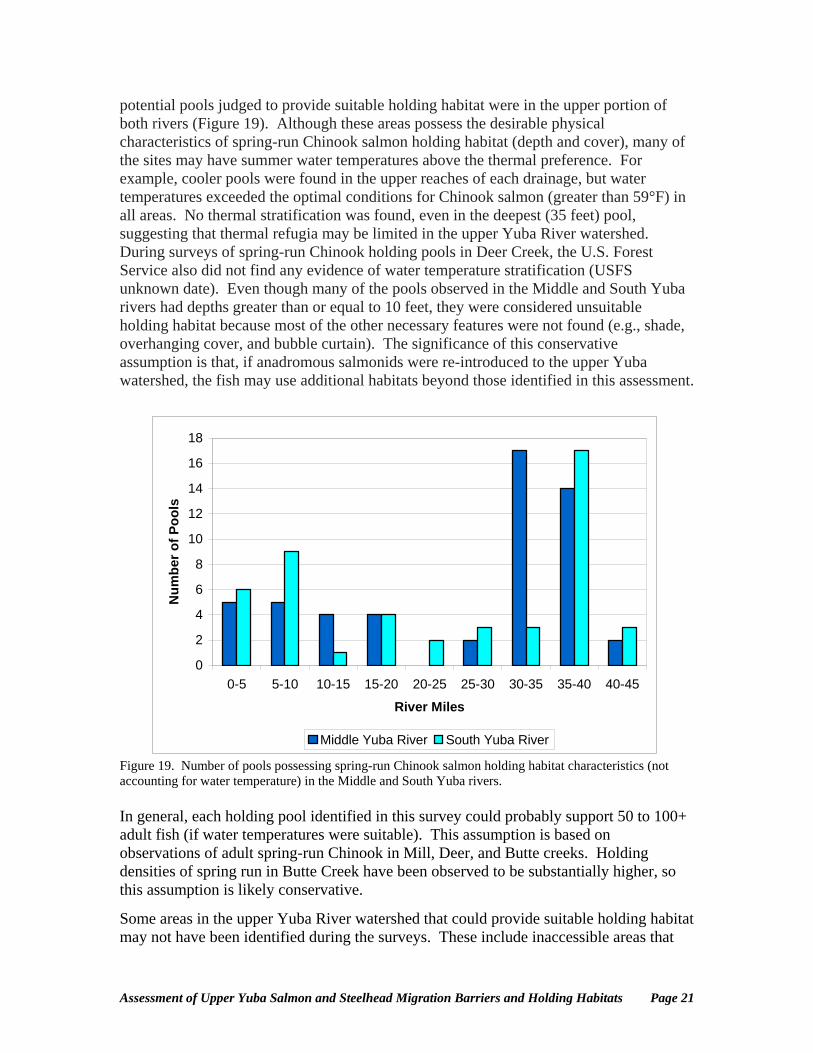
potential pools judged to provide suitable holding habitat were in the upper portion of both rivers (Figure 19). Although these areas possess the desirable physical characteristics of spring-run Chinook salmon holding habitat (depth and cover), many of the sites may have summer water temperatures above the thermal preference. For example, cooler pools were found in the upper reaches of each drainage, but water temperatures exceeded the optimal conditions for Chinook salmon (greater than 59°F) in all areas. No thermal stratification was found, even in the deepest (35 feet) pool, suggesting that thermal refugia may be limited in the upper Yuba River watershed. During surveys of spring-run Chinook holding pools in Deer Creek, the U.S. Forest Service also did not find any evidence of water temperature stratification (USFS unknown date). Even though many of the pools observed in the Middle and South Yuba rivers had depths greater than or equal to 10 feet, they were considered unsuitable holding habitat because most of the other necessary features were not found (e.g., shade, overhanging cover, and bubble curtain). The significance of this conservative assumption is that, if anadromous salmonids were re-introduced to the upper Yuba watershed, the fish may use additional habitats beyond those identified in this assessment.
0
2
4
6
8
10
12
14
16
18
0-5 5-10 10-15 15-20 20-25 25-30 30-35 35-40 40-45
Num
ber o
f Poo
ls
River Miles
Middle Yuba River South Yuba River
Figure 19. Number of pools possessing spring-run Chinook salmon holding habitat characteristics (not accounting for water temperature) in the Middle and South Yuba rivers. In general, each holding pool identified in this survey could probably support 50 to 100+ adult fish (if water temperatures were suitable). This assumption is based on observations of adult spring-run Chinook in Mill, Deer, and Butte creeks. Holding densities of spring run in Butte Creek have been observed to be substantially higher, so this assumption is likely conservative.
Some areas in the upper Yuba River watershed that could provide suitable holding habitat may not have been identified during the surveys. These include inaccessible areas that
Assessment of Upper Yuba Salmon and Steelhead Migration Barriers and Holding Habitats Page 21
could not be adequately observed during the aerial surveys, and areas where physical characteristics would significantly change with increased stream flows. Depending on site-specific conditions, stream flows higher than those occurring during the surveys would be expected to improve habitat attributes, such as water depth and bubble curtains. Therefore, based on the previously stated caveats and absent water temperature limitations, the results presented here should be considered conservative estimates of potential holding habitat for adult spring-run Chinook salmon in the upper Yuba River watershed.
5.0 Literature Cited Airola, D.A. and B.D. Marcotte. 1985. A survey of holding pools for spring-run Chinook salmon in Deer and Mill creeks, 1985. USDA Forest Service, Lassen National Forest, Chester, CA. 10 p.
Barclay, M. 1980. 1980 radio-tagging study of Nooksack spring Chinook. Report to the National Marine Fisheries Service. Grant No. 80-ABH-00032. Nooksack Indian Tribe, Deming, WA. 35 p.
Barclay, M. 2002. Letter from Michael Barclay, Framatome ANP, describing aerial video of the upper Yuba River. November 15, 2002.
Boles, G.L. 1988. Water temperatures effects on Chinook salmon (Oncorhynchus tshawytscha) with emphasis on the Sacramento River, A literature review. California Department of Water Resources. January 1988. 42 p.
California Department of Fish and Game. 1998. A status review of the spring-run Chinook salmon (Oncorhynchus tshawytscha) in the Sacramento River drainage. Report to the Fish and Game Commission. Candidate Species Status Report 98-01. June 1998.
Clay, C.H. 1995. Design of Fishways and Other Fish Facilities. Second Edition. CRC Press, Inc. Boca Raton, FL. 248 p.
Cramer, F.K. and D.F. Hammack. 1952. Salmon research at Deer Creek, California. U.S. Fish and Wildlife Service, Special Scientific Report: Fisheries No. 67. 16 p.
DesLaurier, G. 1991. Report for Klamath National Forest projects. FHR Currents. U.S. Forest Service, R-5 Fish Habitat Relationship Technical Bulletin Number 5. August 1991.
Evans, W.A. and B. Johnston. 1980. Fish migration and fish passage. USDA Forest Service, EM-7100-12, Washington D.C., 63 p. plus appendices.
Fisher, F. 1984. Mill Creek counts. August 7, 1984 memorandum to files. California Department of Fish and Game, Red Bluff, CA. 3 p.
Grimes, J. 1983. Holding habitat of spring-run Chinook salmon (Oncorhynchus tshawytscha) in Deer Creek and Mill Creek, California. Humboldt State University. 23 p.
Assessment of Upper Yuba Salmon and Steelhead Migration Barriers and Holding Habitats Page 22
Hallock, R.J. 1989. Upper Sacramento River steelhead, Oncorhynchus mykiss, 1952 – 1988. Report to the U.S. Fish and Wildlife Service. September 15, 1989. 86 p.
Hallock, R.J. and D.H. Fry. 1967. Five species of salmon, Oncorhynchus, in the Sacramento River, California. Calif. Fish and Game 53:5-22.
Healey, M.C. 1991. Life History of Chinook Salmon (Oncorhynchus tshawytscha). In Pacific Salmon Life Histories. C. Groot and L. Margolis eds. UBC Press, Vancouver. 564 p.
Hinze, J.A. 1959. Annual Report: Nimbus Salmon and Steelhead Hatchery, fiscal year 1957-1958. California Department of Fish and Game Inland Fisheries Division Administrative Report 59-4.
Lisle, T.E. 1989. Sediment transport and resulting deposition in spawning gravels, north coastal California. Water Resources Research 25(6):1303-1319. McFarland, M.C. 2000. Watershed Analysis for Mill, Deer, and Antelope creeks. Appendix E: Anadromous fish habitat: Mill, Deer, and Antelope creek watersheds. Lassen National Forest. Moyle, P.B. 2002. Inland Fishes of California, 2nd edition. University of California Press, Berkeley, California. 502 p. Moyle, P.B., R.M. Yoshiyama, J.E. Williams, and E.D. Wikramanayake. 1995. Fish species of special concern in California. Department of Wildlife and Fisheries Biology, University of California, Davis. Report prepared for the California Department of Fish and Game, Inland Fisheries Division. June 1995. 272 p. Needham, , P.R., H.A. Hanson, and L.P. Parker. 1943. Supplementary report on investigations of fish-salvage problems in relation to Shasta Dam. U.S. Fish and Wildlife Service. Special Scientific Report No. 26. Powers, P.D. and J.F. Orsborn. 1985. Analysis of barriers to upstream fish migration. Final Project Report (Part 4 of 4). Bonneville Power Administration, Portland, OR. 61 p.
Sato, G.M. and P.B. Moyle. 1987. Stream surveys of Deer Creek and Mill Creek, Tehama County, 1986 and 1987, with recommendations for the protection of their drainages and their spring-run Chinook salmon. Department of Wildlife and Fisheries Biology, University of California, Davis. October 13, 1987. 48 p. plus figures, tables, and appendices. U.S. Forest Service. Unknown date. PACFISH in-channel effectiveness monitoring report for Deer, Mill, and Antelope creeks, 1996 – 1999. 27 p. Vogel, D.A. 1983. Evaluation of the Tehama-Colusa Fish Facilities. Cal-Neva Wildlife Transactions. pp. 20-25
Assessment of Upper Yuba Salmon and Steelhead Migration Barriers and Holding Habitats Page 23
Assessment of Upper Yuba Salmon and Steelhead Migration Barriers and Holding Habitats Page 24
Vogel, D.A. 1987a. Estimation of the 1986 spring Chinook salmon run in Mill Creek, California. Report No. FR1/FAO87-12. Fisheries Assistance Office. U.S. Fish and Wildlife Service. Red Bluff, California. 9 p. Vogel, D.A. 1987b. Estimation of the 1986 spring Chinook salmon run in Deer Creek, California. Report No. FR1/FAO87-3. Fisheries Assistance Office. U.S. Fish and Wildlife Service. Red Bluff, California. 10 p. Vogel, D.A. and H. Rectenwald. 1987. Water quality and water quantity needs for chinook salmon production in the Upper Sacramento River. U.S. Fish and Wildlife Service, Exhibit 29, submitted to California State Water Resources Control Board's Bay-Delta Hearings, Sacramento, California. Ward, P.D., T.R. McReynolds, and C.E. Garman. 2004. Butte Creek spring-run Chinook salmon, Oncorhynchus tshawytscha, pre-spawn mortality evaluation, 2003. California Department of Fish and Game Inland Fisheries Administrative Report No. 2004-5. 91 p.
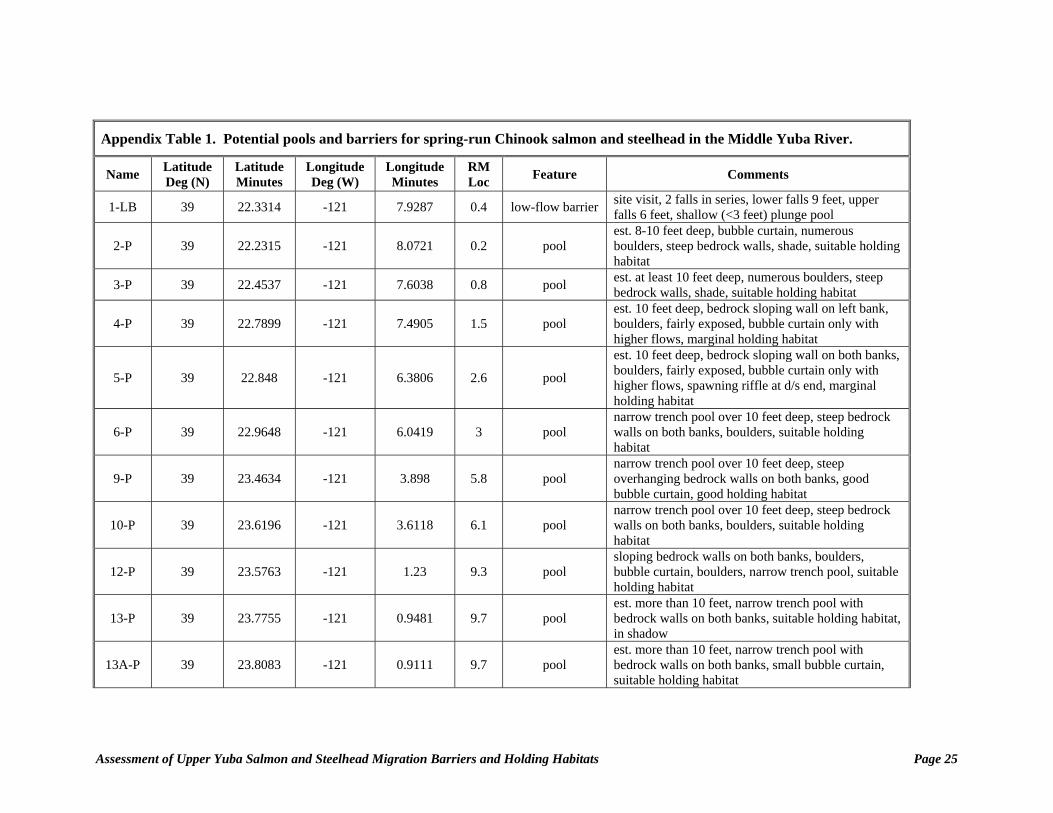
Appendix Table 1. Potential pools and barriers for spring-run Chinook salmon and steelhead in the Middle Yuba River.
Name Latitude Deg (N)
Latitude Minutes
Longitude Deg (W)
Longitude Minutes
RM Loc Feature Comments
1-LB 39 22.3314 -121 7.9287 0.4 low-flow barrier site visit, 2 falls in series, lower falls 9 feet, upper falls 6 feet, shallow (<3 feet) plunge pool
2-P 39 22.2315 -121 8.0721 0.2 pool est. 8-10 feet deep, bubble curtain, numerous boulders, steep bedrock walls, shade, suitable holding habitat
3-P 39 22.4537 -121 7.6038 0.8 pool est. at least 10 feet deep, numerous boulders, steep bedrock walls, shade, suitable holding habitat
4-P 39 22.7899 -121 7.4905 1.5 pool est. 10 feet deep, bedrock sloping wall on left bank, boulders, fairly exposed, bubble curtain only with higher flows, marginal holding habitat
5-P 39 22.848 -121 6.3806 2.6 pool
est. 10 feet deep, bedrock sloping wall on both banks, boulders, fairly exposed, bubble curtain only with higher flows, spawning riffle at d/s end, marginal holding habitat
6-P 39 22.9648 -121 6.0419 3 pool narrow trench pool over 10 feet deep, steep bedrock walls on both banks, boulders, suitable holding habitat
9-P 39 23.4634 -121 3.898 5.8 pool narrow trench pool over 10 feet deep, steep overhanging bedrock walls on both banks, good bubble curtain, good holding habitat
10-P 39 23.6196 -121 3.6118 6.1 pool narrow trench pool over 10 feet deep, steep bedrock walls on both banks, boulders, suitable holding habitat
12-P 39 23.5763 -121 1.23 9.3 pool sloping bedrock walls on both banks, boulders, bubble curtain, boulders, narrow trench pool, suitable holding habitat
13-P 39 23.7755 -121 0.9481 9.7 pool est. more than 10 feet, narrow trench pool with bedrock walls on both banks, suitable holding habitat, in shadow
13A-P 39 23.8083 -121 0.9111 9.7 pool est. more than 10 feet, narrow trench pool with bedrock walls on both banks, small bubble curtain, suitable holding habitat
Assessment of Upper Yuba Salmon and Steelhead Migration Barriers and Holding Habitats Page 25
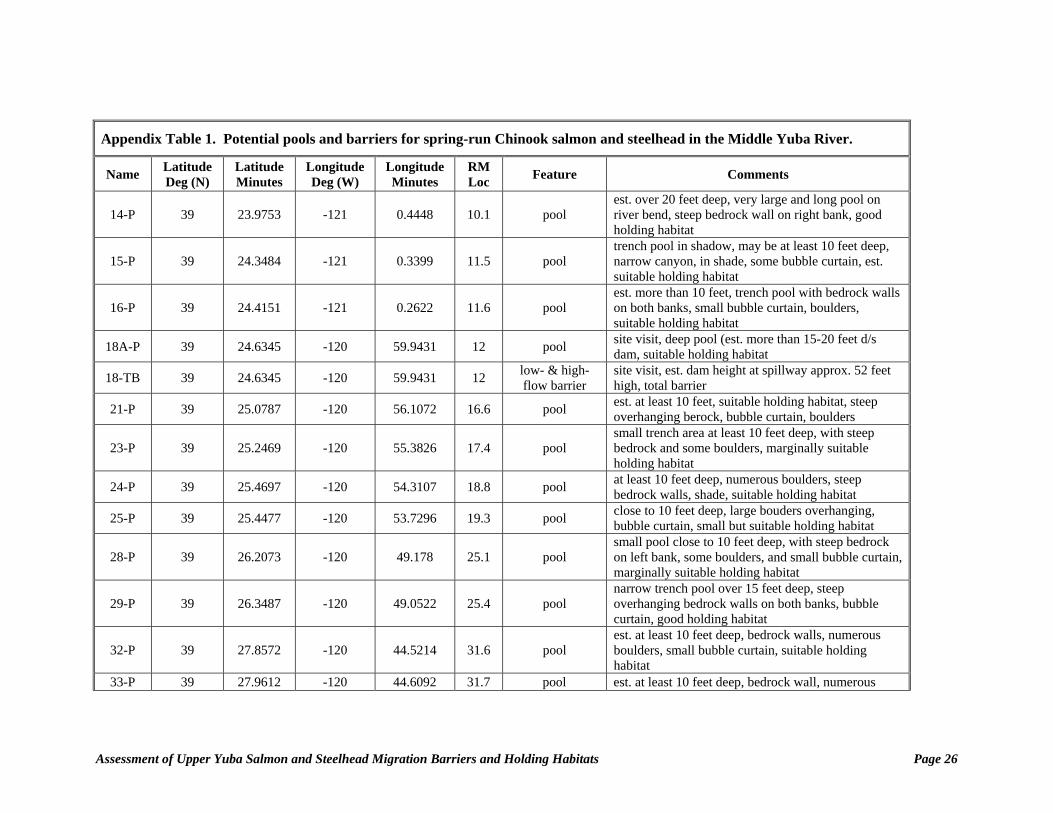
Appendix Table 1. Potential pools and barriers for spring-run Chinook salmon and steelhead in the Middle Yuba River.
Name Latitude Deg (N)
Latitude Minutes
Longitude Deg (W)
Longitude Minutes
RM Loc Feature Comments
14-P 39 23.9753 -121 0.4448 10.1 pool est. over 20 feet deep, very large and long pool on river bend, steep bedrock wall on right bank, good holding habitat
15-P 39 24.3484 -121 0.3399 11.5 pool trench pool in shadow, may be at least 10 feet deep, narrow canyon, in shade, some bubble curtain, est. suitable holding habitat
16-P 39 24.4151 -121 0.2622 11.6 pool est. more than 10 feet, trench pool with bedrock walls on both banks, small bubble curtain, boulders, suitable holding habitat
18A-P 39 24.6345 -120 59.9431 12 pool site visit, deep pool (est. more than 15-20 feet d/s dam, suitable holding habitat
18-TB 39 24.6345 -120 59.9431 12 low- & high-flow barrier
site visit, est. dam height at spillway approx. 52 feet high, total barrier
21-P 39 25.0787 -120 56.1072 16.6 pool est. at least 10 feet, suitable holding habitat, steep overhanging berock, bubble curtain, boulders
23-P 39 25.2469 -120 55.3826 17.4 pool small trench area at least 10 feet deep, with steep bedrock and some boulders, marginally suitable holding habitat
24-P 39 25.4697 -120 54.3107 18.8 pool at least 10 feet deep, numerous boulders, steep bedrock walls, shade, suitable holding habitat
25-P 39 25.4477 -120 53.7296 19.3 pool close to 10 feet deep, large bouders overhanging, bubble curtain, small but suitable holding habitat
28-P 39 26.2073 -120 49.178 25.1 pool small pool close to 10 feet deep, with steep bedrock on left bank, some boulders, and small bubble curtain, marginally suitable holding habitat
29-P 39 26.3487 -120 49.0522 25.4 pool narrow trench pool over 15 feet deep, steep overhanging bedrock walls on both banks, bubble curtain, good holding habitat
32-P 39 27.8572 -120 44.5214 31.6 pool est. at least 10 feet deep, bedrock walls, numerous boulders, small bubble curtain, suitable holding habitat
33-P 39 27.9612 -120 44.6092 31.7 pool est. at least 10 feet deep, bedrock wall, numerous
Assessment of Upper Yuba Salmon and Steelhead Migration Barriers and Holding Habitats Page 26
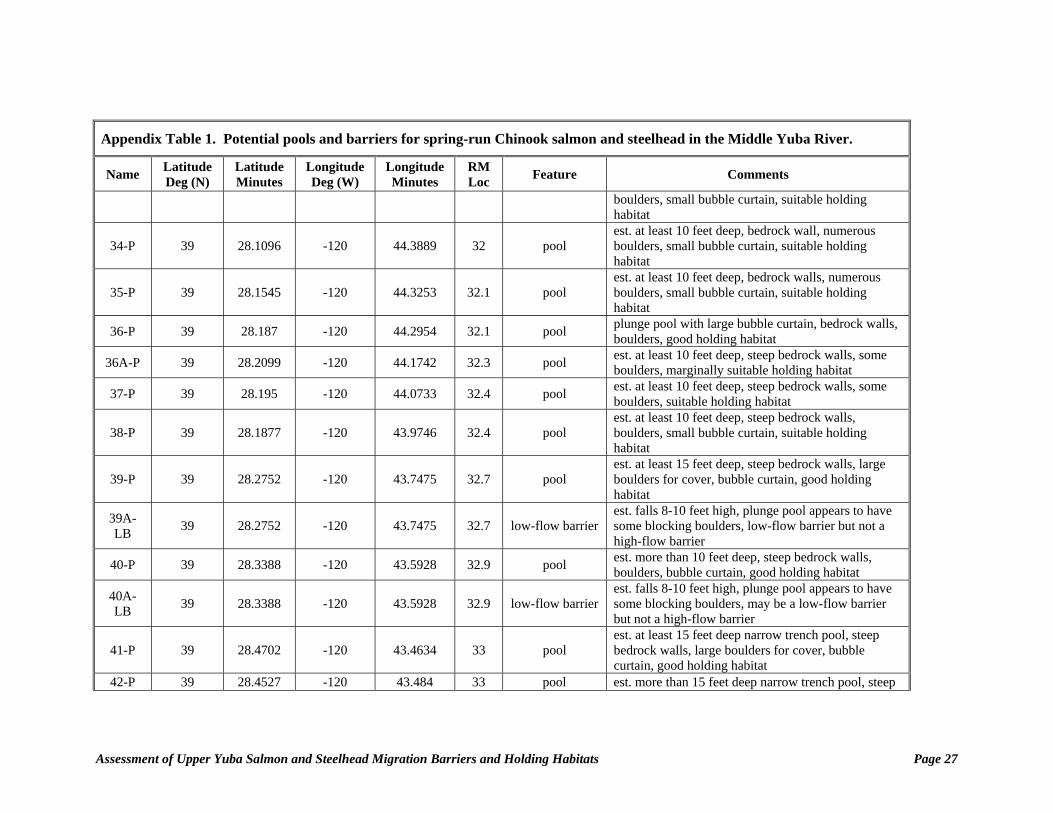
Appendix Table 1. Potential pools and barriers for spring-run Chinook salmon and steelhead in the Middle Yuba River.
Name Latitude Deg (N)
Latitude Minutes
Longitude Deg (W)
Longitude Minutes
RM Loc Feature Comments
boulders, small bubble curtain, suitable holding habitat
34-P 39 28.1096 -120 44.3889 32 pool est. at least 10 feet deep, bedrock wall, numerous boulders, small bubble curtain, suitable holding habitat
35-P 39 28.1545 -120 44.3253 32.1 pool est. at least 10 feet deep, bedrock walls, numerous boulders, small bubble curtain, suitable holding habitat
36-P 39 28.187 -120 44.2954 32.1 pool plunge pool with large bubble curtain, bedrock walls, boulders, good holding habitat
36A-P 39 28.2099 -120 44.1742 32.3 pool est. at least 10 feet deep, steep bedrock walls, some boulders, marginally suitable holding habitat
37-P 39 28.195 -120 44.0733 32.4 pool est. at least 10 feet deep, steep bedrock walls, some boulders, suitable holding habitat
38-P 39 28.1877 -120 43.9746 32.4 pool est. at least 10 feet deep, steep bedrock walls, boulders, small bubble curtain, suitable holding habitat
39-P 39 28.2752 -120 43.7475 32.7 pool est. at least 15 feet deep, steep bedrock walls, large boulders for cover, bubble curtain, good holding habitat
39A-LB 39 28.2752 -120 43.7475 32.7 low-flow barrier
est. falls 8-10 feet high, plunge pool appears to have some blocking boulders, low-flow barrier but not a high-flow barrier
40-P 39 28.3388 -120 43.5928 32.9 pool est. more than 10 feet deep, steep bedrock walls, boulders, bubble curtain, good holding habitat
40A-LB 39 28.3388 -120 43.5928 32.9 low-flow barrier
est. falls 8-10 feet high, plunge pool appears to have some blocking boulders, may be a low-flow barrier but not a high-flow barrier
41-P 39 28.4702 -120 43.4634 33 pool est. at least 15 feet deep narrow trench pool, steep bedrock walls, large boulders for cover, bubble curtain, good holding habitat
42-P 39 28.4527 -120 43.484 33 pool est. more than 15 feet deep narrow trench pool, steep
Assessment of Upper Yuba Salmon and Steelhead Migration Barriers and Holding Habitats Page 27
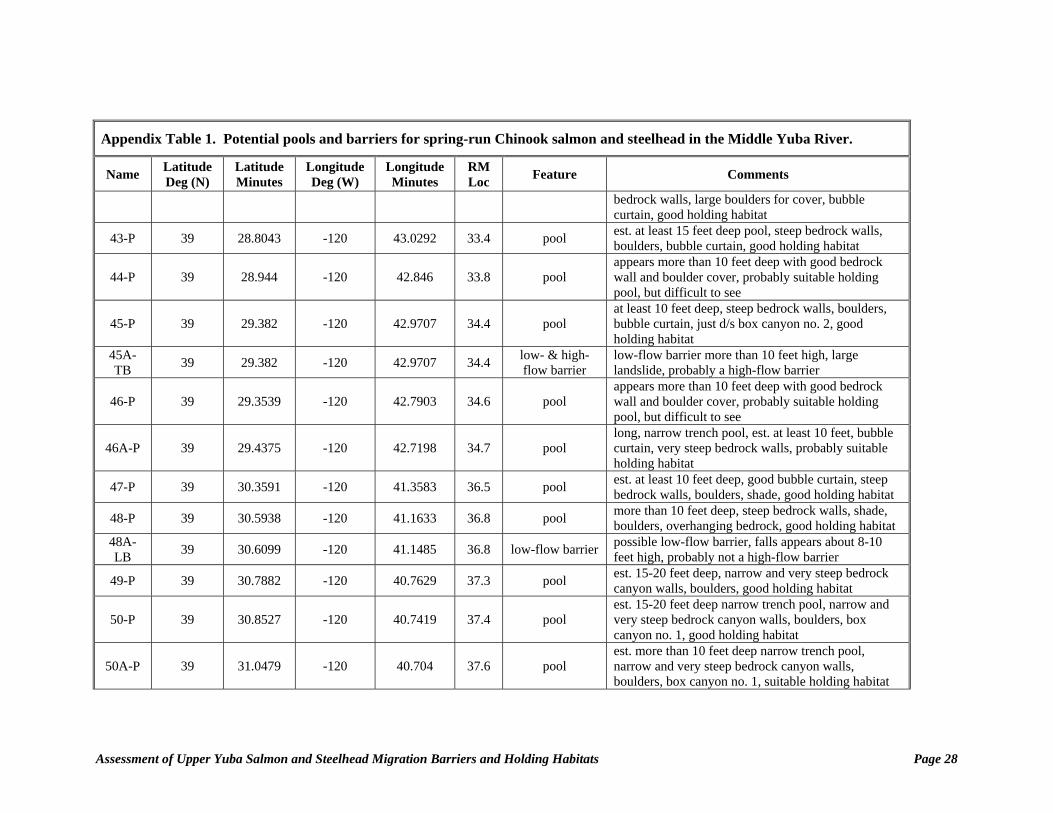
Appendix Table 1. Potential pools and barriers for spring-run Chinook salmon and steelhead in the Middle Yuba River.
Name Latitude Deg (N)
Latitude Minutes
Longitude Deg (W)
Longitude Minutes
RM Loc Feature Comments
bedrock walls, large boulders for cover, bubble curtain, good holding habitat
43-P 39 28.8043 -120 43.0292 33.4 pool est. at least 15 feet deep pool, steep bedrock walls, boulders, bubble curtain, good holding habitat
44-P 39 28.944 -120 42.846 33.8 pool appears more than 10 feet deep with good bedrock wall and boulder cover, probably suitable holding pool, but difficult to see
45-P 39 29.382 -120 42.9707 34.4 pool at least 10 feet deep, steep bedrock walls, boulders, bubble curtain, just d/s box canyon no. 2, good holding habitat
45A-TB 39 29.382 -120 42.9707 34.4 low- & high-
flow barrier low-flow barrier more than 10 feet high, large landslide, probably a high-flow barrier
46-P 39 29.3539 -120 42.7903 34.6 pool appears more than 10 feet deep with good bedrock wall and boulder cover, probably suitable holding pool, but difficult to see
46A-P 39 29.4375 -120 42.7198 34.7 pool long, narrow trench pool, est. at least 10 feet, bubble curtain, very steep bedrock walls, probably suitable holding habitat
47-P 39 30.3591 -120 41.3583 36.5 pool est. at least 10 feet deep, good bubble curtain, steep bedrock walls, boulders, shade, good holding habitat
48-P 39 30.5938 -120 41.1633 36.8 pool more than 10 feet deep, steep bedrock walls, shade, boulders, overhanging bedrock, good holding habitat
48A-LB 39 30.6099 -120 41.1485 36.8 low-flow barrier possible low-flow barrier, falls appears about 8-10
feet high, probably not a high-flow barrier
49-P 39 30.7882 -120 40.7629 37.3 pool est. 15-20 feet deep, narrow and very steep bedrock canyon walls, boulders, good holding habitat
50-P 39 30.8527 -120 40.7419 37.4 pool est. 15-20 feet deep narrow trench pool, narrow and very steep bedrock canyon walls, boulders, box canyon no. 1, good holding habitat
50A-P 39 31.0479 -120 40.704 37.6 pool est. more than 10 feet deep narrow trench pool, narrow and very steep bedrock canyon walls, boulders, box canyon no. 1, suitable holding habitat
Assessment of Upper Yuba Salmon and Steelhead Migration Barriers and Holding Habitats Page 28
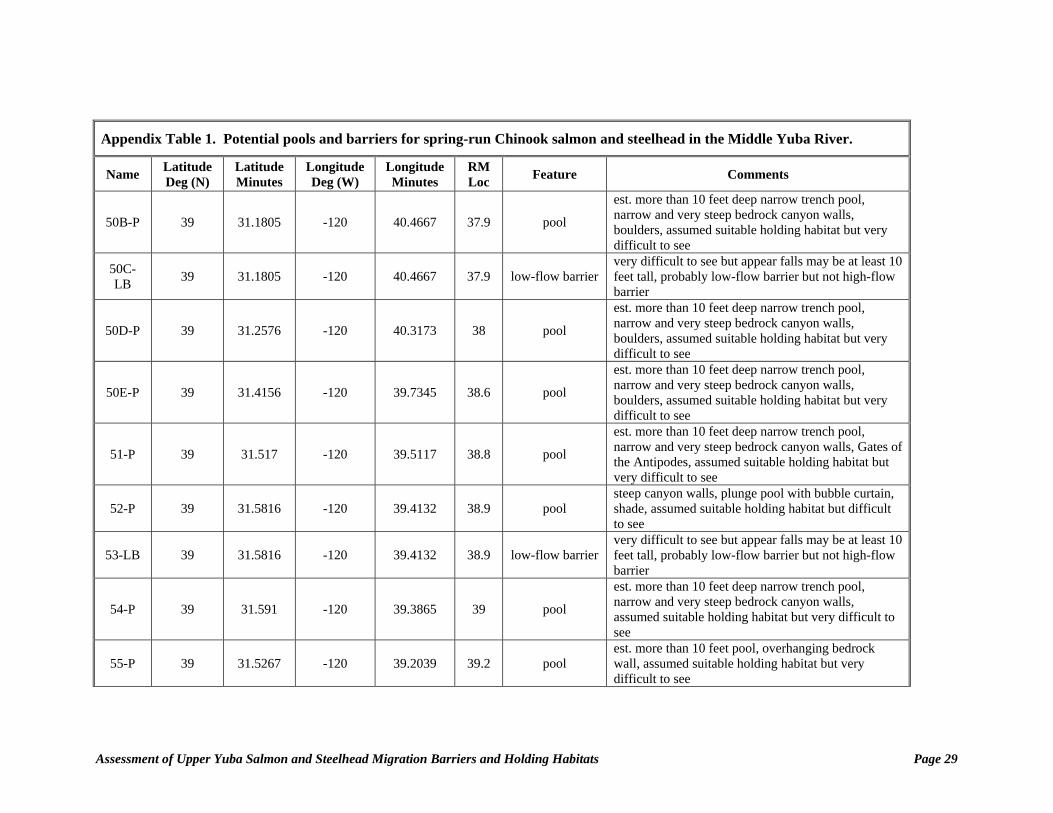
Appendix Table 1. Potential pools and barriers for spring-run Chinook salmon and steelhead in the Middle Yuba River.
Name Latitude Deg (N)
Latitude Minutes
Longitude Deg (W)
Longitude Minutes
RM Loc Feature Comments
50B-P 39 31.1805 -120 40.4667 37.9 pool
est. more than 10 feet deep narrow trench pool, narrow and very steep bedrock canyon walls, boulders, assumed suitable holding habitat but very difficult to see
50C-LB 39 31.1805 -120 40.4667 37.9 low-flow barrier
very difficult to see but appear falls may be at least 10 feet tall, probably low-flow barrier but not high-flow barrier
50D-P 39 31.2576 -120 40.3173 38 pool
est. more than 10 feet deep narrow trench pool, narrow and very steep bedrock canyon walls, boulders, assumed suitable holding habitat but very difficult to see
50E-P 39 31.4156 -120 39.7345 38.6 pool
est. more than 10 feet deep narrow trench pool, narrow and very steep bedrock canyon walls, boulders, assumed suitable holding habitat but very difficult to see
51-P 39 31.517 -120 39.5117 38.8 pool
est. more than 10 feet deep narrow trench pool, narrow and very steep bedrock canyon walls, Gates of the Antipodes, assumed suitable holding habitat but very difficult to see
52-P 39 31.5816 -120 39.4132 38.9 pool steep canyon walls, plunge pool with bubble curtain, shade, assumed suitable holding habitat but difficult to see
53-LB 39 31.5816 -120 39.4132 38.9 low-flow barrier very difficult to see but appear falls may be at least 10 feet tall, probably low-flow barrier but not high-flow barrier
54-P 39 31.591 -120 39.3865 39 pool
est. more than 10 feet deep narrow trench pool, narrow and very steep bedrock canyon walls, assumed suitable holding habitat but very difficult to see
55-P 39 31.5267 -120 39.2039 39.2 pool est. more than 10 feet pool, overhanging bedrock wall, assumed suitable holding habitat but very difficult to see
Assessment of Upper Yuba Salmon and Steelhead Migration Barriers and Holding Habitats Page 29
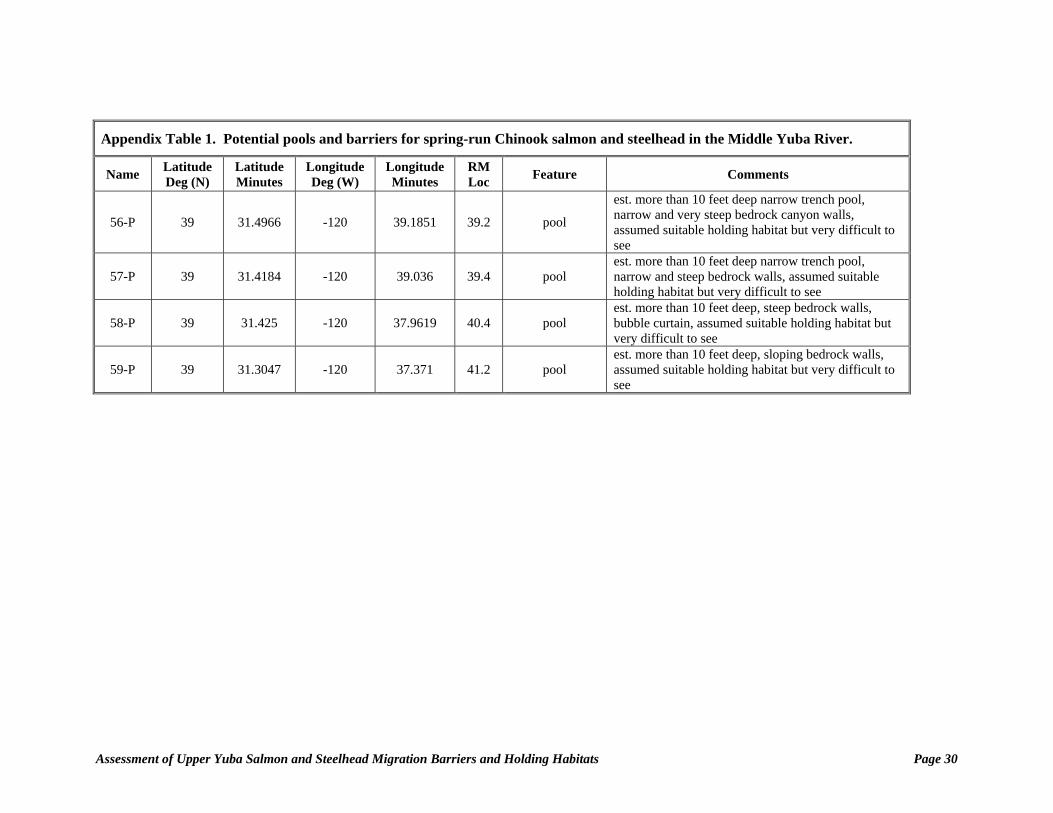
Appendix Table 1. Potential pools and barriers for spring-run Chinook salmon and steelhead in the Middle Yuba River.
Name Latitude Deg (N)
Latitude Minutes
Longitude Deg (W)
Longitude Minutes
RM Loc Feature Comments
56-P 39 31.4966 -120 39.1851 39.2 pool
est. more than 10 feet deep narrow trench pool, narrow and very steep bedrock canyon walls, assumed suitable holding habitat but very difficult to see
57-P 39 31.4184 -120 39.036 39.4 pool est. more than 10 feet deep narrow trench pool, narrow and steep bedrock walls, assumed suitable holding habitat but very difficult to see
58-P 39 31.425 -120 37.9619 40.4 pool est. more than 10 feet deep, steep bedrock walls, bubble curtain, assumed suitable holding habitat but very difficult to see
59-P 39 31.3047 -120 37.371 41.2 pool est. more than 10 feet deep, sloping bedrock walls, assumed suitable holding habitat but very difficult to see
Assessment of Upper Yuba Salmon and Steelhead Migration Barriers and Holding Habitats Page 30
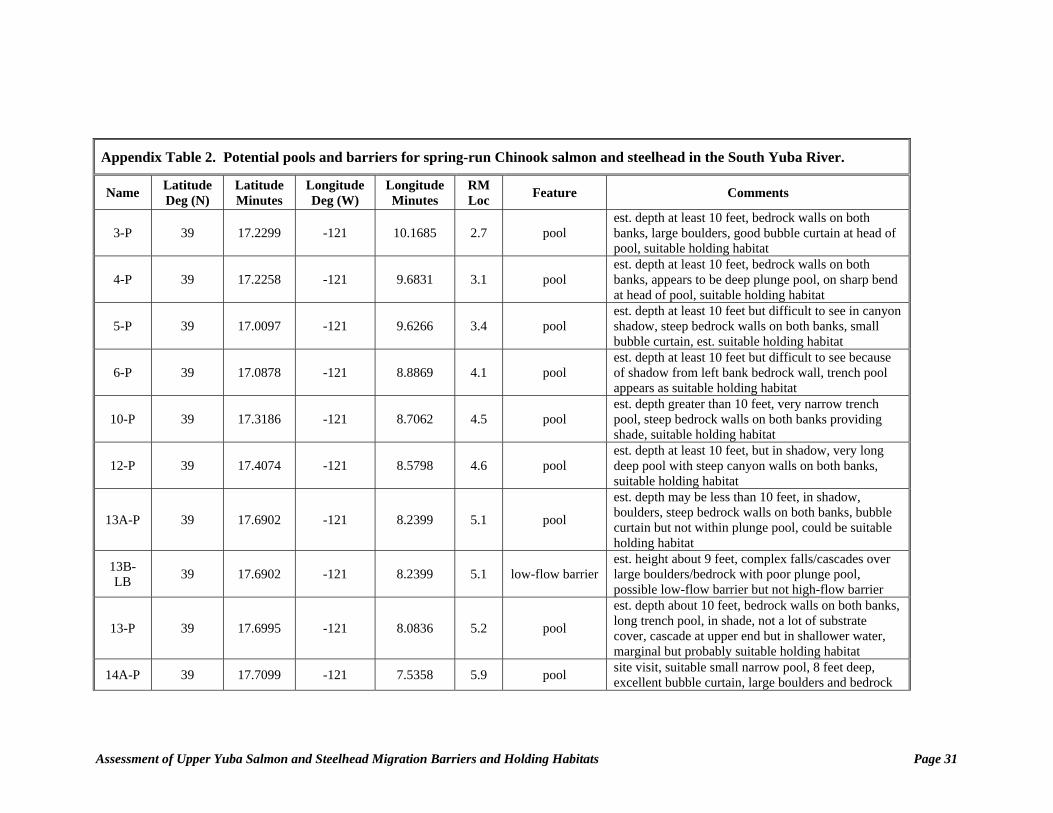
Appendix Table 2. Potential pools and barriers for spring-run Chinook salmon and steelhead in the South Yuba River.
Name Latitude Deg (N)
Latitude Minutes
Longitude Deg (W)
Longitude Minutes
RM Loc Feature Comments
3-P 39 17.2299 -121 10.1685 2.7 pool est. depth at least 10 feet, bedrock walls on both banks, large boulders, good bubble curtain at head of pool, suitable holding habitat
4-P 39 17.2258 -121 9.6831 3.1 pool est. depth at least 10 feet, bedrock walls on both banks, appears to be deep plunge pool, on sharp bend at head of pool, suitable holding habitat
5-P 39 17.0097 -121 9.6266 3.4 pool est. depth at least 10 feet but difficult to see in canyon shadow, steep bedrock walls on both banks, small bubble curtain, est. suitable holding habitat
6-P 39 17.0878 -121 8.8869 4.1 pool est. depth at least 10 feet but difficult to see because of shadow from left bank bedrock wall, trench pool appears as suitable holding habitat
10-P 39 17.3186 -121 8.7062 4.5 pool est. depth greater than 10 feet, very narrow trench pool, steep bedrock walls on both banks providing shade, suitable holding habitat
12-P 39 17.4074 -121 8.5798 4.6 pool est. depth at least 10 feet, but in shadow, very long deep pool with steep canyon walls on both banks, suitable holding habitat
13A-P 39 17.6902 -121 8.2399 5.1 pool
est. depth may be less than 10 feet, in shadow, boulders, steep bedrock walls on both banks, bubble curtain but not within plunge pool, could be suitable holding habitat
13B-LB 39 17.6902 -121 8.2399 5.1 low-flow barrier
est. height about 9 feet, complex falls/cascades over large boulders/bedrock with poor plunge pool, possible low-flow barrier but not high-flow barrier
13-P 39 17.6995 -121 8.0836 5.2 pool
est. depth about 10 feet, bedrock walls on both banks, long trench pool, in shade, not a lot of substrate cover, cascade at upper end but in shallower water, marginal but probably suitable holding habitat
14A-P 39 17.7099 -121 7.5358 5.9 pool site visit, suitable small narrow pool, 8 feet deep, excellent bubble curtain, large boulders and bedrock
Assessment of Upper Yuba Salmon and Steelhead Migration Barriers and Holding Habitats Page 31
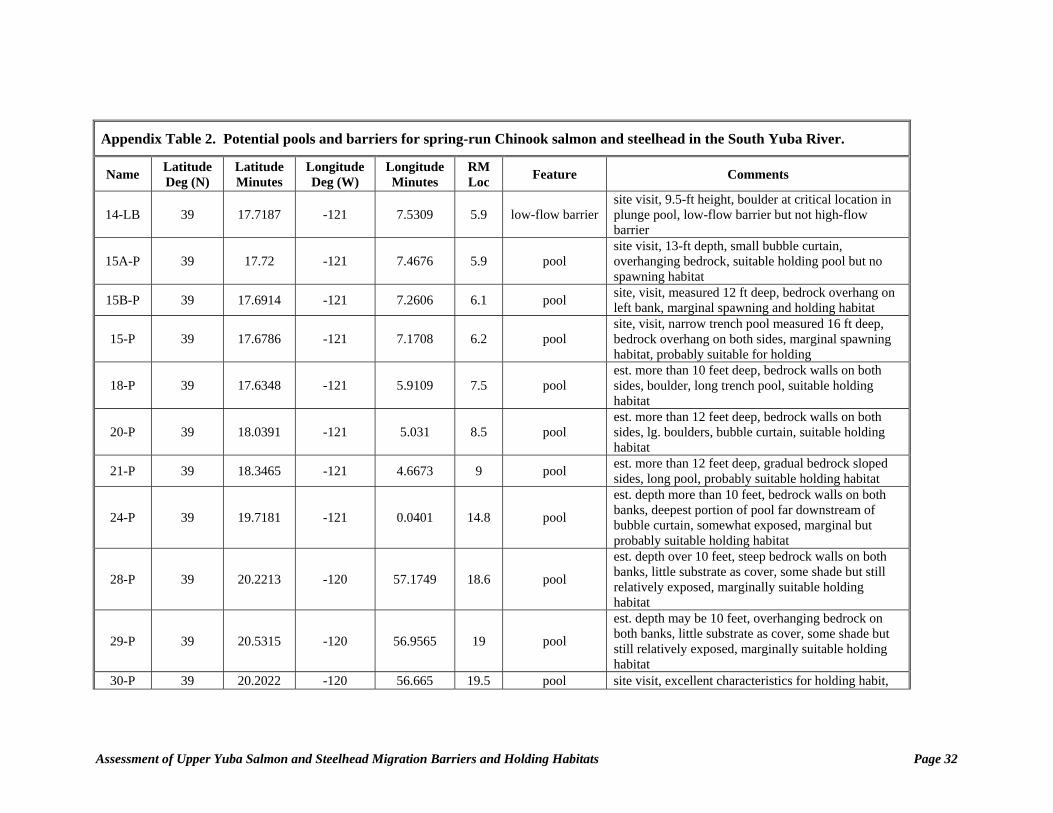
Appendix Table 2. Potential pools and barriers for spring-run Chinook salmon and steelhead in the South Yuba River.
Name Latitude Deg (N)
Latitude Minutes
Longitude Deg (W)
Longitude Minutes
RM Loc Feature Comments
14-LB 39 17.7187 -121 7.5309 5.9 low-flow barrier site visit, 9.5-ft height, boulder at critical location in plunge pool, low-flow barrier but not high-flow barrier
15A-P 39 17.72 -121 7.4676 5.9 pool site visit, 13-ft depth, small bubble curtain, overhanging bedrock, suitable holding pool but no spawning habitat
15B-P 39 17.6914 -121 7.2606 6.1 pool site, visit, measured 12 ft deep, bedrock overhang on left bank, marginal spawning and holding habitat
15-P 39 17.6786 -121 7.1708 6.2 pool site, visit, narrow trench pool measured 16 ft deep, bedrock overhang on both sides, marginal spawning habitat, probably suitable for holding
18-P 39 17.6348 -121 5.9109 7.5 pool est. more than 10 feet deep, bedrock walls on both sides, boulder, long trench pool, suitable holding habitat
20-P 39 18.0391 -121 5.031 8.5 pool est. more than 12 feet deep, bedrock walls on both sides, lg. boulders, bubble curtain, suitable holding habitat
21-P 39 18.3465 -121 4.6673 9 pool est. more than 12 feet deep, gradual bedrock sloped sides, long pool, probably suitable holding habitat
24-P 39 19.7181 -121 0.0401 14.8 pool
est. depth more than 10 feet, bedrock walls on both banks, deepest portion of pool far downstream of bubble curtain, somewhat exposed, marginal but probably suitable holding habitat
28-P 39 20.2213 -120 57.1749 18.6 pool
est. depth over 10 feet, steep bedrock walls on both banks, little substrate as cover, some shade but still relatively exposed, marginally suitable holding habitat
29-P 39 20.5315 -120 56.9565 19 pool
est. depth may be 10 feet, overhanging bedrock on both banks, little substrate as cover, some shade but still relatively exposed, marginally suitable holding habitat
30-P 39 20.2022 -120 56.665 19.5 pool site visit, excellent characteristics for holding habit,
Assessment of Upper Yuba Salmon and Steelhead Migration Barriers and Holding Habitats Page 32
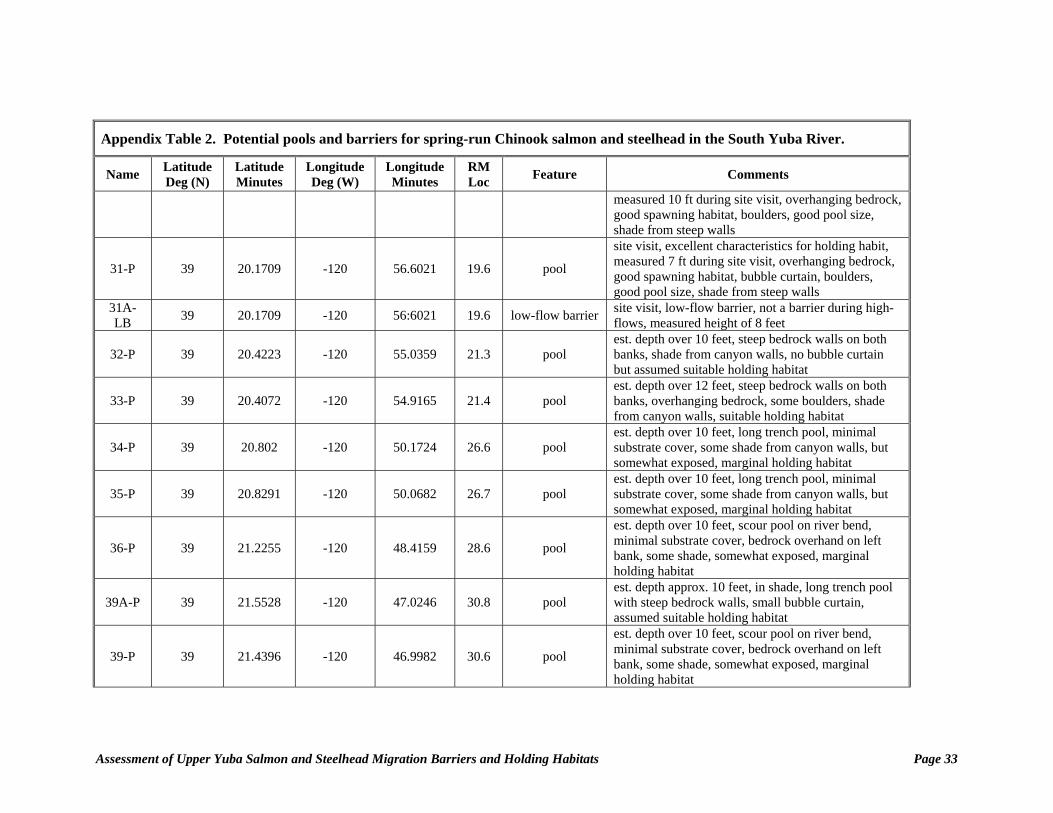
Appendix Table 2. Potential pools and barriers for spring-run Chinook salmon and steelhead in the South Yuba River.
Name Latitude Deg (N)
Latitude Minutes
Longitude Deg (W)
Longitude Minutes
RM Loc Feature Comments
measured 10 ft during site visit, overhanging bedrock, good spawning habitat, boulders, good pool size, shade from steep walls
31-P 39 20.1709 -120 56.6021 19.6 pool
site visit, excellent characteristics for holding habit, measured 7 ft during site visit, overhanging bedrock, good spawning habitat, bubble curtain, boulders, good pool size, shade from steep walls
31A-LB 39 20.1709 -120 56:6021 19.6 low-flow barrier site visit, low-flow barrier, not a barrier during high-
flows, measured height of 8 feet
32-P 39 20.4223 -120 55.0359 21.3 pool est. depth over 10 feet, steep bedrock walls on both banks, shade from canyon walls, no bubble curtain but assumed suitable holding habitat
33-P 39 20.4072 -120 54.9165 21.4 pool est. depth over 12 feet, steep bedrock walls on both banks, overhanging bedrock, some boulders, shade from canyon walls, suitable holding habitat
34-P 39 20.802 -120 50.1724 26.6 pool est. depth over 10 feet, long trench pool, minimal substrate cover, some shade from canyon walls, but somewhat exposed, marginal holding habitat
35-P 39 20.8291 -120 50.0682 26.7 pool est. depth over 10 feet, long trench pool, minimal substrate cover, some shade from canyon walls, but somewhat exposed, marginal holding habitat
36-P 39 21.2255 -120 48.4159 28.6 pool
est. depth over 10 feet, scour pool on river bend, minimal substrate cover, bedrock overhand on left bank, some shade, somewhat exposed, marginal holding habitat
39A-P 39 21.5528 -120 47.0246 30.8 pool est. depth approx. 10 feet, in shade, long trench pool with steep bedrock walls, small bubble curtain, assumed suitable holding habitat
39-P 39 21.4396 -120 46.9982 30.6 pool
est. depth over 10 feet, scour pool on river bend, minimal substrate cover, bedrock overhand on left bank, some shade, somewhat exposed, marginal holding habitat
Assessment of Upper Yuba Salmon and Steelhead Migration Barriers and Holding Habitats Page 33
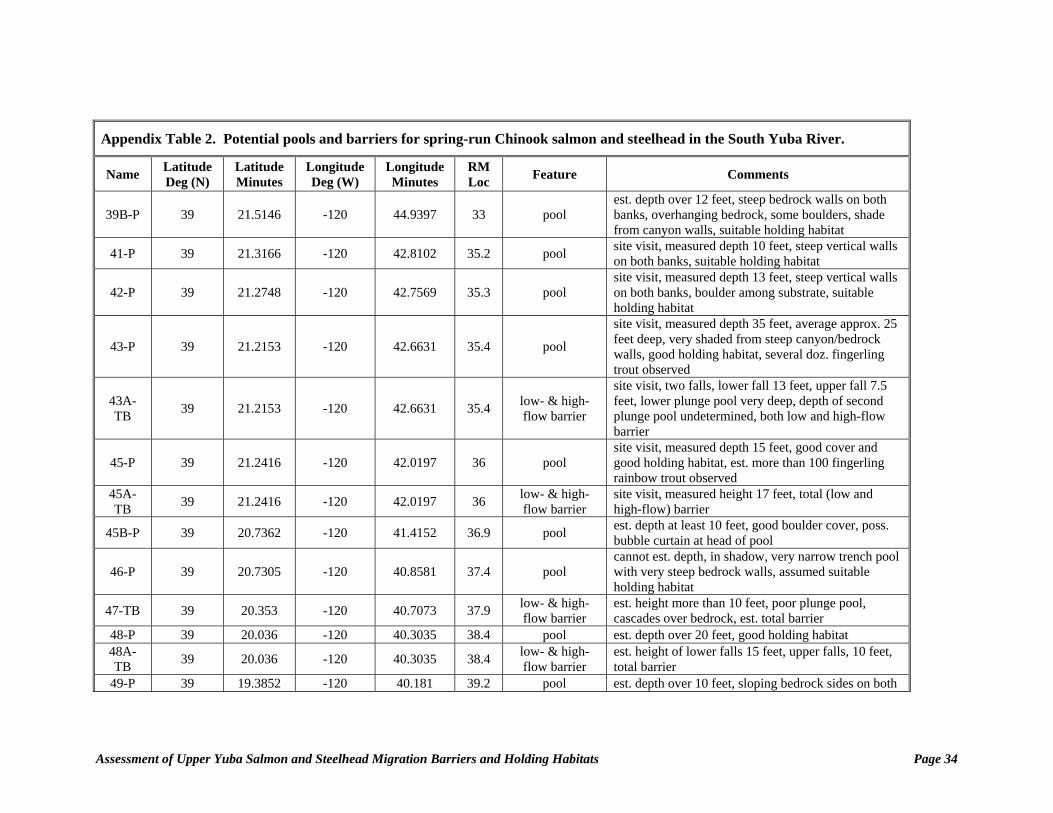
Appendix Table 2. Potential pools and barriers for spring-run Chinook salmon and steelhead in the South Yuba River.
Name Latitude Deg (N)
Latitude Minutes
Longitude Deg (W)
Longitude Minutes
RM Loc Feature Comments
39B-P 39 21.5146 -120 44.9397 33 pool est. depth over 12 feet, steep bedrock walls on both banks, overhanging bedrock, some boulders, shade from canyon walls, suitable holding habitat
41-P 39 21.3166 -120 42.8102 35.2 pool site visit, measured depth 10 feet, steep vertical walls on both banks, suitable holding habitat
42-P 39 21.2748 -120 42.7569 35.3 pool site visit, measured depth 13 feet, steep vertical walls on both banks, boulder among substrate, suitable holding habitat
43-P 39 21.2153 -120 42.6631 35.4 pool
site visit, measured depth 35 feet, average approx. 25 feet deep, very shaded from steep canyon/bedrock walls, good holding habitat, several doz. fingerling trout observed
43A-TB 39 21.2153 -120 42.6631 35.4 low- & high-
flow barrier
site visit, two falls, lower fall 13 feet, upper fall 7.5 feet, lower plunge pool very deep, depth of second plunge pool undetermined, both low and high-flow barrier
45-P 39 21.2416 -120 42.0197 36 pool site visit, measured depth 15 feet, good cover and good holding habitat, est. more than 100 fingerling rainbow trout observed
45A-TB 39 21.2416 -120 42.0197 36 low- & high-
flow barrier site visit, measured height 17 feet, total (low and high-flow) barrier
45B-P 39 20.7362 -120 41.4152 36.9 pool est. depth at least 10 feet, good boulder cover, poss. bubble curtain at head of pool
46-P 39 20.7305 -120 40.8581 37.4 pool cannot est. depth, in shadow, very narrow trench pool with very steep bedrock walls, assumed suitable holding habitat
47-TB 39 20.353 -120 40.7073 37.9 low- & high-flow barrier
est. height more than 10 feet, poor plunge pool, cascades over bedrock, est. total barrier
48-P 39 20.036 -120 40.3035 38.4 pool est. depth over 20 feet, good holding habitat 48A-TB 39 20.036 -120 40.3035 38.4 low- & high-
flow barrier est. height of lower falls 15 feet, upper falls, 10 feet, total barrier
49-P 39 19.3852 -120 40.181 39.2 pool est. depth over 10 feet, sloping bedrock sides on both
Assessment of Upper Yuba Salmon and Steelhead Migration Barriers and Holding Habitats Page 34
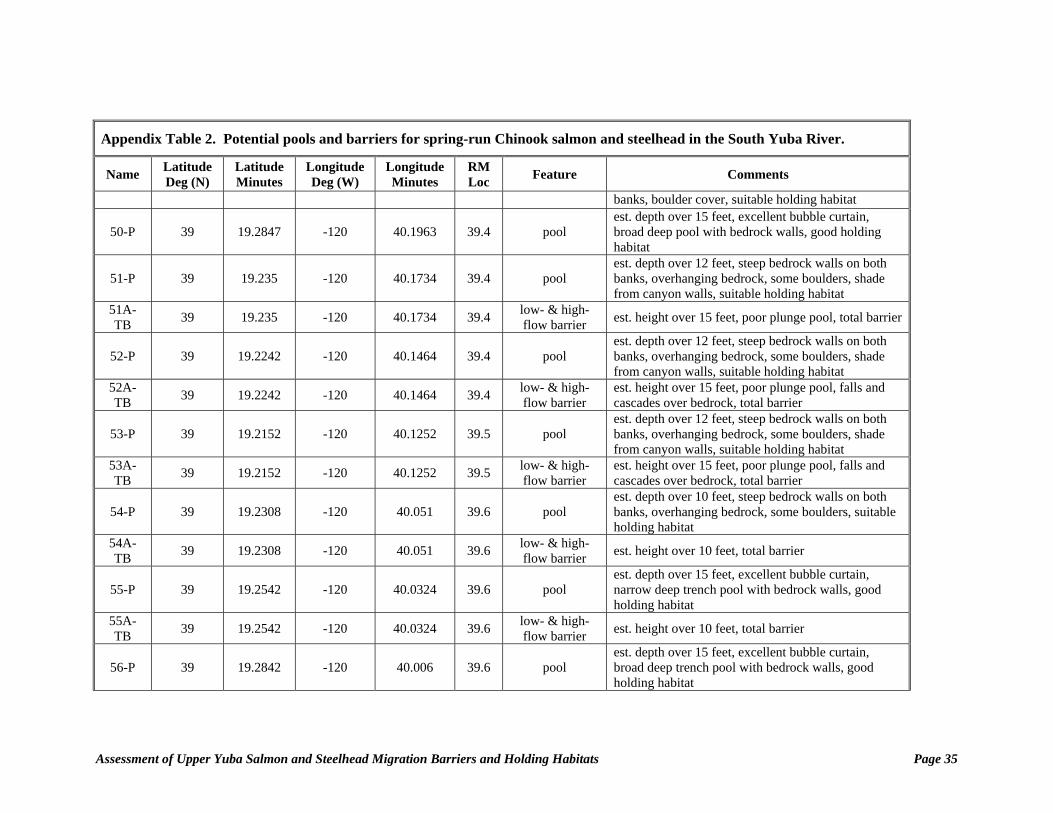
Appendix Table 2. Potential pools and barriers for spring-run Chinook salmon and steelhead in the South Yuba River.
Name Latitude Deg (N)
Latitude Minutes
Longitude Deg (W)
Longitude Minutes
RM Loc Feature Comments
banks, boulder cover, suitable holding habitat
50-P 39 19.2847 -120 40.1963 39.4 pool est. depth over 15 feet, excellent bubble curtain, broad deep pool with bedrock walls, good holding habitat
51-P 39 19.235 -120 40.1734 39.4 pool est. depth over 12 feet, steep bedrock walls on both banks, overhanging bedrock, some boulders, shade from canyon walls, suitable holding habitat
51A-TB 39 19.235 -120 40.1734 39.4 low- & high-
flow barrier est. height over 15 feet, poor plunge pool, total barrier
52-P 39 19.2242 -120 40.1464 39.4 pool est. depth over 12 feet, steep bedrock walls on both banks, overhanging bedrock, some boulders, shade from canyon walls, suitable holding habitat
52A-TB 39 19.2242 -120 40.1464 39.4 low- & high-
flow barrier est. height over 15 feet, poor plunge pool, falls and cascades over bedrock, total barrier
53-P 39 19.2152 -120 40.1252 39.5 pool est. depth over 12 feet, steep bedrock walls on both banks, overhanging bedrock, some boulders, shade from canyon walls, suitable holding habitat
53A-TB 39 19.2152 -120 40.1252 39.5 low- & high-
flow barrier est. height over 15 feet, poor plunge pool, falls and cascades over bedrock, total barrier
54-P 39 19.2308 -120 40.051 39.6 pool est. depth over 10 feet, steep bedrock walls on both banks, overhanging bedrock, some boulders, suitable holding habitat
54A-TB 39 19.2308 -120 40.051 39.6 low- & high-
flow barrier est. height over 10 feet, total barrier
55-P 39 19.2542 -120 40.0324 39.6 pool est. depth over 15 feet, excellent bubble curtain, narrow deep trench pool with bedrock walls, good holding habitat
55A-TB 39 19.2542 -120 40.0324 39.6 low- & high-
flow barrier est. height over 10 feet, total barrier
56-P 39 19.2842 -120 40.006 39.6 pool est. depth over 15 feet, excellent bubble curtain, broad deep trench pool with bedrock walls, good holding habitat
Assessment of Upper Yuba Salmon and Steelhead Migration Barriers and Holding Habitats Page 35
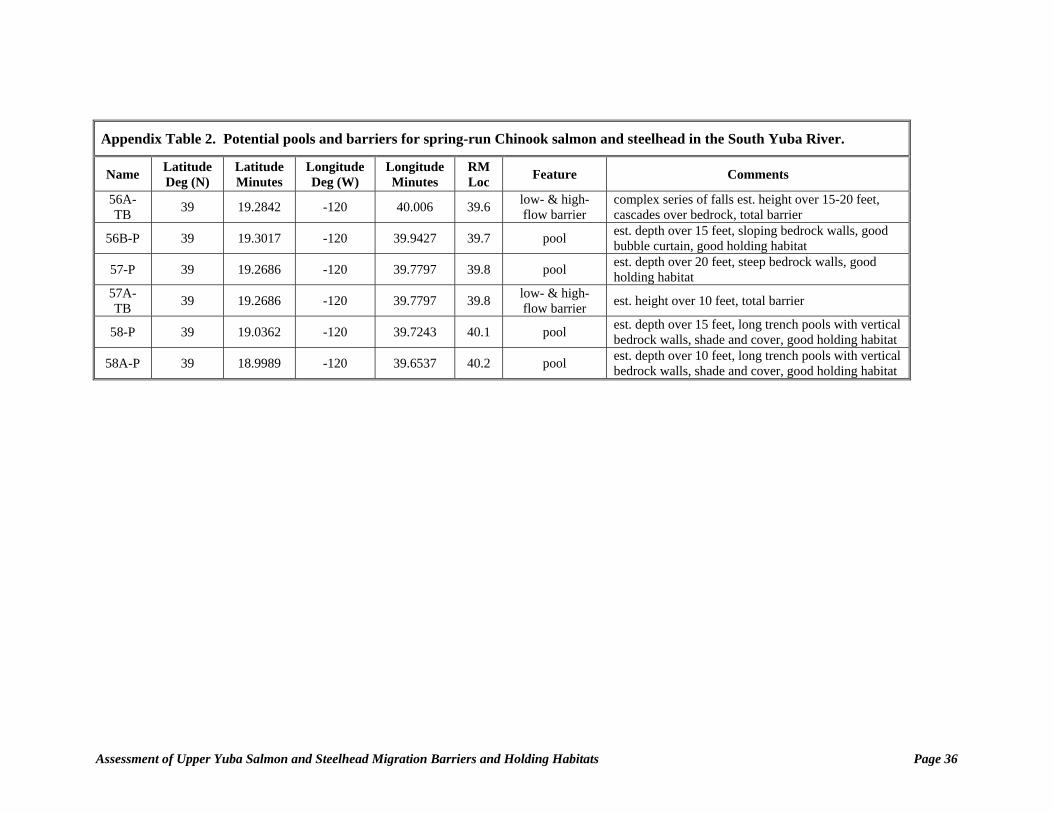
Assessment of Upper Yuba Salmon and Steelhead Migration Barriers and Holding Habitats Page 36
Appendix Table 2. Potential pools and barriers for spring-run Chinook salmon and steelhead in the South Yuba River.
Name Latitude Deg (N)
Latitude Minutes
Longitude Deg (W)
Longitude Minutes
RM Loc Feature Comments
56A-TB 39 19.2842 -120 40.006 39.6 low- & high-
flow barrier complex series of falls est. height over 15-20 feet, cascades over bedrock, total barrier
56B-P 39 19.3017 -120 39.9427 39.7 pool est. depth over 15 feet, sloping bedrock walls, good bubble curtain, good holding habitat
57-P 39 19.2686 -120 39.7797 39.8 pool est. depth over 20 feet, steep bedrock walls, good holding habitat
57A-TB 39 19.2686 -120 39.7797 39.8 low- & high-
flow barrier est. height over 10 feet, total barrier
58-P 39 19.0362 -120 39.7243 40.1 pool est. depth over 15 feet, long trench pools with vertical bedrock walls, shade and cover, good holding habitat
58A-P 39 18.9989 -120 39.6537 40.2 pool est. depth over 10 feet, long trench pools with vertical bedrock walls, shade and cover, good holding habitat

APPENDIX D
Spawning Habitat Evaluation
T E C H N I C A L M E M O R A N D U M
Spawning Habitat Evaluation PREPARED FOR: Upper Yuba River Studies Program
PREPARED BY: Neil Nikirk, CH2M HILL/SAC Carl Mesick, U.S. Fish and Wildlife Service
DATE: June 25, 2006
Introduction The adequacy of spawning habitat above Englebright Dam is an important consideration in evaluating the feasibility of introducing Chinook salmon and steelhead to the upper Yuba River. Accordingly, members of the habitat study team inventoried spawning habitat and conditions in the upper Yuba River watershed to document the location, extent, and quality of potential spawning areas. This technical memorandum describes the methods used to identify potential spawning habitat and the criteria for determining the quality of that habitat. It also presents results of the spawning habitat inventory, including the location and quality of potential spawning habitat in the upper Yuba River, and the number of Chinook salmon and steelhead redds that could be supported in the study area.
Characteristics of Salmonid Spawning Habitat Both Chinook salmon and steelhead typically spawn at the downstream end of pools. Although other areas may occasionally be used for spawning (for example, shallow runs and pool heads), pool tails with adjacent deep water for refuge represent the most likely spawning areas (Barnhart 1991, CDFG 1998). Spawning habitat for Chinook salmon and steelhead include the following key characteristics:
• Adjacent pool habitat with sufficient depth to provide refuge
• Gravel small enough to be moved by the fish during redd construction
• Sufficient depth of suitably sized gravel
• A minimal amount of fine particles that would otherwise suffocate or entomb developing eggs and alevins in the redd
• Sufficient depth and flow of water (velocity) over the gravel bed
• Clean (non-turbid) intragravel flow
• Cool water temperatures
Assessment Approach The habitat study team initially identified locations of potential spawning habitat for Chinook salmon and steelhead through low-altitude aerial videography taken in October 2002. The initial examination of the aerial video indicated that there were over 400 potential spawning
WB042006003SAC/175239/061780006 (APPENDIX D.DOC) 1 175239.10.05
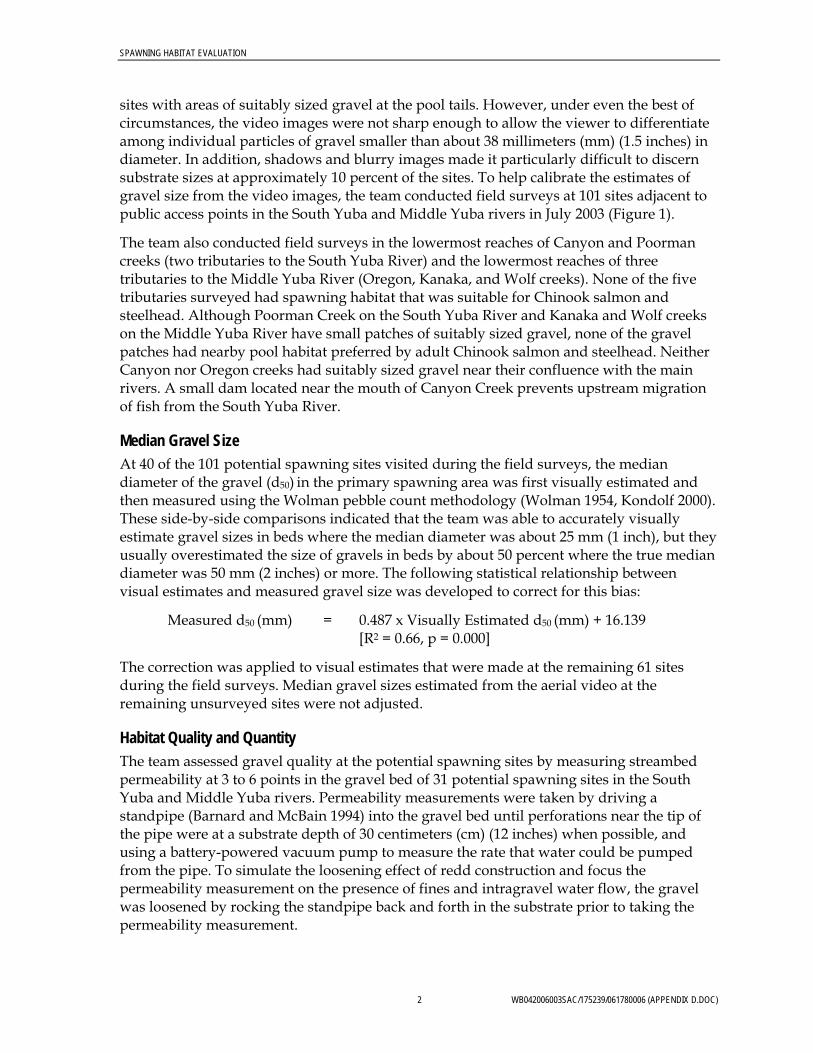
SPAWNING HABITAT EVALUATION
2 WB042006003SAC/175239/061780006 (APPENDIX D.DOC)
sites with areas of suitably sized gravel at the pool tails. However, under even the best of circumstances, the video images were not sharp enough to allow the viewer to differentiate among individual particles of gravel smaller than about 38 millimeters (mm) (1.5 inches) in diameter. In addition, shadows and blurry images made it particularly difficult to discern substrate sizes at approximately 10 percent of the sites. To help calibrate the estimates of gravel size from the video images, the team conducted field surveys at 101 sites adjacent to public access points in the South Yuba and Middle Yuba rivers in July 2003 (Figure 1).
The team also conducted field surveys in the lowermost reaches of Canyon and Poorman creeks (two tributaries to the South Yuba River) and the lowermost reaches of three tributaries to the Middle Yuba River (Oregon, Kanaka, and Wolf creeks). None of the five tributaries surveyed had spawning habitat that was suitable for Chinook salmon and steelhead. Although Poorman Creek on the South Yuba River and Kanaka and Wolf creeks on the Middle Yuba River have small patches of suitably sized gravel, none of the gravel patches had nearby pool habitat preferred by adult Chinook salmon and steelhead. Neither Canyon nor Oregon creeks had suitably sized gravel near their confluence with the main rivers. A small dam located near the mouth of Canyon Creek prevents upstream migration of fish from the South Yuba River.
Median Gravel Size At 40 of the 101 potential spawning sites visited during the field surveys, the median diameter of the gravel (d50) in the primary spawning area was first visually estimated and then measured using the Wolman pebble count methodology (Wolman 1954, Kondolf 2000). These side-by-side comparisons indicated that the team was able to accurately visually estimate gravel sizes in beds where the median diameter was about 25 mm (1 inch), but they usually overestimated the size of gravels in beds by about 50 percent where the true median diameter was 50 mm (2 inches) or more. The following statistical relationship between visual estimates and measured gravel size was developed to correct for this bias:
Measured d50 (mm) = 0.487 x Visually Estimated d50 (mm) + 16.139 [R2 = 0.66, p = 0.000]
The correction was applied to visual estimates that were made at the remaining 61 sites during the field surveys. Median gravel sizes estimated from the aerial video at the remaining unsurveyed sites were not adjusted.
Habitat Quality and Quantity The team assessed gravel quality at the potential spawning sites by measuring streambed permeability at 3 to 6 points in the gravel bed of 31 potential spawning sites in the South Yuba and Middle Yuba rivers. Permeability measurements were taken by driving a standpipe (Barnard and McBain 1994) into the gravel bed until perforations near the tip of the pipe were at a substrate depth of 30 centimeters (cm) (12 inches) when possible, and using a battery-powered vacuum pump to measure the rate that water could be pumped from the pipe. To simulate the loosening effect of redd construction and focus the permeability measurement on the presence of fines and intragravel water flow, the gravel was loosened by rocking the standpipe back and forth in the substrate prior to taking the permeability measurement.
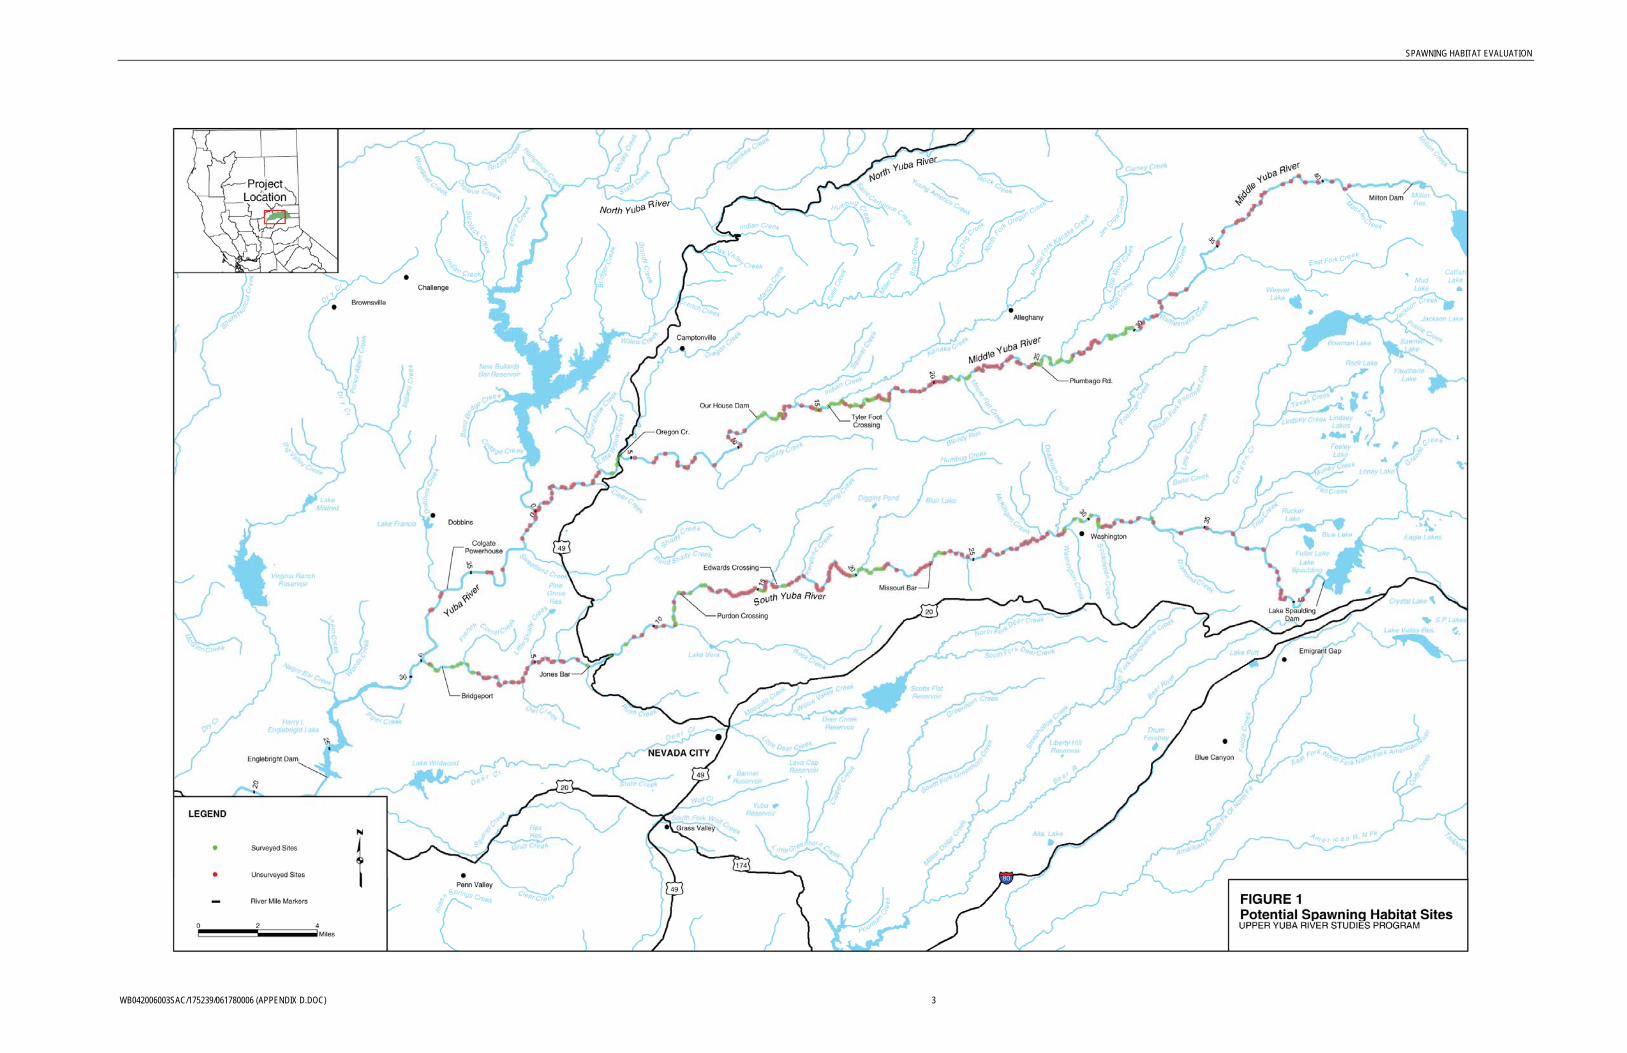
SPAWNING HABITAT EVALUATION
WB042006003SAC/175239/061780006 (APPENDIX D.DOC) 3
SPAWNING HABITAT EVALUATION
To further assess potential spawning habitat quality and quantify the aerial extent of potential spawning gravels, additional measurements were taken during the intensive surveys at 31 sites in the Middle Yuba and South Yuba rivers that included: (1) the area and depth of suitably sized gravel in the wetted channel and floodplain; (2) the depth and velocity of the water flowing over the spawning-sized gravel; (3) the maximum depth of the water in nearby pool habitat; and (4) whether cover provided by undercut boulders, overhanging vegetation, or surface turbulence was present in the nearby pool habitat.
These data were then used to estimate the area of usable gravel, the presence of cover, and maximum pool depth in the other potential spawning habitat sites as viewed in the low-altitude videography. Adjacent pool habitat was judged to provide suitable refuge for Chinook salmon during autumn low flows if the depth of water in the pool was at least 2.4 meters (8 feet), or if the pool depth was between 1.2 and 2.4 meters (4 and 8 feet) and boulders, overhanging vegetation, and/or surface turbulence were present to provide cover. When the maximum depth of the adjacent pool habitat was less than 1.2 meters (4 feet) or cover was not present, sites were considered to provide suitable spawning habitat only for steelhead.
Potential Number of Redds Based on the area of potential spawning habitat observed in the upper Yuba River watershed, the potential number of Chinook salmon redds and steelhead redds that could be supported was estimated using a regression equation developed for fall-run Chinook salmon in the lower Stanislaus River (CMC 2001, 2002a, 2002b). This relationship is based on (1) adjusted maximum fall-run Chinook salmon redd densities in the lower Stanislaus River relative to median gravel size determined from bulk surface substrate samples, (2) relative sizes of Chinook salmon and steelhead redds, and (3) the upper size limit of gravels that can be moved by steelhead-sized fish. The relationship for fall-run Chinook salmon is based on measurements of redd density and median gravel size at 11 sites in a highly used reach of the Stanislaus River.
A majority of the redd density measurements in the Stanislaus River were made during the fall of 1998 when escapement was below average and it was unlikely that the spawning beds were saturated with redds. The redd surveys were repeated at some of the 1998 study sites and at two recently restored sites in the fall of 2000 when the salmon run was above average and presumably the habitat was saturated with redds. The redd densities in 1998 were multiplied by the ratio of fall 2000 redd densities to fall 1998 redd densities (2.1416) to estimate the maximum potential redd densities at all the Stanislaus River study sites (Table 1).
The relationship between maximum redd density and median gravel size was nonlinear with peak redd densities occurring at median gravel sizes of 20 mm. The following regression equation for Chinook salmon was developed with data collected from the 10 Stanislaus River sites where median gravel sizes were at least 24 mm:
Redd Density (redds/100 ft2) = 0.0005838 x (d50 in mm) + 0.06087 [R2 = 0.63, p = 0.004]
To adjust the density for sites with smaller-sized gravels, the estimates were multiplied by 0.15 and 0.65 to estimate redd densities where the median gravel size was 10 mm and 15 mm, respectively. The relationship between Chinook salmon redd density and median gravel size is shown in Figure 2.
WB042006003SAC/175239/061780006 (APPENDIX D.DOC) 5
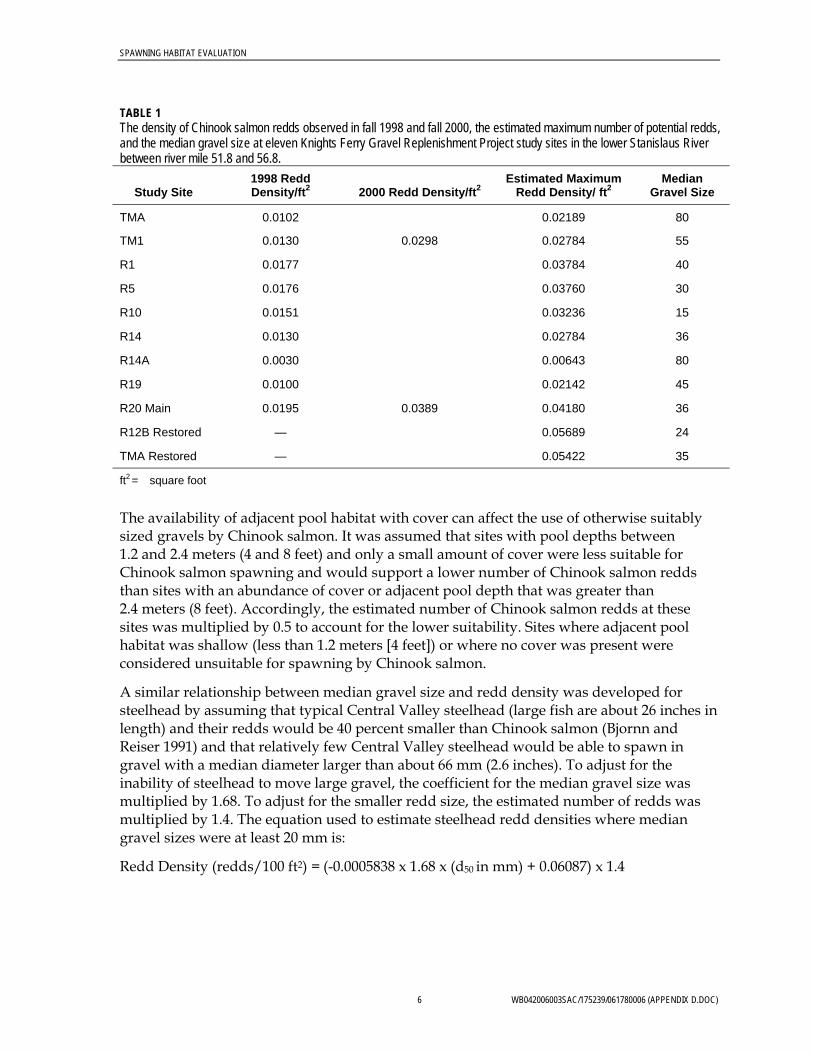
SPAWNING HABITAT EVALUATION
TABLE 1 The density of Chinook salmon redds observed in fall 1998 and fall 2000, the estimated maximum number of potential redds, and the median gravel size at eleven Knights Ferry Gravel Replenishment Project study sites in the lower Stanislaus River between river mile 51.8 and 56.8.
Study Site 1998 Redd Density/ft2 2000 Redd Density/ft2
Estimated Maximum Redd Density/ ft2
Median Gravel Size
TMA 0.0102 0.02189 80
TM1 0.0130 0.0298 0.02784 55
R1 0.0177 0.03784 40
R5 0.0176 0.03760 30
R10 0.0151 0.03236 15
R14 0.0130 0.02784 36
R14A 0.0030 0.00643 80
R19 0.0100 0.02142 45
R20 Main 0.0195 0.0389 0.04180 36
R12B Restored — 0.05689 24
TMA Restored — 0.05422 35
ft2 = square foot
The availability of adjacent pool habitat with cover can affect the use of otherwise suitably sized gravels by Chinook salmon. It was assumed that sites with pool depths between 1.2 and 2.4 meters (4 and 8 feet) and only a small amount of cover were less suitable for Chinook salmon spawning and would support a lower number of Chinook salmon redds than sites with an abundance of cover or adjacent pool depth that was greater than 2.4 meters (8 feet). Accordingly, the estimated number of Chinook salmon redds at these sites was multiplied by 0.5 to account for the lower suitability. Sites where adjacent pool habitat was shallow (less than 1.2 meters [4 feet]) or where no cover was present were considered unsuitable for spawning by Chinook salmon.
A similar relationship between median gravel size and redd density was developed for steelhead by assuming that typical Central Valley steelhead (large fish are about 26 inches in length) and their redds would be 40 percent smaller than Chinook salmon (Bjornn and Reiser 1991) and that relatively few Central Valley steelhead would be able to spawn in gravel with a median diameter larger than about 66 mm (2.6 inches). To adjust for the inability of steelhead to move large gravel, the coefficient for the median gravel size was multiplied by 1.68. To adjust for the smaller redd size, the estimated number of redds was multiplied by 1.4. The equation used to estimate steelhead redd densities where median gravel sizes were at least 20 mm is:
Redd Density (redds/100 ft2) = (-0.0005838 x 1.68 x (d50 in mm) + 0.06087) x 1.4
6 WB042006003SAC/175239/061780006 (APPENDIX D.DOC)
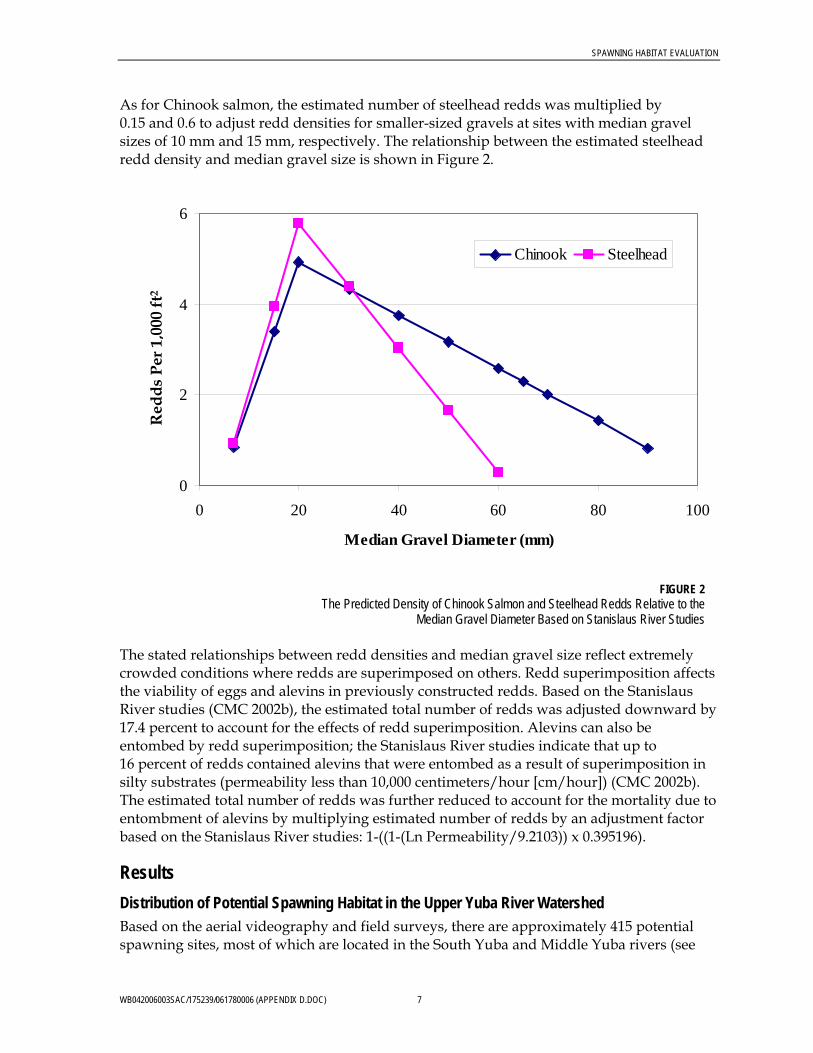
SPAWNING HABITAT EVALUATION
As for Chinook salmon, the estimated number of steelhead redds was multiplied by 0.15 and 0.6 to adjust redd densities for smaller-sized gravels at sites with median gravel sizes of 10 mm and 15 mm, respectively. The relationship between the estimated steelhead redd density and median gravel size is shown in Figure 2.
0
2
4
6
0 20 40 60 80
Median Gravel Diameter (mm)
Red
ds P
er 1
00 F
eet2
Chinook Steelhead
2 t
C) 7
The stated relationships between redd densities and median gravel size reflect extremely crowded conditions where redds are superimposed on others. Redd superimposition affects the viability of eggs and alevins in previously constructed redds. Based on the Stanislaus River studies (CMC 2002b), the estimated total number of redds was adjusted downward by 17.4 percent to account for the effects of redd superimposition. Alevins can also be entombed by redd superimposition; the Stanislaus River studies indicate that up to 16 percent of redds contained alevins that were entombed as a result of superimposition in silty substrates (permeability less than 10,000 centimeters/hour [cm/hour]) (CMC 2002b). The estimated total number of redds was further reduced to account for the mortality due to entombment of alevins by multiplying estimated number of redds by an adjustment factor based on the Stanislaus River studies: 1-((1-(Ln Permeability/9.2103)) x 0.395196).
Results Distribution of Potential Spawning Habitat in the Upper Yuba River Watershed Based on the aerial videography and field surveys, there are approximately 415 potential spawning sites, most of which are located in the South Yuba and Middle Yuba rivers (see
100
FIGURE 2 The Predicted Density of Chinook Salmon and Steelhead Redds Relative to the
Median Gravel Diameter Based on Stanislaus River Studies
Red
ds
Per
1,0
00 f
WB042006003SAC/175239/061780006 (APPENDIX D.DO
SPAWNING HABITAT EVALUATION
Figure 1). On the Middle Yuba River, most of the potential spawning sites are located upstream of Our House Dam (River Mile [RM] 12) and downstream of Oregon Creek (RM 4); few sites exist upstream of Tehama Ravine (RM 30). On the South Yuba River, potential spawning sites are sparsely distributed from Bridgeport (RM 1) to Purdon Crossing (RM 12), with a denser concentration of sites upstream around Edward’s Crossing (RM 16), Humbug Creek (RM 20), and Missouri Bar (RM 24); relatively few spawning sites exist upstream of the town of Washington (RM 29). No potential spawning sites were identified in the North Yuba River below New Bullards Bar Dam. The habitat study team identified only 13 potential spawning sites in the upper Yuba River, all of which are located downstream of the mouth of the Middle Yuba River. Most of the sites in the Yuba River below the mouth of the Middle Yuba River contained relatively large gravel (d50 = 45 to 60 mm [1.8 to 2.4 inches]) and would be used by only a few Chinook salmon and steelhead.
Median Gravel Size Median gravel sizes at 21 intensively surveyed potential spawning sites on the South Yuba River ranged from 6.6 to 74.3 mm (0.25 to 2.9 inches); in the Middle Yuba River (19 sites), the median gravel size ranged from 21.4 to 64.0 mm (0.84 to 2.5 inches) (Table 2). Visual estimates of the median gravel size at the remaining sites ranged from 15 to 150 mm (0.6 to 5.9 inches) in the South Yuba River, 30 to 120 mm (1.2 to 4.7 inches) in the Middle Yuba River, and from 40 to 60 mm (1.6 to 2.4 inches) in the Yuba River below the mouth of the Middle Yuba River.
Habitat Quality The mean bed permeability was 37,858 cm/hour and 63,090 cm/hour at 16 sites on the South Yuba River and 15 sites on the Middle Yuba River, respectively. Individual permeability measurements within sites ranged from 192 to 273,229 cm/hour (Table 3). Mean permeability was relatively low (1,318 to 6,137 cm/hour) at a total of 10 sites near Highway 49, Purdon Crossing, and Missouri Bar on the South Yuba River and near Moore’s Flat on the Middle Yuba River.
At 26 of the 31 sites the habitat team surveyed intensively, the depth of the loose gravel was at least 30 cm (12 inches) deep, as determined by the ability to drive the permeability standpipe into the streambed. However, it was not possible to drive the standpipe into the streambed more than 7.5 to 18 cm (3 to 7 inches) at 5 of the sites where the median gravel size was relatively large (median gravel size between 50 and 76 mm [2 and 3 inches]).
The mean water depth over the gravel beds at the 31 intensively studied sites was 0.4 and 0.5 meters (1.4 and 1.7 feet) in the Middle Yuba and South Yuba rivers, respectively. The mean velocities were 25.9 and 21.0 cm per second (0.85 and 0.69 feet per second) in the Middle Yuba and South Yuba rivers, respectively (Table 4).
TABLE 2 Measured and Visually Estimated Median Gravel Size at Selected Sites on the South and Middle Yuba Rivers
Site Number Measured (mm) Visually Estimated (mm)
South Yuba River 2 39.0 80
4 58.2 60
8 WB042006003SAC/175239/061780006 (APPENDIX D.DOC)
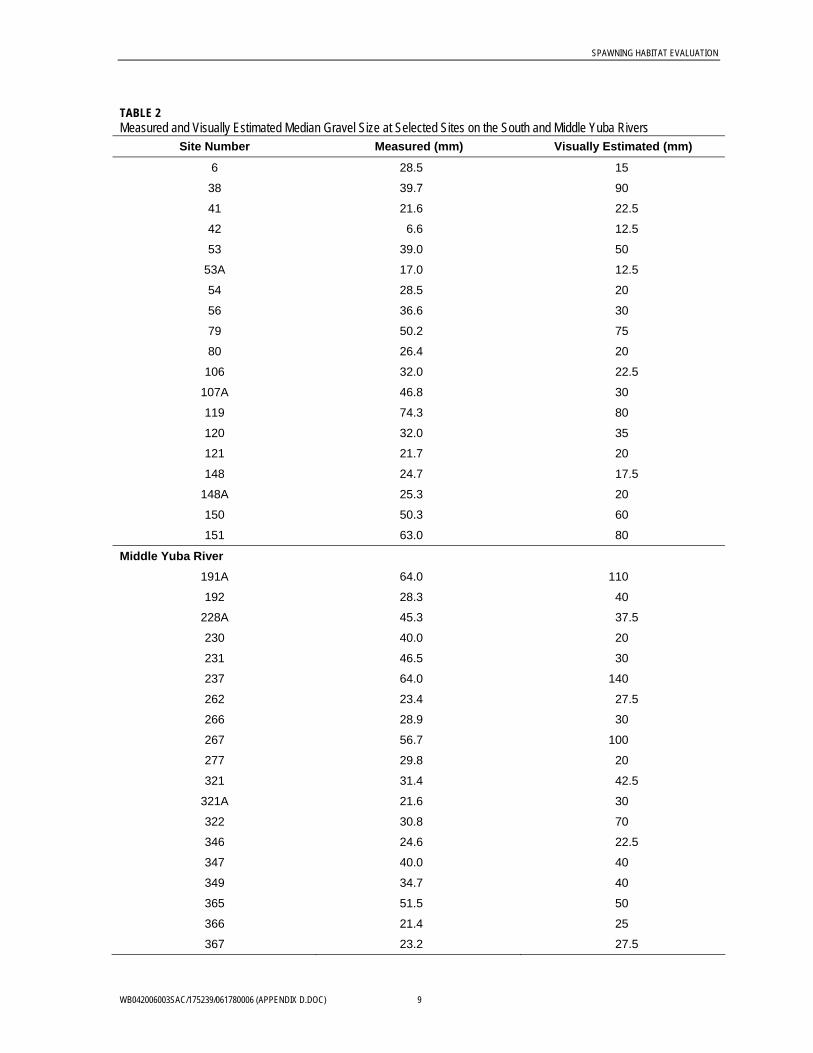
SPAWNING HABITAT EVALUATION
TABLE 2 Measured and Visually Estimated Median Gravel Size at Selected Sites on the South and Middle Yuba Rivers
Site Number Measured (mm) Visually Estimated (mm)
6 28.5 15
38 39.7 90
41 21.6 22.5
42 6.6 12.5
53 39.0 50
53A 17.0 12.5
54 28.5 20
56 36.6 30
79 50.2 75
80 26.4 20
106 32.0 22.5
107A 46.8 30
119 74.3 80
120 32.0 35
121 21.7 20
148 24.7 17.5
148A 25.3 20
150 50.3 60
151 63.0 80
Middle Yuba River 191A 64.0 110
192 28.3 40
228A 45.3 37.5
230 40.0 20
231 46.5 30
237 64.0 140
262 23.4 27.5
266 28.9 30
267 56.7 100
277 29.8 20
321 31.4 42.5
321A 21.6 30
322 30.8 70
346 24.6 22.5
347 40.0 40
349 34.7 40
365 51.5 50
366 21.4 25
367 23.2 27.5
WB042006003SAC/175239/061780006 (APPENDIX D.DOC) 9
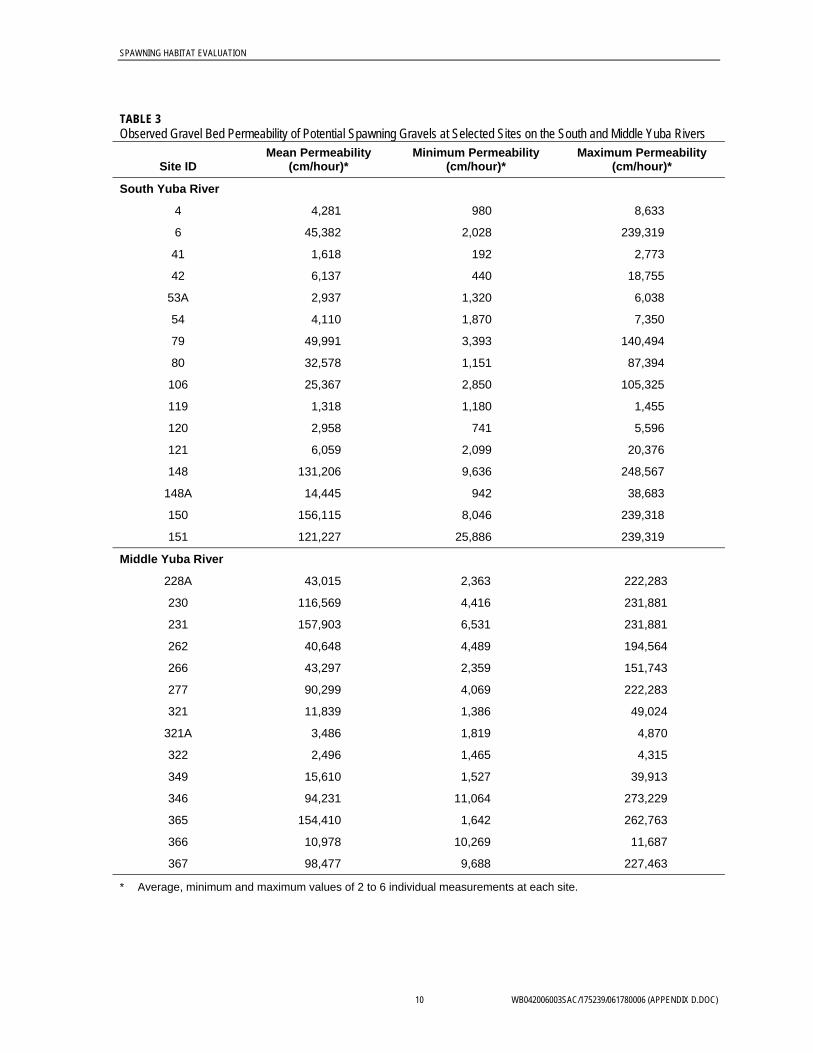
SPAWNING HABITAT EVALUATION
TABLE 3 Observed Gravel Bed Permeability of Potential Spawning Gravels at Selected Sites on the South and Middle Yuba Rivers
Site ID Mean Permeability
(cm/hour)* Minimum Permeability
(cm/hour)* Maximum Permeability
(cm/hour)*
South Yuba River
4 4,281 980 8,633
6 45,382 2,028 239,319
41 1,618 192 2,773
42 6,137 440 18,755
53A 2,937 1,320 6,038
54 4,110 1,870 7,350
79 49,991 3,393 140,494
80 32,578 1,151 87,394
106 25,367 2,850 105,325
119 1,318 1,180 1,455
120 2,958 741 5,596
121 6,059 2,099 20,376
148 131,206 9,636 248,567
148A 14,445 942 38,683
150 156,115 8,046 239,318
151 121,227 25,886 239,319
Middle Yuba River
228A 43,015 2,363 222,283
230 116,569 4,416 231,881
231 157,903 6,531 231,881
262 40,648 4,489 194,564
266 43,297 2,359 151,743
277 90,299 4,069 222,283
321 11,839 1,386 49,024
321A 3,486 1,819 4,870
322 2,496 1,465 4,315
349 15,610 1,527 39,913
346 94,231 11,064 273,229
365 154,410 1,642 262,763
366 10,978 10,269 11,687
367 98,477 9,688 227,463
* Average, minimum and maximum values of 2 to 6 individual measurements at each site.
10 WB042006003SAC/175239/061780006 (APPENDIX D.DOC)
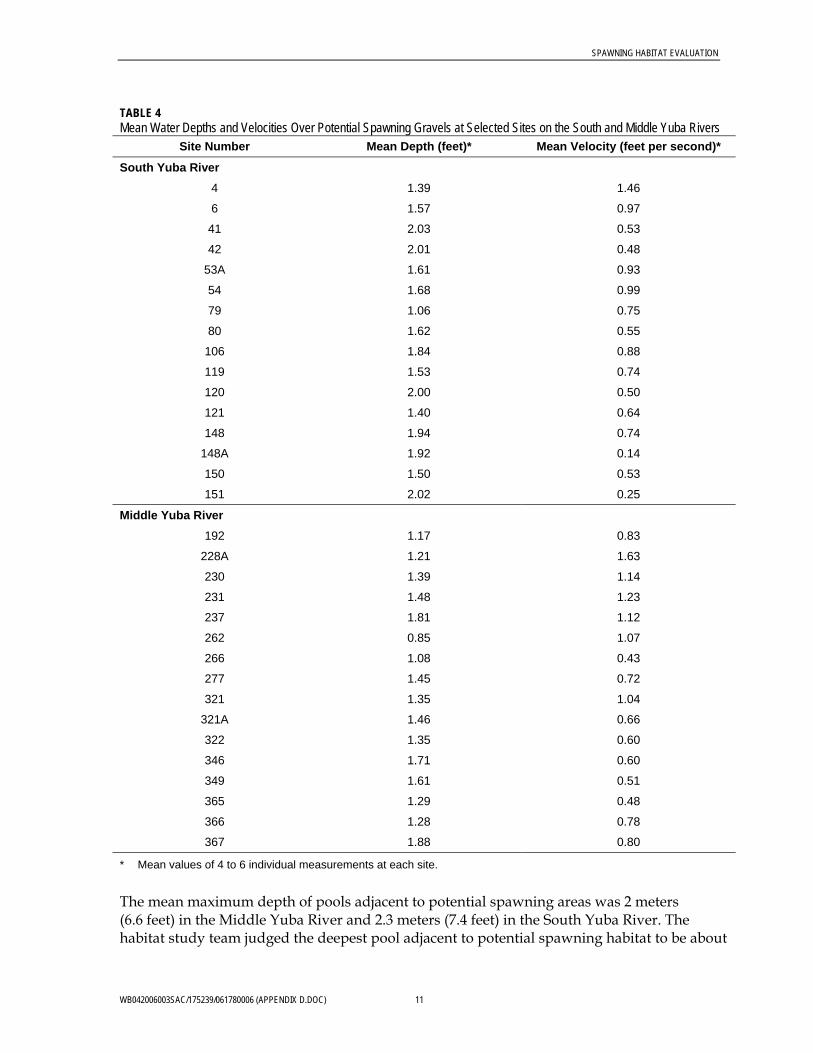
SPAWNING HABITAT EVALUATION
TABLE 4 Mean Water Depths and Velocities Over Potential Spawning Gravels at Selected Sites on the South and Middle Yuba Rivers
Site Number Mean Depth (feet)* Mean Velocity (feet per second)*
South Yuba River 4 1.39 1.46
6 1.57 0.97
41 2.03 0.53
42 2.01 0.48
53A 1.61 0.93
54 1.68 0.99
79 1.06 0.75
80 1.62 0.55
106 1.84 0.88
119 1.53 0.74
120 2.00 0.50
121 1.40 0.64
148 1.94 0.74
148A 1.92 0.14
150 1.50 0.53
151 2.02 0.25
Middle Yuba River 192 1.17 0.83
228A 1.21 1.63
230 1.39 1.14
231 1.48 1.23
237 1.81 1.12
262 0.85 1.07
266 1.08 0.43
277 1.45 0.72
321 1.35 1.04
321A 1.46 0.66
322 1.35 0.60
346 1.71 0.60
349 1.61 0.51
365 1.29 0.48
366 1.28 0.78
367 1.88 0.80
* Mean values of 4 to 6 individual measurements at each site.
The mean maximum depth of pools adjacent to potential spawning areas was 2 meters (6.6 feet) in the Middle Yuba River and 2.3 meters (7.4 feet) in the South Yuba River. The habitat study team judged the deepest pool adjacent to potential spawning habitat to be about
WB042006003SAC/175239/061780006 (APPENDIX D.DOC) 11
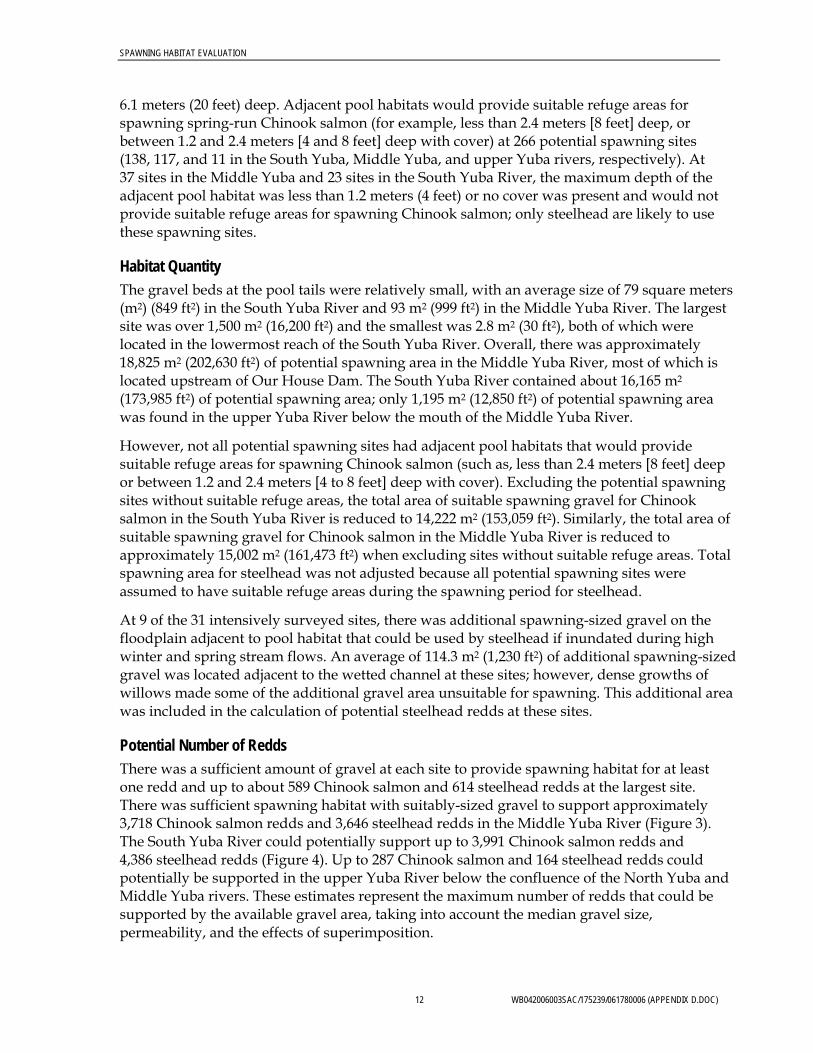
SPAWNING HABITAT EVALUATION
6.1 meters (20 feet) deep. Adjacent pool habitats would provide suitable refuge areas for spawning spring-run Chinook salmon (for example, less than 2.4 meters [8 feet] deep, or between 1.2 and 2.4 meters [4 and 8 feet] deep with cover) at 266 potential spawning sites (138, 117, and 11 in the South Yuba, Middle Yuba, and upper Yuba rivers, respectively). At 37 sites in the Middle Yuba and 23 sites in the South Yuba River, the maximum depth of the adjacent pool habitat was less than 1.2 meters (4 feet) or no cover was present and would not provide suitable refuge areas for spawning Chinook salmon; only steelhead are likely to use these spawning sites.
Habitat Quantity The gravel beds at the pool tails were relatively small, with an average size of 79 square meters (m2) (849 ft2) in the South Yuba River and 93 m2 (999 ft2) in the Middle Yuba River. The largest site was over 1,500 m2 (16,200 ft2) and the smallest was 2.8 m2 (30 ft2), both of which were located in the lowermost reach of the South Yuba River. Overall, there was approximately 18,825 m2 (202,630 ft2) of potential spawning area in the Middle Yuba River, most of which is located upstream of Our House Dam. The South Yuba River contained about 16,165 m2 (173,985 ft2) of potential spawning area; only 1,195 m2 (12,850 ft2) of potential spawning area was found in the upper Yuba River below the mouth of the Middle Yuba River.
However, not all potential spawning sites had adjacent pool habitats that would provide suitable refuge areas for spawning Chinook salmon (such as, less than 2.4 meters [8 feet] deep or between 1.2 and 2.4 meters [4 to 8 feet] deep with cover). Excluding the potential spawning sites without suitable refuge areas, the total area of suitable spawning gravel for Chinook salmon in the South Yuba River is reduced to 14,222 m2 (153,059 ft2). Similarly, the total area of suitable spawning gravel for Chinook salmon in the Middle Yuba River is reduced to approximately 15,002 m2 (161,473 ft2) when excluding sites without suitable refuge areas. Total spawning area for steelhead was not adjusted because all potential spawning sites were assumed to have suitable refuge areas during the spawning period for steelhead.
At 9 of the 31 intensively surveyed sites, there was additional spawning-sized gravel on the floodplain adjacent to pool habitat that could be used by steelhead if inundated during high winter and spring stream flows. An average of 114.3 m2 (1,230 ft2) of additional spawning-sized gravel was located adjacent to the wetted channel at these sites; however, dense growths of willows made some of the additional gravel area unsuitable for spawning. This additional area was included in the calculation of potential steelhead redds at these sites.
Potential Number of Redds There was a sufficient amount of gravel at each site to provide spawning habitat for at least one redd and up to about 589 Chinook salmon and 614 steelhead redds at the largest site. There was sufficient spawning habitat with suitably-sized gravel to support approximately 3,718 Chinook salmon redds and 3,646 steelhead redds in the Middle Yuba River (Figure 3). The South Yuba River could potentially support up to 3,991 Chinook salmon redds and 4,386 steelhead redds (Figure 4). Up to 287 Chinook salmon and 164 steelhead redds could potentially be supported in the upper Yuba River below the confluence of the North Yuba and Middle Yuba rivers. These estimates represent the maximum number of redds that could be supported by the available gravel area, taking into account the median gravel size, permeability, and the effects of superimposition.
12 WB042006003SAC/175239/061780006 (APPENDIX D.DOC)
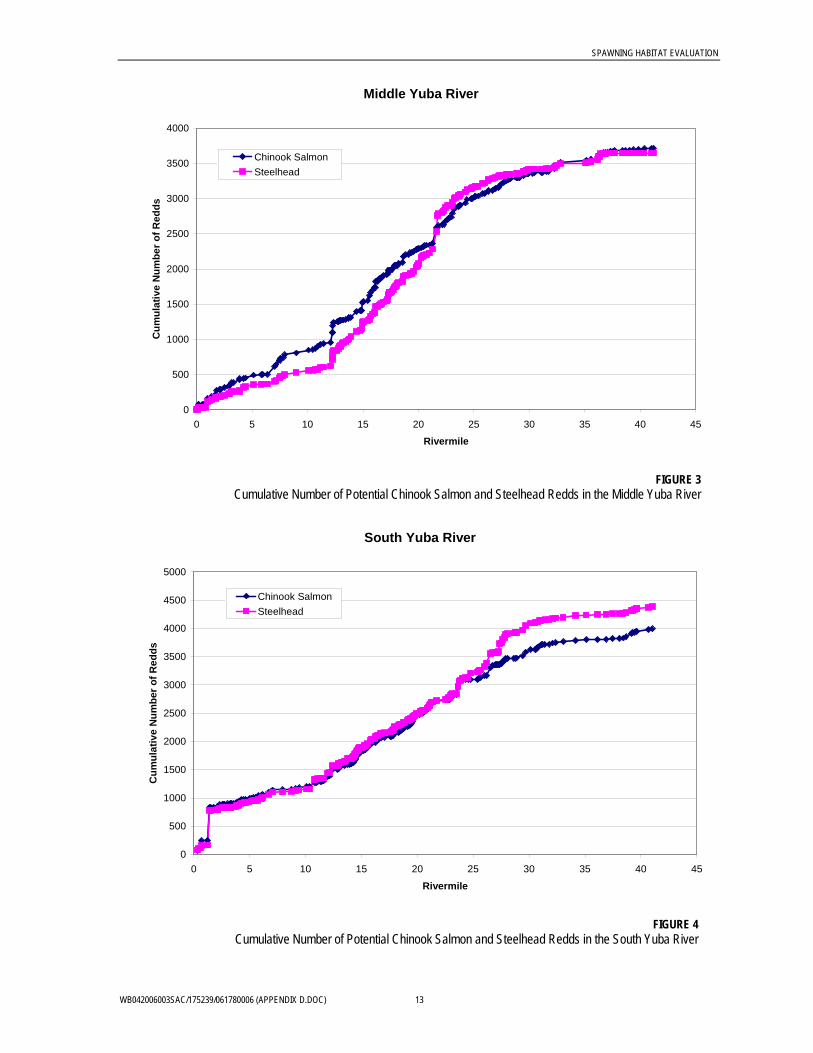
SPAWNING HABITAT EVALUATION
Middle Yuba River
0
500
1000
1500
2000
2500
3000
3500
4000
0 5 10 15 20 25 30 35 40 45
Rivermile
Cum
ulat
ive
Num
ber o
f Red
dsChinook SalmonSteelhead
FIGURE 3
Cumulative Number of Potential Chinook Salmon and Steelhead Redds in the Middle Yuba River
South Yuba River
0
500
1000
1500
2000
2500
3000
3500
4000
4500
5000
0 5 10 15 20 25 30 35 40 45
Rivermile
Cum
ulat
ive
Num
ber o
f Red
ds
Chinook SalmonSteelhead
FIGURE 4
Cumulative Number of Potential Chinook Salmon and Steelhead Redds in the South Yuba River
WB042006003SAC/175239/061780006 (APPENDIX D.DOC) 13
SPAWNING HABITAT EVALUATION
Discussion Timing of Field Surveys The aerial video was conducted during the typical spawning period for spring-run Chinook salmon. Hence, the analysis of spawning area based on the video reflects flow conditions that would be expected to occur during the spawning period for spring-run Chinook salmon if they were introduced into the upper watershed. Steelhead, on the other hand, spawn during the winter and early spring when stream flows may be higher. No video or field studies were conducted during this time period. However, as described above, additional areas of suitably-sized gravel for spawning outside of the wetted channel were identified and quantified during the field surveys. This additional area was included in the calculation of potential redds.
Flows were approximately 30 cubic-feet-per-second (cfs) below Our House Dam on the Middle Yuba River (USGS 11408880) when the aerial video was flown in October 2002. Diversions into the Lohman Ridge tunnel above Our House Dam were negligible at this time, indicating that flows in the Middle Yuba River ranged from approximately 5 cfs below Milton Dam to the 40 cfs measured at Our House Dam. Flows were approximately 40 cfs at Jones Bar on the South Yuba River (USGS 11417500) in October 2002. The field surveys were conducted in July 2003 at flows of approximately 75 cfs in the Middle Yuba River above Our House Dam and 75 cfs at Jones Bar on the South Yuba River. Because flows were somewhat higher during the field surveys than when the aerial video was flown, the amount of potential spawning gravel in the wetted channel may have been overestimated during the field surveys and underestimated from the video. Overall, the differences in flows between the aerial video and the field surveys are likely within the range of flows that would occur with annual variation during the spawning period for spring-run Chinook salmon. Thus, the estimates of potential spawning area cannot be considered conservative. Habitat Quality
Spawning habitat was judged to be suitable for Chinook salmon and steelhead based on the gravel size, bed permeability, and the availability of adjacent refuge areas (deep pools providing cover). Pool habitats adjacent to potential spawning sites were judged to provide suitable refuge areas for spawning Chinook salmon at the majority (63 percent) of the potential spawning sites identified. The remainder of potential spawning sites identified did not have adjacent pool habitats deemed suitable as refuge areas for spawning Chinook salmon, because they were shallow (less than 8 feet deep) and lacked boulders, rock ledges, overhanging vegetation, and/or surface turbulence. Potential spawning areas without suitable refuge areas may still be used by Chinook salmon, but this use cannot be predicted or assumed. Therefore, the estimated number of potential redds that could be supported in the available habitat should be considered as conservative and the true number of redds could be higher. In regard to steelhead, all adjacent pools would likely provide adequate refuge habitat because spawning would occur during winter and spring when stream flows are typically high and pools are relatively deep, with extensive surface turbulence.
Both Chinook salmon and steelhead prefer to spawn in gravel with a median diameter of about 25 mm (1 inch), although they are capable of moving gravel with diameters of up to about 10 percent of their body length (Kondolf 2000). The majority of Chinook salmon use gravels with median diameters from 22 to 48 mm (0.9 to 1.9 inches) but will use gravels with median diameters from 11 to 78 mm (0.4 inches to 3.1 inches) (Kondolf and Wolman 1993).
14 WB042006003SAC/175239/061780006 (APPENDIX D.DOC)
SPAWNING HABITAT EVALUATION
Most steelhead spawn in gravels with median diameters from 18 to 33 mm (0.7 to 1.3 inches) but will use gravels with median diameters from 10 to 46 mm (0.4 to 1.8 inches) (Kondolf and Wolman 1993). Gravel depths of at least 15 mm (6 inches) are required for spawning. Most of the potential spawning sites in the upper Yuba River watershed had gravels within the size range typically used by salmon and steelhead. Only a few of the potential spawning sites had gravels that were too large to be used by steelhead. Gravel depths were typically greater than the minimum required for spawning.
Gravel permeability in both the Middle and South Yuba rivers is relatively high compared to typical values (2,000 to 8,000 cm/hour) observed in undisturbed, natural spawning gravel in the lower Stanislaus (CMC 2002a, 2002b) and Tuolumne rivers (Stillwater Sciences 2001). Salmonids in the Stanislaus River clean the gravel during redd construction and increase permeability to about 26,000 cm/hour (CMC 2002b). Laboratory studies indicate that the survival of Chinook salmon eggs to emergence would be 80 percent with a permeability of 26,000 cm/hour (McCuddin 1977). The relatively high values observed in the Middle and South Yuba rivers suggest that water flow through the gravels would be adequate to provide for high survival to emergence. However, if redd superimposition occurred, then fines cleaned from the superimposing redd could entomb alevins in the superimposed redd (CMC 2002b). Estimates of the number of redds that could be supported in the upper Yuba River watershed were adjusted to account for the effects of superimposition. Turbid intragravel flow during egg incubation can coat incubating eggs with silt and result in suffocation (CMC 2002a); this would primarily affect steelhead that spawn during winter and spring when high flows and storm runoff cause erosion and bed movement.
Based on habitat preference criteria developed for fall-run Chinook salmon in the Stanislaus River (Aceituno 1990), Chinook salmon prefer to spawn in water that is between 0.4 and 0.9 meters (1.3 and 3 feet) deep with velocities from 40 to 85 cm per second (1.3 to 2.8 feet per second). The mean water depth over the gravel beds at the 31 intensively studied sites was within the preferred depth range for spawning. The mean velocities were below the preferred range, but still provided relatively high rates of intra-gravel water flow measured as permeability. Flows higher or lower than observed during the field surveys would likely result in different flows and velocities over the potential spawning beds, but the exact relationship between flow and depth and velocity at each site remains unknown. However, given the broad range of depths and velocities considered suitable for Chinook salmon (Bjornn and Reiser 1991), depths and velocities at potential spawning sites in the Middle and South Yuba rivers are unlikely to be unsuitable for use by spring-run Chinook salmon within the flows anticipated under current water operations. Higher streamflows during winter and spring would likely provide suitable depths and velocities for spawning steelhead.
Habitat Quantity and Number of Redds The estimates of potential spawning area and the number of redds that could be supported represent the area and number of Chinook salmon and steelhead redds that could be supported in the spawning areas identified during the surveys, and assume that there are no barriers that block access to potential spawning habitat and that stream flows and water temperatures are suitable at all sites during the spawning and incubation period. It also assumes that the identified potential spawning areas have suitable holding habitat for spring-run Chinook salmon nearby. The results of the barrier, holding pool, and water
WB042006003SAC/175239/061780006 (APPENDIX D.DOC) 15
SPAWNING HABITAT EVALUATION
temperature analyses will be used in conjunction with the distribution of potential spawning sites to assess the total amount of suitable spawning habitat in the upper Yuba River watershed under current conditions.
Human Influences Gold mining influenced the potential spawning habitat for salmonids at many sites in the Middle Yuba River. Suction dredges were being used to mine gold at almost every site accessible by foot, including most of the sites visited during the July 2003 field surveys. Miners typically remove, by hand, the overlying large cobbles from the substrate in a pool and then use a small suction dredge to pump gravel from the pool bottom where it is deposited onto the pool tail. These activities deepen the pools and increase the amount of spawning-sized gravel at the pool tail, potentially improving the quality of spawning gravel at the pool tail. Although dredging might improve spawning habitat, it could result in mortality of spring-run Chinook salmon and steelhead eggs and alevins if gravel disturbance occurs during the spawning and incubation period.
Human movement of rocks to deepen the pools for swimming and diving also may improve a substantial amount of spawning habitat on both the South Yuba and Middle Yuba rivers. Many sites contained evidence of the removal of large cobbles from the potential spawning areas to create 0.3 to 0.6 meter (1 to 2 foot) high weirs at the pool tail. Removing these cobbles exposed the underlying spawning-sized gravel, thereby reducing the median gravel size and improving the sites for spawning. However, the weirs may reduce the suitability of the sites for spawning by reducing the velocity of the water flowing over the gravel bed.
References Aceituno, M.E. 1990. Habitat preference criteria for fall-run Chinook Salmon holding, spawning, and rearing in the Stanislaus River, California. U.S. Fish and Wildlife Service, Sacramento, California. 26 pages & appendices.
Barnhart, R.A. 1991. Steelhead (Oncorhynchus mykiss). In: J. Stolz and J. Schnell, editors. Trout, the wildlife series. Stackpole Books, Harrisburg, PA. Pages 324-330.
Barnard, K. and S. McBain. 1994. Standpipe to determine permeability, dissolved oxygen, and vertical particle size distribution in salmonid spawning gravels. Fish Habitat Relationships Technical Bulletin No. 15. U.S. Forest Service.
Bjornn, T.C and D.W. Reiser. 1991. Chapter 4: habitat requirements of salmonids in streams. In: W.R. Meehan, editor. Influences of forest and rangeland management on salmonid fishes and their habitats. American Fisheries Society Special Publication 19. Bethesda, Maryland. Pages 83-138.
California Department of Fish and Game (CDFG). 1998. Report to the Fish and Game Commission: a status review of the spring-run Chinook salmon (Oncorhynchus tshawytscha) in the Sacramento River Drainage. Candidate Species Status Report 98-01. June.
Carl Mesick Consultants (CMC). 2001. Task 3 pre-project evaluation report, Knights Ferry Gravel Replenishment Project. Final report produced for the CALFED Bay Delta Program and the Stockton East Water District. Revised 20 July 2001. Carl Mesick Consultants, El Dorado, California.
16 WB042006003SAC/175239/061780006 (APPENDIX D.DOC)
SPAWNING HABITAT EVALUATION
WB042006003SAC/175239/061780006 (APPENDIX D.DOC) 17
CMC. 2002a. Task 5 initial post-project evaluation report, fall 2000, Knights Ferry Gravel Replenishment Project. Final report produced for the CALFED Bay Delta Program and the Stockton East Water District. 14 January 2002. Carl Mesick Consultants, El Dorado, California.
CMC. 2002b. Task 6 second year post-project evaluation report, fall 2000, Knights Ferry Gravel Replenishment Project. Final report produced for the CALFED Bay Delta Program and the Stockton East Water District. 20 February 2002. Carl Mesick Consultants, El Dorado, California.
Kondolf, G.M. 2000. Assessing salmonid spawning gravel quality. Transactions of the American Fisheries Society 129:262-281.
Kondolf, G. M., and M. G. Wolman. 1993. The Sizes of Salmonid Spawning Gravels. Water Resources Research. 29: 2,275-2,285.
McCuddin, M.E. 1977. Survival of salmon and trout embryos and fry in gravel-sand mixtures. Master’s thesis. University of Idaho, Moscow.
Stillwater Sciences. 2001. Tuolumne River substrate permeability assessment and monitoring program. Unpublished report prepared for the Turlock/Modesto Irrigation Districts and the Tuolumne River Technical Advisory Committee. Stillwater Sciences, Berkeley, California.
Vronskiy, B.B. 1972. Reproductive biology of the Kamchatka River Chinook salmon (Oncorhynchus tshawytscha (Walbaum). J. Ichthyology 12:259-273.
Wolman, M.G. 1954. A method of sampling coarse river-bed material. Transactions American Geophysical Union 35:951-956.
APPENDIX E
Upper Yuba River Chinook Salmon and Steelhead Rearing Habitat Assessment
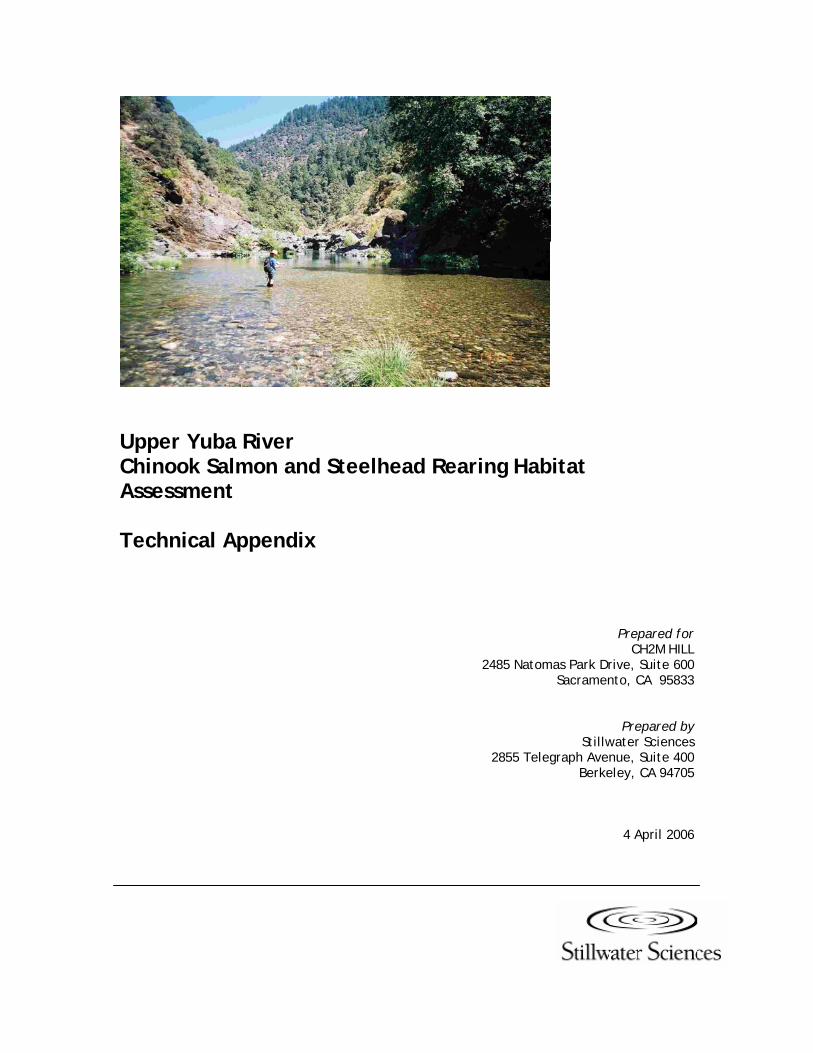
Upper Yuba River Chinook Salmon and Steelhead Rearing Habitat Assessment Technical Appendix
Prepared for CH2M HILL
2485 Natomas Park Drive, Suite 600 Sacramento, CA 95833
Prepared by Stillwater Sciences
2855 Telegraph Avenue, Suite 400 Berkeley, CA 94705
4 April 2006
Upper Yuba River Studies Program Chinook Salmon and Steelhead Rearing Habitat Assessment
Table of Contents
1 Introduction and Background ................................................................................................1
1.1 Life History of Fry and Juvenile Chinook Salmon and Steelhead ................................ 1 1.1.1 Chinook salmon..................................................................................................... 1 1.1.2 Steelhead ............................................................................................................... 2
2 Key Habitat Characteristics....................................................................................................3
2.1 Habitat Type .................................................................................................................. 3 2.2 Substrate ........................................................................................................................ 4 2.3 Cover ............................................................................................................................. 4 2.4 Large Woody Debris ..................................................................................................... 5 2.5 Riparian Vegetation....................................................................................................... 5 2.6 Channel Confinement.................................................................................................... 5 2.7 Water Temperature........................................................................................................ 6 2.8 Water Quality ................................................................................................................ 7 2.9 Food Resources ............................................................................................................. 7 2.10 Predation........................................................................................................................ 7 2.11 Diversions...................................................................................................................... 8
3 Assessment Methods and Results ...........................................................................................9
3.1 Physical Habitat........................................................................................................... 12 3.1.1 Habitat type ......................................................................................................... 12 3.1.2 Substrate .............................................................................................................. 15 3.1.3 Cover ................................................................................................................... 16 3.1.4 Large woody debris ............................................................................................. 17 3.1.5 Riparian vegetation.............................................................................................. 18 3.1.6 Channel confinement........................................................................................... 19
3.2 Comparison of Remotely-assessed Habitat Characteristics with Ground Truthing Data ............................................................................................................................ 20
3.2.1 Methods............................................................................................................... 20 3.2.2 Results ................................................................................................................. 21
4 Literature Cited .....................................................................................................................23
Tables
Table 1. Attributes assessed for each channel segment (unit), based on aerial photo and video analysis. .......................................................................................................................... 11
Table 2. Similarity between remotely-assessed habitat characteristics and ground truthing data collected in field survey reaches in the South and Middle Yuba rivers.......................... 22
Stillwater Sciences 27 June 2006
i
Upper Yuba River Studies Program Chinook Salmon and Steelhead Rearing Habitat Assessment
27 June 2006 Stillwater Sciences
ii
Figures
Figure 1. Color aerial photograph showing a portion of the South Yuba River, used as an ArcGIS layer to delineate habitat types and features related to rearing habitat for Chinook salmon and steelhead....................................................................................................... 9
Figure 2. Screen capture from digital overflight video, showing the same South Yuba River habitat unit as in Figure 1. The digital video was used in conjunction with the aerial photographs to perform the office-based rearing habitat assessment............................ 10
Figure 3. Rearing habitat ground truthing survey reaches in the Upper Yuba River watershed. . 12 Figure 4. Frequency by length of South and Middle Yuba river main channel habitat types
delineated by aerial photo and video analysis. .............................................................. 13 Figure 5. Off-channel habitat, such as this backwater located on the Middle Yuba River, serves
as important rearing and refuge habitat for young salmon and steelhead. .................... 14 Figure 6. Distribution by length of off-channel habitats in the South and Middle Yuba rivers, as
delineated by aerial photo and video analysis. .............................................................. 15 Figure 7. Frequency by length of dominant substrate types in the South and Middle Yuba rivers,
based on aerial photo and video analysis. ..................................................................... 16 Figure 8. Percentage of total channel length in the South and Middle Yuba rivers in each of five
cover classes, based on aerial photo and video analysis. .............................................. 17 Figure 9. Distribution and abundance of LWD in the South and Middle Yuba rivers, based on
aerial photo and video analysis. .................................................................................... 18 Figure 10. Percentage of the total length of both banks in the South and Middle Yuba rivers in
each of five riparian vegetation coverage classes, based on aerial photo and video analysis.......................................................................................................................... 19
Figure 11. The channel of both the South and Middle Yuba rivers in the assessment area is almost entirely confined within narrow canyon walls. ................................................. 20
Upper Yuba River Studies Program Chinook Salmon and Steelhead Rearing Habitat Assessment
1 INTRODUCTION AND BACKGROUND
The Upper Yuba River Studies Program seeks to determine the feasibility of introducing wild Chinook salmon and steelhead into the upper Yuba River upstream of Engelbright Dam. One objective of the evaluation is to determine the suitability of aquatic habitat in the upper river and its ability to support salmon and steelhead under current operations and under other potential operation scenarios. The quantity and quality of rearing habitat will be an important factor in that evaluation. This report describes the habitat needs of these species during their fresh water rearing life history stage, the methods used to assess rearing habitat under current conditions, and the results of the assessment.
1.1 Life History of Fry and Juvenile Chinook Salmon and Steelhead
Anadromous salmonids require a suite of habitat characteristics for successful rearing in fresh water. Many of these characteristics can vary in importance depending on the species, life history type (run), and season. Spring-run Chinook salmon were historically present in the Yuba River (Yoshiyama et al. 2001) and currently occur in the lower Yuba River below Engelbright Dam. This assessment is therefore focused on the spring-run life history type. Life history strategies and timing of rearing spring-run Chinook salmon and steelhead are summarized below. Rearing habitat characteristics are described in Section 2.
1.1.1 Chinook salmon
Spring-run Chinook salmon (Oncorhynchus tshawytscha) fry in the Sacramento River basin generally emerge from the gravels between November and March (Fisher 1994, Ward and McReynolds 2001). Spring-run Chinook salmon typically spend up to one year rearing in fresh water before migrating to sea, but the length of time spent rearing in freshwater also varies greatly. Juvenile Chinook may disperse downstream as fry soon after emergence; early in their first summer as fingerlings; in the fall as flows increase; or after overwintering in freshwater as yearlings (Healey 1991). Even in rivers such as the Sacramento River, where many juveniles rear until they are yearlings, some juveniles probably migrate downstream throughout the year (Nicholas and Hankin 1989). Although fry typically drift downstream following emergence (Healey 1991), movement upstream or into cooler tributaries following emergence has also been observed in some systems (Lindsay et al. 1986, Taylor and Larkin 1986). Juvenile Chinook rearing densities vary widely according to habitat conditions, presence of competitors, and life history strategies (Lister and Genoe 1970; Everest and Chapman 1972; Bjornn 1978, as cited in Bjornn and Reiser 1991; Hillman et al. 1987). Unlike rearing fall-run Chinook salmon which are present in streams only in winter and spring when flows are generally highest and water temperatures lowest, rearing spring-run Chinook may be subject to summer conditions such as high water temperatures and reduced habitat availability resulting from increased solar radiation, warmer weather, and lower summer flows. Nicholas and Hankin (1989) suggest that the duration of freshwater rearing is tied to water temperature, with juveniles remaining longer in rivers with cool water temperatures, such as the North Umpqua River, Oregon.
27 June 2006 Stillwater Sciences 1
Upper Yuba River Studies Program Chinook Salmon and Steelhead Rearing Habitat Assessment
1.1.2 Steelhead
Steelhead is the term commonly used for the anadromous life history form of rainbow trout (Oncorhynchus mykiss). Steelhead exhibit highly variable life history patterns throughout their range, but are broadly categorized into winter and summer reproductive ecotypes. Winter steelhead, the most widespread reproductive ecotype, become sexually mature in the ocean, enter spawning streams in summer, fall or winter, and spawn a few months later in winter or late spring (Meehan and Bjornn 1991, Behnke 1992). Only winter-run steelhead stocks are currently present in Central Valley streams (McEwan and Jackson 1996). Unlike Pacific salmon, adult steelhead may return to the ocean after spawning and return to freshwater to spawn in subsequent years. Juveniles typically remain in fresh water for 2–4 years before emigrating to the ocean from April–June (Barnhart 1991). In the Sacramento River, steelhead generally emigrate as 2-year olds during spring and early summer months (McEwan and Jackson 1996). Emigration appears to be more closely associated with size than age, with 6–8 inches (152–203 mm) being the most common length for downstream migrants. Downstream migration in unregulated streams has been correlated with spring freshets (Reynolds et al. 1993). Rearing steelhead, like spring-run Chinook salmon, therefore experience low flow conditions during summer and must contend with factors such as increased water temperature and reduced habitat area during summer that may reduce the quantity and/or quality of fresh water rearing habitat. Research has shown that although age 1+ smolts may compose a substantial portion of outmigrating steelhead, their survival is poor and they often contribute little to the numbers of returning adults (Shapovalov and Taft 1954, Kabel and German 1967). Survival of steelhead smolts tends to be much greater if outmigration occurs at age 2+ or 3+. Steelhead migrating downstream as juveniles may rear for one month to a year in the estuary before entering the ocean (Barnhart 1991), and the growth that takes place in estuaries may be very important for increasing the odds of marine survival (Smith 1990, McEwan and Jackson 1996). Persistence of a steelhead population is therefore highly dependent on the quantity and quality of habitat for older age classes of juvenile fish (i.e., age 2+ and, to a lesser extent, 3+ and 4+). Because larger fish have greater requirements for space and other resources, however, habitat for age 1+ and older fish is usually more limited than for age 0+ fish.
27 June 2006 Stillwater Sciences 2
Upper Yuba River Studies Program Chinook Salmon and Steelhead Rearing Habitat Assessment
2 KEY HABITAT CHARACTERISTICS
Physical habitat characteristics believed to be of primary importance (i.e., “key” habitat characteristics) for rearing Chinook salmon and steelhead are summarized briefly below. These habitat characteristics are those for which quantitative river-wide assessments were conducted. The rearing habitat assessment approach, including methods and results, is discussed in Section 3.
2.1 Habitat Type
Habitat preferences of rearing Chinook salmon and steelhead change as fish grow and become more powerful swimmers. Newly-emerged Chinook salmon fry occupy low velocity, shallow water areas near stream margins, including backwater eddies, side channels, and areas associated with bank cover such as large woody debris (LWD) (Lister and Genoe 1970, Everest and Chapman 1972, McCain 1992). After emergence, steelhead fry move to shallow water, low velocity habitats such as stream margins and low gradient riffles, and will forage in open areas lacking instream cover (Hartman 1965, Everest et al. 1986, Fontaine 1988). As they grow, young of both species are able to utilize faster and deeper water, broadening the range of habitats they can occupy. As Chinook salmon fry increase in size and their swimming abilities improve in late summer and fall, they increasingly use areas with cover and show a preference for higher velocity, deeper mid-channel areas (Hartman 1965, Everest and Chapman 1972, Fontaine 1988). Age 0+ steelhead have been found to be relatively abundant in backwater pools and in the downstream ends of pools in late summer (Bisson et al. 1988, Fontaine 1988). Steelhead fry may also be found in low gradient riffles. Pools and other locations with deep, cool water are generally expected to provide preferred summer habitat for rearing Chinook salmon and steelhead. Juvenile Chinook salmon appear to prefer pools that have cover provided by banks, overhanging vegetation, large substrates, or LWD. Juvenile Chinook salmon densities in pools have been found to increase with increasing amounts of cover (Steward and Bjornn 1987). Water temperature may also influence juvenile habitat use. In the South Umpqua River basin, Oregon, Roper et al. (1994) observed lower densities of juvenile Chinook where water temperatures were higher. In areas where more suitable water temperatures were available, juvenile Chinook salmon abundance appeared to be tied to pool availability. As steelhead grow larger, they tend to prefer microhabitats (or “focal points”) with deeper water and higher velocity, attempting to find areas with an optimal balance of food supply and energy expenditure, such as velocity refuge positions associated with boulders or other large roughness elements close to fast current areas with high invertebrate drift rates (Everest and Chapman 1972, Bisson et al. 1988, Fausch 1993). Age 1+ steelhead typically feed in pools, and appear to avoid secondary channels and dammed pools, glides, and shallow riffles (Fontaine 1988, Bisson et al. 1988, Dambacher 1991). Age 1+ steelhead prefer high velocity pool heads (where food resources are abundant) and pool tails (which provide optimal feeding conditions in summer due to lower energy expenditure requirements than the more turbulent pool heads) (Reedy 1995). During the winter period of inactivity, steelhead prefer pool habitats with cover, especially low velocity, deeper pools, including backwater and dammed pools (Hartman 1965, Swales et al. 1986, Raleigh et al. 1984, Fontaine 1988).
27 June 2006 Stillwater Sciences 3
Upper Yuba River Studies Program Chinook Salmon and Steelhead Rearing Habitat Assessment
2.2 Substrate
The shallow, low-velocity habitats used by newly emerged Chinook salmon and steelhead fry are generally characterized by finer substrates such as silt and sand. Everest and Chapman (1972) found that spring-run Chinook salmon fry appeared to be most closely associated with substrates ranging in size from silt to 20-cm diameter rubble, with the highest fry densities observed over silt and sand. As they grow, juveniles of both species occur more commonly in association with larger substrates such as gravel, cobble, and boulders. Chinook salmon and steelhead parr (age 1+) seek out larger substrates and may use clast interstices as resting areas during periods of inactivity and as refuge from high flows. During periods of low temperatures and high flows associated with the winter months, age 0+ steelhead tend to reside in rubble substrates (4–10 inch [10–25 cm] diameter) in shallow, low velocity areas near the stream margin (Bustard and Narver 1975). Overwintering juvenile Chinook salmon appear to use deep pools with LWD and interstitial habitat provided by boulders and cobble substrate (Healey 1991, Swales et al. 1986, Levings and Lauzier 1991). Hillman et al. (1987) found that the addition of cobble substrate to glide areas in the fall substantially increases winter rearing densities in these areas, with Chinook appearing to prefer interstitial spaces between the cobbles as cover. Embeddedness by fine sediments may reduce the value of gravel and cobble substrate as winter cover, potentially forcing juvenile Chinook to migrate elsewhere in search of winter cover (Hillman et al. 1987, Stuehrenberg 1975). Stuehrenberg (1975) found that juvenile Chinook salmon were displaced when sediment filled gravel interstices. Large sediment particles (cobbles and boulders) are also used as ‘home stones’ providing refuge from the flow during drift feeding (Morantz et al. 1987).
2.3 Cover
Instream and overhead cover are important to rearing Chinook salmon and steelhead during all freshwater life stages and all seasons. As fry, Chinook and steelhead in near-shore areas rely on overhanging vegetation, LWD and other bank cover to reduce the risk of predation. A CDFG study conducted in the upper Sacramento River found that Chinook salmon fry and juveniles are commonly found in areas with both overhead and instream cover (Brown 1990, as cited in Fris and DeHaven 1993). Steelhead fry, however, appear to be somewhat less dependent on cover than Chinook salmon fry, and may forage in areas that lack cover (Hartman 1965, Everest et al. 1986, Fontaine 1988). During summer, juveniles of both species are closely associated with overhead and complex instream cover, including overhanging vegetation, undercut banks, LWD, and large substrates. During the warmer parts of the year, steelhead parr appear to prefer habitats with cover provided by rocky substrates, overhead cover, and low light intensities (Hartman 1965, Facchin and Slaney 1977, Ward and Slaney 1979, Fausch 1993). In winter, rearing Chinook salmon and steelhead seek areas with low water velocities and instream cover, such as well-vegetated, undercut banks, deep pools with LWD, and interstitial habitat provided by boulders and cobble substrate. Hillman et al. (1987) found that juvenile Chinook salmon remaining in tributaries to overwinter chose areas with cover and low water velocities, such as areas along well-vegetated, undercut banks. During the winter period, age 1+ steelhead use interstices between assemblages of large boulders (>39 in [100 cm] diameter), logs, and/or rootwads as winter cover (Bustard and Narver 1975, Everest et al. 1986).
27 June 2006 Stillwater Sciences 4
Upper Yuba River Studies Program Chinook Salmon and Steelhead Rearing Habitat Assessment
2.4 Large Woody Debris
Large woody debris can be a key habitat component for rearing salmonids throughout their fresh water residence. Large woody debris exerts a strong control on channel morphology and provides refuge from predation and high flows. The distribution and abundance of juvenile salmonids in streams has often been shown to be positively correlated with the quantity and quality of woody cover. Steward and Bjornn 1987) found that the amount of woody debris was among the most important factors influencing density of juvenile Chinook salmon and steelhead in experimental pools. Although steelhead have generally been found to prefer large substrates (i.e., boulder and cobble) or other features as cover, age 1+ steelhead will also use logs, and/or rootwads as winter cover (Bustard and Narver 1975, Everest et al. 1986). In addition to providing cover, LWD also traps and stores sediment, thereby influencing channel morphology and the configuration and distribution of habitat for rearing salmonids. By storing sediment, LWD exerts an important local control on channel morphology (Montgomery and Buffington 1997). Generally, the influence of LWD increases morphological heterogeneity, providing greater hydraulic and sedimentary complexity and, therefore, habitat diversity.
2.5 Riparian Vegetation
Riparian vegetation provides overhead cover for rearing salmonids and, by shading the channel, helps reduce incident solar radiation and maintain cool water temperatures (Beschta et al. 1987, Poole 2002). Organic input from leaf litter fall and woody debris also serves as an important source of nutrients for the river food web (Gregory et al. 1991, Naiman et al. 1992). Many of the aquatic invertebrates used as food by rearing Chinook salmon and steelhead are dependent on nutrients derived from riparian vegetation. The importance of riparian vegetation for rearing Chinook and steelhead is undoubtedly greatest in spring and summer, when vegetation biomass is highest and the leaves of deciduous riparian trees provide shade and increased overhead cover for vulnerable fry and juveniles.
2.6 Channel Confinement
The degree to which a river channel is constrained within the walls of its valley, or channel confinement, can be an important determinant of the amount of off-channel or floodplain habitat available to rearing salmonid fry. Confined channels have little or no room on the valley bottom to form lateral meanders and are therefore relatively straight, generally paralleling the valley walls. Since lateral confinement produces relatively high bed slopes (due to low sinuosity) and minimal floodplain area to dissipate the energy of overbank flows, water velocity is higher during floods compared to unconfined valleys. The resultant high transport capacity exhibited by such channels tends to produce plane bed and step-pool morphologies that are characterized by coarser sediments (Montgomery and Buffington 1997). Therefore, there are fewer of the high quality backwater and side channel habitats preferred by salmonid fry. Salmonids rearing in confined channels are subject to scour and displacement during high flows if velocity refugia are not available. However, cobble- and boulder-sized sediments provide important rearing, sheltering and overwintering for the parr (age 1+) life stage (Bustard and Narver 1975, Coulombe-Pontbriand and Lapointe 2004).
27 June 2006 Stillwater Sciences 5
Upper Yuba River Studies Program Chinook Salmon and Steelhead Rearing Habitat Assessment
In addition to the above physical habitat characteristics, several other factors may have an important influence on the success of rearing salmon and steelhead. These factors are addressed separately below. In addition to physical habitat characteristics, a number of other factors influence the quality of habitat and fresh water rearing success of anadromous salmonids. Several of these factors, considered to be of potential importance to rearing Chinook salmon and steelhead in the Upper Yuba River study area, are summarized below.
2.7 Water Temperature
Salmonids have relatively narrow temperature tolerances during rearing. Although fish may survive water temperature extremes, altered metabolic processes at high and low temperatures result in reduced growth. Water temperatures in streams can fluctuate widely on both a seasonal and daily basis, especially in streams with little shade and/or low summer flows. In the Upper Yuba River basin, it is likely that high water temperatures are a key limiting factor for salmonids during summer/fall rearing, primarily because of streamflow regulation, lack of riparian shade, and ambient temperature conditions in summer and fall. Water temperature may also be an important determinant of juvenile habitat use. In the South Umpqua River basin, Oregon, Roper et al. (1994) observed lower densities of juvenile Chinook salmon where water temperatures were higher. In areas where more suitable water temperatures were available, juvenile Chinook salmon abundance appeared to be tied to pool availability. Water temperature can exert strong influence on the amount of usable summer rearing habitat for Chinook salmon and steelhead in the Upper Yuba River basin. Temperatures also have a significant effect on juvenile growth rates. On maximum daily rations, growth rate increases with temperature to a certain point and then declines with further increases. Reduced rations can also result in reduced growth rates; therefore, declines in juvenile salmonid growth rates are a function of both temperature and food availability. Juvenile Central Valley spring-run Chinook salmon prefer rearing temperatures around 60°F (15.6°C) (NOAA 2002, as cited in CDWR 2004), with a reported range for optimum growth of 56–60°F (13.2–15.3°C) for American River Chinook salmon (Rich 1987, FERC 1993). Depending on acclimation temperature, the upper incipient lethal temperature for Chinook salmon of Sacramento River origin reportedly ranges from 75–84°F (24–28.8°C ) (Rich 1987, Hanson 1991, Cech and Myrick 1999, Myrick and Cech 2001). The upper lethal temperature is dependent on the temperature to which fish are already acclimated, and will increase—up to a certain point—as fish are acclimated to increasingly higher temperatures. Rearing steelhead can apparently tolerate slightly higher temperatures than Chinook salmon. Myrick and Cech (2000, as cited in Myrick and Cech 2001) report a preferred rearing temperature of 63°F (17°C) for Central Valley steelhead (wild Feather River fish). Temperatures for optimum growth and development of juvenile steelhead, based on laboratory studies, range from 59–66°F (15–19°C) (Myrick and Cech 2001). Temperatures >77°F (25°C) are reportedly lethal to juvenile Central Valley steelhead (Myrick and Cech 2001, FERC 1993).
27 June 2006 Stillwater Sciences 6
Upper Yuba River Studies Program Chinook Salmon and Steelhead Rearing Habitat Assessment
2.8 Water Quality
Besides water temperature, a variety of other water quality parameters can affect the distribution and abundance of rearing salmonids in streams. These include turbidity, dissolved oxygen, nutrients, fertilizers, pesticides, and other toxic chemicals. Some of these parameters, such as dissolved oxygen and toxic chemicals, can directly influence rearing success by causing mortality. Other water quality problems may have indirect impacts on rearing success by reducing habitat quality or the availability of food resources. Heavy metals may also have direct or indirect effects on salmonid rearing success. Water quality parameters were not assessed as part of the rearing habitat analysis. However, we are not aware of any evidence to indicate that water quality in the Upper Yuba River study area would be problematic for rearing Chinook salmon or steelhead.
2.9 Food Resources
The availability of food is a key requirement for rearing salmonids. Aquatic macroinvertebrates are the primary food consumed by salmonids in streams. Production of aquatic invertebrates depends in large part on the amount of organic material available in the stream food web. The abundance and diversity of aquatic macroinvertebrates in a stream can be determined only by intensive sampling and analysis. Macroinvertebrate sampling was not conducted as part of the rearing habitat analysis. However, based on preliminary observations of benthic macroinvertebrates made during field surveys, it appears that the abundance and diversity of macroinvertebrates in the South and Middle Yuba rivers is likely to compare favorably with other salmonid streams in northern California.
2.10 Predation
Rearing salmonids are subject to predation during their entire freshwater residence. In river systems where introduced piscivorous fish are abundant, predation pressure on salmonid fry, juveniles, and smolts may be particularly high. In the lower Tuolumne River, introduced predators such as largemouth bass were estimated to contribute to as much as 70% of the mortality of outmigrating juvenile Chinook salmon documented by the California Department of Fish and Game in 1987 (TID/MID 1992). Fish survey data from the South Yuba River indicate the presence of introduced predatory smallmouth bass, bluegill, and green sunfish downstream of Starvation Bar (Moyle and Gard 1993, FERC 1987, as cited in Moyle and Gard 1993). Largemouth bass were recorded from the South Yuba River by FERC (1987, as cited in Moyle and Gard 1993), but no location information was given for this species and location data were not found by Moyle and Gard (1993). The Northwest Power Company (1983, as cited in Moyle and Gard 1993) reported that smallmouth bass composed 2% of the fish population in sampled portions of the South Yuba River upstream of Hoyt Crossing. In addition to these species, data from the US Army Corps of Engineers (1991, as cited in Moyle and Gard 1993) indicate that Alabama spotted bass, another piscivorous species, were stocked in Englebright Reservoir in 1986. Moyle and Gard (1993) suggest that the persistence of the smallmouth bass population in the South Yuba River depends on immigration from Englebright Reservoir. No fish species composition or distribution data were available for the Middle Yuba River, but it is likely that species composition is similar to the South Yuba
27 June 2006 Stillwater Sciences 7
Upper Yuba River Studies Program Chinook Salmon and Steelhead Rearing Habitat Assessment
River where similar habitat conditions occur and passage is possible upstream of Englebright Reservoir. Moyle and Gard (1993) observed that predation by smallmouth bass appeared to be limiting the abundance of native Sacramento pikeminnow and hardhead in the South Yuba River downstream of Starvation Bar. Although it is not possible to quantify the potential effects of predation on anadromous salmonids, it can be assumed that introduced predators would have some impact on outmigrating Chinook salmon and steelhead. However, salmon and steelhead rearing in upstream areas would not likely be subject to substantial predation by introduced piscivores because preferred salmonid rearing habitat is not expected to overlap significantly with habitat used by introduced predators.
2.11 Diversions
Water diversions can impact populations of rearing salmonids both directly and indirectly. Direct impacts include mortality or injury due to entrainment in the diversion or, if the diversion is screened, impingement at the intake screen. Indirect impacts may result from displacement by entrainment as well as habitat loss due to reduced streamflow downstream of the diversion. There is only one major diversion in the Upper Yuba River study area, located at Our House Dam on the Middle Yuba River upstream of Oregon Creek (approximately 12 miles upstream of the confluence with the North Yuba River). Water pooled behind Our House Dam is diverted through an unscreened intake into the Lohman Ridge tunnel. The Lohman Ridge tunnel has a diversion capacity of 850 cfs. Fish that enter the tunnel will end up in Oregon Creek or New Bullards Bar Reservoir. Mortality rates for entrained fish are unknown, but are expected to be low since there are no physical impediments associated with the tunnel (e.g., screens, pipes, valves, turbines). Despite the low expected mortality, any fish diverted into New Bullards Bar Reservoir will be lost from the Middle Yuba River population. Outmigrating salmonids entrained in the Lohman Ridge tunnel and ending up in New Bullards Bar Reservoir would be prevented from continuing their downstream migration and would not contribute to adult returns. It is possible that fish diverted into Oregon Creek (but not continuing to New Bullards Bar Reservoir) could re-enter the Middle Yuba River and potentially contribute to the Middle Yuba River population. The proportion of entrained fish that might re-enter the Middle Yuba River in this manner is unknown.
27 June 2006 Stillwater Sciences 8
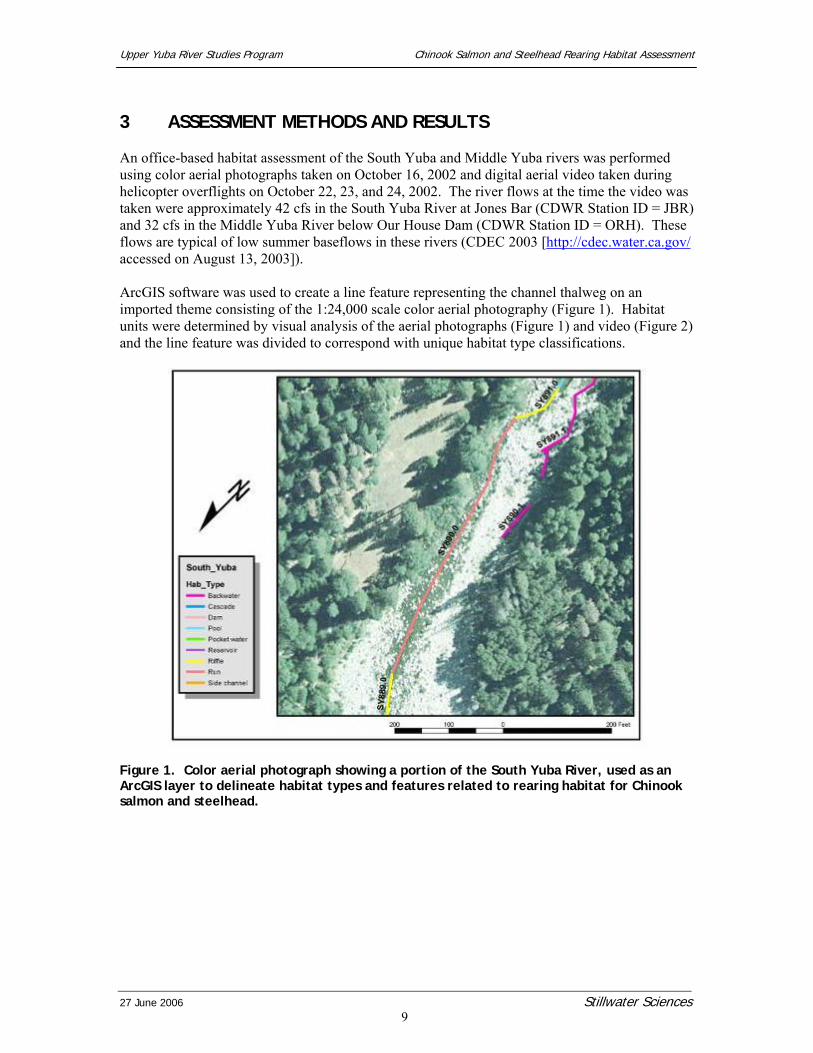
Upper Yuba River Studies Program Chinook Salmon and Steelhead Rearing Habitat Assessment
3 ASSESSMENT METHODS AND RESULTS
An office-based habitat assessment of the South Yuba and Middle Yuba rivers was performed using color aerial photographs taken on October 16, 2002 and digital aerial video taken during helicopter overflights on October 22, 23, and 24, 2002. The river flows at the time the video was taken were approximately 42 cfs in the South Yuba River at Jones Bar (CDWR Station ID = JBR) and 32 cfs in the Middle Yuba River below Our House Dam (CDWR Station ID = ORH). These flows are typical of low summer baseflows in these rivers (CDEC 2003 [http://cdec.water.ca.gov/ accessed on August 13, 2003]). ArcGIS software was used to create a line feature representing the channel thalweg on an imported theme consisting of the 1:24,000 scale color aerial photography (Figure 1). Habitat units were determined by visual analysis of the aerial photographs (Figure 1) and video (Figure 2) and the line feature was divided to correspond with unique habitat type classifications.
Figure 1. Color aerial photograph showing a portion of the South Yuba River, used as an ArcGIS layer to delineate habitat types and features related to rearing habitat for Chinook salmon and steelhead.
27 June 2006 Stillwater Sciences 9
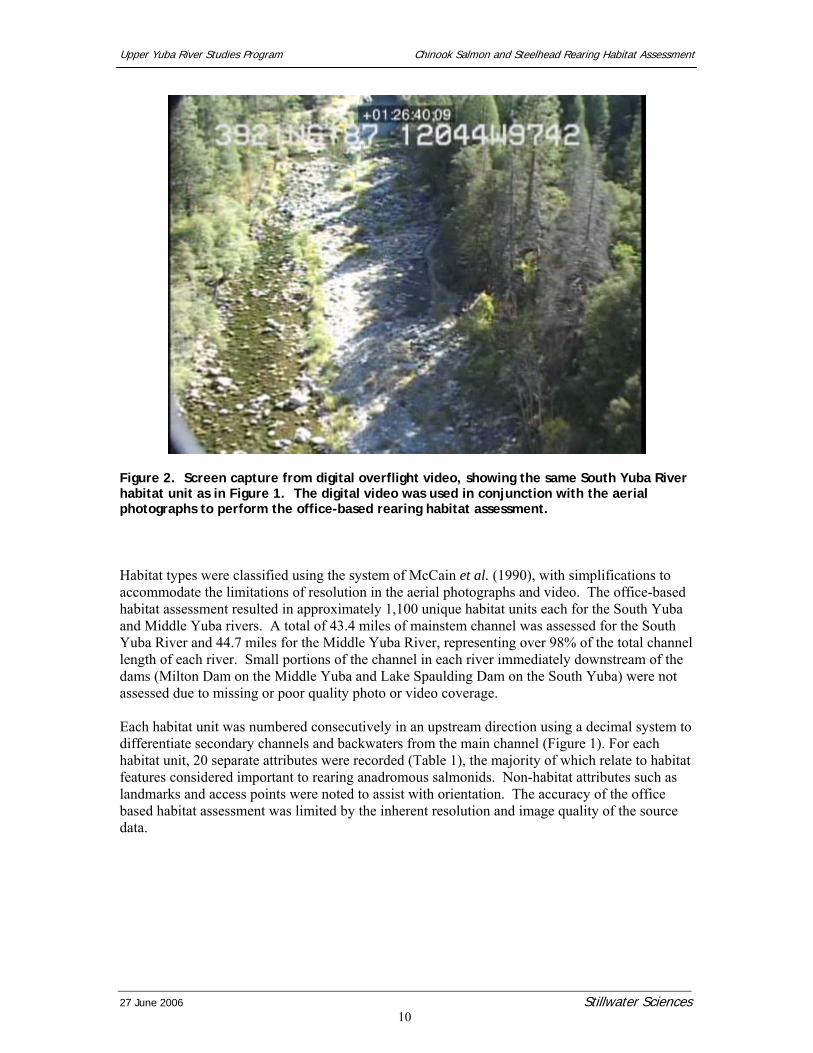
Upper Yuba River Studies Program Chinook Salmon and Steelhead Rearing Habitat Assessment
Figure 2. Screen capture from digital overflight video, showing the same South Yuba River habitat unit as in Figure 1. The digital video was used in conjunction with the aerial photographs to perform the office-based rearing habitat assessment.
Habitat types were classified using the system of McCain et al. (1990), with simplifications to accommodate the limitations of resolution in the aerial photographs and video. The office-based habitat assessment resulted in approximately 1,100 unique habitat units each for the South Yuba and Middle Yuba rivers. A total of 43.4 miles of mainstem channel was assessed for the South Yuba River and 44.7 miles for the Middle Yuba River, representing over 98% of the total channel length of each river. Small portions of the channel in each river immediately downstream of the dams (Milton Dam on the Middle Yuba and Lake Spaulding Dam on the South Yuba) were not assessed due to missing or poor quality photo or video coverage. Each habitat unit was numbered consecutively in an upstream direction using a decimal system to differentiate secondary channels and backwaters from the main channel (Figure 1). For each habitat unit, 20 separate attributes were recorded (Table 1), the majority of which relate to habitat features considered important to rearing anadromous salmonids. Non-habitat attributes such as landmarks and access points were noted to assist with orientation. The accuracy of the office based habitat assessment was limited by the inherent resolution and image quality of the source data.
27 June 2006 Stillwater Sciences 10
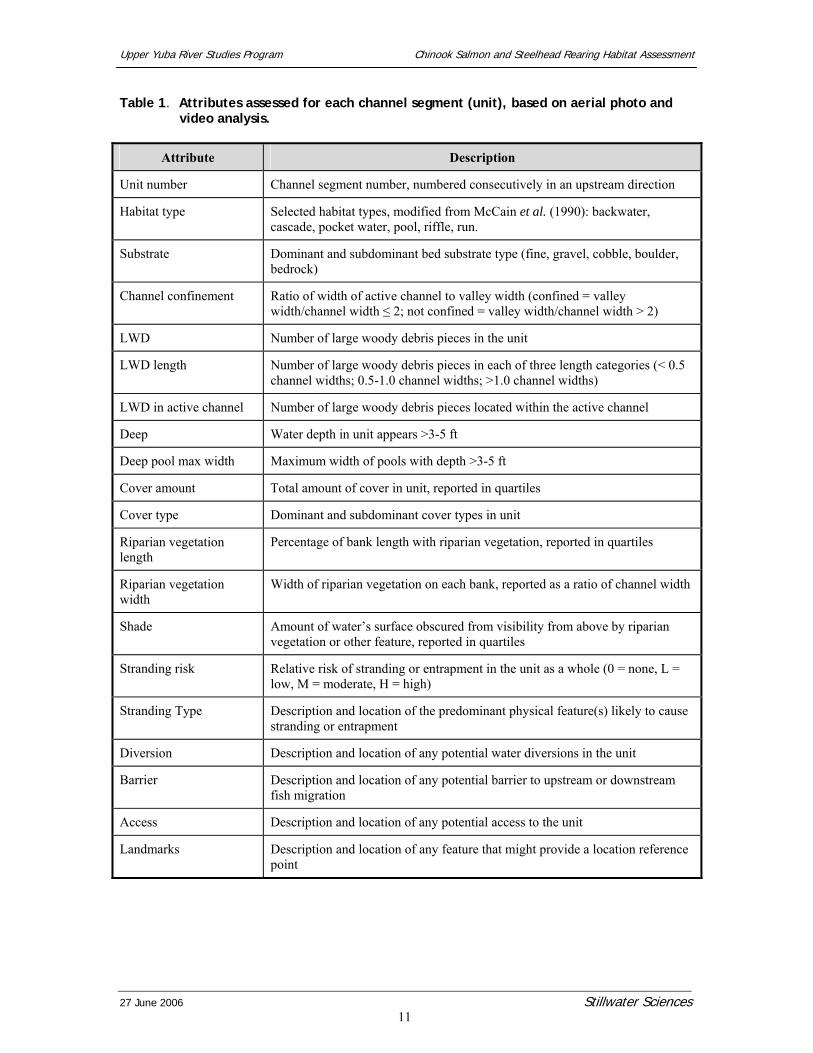
Upper Yuba River Studies Program Chinook Salmon and Steelhead Rearing Habitat Assessment
Table 1. Attributes assessed for each channel segment (unit), based on aerial photo and video analysis.
Attribute Description
Unit number Channel segment number, numbered consecutively in an upstream direction
Habitat type Selected habitat types, modified from McCain et al. (1990): backwater, cascade, pocket water, pool, riffle, run.
Substrate Dominant and subdominant bed substrate type (fine, gravel, cobble, boulder, bedrock)
Channel confinement Ratio of width of active channel to valley width (confined = valley width/channel width ≤ 2; not confined = valley width/channel width > 2)
LWD Number of large woody debris pieces in the unit
LWD length Number of large woody debris pieces in each of three length categories (< 0.5 channel widths; 0.5-1.0 channel widths; >1.0 channel widths)
LWD in active channel Number of large woody debris pieces located within the active channel
Deep Water depth in unit appears >3-5 ft
Deep pool max width Maximum width of pools with depth >3-5 ft
Cover amount Total amount of cover in unit, reported in quartiles
Cover type Dominant and subdominant cover types in unit
Riparian vegetation length
Percentage of bank length with riparian vegetation, reported in quartiles
Riparian vegetation width
Width of riparian vegetation on each bank, reported as a ratio of channel width
Shade Amount of water’s surface obscured from visibility from above by riparian vegetation or other feature, reported in quartiles
Stranding risk Relative risk of stranding or entrapment in the unit as a whole (0 = none, L = low, M = moderate, H = high)
Stranding Type Description and location of the predominant physical feature(s) likely to cause stranding or entrapment
Diversion Description and location of any potential water diversions in the unit
Barrier Description and location of any potential barrier to upstream or downstream fish migration
Access Description and location of any potential access to the unit
Landmarks Description and location of any feature that might provide a location reference point
27 June 2006 Stillwater Sciences 11
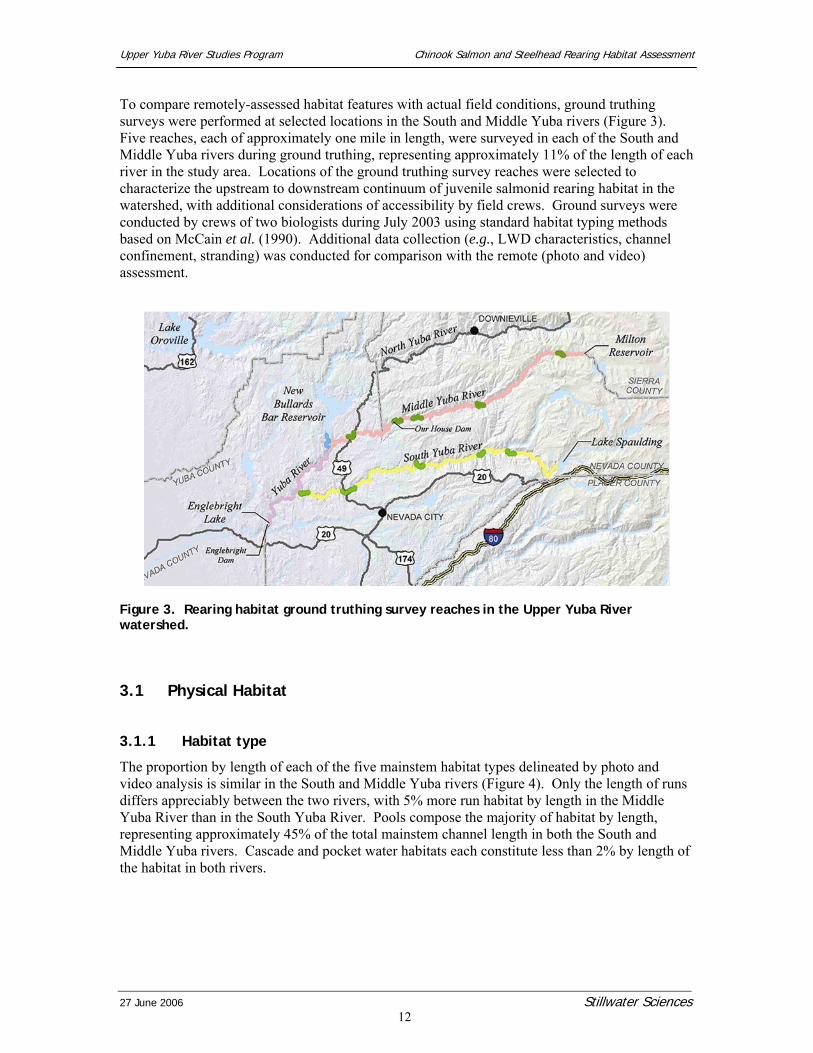
Upper Yuba River Studies Program Chinook Salmon and Steelhead Rearing Habitat Assessment
To compare remotely-assessed habitat features with actual field conditions, ground truthing surveys were performed at selected locations in the South and Middle Yuba rivers (Figure 3). Five reaches, each of approximately one mile in length, were surveyed in each of the South and Middle Yuba rivers during ground truthing, representing approximately 11% of the length of each river in the study area. Locations of the ground truthing survey reaches were selected to characterize the upstream to downstream continuum of juvenile salmonid rearing habitat in the watershed, with additional considerations of accessibility by field crews. Ground surveys were conducted by crews of two biologists during July 2003 using standard habitat typing methods based on McCain et al. (1990). Additional data collection (e.g., LWD characteristics, channel confinement, stranding) was conducted for comparison with the remote (photo and video) assessment.
Figure 3. Rearing habitat ground truthing survey reaches in the Upper Yuba River watershed.
3.1 Physical Habitat
3.1.1 Habitat type
The proportion by length of each of the five mainstem habitat types delineated by photo and video analysis is similar in the South and Middle Yuba rivers (Figure 4). Only the length of runs differs appreciably between the two rivers, with 5% more run habitat by length in the Middle Yuba River than in the South Yuba River. Pools compose the majority of habitat by length, representing approximately 45% of the total mainstem channel length in both the South and Middle Yuba rivers. Cascade and pocket water habitats each constitute less than 2% by length of the habitat in both rivers.
27 June 2006 Stillwater Sciences 12
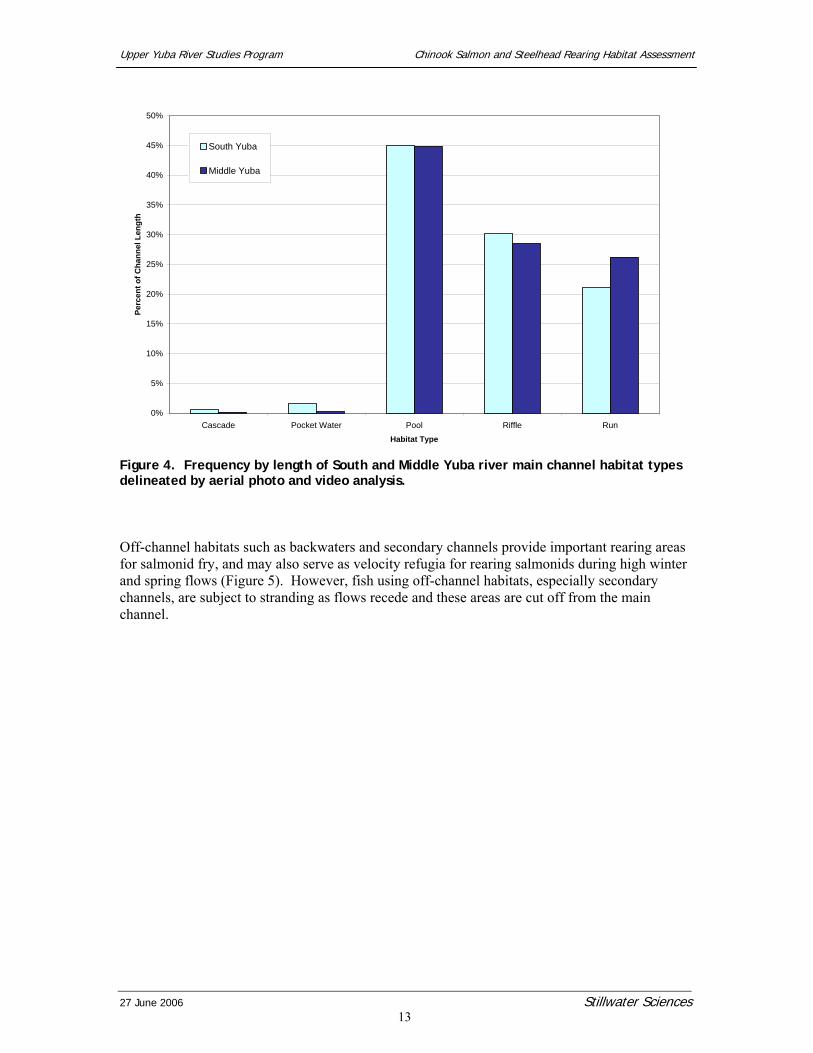
Upper Yuba River Studies Program Chinook Salmon and Steelhead Rearing Habitat Assessment
0%
5%
10%
15%
20%
25%
30%
35%
40%
45%
50%
Cascade Pocket Water Pool Riffle RunHabitat Type
Perc
ent o
f Cha
nnel
Len
gth
South Yuba
Middle Yuba
Figure 4. Frequency by length of South and Middle Yuba river main channel habitat types delineated by aerial photo and video analysis.
Off-channel habitats such as backwaters and secondary channels provide important rearing areas for salmonid fry, and may also serve as velocity refugia for rearing salmonids during high winter and spring flows (Figure 5). However, fish using off-channel habitats, especially secondary channels, are subject to stranding as flows recede and these areas are cut off from the main channel.
27 June 2006 Stillwater Sciences 13
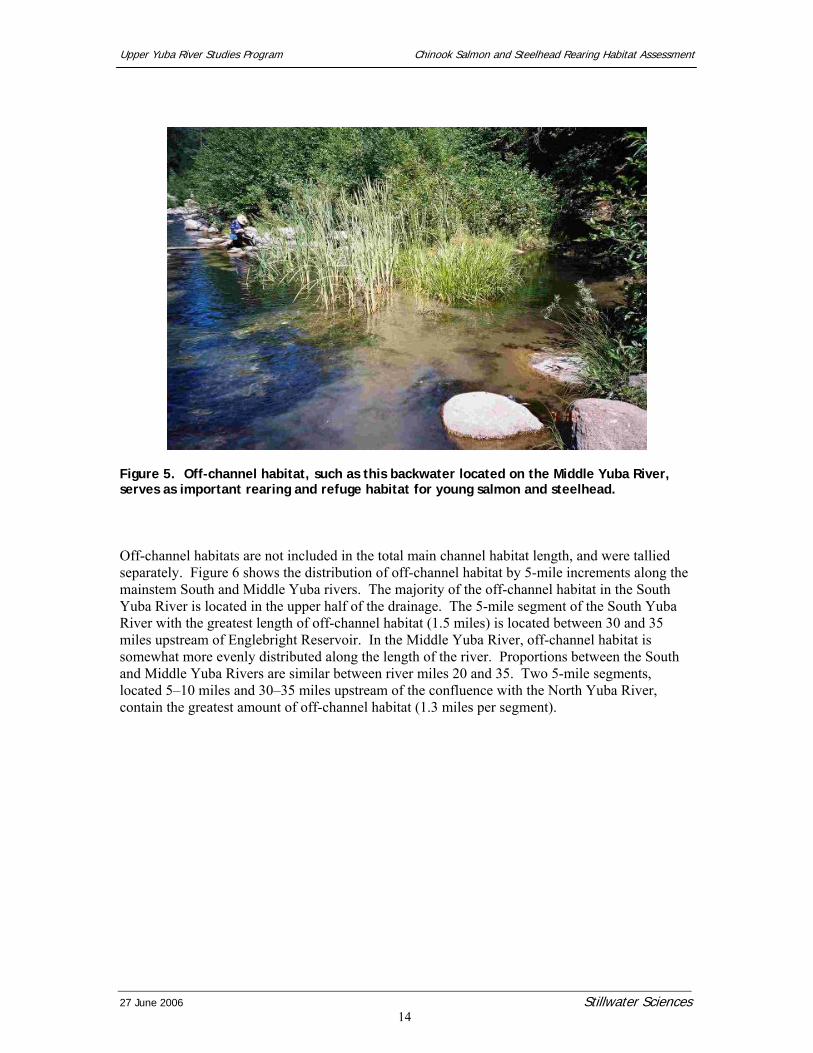
Upper Yuba River Studies Program Chinook Salmon and Steelhead Rearing Habitat Assessment
Figure 5. Off-channel habitat, such as this backwater located on the Middle Yuba River, serves as important rearing and refuge habitat for young salmon and steelhead.
Off-channel habitats are not included in the total main channel habitat length, and were tallied separately. Figure 6 shows the distribution of off-channel habitat by 5-mile increments along the mainstem South and Middle Yuba rivers. The majority of the off-channel habitat in the South Yuba River is located in the upper half of the drainage. The 5-mile segment of the South Yuba River with the greatest length of off-channel habitat (1.5 miles) is located between 30 and 35 miles upstream of Englebright Reservoir. In the Middle Yuba River, off-channel habitat is somewhat more evenly distributed along the length of the river. Proportions between the South and Middle Yuba Rivers are similar between river miles 20 and 35. Two 5-mile segments, located 5–10 miles and 30–35 miles upstream of the confluence with the North Yuba River, contain the greatest amount of off-channel habitat (1.3 miles per segment).
27 June 2006 Stillwater Sciences 14
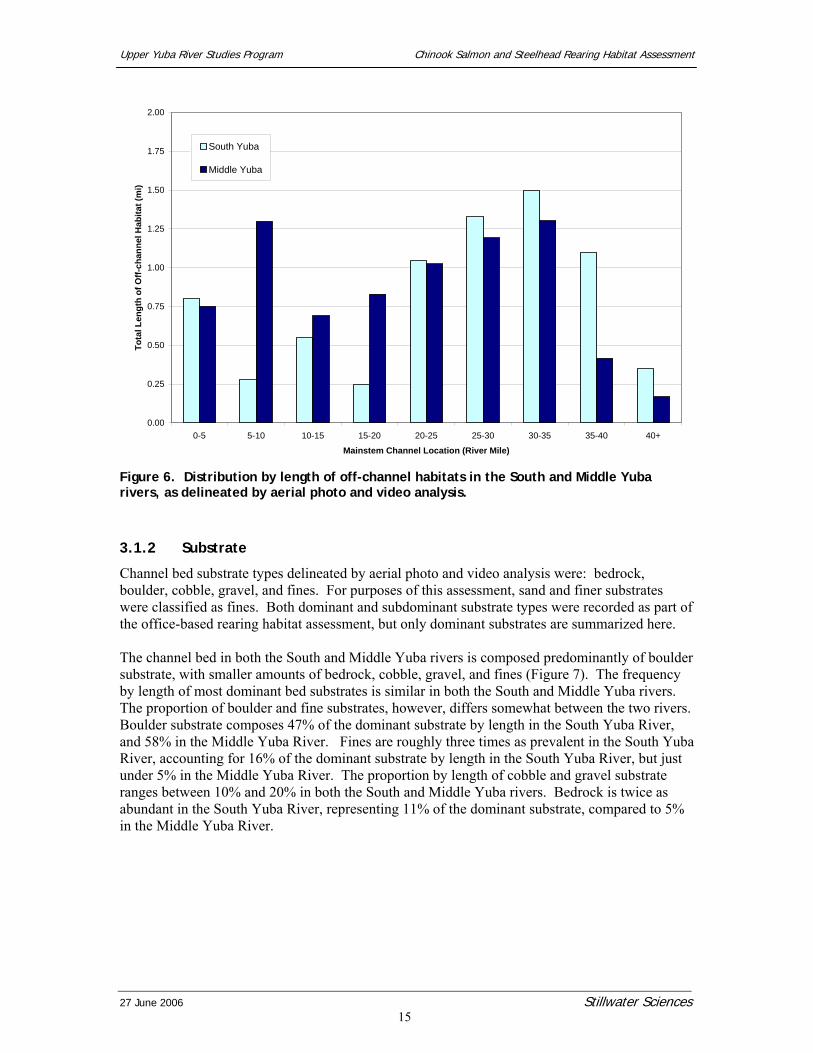
Upper Yuba River Studies Program Chinook Salmon and Steelhead Rearing Habitat Assessment
0.00
0.25
0.50
0.75
1.00
1.25
1.50
1.75
2.00
0-5 5-10 10-15 15-20 20-25 25-30 30-35 35-40 40+
Mainstem Channel Location (River Mile)
Tota
l Len
gth
of O
ff-ch
anne
l Hab
itat (
mi)
South Yuba
Middle Yuba
Figure 6. Distribution by length of off-channel habitats in the South and Middle Yuba rivers, as delineated by aerial photo and video analysis.
3.1.2 Substrate
Channel bed substrate types delineated by aerial photo and video analysis were: bedrock, boulder, cobble, gravel, and fines. For purposes of this assessment, sand and finer substrates were classified as fines. Both dominant and subdominant substrate types were recorded as part of the office-based rearing habitat assessment, but only dominant substrates are summarized here. The channel bed in both the South and Middle Yuba rivers is composed predominantly of boulder substrate, with smaller amounts of bedrock, cobble, gravel, and fines (Figure 7). The frequency by length of most dominant bed substrates is similar in both the South and Middle Yuba rivers. The proportion of boulder and fine substrates, however, differs somewhat between the two rivers. Boulder substrate composes 47% of the dominant substrate by length in the South Yuba River, and 58% in the Middle Yuba River. Fines are roughly three times as prevalent in the South Yuba River, accounting for 16% of the dominant substrate by length in the South Yuba River, but just under 5% in the Middle Yuba River. The proportion by length of cobble and gravel substrate ranges between 10% and 20% in both the South and Middle Yuba rivers. Bedrock is twice as abundant in the South Yuba River, representing 11% of the dominant substrate, compared to 5% in the Middle Yuba River.
27 June 2006 Stillwater Sciences 15
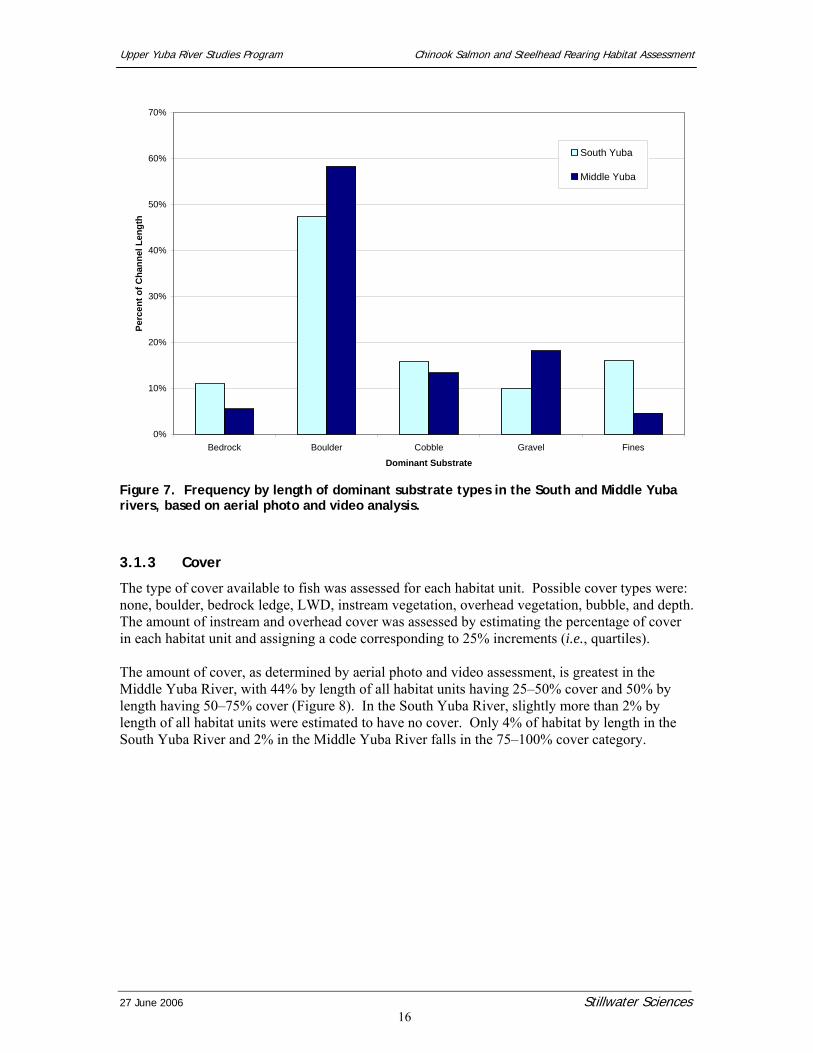
Upper Yuba River Studies Program Chinook Salmon and Steelhead Rearing Habitat Assessment
0%
10%
20%
30%
40%
50%
60%
70%
Bedrock Boulder Cobble Gravel Fines
Dominant Substrate
Perc
ent o
f Cha
nnel
Len
gth
South Yuba
Middle Yuba
Figure 7. Frequency by length of dominant substrate types in the South and Middle Yuba rivers, based on aerial photo and video analysis.
3.1.3 Cover
The type of cover available to fish was assessed for each habitat unit. Possible cover types were: none, boulder, bedrock ledge, LWD, instream vegetation, overhead vegetation, bubble, and depth. The amount of instream and overhead cover was assessed by estimating the percentage of cover in each habitat unit and assigning a code corresponding to 25% increments (i.e., quartiles). The amount of cover, as determined by aerial photo and video assessment, is greatest in the Middle Yuba River, with 44% by length of all habitat units having 25–50% cover and 50% by length having 50–75% cover (Figure 8). In the South Yuba River, slightly more than 2% by length of all habitat units were estimated to have no cover. Only 4% of habitat by length in the South Yuba River and 2% in the Middle Yuba River falls in the 75–100% cover category.
27 June 2006 Stillwater Sciences 16
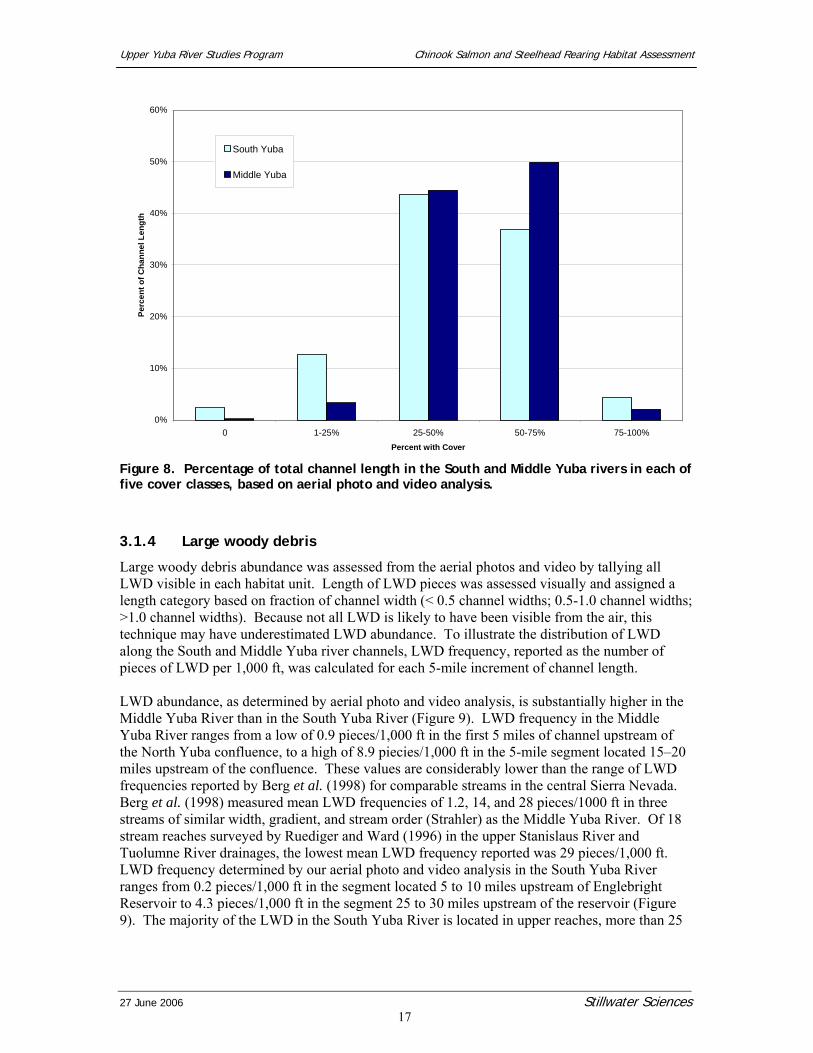
Upper Yuba River Studies Program Chinook Salmon and Steelhead Rearing Habitat Assessment
0%
10%
20%
30%
40%
50%
60%
0 1-25% 25-50% 50-75% 75-100%Percent with Cover
Perc
ent o
f Cha
nnel
Len
gth
South Yuba
Middle Yuba
Figure 8. Percentage of total channel length in the South and Middle Yuba rivers in each of five cover classes, based on aerial photo and video analysis.
3.1.4 Large woody debris
Large woody debris abundance was assessed from the aerial photos and video by tallying all LWD visible in each habitat unit. Length of LWD pieces was assessed visually and assigned a length category based on fraction of channel width (< 0.5 channel widths; 0.5-1.0 channel widths; >1.0 channel widths). Because not all LWD is likely to have been visible from the air, this technique may have underestimated LWD abundance. To illustrate the distribution of LWD along the South and Middle Yuba river channels, LWD frequency, reported as the number of pieces of LWD per 1,000 ft, was calculated for each 5-mile increment of channel length. LWD abundance, as determined by aerial photo and video analysis, is substantially higher in the Middle Yuba River than in the South Yuba River (Figure 9). LWD frequency in the Middle Yuba River ranges from a low of 0.9 pieces/1,000 ft in the first 5 miles of channel upstream of the North Yuba confluence, to a high of 8.9 piecies/1,000 ft in the 5-mile segment located 15–20 miles upstream of the confluence. These values are considerably lower than the range of LWD frequencies reported by Berg et al. (1998) for comparable streams in the central Sierra Nevada. Berg et al. (1998) measured mean LWD frequencies of 1.2, 14, and 28 pieces/1000 ft in three streams of similar width, gradient, and stream order (Strahler) as the Middle Yuba River. Of 18 stream reaches surveyed by Ruediger and Ward (1996) in the upper Stanislaus River and Tuolumne River drainages, the lowest mean LWD frequency reported was 29 pieces/1,000 ft. LWD frequency determined by our aerial photo and video analysis in the South Yuba River ranges from 0.2 pieces/1,000 ft in the segment located 5 to 10 miles upstream of Englebright Reservoir to 4.3 pieces/1,000 ft in the segment 25 to 30 miles upstream of the reservoir (Figure 9). The majority of the LWD in the South Yuba River is located in upper reaches, more than 25
27 June 2006 Stillwater Sciences 17
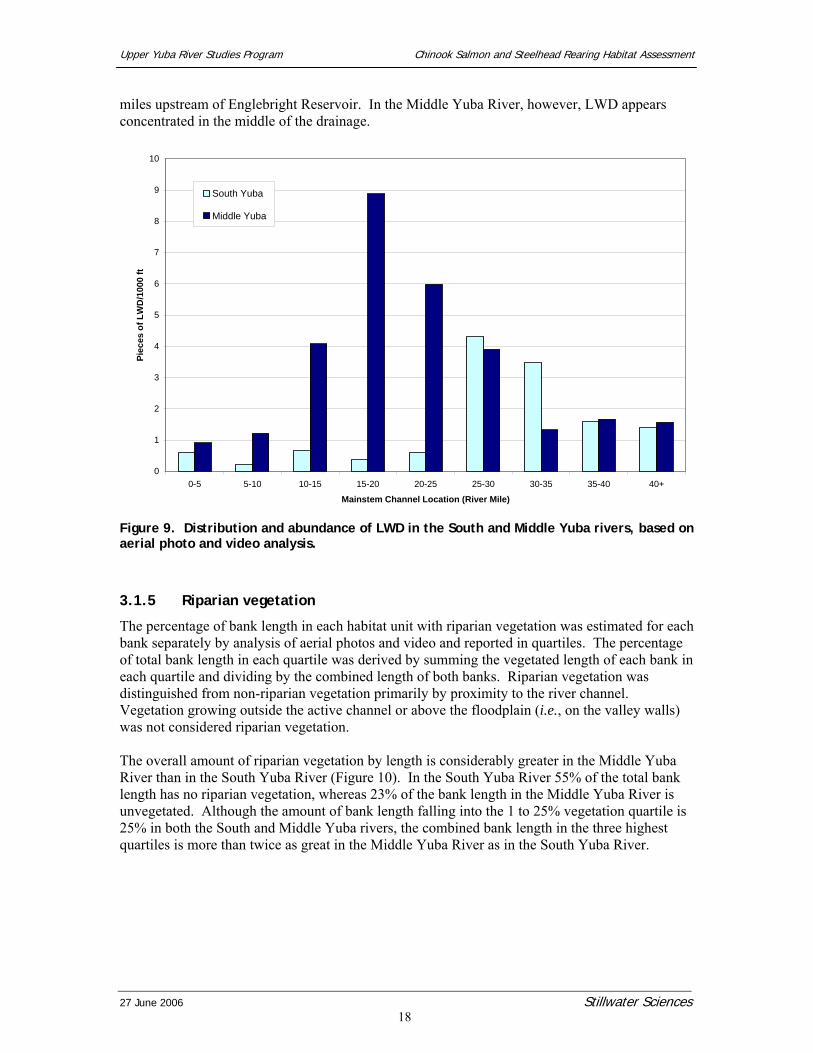
Upper Yuba River Studies Program Chinook Salmon and Steelhead Rearing Habitat Assessment
miles upstream of Englebright Reservoir. In the Middle Yuba River, however, LWD appears concentrated in the middle of the drainage.
0
1
2
3
4
5
6
7
8
9
10
0-5 5-10 10-15 15-20 20-25 25-30 30-35 35-40 40+
Mainstem Channel Location (River Mile)
Piec
es o
f LW
D/1
000
ft
South Yuba
Middle Yuba
Figure 9. Distribution and abundance of LWD in the South and Middle Yuba rivers, based on aerial photo and video analysis.
3.1.5 Riparian vegetation
The percentage of bank length in each habitat unit with riparian vegetation was estimated for each bank separately by analysis of aerial photos and video and reported in quartiles. The percentage of total bank length in each quartile was derived by summing the vegetated length of each bank in each quartile and dividing by the combined length of both banks. Riparian vegetation was distinguished from non-riparian vegetation primarily by proximity to the river channel. Vegetation growing outside the active channel or above the floodplain (i.e., on the valley walls) was not considered riparian vegetation. The overall amount of riparian vegetation by length is considerably greater in the Middle Yuba River than in the South Yuba River (Figure 10). In the South Yuba River 55% of the total bank length has no riparian vegetation, whereas 23% of the bank length in the Middle Yuba River is unvegetated. Although the amount of bank length falling into the 1 to 25% vegetation quartile is 25% in both the South and Middle Yuba rivers, the combined bank length in the three highest quartiles is more than twice as great in the Middle Yuba River as in the South Yuba River.
27 June 2006 Stillwater Sciences 18
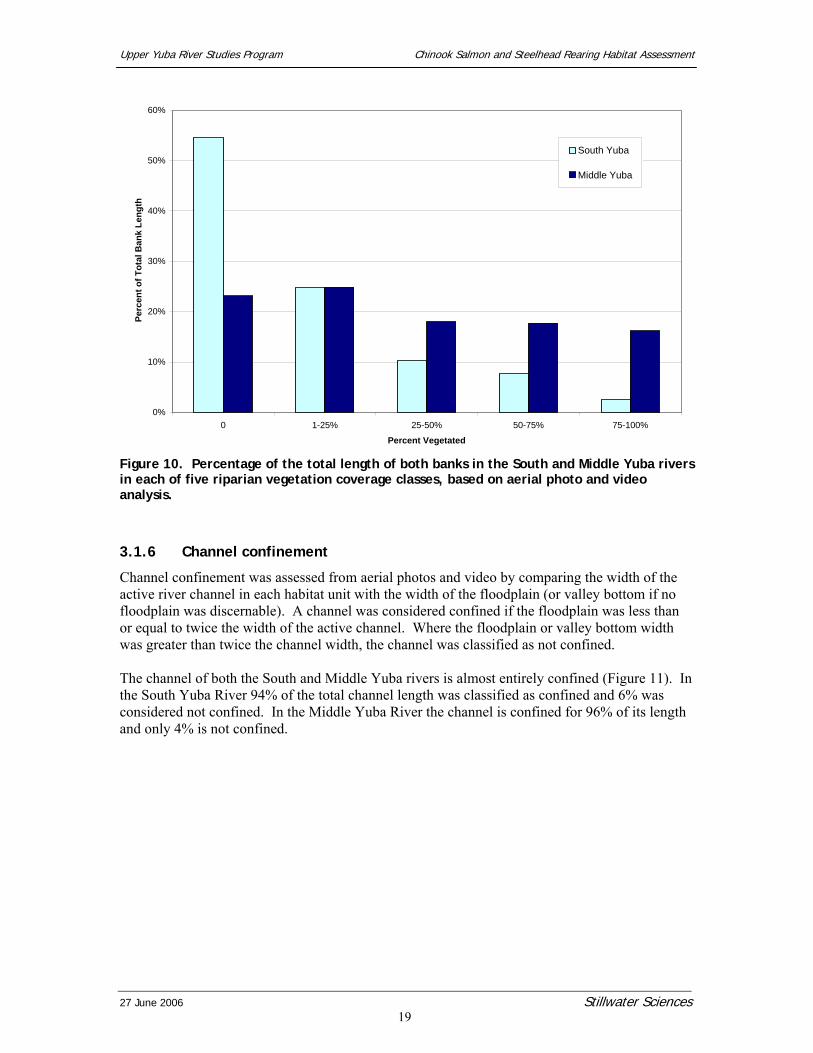
Upper Yuba River Studies Program Chinook Salmon and Steelhead Rearing Habitat Assessment
0%
10%
20%
30%
40%
50%
60%
0 1-25% 25-50% 50-75% 75-100%
Percent Vegetated
Per
cent
of T
otal
Ban
k Le
ngth
South Yuba
Middle Yuba
Figure 10. Percentage of the total length of both banks in the South and Middle Yuba rivers in each of five riparian vegetation coverage classes, based on aerial photo and video analysis.
3.1.6 Channel confinement
Channel confinement was assessed from aerial photos and video by comparing the width of the active river channel in each habitat unit with the width of the floodplain (or valley bottom if no floodplain was discernable). A channel was considered confined if the floodplain was less than or equal to twice the width of the active channel. Where the floodplain or valley bottom width was greater than twice the channel width, the channel was classified as not confined. The channel of both the South and Middle Yuba rivers is almost entirely confined (Figure 11). In the South Yuba River 94% of the total channel length was classified as confined and 6% was considered not confined. In the Middle Yuba River the channel is confined for 96% of its length and only 4% is not confined.
27 June 2006 Stillwater Sciences 19
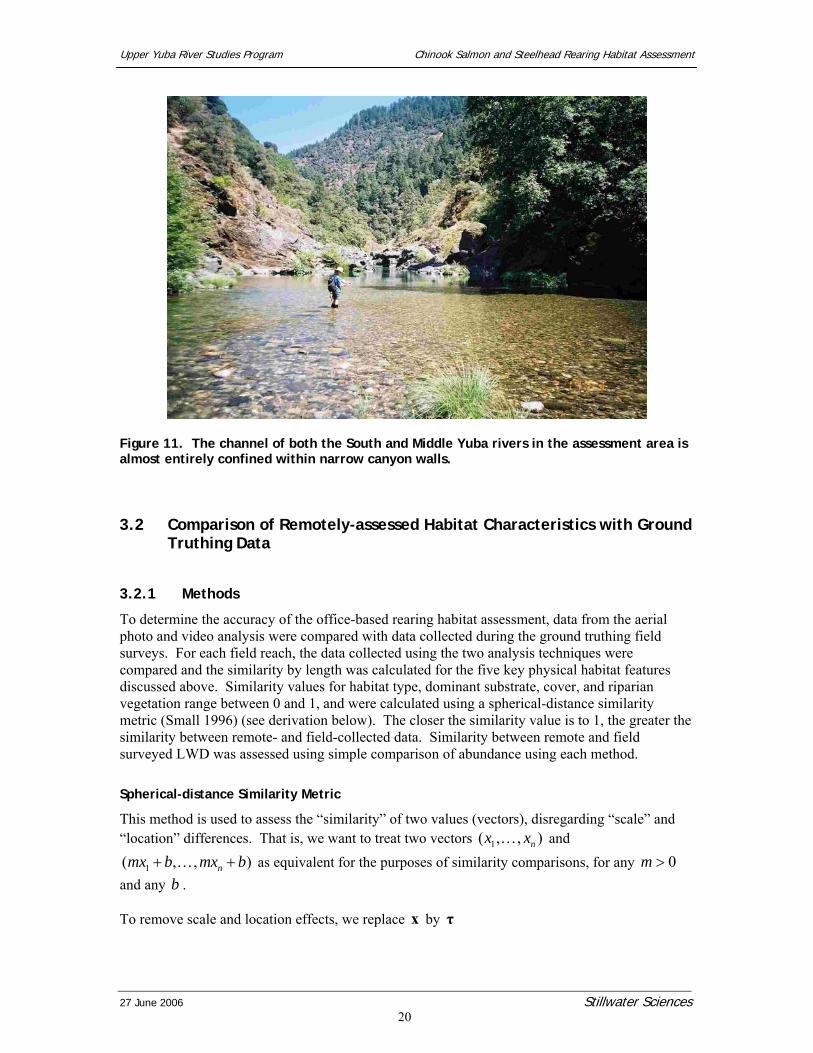
Upper Yuba River Studies Program Chinook Salmon and Steelhead Rearing Habitat Assessment
27 June 2006 Stillwater Sciences 20
Figure 11. The channel of both the South and Middle Yuba rivers in the assessment area is almost entirely confined within narrow canyon walls.
3.2 Comparison of Remotely-assessed Habitat Characteristics with Ground Truthing Data
3.2.1 Methods
To determine the accuracy of the office-based rearing habitat assessment, data from the aerial photo and video analysis were compared with data collected during the ground truthing field surveys. For each field reach, the data collected using the two analysis techniques were compared and the similarity by length was calculated for the five key physical habitat features discussed above. Similarity values for habitat type, dominant substrate, cover, and riparian vegetation range between 0 and 1, and were calculated using a spherical-distance similarity metric (Small 1996) (see derivation below). The closer the similarity value is to 1, the greater the similarity between remote- and field-collected data. Similarity between remote and field surveyed LWD was assessed using simple comparison of abundance using each method. Spherical-distance Similarity Metric
This method is used to assess the “similarity” of two values (vectors), disregarding “scale” and “location” differences. That is, we want to treat two vectors 1( , , )nx xK and
as equivalent for the purposes of similarity comparisons, for any and any b .
1( , , nmx b mx b+ K )+ 0m >
To remove scale and location effects, we replace x by τ
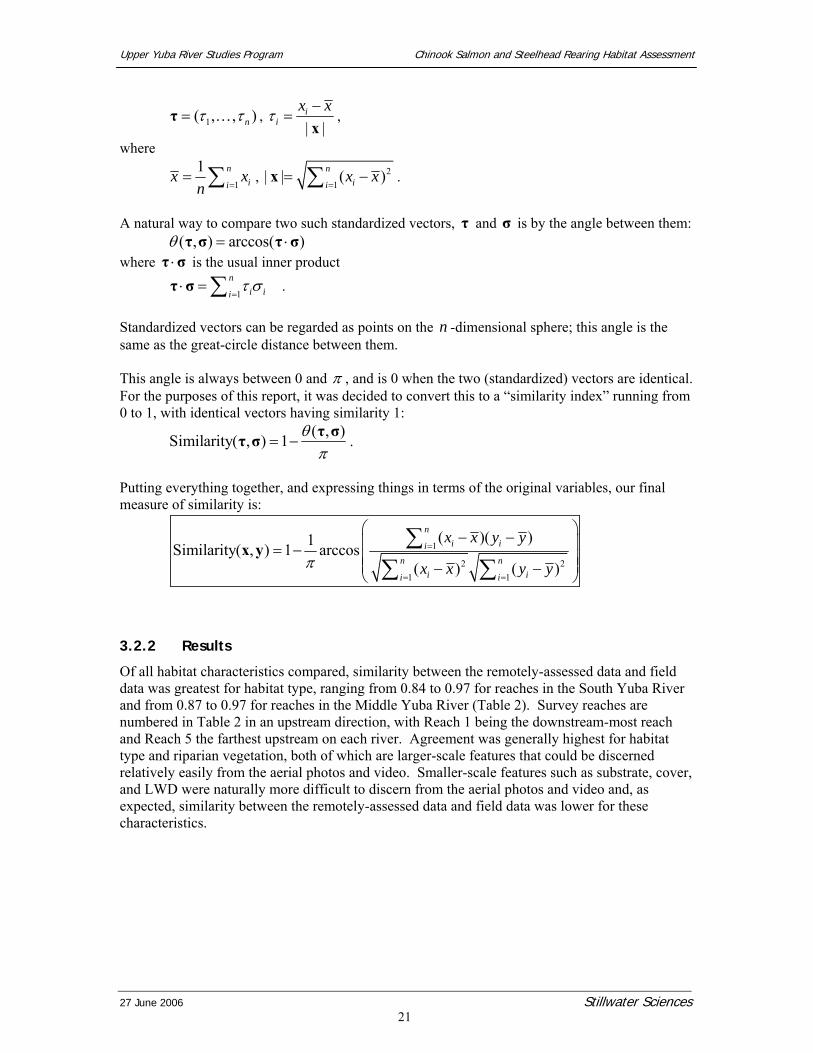
Upper Yuba River Studies Program Chinook Salmon and Steelhead Rearing Habitat Assessment
1( , , )nτ τ=τ K , | |i
ix xτ −
=x
,
where
1
1 nii
x xn =
= ∑ , 21
| | ( )nii
x x=
= −∑x .
A natural way to compare two such standardized vectors, and is by the angle between them: τ σ ( , ) arccos( )θ = ⋅τ σ τ σ where is the usual inner product ⋅τ σ
1
ni iiτ σ
=⋅ =∑τ σ .
Standardized vectors can be regarded as points on the -dimensional sphere; this angle is the same as the great-circle distance between them.
n
This angle is always between 0 and π , and is 0 when the two (standardized) vectors are identical. For the purposes of this report, it was decided to convert this to a “similarity index” running from 0 to 1, with identical vectors having similarity 1:
( , )Similarity( , ) 1 θπ
= −τ στ σ .
Putting everything together, and expressing things in terms of the original variables, our final measure of similarity is:
1
2 21 1
( )( )1Similarity( , ) 1 arccos( ) ( )
ni ii
n ni ii i
x x y y
x x y yπ=
= =
⎛ ⎞− −⎜ ⎟= − ⎜ ⎟⎜ ⎟− −⎝ ⎠
∑∑ ∑
x y
3.2.2 Results
Of all habitat characteristics compared, similarity between the remotely-assessed data and field data was greatest for habitat type, ranging from 0.84 to 0.97 for reaches in the South Yuba River and from 0.87 to 0.97 for reaches in the Middle Yuba River (Table 2). Survey reaches are numbered in Table 2 in an upstream direction, with Reach 1 being the downstream-most reach and Reach 5 the farthest upstream on each river. Agreement was generally highest for habitat type and riparian vegetation, both of which are larger-scale features that could be discerned relatively easily from the aerial photos and video. Smaller-scale features such as substrate, cover, and LWD were naturally more difficult to discern from the aerial photos and video and, as expected, similarity between the remotely-assessed data and field data was lower for these characteristics.
27 June 2006 Stillwater Sciences 21
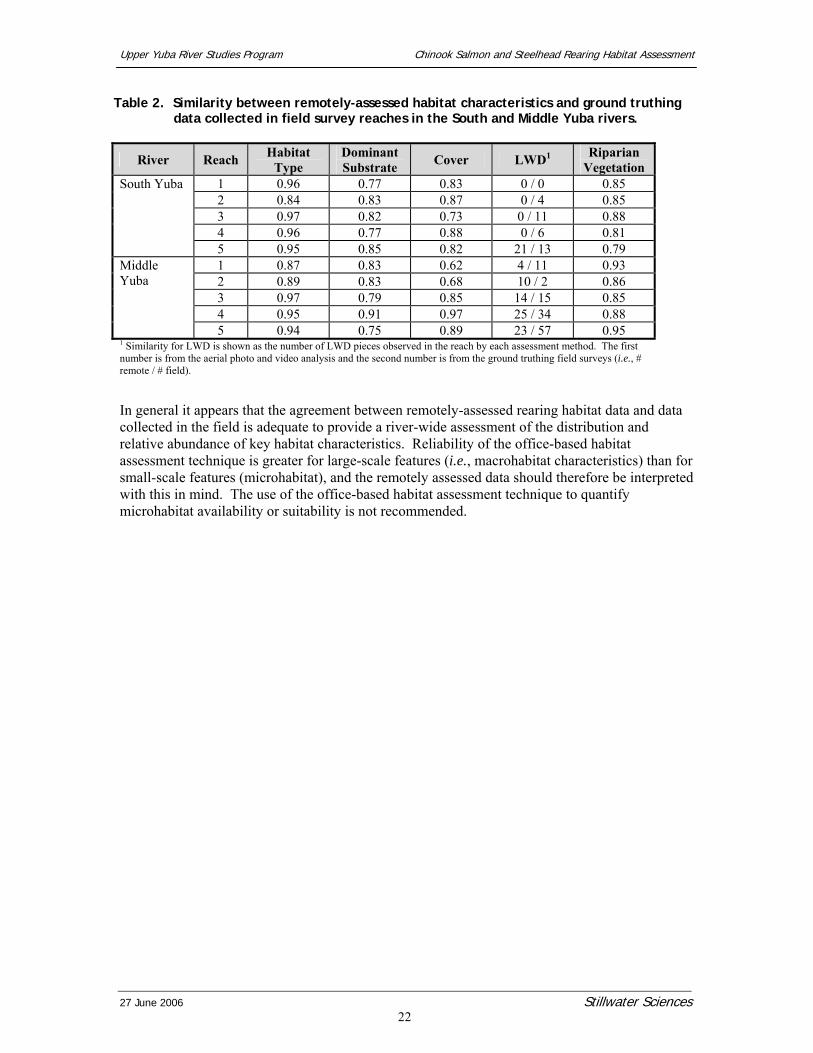
Upper Yuba River Studies Program Chinook Salmon and Steelhead Rearing Habitat Assessment
Table 2. Similarity between remotely-assessed habitat characteristics and ground truthing data collected in field survey reaches in the South and Middle Yuba rivers.
River Reach Habitat Type
Dominant Substrate Cover LWD1 Riparian
Vegetation 1 0.96 0.77 0.83 0 / 0 0.85 2 0.84 0.83 0.87 0 / 4 0.85 3 0.97 0.82 0.73 0 / 11 0.88 4 0.96 0.77 0.88 0 / 6 0.81
South Yuba
5 0.95 0.85 0.82 21 / 13 0.79 1 0.87 0.83 0.62 4 / 11 0.93 2 0.89 0.83 0.68 10 / 2 0.86 3 0.97 0.79 0.85 14 / 15 0.85 4 0.95 0.91 0.97 25 / 34 0.88
Middle Yuba
5 0.94 0.75 0.89 23 / 57 0.95 1 Similarity for LWD is shown as the number of LWD pieces observed in the reach by each assessment method. The first number is from the aerial photo and video analysis and the second number is from the ground truthing field surveys (i.e., # remote / # field).
In general it appears that the agreement between remotely-assessed rearing habitat data and data collected in the field is adequate to provide a river-wide assessment of the distribution and relative abundance of key habitat characteristics. Reliability of the office-based habitat assessment technique is greater for large-scale features (i.e., macrohabitat characteristics) than for small-scale features (microhabitat), and the remotely assessed data should therefore be interpreted with this in mind. The use of the office-based habitat assessment technique to quantify microhabitat availability or suitability is not recommended.
27 June 2006 Stillwater Sciences 22
Upper Yuba River Studies Program Chinook Salmon and Steelhead Rearing Habitat Assessment
4 LITERATURE CITED
Barnhart, R.A. 1991. Steelhead Oncorhynchus mykiss. Pages 324-336 in J. Stolz and J. Schnell, editors. The Wildlife Series: Trout. Stackpole Books. Harrisburg, Pennsylvania.
Behnke, R. J. 1992. Native trout of western North America. American Fisheries Society, Bethesda, Maryland.
Berg N., A. Carlson, D. Azuma. 1998. Function and dynamics of woody debris in stream reaches in the central Sierra Nevada, California. Canadian Journal of Fisheries and Aquatic Sciences 55: 1807–1820.
Beschta, R. L., R. E. Bilby, G. W. Brown, L. B. Holtby, and T. D. Hofstra. 1987. Stream temperature and aquatic habitat: fisheries and forestry interactions. Pages 191-232 in E. O. Salo, and T. W. Cundy, editors. Streamside management: forestry and fishery interactions. Contribution No. 57. College of Forest Resources, University of Washington, Seattle.
Bisson, P. A., K. Sullivan, and J. L. Nielsen. 1988. Channel hydraulics, habitat use, and body form of juvenile coho salmon, steelhead trout, and cutthroat trout in streams. Transactions of the American Fisheries Society 117: 262-273.
Bjornn, T. C. 1978. Survival, production, and yield of trout and Chinook salmon in the Lemhi River, Idaho. Bulletin No. 27. Forest, Wildlife, and Range Experiment Station, University of Idaho, Moscow.
Bjornn, T.C. and D.W. Reiser. 1991. Habitat requirements of salmonids in streams. American Fisheries Society Special Publication 19: 83–138.
Brett, J.R. 1952. Temperature tolerance in young Pacific salmon, genus Oncorhynchus. Journal of the Fisheries Research Board of Canada 9: 265–323.
Brown, L.R. 1990. Age, growth, feeding, and behavior of Sacramento squawfish (Ptychocheilus grandis) in Bear Creek, Colusa Co., California. Southwestern Naturalist 35: 249–260.
Bustard, D. R., and D. W. Narver. 1975. Aspects of the winter ecology of juvenile coho salmon (Oncorhynchus kisutch) and steelhead trout (Salmo gairdneri). Journal of the Fisheries Research Board of Canada 32:667-680.
CDEC (California Data Exchange Center). 2003. http://cdec.water.ca.gov/. [Accessed on August 13, 2003].
CDWR (California Department of Water Resources). 2004. Matrix of life history and habitat requirements for Feather River fish species: Chinook salmon. CDWR, Sacramento, Oroville Facilities Relicensing, FERC Project No. 2100.
Cech, J. J., Jr., and C. A. Myrick. 1999. Steelhead and chinook salmon bioenergetics: temperature, ration, and genetic effects. University of California Water Resources Center, Davis.
27 June 2006 Stillwater Sciences 23
Upper Yuba River Studies Program Chinook Salmon and Steelhead Rearing Habitat Assessment
Coulombe-Pontbriand, M, and M. Lapointe. 2004. Landscape controls on boulder-rich, winter habitat availability and their effects on Atlantic salmon (Salmo salar) parr abundance in two fifth-order mountain streams. Canadian Journal of Fisheries and Aquatic Sciences 61: 648-658.
Dambacher, J. M. 1991. Distribution, abundance, and emigration of juvenile steelhead (Oncorhynchus mykiss), and analysis of stream habitat in the Steamboat Creek basin, Oregon. Oregon State University, Corvallis. Master's thesis.
Everest, F. H., and five coauthors. 1986. Abundance, behavior, and habitat utilization by coho salmon and steelhead trout in Fish Creek, Oregon, as influenced by habitat enhancement. Prepared by U. S. Forest Service for Bonneville Power Administration, Portland, Oregon, Project No. 84-11.
Everest, F.H., and D.W. Chapman. 1972. Habitat selection and spatial interaction by juvenile Chinook salmon and steelhead trout in two Idaho streams. Journal of the Fisheries Research Board of Canada 29: 91-100.
Facchin, A., and P. A. Slaney. 1977. Management implications of substrate utilization during summer by juvenile steelhead (Salmo gairdneri) in the South Alouette River. Fisheries Technical Circular 32. British Columbia Fish and Wildlife Bureau.
Fausch, K.D. 1993. Experimental analysis of microhabitat selection by juvenile steelhead (Oncorhynchus mykiss) and coho salmon (O. kisutch) in a British Columbia stream. Canadian Journal of Fisheries and Aquatic Sciences 50(6):1198-1207.
FERC (Federal Energy Regulatory Commission). 1987. Environmental Assessment of Potential Cumulative Impacts Associated with Hydropower Development in the Yuba River Basin, California.
FERC (Federal Energy Regulatory Commission). 1993. Proposed modifications to the Lower Mokelumne River Project, California: FERC Project No. 2916-004 (Licensee: East Bay Municipal Utility District). FERC, Division of Project Compliance and Administration, Washington, D. C., Final Environmental Impact Statement.
Fisher, F.W. 1994. Past and present status of Central Valley chinook salmon. Conservation Biology 8:870-873.
Fontaine, B.L. 1988. An evaluation of the effectiveness of instream structures for steelhead trout rearing habitat in the Steamboat Creek basin. Master’s thesis. Oregon State University, Corvallis.
Fris, M.B. and R.W. DeHaven. 1993. A community-based Habitat Suitability Index model for Shaded Riverine Aquatic Cover, selected reaches of the Sacramento River system (draft). USDI, FWS, Sacramento Field Office, CA. 23 pp.
Gregory, S. V., F. J. Swanson, W. A. McKee, and K. W. Cummins. 1991. An ecosystem perspective of riparian zones. BioScience 41: 540-551.
27 June 2006 Stillwater Sciences 24
Upper Yuba River Studies Program Chinook Salmon and Steelhead Rearing Habitat Assessment
Hanson, C. R. 1991. Acute temperature tolerance of juvenile chinook salmon from the Mokelumne River. Hanson Environmental, Inc. Walnut Creek, California.
Hartman, G.F. 1965. The role of behavior in the ecology and interaction of underyearling coho salmon (Oncorhynchus kisutch) and steelhead trout (Salmo gairdneri). Journal of the Fisheries Research Board of Canada 22: 1035-1081.
Healey, M.C. 1991. Life history of Chinook salmon (Oncorhynchus tshawytscha). Pages 311-393 in C. Groot and L. Margolis, editors. Pacific salmon life histories. University of British Columbia Press, Vancouver, British Columbia.
Hillman, T.W., J.S. Griffith, and W.S. Platts. 1987. Summer and winter habitat selection by juvenile Chinook salmon in a highly sedimented Idaho stream. Transactions of the American Fisheries Society 116: 185-195.
Kabel, C. S., and E. R. German. 1967. Some aspects of stocking hatchery-reared steelhead and silver salmon. California Department of Fish and Game, No. 67-3.
Levings, C.D., and R.B. Lauzier. 1991. Extensive use of the Fraser River basin as winter habitat by juvenile Chinook salmon (Oncorhynchus tshawytscha). Canadian Journal of Zoology 69: 1759-1767.
Lindsay, R.B., W.J. Knox, M.W. Flesher, B.J. Smith, E.A. Olsen, L.S. Lutz. 1986. Study of wild spring chinook salmon in the John Day River system. Prepared by Oregon Department of Fish and Wildlife, Portland for Bonneville Power Administration, Portland, Oregon. February 1985. Final Report.
Lister, D.B., and H.S. Genoe. 1970. Stream habitat utilization of cohabiting underyearlings of Chinook (Oncorhynchus tshawytscha) and coho (O. kisutch) salmon in the Big Qualicum River, British Columbia. Journal of the Fisheries Research Board of Canada 27: 1215-1224.
McCain, M.E. 1992. Comparison of habitat use and availability for juvenile fall Chinook salmon in a tributary of the Smith River, California. Fish Habitat Relationships Currents, Fish Habitat Relationships Technical Bulletin 7. USDA Forest Service, San Francisco, California.
McCain, M., D. Fuller, L. Decker, and K. Overton. 1990. Stream habitat classification and inventory procedures for Northern California. Fish Habitat Relationships Currents, Fish Habitat Relationships Technical Bulletin 7. USDA Forest Service, San Francisco, California.
McEwan, D., and T.A. Jackson. 1996. Steelhead restoration and management plan for California. Management Report. California Department of Fish and Game, Inland Fisheries Division, Sacramento.
Meehan, W. R., and T. C. Bjornn. 1991. Salmonid distributions and life histories. Pages 47-82 in W. R. Meehan, editor. Influences of forest and rangeland management on salmonid fishes and their habitats. American Fisheries Society Special Publication No. 19, Bethesda, Maryland.
27 June 2006 Stillwater Sciences 25
Upper Yuba River Studies Program Chinook Salmon and Steelhead Rearing Habitat Assessment
Montgomery, D. R., and J. M. Buffington. 1997. Channel-reach morphology in mountain drainage basins. Geological Society of America Bulletin 109:596-611.
Morantz, D.L., Sweeney, R.K., Shirvell, C.S. and D.A. Longard. 1987. Selection of microhabitat in summer by juvenile Atlantic salmon (Salmo salar). Canadian Journal of Fisheries and Aquatic Sciences 44: 120-129.
Moyle, P.B., and M. Gard. 1993. South Yuba River fisheries survey and habitat assessment. Report to the California State Department of Parks and Recreation. Davis, California.
Myrick, C. A., and J. J. Cech Jr. 2000. Growth and thermal biology of Feather River steelhead under constant and cyclical temperatures. Davis, CA, Department of Wildlife, Fish, and Conservation Biology, University of California, Davis.
Myrick, C. A., and J. J. Cech, Jr. 2001. Temperature effects on Chinook salmon and steelhead: a review focusing on California's Central Valley populations. Prepared by Department of Fishery and Wildlife Biology, Colorado State University, Fort Collins and Department of Wildlife, Fish, and Conservation Biology, University of California, Davis.
Naiman, R. J., and eight coauthors. 1992. Fundamental elements of ecologically healthy watersheds in the Pacific Northwest coastal ecoregion. Pages 127-188 in R. J. Naiman, editor. Watershed management: balancing sustainability and environmental change. Springer-Verlag, New York.
Nicholas, J.W., and D.G. Hankin. 1989. Chinook salmon populations in Oregon coastal river basins: descriptions of life histories and assessment of recent trends in run strengths. Report EM 8402. Oregon Department of Fish and Wildlife, Research and Development Section, Corvallis.
NOAA (National Oceanic and Atmospheric Administration). 2002. Biological Opinion on Interim Operations of the CVP and SWP Between April 2000 and March 2004 on Federally Listed Threatened Central Valley Spring-Run Chinook Salmon and Threatened Central Valley Steelhead in Accordance With Section 7 of the ESA.
Northwest Power Company. 1983. Application for License before the Federal Energy Regulatory Commission: Miner’s Tunnel Hydroelectric Project, Nevada City, California. June.
Poole, G.C. 2002. Fluvial landscape ecology: addressing uniqueness within the river discontinuum. Freshwater Biology 47: 641-660.
Raleigh, R.F., T. Hickman, R.C. Solomon, and P.C. Nelson. 1984. Habitat suitability information: rainbow trout. FWS/OBS-82/10.60. U. S. Fish and Wildlife Service, Washington, D. C.
Reedy, G. D. 1995. Summer abundance and distribution of juvenile Chinook salmon (Oncorhynchus tshawytscha) and steelhead trout (Oncorhynchus mykiss) in the Middle Fork Smith River, California. Master's thesis. Humboldt State University, Arcata, California.
27 June 2006 Stillwater Sciences 26
Upper Yuba River Studies Program Chinook Salmon and Steelhead Rearing Habitat Assessment
Reynolds, F. L., T. J. Mills, R. Benthin, and A. Low. 1993. Restoring Central Valley streams: a plan for action. California Department of Fish and Game, Inland Fisheries Division, Sacramento.
Rich, A. A. 1987. Water temperatures which optimize growth and survival of the anadromous fishery resources of the lower American River. Prepared by A. A. Rich and Associates, San Rafael for McDonough, Holland, and Allen, Sacramento, California.
Roper, B.R. D.L. Scarnecchia, T.J. La Marr. 1994. Summer distribution of and habitat use by chinook salmon and steelhead within a major basin of the South Umpqua River, Oregon. Transactions of the American Fisheries Society 123: 298-308.
Ruediger, R., and J. Ward. 1996. Abundance and function or large woody debris in central Sierra Nevada streams. Fish Habitat Relationships Currents, Fish Habitat Relationships Technical Bulletin 20. May. USDA Forest Service, San Francisco, California.
Shapovalov, L., and A. C. Taft. 1954. The life histories of the steelhead rainbow trout (Salmo gairdneri gairdneri) and silver salmon (Oncorhynchus kisutch) with special reference to Waddell Creek, California, and recommendations regarding their management. California Department of Fish and Game, 98.
Small, C. G. 1996. The statistical theory of shape. Springer Series in Statistics. Springer-Verlag, New York.
Smith, J. J. 1990. The effects of sandbar formation and inflows on aquatic habitat and fish utilization in Pescadero, San Gregorio, Waddell, and Pomponio Creek estuary/lagoon systems, 1985-1989. Prepared by San Jose State University, Department of Biological Sciences, San Jose, California for California Department of Parks and Recreation.
Steward, C. R., and T. C. Bjornn. 1987. The distribution of chinook salmon juveniles in pools at three discharges. Proceedings of the Annual Conference Western Association of Fish and Wildlife Agencies 67: 364-374.
Stuehrenberg, L. C. 1975. The effects of granitic sand on the distribution and abundance of salmonids in Idaho streams. Master's thesis. University of Idaho, Moscow.
Swales, S., R.B. Lauzier, and C.D. Levings. 1986. Winter habitat preferences of juvenile salmonids in two interior rivers in British Columbia. Canadian Journal of Zoology 64: 1506-1514.
Taylor, E.B., and P.A. Larkin. 1986. Current response and agonistic behavior in newly emerged fry of chinook salmon, Oncorhynchus tshawytscha, from ocean- and stream-type populations. Canadian Journal of Fisheries and Aquatic Sciences 43: 565-573.
TID/MID (Turlock Irrigation District and Modesto Irrigation District). 1992. Lower Tuolumne River predation study report. Appendix 22 to Don Pedro Project Fisheries Studies Report (FERC Article 39, Project No. 2299). In Report of Turlock Irrigation District and Modesto Irrigation District Pursuant to Article 39 of the License for the Don Pedro Project, No. 2299. Vol. VII. Prepared by EA Engineering, Science, and Technology, Lafayette, California.
27 June 2006 Stillwater Sciences 27
Upper Yuba River Studies Program Chinook Salmon and Steelhead Rearing Habitat Assessment
27 June 2006 Stillwater Sciences 28
U.S. Army Corps of Engineers. 1991. Draft Fish and Wildlife Management Plan for Englebright Lake. 37 pp.
Ward, B.R., and P.A. Slaney. 1979. Evaluation of in-stream enhancement structures for the production of juvenile steelhead trout and coho salmon in the Keogh River: Progress 1977 and 1978. Fisheries Technical Circular 45. Ministry of Environment, Province of British Columbia.
Ward, P.D., and T.R. McReynolds. 2001. Butte and Big Chico creeks spring-run chinook salmon, Oncorhynchus tshawytscha, life history investigation 1998-2000. Inland Fisheries Administrative Report No. 2001-2. California Department of Fish and Game, Sacramento Valley and Central Sierra Region, Rancho Cordova, California.
Yoshiyama, R.M., E.R. Gerstung, F.W. Fisher, and P.B. Moyle. 2001. Historical and present distribution of Chinook salmon in the Central Valley drainage of California. Pages 71-176 in R.L. Brown, editor. Contributions to the Biology of Central Valley Salmonids. California Department of Fish and Game Bulletin 179.

APPENDIX F
Water Temperature Monitoring
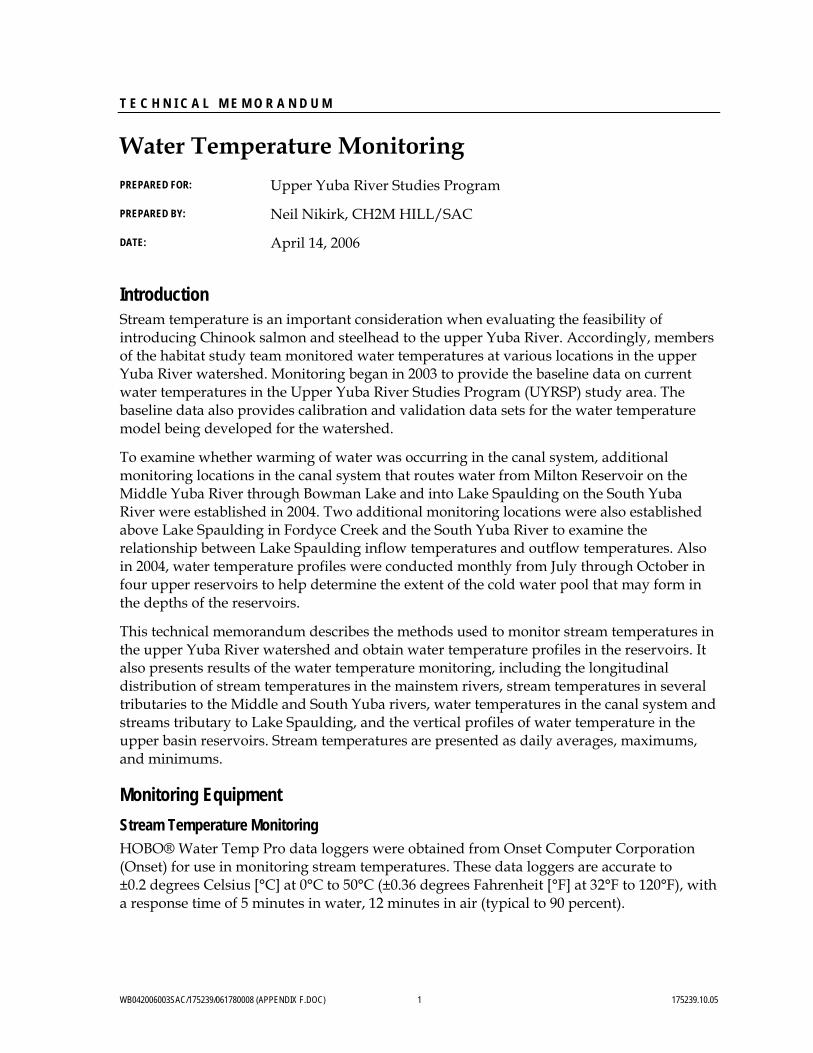
T E C H N I C A L M E M O R A N D U M
Water Temperature Monitoring PREPARED FOR: Upper Yuba River Studies Program
PREPARED BY: Neil Nikirk, CH2M HILL/SAC
DATE: April 14, 2006
Introduction Stream temperature is an important consideration when evaluating the feasibility of introducing Chinook salmon and steelhead to the upper Yuba River. Accordingly, members of the habitat study team monitored water temperatures at various locations in the upper Yuba River watershed. Monitoring began in 2003 to provide the baseline data on current water temperatures in the Upper Yuba River Studies Program (UYRSP) study area. The baseline data also provides calibration and validation data sets for the water temperature model being developed for the watershed.
To examine whether warming of water was occurring in the canal system, additional monitoring locations in the canal system that routes water from Milton Reservoir on the Middle Yuba River through Bowman Lake and into Lake Spaulding on the South Yuba River were established in 2004. Two additional monitoring locations were also established above Lake Spaulding in Fordyce Creek and the South Yuba River to examine the relationship between Lake Spaulding inflow temperatures and outflow temperatures. Also in 2004, water temperature profiles were conducted monthly from July through October in four upper reservoirs to help determine the extent of the cold water pool that may form in the depths of the reservoirs.
This technical memorandum describes the methods used to monitor stream temperatures in the upper Yuba River watershed and obtain water temperature profiles in the reservoirs. It also presents results of the water temperature monitoring, including the longitudinal distribution of stream temperatures in the mainstem rivers, stream temperatures in several tributaries to the Middle and South Yuba rivers, water temperatures in the canal system and streams tributary to Lake Spaulding, and the vertical profiles of water temperature in the upper basin reservoirs. Stream temperatures are presented as daily averages, maximums, and minimums.
Monitoring Equipment Stream Temperature Monitoring HOBO® Water Temp Pro data loggers were obtained from Onset Computer Corporation (Onset) for use in monitoring stream temperatures. These data loggers are accurate to ±0.2 degrees Celsius [°C] at 0°C to 50°C (±0.36 degrees Fahrenheit [°F] at 32°F to 120°F), with a response time of 5 minutes in water, 12 minutes in air (typical to 90 percent).
WB042006003SAC/175239/061780008 (APPENDIX F.DOC) 1 175239.10.05
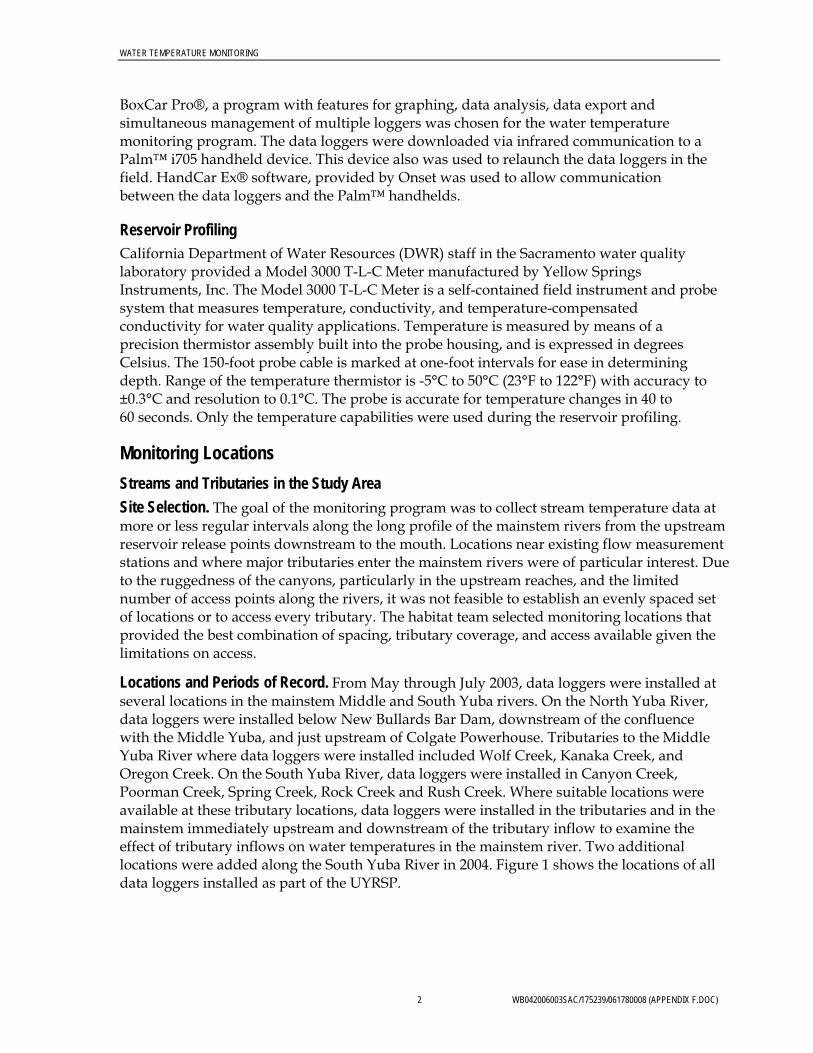
WATER TEMPERATURE MONITORING
2 WB042006003SAC/175239/061780008 (APPENDIX F.DOC)
BoxCar Pro®, a program with features for graphing, data analysis, data export and simultaneous management of multiple loggers was chosen for the water temperature monitoring program. The data loggers were downloaded via infrared communication to a Palm™ i705 handheld device. This device also was used to relaunch the data loggers in the field. HandCar Ex® software, provided by Onset was used to allow communication between the data loggers and the Palm™ handhelds.
Reservoir Profiling California Department of Water Resources (DWR) staff in the Sacramento water quality laboratory provided a Model 3000 T-L-C Meter manufactured by Yellow Springs Instruments, Inc. The Model 3000 T-L-C Meter is a self-contained field instrument and probe system that measures temperature, conductivity, and temperature-compensated conductivity for water quality applications. Temperature is measured by means of a precision thermistor assembly built into the probe housing, and is expressed in degrees Celsius. The 150-foot probe cable is marked at one-foot intervals for ease in determining depth. Range of the temperature thermistor is -5°C to 50°C (23°F to 122°F) with accuracy to ±0.3°C and resolution to 0.1°C. The probe is accurate for temperature changes in 40 to 60 seconds. Only the temperature capabilities were used during the reservoir profiling.
Monitoring Locations Streams and Tributaries in the Study Area Site Selection. The goal of the monitoring program was to collect stream temperature data at more or less regular intervals along the long profile of the mainstem rivers from the upstream reservoir release points downstream to the mouth. Locations near existing flow measurement stations and where major tributaries enter the mainstem rivers were of particular interest. Due to the ruggedness of the canyons, particularly in the upstream reaches, and the limited number of access points along the rivers, it was not feasible to establish an evenly spaced set of locations or to access every tributary. The habitat team selected monitoring locations that provided the best combination of spacing, tributary coverage, and access available given the limitations on access.
Locations and Periods of Record. From May through July 2003, data loggers were installed at several locations in the mainstem Middle and South Yuba rivers. On the North Yuba River, data loggers were installed below New Bullards Bar Dam, downstream of the confluence with the Middle Yuba, and just upstream of Colgate Powerhouse. Tributaries to the Middle Yuba River where data loggers were installed included Wolf Creek, Kanaka Creek, and Oregon Creek. On the South Yuba River, data loggers were installed in Canyon Creek, Poorman Creek, Spring Creek, Rock Creek and Rush Creek. Where suitable locations were available at these tributary locations, data loggers were installed in the tributaries and in the mainstem immediately upstream and downstream of the tributary inflow to examine the effect of tributary inflows on water temperatures in the mainstem river. Two additional locations were added along the South Yuba River in 2004. Figure 1 shows the locations of all data loggers installed as part of the UYRSP.
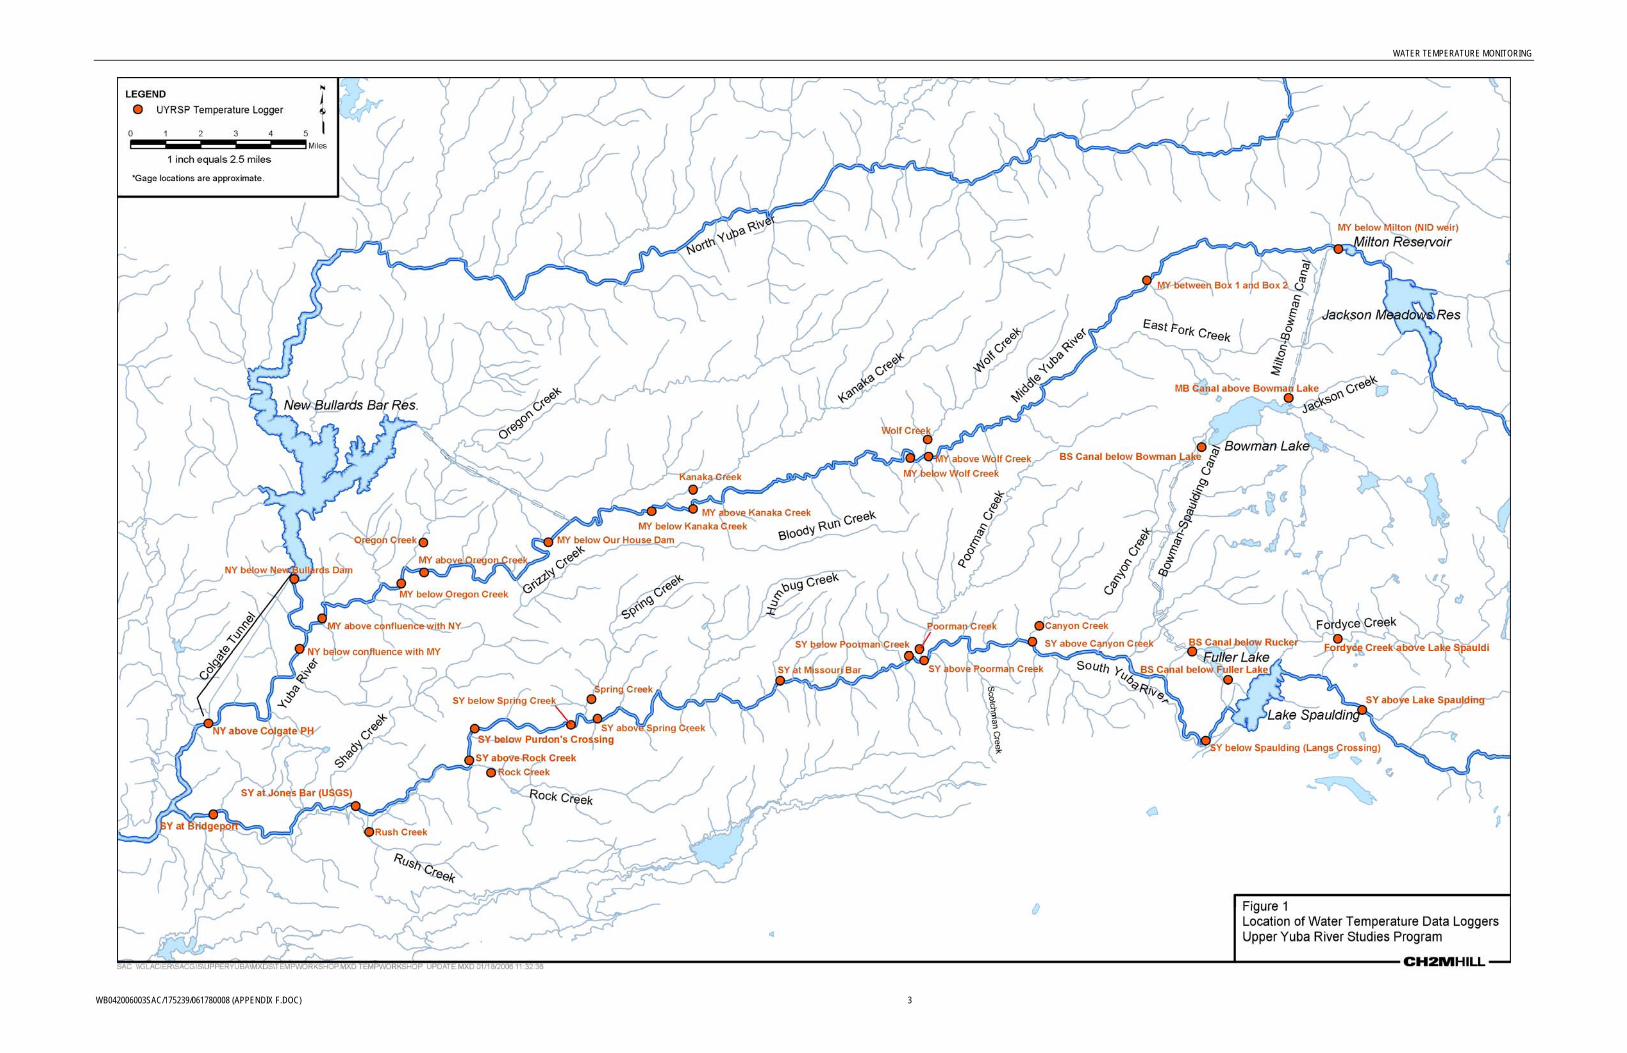
WATER TEMPERATURE MONITORING
WB042006003SAC/175239/061780008 (APPENDIX F.DOC) 3
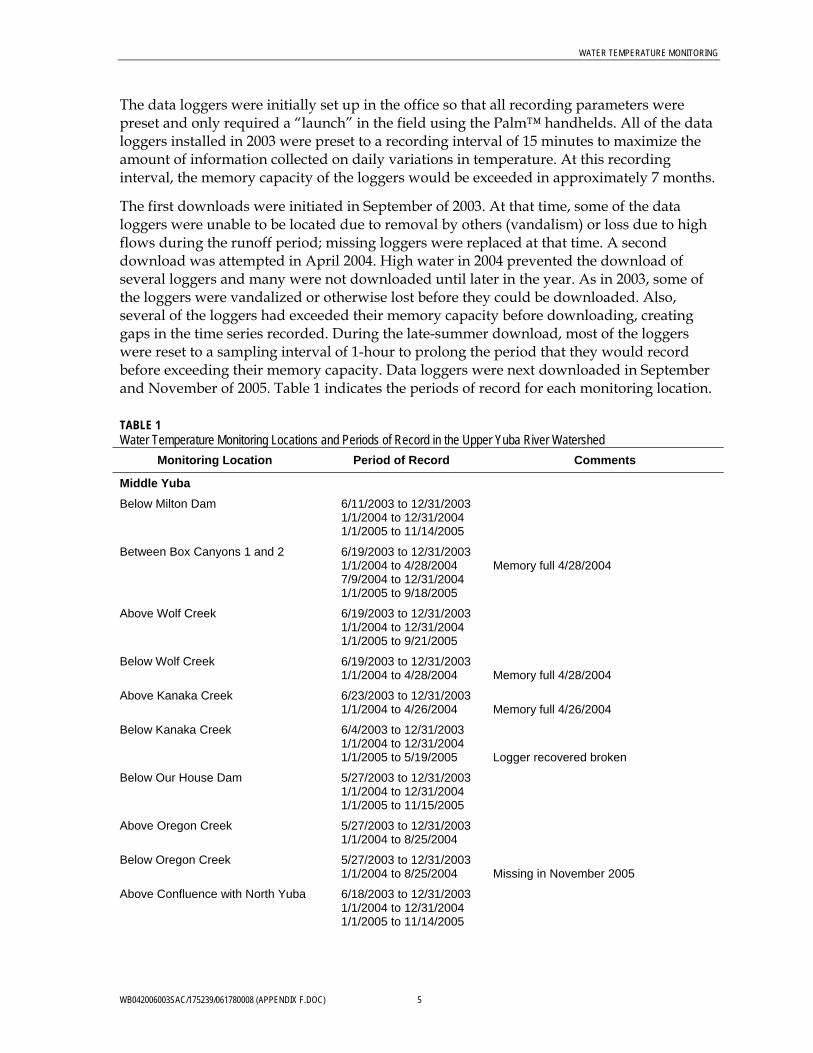
WATER TEMPERATURE MONITORING
The data loggers were initially set up in the office so that all recording parameters were preset and only required a “launch” in the field using the Palm™ handhelds. All of the data loggers installed in 2003 were preset to a recording interval of 15 minutes to maximize the amount of information collected on daily variations in temperature. At this recording interval, the memory capacity of the loggers would be exceeded in approximately 7 months.
The first downloads were initiated in September of 2003. At that time, some of the data loggers were unable to be located due to removal by others (vandalism) or loss due to high flows during the runoff period; missing loggers were replaced at that time. A second download was attempted in April 2004. High water in 2004 prevented the download of several loggers and many were not downloaded until later in the year. As in 2003, some of the loggers were vandalized or otherwise lost before they could be downloaded. Also, several of the loggers had exceeded their memory capacity before downloading, creating gaps in the time series recorded. During the late-summer download, most of the loggers were reset to a sampling interval of 1-hour to prolong the period that they would record before exceeding their memory capacity. Data loggers were next downloaded in September and November of 2005. Table 1 indicates the periods of record for each monitoring location.
TABLE 1 Water Temperature Monitoring Locations and Periods of Record in the Upper Yuba River Watershed
Monitoring Location Period of Record Comments
Middle Yuba Below Milton Dam 6/11/2003 to 12/31/2003
1/1/2004 to 12/31/2004 1/1/2005 to 11/14/2005
Between Box Canyons 1 and 2 6/19/2003 to 12/31/2003 1/1/2004 to 4/28/2004 7/9/2004 to 12/31/2004 1/1/2005 to 9/18/2005
Memory full 4/28/2004
Above Wolf Creek 6/19/2003 to 12/31/2003 1/1/2004 to 12/31/2004 1/1/2005 to 9/21/2005
Below Wolf Creek 6/19/2003 to 12/31/2003 1/1/2004 to 4/28/2004
Memory full 4/28/2004
Above Kanaka Creek 6/23/2003 to 12/31/2003 1/1/2004 to 4/26/2004
Memory full 4/26/2004
Below Kanaka Creek 6/4/2003 to 12/31/2003 1/1/2004 to 12/31/2004 1/1/2005 to 5/19/2005
Logger recovered broken
Below Our House Dam 5/27/2003 to 12/31/2003 1/1/2004 to 12/31/2004 1/1/2005 to 11/15/2005
Above Oregon Creek 5/27/2003 to 12/31/2003 1/1/2004 to 8/25/2004
Below Oregon Creek 5/27/2003 to 12/31/2003 1/1/2004 to 8/25/2004
Missing in November 2005
Above Confluence with North Yuba 6/18/2003 to 12/31/2003 1/1/2004 to 12/31/2004 1/1/2005 to 11/14/2005
WB042006003SAC/175239/061780008 (APPENDIX F.DOC) 5
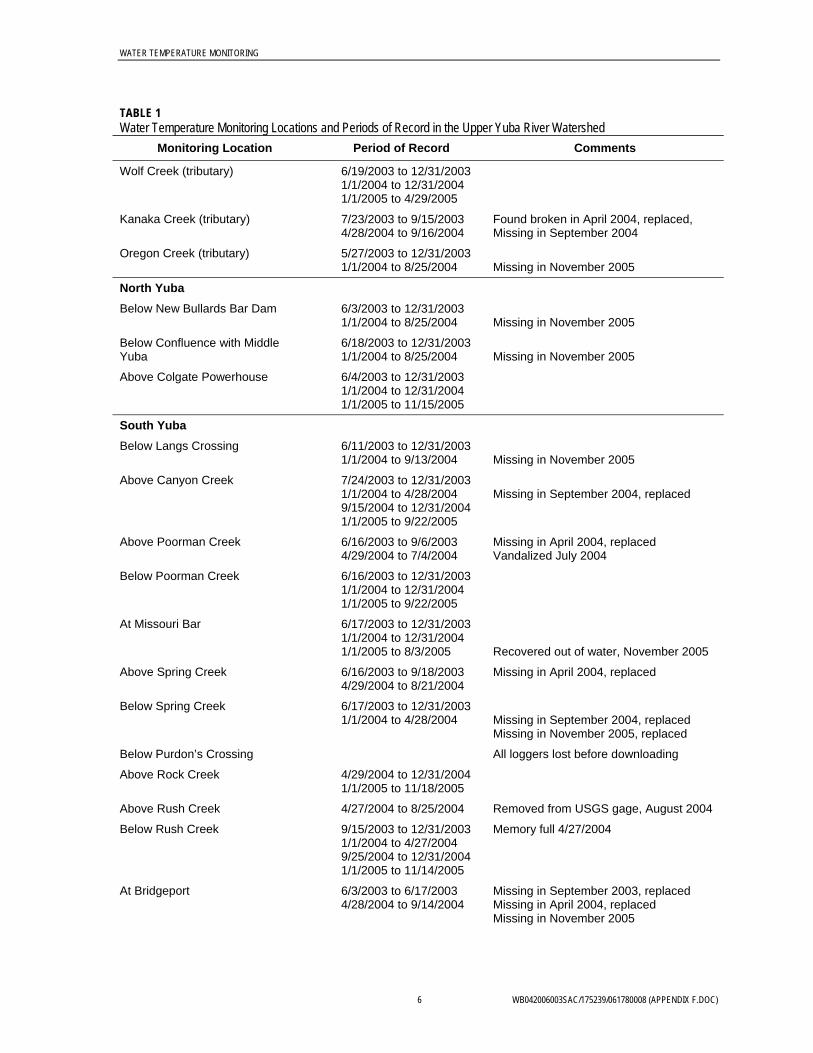
WATER TEMPERATURE MONITORING
TABLE 1 Water Temperature Monitoring Locations and Periods of Record in the Upper Yuba River Watershed
Monitoring Location Period of Record Comments
Wolf Creek (tributary) 6/19/2003 to 12/31/2003 1/1/2004 to 12/31/2004 1/1/2005 to 4/29/2005
Kanaka Creek (tributary) 7/23/2003 to 9/15/2003 4/28/2004 to 9/16/2004
Found broken in April 2004, replaced, Missing in September 2004
Oregon Creek (tributary) 5/27/2003 to 12/31/2003 1/1/2004 to 8/25/2004
Missing in November 2005
North Yuba Below New Bullards Bar Dam 6/3/2003 to 12/31/2003
1/1/2004 to 8/25/2004 Missing in November 2005
Below Confluence with Middle Yuba
6/18/2003 to 12/31/2003 1/1/2004 to 8/25/2004
Missing in November 2005
Above Colgate Powerhouse 6/4/2003 to 12/31/2003 1/1/2004 to 12/31/2004 1/1/2005 to 11/15/2005
South Yuba Below Langs Crossing 6/11/2003 to 12/31/2003
1/1/2004 to 9/13/2004 Missing in November 2005
Above Canyon Creek 7/24/2003 to 12/31/2003 1/1/2004 to 4/28/2004 9/15/2004 to 12/31/2004 1/1/2005 to 9/22/2005
Missing in September 2004, replaced
Above Poorman Creek 6/16/2003 to 9/6/2003 4/29/2004 to 7/4/2004
Missing in April 2004, replaced Vandalized July 2004
Below Poorman Creek 6/16/2003 to 12/31/2003 1/1/2004 to 12/31/2004 1/1/2005 to 9/22/2005
At Missouri Bar 6/17/2003 to 12/31/2003 1/1/2004 to 12/31/2004 1/1/2005 to 8/3/2005
Recovered out of water, November 2005
Above Spring Creek 6/16/2003 to 9/18/2003 4/29/2004 to 8/21/2004
Missing in April 2004, replaced
Below Spring Creek 6/17/2003 to 12/31/2003 1/1/2004 to 4/28/2004
Missing in September 2004, replaced Missing in November 2005, replaced
Below Purdon’s Crossing All loggers lost before downloading
Above Rock Creek 4/29/2004 to 12/31/2004 1/1/2005 to 11/18/2005
Above Rush Creek 4/27/2004 to 8/25/2004 Removed from USGS gage, August 2004
Below Rush Creek 9/15/2003 to 12/31/2003 1/1/2004 to 4/27/2004 9/25/2004 to 12/31/2004 1/1/2005 to 11/14/2005
Memory full 4/27/2004
At Bridgeport 6/3/2003 to 6/17/2003 4/28/2004 to 9/14/2004
Missing in September 2003, replaced Missing in April 2004, replaced Missing in November 2005
6 WB042006003SAC/175239/061780008 (APPENDIX F.DOC)
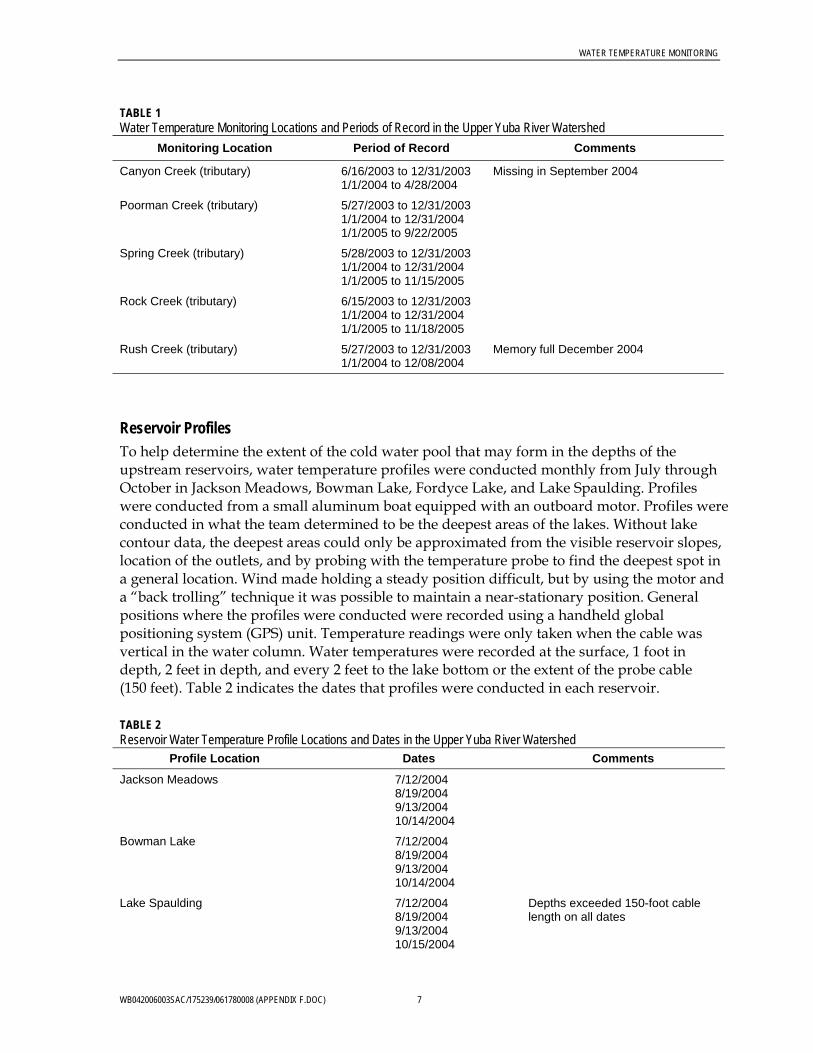
WATER TEMPERATURE MONITORING
TABLE 1 Water Temperature Monitoring Locations and Periods of Record in the Upper Yuba River Watershed
Monitoring Location Period of Record Comments
Canyon Creek (tributary) 6/16/2003 to 12/31/2003 1/1/2004 to 4/28/2004
Missing in September 2004
Poorman Creek (tributary) 5/27/2003 to 12/31/2003 1/1/2004 to 12/31/2004 1/1/2005 to 9/22/2005
Spring Creek (tributary) 5/28/2003 to 12/31/2003 1/1/2004 to 12/31/2004 1/1/2005 to 11/15/2005
Rock Creek (tributary) 6/15/2003 to 12/31/2003 1/1/2004 to 12/31/2004 1/1/2005 to 11/18/2005
Rush Creek (tributary) 5/27/2003 to 12/31/2003 1/1/2004 to 12/08/2004
Memory full December 2004
Reservoir Profiles To help determine the extent of the cold water pool that may form in the depths of the upstream reservoirs, water temperature profiles were conducted monthly from July through October in Jackson Meadows, Bowman Lake, Fordyce Lake, and Lake Spaulding. Profiles were conducted from a small aluminum boat equipped with an outboard motor. Profiles were conducted in what the team determined to be the deepest areas of the lakes. Without lake contour data, the deepest areas could only be approximated from the visible reservoir slopes, location of the outlets, and by probing with the temperature probe to find the deepest spot in a general location. Wind made holding a steady position difficult, but by using the motor and a “back trolling” technique it was possible to maintain a near-stationary position. General positions where the profiles were conducted were recorded using a handheld global positioning system (GPS) unit. Temperature readings were only taken when the cable was vertical in the water column. Water temperatures were recorded at the surface, 1 foot in depth, 2 feet in depth, and every 2 feet to the lake bottom or the extent of the probe cable (150 feet). Table 2 indicates the dates that profiles were conducted in each reservoir.
TABLE 2 Reservoir Water Temperature Profile Locations and Dates in the Upper Yuba River Watershed
Profile Location Dates Comments
Jackson Meadows 7/12/2004 8/19/2004 9/13/2004 10/14/2004
Bowman Lake 7/12/2004 8/19/2004 9/13/2004 10/14/2004
Lake Spaulding 7/12/2004 8/19/2004 9/13/2004 10/15/2004
Depths exceeded 150-foot cable length on all dates
WB042006003SAC/175239/061780008 (APPENDIX F.DOC) 7
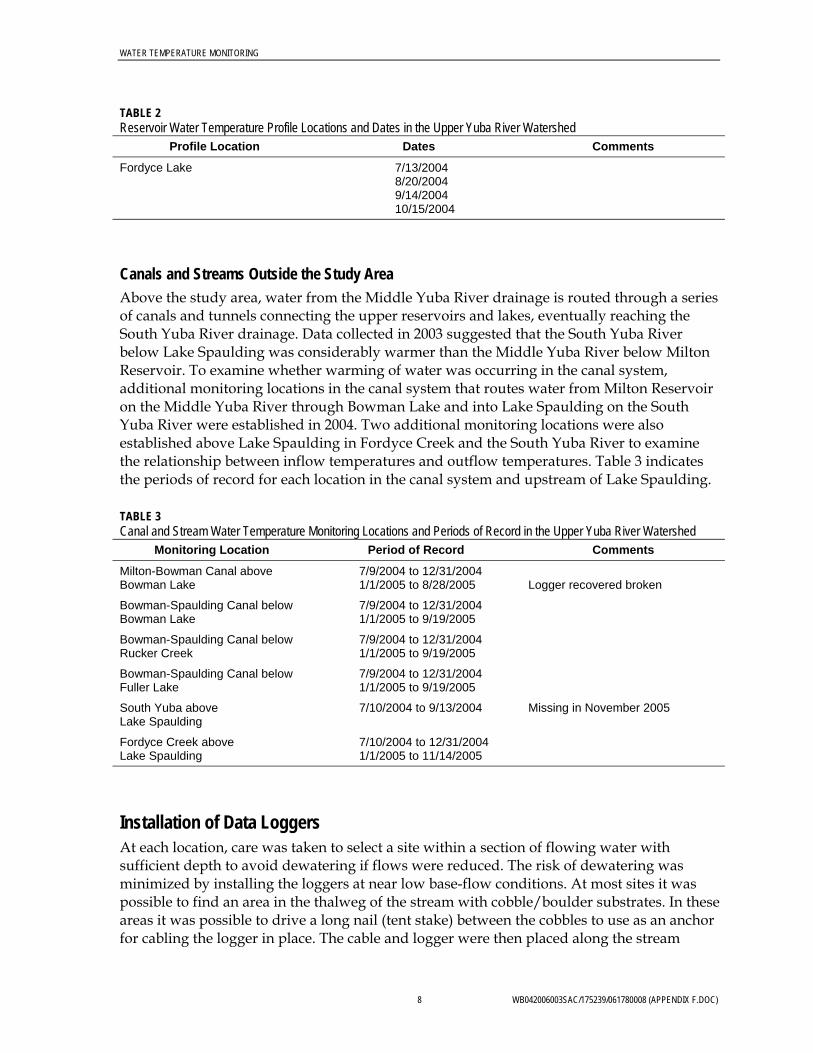
WATER TEMPERATURE MONITORING
TABLE 2 Reservoir Water Temperature Profile Locations and Dates in the Upper Yuba River Watershed
Profile Location Dates Comments
Fordyce Lake 7/13/2004 8/20/2004 9/14/2004 10/15/2004
Canals and Streams Outside the Study Area Above the study area, water from the Middle Yuba River drainage is routed through a series of canals and tunnels connecting the upper reservoirs and lakes, eventually reaching the South Yuba River drainage. Data collected in 2003 suggested that the South Yuba River below Lake Spaulding was considerably warmer than the Middle Yuba River below Milton Reservoir. To examine whether warming of water was occurring in the canal system, additional monitoring locations in the canal system that routes water from Milton Reservoir on the Middle Yuba River through Bowman Lake and into Lake Spaulding on the South Yuba River were established in 2004. Two additional monitoring locations were also established above Lake Spaulding in Fordyce Creek and the South Yuba River to examine the relationship between inflow temperatures and outflow temperatures. Table 3 indicates the periods of record for each location in the canal system and upstream of Lake Spaulding.
TABLE 3 Canal and Stream Water Temperature Monitoring Locations and Periods of Record in the Upper Yuba River Watershed
Monitoring Location Period of Record Comments
Milton-Bowman Canal above Bowman Lake
7/9/2004 to 12/31/2004 1/1/2005 to 8/28/2005
Logger recovered broken
Bowman-Spaulding Canal below Bowman Lake
7/9/2004 to 12/31/2004 1/1/2005 to 9/19/2005
Bowman-Spaulding Canal below Rucker Creek
7/9/2004 to 12/31/2004 1/1/2005 to 9/19/2005
Bowman-Spaulding Canal below Fuller Lake
7/9/2004 to 12/31/2004 1/1/2005 to 9/19/2005
South Yuba above Lake Spaulding
7/10/2004 to 9/13/2004 Missing in November 2005
Fordyce Creek above Lake Spaulding
7/10/2004 to 12/31/2004 1/1/2005 to 11/14/2005
Installation of Data Loggers At each location, care was taken to select a site within a section of flowing water with sufficient depth to avoid dewatering if flows were reduced. The risk of dewatering was minimized by installing the loggers at near low base-flow conditions. At most sites it was possible to find an area in the thalweg of the stream with cobble/boulder substrates. In these areas it was possible to drive a long nail (tent stake) between the cobbles to use as an anchor for cabling the logger in place. The cable and logger were then placed along the stream
8 WB042006003SAC/175239/061780008 (APPENDIX F.DOC)
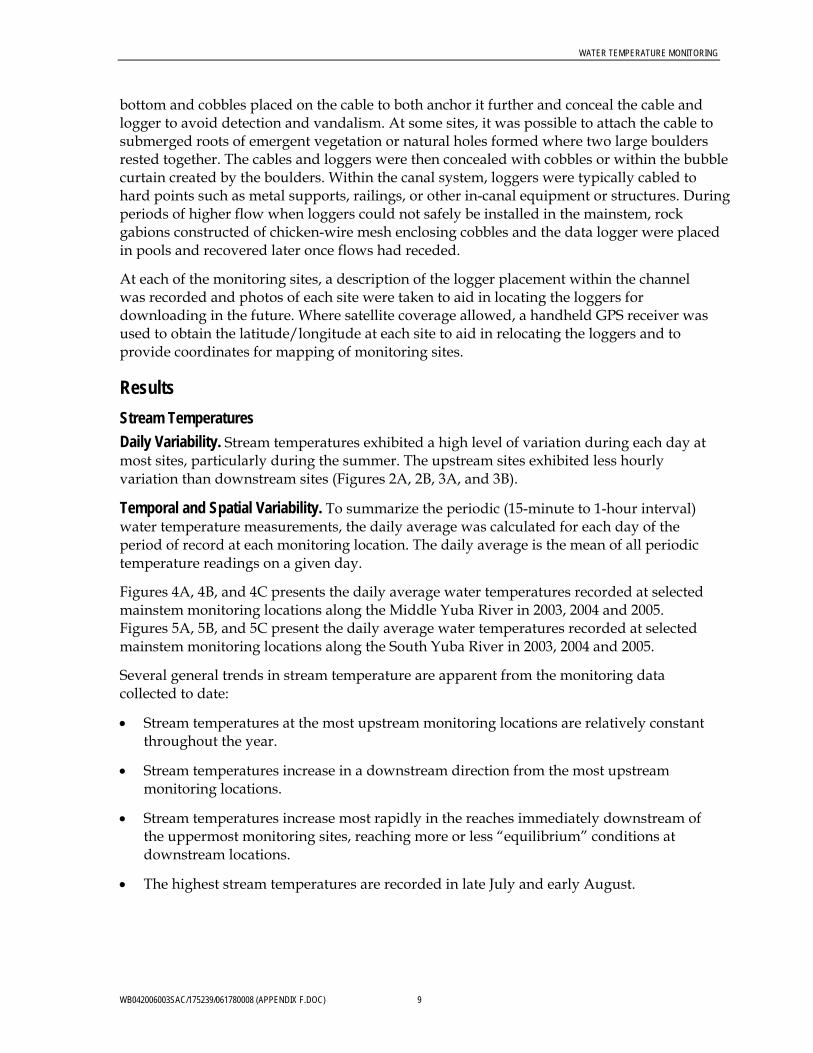
WATER TEMPERATURE MONITORING
bottom and cobbles placed on the cable to both anchor it further and conceal the cable and logger to avoid detection and vandalism. At some sites, it was possible to attach the cable to submerged roots of emergent vegetation or natural holes formed where two large boulders rested together. The cables and loggers were then concealed with cobbles or within the bubble curtain created by the boulders. Within the canal system, loggers were typically cabled to hard points such as metal supports, railings, or other in-canal equipment or structures. During periods of higher flow when loggers could not safely be installed in the mainstem, rock gabions constructed of chicken-wire mesh enclosing cobbles and the data logger were placed in pools and recovered later once flows had receded.
At each of the monitoring sites, a description of the logger placement within the channel was recorded and photos of each site were taken to aid in locating the loggers for downloading in the future. Where satellite coverage allowed, a handheld GPS receiver was used to obtain the latitude/longitude at each site to aid in relocating the loggers and to provide coordinates for mapping of monitoring sites.
Results Stream Temperatures Daily Variability. Stream temperatures exhibited a high level of variation during each day at most sites, particularly during the summer. The upstream sites exhibited less hourly variation than downstream sites (Figures 2A, 2B, 3A, and 3B).
Temporal and Spatial Variability. To summarize the periodic (15-minute to 1-hour interval) water temperature measurements, the daily average was calculated for each day of the period of record at each monitoring location. The daily average is the mean of all periodic temperature readings on a given day.
Figures 4A, 4B, and 4C presents the daily average water temperatures recorded at selected mainstem monitoring locations along the Middle Yuba River in 2003, 2004 and 2005. Figures 5A, 5B, and 5C present the daily average water temperatures recorded at selected mainstem monitoring locations along the South Yuba River in 2003, 2004 and 2005.
Several general trends in stream temperature are apparent from the monitoring data collected to date:
• Stream temperatures at the most upstream monitoring locations are relatively constant throughout the year.
• Stream temperatures increase in a downstream direction from the most upstream monitoring locations.
• Stream temperatures increase most rapidly in the reaches immediately downstream of the uppermost monitoring sites, reaching more or less “equilibrium” conditions at downstream locations.
• The highest stream temperatures are recorded in late July and early August.
WB042006003SAC/175239/061780008 (APPENDIX F.DOC) 9
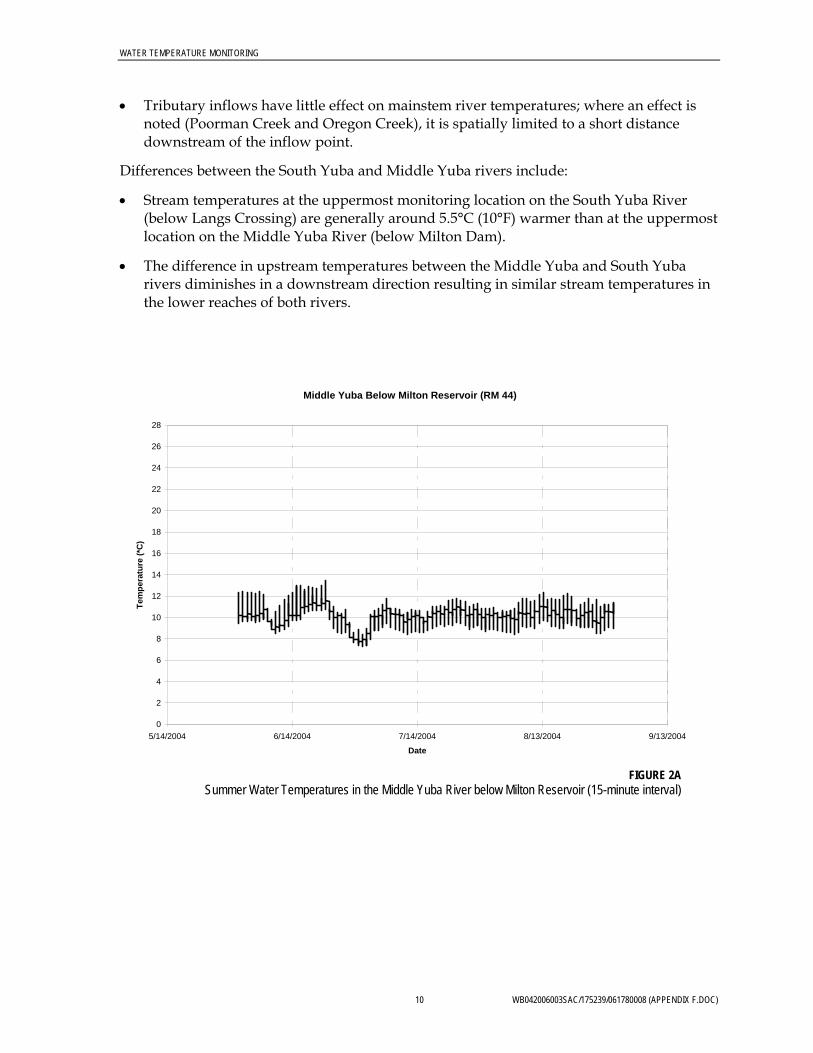
WATER TEMPERATURE MONITORING
• Tributary inflows have little effect on mainstem river temperatures; where an effect is noted (Poorman Creek and Oregon Creek), it is spatially limited to a short distance downstream of the inflow point.
Differences between the South Yuba and Middle Yuba rivers include:
• Stream temperatures at the uppermost monitoring location on the South Yuba River (below Langs Crossing) are generally around 5.5°C (10°F) warmer than at the uppermost location on the Middle Yuba River (below Milton Dam).
• The difference in upstream temperatures between the Middle Yuba and South Yuba rivers diminishes in a downstream direction resulting in similar stream temperatures in the lower reaches of both rivers.
Middle Yuba Below Milton Reservoir (RM 44)
0
2
4
6
8
10
12
14
16
18
20
22
24
26
28
5/14/2004 6/14/2004 7/14/2004 8/13/2004 9/13/2004
Date
Tem
pera
ture
(*C
)
FIGURE 2A Summer Water Temperatures in the Middle Yuba River below Milton Reservoir (15-minute interval)
10 WB042006003SAC/175239/061780008 (APPENDIX F.DOC)
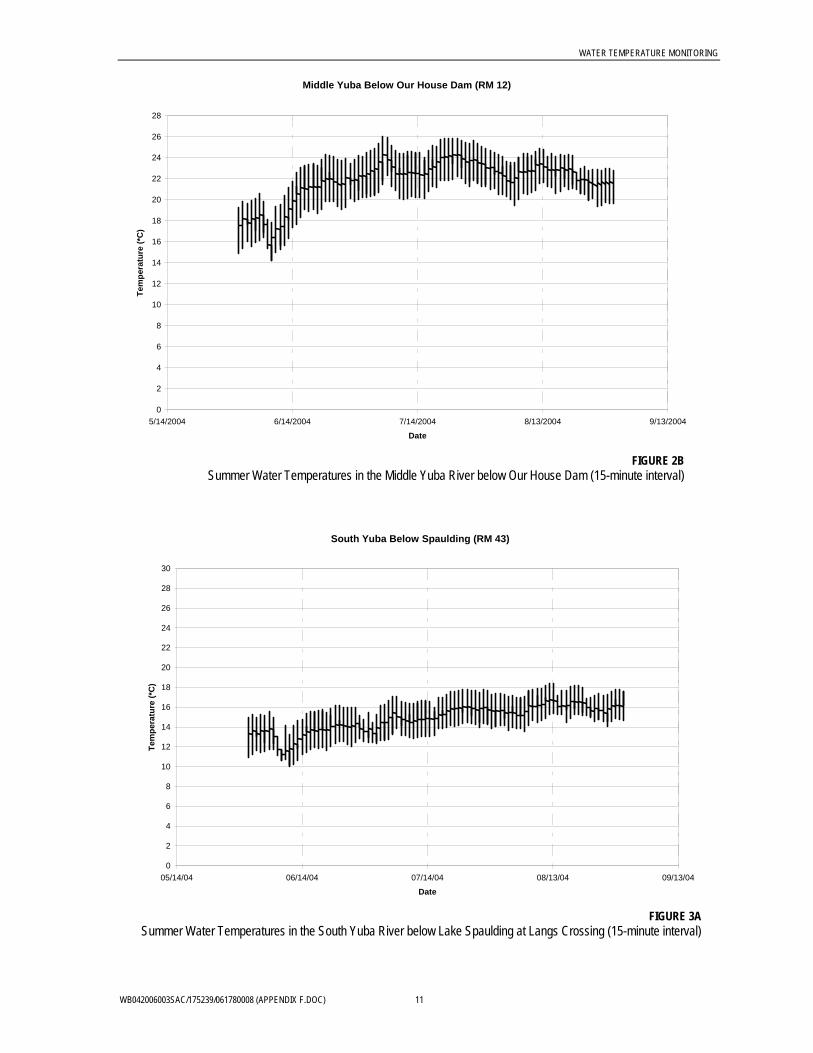
WATER TEMPERATURE MONITORING
Middle Yuba Below Our House Dam (RM 12)
0
2
4
6
8
10
12
14
16
18
20
22
24
26
28
5/14/2004 6/14/2004 7/14/2004 8/13/2004 9/13/2004
Date
Tem
pera
ture
(*C
)
FIGURE 2B
Summer Water Temperatures in the Middle Yuba River below Our House Dam (15-minute interval)
South Yuba Below Spaulding (RM 43)
0
2
4
6
8
10
12
14
16
18
20
22
24
26
28
30
05/14/04 06/14/04 07/14/04 08/13/04 09/13/04
Date
Tem
pera
ture
(*C
)
FIGURE 3A
Summer Water Temperatures in the South Yuba River below Lake Spaulding at Langs Crossing (15-minute interval)
WB042006003SAC/175239/061780008 (APPENDIX F.DOC) 11
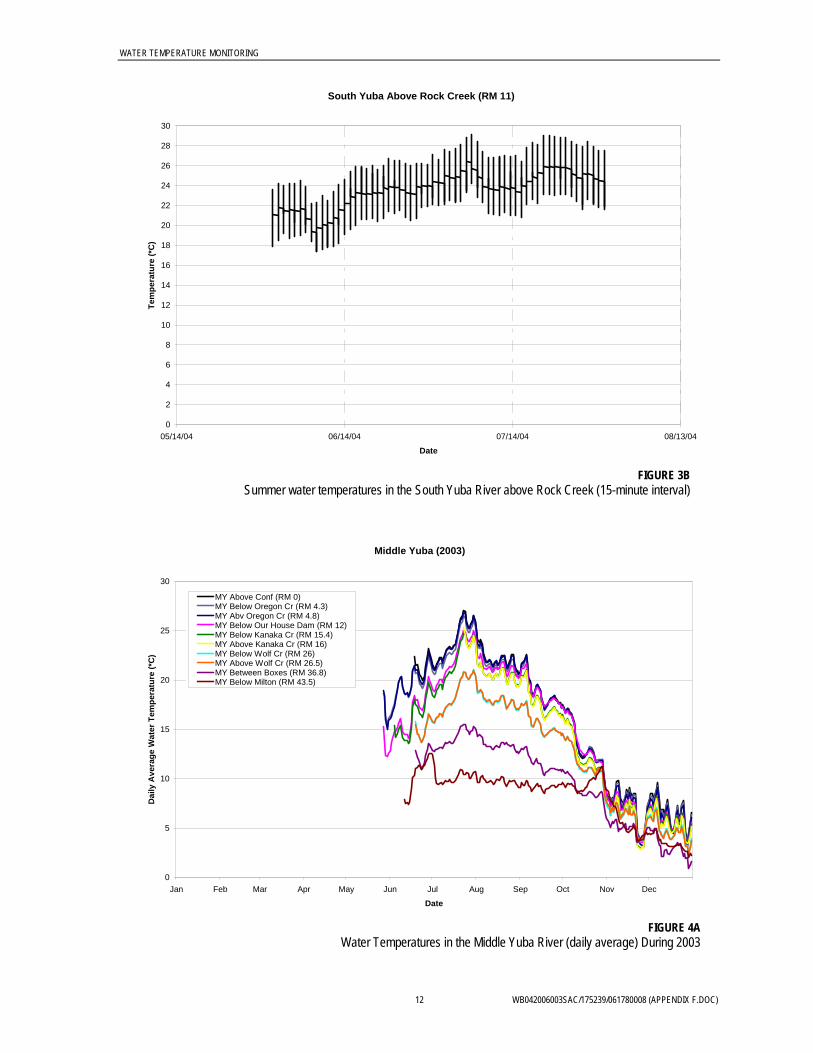
WATER TEMPERATURE MONITORING
South Yuba Above Rock Creek (RM 11)
0
2
4
6
8
10
12
14
16
18
20
22
24
26
28
30
05/14/04 06/14/04 07/14/04 08/13/04
Date
Tem
pera
ture
(*C
)
FIGURE 3B Summer water temperatures in the South Yuba River above Rock Creek (15-minute interval)
Middle Yuba (2003)
0
5
10
15
20
25
30
Jan Feb Mar Apr May Jun Jul Aug Sep Oct Nov Dec
Date
Dai
ly A
vera
ge W
ater
Tem
pera
ture
(*C
)
MY Above Conf (RM 0)MY Below Oregon Cr (RM 4.3)MY Abv Oregon Cr (RM 4.8)MY Below Our House Dam (RM 12)MY Below Kanaka Cr (RM 15.4)MY Above Kanaka Cr (RM 16)MY Below Wolf Cr (RM 26)MY Above Wolf Cr (RM 26.5)MY Between Boxes (RM 36.8)MY Below Milton (RM 43.5)
FIGURE 4A
Water Temperatures in the Middle Yuba River (daily average) During 2003
12 WB042006003SAC/175239/061780008 (APPENDIX F.DOC)
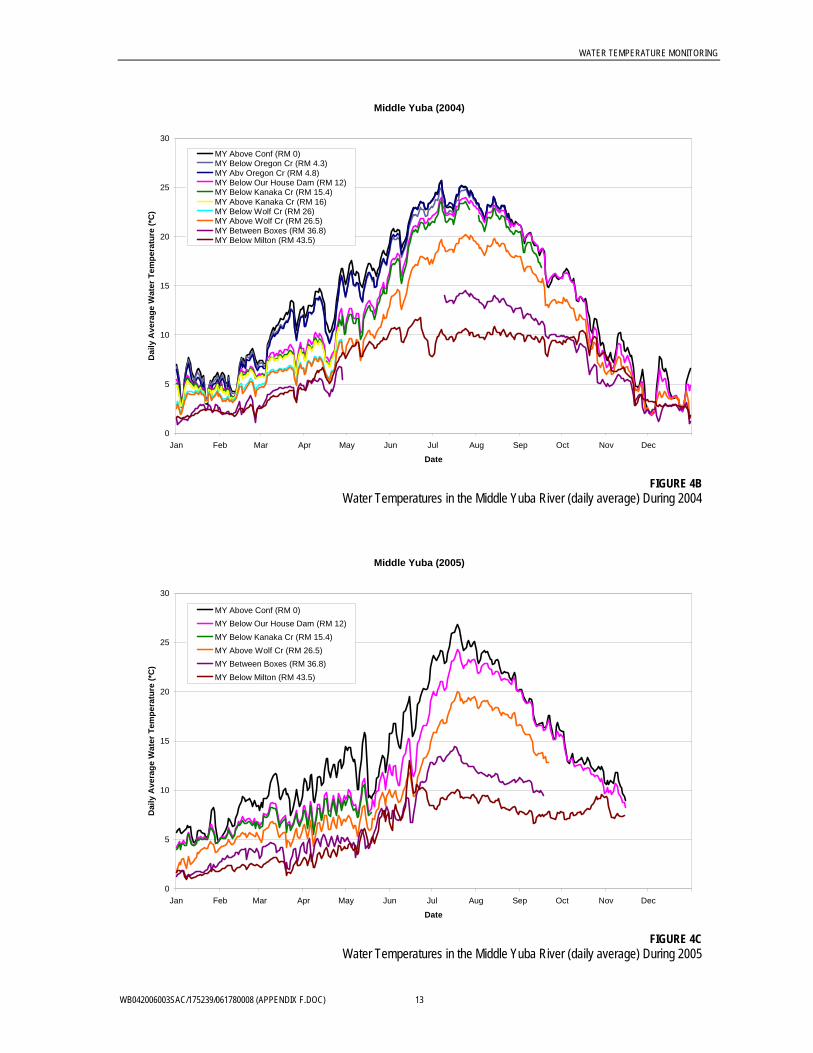
WATER TEMPERATURE MONITORING
Middle Yuba (2004)
0
5
10
15
20
25
30
Jan Feb Mar Apr May Jun Jul Aug Sep Oct Nov Dec
Date
Dai
ly A
vera
ge W
ater
Tem
pera
ture
(*C
)MY Above Conf (RM 0)MY Below Oregon Cr (RM 4.3)MY Abv Oregon Cr (RM 4.8)MY Below Our House Dam (RM 12)MY Below Kanaka Cr (RM 15.4)MY Above Kanaka Cr (RM 16)MY Below Wolf Cr (RM 26)MY Above Wolf Cr (RM 26.5)MY Between Boxes (RM 36.8)MY Below Milton (RM 43.5)
FIGURE 4B
Water Temperatures in the Middle Yuba River (daily average) During 2004
Middle Yuba (2005)
0
5
10
15
20
25
30
Jan Feb Mar Apr May Jun Jul Aug Sep Oct Nov Dec
Date
Dai
ly A
vera
ge W
ater
Tem
pera
ture
(*C
)
MY Above Conf (RM 0)MY Below Our House Dam (RM 12)MY Below Kanaka Cr (RM 15.4)MY Above Wolf Cr (RM 26.5)MY Between Boxes (RM 36.8)MY Below Milton (RM 43.5)
FIGURE 4C
Water Temperatures in the Middle Yuba River (daily average) During 2005
WB042006003SAC/175239/061780008 (APPENDIX F.DOC) 13
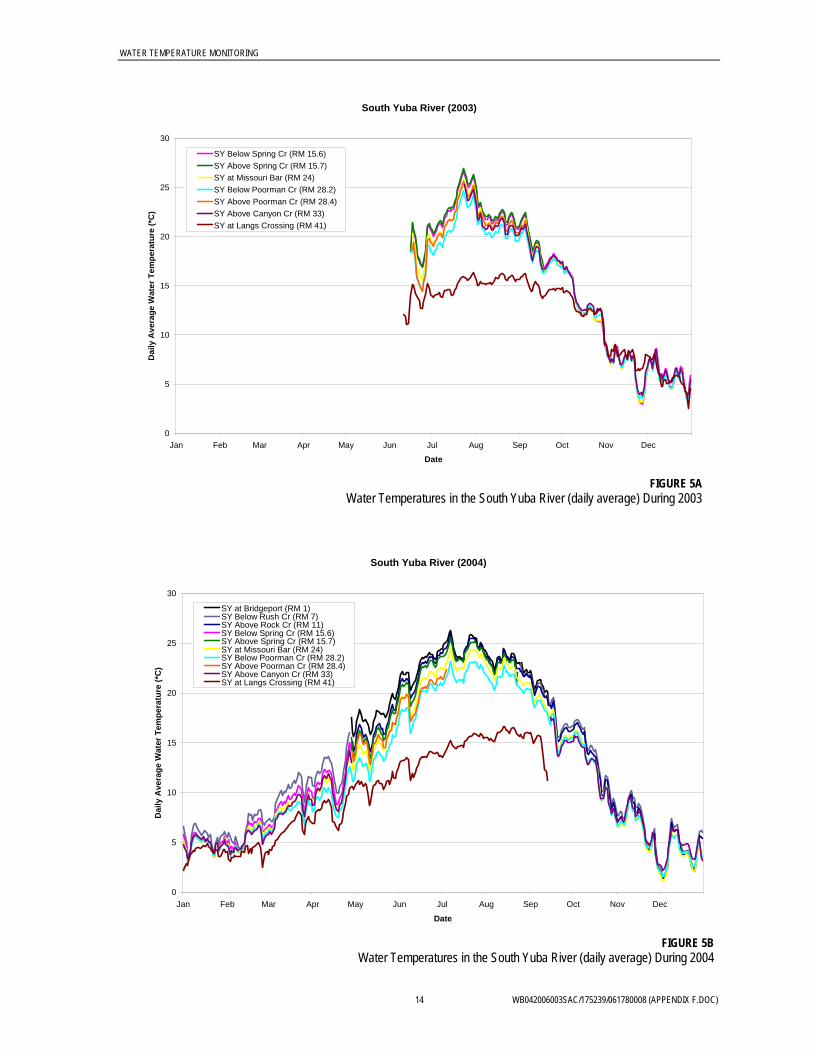
WATER TEMPERATURE MONITORING
South Yuba River (2003)
0
5
10
15
20
25
30
Jan Feb Mar Apr May Jun Jul Aug Sep Oct Nov Dec
Date
Dai
ly A
vera
ge W
ater
Tem
pera
ture
(*C
)SY Below Spring Cr (RM 15.6)SY Above Spring Cr (RM 15.7)SY at Missouri Bar (RM 24)SY Below Poorman Cr (RM 28.2)SY Above Poorman Cr (RM 28.4)SY Above Canyon Cr (RM 33)SY at Langs Crossing (RM 41)
FIGURE 5A
Water Temperatures in the South Yuba River (daily average) During 2003
South Yuba River (2004)
0
5
10
15
20
25
30
Jan Feb Mar Apr May Jun Jul Aug Sep Oct Nov Dec
Date
Dai
ly A
vera
ge W
ater
Tem
pera
ture
(*C
)
SY at Bridgeport (RM 1)SY Below Rush Cr (RM 7)SY Above Rock Cr (RM 11)SY Below Spring Cr (RM 15.6)SY Above Spring Cr (RM 15.7)SY at Missouri Bar (RM 24)SY Below Poorman Cr (RM 28.2)SY Above Poorman Cr (RM 28.4)SY Above Canyon Cr (RM 33)SY at Langs Crossing (RM 41)
FIGURE 5B
Water Temperatures in the South Yuba River (daily average) During 2004
14 WB042006003SAC/175239/061780008 (APPENDIX F.DOC)
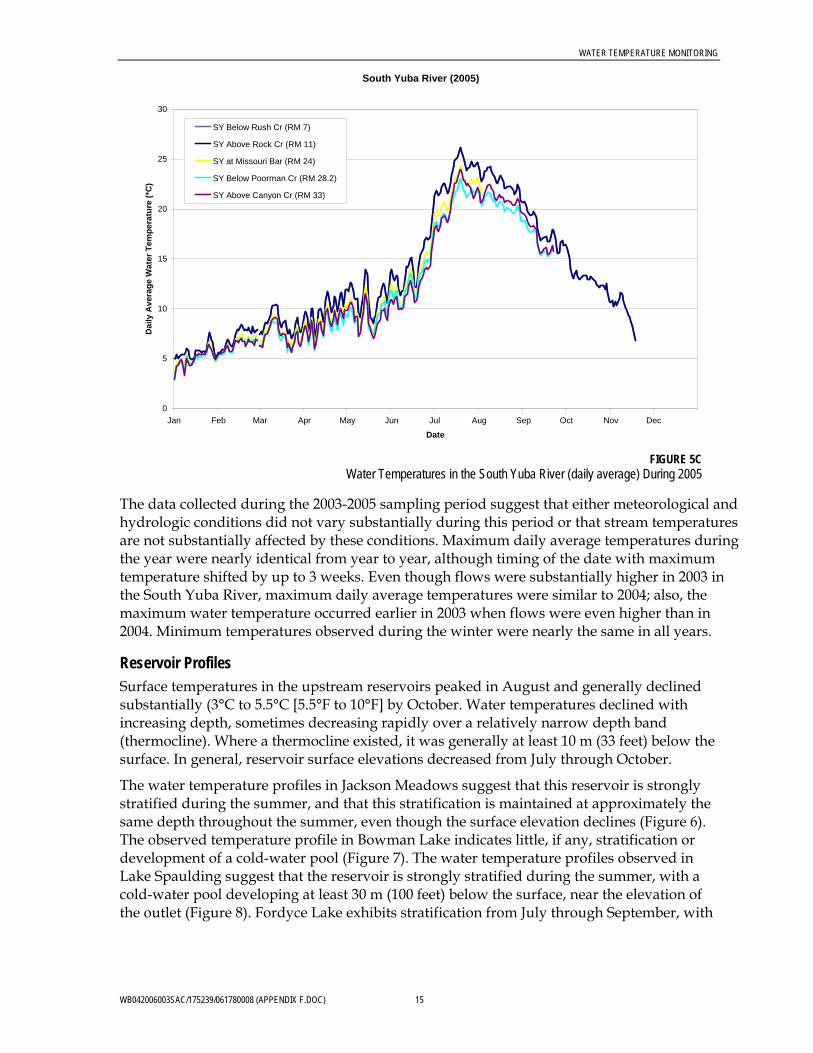
WATER TEMPERATURE MONITORING
The data collected during the 2003-2005 sampling period suggest that either meteorological and hydrologic conditions did not vary substantially during this period or that stream temperatures are not substantially affected by these conditions. Maximum daily average temperatures during the year were nearly identical from year to year, although timing of the date with maximum temperature shifted by up to 3 weeks. Even though flows were substantially higher in 2003 in the South Yuba River, maximum daily average temperatures were similar to 2004; also, the maximum water temperature occurred earlier in 2003 when flows were even higher than in 2004. Minimum temperatures observed during the winter were nearly the same in all years.
South Yuba River (2005)
0
5
10
15
20
25
30
Jan Feb Mar Apr May Jun Jul Aug Sep Oct Nov Dec
Date
Dai
ly A
vera
ge W
ater
Tem
pera
ture
(*C
)
SY Below Rush Cr (RM 7)
SY Above Rock Cr (RM 11)
SY at Missouri Bar (RM 24)
SY Below Poorman Cr (RM 28.2)
SY Above Canyon Cr (RM 33)
FIGURE 5C
Water Temperatures in the South Yuba River (daily average) During 2005
Reservoir Profiles Surface temperatures in the upstream reservoirs peaked in August and generally declined substantially (3°C to 5.5°C [5.5°F to 10°F] by October. Water temperatures declined with increasing depth, sometimes decreasing rapidly over a relatively narrow depth band (thermocline). Where a thermocline existed, it was generally at least 10 m (33 feet) below the surface. In general, reservoir surface elevations decreased from July through October.
The water temperature profiles in Jackson Meadows suggest that this reservoir is strongly stratified during the summer, and that this stratification is maintained at approximately the same depth throughout the summer, even though the surface elevation declines (Figure 6). The observed temperature profile in Bowman Lake indicates little, if any, stratification or development of a cold-water pool (Figure 7). The water temperature profiles observed in Lake Spaulding suggest that the reservoir is strongly stratified during the summer, with a cold-water pool developing at least 30 m (100 feet) below the surface, near the elevation of the outlet (Figure 8). Fordyce Lake exhibits stratification from July through September, with
WB042006003SAC/175239/061780008 (APPENDIX F.DOC) 15
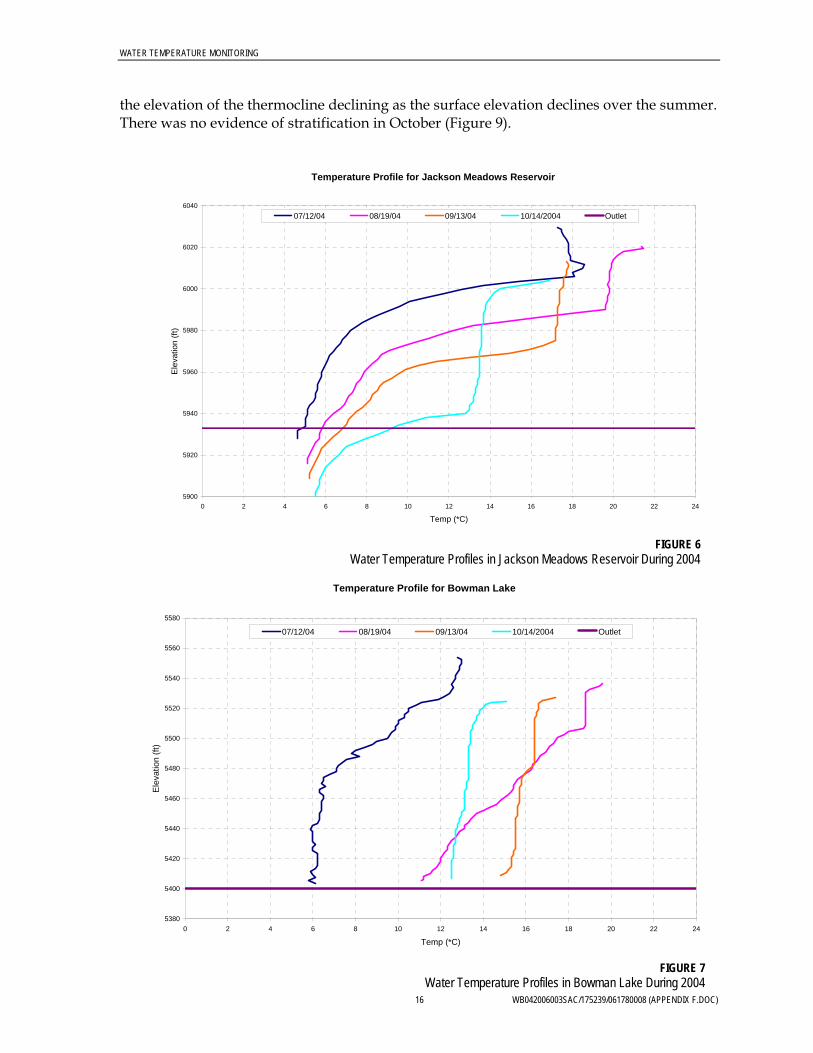
WATER TEMPERATURE MONITORING
the elevation of the thermocline declining as the surface elevation declines over the summer. There was no evidence of stratification in October (Figure 9).
Temperature Profile for Jackson Meadows Reservoir
5900
5920
5940
5960
5980
6000
6020
6040
0 2 4 6 8 10 12 14 16 18 20 22 24
Temp (*C)
Ele
vatio
n (ft
)
07/12/04 08/19/04 09/13/04 10/14/2004 Outlet
FIGURE 6
Water Temperature Profiles in Jackson Meadows Reservoir During 2004
Temperature Profile for Bowman Lake
5380
5400
5420
5440
5460
5480
5500
5520
5540
5560
5580
0 2 4 6 8 10 12 14 16 18 20 22 2
Temp (*C)
Ele
vatio
n (ft
)
16 WB042006003SAC/175239/061780008 (APPENDIX F.DOC)
4
07/12/04 08/19/04 09/13/04 10/14/2004 Outlet
FIGURE 7
Water Temperature Profiles in Bowman Lake During 2004
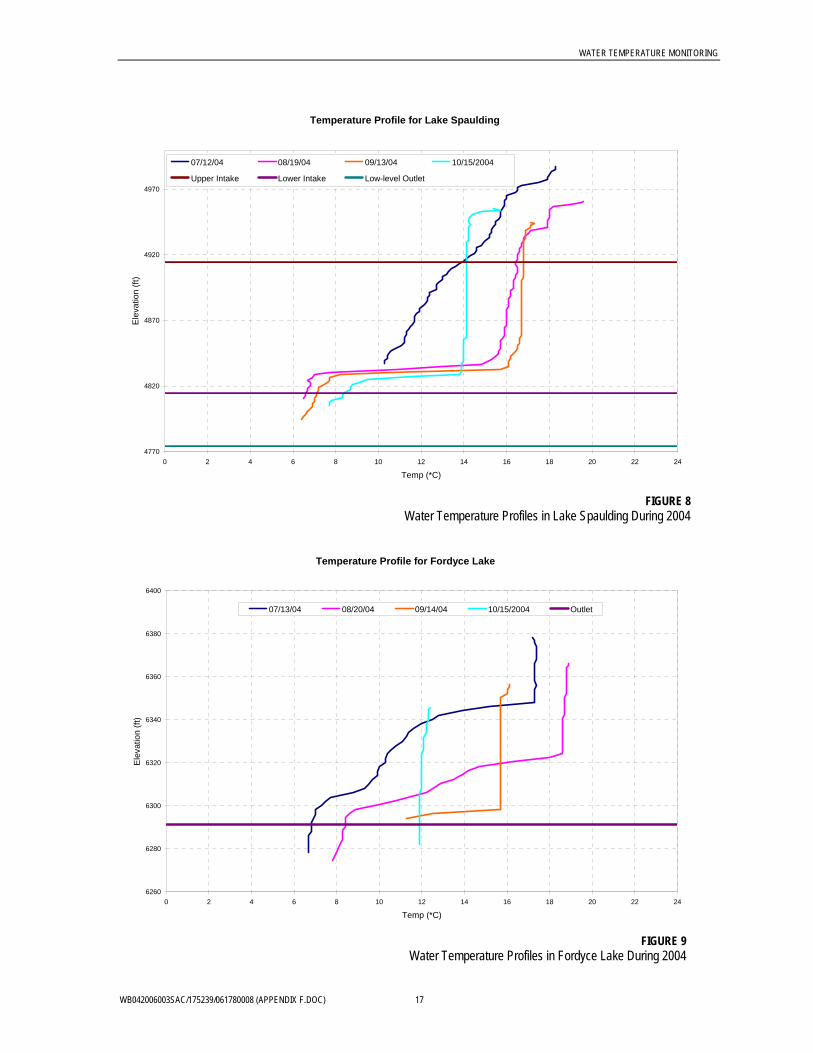
WATER TEMPERATURE MONITORING
Temperature Profile for Lake Spaulding
4770
4820
4870
4920
4970
0 2 4 6 8 10 12 14 16 18 20 22 2
Temp (*C)
Ele
vatio
n (ft
)
4
07/12/04 08/19/04 09/13/04 10/15/2004
Upper Intake Lower Intake Low-level Outlet
FIGURE 8
Water Temperature Profiles in Lake Spaulding During 2004
Temperature Profile for Fordyce Lake
6260
6280
6300
6320
6340
6360
6380
6400
0 2 4 6 8 10 12 14 16 18 20 22 2
Temp (*C)
Ele
vatio
n (ft
)
4
07/13/04 08/20/04 09/14/04 10/15/2004 Outlet
FIGURE 9
Water Temperature Profiles in Fordyce Lake During 2004
WB042006003SAC/175239/061780008 (APPENDIX F.DOC) 17
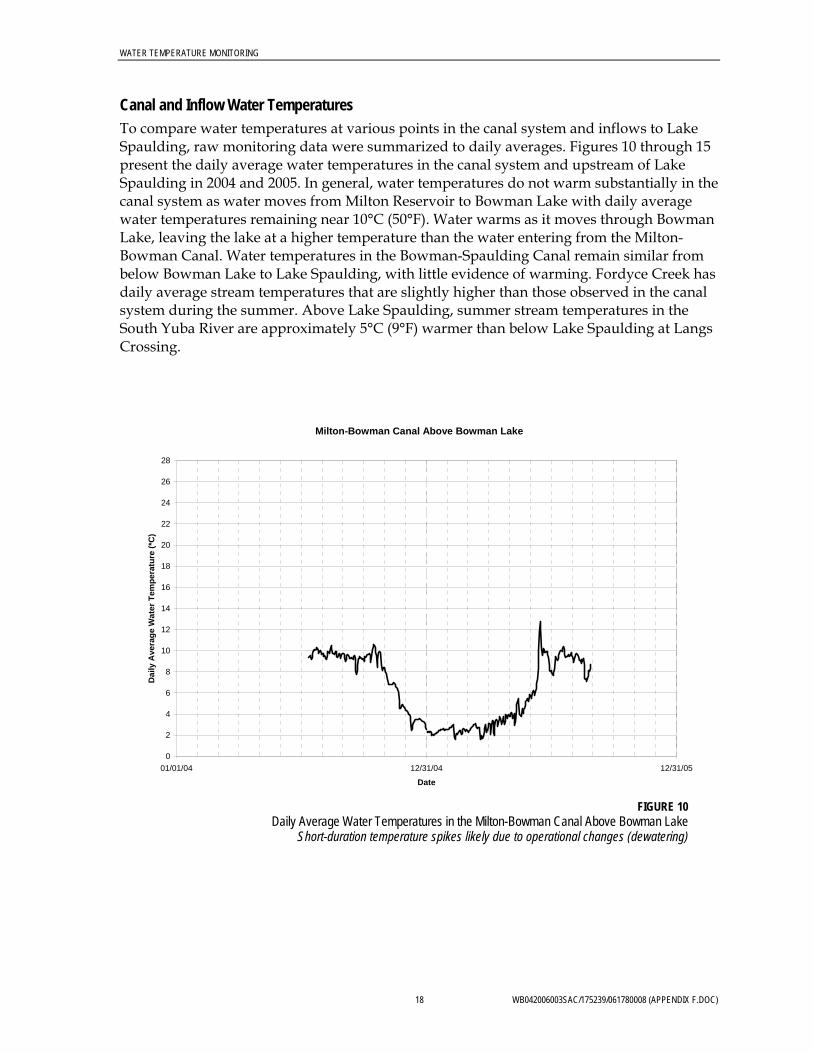
WATER TEMPERATURE MONITORING
Canal and Inflow Water Temperatures To compare water temperatures at various points in the canal system and inflows to Lake Spaulding, raw monitoring data were summarized to daily averages. Figures 10 through 15 present the daily average water temperatures in the canal system and upstream of Lake Spaulding in 2004 and 2005. In general, water temperatures do not warm substantially in the canal system as water moves from Milton Reservoir to Bowman Lake with daily average water temperatures remaining near 10°C (50°F). Water warms as it moves through Bowman Lake, leaving the lake at a higher temperature than the water entering from the Milton-Bowman Canal. Water temperatures in the Bowman-Spaulding Canal remain similar from below Bowman Lake to Lake Spaulding, with little evidence of warming. Fordyce Creek has daily average stream temperatures that are slightly higher than those observed in the canal system during the summer. Above Lake Spaulding, summer stream temperatures in the South Yuba River are approximately 5°C (9°F) warmer than below Lake Spaulding at Langs Crossing.
Milton-Bowman Canal Above Bowman Lake
0
2
4
6
8
10
12
14
16
18
20
22
24
26
28
01/01/04 12/31/04 12/31/05
Date
Dai
ly A
vera
ge W
ater
Tem
pera
ture
(*C
)
FIGURE 10 Daily Average Water Temperatures in the Milton-Bowman Canal Above Bowman Lake
Short-duration temperature spikes likely due to operational changes (dewatering)
18 WB042006003SAC/175239/061780008 (APPENDIX F.DOC)
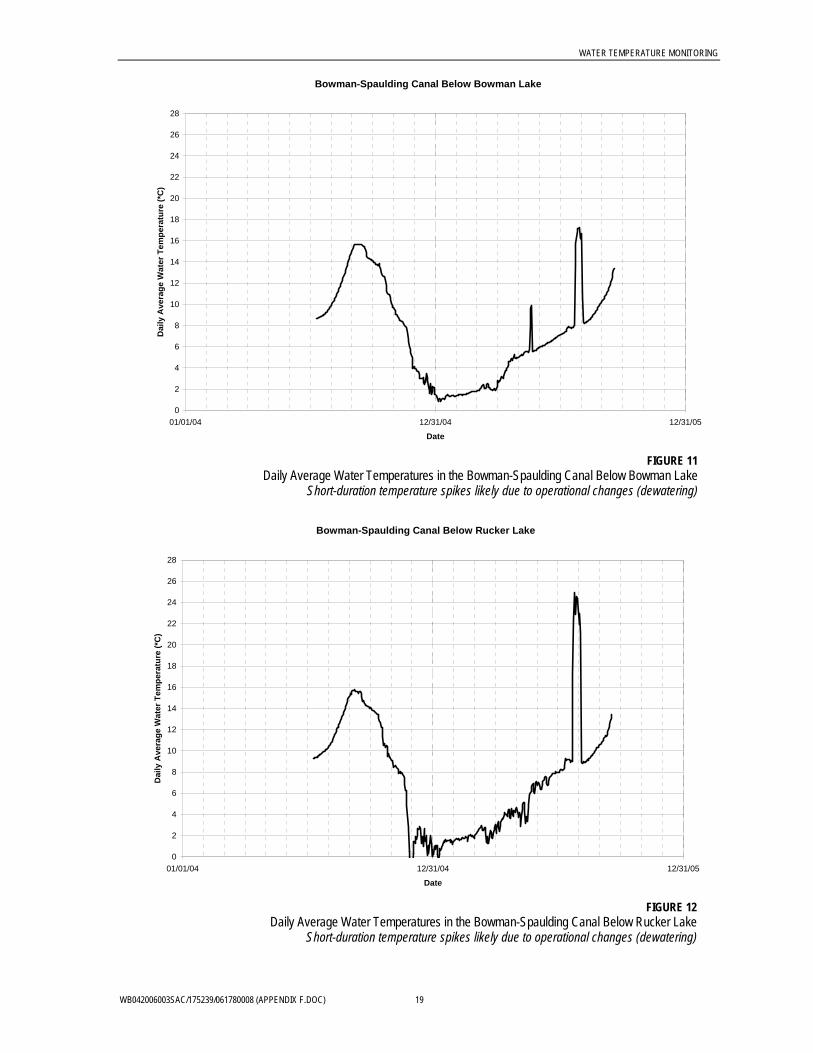
WATER TEMPERATURE MONITORING
WB042006003SAC/175239/061780008 (APPENDIX F.DOC) 19
Bowman-Spaulding Canal Below Bowman Lake
0
2
4
6
8
10
12
14
16
18
20
22
24
26
28
01/01/04 12/31/04 12/31/05
Date
Dai
ly A
vera
ge W
ater
Tem
pera
ture
(*C
)
FIGURE 11 Daily Average Water Temperatures in the Bowman-Spaulding Canal Below Bowman Lake
Short-duration temperature spikes likely due to operational changes (dewatering)
Bowman-Spaulding Canal Below Rucker Lake
0
2
4
6
8
10
12
14
16
18
20
22
24
26
28
01/01/04 12/31/04 12/31/05
Date
Dai
ly A
vera
ge W
ater
Tem
pera
ture
(*C
)
FIGURE 12 Daily Average Water Temperatures in the Bowman-Spaulding Canal Below Rucker Lake
Short-duration temperature spikes likely due to operational changes (dewatering)
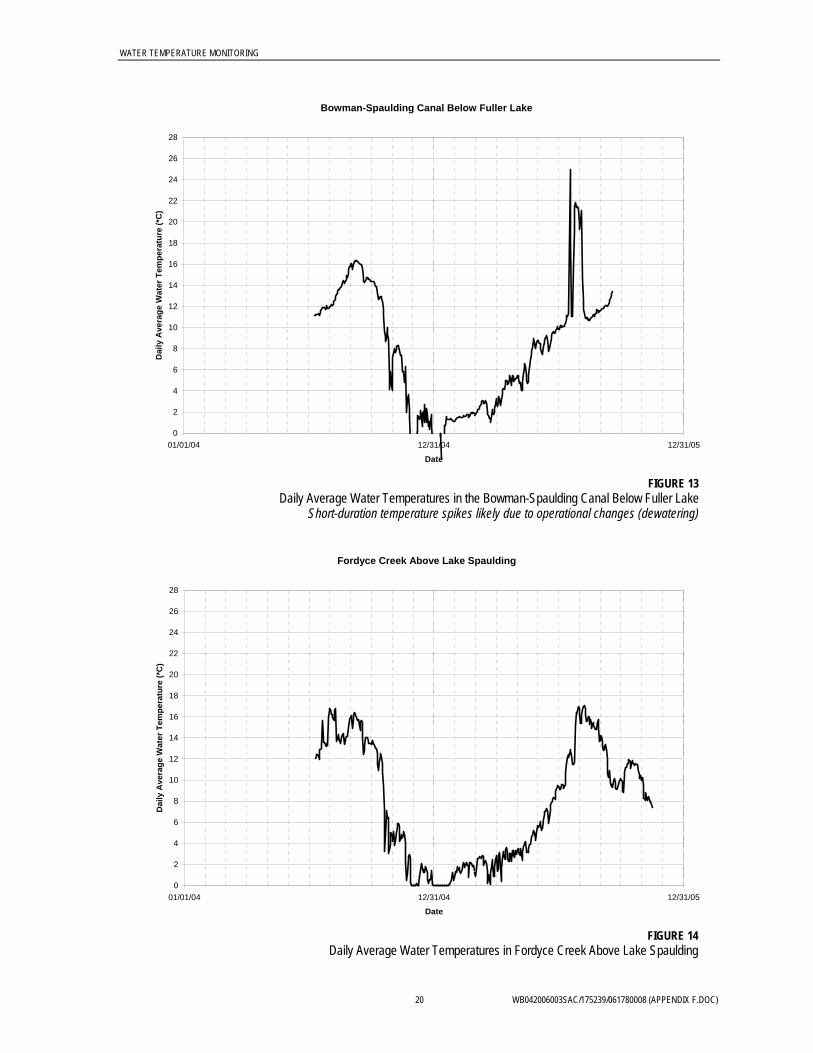
WATER TEMPERATURE MONITORING
Bowman-Spaulding Canal Below Fuller Lake
0
2
4
6
8
10
12
14
16
18
20
22
24
26
28
01/01/04 12/31/04 12/31/05
Date
Dai
ly A
vera
ge W
ater
Tem
pera
ture
(*C
)
FIGURE 13 Daily Average Water Temperatures in the Bowman-Spaulding Canal Below Fuller Lake
Short-duration temperature spikes likely due to operational changes (dewatering)
Fordyce Creek Above Lake Spaulding
0
2
4
6
8
10
12
14
16
18
20
22
24
26
28
01/01/04 12/31/04 12/31/05
Date
Dai
ly A
vera
ge W
ater
Tem
pera
ture
(*C
)
FIGURE 14 Daily Average Water Temperatures in Fordyce Creek Above Lake Spaulding
20 WB042006003SAC/175239/061780008 (APPENDIX F.DOC)
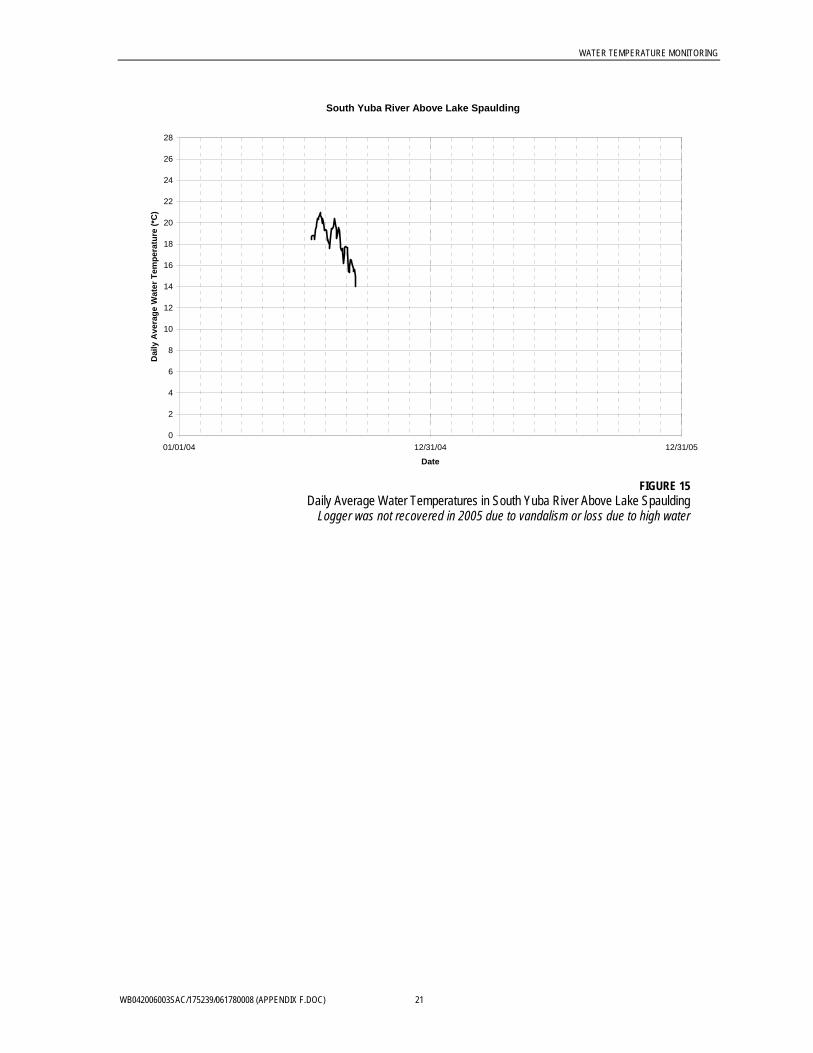
WATER TEMPERATURE MONITORING
South Yuba River Above Lake Spaulding
0
2
4
6
8
10
12
14
16
18
20
22
24
26
28
01/01/04 12/31/04 12/31/05
Date
Dai
ly A
vera
ge W
ater
Tem
pera
ture
(*C
)
FIGURE 15 Daily Average Water Temperatures in South Yuba River Above Lake Spaulding
Logger was not recovered in 2005 due to vandalism or loss due to high water
WB042006003SAC/175239/061780008 (APPENDIX F.DOC) 21
APPENDIX G
Middle and South Yuba Rainbow Trout (Oncorhynchus mykiss) Distribution and
Abundance Dive Counts August 2004
Middle and South Yuba Rainbow Trout (Oncorhynchus mykiss)
Distribution and Abundance
Dive Counts August 2004
FINAL DRAFT
Prepared by:
Tom Gast, Mark Allen, and Scott Riley
Thomas R. Payne and Associates
890 L Street
Arcata, CA 95521
(707) 822-8478
August 2005
Middle and South Yuba Rainbow Trout (Oncorhynchus mykiss) Distribution and Abundance Dive Counts August 2004
Table of Contents
List of Tables...........................................................................................................III List of Figures.......................................................................................................... IV Introduction ..............................................................................................................1 Methods....................................................................................................................1
Distribution and Abundance ....................................................................................1 Thermal Refugia.....................................................................................................3 Barriers..................................................................................................................3
Analysis ....................................................................................................................4 Results......................................................................................................................4
Fish Distribution .....................................................................................................4 Rainbow Trout Density ...........................................................................................7 Thermal Refugia...................................................................................................16
Deep Pools .......................................................................................................16 Tributaries ........................................................................................................18
Barriers................................................................................................................20 Discussion ...............................................................................................................20
Relationship Between Water Temperature and Fish Densities..................................20 Rainbow Trout ..................................................................................................20 Non-Salmonid Species .......................................................................................26
Comparison of Rainbow Trout Densities in the Yuba River with Other Northern California Rivers ...................................................................................................26 Potential Rearing Habitat for Anadromous Salmonids..............................................28
References ..............................................................................................................30 Appendix A. Raw data collected during the Middle and South Yuba 2004 dive counts....1 Appendix B. Index densities of fish observed during the Middle and South Yuba 2004 dive counts. ..............................................................................................................1 Appendix C. Photographs of the main stem and tributary barriers to fish passage encountered during the Middle and South Yuba 2004 dive count. .................................1 Appendix D. Monthly mean, median, mode, average daily maximum, average daily minimum, and average daily fluctuation of the Middle and South Yuba 2004 July and August stream temperatures. .....................................................................................1
South Yuba ............................................................................................................1 Middle Yuba ...........................................................................................................2
Thomas R. Payne and Associates Page II 11/7/2007
Middle and South Yuba Rainbow Trout (Oncorhynchus mykiss) Distribution and Abundance Dive Counts August 2004
List of Tables Table 1. Locations and depths of deep pools in which water column temperature
profiles were measured on the South and Middle Yuba Rivers. The temperatures were measured at the bottom and surface of the pools. ......................................17
Table 2. Tributaries to the Middle and South Yuba assessed for thermal refugia for salmonids. RBT = rainbow trout, SKR = Sacramento sucker, SMB = smallmouth bass. ................................................................................................................19
Table 3. Location of potential barriers encountered on the Middle and South Yuba Rivers while conducting the rainbow trout distribution and abundance survey.......20
Table 4. Juvenile and adult rainbow trout index densities and range of densities from all habitat types in the Seneca and Belden Reaches of the North Fork Feather River (2001) and the Middle and South Yuba Rivers (2004). Juveniles were classified as 2-6 inches in the North Fork Feather and 4-8 inches in the Yuba River. No data was collected on rainbow trout fry (less than 2 in) in the NFFR. ...........................27
Table 5. Index densities and range of densities for various size categories of rainbow trout in the Upper Sacramento (2001) and Middle and South Yuba (2004) Rivers (all habitat types combined except deep pools which were not sampled on the Upper Sacramento River). The upper reach of the Upper Sacramento River is upstream of the Cantara Loop Bridge while the lower reach extends to the Shasta Reservoir. ..28
Thomas R. Payne and Associates Page III 11/7/2007
Middle and South Yuba Rainbow Trout (Oncorhynchus mykiss) Distribution and Abundance Dive Counts August 2004
Thomas R. Payne and Associates Page IV 11/7/2007
List of Figures Figure 1. Locations and river mile of dive count units on the Middle and South Yuba
rivers. ................................................................................................................6 Figure 2. Rainbow trout index densities (#/mile) in sampled run, pool, and riffle
habitats (combined) in the Middle Yuba River. The tributaries depicted by the fine vertical lines are: Yellow Jacket Creek (RM 1.8), Oregon Creek (RM 4.8), Kanaka Creek (RM 16.5), and Wolf Creek (RM 26.9). ........................................................8
Figure 3. Rainbow trout index densities (#/mile) in sampled run habitats in the Middle Yuba River. The tributaries depicted by the fine vertical lines are: Yellow Jacket Creek (RM 1.8), Oregon Creek (RM 4.8), Kanaka Creek (RM 16.5), and Wolf Creek (RM 26.9). Note that the index density for 0-4 inch rainbow trout at RM 39.1 is 2913 trout/mile, off the chart scale. .....................................................................9
Figure 4. Rainbow trout index densities (#/mile) in sampled riffle habitats in the Middle Yuba River. The tributaries depicted by the fine vertical lines are: Yellow Jacket Creek (RM 1.8), Oregon Creek (RM 4.8), Kanaka Creek (RM 16.5), and Wolf Creek (RM 26.9). ........................................................................................................10
Figure 5. Rainbow trout index densities (#/mile) in sampled pool habitats in the Middle Yuba River. The tributaries depicted by the fine vertical lines are: Yellow Jacket Creek (RM 1.8), Oregon Creek (RM 4.8), Kanaka Creek (RM 16.5), and Wolf Creek (RM 26.9). ........................................................................................................11
Figure 6. Rainbow trout index densities (#/mile) in sampled run, pool, and riffle habitats (combined) in the South Yuba River. The tributaries depicted by the fine vertical lines are: Owl (RM 4.2), Spring (RM 16), Humbug (RM 20.6), McKilligan (RM 28.1), and Poorman (RM 28.8) creeks. ...............................................................12
Figure 7. Rainbow trout index densities (#/mile) in sampled run habitats in the South Yuba River. The tributaries depicted by the fine vertical lines are: Owl (RM 4.2), Spring (RM 16), Humbug (RM 20.6), McKilligan (RM 28.1), and Poorman (RM 28.8) creeks. Note that the index density for 8-14 inch rainbow trout at RM 39.1 is 951 trout/mile, off the chart scale.............................................................................13
Figure 8. Rainbow trout index densities (#/mile) in sampled riffle habitats in the South Yuba River. The tributaries depicted by the fine vertical lines are: Owl (RM 4.2), Spring (RM 16), Humbug (RM 20.6), McKilligan (RM 28.1), and Poorman (RM 28.8) creeks. .............................................................................................................14
Figure 9. Rainbow trout index densities (#/mile) in sampled pool habitats in the South Yuba River. The tributaries depicted by the fine vertical lines are: Owl (RM 4.2), Spring (RM 16), Humbug (RM 20.6), McKilligan (RM 28.1), and Poorman (RM 28.8) creeks. .............................................................................................................15
Figure 10. Middle and South Yuba mean July and August recorded temperatures (CH2MHILL data) and regression verses river mile. .............................................23
Figure 11. Rainbow trout index densities (three size classes) versus average July water temperature on the Middle and South Yuba rivers. The fine vertical lines show estimated water temperatures at the confluences of Yellowjacket, Oregon, Kanaka, and Wolf creeks on the Middle Yuba and Owl, Spring, Humbug, McKilligan, and Poorman creeks on the South Yuba....................................................................24
Figure 12. Average rainbow trout index densities (#/mile) by estimated mean daily water temperature in July. All index densities for each location which had an average July temperature within each 20F range (midpoint specified on axis) were averaged. .........................................................................................................25
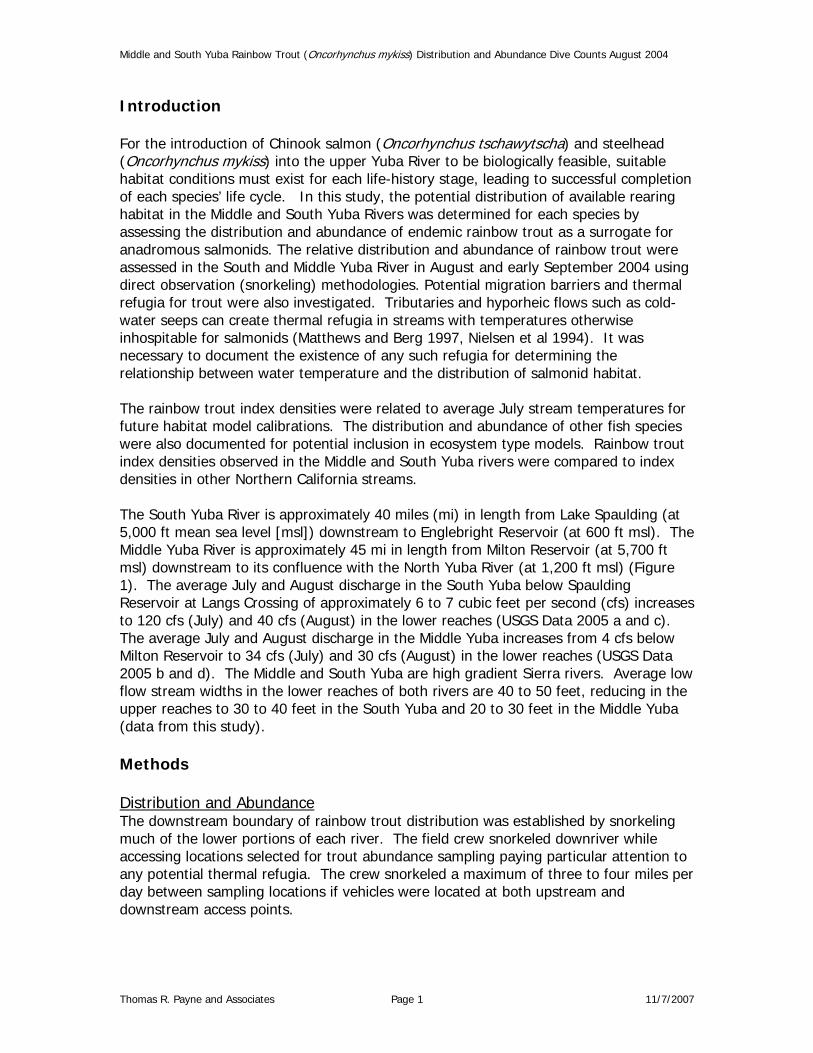
Middle and South Yuba Rainbow Trout (Oncorhynchus mykiss) Distribution and Abundance Dive Counts August 2004
Introduction For the introduction of Chinook salmon (Oncorhynchus tschawytscha) and steelhead (Oncorhynchus mykiss) into the upper Yuba River to be biologically feasible, suitable habitat conditions must exist for each life-history stage, leading to successful completion of each species’ life cycle. In this study, the potential distribution of available rearing habitat in the Middle and South Yuba Rivers was determined for each species by assessing the distribution and abundance of endemic rainbow trout as a surrogate for anadromous salmonids. The relative distribution and abundance of rainbow trout were assessed in the South and Middle Yuba River in August and early September 2004 using direct observation (snorkeling) methodologies. Potential migration barriers and thermal refugia for trout were also investigated. Tributaries and hyporheic flows such as cold-water seeps can create thermal refugia in streams with temperatures otherwise inhospitable for salmonids (Matthews and Berg 1997, Nielsen et al 1994). It was necessary to document the existence of any such refugia for determining the relationship between water temperature and the distribution of salmonid habitat. The rainbow trout index densities were related to average July stream temperatures for future habitat model calibrations. The distribution and abundance of other fish species were also documented for potential inclusion in ecosystem type models. Rainbow trout index densities observed in the Middle and South Yuba rivers were compared to index densities in other Northern California streams. The South Yuba River is approximately 40 miles (mi) in length from Lake Spaulding (at 5,000 ft mean sea level [msl]) downstream to Englebright Reservoir (at 600 ft msl). The Middle Yuba River is approximately 45 mi in length from Milton Reservoir (at 5,700 ft msl) downstream to its confluence with the North Yuba River (at 1,200 ft msl) (Figure 1). The average July and August discharge in the South Yuba below Spaulding Reservoir at Langs Crossing of approximately 6 to 7 cubic feet per second (cfs) increases to 120 cfs (July) and 40 cfs (August) in the lower reaches (USGS Data 2005 a and c). The average July and August discharge in the Middle Yuba increases from 4 cfs below Milton Reservoir to 34 cfs (July) and 30 cfs (August) in the lower reaches (USGS Data 2005 b and d). The Middle and South Yuba are high gradient Sierra rivers. Average low flow stream widths in the lower reaches of both rivers are 40 to 50 feet, reducing in the upper reaches to 30 to 40 feet in the South Yuba and 20 to 30 feet in the Middle Yuba (data from this study). Methods Distribution and Abundance The downstream boundary of rainbow trout distribution was established by snorkeling much of the lower portions of each river. The field crew snorkeled downriver while accessing locations selected for trout abundance sampling paying particular attention to any potential thermal refugia. The crew snorkeled a maximum of three to four miles per day between sampling locations if vehicles were located at both upstream and downstream access points.
Thomas R. Payne and Associates Page 1 11/7/2007
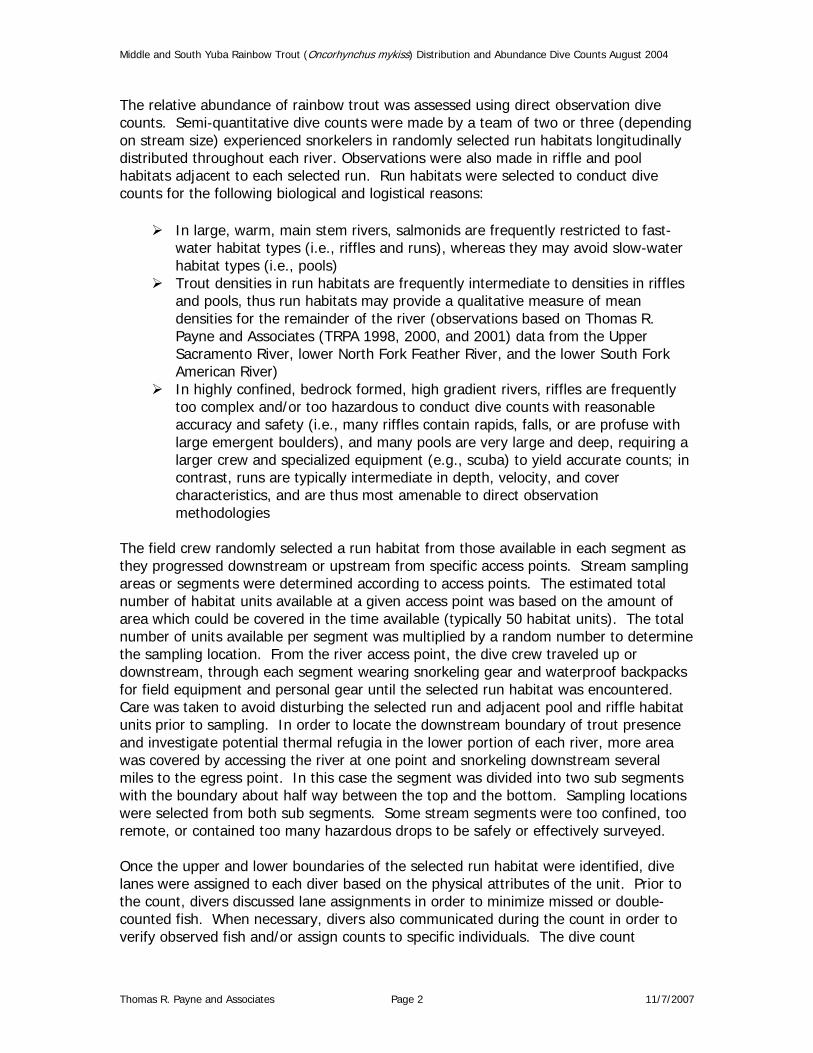
Middle and South Yuba Rainbow Trout (Oncorhynchus mykiss) Distribution and Abundance Dive Counts August 2004
The relative abundance of rainbow trout was assessed using direct observation dive counts. Semi-quantitative dive counts were made by a team of two or three (depending on stream size) experienced snorkelers in randomly selected run habitats longitudinally distributed throughout each river. Observations were also made in riffle and pool habitats adjacent to each selected run. Run habitats were selected to conduct dive counts for the following biological and logistical reasons:
In large, warm, main stem rivers, salmonids are frequently restricted to fast-water habitat types (i.e., riffles and runs), whereas they may avoid slow-water habitat types (i.e., pools)
Trout densities in run habitats are frequently intermediate to densities in riffles and pools, thus run habitats may provide a qualitative measure of mean densities for the remainder of the river (observations based on Thomas R. Payne and Associates (TRPA 1998, 2000, and 2001) data from the Upper Sacramento River, lower North Fork Feather River, and the lower South Fork American River)
In highly confined, bedrock formed, high gradient rivers, riffles are frequently too complex and/or too hazardous to conduct dive counts with reasonable accuracy and safety (i.e., many riffles contain rapids, falls, or are profuse with large emergent boulders), and many pools are very large and deep, requiring a larger crew and specialized equipment (e.g., scuba) to yield accurate counts; in contrast, runs are typically intermediate in depth, velocity, and cover characteristics, and are thus most amenable to direct observation methodologies
The field crew randomly selected a run habitat from those available in each segment as they progressed downstream or upstream from specific access points. Stream sampling areas or segments were determined according to access points. The estimated total number of habitat units available at a given access point was based on the amount of area which could be covered in the time available (typically 50 habitat units). The total number of units available per segment was multiplied by a random number to determine the sampling location. From the river access point, the dive crew traveled up or downstream, through each segment wearing snorkeling gear and waterproof backpacks for field equipment and personal gear until the selected run habitat was encountered. Care was taken to avoid disturbing the selected run and adjacent pool and riffle habitat units prior to sampling. In order to locate the downstream boundary of trout presence and investigate potential thermal refugia in the lower portion of each river, more area was covered by accessing the river at one point and snorkeling downstream several miles to the egress point. In this case the segment was divided into two sub segments with the boundary about half way between the top and the bottom. Sampling locations were selected from both sub segments. Some stream segments were too confined, too remote, or contained too many hazardous drops to be safely or effectively surveyed. Once the upper and lower boundaries of the selected run habitat were identified, dive lanes were assigned to each diver based on the physical attributes of the unit. Prior to the count, divers discussed lane assignments in order to minimize missed or double-counted fish. When necessary, divers also communicated during the count in order to verify observed fish and/or assign counts to specific individuals. The dive count
Thomas R. Payne and Associates Page 2 11/7/2007
Middle and South Yuba Rainbow Trout (Oncorhynchus mykiss) Distribution and Abundance Dive Counts August 2004
commenced with all divers evenly spaced at the downstream end of the unit. The divers then progressed upstream scanning the water for trout. Divers also conducted separate counts along each bank of the run habitats in six-foot wide “fry lanes” in order to focus specifically on small trout fry, which may have been missed in the initial count. All other fish species observed were enumerated on the data forms separately from the trout count data. All observed trout were counted according to size classes (0-4 inches [in], 4-8 in, 8-14 in and >14 in) by reference to an underwater ruler. All count data were recorded on underwater dive slates during the count, and then transferred to data forms following the dive. Divers carried a wrist-mounted ruler incremented with the size classes, and periodically the divers were tested in size estimation using submerged trout models of various sizes. The length and mean width of each sampled run habitat was measured with a laser range finder following the count. Each sampled run was also photographed, its location determined using hand-held GPS receivers (where coverage permitted), and marked on a topographic map. In addition to the surface area measurements, each run was characterized by dominant/subdominant substrate and cover type using the categories identified in the October 2003 Interim Report on current conditions in the Yuba River Watershed (UYRSP 2003). The lengths of sampled pools and riffles were also measured, however widths, substrate, and cover data were not recorded for those habitat types. Water temperatures were recorded and minimum visibility was estimated by measuring the distance that a diver could clearly identify an artificial trout approximately the size of a large fry. Thermal Refugia In order to locate possible thermal refuge areas, water temperatures were measured wherever any unusual clustering of trout were observed, in deep pools where stratification was possible, and above/below all flowing tributary mouths. An AquaCal ClineFinder digital thermometer-depth sounder with a resolution of 0.10 Fahrenheit (F) and accuracy of 0.50 F was used to measure water column temperature profiles. Qualitative assessments of all accessible significant tributaries (Oregon Creek, Kanaka Creek, Yellow Jacket Creek, Wolf Creek, Owl Creek, Humbug Creek, Poorman Creek, and McKilligan Creek) were conducted by visually estimating the stream flow, measuring water temperature, photographing, and visually assessing the rearing potential of the lower reaches. Typically the dive crew continued the assessment upstream to an upstream passage barrier or one to two thousand feet if no barriers were encountered. Any migration barriers observed in the lower portion of the tributary were recorded. A cursory dive survey was conducted in the lower reach of the tributary to determine occupancy by trout, and also in the main stem at the confluence to determine if a thermal refuge was indicated. If evidence of a thermal refuge was found, more detailed evaluation of the refuge characteristics (i.e., temperature recordings, additional dive counts, map sketches, etc.) were conducted at that time. Barriers All potential barriers to fish migration that were encountered while traveling the stream channel were photographed and qualitatively described, with estimated vertical heights and GPS positions recorded at each site. Additional barriers to fish migration likely exist
Thomas R. Payne and Associates Page 3 11/7/2007
Middle and South Yuba Rainbow Trout (Oncorhynchus mykiss) Distribution and Abundance Dive Counts August 2004
in the areas not accessed by the dive crew, consequently this description of potential fish barriers is not intended to represent a complete record. Analysis The dive counts of trout were converted to index estimates of fish density (#/mile), by size class, for each of the sampled habitat units based on the length of the habitat unit sampled. The index densities were then plotted against location (i.e., river mile [RM]) in order to evaluate longitudinal trends in abundance, and to estimate the area of habitat potentially suitable for rearing by anadromous salmonids. For the Middle and South Yuba rivers, the measurement of river mile began at the confluence with the North Yuba and Yuba rivers respectively. The longitudinal distribution and abundance of trout was also compared to recorded mean July temperature data for both the Middle and South Yuba. In addition, the relative densities of trout in the South and Middle Yuba Rivers were compared to estimated index densities of trout (also based on dive counts) from habitats in other main stem California rivers. Results Snorkel counts, refuge assessment, trout distribution, and barrier assessment were conducted on the Middle and South Yuba rivers between 21 August 2004 and 04 September 2004. Measured water temperatures during the survey ranged from 52.7oF to 74.9oF on the Middle Yuba River. On the South Yuba River, temperatures ranged from 63.1oF to 78.5oF. Estimated flows on the Middle Yuba ranged from 8 cfs to 40 cfs, and on the South Yuba flows ranged from 15 cfs to 40 cfs. At the time of this survey, the gaged discharge at Jones Bar on the South Yuba River averaged 40 cfs (38 cfs to 42 cfs) and at Our House Dam on the Middle Yuba River the discharge averaged 25 cfs (23 cfs to 28 cfs) (California Data Exchange Center 2005). Four tributaries to the Middle Yuba and five tributaries to the South Yuba were surveyed for salmonid rearing potential. Water temperature profiles were measured in nine deep pools on the Middle Yuba River and 24 deep pools on the South Yuba River. Four barriers to fish migration were encountered on the Middle Yuba and three were encountered on the South Yuba River. Fish Distribution Counts were completed in 14 runs (each with an associated riffle and pool) on the Middle Yuba, and in 18 runs (with riffles and pools) on the South Yuba (Figure 1). Visibility during the survey ranged from 7 feet (ft) to 18 ft on the Middle Yuba, and from 7 ft to 20 ft on the South Yuba, with the highest visibilities occurring in the upper portions of each river. Gold mining reduced visibility below dredging operations and thwarted snorkeling efforts on several occasions. These locations were revisited. Rainbow trout inhabited the entire length of the Middle Yuba River from Milton Dam to the confluence with the North Yuba. In the South Yuba River, rainbow trout were present from approximately 0.5 miles downstream of Owl Creek (RM 4.2) upstream to Spaulding Reservoir; however, densities were very low downstream of Purdon Crossing (RM 12.3).
Thomas R. Payne and Associates Page 4 11/7/2007
Middle and South Yuba Rainbow Trout (Oncorhynchus mykiss) Distribution and Abundance Dive Counts August 2004
Thomas R. Payne and Associates Page 5 11/7/2007
Other fish species observed included brown trout (Salmo trutta), Sacramento sucker (Catostomus occidentalis), Sacramento pikeminnow (Ptychocheilus grandis), Hardhead (Mylopharodon conocephalus), smallmouth bass (Micropterus dolomieui), and sunfish (Lepomis spp.). No smallmouth bass, adult pikeminnow, or hardhead were observed upstream of Our House Dam (RM 12.6) on the Middle Yuba River; however, a few minnow fry were observed a short distance upstream of the dam. Sacramento suckers were observed below Our House Dam. Brown Trout were present in the upper reaches of the Middle Yuba River from Milton Dam downstream to RM 37.5. In the South Yuba River, adult hardhead were observed at RM 3.9, whereas adult pikeminnow were observed at several locations downstream of RM 10.4. Fry and juvenile minnows and Sacramento sucker were observed upstream to RM 28.3. No smallmouth bass or brown trout were observed, but a few sunfish were observed in a shallow backwater pool at RM 5.7.
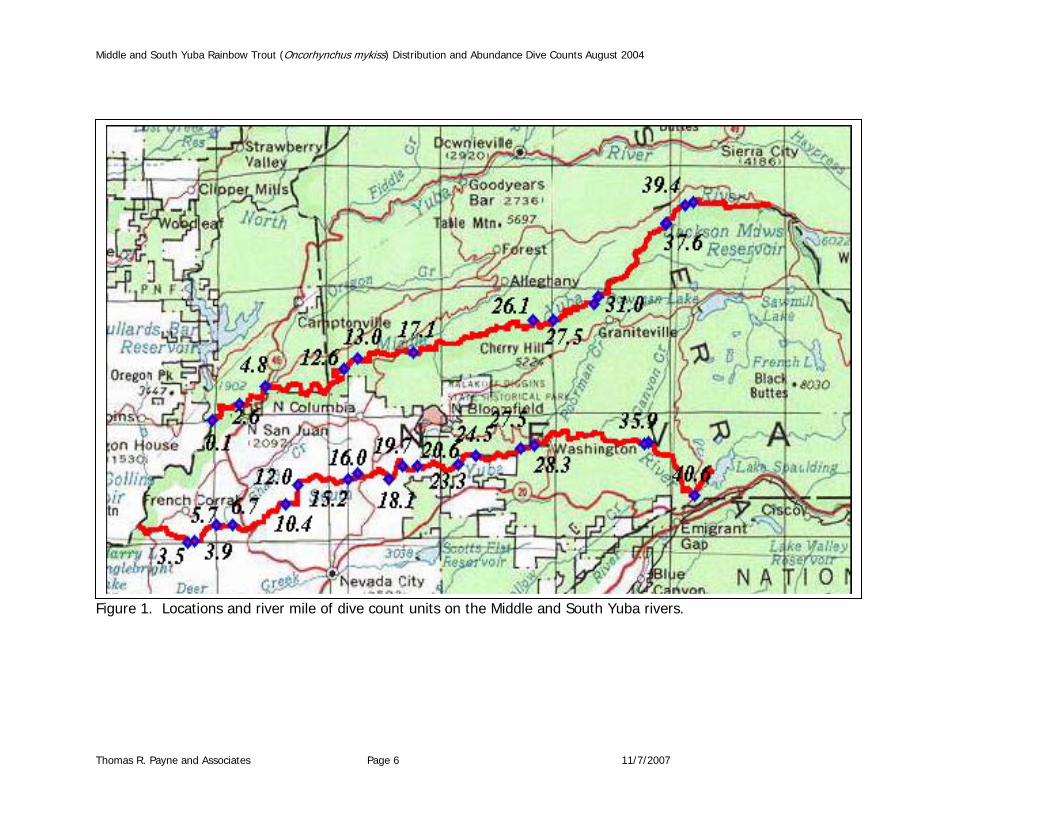
Middle and South Yuba Rainbow Trout (Oncorhynchus mykiss) Distribution and Abundance Dive Counts August 2004
Figure 1. Locations and river mile of dive count units on the Middle and South Yuba rivers.
Thomas R. Payne and Associates Page 6 11/7/2007
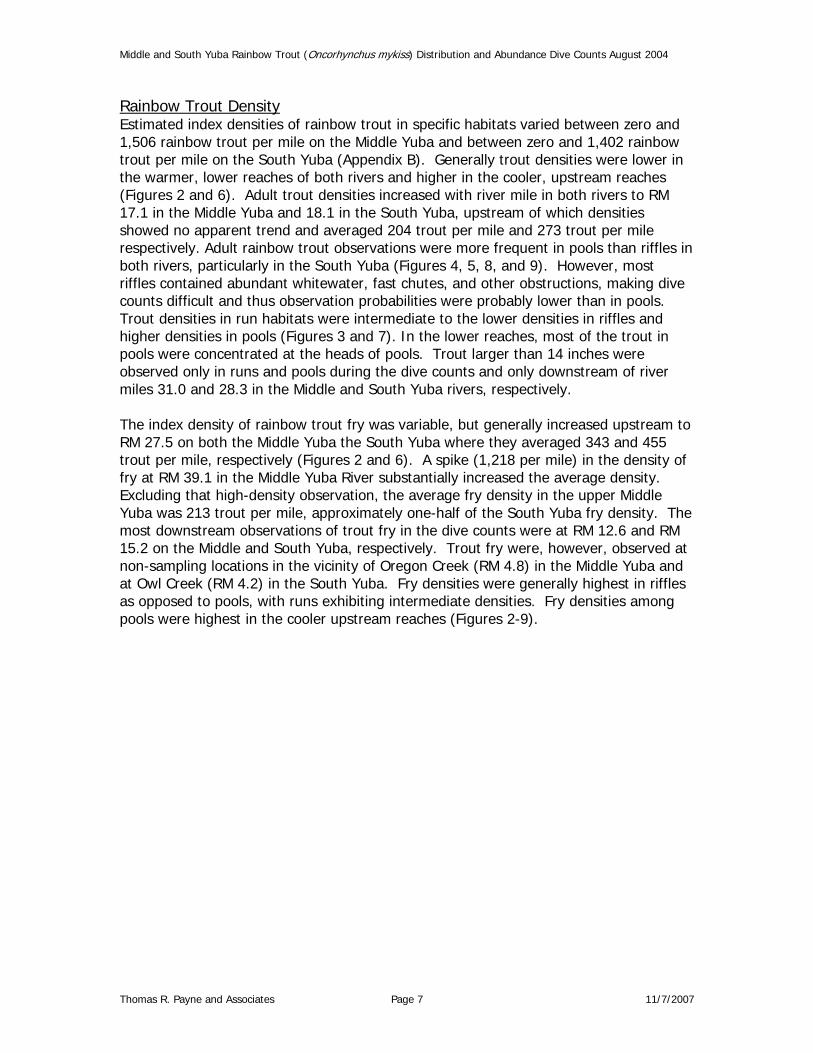
Middle and South Yuba Rainbow Trout (Oncorhynchus mykiss) Distribution and Abundance Dive Counts August 2004
Rainbow Trout Density Estimated index densities of rainbow trout in specific habitats varied between zero and 1,506 rainbow trout per mile on the Middle Yuba and between zero and 1,402 rainbow trout per mile on the South Yuba (Appendix B). Generally trout densities were lower in the warmer, lower reaches of both rivers and higher in the cooler, upstream reaches (Figures 2 and 6). Adult trout densities increased with river mile in both rivers to RM 17.1 in the Middle Yuba and 18.1 in the South Yuba, upstream of which densities showed no apparent trend and averaged 204 trout per mile and 273 trout per mile respectively. Adult rainbow trout observations were more frequent in pools than riffles in both rivers, particularly in the South Yuba (Figures 4, 5, 8, and 9). However, most riffles contained abundant whitewater, fast chutes, and other obstructions, making dive counts difficult and thus observation probabilities were probably lower than in pools. Trout densities in run habitats were intermediate to the lower densities in riffles and higher densities in pools (Figures 3 and 7). In the lower reaches, most of the trout in pools were concentrated at the heads of pools. Trout larger than 14 inches were observed only in runs and pools during the dive counts and only downstream of river miles 31.0 and 28.3 in the Middle and South Yuba rivers, respectively. The index density of rainbow trout fry was variable, but generally increased upstream to RM 27.5 on both the Middle Yuba the South Yuba where they averaged 343 and 455 trout per mile, respectively (Figures 2 and 6). A spike (1,218 per mile) in the density of fry at RM 39.1 in the Middle Yuba River substantially increased the average density. Excluding that high-density observation, the average fry density in the upper Middle Yuba was 213 trout per mile, approximately one-half of the South Yuba fry density. The most downstream observations of trout fry in the dive counts were at RM 12.6 and RM 15.2 on the Middle and South Yuba, respectively. Trout fry were, however, observed at non-sampling locations in the vicinity of Oregon Creek (RM 4.8) in the Middle Yuba and at Owl Creek (RM 4.2) in the South Yuba. Fry densities were generally highest in riffles as opposed to pools, with runs exhibiting intermediate densities. Fry densities among pools were highest in the cooler upstream reaches (Figures 2-9).
Thomas R. Payne and Associates Page 7 11/7/2007
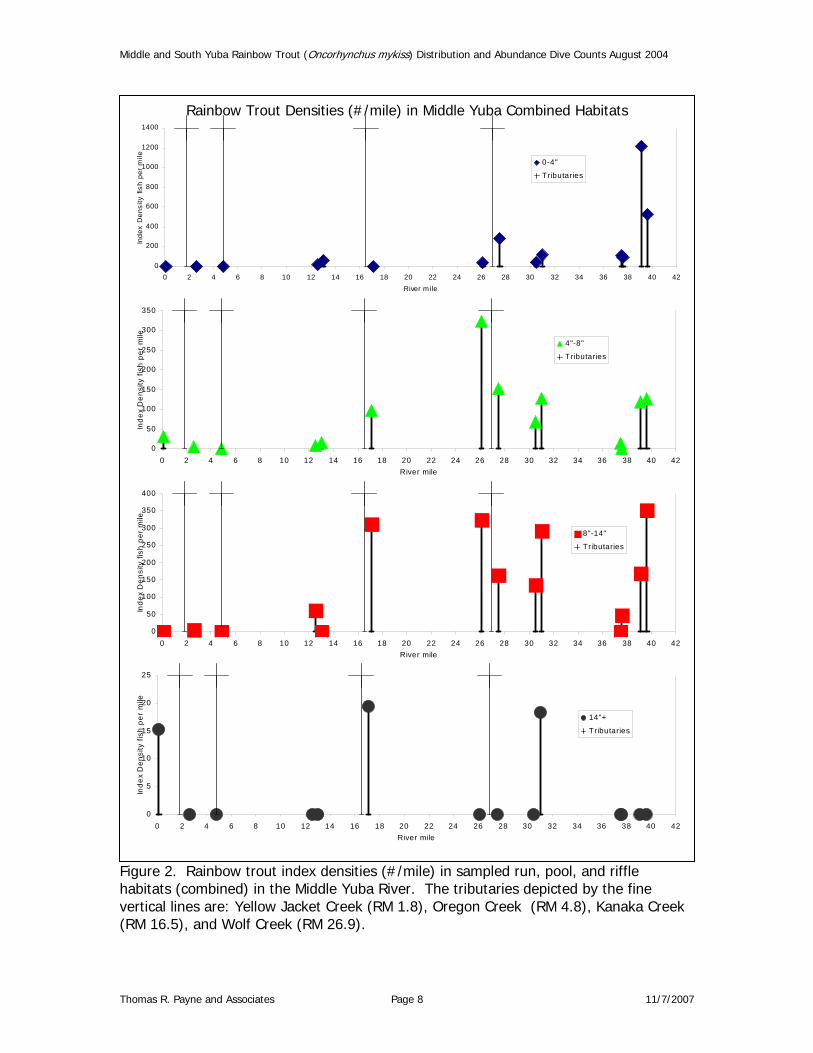
Middle and South Yuba Rainbow Trout (Oncorhynchus mykiss) Distribution and Abundance Dive Counts August 2004
Figure 2. Rainbow trout index densities (#/mile) in sampled run, pool, and riffle habitats (combined) in the Middle Yuba River. The tributaries depicted by the fine vertical lines are: Yellow Jacket Creek (RM 1.8), Oregon Creek (RM 4.8), Kanaka Creek (RM 16.5), and Wolf Creek (RM 26.9).
Rainbow Trout Densities (#/mile) in Middle Yuba Combined Habitats
0
200
400
600
800
1000
1200
1400
0 2 4 6 8 10 12 14 16 18 20 22 24 26 28 30 32 34 36 38 40 42River mile
Inde
x D
ensi
ty fi
sh p
er m
ile
0-4"
Tributaries
0
50
100
150
200
250
300
350
400
0 2 4 6 8 10 12 14 16 18 20 22 24 26 28 30 32 34 36 38 40 42River mile
Inde
x D
ensi
ty fi
sh p
er m
ile
8"-14"
Tributaries
0
50
100
150
200
250
300
350
0 2 4 6 8 10 12 14 16 18 20 22 24 26 28 30 32 34 36 38 40 42River mile
Inde
x D
ensi
ty fi
sh p
er m
ile
4"-8"
Tributaries
0
5
10
15
20
25
0 2 4 6 8 10 12 14 16 18 20 22 24 26 28 30 32 34 36 38 40 42River mile
Inde
x D
ensi
ty fi
sh p
er m
ile
14"+
Tributaries
Thomas R. Payne and Associates Page 8 11/7/2007
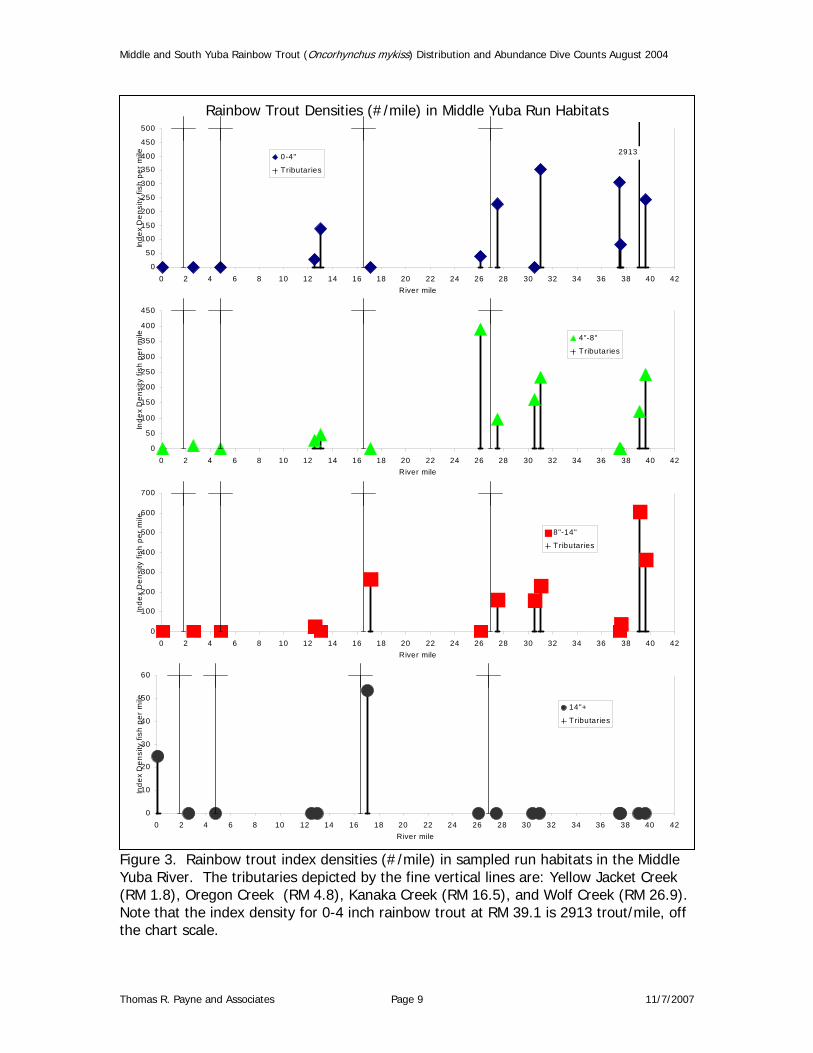
Middle and South Yuba Rainbow Trout (Oncorhynchus mykiss) Distribution and Abundance Dive Counts August 2004
Figure 3. Rainbow trout index densities (#/mile) in sampled run habitats in the Middle Yuba River. The tributaries depicted by the fine vertical lines are: Yellow Jacket Creek (RM 1.8), Oregon Creek (RM 4.8), Kanaka Creek (RM 16.5), and Wolf Creek (RM 26.9). Note that the index density for 0-4 inch rainbow trout at RM 39.1 is 2913 trout/mile, off the chart scale.
Rainbow Trout Densities (#/mile) in Middle Yuba Run Habitats
0
50
100
150
200
250
300
350
400
450
500
0 2 4 6 8 10 12 14 16 18 20 22 24 26 28 30 32 34 36 38 40 42River mile
Inde
x D
ensi
ty fi
sh p
er m
ile 0-4"
Tributaries
2913
0
50
100
150
200
250
300
350
400
450
0 2 4 6 8 10 12 14 16 18 20 22 24 26 28 30 32 34 36 38 40 42River mile
Inde
x D
ensi
ty fi
sh p
er m
ile 4"-8"
Tributaries
0
100
200
300
400
500
600
700
0 2 4 6 8 10 12 14 16 18 20 22 24 26 28 30 32 34 36 38 40 42River mile
Inde
x D
ensi
ty fi
sh p
er m
ile
8"-14"
Tributaries
0
10
20
30
40
50
60
0 2 4 6 8 10 12 14 16 18 20 22 24 26 28 30 32 34 36 38 40 42River mile
Inde
x D
ensi
ty fi
sh p
er m
ile
14"+
Tributaries
Thomas R. Payne and Associates Page 9 11/7/2007
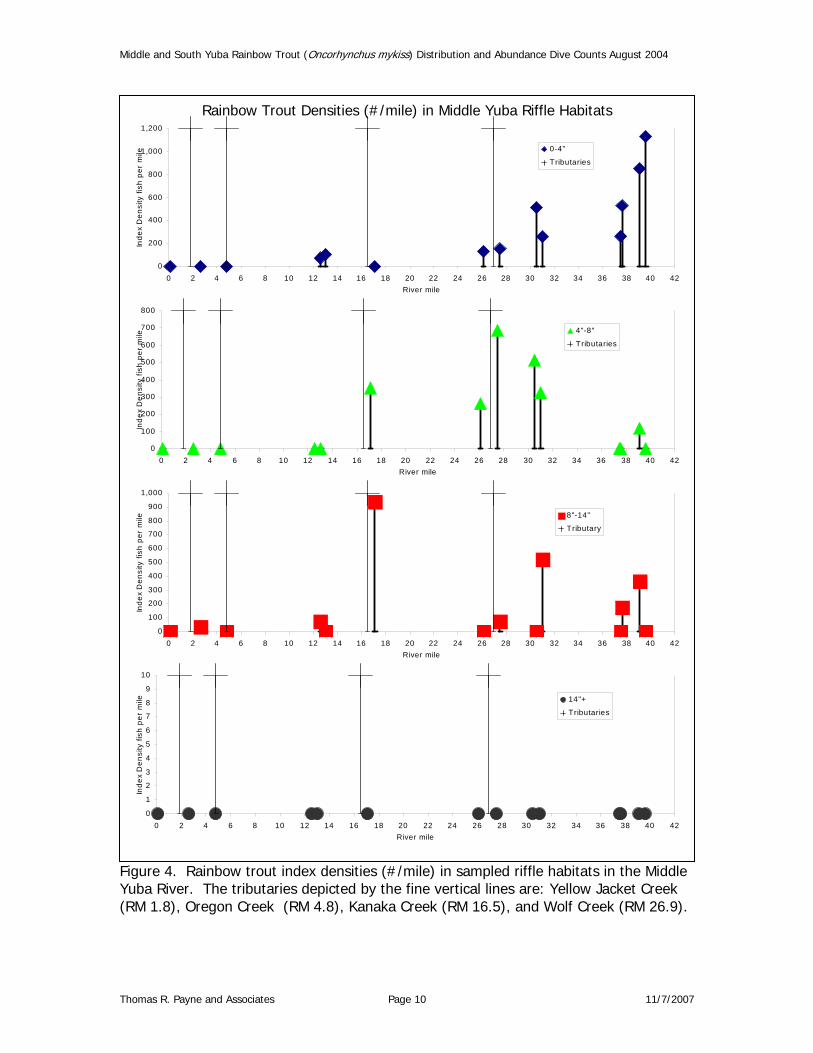
Middle and South Yuba Rainbow Trout (Oncorhynchus mykiss) Distribution and Abundance Dive Counts August 2004
Figure 4. Rainbow trout index densities (#/mile) in sampled riffle habitats in the Middle Yuba River. The tributaries depicted by the fine vertical lines are: Yellow Jacket Creek (RM 1.8), Oregon Creek (RM 4.8), Kanaka Creek (RM 16.5), and Wolf Creek (RM 26.9).
Rainbow Trout Densities (#/mile) in Middle Yuba Riffle Habitats
0
200
400
600
800
1,000
1,200
0 2 4 6 8 10 12 14 16 18 20 22 24 26 28 30 32 34 36 38 40 42River mile
Inde
x D
ensi
ty fi
sh p
er m
ile 0-4"
Tributaries
0
100
200
300
400
500
600
700
800
0 2 4 6 8 10 12 14 16 18 20 22 24 26 28 30 32 34 36 38 40 42River mile
Inde
x D
ensi
ty fi
sh p
er m
ile
4"-8"
Tributaries
0
100
200
300
400
500
600
700
800
900
1,000
0 2 4 6 8 10 12 14 16 18 20 22 24 26 28 30 32 34 36 38 40 42River mile
Inde
x D
ensi
ty fi
sh p
er m
ile 8"-14"
Tributary
0
1
2
3
4
5
6
7
8
9
10
0 2 4 6 8 10 12 14 16 18 20 22 24 26 28 30 32 34 36 38 40 42River mile
Inde
x D
ensi
ty fi
sh p
er m
ile 14"+
Tributaries
Thomas R. Payne and Associates Page 10 11/7/2007
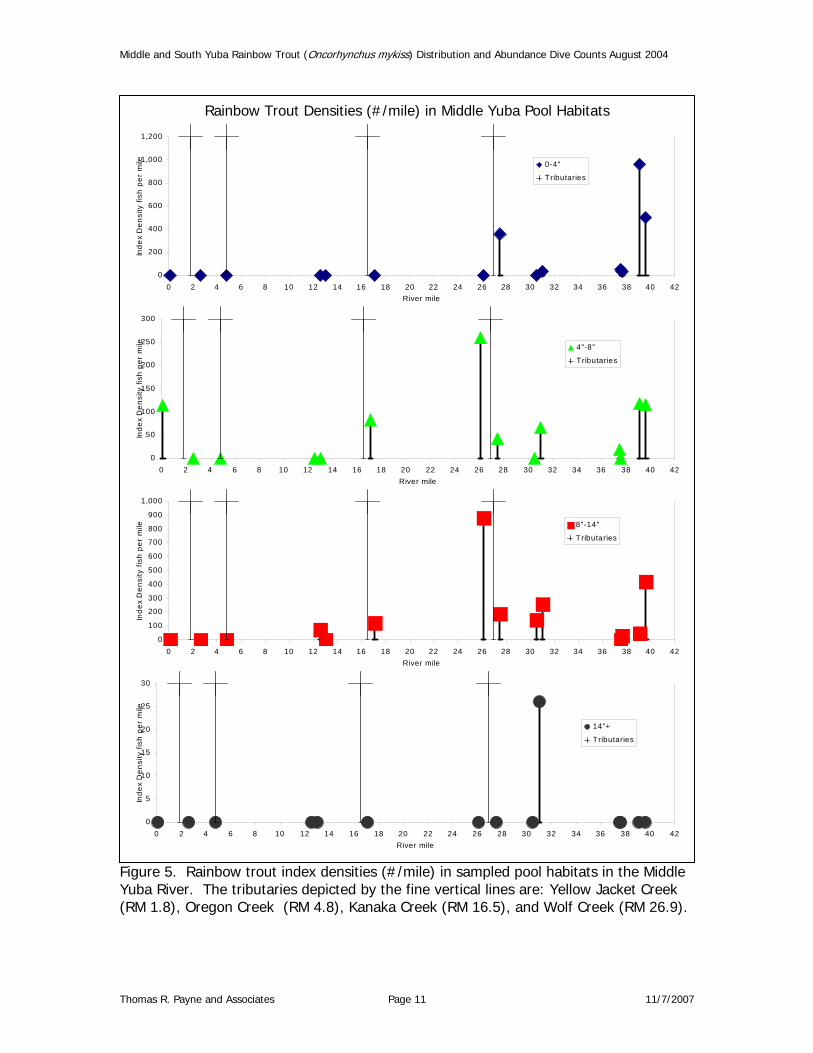
Middle and South Yuba Rainbow Trout (Oncorhynchus mykiss) Distribution and Abundance Dive Counts August 2004
Figure 5. Rainbow trout index densities (#/mile) in sampled pool habitats in the Middle Yuba River. The tributaries depicted by the fine vertical lines are: Yellow Jacket Creek (RM 1.8), Oregon Creek (RM 4.8), Kanaka Creek (RM 16.5), and Wolf Creek (RM 26.9).
Rainbow Trout Densities (#/mile) in Middle Yuba Pool Habitats
0
200
400
600
800
1,000
1,200
0 2 4 6 8 10 12 14 16 18 20 22 24 26 28 30 32 34 36 38 40 42River mile
Inde
x D
ensi
ty fi
sh p
er m
ile 0-4"
Tributaries
0
50
100
150
200
250
300
0 2 4 6 8 10 12 14 16 18 20 22 24 26 28 30 32 34 36 38 40 42River mile
Inde
x D
ensi
ty fi
sh p
er m
ile 4"-8"
Tributaries
0
100
200
300
400
500
600
700
800
900
1,000
0 2 4 6 8 10 12 14 16 18 20 22 24 26 28 30 32 34 36 38 40 42River mile
Inde
x D
ensi
ty fi
sh p
er m
ile 8"-14"
Tributaries
0
5
10
15
20
25
30
0 2 4 6 8 10 12 14 16 18 20 22 24 26 28 30 32 34 36 38 40 42River mile
Inde
x D
ensi
ty fi
sh p
er m
ile
14"+
Tributaries
Thomas R. Payne and Associates Page 11 11/7/2007
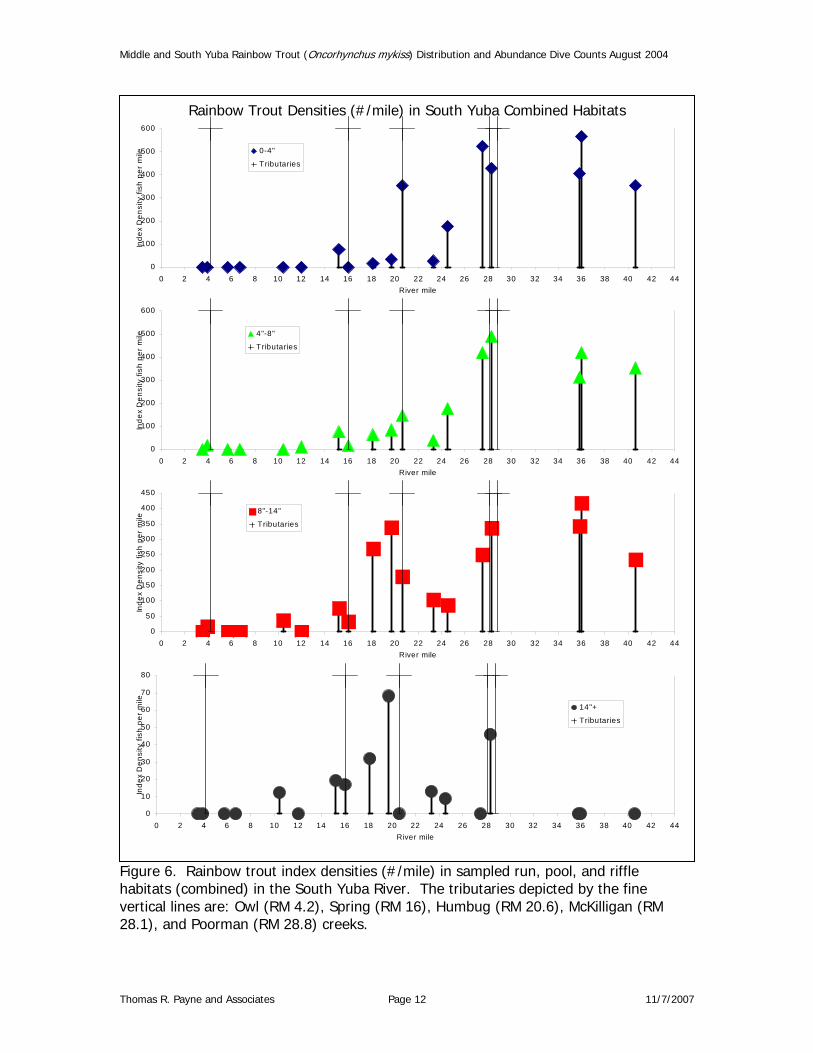
Middle and South Yuba Rainbow Trout (Oncorhynchus mykiss) Distribution and Abundance Dive Counts August 2004
Figure 6. Rainbow trout index densities (#/mile) in sampled run, pool, and riffle habitats (combined) in the South Yuba River. The tributaries depicted by the fine vertical lines are: Owl (RM 4.2), Spring (RM 16), Humbug (RM 20.6), McKilligan (RM 28.1), and Poorman (RM 28.8) creeks.
Rainbow Trout Densities (#/mile) in Middle Yuba Pool Habitats
0
200
400
600
800
1,000
1,200
0 2 4 6 8 10 12 14 16 18 20 22 24 26 28 30 32 34 36 38 40 42River mile
Inde
x D
ensi
ty fi
sh p
er m
ile 0-4"
Tributaries
0
50
100
150
200
250
300
0 2 4 6 8 10 12 14 16 18 20 22 24 26 28 30 32 34 36 38 40 42River mile
Inde
x D
ensi
ty fi
sh p
er m
ile 4"-8"
Tributaries
0
100
200
300
400
500
600
700
800
900
1,000
0 2 4 6 8 10 12 14 16 18 20 22 24 26 28 30 32 34 36 38 40 42River mile
Inde
x D
ensi
ty fi
sh p
er m
ile 8"-14"
Tributaries
0
5
10
15
20
25
30
0 2 4 6 8 10 12 14 16 18 20 22 24 26 28 30 32 34 36 38 40 42River mile
Inde
x D
ensi
ty fi
sh p
er m
ile
14"+
Tributaries
Rainbow Trout Densities (#/mile) in South Yuba Combined Habitats
0
100
200
300
400
500
600
0 2 4 6 8 10 12 14 16 18 20 22 24 26 28 30 32 34 36 38 40 42 44River mile
Inde
x D
ensi
ty fi
sh p
er m
ile 0-4"
Tributaries
0
100
200
300
400
500
600
0 2 4 6 8 10 12 14 16 18 20 22 24 26 28 30 32 34 36 38 40 42 44River mile
Inde
x D
ensi
ty fi
sh p
er m
ile 4"-8"
Tributaries
0
50
100
150
200
250
300
350
400
450
0 2 4 6 8 10 12 14 16 18 20 22 24 26 28 30 32 34 36 38 40 42 44River mile
Inde
x D
ensi
ty fi
sh p
er m
ile
8"-14"
Tributaries
0
10
20
30
40
50
60
70
80
0 2 4 6 8 10 12 14 16 18 20 22 24 26 28 30 32 34 36 38 40 42 44River mile
Inde
x D
ensi
ty fi
sh p
er m
ile
14"+
Tributaries
Thomas R. Payne and Associates Page 12 11/7/2007
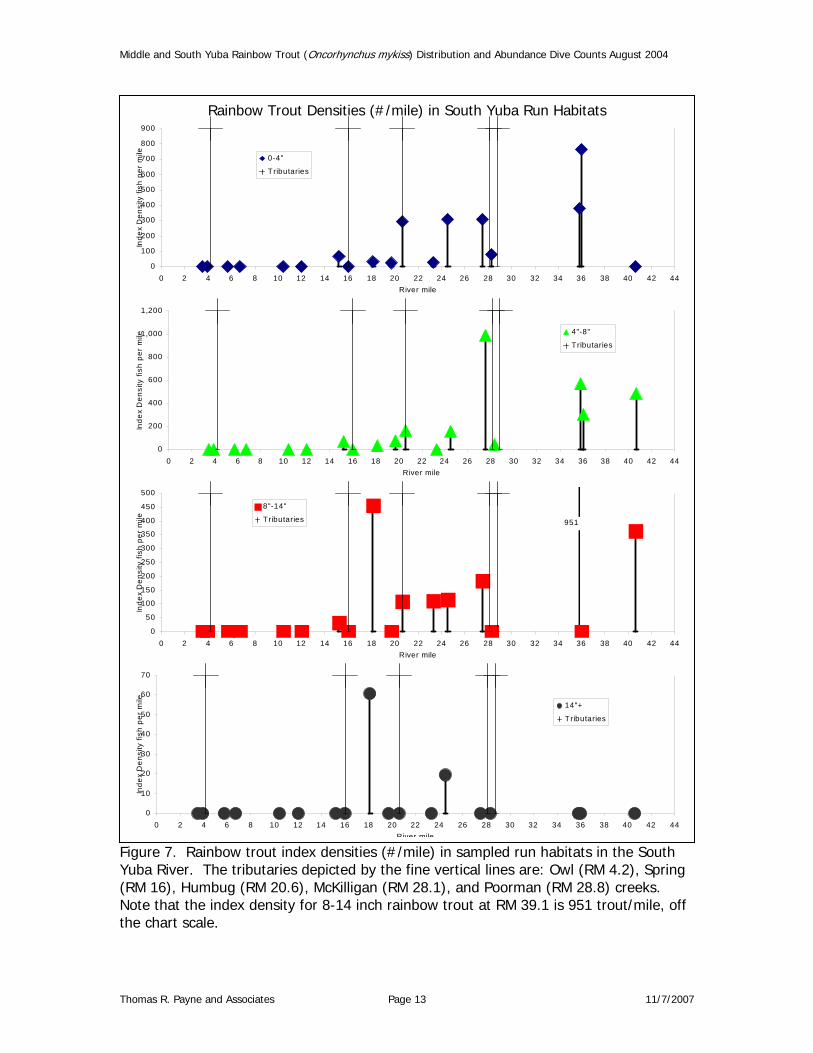
Middle and South Yuba Rainbow Trout (Oncorhynchus mykiss) Distribution and Abundance Dive Counts August 2004
Figure 7. Rainbow trout index densities (#/mile) in sampled run habitats in the South Yuba River. The tributaries depicted by the fine vertical lines are: Owl (RM 4.2), Spring (RM 16), Humbug (RM 20.6), McKilligan (RM 28.1), and Poorman (RM 28.8) creeks. Note that the index density for 8-14 inch rainbow trout at RM 39.1 is 951 trout/mile, off the chart scale.
Rainbow Trout Densities (#/mile) in South Yuba Run Habitats
0
100
200
300
400
500
600
700
800
900
0 2 4 6 8 10 12 14 16 18 20 22 24 26 28 30 32 34 36 38 40 42 44River mile
Inde
x D
ensi
ty fi
sh p
er m
ile 0-4"
Tributaries
0
200
400
600
800
1,000
1,200
0 2 4 6 8 10 12 14 16 18 20 22 24 26 28 30 32 34 36 38 40 42 44River mile
Inde
x D
ensi
ty fi
sh p
er m
ile 4"-8"
Tributaries
0
50
100
150
200
250
300
350
400
450
500
0 2 4 6 8 10 12 14 16 18 20 22 24 26 28 30 32 34 36 38 40 42 44River mile
Inde
x D
ensi
ty fi
sh p
er m
ile
8"-14"
Tributaries 951
0
10
20
30
40
50
60
70
0 2 4 6 8 10 12 14 16 18 20 22 24 26 28 30 32 34 36 38 40 42 44River mile
Inde
x D
ensi
ty fi
sh p
er m
ile 14"+
Tributaries
Thomas R. Payne and Associates Page 13 11/7/2007
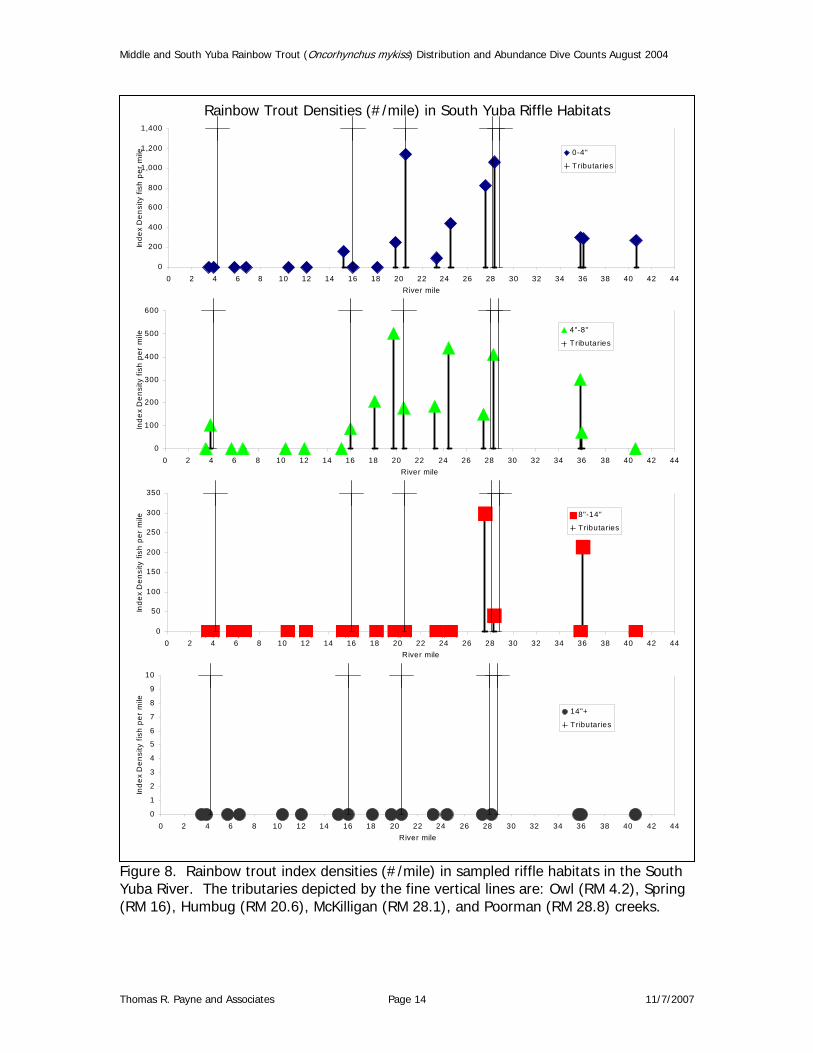
Middle and South Yuba Rainbow Trout (Oncorhynchus mykiss) Distribution and Abundance Dive Counts August 2004
Figure 8. Rainbow trout index densities (#/mile) in sampled riffle habitats in the South Yuba River. The tributaries depicted by the fine vertical lines are: Owl (RM 4.2), Spring (RM 16), Humbug (RM 20.6), McKilligan (RM 28.1), and Poorman (RM 28.8) creeks.
Rainbow Trout Densities (#/mile) in South Yuba Riffle Habitats
0
200
400
600
800
1,000
1,200
1,400
0 2 4 6 8 10 12 14 16 18 20 22 24 26 28 30 32 34 36 38 40 42 44River mile
Inde
x D
ensi
ty fi
sh p
er m
ile 0-4"
Tributaries
0
100
200
300
400
500
600
0 2 4 6 8 10 12 14 16 18 20 22 24 26 28 30 32 34 36 38 40 42 44River mile
Inde
x D
ensi
ty fi
sh p
er m
ile
4"-8"
Tributaries
0
50
100
150
200
250
300
350
0 2 4 6 8 10 12 14 16 18 20 22 24 26 28 30 32 34 36 38 40 42 44River mile
Inde
x D
ensi
ty fi
sh p
er m
ile 8"-14"
Tributaries
0
1
2
3
4
5
6
7
8
9
10
0 2 4 6 8 10 12 14 16 18 20 22 24 26 28 30 32 34 36 38 40 42 44River mile
Inde
x D
ensi
ty fi
sh p
er m
ile
14"+
Tributaries
Thomas R. Payne and Associates Page 14 11/7/2007
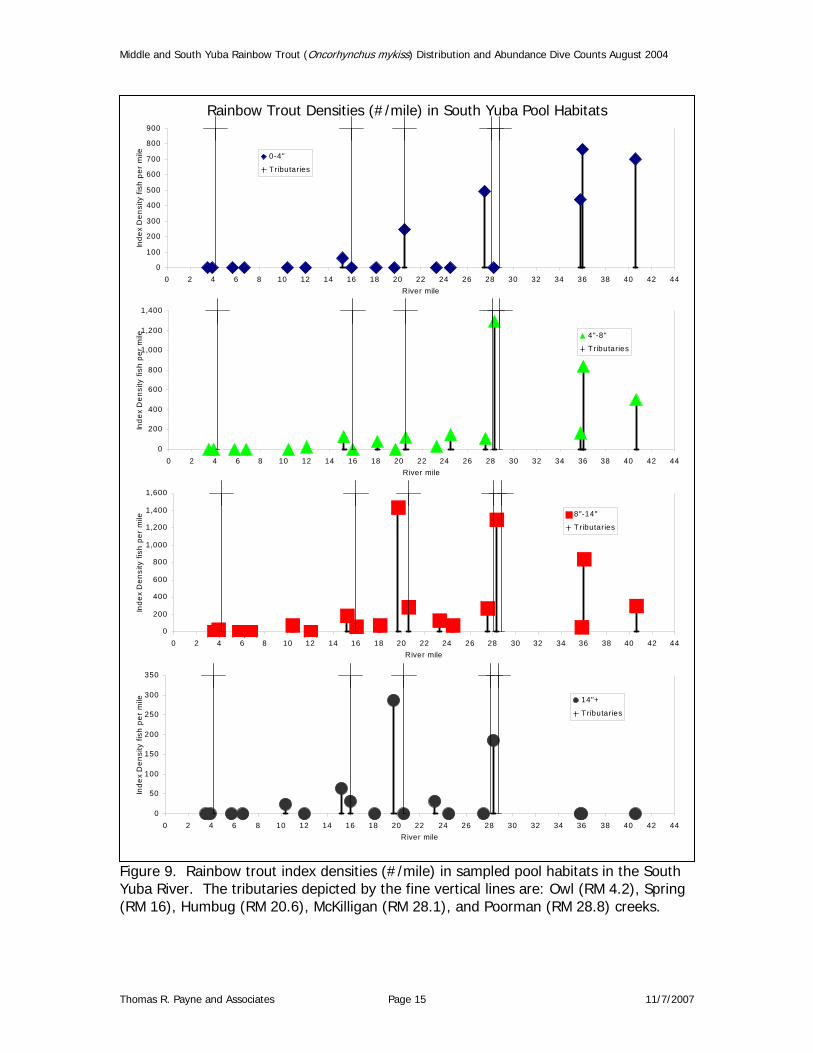
Middle and South Yuba Rainbow Trout (Oncorhynchus mykiss) Distribution and Abundance Dive Counts August 2004
Thomas R. Payne and Associates Page 15 11/7/2007
Figure 9. Rainbow trout index densities (#/mile) in sampled pool habitats in the South Yuba River. The tributaries depicted by the fine vertical lines are: Owl (RM 4.2), Spring (RM 16), Humbug (RM 20.6), McKilligan (RM 28.1), and Poorman (RM 28.8) creeks.
Rainbow Trout Densities (#/mile) in South Yuba Pool Habitats
0
100
200
300
400
500
600
700
800
900
0 2 4 6 8 10 12 14 16 18 20 22 24 26 28 30 32 34 36 38 40 42 44River mile
Inde
x D
ensi
ty fi
sh p
er m
ile 0-4"
Tributaries
0
200
400
600
800
1,000
1,200
1,400
0 2 4 6 8 10 12 14 16 18 20 22 24 26 28 30 32 34 36 38 40 42 44River mile
Inde
x D
ensi
ty fi
sh p
er m
ile 4"-8"
Tributaries
0
200
400
600
800
1,000
1,200
1,400
1,600
0 2 4 6 8 10 12 14 16 18 20 22 24 26 28 30 32 34 36 38 40 42 44River mile
Inde
x D
ensi
ty fi
sh p
er m
ile 8"-14"
Tributaries
0
50
100
150
200
250
300
350
0 2 4 6 8 10 12 14 16 18 20 22 24 26 28 30 32 34 36 38 40 42 44River mile
Inde
x D
ensi
ty fi
sh p
er m
ile 14"+
Tributaries
Middle and South Yuba Rainbow Trout (Oncorhynchus mykiss) Distribution and Abundance Dive Counts August 2004
Thermal Refugia Cold-water zones produced by deep pool stratification, tributaries, or hyporheic flows may provide thermal refugia for trout during warm summer periods (Nielsen et al 1994). In this study, however, only one thermal refugia was observed that appeared to be utilized by trout.
Deep Pools South Yuba Of the 26 pools in the South Yuba River in which water column temperatures were profiled, only two were thermally stratified (i.e., the difference in bottom and surface temperatures greater than one degree F) (Table 1). The pool at RM 27.5 had a surface temperature of 69.00F at 13:00 and a bottom temperature of 66.70F (equal to the morning surface temperature). A steady decline in temperature from the surface to the bottom suggested thermal stratification due to lack of mixing rather than hyporheic flows. No trout were observed in this pool. The 26 foot deep pool at RM 40.5 (Langs Crossing) exhibited the greatest thermal stratification with a bottom temperature of 57.10F and a surface temperature of 62.50F. Rainbow and brown trout were observed in this pool; however, they were utilizing the shallow tailout where stratification was not present. Middle Yuba Of the nine deep pools surveyed for thermal stratification on the Middle Yuba River, one was stratified with a difference in temperature greater then 10 F (Table 1). The 19.5 foot deep pool 0.9 miles upstream of the confluence with the North Yuba had a surface temperature of 73.20F and a bottom temperature of 69.90F. The bottom water temperature was warmer than the morning river temperature of 67.40F. No fish were observed in this pool.
Thomas R. Payne and Associates Page 16 11/7/2007
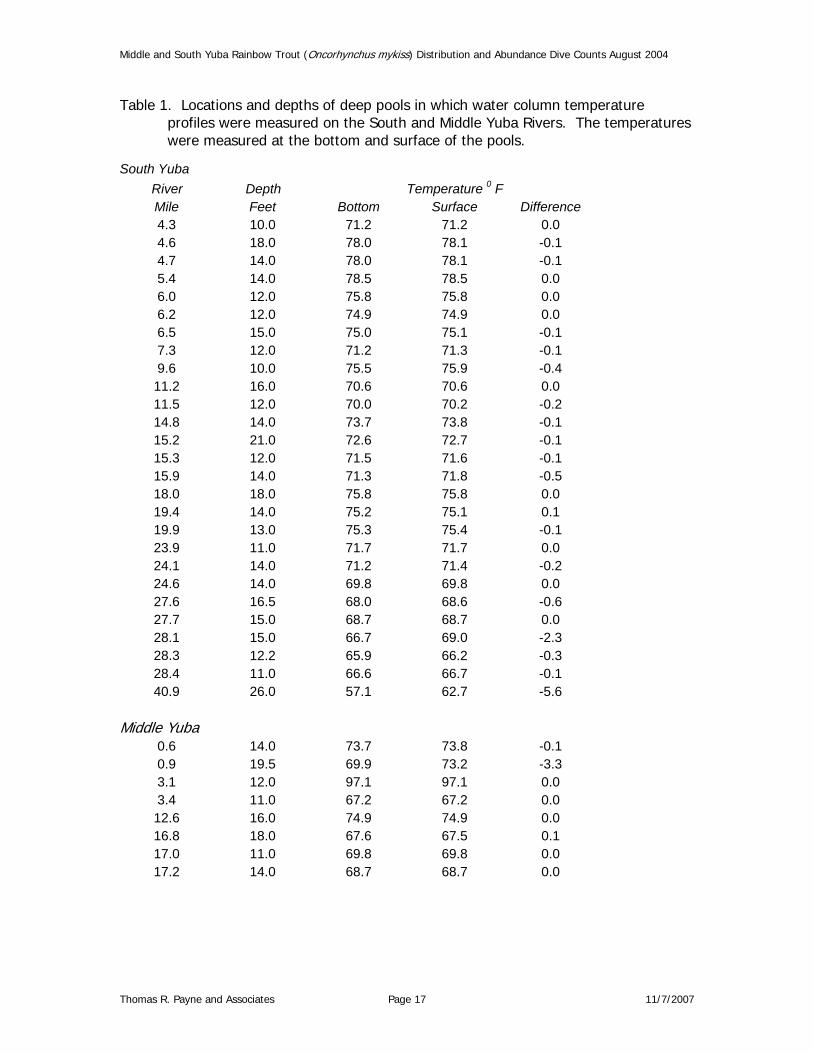
Middle and South Yuba Rainbow Trout (Oncorhynchus mykiss) Distribution and Abundance Dive Counts August 2004
Table 1. Locations and depths of deep pools in which water column temperature profiles were measured on the South and Middle Yuba Rivers. The temperatures were measured at the bottom and surface of the pools.
South Yuba River Depth Temperature 0 F Mile Feet Bottom Surface Difference 4.3 10.0 71.2 71.2 0.0 4.6 18.0 78.0 78.1 -0.1 4.7 14.0 78.0 78.1 -0.1 5.4 14.0 78.5 78.5 0.0 6.0 12.0 75.8 75.8 0.0 6.2 12.0 74.9 74.9 0.0 6.5 15.0 75.0 75.1 -0.1 7.3 12.0 71.2 71.3 -0.1 9.6 10.0 75.5 75.9 -0.4 11.2 16.0 70.6 70.6 0.0 11.5 12.0 70.0 70.2 -0.2 14.8 14.0 73.7 73.8 -0.1 15.2 21.0 72.6 72.7 -0.1 15.3 12.0 71.5 71.6 -0.1 15.9 14.0 71.3 71.8 -0.5 18.0 18.0 75.8 75.8 0.0 19.4 14.0 75.2 75.1 0.1 19.9 13.0 75.3 75.4 -0.1 23.9 11.0 71.7 71.7 0.0 24.1 14.0 71.2 71.4 -0.2 24.6 14.0 69.8 69.8 0.0 27.6 16.5 68.0 68.6 -0.6 27.7 15.0 68.7 68.7 0.0 28.1 15.0 66.7 69.0 -2.3 28.3 12.2 65.9 66.2 -0.3 28.4 11.0 66.6 66.7 -0.1 40.9 26.0 57.1 62.7 -5.6
Middle Yuba
0.6 14.0 73.7 73.8 -0.1 0.9 19.5 69.9 73.2 -3.3 3.1 12.0 97.1 97.1 0.0 3.4 11.0 67.2 67.2 0.0 12.6 16.0 74.9 74.9 0.0 16.8 18.0 67.6 67.5 0.1 17.0 11.0 69.8 69.8 0.0 17.2 14.0 68.7 68.7 0.0
Thomas R. Payne and Associates Page 17 11/7/2007
Middle and South Yuba Rainbow Trout (Oncorhynchus mykiss) Distribution and Abundance Dive Counts August 2004
Tributaries Tributaries to the main stem, having cooler summertime water temperatures, may provide refuge for salmonids from higher than optimum main stem water temperatures (Table 2). Oregon Creek, Kanaka Creek, and Wolf Creek, tributaries to the Middle Yuba, and Poorman Creek, tributary to the South Yuba, all were cooler than the main stem, appeared to provide good habitat, and are were inhabited by juvenile and adult rainbow trout. The North Yuba River, at the confluence with the Middle Yuba, also provides ample cool-water trout habitat. At the time of observation, water temperature in the North Yuba at the confluence with the Middle Yuba was 65.50F, 8.30F less than the Middle Yuba water temperature (73.80F). Middle Yuba
Yellowjacket Creek (confluence with the Middle Yuba at RM 1.8) had an estimated 0.2 cfs flow, steep gradient, and incised channel, and provided very little potential for summer rearing habitat. Creek water temperature was 62.50F, 10.20F less than the Middle Yuba.
Oregon Creek (confluence with Middle Yuba at RM 4.8) had an estimated flow of 2 cfs with a water temperature of 620F, 7.90F less than the main stem. The mouth was passable to small fish. Of the 2,088 feet surveyed, no barriers were encountered. Most of the channel was low gradient with holding areas and some spawning gravel.
Kanaka Creek (confluence with the Middle Yuba at RM 16.5) had an estimated flow of 2 cfs and a water temperature of 65.20F, 2.30F less than the main stem. The mouth of the creek is steep and flows over bedrock with a low water fry barrier cascade only 110 feet upstream of the confluence. Rainbow trout adults and fry inhabited the creek both upstream and downstream of this barrier. The creek channel was actively dredged creating dredge pools and spawnable dredge tailings. Four small cascade barriers (approximate four foot drop each) were present below a final eight-foot high barrier 1,748 feet upstream of the confluence (photographs in Appendix C).
Wolf Creek (confluence with the Middle Yuba at RM 26.9) had an estimated flow of 4 cfs and a water temperature of 59.60F, 6.10F less than the main stem. Rainbow trout fry were observed in the 1,004 feet of stream channel surveyed. The gradual channel slope with cobble and small boulder substrate presented good salmonid rearing habitat. Three road crossings and a dredge were recorded in the area surveyed.
South Yuba
Owl Creek (confluence with the South Yuba at RM 4.7) had an estimated flow of about one cfs. The water temperature in Owl Creek was 65.0 F, 70F less than the main stem. Although there was no discernable temperature decrease in the main stem due to the Owl Creek accretion, a concentration of rainbow trout was observed at the confluence. In the run and riffle at the confluence one fry and six adult trout were counted. Upstream and downstream of this area zero to two trout per habitat unit were observed. Fry and adult trout inhabited Owl Creek
0
Thomas R. Payne and Associates Page 18 11/7/2007
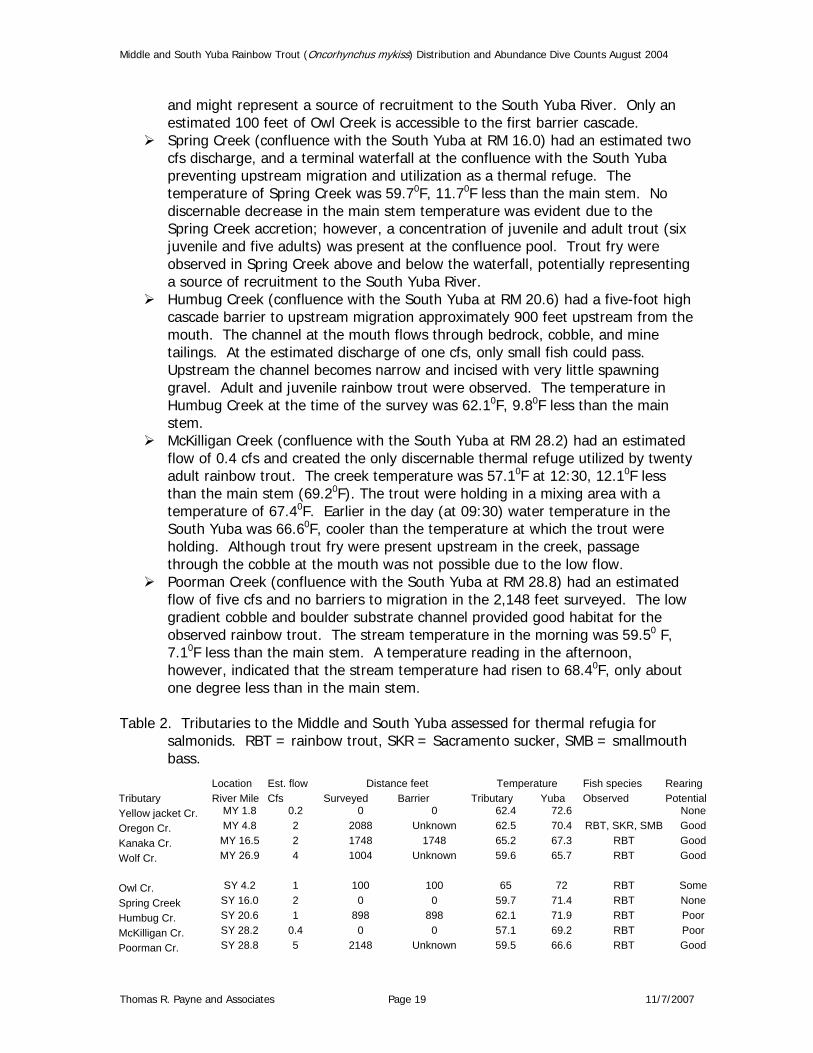
Middle and South Yuba Rainbow Trout (Oncorhynchus mykiss) Distribution and Abundance Dive Counts August 2004
and might represent a source of recruitment to the South Yuba River. Only an estimated 100 feet of Owl Creek is accessible to the first barrier cascade.
Spring Creek (confluence with the South Yuba at RM 16.0) had an estimated two cfs discharge, and a terminal waterfall at the confluence with the South Yuba preventing upstream migration and utilization as a thermal refuge. The temperature of Spring Creek was 59.70F, 11.70F less than the main stem. No discernable decrease in the main stem temperature was evident due to the Spring Creek accretion; however, a concentration of juvenile and adult trout (six juvenile and five adults) was present at the confluence pool. Trout fry were observed in Spring Creek above and below the waterfall, potentially representing a source of recruitment to the South Yuba River.
Humbug Creek (confluence with the South Yuba at RM 20.6) had a five-foot high cascade barrier to upstream migration approximately 900 feet upstream from the mouth. The channel at the mouth flows through bedrock, cobble, and mine tailings. At the estimated discharge of one cfs, only small fish could pass. Upstream the channel becomes narrow and incised with very little spawning gravel. Adult and juvenile rainbow trout were observed. The temperature in Humbug Creek at the time of the survey was 62.10F, 9.80F less than the main stem.
McKilligan Creek (confluence with the South Yuba at RM 28.2) had an estimated flow of 0.4 cfs and created the only discernable thermal refuge utilized by twenty adult rainbow trout. The creek temperature was 57.10F at 12:30, 12.10F less than the main stem (69.20F). The trout were holding in a mixing area with a temperature of 67.40F. Earlier in the day (at 09:30) water temperature in the South Yuba was 66.60F, cooler than the temperature at which the trout were holding. Although trout fry were present upstream in the creek, passage through the cobble at the mouth was not possible due to the low flow.
Poorman Creek (confluence with the South Yuba at RM 28.8) had an estimated flow of five cfs and no barriers to migration in the 2,148 feet surveyed. The low gradient cobble and boulder substrate channel provided good habitat for the observed rainbow trout. The stream temperature in the morning was 59.50 F, 7.10F less than the main stem. A temperature reading in the afternoon, however, indicated that the stream temperature had risen to 68.40F, only about one degree less than in the main stem.
Table 2. Tributaries to the Middle and South Yuba assessed for thermal refugia for
salmonids. RBT = rainbow trout, SKR = Sacramento sucker, SMB = smallmouth bass.
Location Est. flow Distance feet Temperature Fish species Rearing Tributary River Mile Cfs Surveyed Barrier Tributary Yuba Observed Potential Yellow jacket Cr. MY 1.8 0.2 0 0 62.4 72.6 None Oregon Cr. MY 4.8 2 2088 Unknown 62.5 70.4 RBT, SKR, SMB Good
Kanaka Cr. MY 16.5 2 1748 1748 65.2 67.3 RBT Good Wolf Cr. MY 26.9 4 1004 Unknown 59.6 65.7 RBT Good
Owl Cr. SY 4.2 1 100 100 65 72 RBT Some
Spring Creek SY 16.0 2 0 0 59.7 71.4 RBT None Humbug Cr. SY 20.6 1 898 898 62.1 71.9 RBT Poor
McKilligan Cr. SY 28.2 0.4 0 0 57.1 69.2 RBT Poor Poorman Cr. SY 28.8 5 2148 Unknown 59.5 66.6 RBT Good
Thomas R. Payne and Associates Page 19 11/7/2007
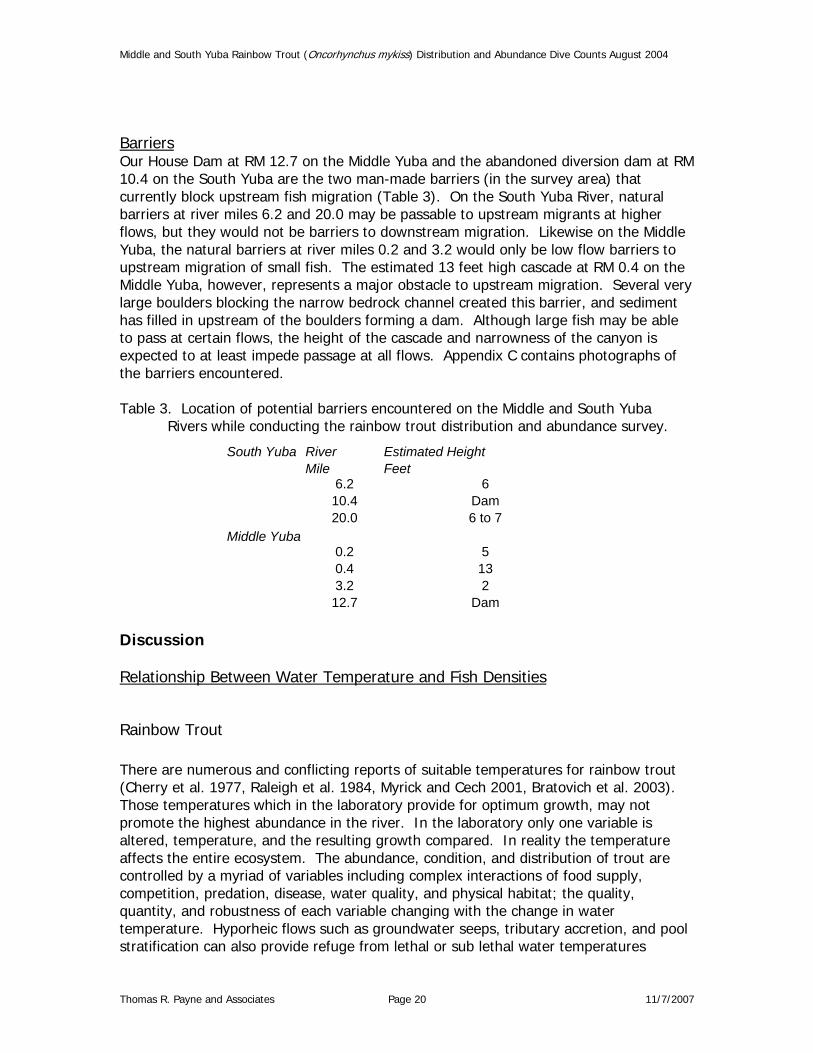
Middle and South Yuba Rainbow Trout (Oncorhynchus mykiss) Distribution and Abundance Dive Counts August 2004
Barriers Our House Dam at RM 12.7 on the Middle Yuba and the abandoned diversion dam at RM 10.4 on the South Yuba are the two man-made barriers (in the survey area) that currently block upstream fish migration (Table 3). On the South Yuba River, natural barriers at river miles 6.2 and 20.0 may be passable to upstream migrants at higher flows, but they would not be barriers to downstream migration. Likewise on the Middle Yuba, the natural barriers at river miles 0.2 and 3.2 would only be low flow barriers to upstream migration of small fish. The estimated 13 feet high cascade at RM 0.4 on the Middle Yuba, however, represents a major obstacle to upstream migration. Several very large boulders blocking the narrow bedrock channel created this barrier, and sediment has filled in upstream of the boulders forming a dam. Although large fish may be able to pass at certain flows, the height of the cascade and narrowness of the canyon is expected to at least impede passage at all flows. Appendix C contains photographs of the barriers encountered. Table 3. Location of potential barriers encountered on the Middle and South Yuba
Rivers while conducting the rainbow trout distribution and abundance survey.
South Yuba River Estimated Height Mile Feet
6.2 6 10.4 Dam 20.0 6 to 7
Middle Yuba 0.2 5 0.4 13 3.2 2 12.7 Dam
Discussion Relationship Between Water Temperature and Fish Densities
Rainbow Trout There are numerous and conflicting reports of suitable temperatures for rainbow trout (Cherry et al. 1977, Raleigh et al. 1984, Myrick and Cech 2001, Bratovich et al. 2003). Those temperatures which in the laboratory provide for optimum growth, may not promote the highest abundance in the river. In the laboratory only one variable is altered, temperature, and the resulting growth compared. In reality the temperature affects the entire ecosystem. The abundance, condition, and distribution of trout are controlled by a myriad of variables including complex interactions of food supply, competition, predation, disease, water quality, and physical habitat; the quality, quantity, and robustness of each variable changing with the change in water temperature. Hyporheic flows such as groundwater seeps, tributary accretion, and pool stratification can also provide refuge from lethal or sub lethal water temperatures
Thomas R. Payne and Associates Page 20 11/7/2007
Middle and South Yuba Rainbow Trout (Oncorhynchus mykiss) Distribution and Abundance Dive Counts August 2004
(Matthews and Berg 1996, Nielsen et al 1994), and tributaries can provide recruitment to the main stem. Access to the stream and resulting human influences, such as angling and gold dredging, can also substantially alter fish densities. A comparison of water temperatures to trout index densities could reveal trends depicting the optimum temperature with various other undulations reflecting one or more of the other physical, chemical, biological, or human factors. Stream temperatures for the summer months (CH2MHILL data) were recorded at eight locations on the Middle Yuba and seven locations on the South Yuba. Calculating regression models of average monthly temperature against river mile allows the estimation of average water temperature at each of the locations sampled in the dive counts (Figure 10). This method of determining the average water temperature for each of the sample locations assumes that the stream temperature varies evenly with river mile. Although a perfect relationship is not expected due to accretion, channel morphology, and changes in the riparian canopy, the regression models for both rivers provided a very good representation of the longitudinal stream temperatures (both R2’s exceeded 0.99). Although site-specific stream temperatures were measured at each sample location during the survey period, those temperatures were significantly affected by time of day and short-term meteorological conditions and thus were less representative of the average temperatures occurring at that location. The site-specific temperatures recorded during the survey are included with the raw data in Appendix A. July average water temperatures were compared to trout densities. Although the survey was conducted in late August and early September when water temperatures were slightly cooler than July, we assumed that July water temperatures were most limiting to the local trout population and that the trout did not substantially redistribute themselves as temperatures decreased in August. Consideration was also given to other methods of temperature analysis including using average daily maximum water temperatures, monthly mode and median temperatures, and including diurnal fluctuations. Although such methods of analysis are utilized in other studies, the vast majority relate the fish population parameters to mean temperatures. Median temperatures were very close to mean temperatures when unreasonably high values were eliminated form the data set. Also, frequency distributions of monthly temperatures were often bimodal and dependant on the bin sizes specified for the frequency distributions (i.e. 0.10, 0.50, 1.00, etc.), thus the use temperature modes could be misleading. Consequently, mean monthly temperatures are the most universally utilized and are used in this discussion (Figure 11); however, the other values are also presented in Appendix D. In order to better illustrate trends in the relationship between average July temperatures and rainbow trout index densities, all index densities from locations which had average July temperatures within 20F categories were grouped together and averaged prior to plotting (Figure 12).
Thomas R. Payne and Associates Page 21 11/7/2007
Middle and South Yuba Rainbow Trout (Oncorhynchus mykiss) Distribution and Abundance Dive Counts August 2004
Thomas R. Payne and Associates Page 22 11/7/2007
Middle Yuba Index densities for adult rainbow trout in the Middle Yuba River were typically low at locations with average July stream temperatures above 71.90F (Figure 11). Index densities at warmer sites averaged 16 fish/mile (range 0-62 fish/mile), whereas densities at cooler sites averaged 204 fish/mile (range 0-353 fish/mile). Juvenile rainbow trout exhibited similar trends. The index densities for rainbow trout fry in the Middle Yuba were low (average of 17 trout/mile and range of 0 to 63 trout per mile) at locations with average July stream temperatures above 65.80F. At locations with July average temperatures of or below 65.80F, the index densities for fry varied between 45 and 1,218 fish per mile. The large variation in trout fry suggest that other environmental factors such as quality and quantity of spawning gravel, tributary recruitment, predation, human influence, or other unidentified factors play an important role in determining fry density. When index densities were grouped into 20F categories (Figure 12), the index density for adult trout increased from lows at higher temperatures to the 710 to 730F category, and then declined at cooler temperatures. Similar trends occurred for juvenile trout, except that the index densities peaked at the 650 to 670F category. Fry index densities, except for the unusual peak in the lowest temperature category, also exhibited a similar temperature relationship. South Yuba In the South Yuba River, the adult trout index density averaged 273 trout per mile at locations with average July water temperatures less than or equal to 75.20F (range 96 to 417 fish/mile) (Figure 11). At locations with higher average July stream temperatures, the average adult index density declined to 27 fish per mile, and no adult trout were observed at locations with average July stream temperatures above 76.30F. Reduced densities of adult rainbow trout occurred in the Humbug Creek to Missouri Bar area with average July temperatures between 73.40F and 74.70F. Both fry and juvenile index densities were consistently highest at average July stream temperatures of 71.90F and cooler. The fry and juvenile index density spike at the location with 72.70F may have been a result of recruitment from Humbug Creek, which flows into the South Yuba at that point. Grouping the density data in temperature ranges of 20F (Figure 12) indicate that index densities of fry, juvenile, and adult rainbow trout reach a plateau in the 710 to 730F category.
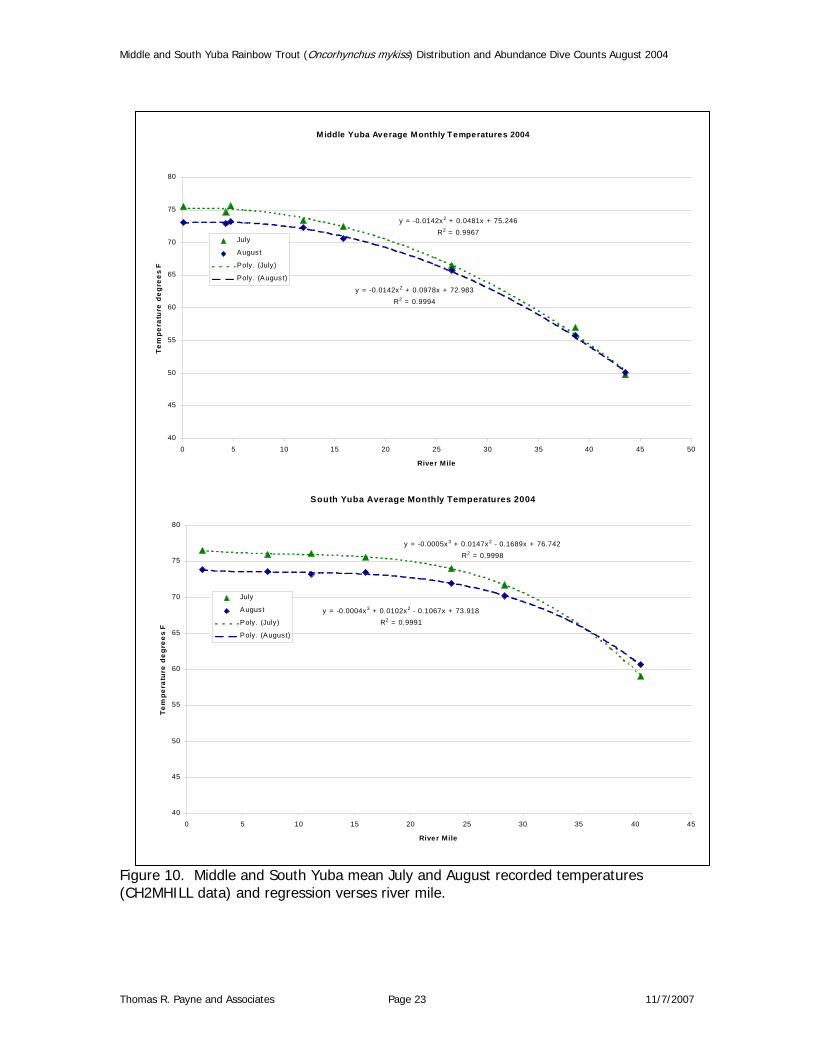
Middle and South Yuba Rainbow Trout (Oncorhynchus mykiss) Distribution and Abundance Dive Counts August 2004
Figure 10. Middle and South Yuba mean July and August recorded temperatures (CH2MHILL data) and regression verses river mile.
Middle Yuba Average Monthly Temperatures 2004
y = -0.0142x2 + 0.0481x + 75.246R2 = 0.9967
y = -0.0142x2 + 0.0978x + 72.983R2 = 0.9994
40
45
50
55
60
65
70
75
80
0 5 10 15 20 25 30 35 40 45 50
River Mile
Tem
pera
ture
deg
rees
F
July
August
Poly. (July)
Poly. (August)
South Yuba Average Monthly Temperatures 2004
y = -0.0005x3 + 0.0147x2 - 0.1689x + 76.742R2 = 0.9998
y = -0.0004x3 + 0.0102x2 - 0.1067x + 73.918R2 = 0.9991
40
45
50
55
60
65
70
75
80
0 5 10 15 20 25 30 35 40 45
River Mile
Tem
pera
ture
deg
rees
F
July
August
Poly. (July)
Poly. (August)
Thomas R. Payne and Associates Page 23 11/7/2007
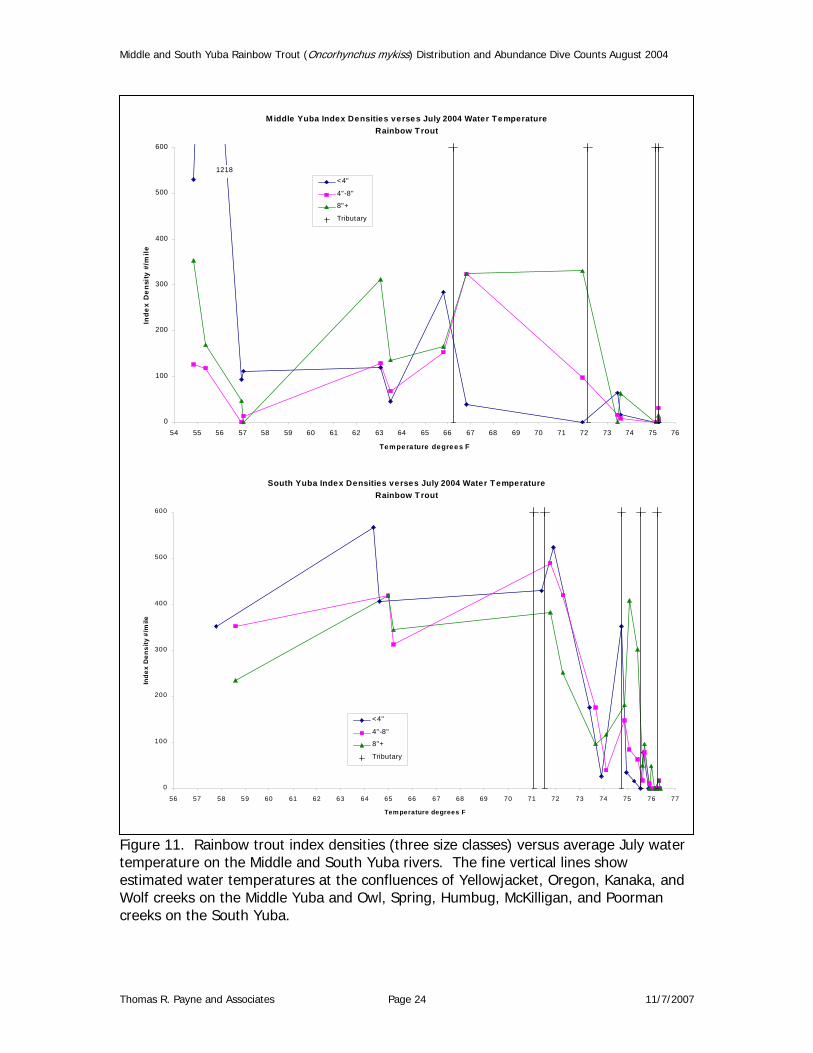
Middle and South Yuba Rainbow Trout (Oncorhynchus mykiss) Distribution and Abundance Dive Counts August 2004
Figure 11. Rainbow trout index densities (three size classes) versus average July water temperature on the Middle and South Yuba rivers. The fine vertical lines show estimated water temperatures at the confluences of Yellowjacket, Oregon, Kanaka, and Wolf creeks on the Middle Yuba and Owl, Spring, Humbug, McKilligan, and Poorman creeks on the South Yuba.
Middle Yuba Index Densities verses July 2004 Water TemperatureRainbow T rout
0
100
200
300
400
500
600
54 55 56 57 58 59 60 61 62 63 64 65 66 67 68 69 70 71 72 73 74 75 76
Tempera ture degrees F
Inde
x D
ensi
ty #
/mile
<4"
4"-8"
8"+
Tributary
1218
South Yuba Index Densities verses July 2004 Water T emperatureRainbow T rout
0
100
200
300
400
500
600
56 57 58 59 60 61 62 63 64 65 66 67 68 69 70 71 72 73 74 75 76 77
Temperature degrees F
Inde
x D
ensi
ty #
/mile
<4"
4"-8"
8"+
Tributary
Thomas R. Payne and Associates Page 24 11/7/2007
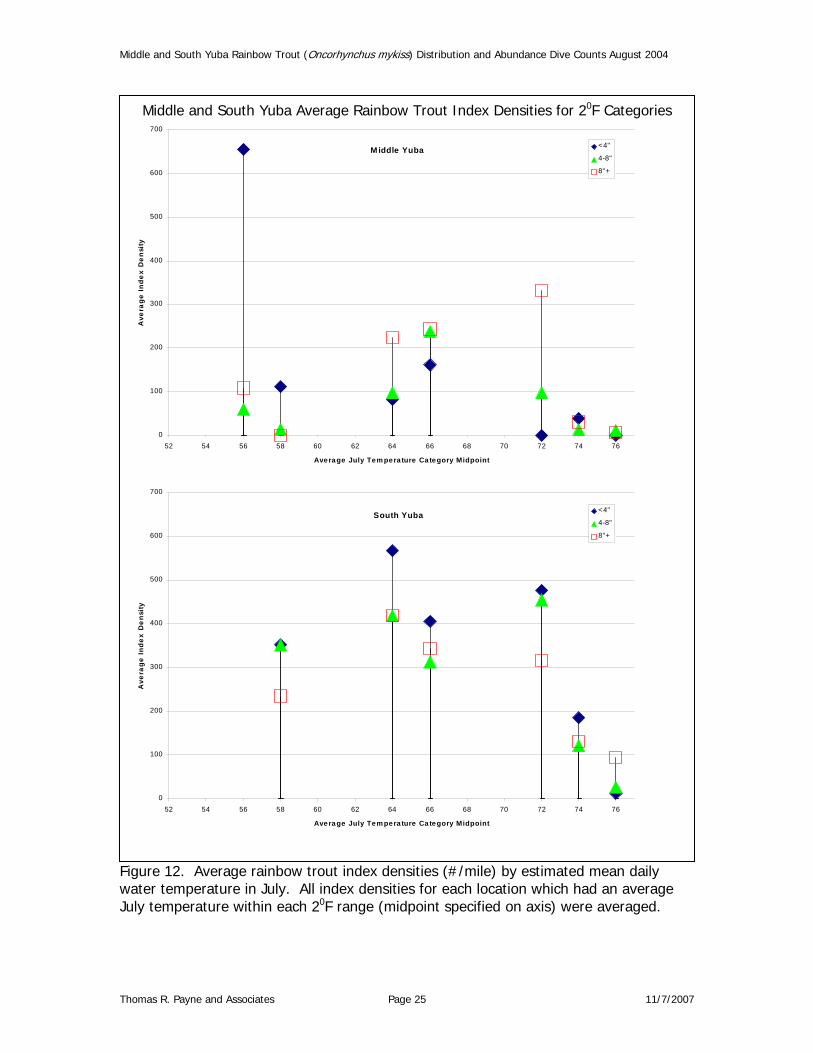
Middle and South Yuba Rainbow Trout (Oncorhynchus mykiss) Distribution and Abundance Dive Counts August 2004
Figure 12. Average rainbow trout index densities (#/mile) by estimated mean daily water temperature in July. All index densities for each location which had an average July temperature within each 20F range (midpoint specified on axis) were averaged.
Middle and South Yuba Average Rainbow Trout Index Densities for 20F Categories
Middle Yuba
0
100
200
300
400
500
600
700
52 54 56 58 60 62 64 66 68 70 72 74 76
Average July Tem pera ture Category Midpoint
Ave
rage
Inde
x D
ensi
ty<4"
4-8"
8"+
South Yuba
0
100
200
300
400
500
600
700
52 54 56 58 60 62 64 66 68 70 72 74 76
Average July Tem pera ture Category Midpoint
Ave
rage
Inde
x D
ensi
ty
<4"
4-8"
8"+
Thomas R. Payne and Associates Page 25 11/7/2007
Middle and South Yuba Rainbow Trout (Oncorhynchus mykiss) Distribution and Abundance Dive Counts August 2004
Non-Salmonid Species Index densities of non-salmonids were variable and, except for Sacramento suckers, confined to the warmer, lower reaches of both rivers. Sacramento suckers were not observed in locations with average July temperatures less than 63.10F. Smallmouth bass occurred where average July stream temperatures exceeded 73.60F. Pikeminnow and hardhead were observed in locations with average July temperatures greater than 71.70F.
Comparison of Rainbow Trout Densities in the Yuba River with Other Northern California Rivers Index densities of rainbow trout in the South and Middle Yuba rivers were compared to two other northern California rivers in which TRPA has conducted dive counts. For the Middle and South Yuba rivers, the average index densities were calculated from the locations where warm temperatures did not appear to limit trout densities. For the Middle Yuba adult and juvenile rainbow trout, the range used was from RM 17.1 to RM 40, whereas the fry range was from RM 27.5 to RM 40. The South Yuba adult and juvenile index estimate was calculated from dive count data between RM 18.1 and RM 40, whereas the fry index density range was calculated from locations upstream of RM 27.5. The two rivers to which the Middle and South Yuba rivers are compared are the Upper Sacramento River (TRPA 2001a) and North Fork Feather River (NFFR) (TRPA 2002). The Upper Sacramento River flows approximately 42 miles from Lake Siskiyou to Shasta Lake. The 40 to 50 cfs summer dam release increases to approximately 200 cfs in the lower reach. Stream widths increase from an average of 50 ft in the upper reach to 70 ft in the lower reach. 2001 index densities were available for both the upper and lower reaches (TRPA 2001a). The North Fork Feather River flows between Lake Almanor and Lake Oroville through several hydroelectric diversions. The Seneca Reach extends 17.5 miles from the Canyon Dam (summertime release of 35 cfs) on Lake Almanor to the Belden Fore-bay. The Belden reach extends 15 miles from the Belden Fore-bay (60 to 140 cfs summertime release) to the Belden powerhouse, just upstream of the Rock Creek Fore-bay. Both the NFFR and the Upper Sacramento River had substantially higher flows than the Middle and South Yuba (Tables 4 and 5). The estimated discharges at the locations used for index density calculations ranged from 15 to 30 cfs in the South Yuba and 8 to 20 cfs in the Middle Yuba. The Seneca Reach of the NFFR had the most comparable discharge, but still approximately twice the South Yuba and four times the Middle Yuba. An area density (#/ft2) comparison might be better than a longitudinal (#/mile) for these different sized rivers; however, widths were collected only on run habitats at the dive count locations on the Middle and South Yuba rivers. Comparing the Belden and Seneca discharges and index densities demonstrates that even area densities would not have produced comparable densities.
Thomas R. Payne and Associates Page 26 11/7/2007
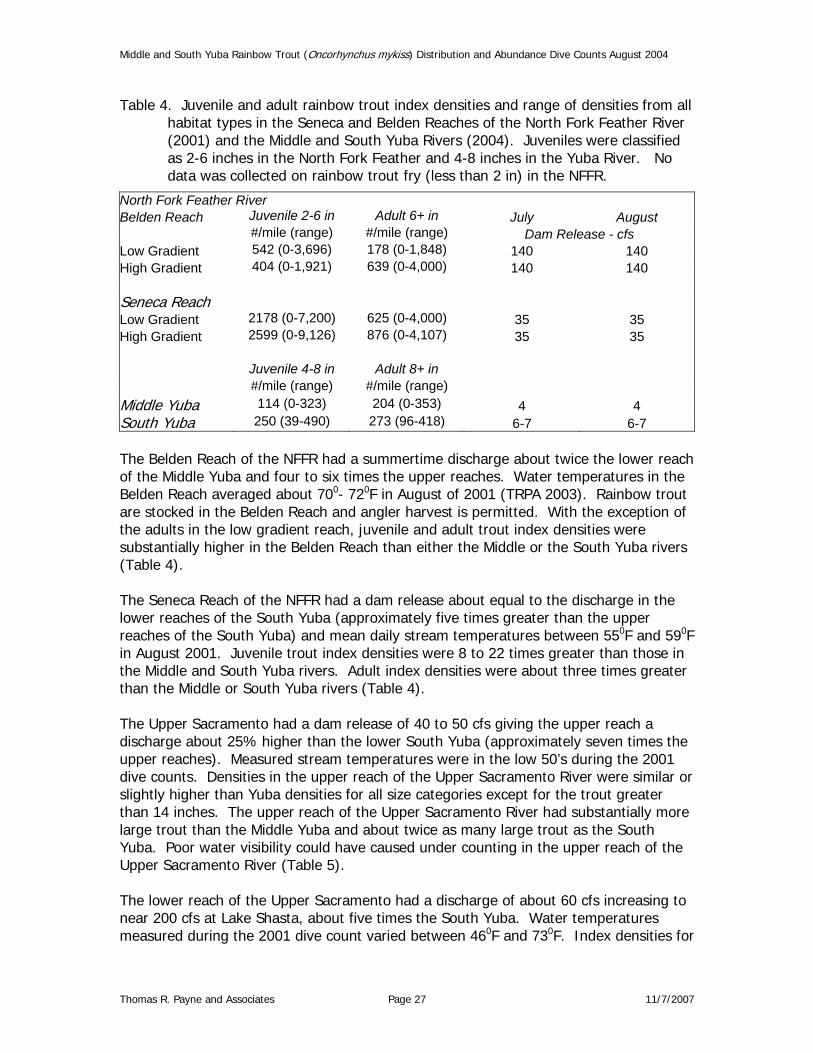
Middle and South Yuba Rainbow Trout (Oncorhynchus mykiss) Distribution and Abundance Dive Counts August 2004
Table 4. Juvenile and adult rainbow trout index densities and range of densities from all habitat types in the Seneca and Belden Reaches of the North Fork Feather River (2001) and the Middle and South Yuba Rivers (2004). Juveniles were classified as 2-6 inches in the North Fork Feather and 4-8 inches in the Yuba River. No data was collected on rainbow trout fry (less than 2 in) in the NFFR.
North Fork Feather River Belden Reach Juvenile 2-6 in Adult 6+ in July August #/mile (range) #/mile (range) Dam Release - cfs Low Gradient 542 (0-3,696) 178 (0-1,848) 140 140 High Gradient 404 (0-1,921) 639 (0-4,000) 140 140 Seneca Reach Low Gradient 2178 (0-7,200) 625 (0-4,000) 35 35 High Gradient 2599 (0-9,126) 876 (0-4,107) 35 35 Juvenile 4-8 in Adult 8+ in #/mile (range) #/mile (range) Middle Yuba 114 (0-323) 204 (0-353) 4 4 South Yuba 250 (39-490) 273 (96-418) 6-7 6-7 The Belden Reach of the NFFR had a summertime discharge about twice the lower reach of the Middle Yuba and four to six times the upper reaches. Water temperatures in the Belden Reach averaged about 700- 720F in August of 2001 (TRPA 2003). Rainbow trout are stocked in the Belden Reach and angler harvest is permitted. With the exception of the adults in the low gradient reach, juvenile and adult trout index densities were substantially higher in the Belden Reach than either the Middle or the South Yuba rivers (Table 4). The Seneca Reach of the NFFR had a dam release about equal to the discharge in the lower reaches of the South Yuba (approximately five times greater than the upper reaches of the South Yuba) and mean daily stream temperatures between 550F and 590F in August 2001. Juvenile trout index densities were 8 to 22 times greater than those in the Middle and South Yuba rivers. Adult index densities were about three times greater than the Middle or South Yuba rivers (Table 4). The Upper Sacramento had a dam release of 40 to 50 cfs giving the upper reach a discharge about 25% higher than the lower South Yuba (approximately seven times the upper reaches). Measured stream temperatures were in the low 50’s during the 2001 dive counts. Densities in the upper reach of the Upper Sacramento River were similar or slightly higher than Yuba densities for all size categories except for the trout greater than 14 inches. The upper reach of the Upper Sacramento River had substantially more large trout than the Middle Yuba and about twice as many large trout as the South Yuba. Poor water visibility could have caused under counting in the upper reach of the Upper Sacramento River (Table 5). The lower reach of the Upper Sacramento had a discharge of about 60 cfs increasing to near 200 cfs at Lake Shasta, about five times the South Yuba. Water temperatures measured during the 2001 dive count varied between 460F and 730F. Index densities for
Thomas R. Payne and Associates Page 27 11/7/2007
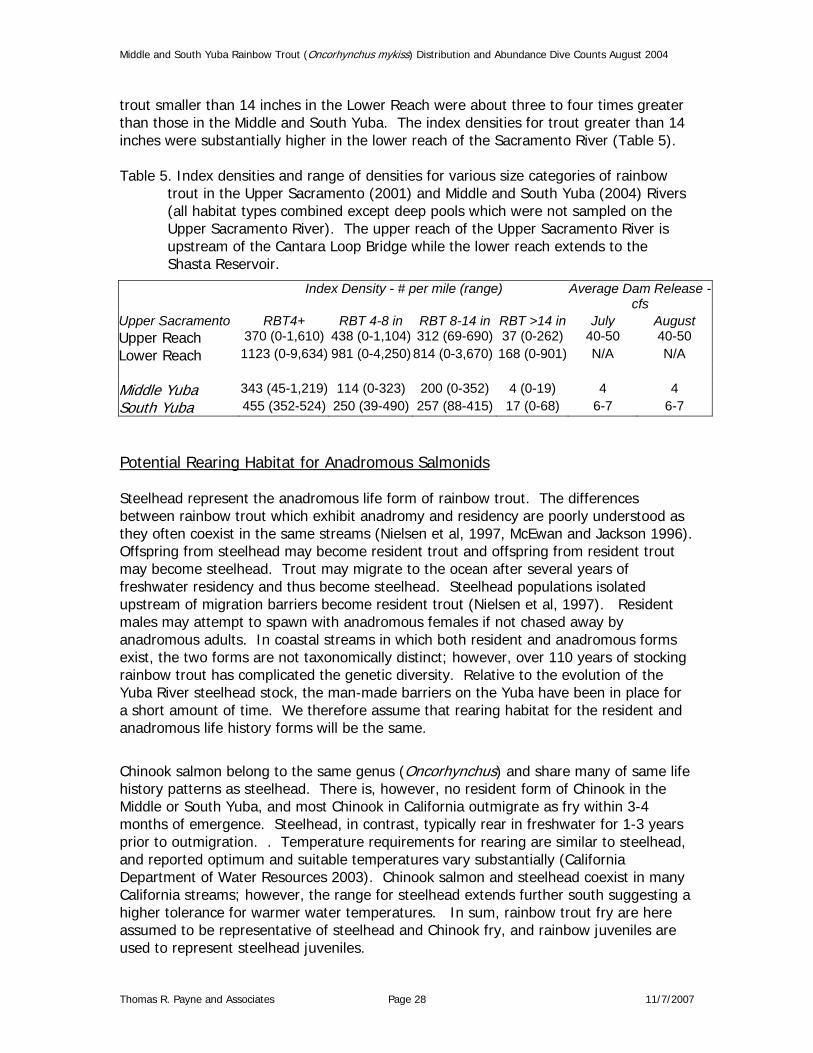
Middle and South Yuba Rainbow Trout (Oncorhynchus mykiss) Distribution and Abundance Dive Counts August 2004
trout smaller than 14 inches in the Lower Reach were about three to four times greater than those in the Middle and South Yuba. The index densities for trout greater than 14 inches were substantially higher in the lower reach of the Sacramento River (Table 5). Table 5. Index densities and range of densities for various size categories of rainbow
trout in the Upper Sacramento (2001) and Middle and South Yuba (2004) Rivers (all habitat types combined except deep pools which were not sampled on the Upper Sacramento River). The upper reach of the Upper Sacramento River is upstream of the Cantara Loop Bridge while the lower reach extends to the Shasta Reservoir.
Index Density - # per mile (range) Average Dam Release -
cfs Upper Sacramento RBT4+ RBT 4-8 in RBT 8-14 in RBT >14 in July August Upper Reach 370 (0-1,610) 438 (0-1,104) 312 (69-690) 37 (0-262) 40-50 40-50 Lower Reach 1123 (0-9,634) 981 (0-4,250) 814 (0-3,670) 168 (0-901) N/A N/A Middle Yuba 343 (45-1,219) 114 (0-323) 200 (0-352) 4 (0-19) 4 4 South Yuba 455 (352-524) 250 (39-490) 257 (88-415) 17 (0-68) 6-7 6-7 Potential Rearing Habitat for Anadromous Salmonids Steelhead represent the anadromous life form of rainbow trout. The differences between rainbow trout which exhibit anadromy and residency are poorly understood as they often coexist in the same streams (Nielsen et al, 1997, McEwan and Jackson 1996). Offspring from steelhead may become resident trout and offspring from resident trout may become steelhead. Trout may migrate to the ocean after several years of freshwater residency and thus become steelhead. Steelhead populations isolated upstream of migration barriers become resident trout (Nielsen et al, 1997). Resident males may attempt to spawn with anadromous females if not chased away by anadromous adults. In coastal streams in which both resident and anadromous forms exist, the two forms are not taxonomically distinct; however, over 110 years of stocking rainbow trout has complicated the genetic diversity. Relative to the evolution of the Yuba River steelhead stock, the man-made barriers on the Yuba have been in place for a short amount of time. We therefore assume that rearing habitat for the resident and anadromous life history forms will be the same.
Chinook salmon belong to the same genus (Oncorhynchus) and share many of same life history patterns as steelhead. There is, however, no resident form of Chinook in the Middle or South Yuba, and most Chinook in California outmigrate as fry within 3-4 months of emergence. Steelhead, in contrast, typically rear in freshwater for 1-3 years prior to outmigration. . Temperature requirements for rearing are similar to steelhead, and reported optimum and suitable temperatures vary substantially (California Department of Water Resources 2003). Chinook salmon and steelhead coexist in many California streams; however, the range for steelhead extends further south suggesting a higher tolerance for warmer water temperatures. In sum, rainbow trout fry are here assumed to be representative of steelhead and Chinook fry, and rainbow juveniles are used to represent steelhead juveniles.
Thomas R. Payne and Associates Page 28 11/7/2007
Middle and South Yuba Rainbow Trout (Oncorhynchus mykiss) Distribution and Abundance Dive Counts August 2004
Assuming that rainbow trout is an acceptable surrogate for anadromous salmonids, the 2004 data suggest that summertime habitat in both the Middle and South Yuba main stems is expected to be primarily limited to reaches upstream of RM 17. In the Middle Yuba, juvenile and adult rainbows were observed in the entire study area; however, densities downstream of RM 17 were low and variable. Likewise, in the South Yuba juveniles were observed at RM 3.9, but densities were low and variable downstream of RM 18.1. Although fry were observed at downstream locations, fry densities did not reach consistent densities until RM 27.5. The river miles and elevations are similar in both rivers at the juvenile and fry rearing habitat boundaries; however, the average 2004 July water temperature in the Middle Yuba was lower by 40 to 60F at those locations. This may be partially related to flow as the South Yuba estimated flow was approximately twice that of the Middle Yuba at those locations. Trout require more food and highly oxygenated water at higher water temperatures (Moyle 2002, Smith and Li 1983) and the higher flows in the South Yuba could allow trout to tolerate higher temperatures.
Our House Dam on the Middle Yuba River (RM 12.7) and the abandoned diversion dam on the South Yuba River (RM 9.7) may block upstream migration to almost all good summertime habitat. The barrier cascade at RM 0.4 on the Middle Yuba is expected to impede upstream migration of adult salmonids to virtually the entire river during most if not all of the year. Oregon Creek (RM 4.8) and Kanaka Creek (RN 16.5) offer additional summertime fry and juvenile habitat downstream of RM 17 in the Middle Yuba drainage. Wolf Creek (RM 26.9), tributary to the Middle Yuba River, and Humbug Creek (RM 20), tributary to the South Yuba River, provide additional summertime fry and juvenile habitat, but converge with the main stem upstream of the identified downstream juvenile habitat boundary. Owl Creek and Spring Creek, tributaries to the South Yuba River, may provide very limited summertime refuge in the lower reach (below RM 18). Poorman Creek (RM 28.8) provides additional habitat, but converges with the South Yuba upstream of the fry and juvenile downstream habitat boundaries.
Because of the limited sample size (units counted) and magnitude of variation in counts, the distribution boundaries at RM 17-18 and 27.5 is not exact and could be several miles downstream. Annual differences in water year type (e.g. consequent discharge) and summertime meteorological conditions may cause the boundaries to vary significantly. For example, Gard (2004) observed no rainbow trout in the South Yuba downstream of Jones Bar (RM 7.0) in 1991 and 1992 surveys, but 16 trout downstream of Starvation Bar (RM 4.2) in 1993. The average July flow at Jones Bar was 107 cfs in 1993, whereas 43 and 68 cfs in 1992 and 1991 respectively, suggesting some flow dependence (USGS 2005c). However, the 2004 average July flow of 51 cfs was similar to the 1991 and 1992 average July flows yet the rainbow trout distribution was similar to 1993 (USGS 2005c). No one variable can explain all the differences in trout population density; however, knowing the population structure of a watershed is necessary to validate any model simulation of the multitude of interacting variables controlling the populations.
Thomas R. Payne and Associates Page 29 11/7/2007
Middle and South Yuba Rainbow Trout (Oncorhynchus mykiss) Distribution and Abundance Dive Counts August 2004
References Bratovich, P., Pitts, A., Niggemyer, A., and Olson, D. 2003. Interim report, SP-F10, Task
3B, Steelhead Rearing Temperatures. Oroville Facilities Relicensing, FERC Project No. 2100. Prepared for California State Department of Water Resources under the direction of Terry J. Mills.
California Data Exchange Center. 2005. Preliminary hourly discharge data queried from:
http://cdec.water.ca.gov/cgi-progs/. California Department of Water Resources. 2003. Chinook Salmon Life History Matrix.
Oroville FERC Relicensing (FERC No. 2100). http://orovillerelicensing.water.ca.gov/text_site/wg_aqua_terrest_29jan03_att7.htm
Cherry, D.S., K.L. Dickson, J. Cairns, Jr., and J.R. Stauffer. 1977. Preferred, avoided,
and lethal temperatures of fish during rising temperature conditions. Journal of the Fisheries Research Board of Canada 34:239-246.
Gard, M. 2004. Potential for Restoration of a California Stream Native Fish Assemblage.
California Fish and Game 90(1):29-35 2004. McEwan, D., and T.A. Jackson. 1996. Steelhead restoration and management plan for
California. California Department of Fish and Game. February 1996 report. 244p. Matthews, K.R., and N.H. Berg. 1997. Rainbow trout responses to water temperature
and dissolved oxygen stress in two southern California stream pools. Journal of Fish Biology 50:50-67.
Moyle, P.B. 2002. Inland Fishes of California. University of California Press. Berkeley,
CA. 502p. Myrick, C.A. and J. J. Cech, Jr. 2001. Temperature Effects on Chinook Salmon and
Steelhead: a Review Focusing on California’s Central Valley Populations. Bay-Delta Modeling Forum Technical Publication 01-1. 56pp.
Nielsen, J.L., T.E. Lisle, and V. Ozaki. 1994. Thermally stratified pools and their use by
steelhead in northern California streams. Transactions of the American Fisheries Society 123:613-626.
Nielsen, J.L., C. Carpanzano, M.C. Fountain, and C.A. Gan. 1997. Mitochondrial DNA
and nuclear microsatellite diversity in hatchery and wild Oncorhynchus mykiss from freshwater habitats in southern California. Transactions of the American Fisheries Society 126:397-417.
Raleigh, R.F., T. Hickman, R.C. Solomon, and P.C. Nelson. 1984. Habitat suitability
information: Rainbow trout. United States Fish and Wildlife Service FWS/OBS-82/10.60. 64pp.
Thomas R. Payne and Associates Page 30 11/7/2007
Middle and South Yuba Rainbow Trout (Oncorhynchus mykiss) Distribution and Abundance Dive Counts August 2004
Smith, J.J., and H.W. Li. 1983. Energetic factors influencing foraging tactics of juvenile steelhead trout, Salmo gairdneri. Pages 173-180 in D.L.G. Noakes, editor. Predators and prey in fishes. Dr. W. Junk Publishers, The Hague Netherlands. 228pp.
Thomas R. Payne & Associates. 1998. Recovery of fish populations in the upper
Sacramento River following the Cantara spill of July 1991. 1997 Annual Report by Thomas R. Payne & Associates to the California Department of Fish & Game, Redding, California, 6/30/98. 88pp + appendices.
Thomas R. Payne & Associates. 2000. Determining appropriate HSC for use in the
South Fork American River Basin. Testing the transferability of generic and California-specific HSC. Report submitted to El Dorado Irrigation District, Placerville, California. 100pp.
Thomas R. Payne & Associates. 2001. Development of habitat suitability criteria for the
Poe Project (FERC No. 2107), North Fork Feather River, California. Report prepared for Pacific Gas and Electric Company, San Ramon, California. 103pp.
Thomas R. Payne & Associates. 2001a. Recovery of fish populations in the Upper
Sacramento River. A Summary of the 2001 Dive Counts. Summary Report to the California Department of Fish & Game, Redding, California, 9/21/01. 25pp.
Thomas R. Payne & Associates. 2002. Habitat suitability criteria for rainbow trout and
Sacramento suckers in the Upper North Fork Feather River Project (FERC No. 2105). Report prepared for Pacific Gas and Electric Company, San Ramon, California. 86pp.
Thomas R. Payne & Associates. 2003. Revised Water Temperature Modeling for the
Rock Creek-Cresta, Hydroelectric Project, FERC Project No. 1962, prepared for Pacific Gas and Electric Company.
USGS Data Query. 2005a. Station 11414250 South Yuba River at Langs Crossing.
http://nwis.waterdata.usgs.gov/nwis/monthly?site_no=11414250&agency_cd=USGS&format=html_table&date_format=YYYY-MM-DD&rdb_compression=file&submitted_form=brief_list
USGS Data Query. 2005b. Station 11408550 Middle Yuba River below Milton Dam
http://nwis.waterdata.usgs.gov/ca/nwis/monthly?site_no=11408550&agency_cd=USGS&format=html
USGS Data Query. 2005c. Station 11417500 South Yuba River at Jones Bar
http://nwis.waterdata.usgs.gov/ca/nwis/monthly?site_no=11417500&agency_cd=USGS&format=html
USGS Data Query. 2005d. Station 11408880 Middle Yuba River below Our House Dam
http://nwis.waterdata.usgs.gov/ca/nwis/monthly?site_no=11408880&agency_cd=USGS&format=html
Thomas R. Payne and Associates Page 31 11/7/2007

Middle and South Yuba Rainbow Trout (Oncorhynchus mykiss) Distribution and Abundance Dive Counts August 2004
Thomas R. Payne and Associates Page 32 11/7/2007
UYRSP 2003. Personal communication with CH2MHILL staff regarding the Upper Yuba
River Studies Program Interim Report.

Middle and South Yuba Rainbow Trout (Oncorhynchus mykiss) Distribution and Abundance Dive Counts August 2004
Appendix A. Raw data collected during the Middle and South Yuba 2004 dive counts. Separate File.
Thomas R. Payne and Associates Page A-1 11/7/2007

Middle and South Yuba Rainbow Trout (Oncorhynchus mykiss) Distribution and Abundance Dive Counts August 2004
Appendix B. Index densities of fish observed during the Middle and South Yuba 2004 dive counts. Separate File.
Thomas R. Payne and Associates Page B-1 11/7/2007

Middle and South Yuba Rainbow Trout (Oncorhynchus mykiss) Distribution and Abundance Dive Counts August 2004
Appendix C. Photographs of the main stem and tributary barriers to fish passage encountered during the Middle and South Yuba 2004 dive count. Separate File.
Thomas R. Payne and Associates Page C-1 11/7/2007
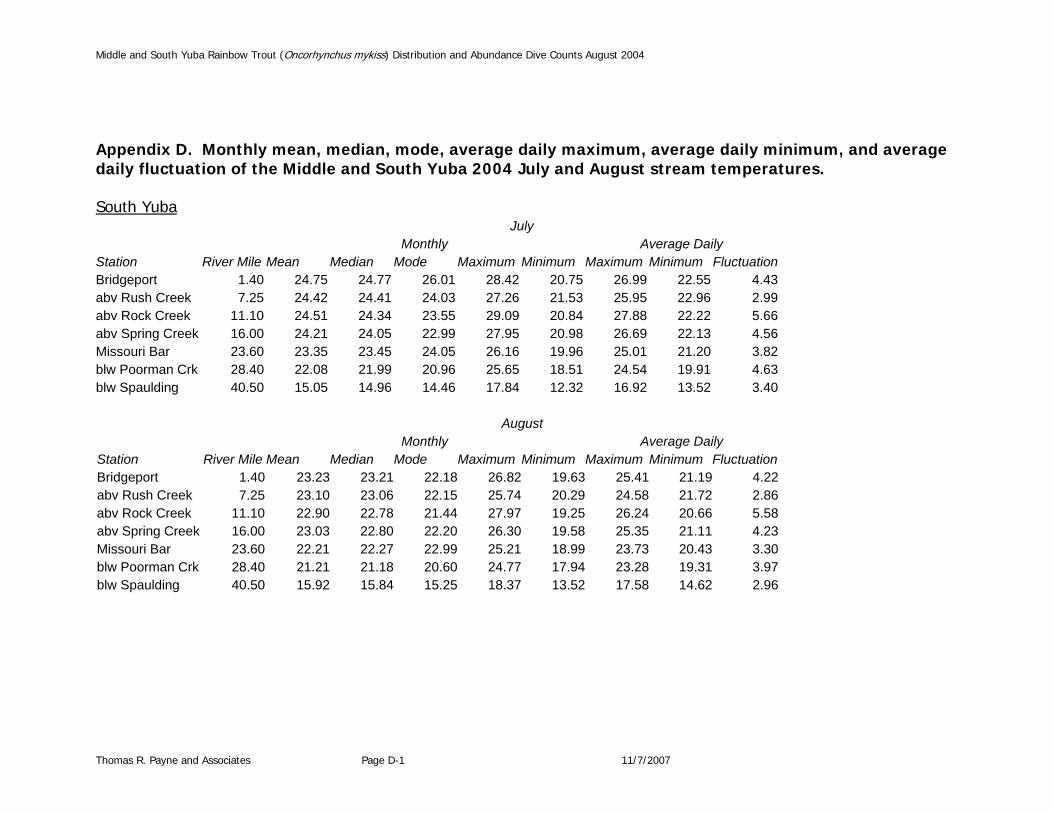
Middle and South Yuba Rainbow Trout (Oncorhynchus mykiss) Distribution and Abundance Dive Counts August 2004
Appendix D. Monthly mean, median, mode, average daily maximum, average daily minimum, and average daily fluctuation of the Middle and South Yuba 2004 July and August stream temperatures. South Yuba July Monthly Average Daily Station River Mile Mean Median Mode Maximum Minimum Maximum Minimum FluctuationBridgeport 1.40 24.75 24.77 26.01 28.42 20.75 26.99 22.55 4.43abv Rush Creek 7.25 24.42 24.41 24.03 27.26 21.53 25.95 22.96 2.99abv Rock Creek 11.10 24.51 24.34 23.55 29.09 20.84 27.88 22.22 5.66abv Spring Creek 16.00 24.21 24.05 22.99 27.95 20.98 26.69 22.13 4.56Missouri Bar 23.60 23.35 23.45 24.05 26.16 19.96 25.01 21.20 3.82blw Poorman Crk 28.40 22.08 21.99 20.96 25.65 18.51 24.54 19.91 4.63blw Spaulding 40.50 15.05 14.96 14.46 17.84 12.32 16.92 13.52 3.40 August Monthly Average Daily Station River Mile Mean Median Mode Maximum Minimum Maximum Minimum FluctuationBridgeport 1.40 23.23 23.21 22.18 26.82 19.63 25.41 21.19 4.22abv Rush Creek 7.25 23.10 23.06 22.15 25.74 20.29 24.58 21.72 2.86abv Rock Creek 11.10 22.90 22.78 21.44 27.97 19.25 26.24 20.66 5.58abv Spring Creek 16.00 23.03 22.80 22.20 26.30 19.58 25.35 21.11 4.23Missouri Bar 23.60 22.21 22.27 22.99 25.21 18.99 23.73 20.43 3.30blw Poorman Crk 28.40 21.21 21.18 20.60 24.77 17.94 23.28 19.31 3.97blw Spaulding 40.50 15.92 15.84 15.25 18.37 13.52 17.58 14.62 2.96
Thomas R. Payne and Associates Page D-1 11/7/2007
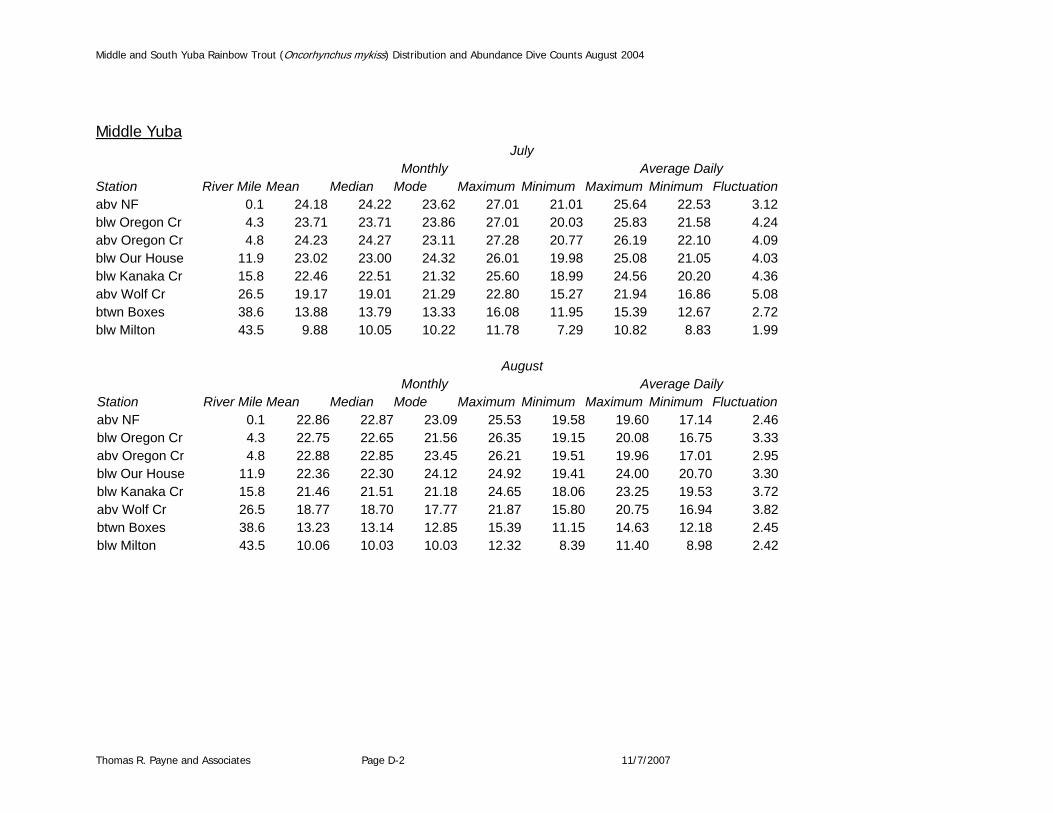
Middle and South Yuba Rainbow Trout (Oncorhynchus mykiss) Distribution and Abundance Dive Counts August 2004
Thomas R. Payne and Associates Page D-2 11/7/2007
Middle Yuba July Monthly Average Daily Station River Mile Mean Median Mode Maximum Minimum Maximum Minimum Fluctuationabv NF 0.1 24.18 24.22 23.62 27.01 21.01 25.64 22.53 3.12blw Oregon Cr 4.3 23.71 23.71 23.86 27.01 20.03 25.83 21.58 4.24abv Oregon Cr 4.8 24.23 24.27 23.11 27.28 20.77 26.19 22.10 4.09blw Our House 11.9 23.02 23.00 24.32 26.01 19.98 25.08 21.05 4.03blw Kanaka Cr 15.8 22.46 22.51 21.32 25.60 18.99 24.56 20.20 4.36abv Wolf Cr 26.5 19.17 19.01 21.29 22.80 15.27 21.94 16.86 5.08btwn Boxes 38.6 13.88 13.79 13.33 16.08 11.95 15.39 12.67 2.72blw Milton 43.5 9.88 10.05 10.22 11.78 7.29 10.82 8.83 1.99 August Monthly Average Daily Station River Mile Mean Median Mode Maximum Minimum Maximum Minimum Fluctuationabv NF 0.1 22.86 22.87 23.09 25.53 19.58 19.60 17.14 2.46blw Oregon Cr 4.3 22.75 22.65 21.56 26.35 19.15 20.08 16.75 3.33abv Oregon Cr 4.8 22.88 22.85 23.45 26.21 19.51 19.96 17.01 2.95blw Our House 11.9 22.36 22.30 24.12 24.92 19.41 24.00 20.70 3.30blw Kanaka Cr 15.8 21.46 21.51 21.18 24.65 18.06 23.25 19.53 3.72abv Wolf Cr 26.5 18.77 18.70 17.77 21.87 15.80 20.75 16.94 3.82btwn Boxes 38.6 13.23 13.14 12.85 15.39 11.15 14.63 12.18 2.45blw Milton 43.5 10.06 10.03 10.03 12.32 8.39 11.40 8.98 2.42


![Fishing and Hatcheries · Fall Chinook Spring Chinook Winter Steelhead Summer Steelhead Coho iddle Rogue/Applegate Hatcheries Above William Jess Da Cole ivers Hatche Skunk]Greens](https://img.pdfslide.net/doc/110x75/5f98aafb2a473200456716ee/fishing-and-hatcheries-fall-chinook-spring-chinook-winter-steelhead-summer-steelhead.jpg)