Embed Size (px)
Citation preview
Ž .Marine Chemistry 68 2000 307–321www.elsevier.nlrlocatermarchem
Uranium in rivers and estuaries of globally diverse,smaller watersheds
H. Windom a,), R. Smith a, F. Niencheski b, C. Alexander a
a Skidaway Institute of Oceanography, 10 Ocean Science Circle, SaÕannah, GA 31411, USAb Laboratorio de Hidroquimica, Fundacao UniÕersidade Do Rio Grande, Caixa Postal 474, 96201-900 Rio Grande R.S., Brazil
Received 30 March 1999; accepted 18 August 1999
Abstract
Data for uranium concentrations in 29 rivers and eight estuaries are presented. The river data expands the existingdatabase on riverine uranium transport to include more smaller watersheds which collectively account for a large portion ofmaterial transport from the continent to the oceans. Riverine concentrations for these smaller watershed range from less than50 to 660 pM. The results for these systems, when combined with previously published data on mostly larger rivers, do not
wchange significantly the calculated global riverine flux and thus earlier estimates by Palmer and Edmond Palmer, M.R.,xEdmond, J.M., 1993. Uranium in river water. Geochim. Cosmochim. Acta, 57, pp. 4947–4955 are substantiated. Uranium
transport through eight diverse estuaries was studied to assess the importance of estuarine removal in the global marineuranium budget. Results indicate that uranium is conservatively transported in most systems studied. Results reported herefor the Savannah estuary, however, indicate significant uranium removal. Our results suggest that uranium is removed in salt
2 2 wmarsh estuaries at a rate of ca. 70 mmolrm . This compares to a rate of 15 mmolrm for Delaware salt marshes Church,T.M., Sarin, M.M., Fleisher, M.Q., Ferchlman, T.G., 1996. Salt marshes: an important sink for dissolved uranium. Geochim.
xCosmochim. Acta, 60, pp. 3879–3887 . We suggest that uranium removal to salt marsh sediments is due to anaerobicmicrobially mediated processes. We use these results to estimate the global significance of the salt marsh sink in the oceanicbudget of uranium. We estimate that 2.7=107 mol of uranium are removed to salt marshes annually as compared to an
7 wannual global riverine input of 3–6=10 mol estimated by Palmer and Edmond Palmer, M.R., Edmond, J.M., 1993.xUranium in river water. Geochim. Cosmochim. Acta, 57, pp. 4947–4955 . q 2000 Elsevier Science B.V. All rights reserved.
Keywords: uranium; watershed; river
1. Introduction
An understanding of the marine biogeochemistryof uranium is important to many geochronometric,paleoenvironmental and other studies where uraniumdecay series daughters provide tracers of processes
) Corresponding author. Tel.: q1-912-598-2453; Fax: q1-912-598-2310; E-mail: [email protected]
and thus, this subject has received much attention.Improved ability to analyze this element, using in-ductively coupled plasma mass spectrometry, hasrecently become widely available, and this has led toan increase in the study of this element. A primaryfocus of recent studies has been on constraining theglobal ocean mass balance of uranium.
Relatively few papers have dealt with the riverineŽchemistry of uranium Palmer and Edmond, 1993;
.Shiller, 1997 and only the work by Palmer and
0304-4203r00r$ - see front matter q 2000 Elsevier Science B.V. All rights reserved.Ž .PII: S0304-4203 99 00086-9
( )H. Windom et al.rMarine Chemistry 68 2000 307–321308
Edmond has provided an estimate of the riverineinput to the ocean based on a globally significantdataset. Far more attention has been placed on theprocesses responsible for uranium removal in themarine environment. For example, removal of ura-nium from seawater and its accumulation in sedi-
Žment has been studied by many authors Cochran etal., 1986; Anderson, 1987; Anderson et al., 1989;Barnes and Cochran, 1990, 1991, 1993; Klinkham-
.mer and Palmer, 1991 . The major mechanism thathas been proposed involves uranium diffusion into
Ž . Ž .sediments where it is reduced from U VI to U IV .Earlier studies regarded uranium reduction as anabiotic process with microbial involvement beinglimited to supplying reduced compounds to serve as
Ž . Ž .reactants in the U VI to U IV conversion. Morerecent studies indicate a more direct microbial in-
Ž .volvement. For example, Barnes and Cochran 1993 ,using sediment incubation experiments, showed thaturanium removal was correlated with sulfate reduc-
Ž .tion. McManus et al. 1998 found that the rate ofuranium removal in continental margin sedimentswas likely related to the rate of organic matterdeposition at the sediment–water boundary. Both ofthese papers suggest that rates of microbial processescontrol the rate of uranium removal.
Processes controlling the removal of uranium insalt marsh estuaries and the importance of this sinkin the global marine budget of uranium have been
Ž .considered by few investigators. Church et al. 1996hypothesize that uranium is scavenged by organicandror iron oxide flocs and deposited on the marshsediment surface where acidity created by sulfideoxidation destabilizes the uranyl carbonate complexand uranium is then sequestered in solid phases as aresult, potentially, of a variety of diagenetic pro-cesses. No direct microbial processes are invoked by
Ž .Church et al. 1996 and the rate of removal iscontrolled by the delivery of uranium to the marshsurface during each tidal cycle.
This paper presents additional data which we havegathered with the aim of improving our understand-ing of uranium inputs from rivers. We also presentdata on the estuarine behavior of uranium to assessthe global significance of estuarine removal, particu-larly in salt marshes.
Most of the studies on this subject publishedrecently have considered large rivers and their estu-
aries. This paper focuses on smaller systems whichmust be considered also in addressing global biogeo-chemical cycles and mass balances. To emphasizethis point, consider that the 50 largest rivers of theworld, with respect to discharge, account for onlyabout 30% of the riverine freshwater input to the
Ž .oceans Todd, 1970 . Also, small river systems oftenaccount for a disproportionate amount of global ma-terial transport from the continents to the oceans.This is demonstrated well by the work of Milliman
Ž .and Syvitski 1992 for sediment transport. Andfinally, the world’s coastlines are more typicallyassociated with smaller river estuaries than largerones.
2. Methods
Samples were collected from diverse riverine andestuarine systems in various parts of the world.Because many of the sampling sites were in underde-veloped regions, all field methods used were de-signed to be suitable for deployment in remote areasfor collecting uncompromised samples. Water sam-ples were collected using procedures similar to those
Ž .described by Windom et al. 1991b using silicontubing attached to a hand-powered peristaltic pump.The inlet to the pumping system has a vane thatorients it into the current flow. The tubing is thor-oughly cleaned by rinsing with 10% HCl and dis-tilled water, in the lab, and is flushed, in the field,before samples are collected. Samples were filteredthrough precleaned Gelman Minicapsul cartridge fil-
Ž .ters 0.45 mm , attached to the outlet end of thesilicone tubing, directly into precleaned polyethylenebottles. Salinity in the field for estuarine sampleswas estimated by refractometer. Samples were ana-lyzed later in the laboratory using an AGE MIN-ISAL 2100 salinometer.
Pore water samples were collected from corestaken in the estuarine zone of the Patos Lagoon foruranium and nutrient analyses. Undisturbed coreswere collected using an 8 cm diameter plastic tubeinserted into the sediments by hand using a piston toavoid compressing the core. The cores were sec-tioned at various intervals and each section placedimmediately into a PVC cylinder to which nitrogen
( )H. Windom et al.rMarine Chemistry 68 2000 307–321 309
pressure was applied to squeeze the pore waterthrough a cellulose filter. The first few milliliterswere discarded and subsequent filtrate collected foranalysis.
Isotope dilution inductively coupled plasmarmassŽ .spectrometry ICPrMS was used for the determina-
tion of uranium in the river and estuarine surfaceand pore water samples. The technique we usedwas adapted from that developed for barium
Ž .by Klinkhammer and Chan 1990 . Analysis wasaccomplished by spiking the sample with 235Uenriched uranium isotope and measuring the ura-nium-238ruranium-235 ratio. Estuarine sampleswere generally diluted with distilled water beforespiking. Analyses were carried out on a VG-Elemen-tal PQII Plus ICPrMS using two replicate 60-s scansfrom mass 233.6 to 239.4. Data validation was deter-mined by the analysis of a sample of known uraniumconcentration sequenced every 10 samples. Blankswere determined at the beginning of the run andbetween every 10 samples to maintain proper blankcorrection. This technique was recently applied inthe certification of a standard reference material forthe Canadian Research Council. The reference mate-rial, named SLRS-4, is a fresh river water samplewhich is now available from CRC. Our blind resultson this reference material during the certificationprocedure was 49"1 ngrl based on six replicates.The certified value is now published as 50"3 ngrl.
Ammonium, phosphate and silicate were analyzedby methods modified from Strickland and ParsonsŽ .1965 . Alkalinity was determined by Gran titration
Ž .in the field Edmond, 1970 .
3. Results
3.1. RiÕers
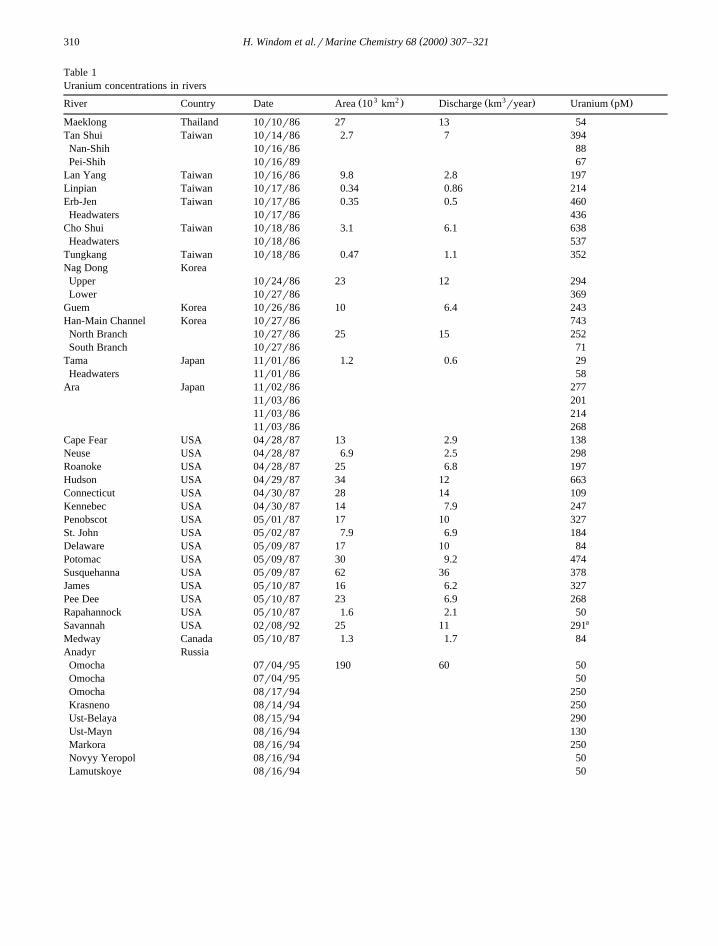
During the course of several projects, carried outbetween 1986 and 1995, we collected water samplesfor uranium analyses from 29 river systems and the
Ž .freshwater region of Patos Lagoon Brazil Table 1 .The watersheds of these rivers range in size over
Žapproximately three orders of magnitude 0.34–1903 2 . Ž10 km . For some rivers e.g., Tan Shui, Ara,
.Anadyr, etc. data are presented for several samples
that were collected in different tributaries of the riveror at different locations along the main trunk; butmost of the uranium concentrations reported are for asingle sample collected near the mouth of the river,but upstream of any salt water influence.
The Patos Lagoon is the largest coastal lagoon inSouth America, having a length of about 250 km andan average width of about 50 km. It receives inputfrom several rivers; the largest river, the GuaibaRiver, is responsible for approximately 85% of thefreshwater discharge through the lagoon. The threefreshwater samples were collected from a region ofthe lagoon approximately 150 km from its mouth.
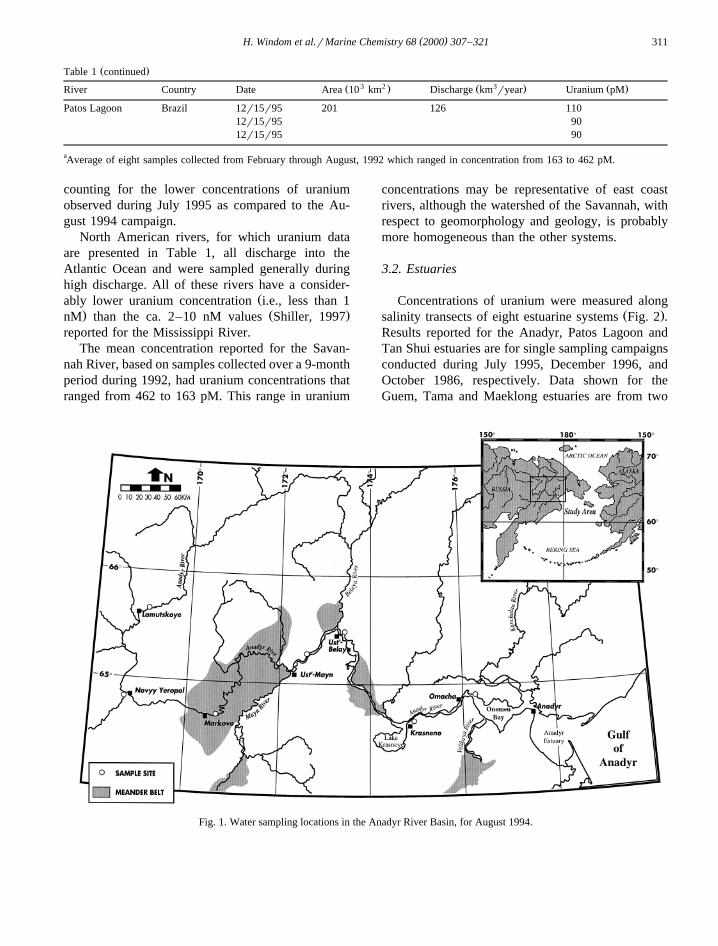
Samples from the Anadyr River, in NortheasternRussia, were collected during two different fieldcampaigns. During August 1994, samples were col-lected at five locations along the main stem of the
Ž .river Fig. 1 . During the July 1995 campaign, em-phasis was on the study of the Anadyr estuaryŽ .discussed below , so freshwater samples were col-lected only near the mouth of the river at the head ofthe estuary, near Anadyr.
The results for the Anadyr river, which drains ashield terrain, indicate clearly that temporal variabil-ity in dissolved uranium concentrations can be sig-nificant. The five-fold difference in concentrationsobserved between the two campaigns near the mouthof the river is similar to annual differences observednear the mouth of the Mississippi River by ShillerŽ .1997 , although uranium concentrations in this riverare considerably higher than those in the Anadyr.Shiller’s data suggest that the variability for theMississippi is controlled by variability in the portionof the watershed from which the discharge is primar-ily derived during different seasons. This may be thecase also for the Anadyr because different parts ofthe watershed will dominate river chemistry depend-ing on the degree of ice melt. But it is likely thatduring ice melt, the ratio of surface and groundwatercontributions to discharge will vary significantly andthis would affect the concentration of weatheringproducts in the river water.
The watershed of the Anadyr straddles the ArcticCircle and ca. 90% of the discharge from the water-shed occurs between June and August, with highestflows occurring during June. It is likely that the earlymelt water is more dilute in weathering productsthan that associated with later discharge, thus ac-
( )H. Windom et al.rMarine Chemistry 68 2000 307–321310
Table 1Uranium concentrations in rivers
3 2 3Ž . Ž . Ž .River Country Date Area 10 km Discharge km ryear Uranium pM
Maeklong Thailand 10r10r86 27 13 54Tan Shui Taiwan 10r14r86 2.7 7 394Nan-Shih 10r16r86 88Pei-Shih 10r16r89 67
Lan Yang Taiwan 10r16r86 9.8 2.8 197Linpian Taiwan 10r17r86 0.34 0.86 214Erb-Jen Taiwan 10r17r86 0.35 0.5 460Headwaters 10r17r86 436
Cho Shui Taiwan 10r18r86 3.1 6.1 638Headwaters 10r18r86 537
Tungkang Taiwan 10r18r86 0.47 1.1 352Nag Dong KoreaUpper 10r24r86 23 12 294Lower 10r27r86 369
Guem Korea 10r26r86 10 6.4 243Han-Main Channel Korea 10r27r86 743North Branch 10r27r86 25 15 252South Branch 10r27r86 71
Tama Japan 11r01r86 1.2 0.6 29Headwaters 11r01r86 58
Ara Japan 11r02r86 27711r03r86 20111r03r86 21411r03r86 268
Cape Fear USA 04r28r87 13 2.9 138Neuse USA 04r28r87 6.9 2.5 298Roanoke USA 04r28r87 25 6.8 197Hudson USA 04r29r87 34 12 663Connecticut USA 04r30r87 28 14 109Kennebec USA 04r30r87 14 7.9 247Penobscot USA 05r01r87 17 10 327St. John USA 05r02r87 7.9 6.9 184Delaware USA 05r09r87 17 10 84Potomac USA 05r09r87 30 9.2 474Susquehanna USA 05r09r87 62 36 378James USA 05r10r87 16 6.2 327Pee Dee USA 05r10r87 23 6.9 268Rapahannock USA 05r10r87 1.6 2.1 50
aSavannah USA 02r08r92 25 11 291Medway Canada 05r10r87 1.3 1.7 84Anadyr RussiaOmocha 07r04r95 190 60 50Omocha 07r04r95 50Omocha 08r17r94 250Krasneno 08r14r94 250Ust-Belaya 08r15r94 290Ust-Mayn 08r16r94 130Markora 08r16r94 250Novyy Yeropol 08r16r94 50Lamutskoye 08r16r94 50
( )H. Windom et al.rMarine Chemistry 68 2000 307–321 311
Ž .Table 1 continued3 2 3Ž . Ž . Ž .River Country Date Area 10 km Discharge km ryear Uranium pM
Patos Lagoon Brazil 12r15r95 201 126 11012r15r95 9012r15r95 90
aAverage of eight samples collected from February through August, 1992 which ranged in concentration from 163 to 462 pM.
counting for the lower concentrations of uraniumobserved during July 1995 as compared to the Au-gust 1994 campaign.
North American rivers, for which uranium dataare presented in Table 1, all discharge into theAtlantic Ocean and were sampled generally duringhigh discharge. All of these rivers have a consider-
Žably lower uranium concentration i.e., less than 1. Ž .nM than the ca. 2–10 nM values Shiller, 1997
reported for the Mississippi River.The mean concentration reported for the Savan-
nah River, based on samples collected over a 9-monthperiod during 1992, had uranium concentrations thatranged from 462 to 163 pM. This range in uranium
concentrations may be representative of east coastrivers, although the watershed of the Savannah, withrespect to geomorphology and geology, is probablymore homogeneous than the other systems.
3.2. Estuaries
Concentrations of uranium were measured alongŽ .salinity transects of eight estuarine systems Fig. 2 .
Results reported for the Anadyr, Patos Lagoon andTan Shui estuaries are for single sampling campaignsconducted during July 1995, December 1996, andOctober 1986, respectively. Data shown for theGuem, Tama and Maeklong estuaries are from two
Fig. 1. Water sampling locations in the Anadyr River Basin, for August 1994.
( )H. Windom et al.rMarine Chemistry 68 2000 307–321312
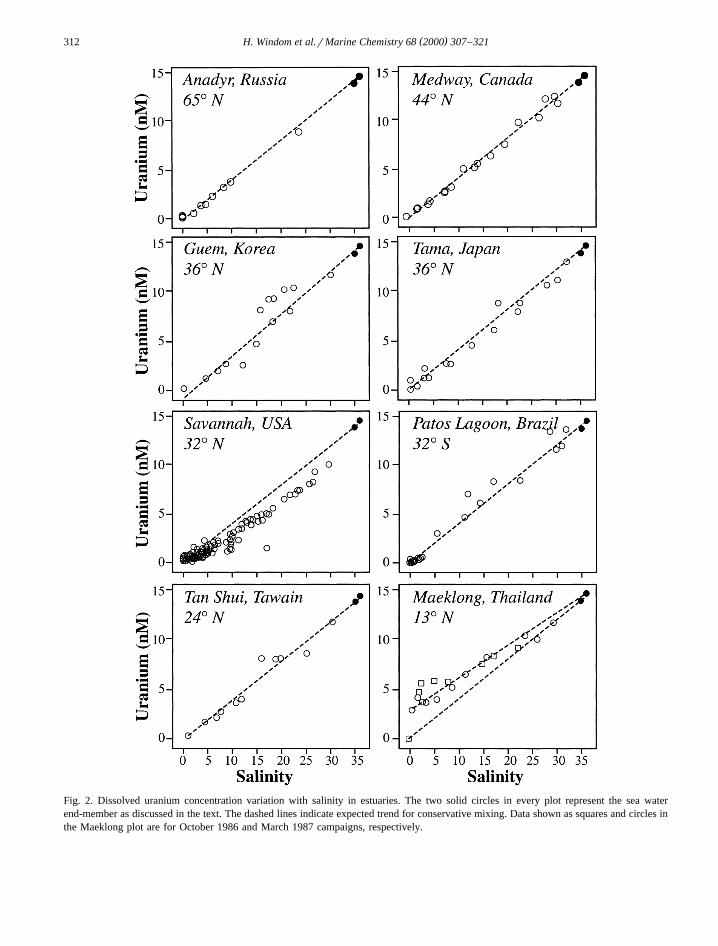
Fig. 2. Dissolved uranium concentration variation with salinity in estuaries. The two solid circles in every plot represent the sea waterend-member as discussed in the text. The dashed lines indicate expected trend for conservative mixing. Data shown as squares and circles inthe Maeklong plot are for October 1986 and March 1987 campaigns, respectively.
( )H. Windom et al.rMarine Chemistry 68 2000 307–321 313
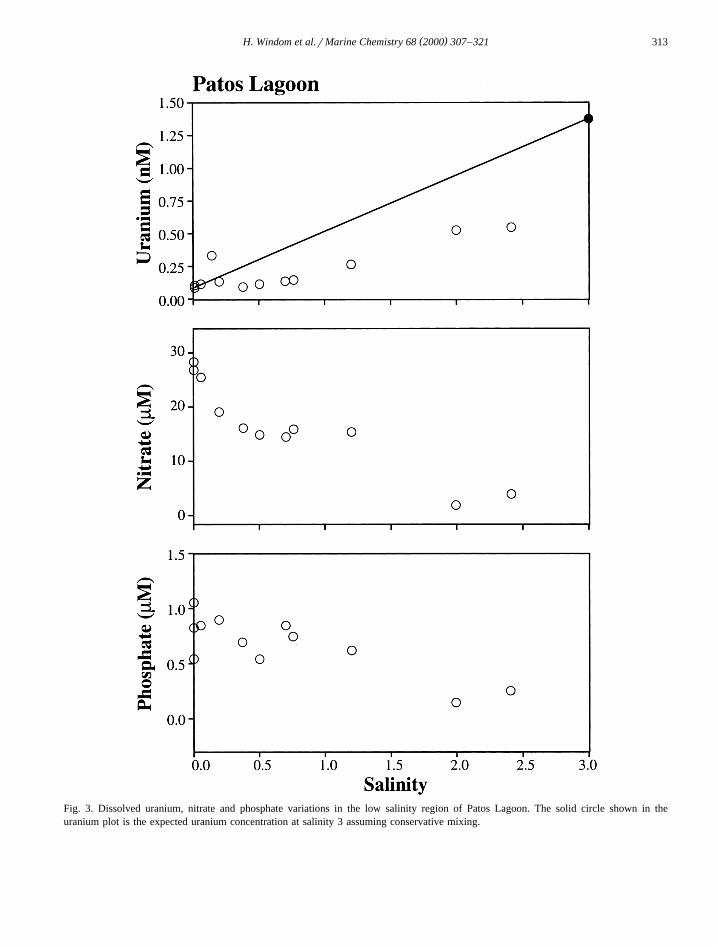
Fig. 3. Dissolved uranium, nitrate and phosphate variations in the low salinity region of Patos Lagoon. The solid circle shown in theuranium plot is the expected uranium concentration at salinity 3 assuming conservative mixing.
( )H. Windom et al.rMarine Chemistry 68 2000 307–321314
sampling campaigns each, with data from both cam-paigns plotted together. These campaigns were con-ducted during October 1986 and March 1987. Re-sults for the Medway estuary are also from twosampling campaigns conducted during May 1987and September 1988. And, finally, data shown forthe Savannah estuary are for samples collected dur-ing five campaigns carried out during Februarythrough the end of August, 1992. Two reference datapoints are provided in the plots of these data whichrepresent average oceanic uranium concentrations,
Ž .normalized to a salinity of 35 Nozaki, 1991 andŽuranium concentration in the Gulf Stream salinity
. Ž .36.2 reported by Maeda and Windom 1982 .ŽThe data for the high latitude estuaries i.e.,
.Anadyr and Medway indicate that uranium behavesconservatively during transport through the freshwa-ter–seawater mixing zone. This is true for bothsampling campaigns in the Medway estuary as thedata from the two sampling campaigns plot togetherwith no apparent differences between them. Thewater column of both estuaries was saturated orsupersaturated with oxygen when sampled and, al-though nutrient removal in the estuary was observed
Žin both systems Windom et al., 1991a; Windom,.unpublished data , biological production was not
great judging from the clarity of the water column.Data for the two sampling campaigns each in the
Ž .Geum and Tama estuaries Fig. 2 suggest that ura-nium is also transported through these estuaries con-servatively. For these two systems, however, there issomewhat more scatter in the data which may reflectlocal nonconservative behavior or analytical uncer-tainty. For example, in the Guem estuary, uraniummay be removed at low salinity and released athigher salinity similar to the uranium behavior ob-
Ž .served by Swarzenski et al. 1995 for the Amazonriver–seawater mixing zone.
The Tan Shui estuary, which runs through Tapei,Taiwan, is heavily contaminated with industrial andmunicipal wastes. The organic loading is so exten-sive that a large portion of the estuary is almost
Ž .anoxic discussed further below . Even so, uranium
is apparently transported through this estuary conser-Ž .vatively Fig. 2 . If abiotic redox processes are re-
sponsible for uranium removal, effects should beapparent here.
Results for the remaining three estuaries are dis-cussed in more detail in Sections 3.2.1, 3.2.2 and3.2.3 because they may provide some additionalinsights into processes affecting uranium transport.
3.2.1. Patos LagoonFor this freshwater–seawater mixing zone, ura-
nium appears to behave relatively conservativelyacross the entire salinity range. During field sam-pling in the Patos Lagoon, advantage was taken ofthe slow mixing rate of this system which resulted inthe zone of 0–5 salinity being spread over an ap-proximately 30 km length of the lagoon. High resolu-
Ž .tion relative to salinity sampling of this regionprovided at closer look at processes occurring at lowsalinity. Results of analysis on samples from this
Ž .region Fig. 3 indicate that uranium is removed.This removal appears to be related to nutrient re-moval and is probably due to ‘‘productivity-depen-
Ž .dent scavenging’’, as proposed by Shaw et al. 1994to explain uranium removal from the water column
Ž .of Chesapeake Bay. Niencheski and Windom 1994have shown that river-derived nutrients are virtuallyquantitatively removed in the low salinity region ofPatos Lagoon due to extensive phytoplankton blooms.The biomass thus produced is subsequently reminer-alized in the higher salinity region near the mouth ofthe Lagoon. Throughout the estuary, however, thewater column continues to be saturated–super-saturated with oxygen, owing principally to the shal-low depth of the lagoon and efficient wind mixing.Similar conditions prevailed during December 1995when the present study was conducted. Results for
Žother metals reported elsewhere Windom et al.,.1999 indicate that most metals are scavenged in the
low salinity region of the Patos Lagoon but arereleased at higher salinity apparently in associationwith organic matter remineralization.
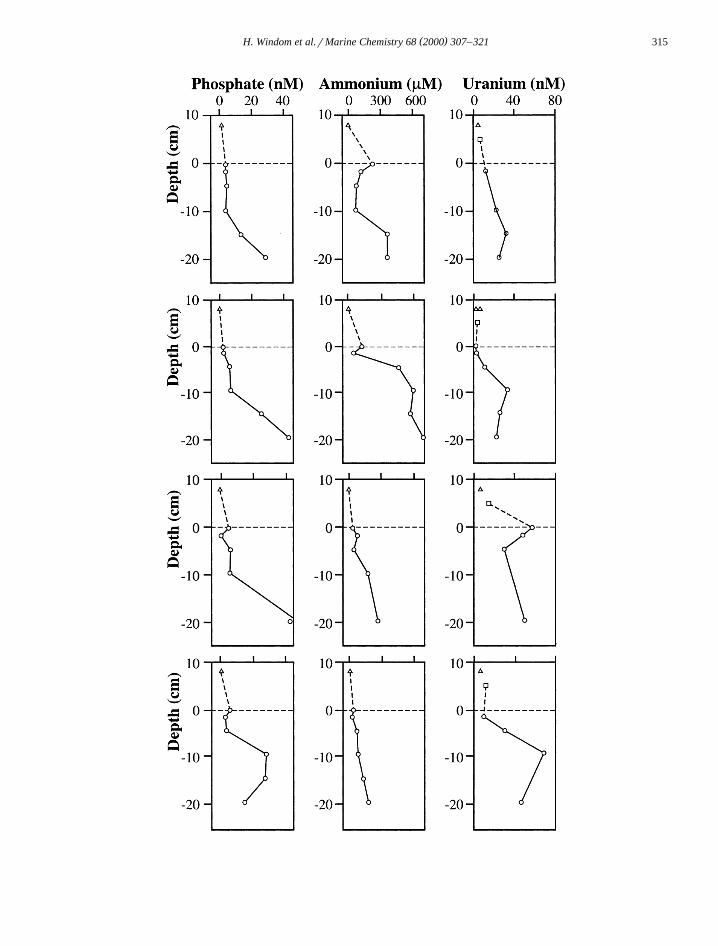
Fig. 4. Depth profiles of porewater phosphate, ammonium and uranium concentrations. Dashed line represents the sediment–water interface.Overlying water samples were collected directly from core barrels. Profiles are for cores collected in the higher salinity region of the PatosLagoon system, near the city of Rio Grande, Brazil. Profiles suggest diffusion of uranium, phosphate and ammonium out of the sediments tothe overlying water.
( )H. Windom et al.rMarine Chemistry 68 2000 307–321 315
( )H. Windom et al.rMarine Chemistry 68 2000 307–321316
Uranium is readily taken up by algae and otherŽ .microorganisms Horikoshi et al., 1979, 1981a,b
Žand it is likely that this process i.e., biological.uptake accounts for uranium removal in the low
Ž .salinity region of Patos Lagoon. Shaw et al. 1994have argued that bottom water and sediment redoxconditions determine whether or not uranium, con-tained in biological detritus, is reduced and accumu-lated in bottom sediments. Because the water columnof Patos Lagoon is oxic and the sediments are gener-ally sandy uranium may be released back to thewater column as organic matter is oxidized. Toassess this, porewater profiles of uranium and nutri-ents were analyzed in sediments collected from the
Ž .mixing zone of Patos Lagoon Fig. 4 . The results ofthese analyses reflect clearly the remobilization ofthese substance, presumably due to organic matterremineralizing, with diffusional gradients toward thesediment surface and into the water column.
3.2.2. MaeklongThe data for the two sampling campaigns in this
estuary are indicated by different symbols in Fig. 2because the results suggest that the behavior ofuranium may have differed significantly between thetwo campaigns. During the October 1986 campaign,the samples collected included one truly fresh end-member. Although we had assumed that we alsocollected a zero salinity sample during the March1987 campaign based on refractometer readings,analysis back in the laboratory indicated a minimumsalinity of 0.75. We point this out because the Octo-ber data suggest a rapid release or increase of ura-nium as salinity increases only a small amount. This
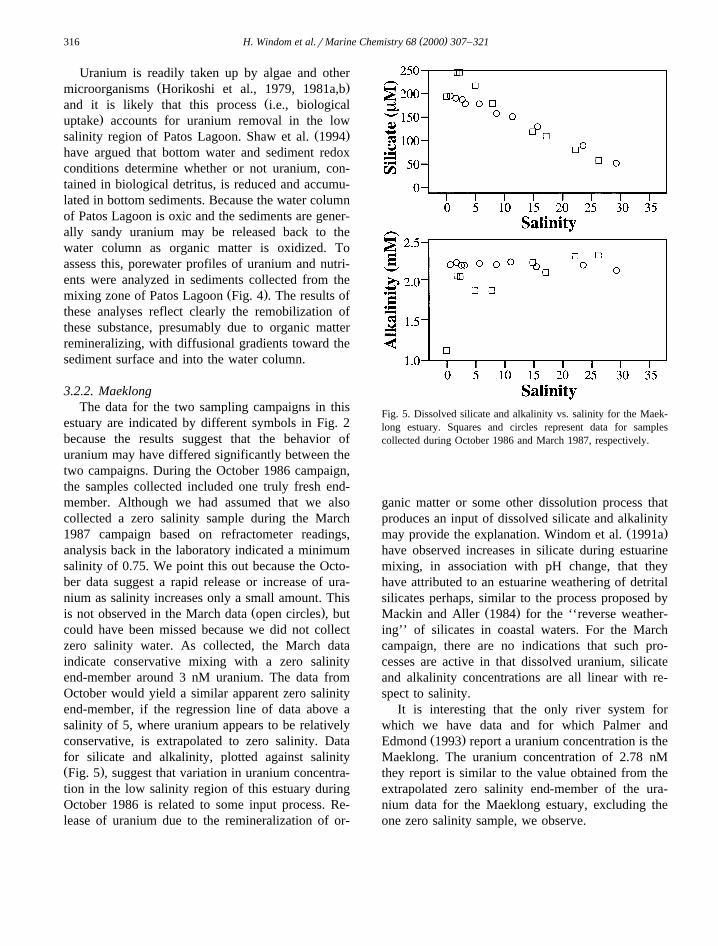
Ž .is not observed in the March data open circles , butcould have been missed because we did not collectzero salinity water. As collected, the March dataindicate conservative mixing with a zero salinityend-member around 3 nM uranium. The data fromOctober would yield a similar apparent zero salinityend-member, if the regression line of data above asalinity of 5, where uranium appears to be relativelyconservative, is extrapolated to zero salinity. Datafor silicate and alkalinity, plotted against salinityŽ .Fig. 5 , suggest that variation in uranium concentra-tion in the low salinity region of this estuary duringOctober 1986 is related to some input process. Re-lease of uranium due to the remineralization of or-
Fig. 5. Dissolved silicate and alkalinity vs. salinity for the Maek-long estuary. Squares and circles represent data for samplescollected during October 1986 and March 1987, respectively.
ganic matter or some other dissolution process thatproduces an input of dissolved silicate and alkalinity
Ž .may provide the explanation. Windom et al. 1991ahave observed increases in silicate during estuarinemixing, in association with pH change, that theyhave attributed to an estuarine weathering of detritalsilicates perhaps, similar to the process proposed by
Ž .Mackin and Aller 1984 for the ‘‘reverse weather-ing’’ of silicates in coastal waters. For the Marchcampaign, there are no indications that such pro-cesses are active in that dissolved uranium, silicateand alkalinity concentrations are all linear with re-spect to salinity.
It is interesting that the only river system forwhich we have data and for which Palmer and
Ž .Edmond 1993 report a uranium concentration is theMaeklong. The uranium concentration of 2.78 nMthey report is similar to the value obtained from theextrapolated zero salinity end-member of the ura-nium data for the Maeklong estuary, excluding theone zero salinity sample, we observe.
( )H. Windom et al.rMarine Chemistry 68 2000 307–321 317
3.2.3. SaÕannahThe Savannah estuary is the only system studied
where removal processes appear to exert a signifi-cant influence on the dissolved uranium–salinity re-lationship with uranium concentrations consistently
below the conservative mixing curve throughout theŽ .estuary Fig. 2 . Results of studies on the Savannah
Ž .estuary by Maeda and Windom 1982 , althoughbased on fewer measurements using alpha spectrom-etry, were similar to those obtained during the pre-
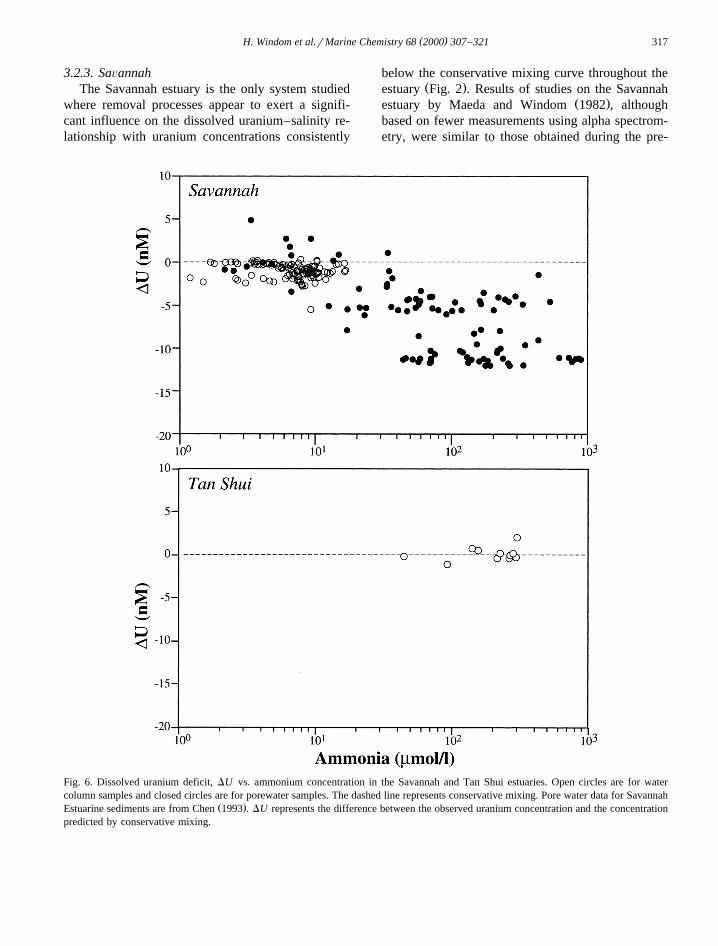
Fig. 6. Dissolved uranium deficit, DU vs. ammonium concentration in the Savannah and Tan Shui estuaries. Open circles are for watercolumn samples and closed circles are for porewater samples. The dashed line represents conservative mixing. Pore water data for Savannah
Ž .Estuarine sediments are from Chen 1993 . DU represents the difference between the observed uranium concentration and the concentrationpredicted by conservative mixing.
( )H. Windom et al.rMarine Chemistry 68 2000 307–321318
sent study. Maeda and Windom observed even morepronounced removal of uranium in the Ogeecheeestuary, especially during low flow conditions. TheOgeechee river is the next river basin south of theSavannah river, and like the Savannah, its estuary isdominated by salt marshes and influenced by a fairly
Ž .large tidal amplitude ca. 2–3 m . As pointed out byMaeda and Windom, these estuaries are net sinks ofoceanic uranium since, based on the shapes of theirU–salinity mixing curves, the uranium removal ratemust exceed the river input rate of uranium.
Other salt marsh estuaries have also been shownŽto be uranium sinks Church et al., 1996 and refer-
.ences therein and various processes have been pro-Ž .posed to account for this. Maeda and Windom 1982
first proposed that water column scavenging in asso-ciation with iron removal andror organic matterflocculation in the mixing zone accounted for the
Ž .observed uranium removal. Church et al. 1996propose that uranium removal involved a water col-umn process, such as that described by Maeda and
Ž .Windom 1982 , but the process is enhanced byredox cycling within salt marshes or at the saltmarsh–sediment interface during tidal inundation.
The results for the Savannah estuary reported herealso suggest that water column removal of uraniumis related to a redox process. This is apparent in thegeneral relationship between water column uraniumdeficit, DU and water column ammonium concentra-
Ž .tion Fig. 6, open circles where DUsU yaSob ob
and U and S are the observed uranium concentra-ob ob
tion and salinity, respectively, and a is the slope ofthe conservative mixing curve shown as a dotted linein Fig. 2. The relationship suggests that when thewater column is more reducing, or at least containsproducts of reduction processes, the uranium deficitis greater. But, the water column of other systems,such as the Tan Shui estuary, are even more reduc-ing, yet no apparent uranium removal is observed, soit is likely that water column processes do not exertthe major influence on uranium removal.
Ž .Chen 1993 studied the pore water chemistry oftrace elements in the estuaries of the Savannah andOgeechee rivers. When his pore water uranium andammonium data for salt marsh sediments collected inthe Savannah estuary are plotted with our estuarinewater column data, the increasing uranium deficitwith increasing ammonium concentration is even
Ž .more pronounced Fig. 6 . Chen’s pore water datafor salt marsh sediments, in the vicinity of the Sa-vannah and the Ogeechee estuaries, show decreasinguranium concentrations with depth indicating an in-ward flux. The uranium gradient is well correlatedwith dissolved pore water iron concentrations inmost of the cores suggesting a coupling.
Ž .The uranium–ammonium Fig. 6 and uranium–Žiron relationships in sediment porewater Chen,
.1993 , that show a uranium flux into the sediments,suggest an anaerobic removal process. Lovley and
Ž . Ž .Phillips 1992 , Lovley et al. 1991; 1993 , havedemonstrated that sulfate and iron reducing bacteria
Ž . Ž .are efficient at reducing U VI to U IV . Circulationof salt marsh groundwater, driven by tidal inunda-tion, which has been shown to be an importantadvective process in nutrient cycling in salt marshesŽ .Whiting and Childers, 1989 , would be an efficientmechanism to deliver oceanic uranium to salt marshsediments for anaerobic processing. Decreased ura-nium and increased ammonium in estuarine waterswould reflect the products of these reactions.
4. Discussion
The results presented above add to the body ofinformation on global riverine U flux and the oceanicuranium balance. These issues are discussed belowin an attempt to integrate our findings with those ofother researchers.
4.1. Global riÕer flux
Ž .Palmer and Edmond 1993 reported values ofdissolved uranium concentrations in 38 rivers andreviewed these data along with previously publisheddata on five additional rivers. These 43 rivers rangedin flow from -1 to 6930 km3ryear and theiruranium concentrations ranged from 60 pM to over20 nM. In the present study, dissolved uraniumconcentrations are reported for an additional 29 riverswhich range in discharge from -1 to over 100km3ryear and range in uranium concentration fromca. 50 to 743 pM.
( )H. Windom et al.rMarine Chemistry 68 2000 307–321 319
The discharge-weighted mean uranium concentra-tion of the data presented by Palmer and EdmondŽ .1993 is 1.3 nM, but this value is influenced heavilyby the Ganges and Brahmaputra. The dischargeweighted mean for the rivers for which we reportdata is only 204 pM. When these two data sets,consisting of 72 rivers, are combined, the meanuranium concentration changes little from the 1.3 nMvalue of Palmer and Edmond, so their estimate forthe global river flux of uranium is not altered bythese new data. However, if the Brahmaputra andGanges rivers are excluded, the uranium concentra-tion of the combined discharge of the remaining 70rivers is ca. 600 pM. If the total river discharge tothe ocean, excluding the Ganges and Brahmaputra isassumed to have this uranium concentration, thenthis flux to the ocean would be 2.1=107 molryear.Adding to this, the contributions from the Ganges
Ž .and Brahmaputra from Palmer and Edmond, 1993gives a total global river flux of ca. 3.3=107
molryear, which would decrease the lower end ofthe range of 3.7–4.8=107 molryear estimated by
Ž .Palmer and Edmond 1993 , by only 10%.
4.1.1. Salt marsh estuarine sink for uraniumA number of researchers have considered the
mechanisms of uranium removal in the marine envi-ronment necessary to balance the riverine input.
Ž .Palmer and Edmond 1989 and Klinkhammer andŽ .Palmer 1991 have argued for reducing sediments of
ocean margins and hydrothermal systems, respec-tively, as being the major sinks. More recently,attention has been focused on estuarine sediments as
Žsignificant sinks for oceanic uranium Barnes andCochran, 1993; Sarin and Church, 1994; Shaw et al.,
.1994; Church et al., 1996 . Even a decade earlier,Ž .Maeda and Windom 1982 had pointed out that
uranium is removed from salt marsh estuarine watersat a rate greater than that supplied by local riverinput.
Estuarine salt marshes are maintained throughperiodic inundation of marine waters. This providesan efficient mechanism of conveying oceanic ura-nium to this environment for biogeochemical pro-cessing. Given our present results and those of
Ž .Church et al. 1996 , it appears that salt marshes mayprovide an efficient uranium sink throughout the
world. But do salt marshes provide a globally signifi-cant uranium sink?
Our results from the Savannah estuary can beused to make a rough assessment of the potentialimportance of salt marshes as a global sink foruranium. Obviously, the efficiency of salt marshes inuranium removal varies from place to place, depend-ing on how a given salt marsh processes waterthrough its sediments. The efficiency depends pri-marily on tidal inundation and microbial activity, andperhaps, an integrated relative measure of these issalt marsh productivity.
The salt marshes of the southeastern US Atlanticcoast cover an area of about 400,000 ha. Theirannual productivity ranges between about 1300 and
2 Ž .2300 gCrm Pomeroy and Wiegert, 1981 . Thisrate of productivity is generally in the range of theglobal average salt marsh primary production of
2 Ž .1400 gCrm year. Walsh, 1984 , so we mightassume that the processing of uranium by salt marshesin the vicinity of the Savannah estuary provides anaverage estimate of this process.
The Savannah River is one of the larger of eightrivers that discharge through the extensive salt marshsystem lying along the coasts of South Carolina,
ŽGeorgia and North Florida and its discharge ca. 103 .km ryear is less than 20% of the total freshwater
Ž 3 .input ca. 60 km ryear to the region. It would bevirtually impossible to determine what portion of thismarsh system affects material transport through theSavannah Estuary. If, however, it is conservativelyassumed that as much as 20% of the 400,000 ha ofsalt marsh is responsible for the uranium removalobserved in the uranium vs. salinity data for the
Ž .Savannah Fig. 2 , then the uranium removal per unitarea of salt marsh can be estimated. Assuming asmaller percentage of the salt marsh accounts foruranium removal observed in the Savannah estuarywould lead to a larger estimate of the salt marshsink.
Ž .Maeda and Windom 1982 estimated the rate ofuranium removal in the Ogeechee estuary, based onthe U–salinity relationship using the approach of Li
Ž .and Chan 1979 . This estimates uranium removal,R, using the relationship:
RsQ IyU 1Ž . Ž .r
( )H. Windom et al.rMarine Chemistry 68 2000 307–321320
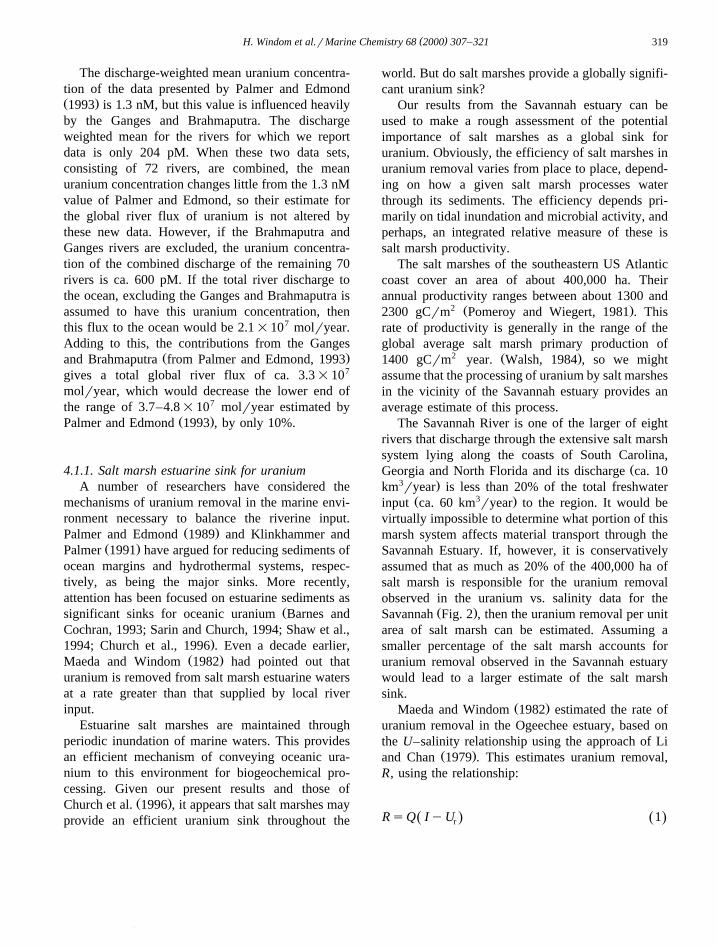
Fig. 7. Diagram of dissolved uranium variations with salinity inthe Savannah estuary in relations to theoretical conservative mix-ing. Solid line represents the regression curve of uranium onsalinity, for samples having salinity greater than 20, extrapolatedto zero. U and I indicate graphic representation of parameters inr
Ž .Eq. 1 .
where I is the intercept on the U-axis of the tangentto the U–salinity mixing curve in the high salinityregion, U is the observed uranium concentration ofr
river water and Q is river discharge.The data collected for the Savannah estuary cov-
ered a period of time which is considered to berepresentative of the seasonal variability that occurs.
Ž .These data Fig. 2 form a reasonably constant mix-ing curve with uranium concentrations becomingrelatively linear with respect to increasing salinity atsalinities greater than 20. If a regression line ofuranium on salinity greater than 20 is extrapolated to
Ž .zero salinity, its intercept I is ca. y5 nM Fig. 7 .Using a mean uranium concentration, U , for ther
Savannah river of 290 pM and an average annual3 Ž .discharge, Q, of 11 km ryear Table 1 , the uranium
removal rate for the Savannah Estuary calculatedŽ . 10using Eq. 1 is ca. 5.8=10 mmolryear. or ca. 70
mmolrm2 of marsh area per year, assuming that theremoval is accumulated in 80,000 ha of salt marsh.This compares fairly well to 15 mmolrm2 estimated
Ž .by Church et al. 1996 for a Delaware Marsh, andthis lower value may be reasonable considering thatthe tidal amplitude is between 1 and 1.5 m for theirstudy area, as compared to 2–2.5 m for the SavannahRiver mouth. Also, Delaware salt marshes are gener-ally less productive than those along the Southeast-ern Atlantic coast.
Ž .Woodwell et al. 1973 estimate that the globalarea of salt marsh is about 3.8=105 km2. Given therate of uranium removal estimated above for saltmarshes in the vicinity of the Savannah estuary andextrapolating this to the world, the global salt marshsink would be about 2.7=107 molryear.
Even if the global uranium removal rate attributedto salt marsh sediments, estimated on the basis ofresults for the Savannah estuary, is high, our results
Ž .coupled with those of Church et al. 1996 indicatethat salt marshes are a significant sink for the globaluranium input to the oceans which is estimated to be
7 Žin the range of ca. 3–6=10 molryear. Palmer and.Edmond, 1993 .
Acknowledgements
The authors wish to acknowledge the assistants inthe field of numerous colleagues in the US, Brazil,Canada, Korea, Russia, Thailand and Taiwan. Wealso thank Alan Shiller, Tom Church, Peter Swarzen-ski and another anonymous reviewer for their criticalreview of the manuscript and helpful suggestions.
ŽThis work was supported in part by NSF Grant Nos..OCE-9415789, OCE-8600287, and INT-8600288
Ž .and ONR Grant No. N00014-93-1-1315 .
References
Anderson, R.F., 1987. Redox behavior of uranium in an anoxicmarine basin. Uranium 3, 145–164.
Anderson, R.F., Lehuray, A.P., Fleisher, M.Q., Murray, J.W.,1989. Uranium deposition in Saanich Inlet sediments, Vancou-ver Island. Geochim. Cosmochim. Acta 53, 2205–2213.
Barnes, C.E., Cochran, J.K., 1990. Uranium removal in oceansediments and the oceanic U balance. Earth Planet. Sci. Lett.97, 94–101.
Barnes, C.E., Cochran, J.K., 1991. Geochemistry of uranium inBlack Sea sediments. Deep-Sea Res. 38, 51237–51254.
Barnes, C.E., Cochran, J.K., 1993. Uranium geochemistry inestuarine sediments: controls on removal and release pro-cesses. Geochim. Cosmochim. Acta 57, 555–569.
Chen, Y.-C., 1993. Trace Element Distributions in Salt MarshSediments: The Relative Importance of Non-Steady State andDiagenetic Processes. PhD Dissertation, GA Inst. Tech., At-lanta, GA, 172 pp.
Church, T.M., Sarin, M.M., Fleisher, M.Q., Ferchlman, T.G.,1996. Salt marshes: an important sink for dissolved uranium.Geochim. Cosmochim. Acta 60, 3879–3887.
( )H. Windom et al.rMarine Chemistry 68 2000 307–321 321
Cochran, J.K., Carey, A.E., Sholkavitz, E.R., Surprenant, L.D.,1986. The geochemistry of uranium and thorium in Coastalmarine sediments and sediment pore waters. Geochim. Cos-mochim. Acta 50, 663–680.
Edmond, J.M., 1970. High precision determination of titrationalkalinity and total carbon dioxide content of seawater bypotentiometric titration. Deep-Sea Res. 17, 737–750.
Horikoshi, T., Nakajima, A., Sakaguchi, T., 1979. Uptake ofuranium by Chlorella regularis. Agric. Biol. Chem. 43, 617–623.
Horikoshi, T., Nakajima, A., Sakaguchi, T., 1981a. Studies on theaccumulation of heavy metal elements in biological systems:XIX. Accumulation of Uranium by Microorganisms. Eur. J.Appl. Microbiol. Biotechnol. 12, 90–96.
Horikoshi, T., Nakajima, A., Sakaguchi, T., 1981. Accumulationof uranium by Chlorella cells grown under autotrophic,heterotrophic and mixotrophic culture conditions. Agric. BiolChem., pp. 781–783.
Klinkhammer, G.P., Chan, L.H., 1990. Determination of bariumin marine waters by isotope dilution inductively coupled plasmamass spectrometry. Anal. Chim. Acta 232, 323–329.
Klinkhammer, G.P., Palmer, M.R., 1991. Uranium in the oceans:where it goes and why. Geochim. Cosmochim. Acta 55,1799–1809.
Li, Y.H., Chan, L.H., 1979. Desorption of Ba and Ra-226 fromriver-borne sediments in the Hudson estuary. Earth Planet. Sci.Lett. 43, 343–350.
Lovley, D.R., Phillips, E.J.P., 1992. Reduction of uranium byDesulfoÕibrio desulfuricans. Appl. Environ. Microbiol. 58,850–856.
Lovley, D.R., Phillips, E.J.P., Gorby, Y.A., Landa, E.R., 1991.Microbial reduction of uranium. Nature 350, 413–416.
Lovley, D.R., Widman, P.K., Woodward, J.C., Phillips, E.J.P.,1993. Reduction of uranium by cytochrome C of DesulfoÕib-3
rio Õulgaris. Appl. Environ. Microbiol. 59, 3572–3576.Mackin, J.E., Aller, R.C., 1984. Dissolved Al in sediments and
water of the East China Sea: implications for anthigenicmineral formation. Geochim. Cosmochim. Acta 48, 281–297.
Maeda, M., Windom, H.L., 1982. Behavior of uranium in twoestuaries of the southeastern United States. Mar. Chem. 11,427–436.
McManus, J., Berelson, W.M., Klinkhammer, G.P., Johnson, K.S.,Coale, K.H., Anderson, R.F., Kumar, N., Burdige, D., Ham-mond, D.E., Brumsack, H.S., McKorkle, D., Rushdi, A., 1998.Geochemistry of barium in marine sediments: implications forits use as a paleoproxy. Geochim. Cosmochim. Acta 62,3453–3473.
Milliman, J.D., Syvitski, J.P.M., 1992. Geomorphicrtectonic con-trol of seidment discharge to the ocean. The importance ofsmall mountainous rivers. J. Geol. 100, 525–544.
Niencheski, L.F., Windom, H.L., 1994. Nutrient flux and budgetŽ .in Patos Lagoon Estuarine Brazil . Sci. Total Environ. 149,
53–60.Nozaki, Y., 1991. The systematics and kinetics of UrTh decay
series nuclides in ocean water. Rev. Aquat. Sci. 4, 75–105.Palmer, M.R., Edmond, J.M., 1989. The strontium isotope budget
of the modern ocean. Earth Planet. Sci. Lett. 92, 11–26.Palmer, M.R., Edmond, J.M., 1993. Uranium in river water.
Geochim. Cosmochim. Acta 57, 4947–4955.Ž .Pomeroy, L.R., Wiegert, R.G. Eds. , 1981. The Ecology of a Salt
Marsh. Ecological Studies, Vol. 28, Springer-Verlag, NewYork, 271 pp.
Sarin, M.M., Church, T.M., 1994. Behaviour of uranium duringmixing in the Delaware and Chesapeake estuaries. Estuarine,Coastal Shelf Sci. 39, 619–631.
Shaw, T.J., Sholkovitz, E.R., Klinkhammer, G., 1994. Redoxdynamics in the Chesapeake Bay: the effect on sedimentrwateruranium exchange. Geochim. Cosmochim. Acta 58, 2985–2995.
Shiller, A.M., 1997. Dissolved trace elements in the MississippiRiver: seasonal, interannual and decadal variability, Geochim.Cosmochim. Acta, in press.
Strickland, J.D.H., Parsons, T.R., 1965. A Practical Handbook ofSeawater Analysis, Fisheries Research Board of Canada Bull,1967.
Swarzenski, P.W., McKee, B.A., Booth, J.G., 1995. Uraniumgeochemistry on the Amazon shelf: chemical phase partition-ing and cycling across a salinity gradient. Geochim. Cos-mochim. Acta 59, 7–18.
Todd, D.K., 1970. The Water Encyclopedia, Water InformationCenter, Port Washington, NY, 559 pp.
Walsh, J.J., 1984. The role of the biota is accelerated ecologicalcycle: a temporal view. Bioscience 34, 343–350.
Whiting, G.J., Childers, D.L., 1989. Subtidal advective water fluxas a potentially important nutrient input to southeastern USAsaltmarsh estuaries. Estuarine, Coastal Shelf Sci. 28, 417–431.
Windom, H., Byrd, J., Smith, R. Jr., Hungspreugs, M., Dharm-vanij, S., Thumtrakul, W., Yeats, P., 1991a. Trace metal–nutrient relationships in estuaries. Mar. Chem. 32, 177–194.
Windom, H.L., Byrd, J.T., Smith, R.G., Huan, F., 1991b. Inade-quacy of NASQAN data for assessing metal trends in thenation’s rivers. Environ. Sci. Technol. 24, 1137–1142.
Windom, H.L., Niencheski, L.F., Smith, R.G. Jr., 1999. Biogeo-chemistry of nutrients and trace metals in the estuarine region
Ž .of the Patos Lagoon Brazil . Estuarine, Coastal Shelf Sci. 48,113–123.
Woodwell, G.M., Rich, P.H., Hall, C.A.S., 1973. In: Woodwell,Ž .G.M., Pecan, E.V. Eds. , Carbon in Estuaries, Brookhaven
Symposium Biological Series 24, pp. 221–224.