Embed Size (px)
Citation preview
CHAPTER 12
URBAN INSERTION OF GOVERNMENT HOUSING PROJECTS: EVERYDAY MOBILITY AND LAND USE1
Clarisse Linke2 Bernardo Serra3
Fernando Garrefa4
Débora Cristina Araújo5
Simone Barbosa Villa6 Vanessa Gapriotti Nadalin7
Cleandro Krause8
1 INTRODUCTION
Since 2007, the Brazilian Government has been implementing a policy that chan-nels massive investments in infrastructure through its Growth Acceleration Program (Programa de Aceleração do Crescimento – PAC). Although funding for favela upgrades was included, investments in urban infrastructure were not initially among the main priorities of this program. However, the situation changed drastically from 2009 on-wards, followed by the launch of the second Growth Acceleration Program (PAC-2)
1. This is a condensed version of the Discussion Paper 2176 published by Ipea on the basis of field surveys in Rio de Janeiro and São Paulo conducted by Pedro Torres, Gabriel Schvarsberg, Luc Nadal and the LabCidade staff at FAU/USP, coordinated by Professor Dr. Raquel Rolnik with the assistance and revision of Álvaro Luis dos Santos Pereira, Ana Paula de Oliveira Lopes, Fernanda Accioly Moreira, Júlia Ferreira de Sá Borrelli, Luanda Villas Boas Vannuchi, Luis Guilherme Alves Rossi, Luciana Royer, Rodrigo Faria Gonçalves Iacovini, Vitor Coelho Nisida, Décio Rodrigues Nunes Junior, Lucas Pacobahyba, Gabriel Oliveira, Juliana de Castro, Juliana Muniz and Ana Nassar. Field surveys in Uberlândia and the respective analyzes were handled by staff and students from the School of Architecture, Urban Planning and Design at the Uberlândia Federal University, consisting of Simone Barbosa Villa (Consultant), Débora Cristina Araújo (Student, Graduate Studies Program in Architecture and Urban Planning) and Ana Beatriz Miquelutti de Oliveira, Ellen Vanessa Soares Pereira, Ernesto Melo, Gabriela Caetano Buiatti, Henrique Inocêncio Borges, Larissa Oliveira Castilho, Lucas Eduardo Bueno Dantas, Rafael Gonçalves, Raquel Silva Nascimento Oliveira and Talita Pereira de Araújo (Graduate Students in Architecture and Urban Planning). 2. Executive Director, Institute for Transportation and Development Policy (Brazil), MSc in Political Science, NGOs and Development, London School of Economics and Political Science; Third Sector Graduate Studies, Institute of Economics, Rio de Janeiro Federal University (UFRJ).3. Public Policies Coordinator, Institute for Transportation and Development Policy (Brazil), MSc inn Economics, Université Paris 1 Panthéon-Sorbonne and currently undertaking a Master Degree in Urban Engineering, Polytechnic School, Rio de Janeiro Federal University (UFRJ).4. Head of the School of Architecture, Urbanism and Design of the Federal University of Uberlândia (FAUeD/UFU).5. Architect at the Secretariat of Urban Planning, Municipality of Uberlândia.6.Associate Professor at FAUeD/UFU, coordinator of Grupo Mora: housing research, at the same institution.7. Planning and research technician, Regional, Urban and Environmental Studies and Policies Department (Dirur), Ipea. 8. Planning and research technician, Dirur, Ipea. The authors offer their thanks for the support of research assistants Alex Rodrigues do Nascimento and Matheus dos Santos Rabetti, Quantitative Methods Advisory Unit, Dirur.
City and Movement: mobilities and interactions in urban development262 |
in 2010. This shift was reflected through investments in urban mobility projects, with a total of R$ 143 billion announced for PAC-2, PAC Copa and the Mobility Pact.9
In 2009, the Brazilian Government launched the Minha Casa Minha Vida (MCMV – in English, My Home My Life) public housing program that mobilized funds since then at unprecedented levels in Brazil. The program was designed to lessen a housing shortage estimated at 5.5 million units (Pasternak and D’Ottaviano, 2014), and funds were earmarked for the construction of public housing projects. The initial goal of this program in 2009 was to build one million homes, with this target raised by the [Dilma] Rousseff Administration to two million, and then to three million in 2014. This housing subsidies policy paved the way for families to move into their own homes in urban areas, with three monthly Income Brackets: up to R$ 1,600 (income bracket 1), R$ 1,600 – R$ 3,275 (income bracket 2) and R$ 3,275 – R$ 5,400 (income bracket 3). The lack of homes for income bracket 1 families accounts for 90% of Brazil’s housing shortage (Maricato, 2012).
In addition to addressing this housing shortage, the roots of this program also include an explicit economic goal. Encompassed by the PAC, the MCMV is part of a strategy created in response to the 2008 global credit crunch, and was designed to boost economic growth while generating jobs and income through the construction industry. In practice, these twin targets resulted in higher priority for construction speed and unit quantity, to the detriment of quality, in terms of the location, design and planning of these homes (Cardoso, 2013). Consequently, while the MCMV Program has indeed delivered significant numbers of housing units at affordable prices, there is nevertheless a rising tide of criticism over the quality of these units. More specifically, the link between providing social housing at affordable prices, locations and options for accessing the city seem to have generally been neglected, with the negative effects of this program accentuating the social segregation of low-income families. In fact, this program has been replicating the missteps of Brazil’s housing policy since the 1960s, when property construction and ownership transfers were defined as the only strategy for addressing housing shortages (Bonduki, 2014). The location of major public housing projects in Rio de Janeiro – such as Cidade de Deus and Vila Kennedy – underscore the periph-eralization of low-income housing of that earlier period.
An analysis of the locations of developments implemented for MCMV income bracket 1 shows that most of these housing complexes were built as residential-only projects on the outskirts of Brazilian cities, far away from areas that concentrate opportunities and public services, requiring lengthy commutes and reinforcing a situation of social and spatial segregation that is examined in this paper. For example, more than 66,000 housing units were contracted in Rio de Janeiro, with a goal of
9. Available at: <http://www.pac.gov.br/noticia/193f78a6> and <http://goo.gl/e0ogTi>.
Urban Insertion of Government Housing Projects: everyday mobility and land use | 263
100,000 by the end of 2016. Of these, 50% were earmarked for income bracket 1 families (Rio de Janeiro City Hall, 2014) with 53% of all units handed over to families in this income bracket located in the West Zone. People living in these complexes and using public transportation to the more prosperous South Zone or the Centro business district – where most registered jobs and services are located – face commutes of up to four hours a day (Cardoso, 2013). By June 2013, contracts had been signed for the creation of 64,600 housing units in São Paulo, with 34.1% of these earmarked for income bracket 1 families. Analyzing the distance from the two main hubs offering jobs and services (Praça da Sé and Avenida Berrini), it was apparent that MCMV income bracket 1 complexes are located at mean distances of 26 – 28 kilometers from the areas that concentrates the opportunities in the city (Marques and Rodrigues, 2013). Out of 6,636 housing units delivered in Uberlândia, 62.87% went to income bracket 1 families; a further 6,008 units have been contracted or are under construction for families in income brackets 1 and 2 (Uberlândia City Hall, 2015). These developments are scattered through outlying areas all around the city, mainly in the West Sector, recalling that municipal laws were altered in order to expand urban perimeters, which allowed sub-division of the tracts of land on which most of these projects were built.
Together with the design of these developments, this geographical distribu-tion exacerbates the territorial segregation of low-income families, triggering many different impacts on the mobility and quality of life of their members. Moreover, this public housing production logic has also imposed costs on society as a whole, with more funding needed to extend infrastructure facilities out towards these peripheral areas, in parallel to longer commutes, traffic jams, air pollution and road safety challenges.
It is thus necessary to assess the extent to which moving into the homes of-fered by MCMV projects proved positive for their residents, from the standpoint of location, cost and quality of life. This is a crucial factor for Rio de Janeiro, for example, where the MCMV Program is the only resettlement mechanism for families removed from high-risk areas in order to make way for sweeping changes underwritten by massive investments that are changing the face of the city. It is also worthwhile analyzing the characteristics of the developments implemented so far, in order to assess the challenges of urban insertion, striving to highlight steps that could foster progress through not only building homes but also providing good quality urban settings for their residents.
In order to address these challenges, we present a case study of five income bracket 1 developments: two in Rio de Janeiro, two in São Paulo and one in Uberlândia. These case studies are intended to provide input to reassess core ele-ments related to the quality and costs of MCMV developments, as well as aspects related to urban mobility and access to the city. The following sections present
City and Movement: mobilities and interactions in urban development264 |
the methodological grounds used, and the resulting findings of, these case stud-ies, together with proposals for more effective ways to address the challenges of mobility and accessibility noted in the course of the study.
2 METHODOLOGY
Different criteria guided the selection of developments in each municipality. In Rio de Janeiro, this choice was based on the contrast between what is rated as one of the best projects in terms of location, with easy access to public transportation in an area that is already consolidated with supplies of services and facilities, and one of the most remote MCMV developments, located far from transportation, services and other amenities. In São Paulo, developments were selected where the Right of the City and Public Space Laboratory at the School of Urban Planning and Architecture, University of São Paulo (LabCidade, FAU/USP) have already engaged in research activities. In terms of location and transportation, both developments present intermediary situation comparing with the two projects in Rio de Janeiro, located in better consolidated outlying areas with relatively good transportation options and access to local sub-centers. In Uberlândia, a development was selected that is typical of most of the housing projects built by the MCMV in that city: in an outlying district that is segregated by a highway and offers few urban amenities and connections to surroundings areas.
The researchers first obtained general information on each of the selected developments. Next, the researchers administered a survey with their residents, through a questionnaire designed to explore their views of the changes introduced by moving away from their old homes. The questionnaire addressed issues such as alterations in use of means of transportation, time spent commuting, transportation and housing costs, availability of local recreation facilities, services and stores, in addition to resident satisfaction. The surveys of people living in Rio de Janeiro and São Paulo were conducted between April and July 2014, with teams of six to eight researchers at each complex. During this period, 299 families were interviewed, for a total of 1,079 people. The surveys in Uberlândia were conducted by a team of nine researchers interviewing a total of sixty families (228 people) between November and December 2014.
These developments were also analyzed through the MCMV Income Bracket 1 Urban Insertion Assessment Tool developed by the Institute for Transportation and Development Policy (ITDP) in partnership with the LabCidade – FAU/USP. This tool draws from two sources: the Transport-Oriented Development (TOD) Standard developed by ITDP,10 and second, the concept of “urban insertion,” defined here as the way in which housing units interact in urban areas, taking
10. Available at: <http://goo.gl/tWzxEJ>.
Urban Insertion of Government Housing Projects: everyday mobility and land use | 265
into consideration the location, the adaptation to the terrain, their connections to infrastructure facilities, the availability of public utility services and links with nearby public areas and buildings.11
The Urban Insertion Assessment Tool is designed to evaluate the urban inser-tion of an MCMV housing unit construction project prior to its implementation, thus providing input for project approval processes. Moreover, this tool also helps to: clarify the public and private players involved in project development, assess-ment and approval criteria; define the best design and establish the location and manner of implementation of the development; focus on establishing access to public areas; foster sociability and pedestrian traffic; and improve access to public transportation and the public amenities, jobs, commerce and services that are es-sential for urban life. This tool also assesses the extent to which each development improves or worsens social and spatial segregation in Brazilian cities.
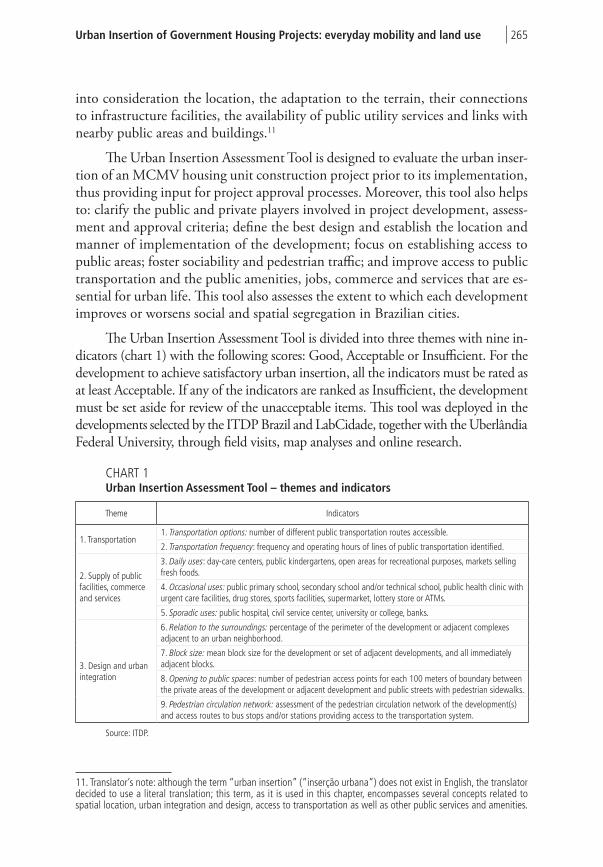
The Urban Insertion Assessment Tool is divided into three themes with nine in-dicators (chart 1) with the following scores: Good, Acceptable or Insufficient. For the development to achieve satisfactory urban insertion, all the indicators must be rated as at least Acceptable. If any of the indicators are ranked as Insufficient, the development must be set aside for review of the unacceptable items. This tool was deployed in the developments selected by the ITDP Brazil and LabCidade, together with the Uberlândia Federal University, through field visits, map analyses and online research.
CHART 1Urban Insertion Assessment Tool – themes and indicators
Theme Indicators
1. Transportation1. Transportation options: number of different public transportation routes accessible.
2. Transportation frequency: frequency and operating hours of lines of public transportation identified.
2. Supply of public facilities, commerce and services
3. Daily uses: day-care centers, public kindergartens, open areas for recreational purposes, markets selling fresh foods.
4. Occasional uses: public primary school, secondary school and/or technical school, public health clinic with urgent care facilities, drug stores, sports facilities, supermarket, lottery store or ATMs.
5. Sporadic uses: public hospital, civil service center, university or college, banks.
3. Design and urban integration
6. Relation to the surroundings: percentage of the perimeter of the development or adjacent complexes adjacent to an urban neighborhood.
7. Block size: mean block size for the development or set of adjacent developments, and all immediately adjacent blocks.
8. Opening to public spaces: number of pedestrian access points for each 100 meters of boundary between the private areas of the development or adjacent development and public streets with pedestrian sidewalks.
9. Pedestrian circulation network: assessment of the pedestrian circulation network of the development(s) and access routes to bus stops and/or stations providing access to the transportation system.
Source: ITDP.
11. Translator’s note: although the term “urban insertion” (“inserção urbana”) does not exist in English, the translator decided to use a literal translation; this term, as it is used in this chapter, encompasses several concepts related to spatial location, urban integration and design, access to transportation as well as other public services and amenities.
City and Movement: mobilities and interactions in urban development266 |
Additionally, an extension of the Urban Insertion Assessment Tool was pro-posed in order to include an evaluation of access to formal employment, based on company records in the Annual Information Report released by the Ministry of Labor and Employment (Rais-MTE), with two indicators: i) number of formal jobs available with wages of up to R$ 1,600/month (family income ceiling accepted by the program in income bracket 1 in 2013) reachable by a public transportation trip of between 30 and 60 minutes;12 as no information was available in Uberlândia on the duration of public transportation commutes, a period of up to fifteen minutes by car was used; and ii) the percentage of accessible jobs as described above in proportion to the total number of registered jobs in each municipality with wages of up to R$ 1,600/month in 2013.
Commuting times to employer firms were calculated through the Google Maps webtool. Tentative isochrones (lines along which commute times are the same) were created that correspond to each of the commute durations adopted, from each housing project. The number of companies in each of the isochrones was then calculated and, through cross-referencing these figures with the database on employees and their wages, the number of jobs was obtained. These analyses were conducted in Rio de Janeiro, as the two housing complexes under analysis are located in very different intra-urban contexts, and also for Uberlândia, in order to obtain a diagnosis for a mid-sized city (or regional hub) that could be compared with the figures for a metropolis.
3 CASE STUDIES: MAIN FILDINGS AND ANALYSES
3.1 Characterization of housing complexes studies
3.1.1 Rio de Janeiro
Located around eight kilometers from the CBD and the history-rich center of Rio de Janeiro, the Bairro Carioca housing project, also known as “Triagem,” is located alongside train and metro lines that connect at the station with the same name. The development’s surrounding area is also served by several regular bus lines, ensuring good public transportation. This development was designed to house families liv-ing in high-risk areas in several different parts of Rio, together with other families that meet the criteria of MCMV income bracket 1 approval process.13 The 2,240
12. These commuting times correspond to those used for Indicators 4 and 5 respectively. In addition to using the same indicator parameters as the Urban Insertion Assessment Tool, attempts were also made to ensure compatibility with information drawn from the National Household Sampling Survey (Pnad, IBGE). 13. The selection process for bracket 1 families is based on nationwide criteria that include monthly family income levels as a priority for families living in high-risk areas, families headed by women and families of people with special needs. In addition to meeting these criteria, families must be registered with municipal governments and comply with local requirements, after which their names are entered for a random draw. Beneficiaries may not choose the locations of their future homes.
Urban Insertion of Government Housing Projects: everyday mobility and land use | 267
housing units are built on a tract of land covering 12.2 hectares and is expected to house 8,896 residents. Furthermore, the Bairro Carioca project was designed as a development with complementary uses, including a market, restaurant, drugstore, beauty salon, day-care center, fitness center, health clinic and primary school, in addition to an educational community center (Nave de Conhecimento) equipped with a laboratory, an auditorium and a library.
Built in a greenfield area and located on the Estrada dos Palmares in Santa Cruz, in Western Zone of Rio de Janeiro, the six apartment blocks forming the Jesuítas is one of the most remote housing project of the MCMV program in the city. The development is six kilometers from the center of Santa Cruz, which is in turn some fifty kilometers from downtown Rio, 46 kilometers from the South Zone and 33 kilometers from Barra da Tijuca. The Santa Cruz district lies at the end of Avenida Brasil, the main highway running between the North Zone and West Zone, alongside the terminals of two (respectively) medium and high capacity public transportation systems (Transoeste Bus Rapid Transit system and the Supervia urban train network). The West Zone – where this development is located – is a low-income region with high unemployment and poor public util-ity services.14 Since 2009, Santa Cruz has been on the cutting edge of the urban frontier, where rural landscapes are shrinking and new property developments rub shoulders with small ramshackle farms.
Once completed, the six apartment blocks at Jesuítas will offer 2,718 units that are expected to house around 10,000 people. These apartment blocks are clas-sified by the origins of the families who will live in them: three will house families moved from favelas and high-risk areas, while the other three will be set aside for families completing the standard MCMV process. Two apartment blocks were selected for the field survey because of possible differences in perceptions among their residents: Cascais, whose residents completed the standard MCMV process, and Coimbra, families from slums and high-risk areas.
When it was inaugurated in April 2012, the area around this development offered no commerce, services or other urban amenities. When the survey of its residents was conducted in April 2014, the researchers noted that small informal commerce had appeared in the development, as well as a public school and health clinic were constructed on the Estrada Palmares, some 500 meters away from the closest apartment block.
14. Among the 126 districts in Rio de Janeiro, Santa Cruz ranked 119th by the Human Development Index (HDI) in 2010.
City and Movement: mobilities and interactions in urban development268 |
3.1.2 São Paulo
The Residencial Iguape housing project is located in the Itaquera district in the West Zone of São Paulo some 22 kilometers from the Avenida Berrini and around 15 kilometers from the Praça da Sé, which are the two main city’s hubs. Located in a relatively well consolidated area, this project is endowed with good public transportation, including several bus lines and fast access to the metro. Inaugurated in January 2013 with 300 units, it is expected to house 1,200 income bracket 1 residents selected through the standard MCMV process. In addition to relatively good public transportation, the surrounding area also offers plenty of commerce and other amenities.
Located in the Sapopemba district, also in the West Zone of São Paulo15 and inaugurated in 2011, the Residencial São Roque was one of the first MCMV income bracket 1 buildings in this municipality, located some 19 kilometers from the Avenida Berrini and around 15 kilometers from the Praça da Sé. Similar to the Iguape project, São Roque is also relatively well served in terms of transportation options travelling towards major city’s hubs.
Of the 300 units delivered, 158 units were intended for residents in high-risk ar-eas, with the remainder allocated to families completing the standard MCMV process.
3.1.3 Uberlândia
Located in the East Sector of Uberlândia, the Loteamento Jardim Sucupira subdi-vision is part of a residential district (Bairro Residencial Integração), together with three other subdivisions, accessed from the Rodovia BR-452 highway running between Uberlândia and Araxá, 7.5 kilometers from the city center in the Praça Tubal Vilela square. This subdivision was approved by the city Council in 2004, with part of it included in the Special Social Interest Zone in 2011, where 270 single-family units were built, each covering 38.02 m2, handed over in 2011 to families completing the standard MCMV process.
This subdivision includes a public primary school, two kindergartens, a family health clinic, a prison and a re-educational detention center for young offenders. Commuters catch buses to downtown areas through a centralized distribution system with five integration terminals (Central, Umuarama, Planalto, Santa Luzia and Industrial District) where these lines are integrated, redistributing the flow. The residents of Jardim Sucupira have only a single bus line with three stops along a route ending at the Central Terminal, and the remaining two lines serving this subdivision are some two kilometers away from the development.
15. Data released by the IBGE in 2000 showed that, according to the HDI, Sapopemba ranked 78th among the 96 districts in São Paulo.
Urban Insertion of Government Housing Projects: everyday mobility and land use | 269
3.2 Field survey findings16
This section presents analyses of the behavior of the variables researched in the field that together lead to the conclusion that the appropriation of the city takes place in different ways among the developments examined. Important reasons for these differences, include the location of these homes and the characteristics of the commutes (means of transportation, costs, duration etc.) undertaken by their residents.
3.2.1 Exploring resident profiles
An examination of the social and economic characteristics of people living in the developments under study reveals similarities derived from the people’s positions in society, regardless of the city where they actually reside. On the other hand, there are exceptional situations that also warrant closer attention.
Starting with the age of the residents, a comparison presents a relatively even distribution: in all the complexes, the largest group consisted of adults (45% to 63%), followed by children, adolescents and finally the elderly. However, most residents are at active ages, indicating that they are deeply involved in activities outside the home, triggering greater demands for transportation than children and the elderly (Vasconcellos, 2005).
In terms of these activities, the complexes presented relatively similar per-centages of residents working or studying during the previous thirty days: 63% to 78%. These data show that most residents at active ages are actually studying or working and therefore need to access their places of work or study every weekday.
In terms of their income, the data reflect similarities among the developments, confirming that the vast majority (between 80% and 90%) of residents in the case studies in Rio de Janeiro and São Paulo were in fact encompassed by MCMV income bracket 1, consisting largely of people with incomes of up to 3 minimum wages (MW). These data show that most of these housing units have been allocated to families qualifying under the income ceiling established by the MCMV program for these developments. Furthermore, this also reflects a financial situation where variations in transportation and housing costs have significant impact on family budgets. However, two somewhat different situations must be stressed: at Iguape, 53% of the residents stated that they had no incomes, due to the high proportion of students and schoolchildren in the sample, while there was a large contingent (around 45%) of residents earning more than three minimum wages at Sucupira, with no homes without incomes at this development in Uberlândia.
16. The full reports on the analyses briefly presented here are available in the Ipea Discussion Paper.
City and Movement: mobilities and interactions in urban development270 |
3.2.2 Vehicle ownership and commuting to work
Although the population is relatively homogenous in terms of income at all four developments in Rio de Janeiro and São Paulo, the percentage of people owning cars varied significantly (between 4.5% and 44% of the residents). A comparison among the housing complexes shows that the motorization rate in São Paulo is higher for these residents than their counterparts in Rio de Janeiro. Meanwhile, the motorization rate is even higher in Uberlândia, at around 70%. The Bairro Carioca and Coimbra apartment block of Jesuítas (Rio de Janeiro), whose residents were people moved from high-risk areas and informal settlements presented the lowest motorization rates (4.5% and 11% respectively). The proportions of families completing the formal MCMV se-lection process were higher, with the current motorization rate keeping pace. This indicates the possibility of a link between previous housing conditions and vehicle ownership. Notably, the data did not indicate any clear links between income and vehicle ownership.
Most of the residents of these developments used public transportation and walking to travel to and from work. Except for the São Roque development, where there was no variation in the types of transportation used after moving into the housing units provided by the MCMV Program, for all the other case studies, it became apparent that their residents made less use of active transportation options (walking or cycling), using motorized options more frequently. People living in the Bairro Carioca, Jesuítas and Iguape complexes began to use public transportation more frequently, with a significant increase in higher-capacity options (metro, train and BRT). However, individual transportation increased the most at Sucupira, particularly cars. It is worthwhile noting here that there are no trains or metros in Uberlândia; other explanations may include infrequent bus services and roads that discourage cyclists, with tricky highway crossings. The use of private motorized vehicles (motorcycles and automobiles) did not drop in any of the cases, with increased car use at the Bairro Carioca and Iguape developments, despite being ranked as the best located in terms of easy access to public transportation.
An examination of the locations of these developments in their respective cities suggests that the shift towards motorized transportation options is prompted mainly by longer distances between these new homes and employment centers.
3.2.3 Commuting times to and from work
Moving into the homes provided through the MCMV Program had quite differ-ent effects on the municipalities under analysis in terms of commuting times to and from work.
Urban Insertion of Government Housing Projects: everyday mobility and land use | 271
Residents living in the São Paulo complexes actually gained time through shorter commutes; the mean travel times to work each day shrank by 8% at Iguape and 12% at São Roque, which is compatible with their location in well-consolidated areas with reasonable supplies of commerce and services as well as access to public transportation. These findings indicate potentially positive progress in the quality of life of these residents, with more time to devote to other activities.
Two quite different results were found for the developments in Rio de Janeiro, also due to their location. At Jesuítas, there was a 39% increase in mean daily com-mutes to work related to the logic of a housing-only project on the outskirts of the city, in an area that is still growing, and disconnected from commerce, services and other amenities. Commuting times remained unchanged in Bairro Carioca, due largely to the fact that many of these residents were resettled from areas relatively close to their new homes, with good supplies of services and transportation options available in close proximity of the new development.
The duration of daily commutes rose by around 11% at Sucupira. Although far closer to the center of Uberlândia than the distance between the Jesuítas complex and main hubs of Rio de Janeiro, the two developments shared some characteristics: poor connections between these two projects and public transportation options, in addition to locations.
Reports from residents indicated that most people moving into these new complexes were informal workers, mainly in the civil construction and services segments, and changed jobs when they arrived. Within this context, people living in the Jesuítas homes face greater difficulties in finding work, due to the development’s location in a less consolidated area. This information requires further investigation because – as the job accessibility analyses indicate (see section 3.4) – this suggests that location is an extremely important factor, as people living in more remote projects with unconsolidated surroundings are more severely affected in terms of access to formal and informal jobs.
3.2.4 Alterations to transportation and housing outlays
Moving into their new homes resulted in higher mean transportation costs for the residents of all the MCMV projects, with diverse effects on housing outlays.
The sharpest increase in transportation costs occurred at the Jesuítas develop-ment, up 156% after moving in, followed by 89% at Sucupira, 31% at Iguape, 11% at Bairro Carioca and 1% at São Roque. These figures are directly related to a shift from active transportation to motorized options that are more expensive, with adverse impacts arising from the implementation logic of these developments, which sought lower land acquisition costs by opting for cheaper properties in outlying urban areas.
City and Movement: mobilities and interactions in urban development272 |
Housing costs varied widely, dropping in São Paulo but rising in Rio de Janeiro and Uberlândia, after moving into the MCMV housing units. The Bairro Carioca is particularly noteworthy with the highest increase (up 139%), followed by Jesuítas (51%) and Sucupira (12%). The increase in housing costs in Rio de Janeiro occurred because some of the beneficiary families came from self-built homes in informal settlements where they paid no monthly maintenance fees or utility bills for water and electricity, now having to bear these costs in the MCMV units. Despite its remote location, the absolute value of the mean housing costs in the Jesuítas complex is 38% higher than in the Bairro Carioca.17
In contrast, the developments analyzed in São Paulo posted a steady drop in housing costs, down 10% at São Roque and 24% at Iguape, largely because most of their residents were previously living in rented apartments. Consequently, moving into these new housing units at subsidized prices resulted in lower outlays for these families.
3.2.5 The proportion of transportation and housing expenses in the family budgets of residents
The impacts of alterations to transportation and housing expenditures on family budgets varied widely, depending on the project. Bearing in mind the benefits gained in terms of access to formal housing and looking ahead to the proportion of transportation and housing outlays relative to overall family budgets, moving into these MCMV houses was not a positive step only for the Jesuítas residents, whose family expenses increased for transportation (+14%) and housing (+11%). For people living in the other developments, there were few changes in the proportion of transportation costs for family budgets, while housing expenditures fell for the residents of São Roque and Iguape, they rose at Bairro Carioca because residents there had previously lower costs when living in informal settlements.
However, this analysis changed when comparing the proportion of these outlays in a combined transportation and housing costs index that stipulates that the sum of these outlays should not exceed 45% of family budgets, based on a 30% ceiling for housing and 15% for transportation.18 While the mean figures for the Bairro Carioca and Iguape complexes remained below the stipulated ceil-ings for the aggregate index, reflecting the separate figures for the housing and transportation components, the sharp increase in transportation costs for people living in the Jesuítas project, and persistently high housing costs for the residents
17. A possible explanation for these higher costs would be higher monthly condominium fees paid by residents of the Jesuítas complex; this information was not available and requires further investigation.18. This index was drawn up by the Center for Neighborhood Technology (CNT), with a 45% ceiling usually adopted in the United States. For the Bairro Carioca, we assume that this move was positive despite higher costs, as transportation and housing outlays together remained at the ceiling of 45%.
Urban Insertion of Government Housing Projects: everyday mobility and land use | 273
of São Roque resulted in index values higher than the recommended levels. At Sucupira, the overall index remained higher than recommended both before and after moving between homes, with these outlays distributed differently: higher transportation costs and lower expenditures on housing.
3.2.6 Satisfaction with new homes
At all the developments, most (56% to 75%) residents stated that they preferred their new locations. An analysis of the reasons behind this preference showed that access to formal land with ownership titles and greater safety and security were the factors mentioned most frequently, indicating appreciable benefits compared to their previous housing situations. People living in the São Paulo developments also emphasized the central location and easy access to public transportation, indicating an awareness of improvements in these aspects. When asked what could be done to make these house complexes even better, demands for more recreation areas and commerce were particularly noteworthy. At the more remote projects (Jesuítas and Sucupira), residents emphasized the lack of educational facilities, while people living in the two complexes in Rio de Janeiro wanted more public transportation options.
3.2.7 Satisfaction with available transportation options
Perceptions of transportation costs options varied widely by municipality. The residents of the complexes in São Paulo scored these aspects higher, once again indicating a perception of better transportation provision after moving into their new homes. However, an awareness of the need for improvement is apparent at all the projects, in terms of the number of routes and more frequent bus services. Even at the Bairro Carioca – located in an area with several commuter options, including buses, com-muter rail and the metro – residents tend to have negative views on the urban design of the project, feeling that it hampers easy access to transportation and complaining about poor quality pedestrian facilities that are perceived as unsafe and insecure.
3.3 Findings: urban insertion analysis
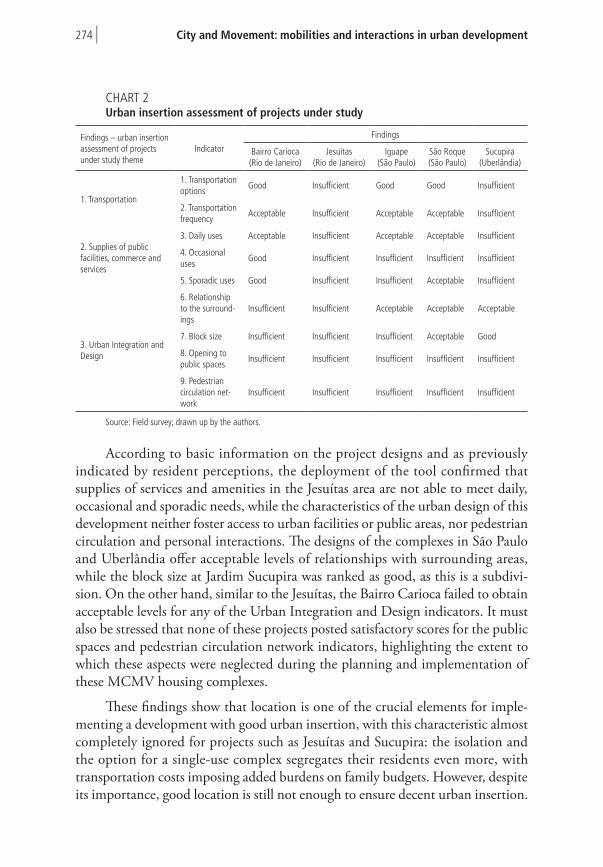
An analysis of these five housing projects by the Urban Insertion Assessment Tool shows that the original designs presented by the property developers would not have been approved at the implementation stage if urban planning aspects related to location, integration with their surroundings and urban design had been assessed in greater depth. The worst case is Jesuítas, where none of the indicators obtained satisfactory scores, followed by Sucupira, with only two indicators rated as sufficient. The others offer good access to transportation facilities, with low scores in terms of integration with their surrounding areas and urban design.
City and Movement: mobilities and interactions in urban development274 |
CHART 2 Urban insertion assessment of projects under study
Findings – urban insertion assessment of projects under study theme
IndicatorFindings
Bairro Carioca(Rio de Janeiro)
Jesuítas(Rio de Janeiro)
Iguape(São Paulo)
São Roque(São Paulo)
Sucupira(Uberlândia)
1. Transportation
1. Transportation options Good Insufficient Good Good Insufficient
2. Transportation frequency Acceptable Insufficient Acceptable Acceptable Insufficient
2. Supplies of public facilities, commerce and services
3. Daily uses Acceptable Insufficient Acceptable Acceptable Insufficient
4. Occasional uses Good Insufficient Insufficient Insufficient Insufficient
5. Sporadic uses Good Insufficient Insufficient Acceptable Insufficient
3. Urban Integration and Design
6. Relationship to the surround-ings
Insufficient Insufficient Acceptable Acceptable Acceptable
7. Block size Insufficient Insufficient Insufficient Acceptable Good
8. Opening to public spaces Insufficient Insufficient Insufficient Insufficient Insufficient
9. Pedestrian circulation net-work
Insufficient Insufficient Insufficient Insufficient Insufficient
Source: Field survey; drawn up by the authors.
According to basic information on the project designs and as previously indicated by resident perceptions, the deployment of the tool confirmed that supplies of services and amenities in the Jesuítas area are not able to meet daily, occasional and sporadic needs, while the characteristics of the urban design of this development neither foster access to urban facilities or public areas, nor pedestrian circulation and personal interactions. The designs of the complexes in São Paulo and Uberlândia offer acceptable levels of relationships with surrounding areas, while the block size at Jardim Sucupira was ranked as good, as this is a subdivi-sion. On the other hand, similar to the Jesuítas, the Bairro Carioca failed to obtain acceptable levels for any of the Urban Integration and Design indicators. It must also be stressed that none of these projects posted satisfactory scores for the public spaces and pedestrian circulation network indicators, highlighting the extent to which these aspects were neglected during the planning and implementation of these MCMV housing complexes.
These findings show that location is one of the crucial elements for imple-menting a development with good urban insertion, with this characteristic almost completely ignored for projects such as Jesuítas and Sucupira: the isolation and the option for a single-use complex segregates their residents even more, with transportation costs imposing added burdens on family budgets. However, despite its importance, good location is still not enough to ensure decent urban insertion.
Urban Insertion of Government Housing Projects: everyday mobility and land use | 275
More specifically, it is crucial to ensure supplies of amenities, commerce and services that can meet the needs of local residents, as well as an urban design foster-ing pedestrian circulation, interactions among people and access to public areas. Assessments of the Bairro Carioca, Iguape and São Roque case studies show that these characteristics were also disregarded, resulting in housing projects that – although well located in terms of transportation – are poorly integrated with their surround-ings. These deficiencies increased the need for commutes and hampered the daily travel of their residents, while also reducing access to facilities, goods and services.
3.4 Findings – analysis of access to formal employment
The researchers analyzed ease of access to formal jobs for both cases in Rio de Janeiro, as well as the Uberlândia project. As expected, there is a striking contrast between the two developments in Rio de Janeiro: in just thirty minutes, Bairro Carioca residents opting for public transportation can reach places clustering 5.31% of total formal jobs (with wages of up to R$ 1,600) in this municipality; a sixty-minute commute takes them to almost half (45.4%) of these jobs available in 2013. A comparison of the Bairro Carioca and Jesuítas cases shows that a thirty-minute commute from the former encompasses 172 times more jobs than can be reached from the latter; and 32 times more jobs in sixty minutes. In Uberlândia – where data on commuting times using public transportation was not available – almost half (46.1%) of the jobs in this municipality in the same wage bracket can be reached within fifteen minutes by private vehicle, with the same length of time needed to reach the city center from the Jardim Sucupira housing project.
4 CLOSING REMARKS
Since its 2009 launch, the MCMV mass housing program has significantly impacted the growth dynamics of Brazilian cities. Although the program receives positive satisfaction ratings from residents, the findings of the case studies examining income bracket 1 housing developments built by the private sector show that their characteristics fail to comply with the best land use and Transportation Oriented Development practices (TOD). This was particularly true in terms of alignment with urban policies, effective responses to location challenges for new develop-ments, access to the city, urban design and integration with their surroundings.
By focusing on everyday mobility, the findings of the survey underscore the idea that providing homes is not just a matter of building houses or apartments, but must also provide access to the resources and opportunities offered by the city, which implies mastering urban insertion and ensuring physical, economic, social and cultural integration with urban fabrics and frameworks. Along these lines, the findings reaffirm that the MCMV program has successfully built houses, while lagging behind in terms of constructing cities (Rolnik, 2012). Moreover, its effects
City and Movement: mobilities and interactions in urban development276 |
on constructed urban contexts indicate that it is reinforcing an urbanization model grounded on expansion with social and spatial segregation, giving rise to a series of costs that impact the society as a whole.
In order to address these challenges, urban insertion principles must be taken into consideration when reviewing the program specifications, including guidelines to ensure: i) that MCMV projects are located in urban areas equipped with infrastructure, offering access to commerce, services and jobs, in order to reverse the trend towards social and spatial segregation; ii) that new developments are located in areas endowed with good quality public transportation, in terms of reliability and regularity, in addition to upgrading public transportation services in areas where MCMV housing developments have already been built; iii) mixed use for new projects and more remote developments that have already been built, making them self-sufficient, with less commuting required; and iv) new projects are designed, and existing developments redesigned, in order to encourage pedestrian and bicycle traffic, thereby fostering more sociable transportation modes.
In addition to these principles, the challenges pinpointed in the analyzed developments highlighted the need for a tool with a set of guidelines and metrics able to measure the quality of urban insertion of new social housing projects. This tool must be able to guide the players in charge of planning and designing new complexes, whether privately-owned corporations or non-profit entities, as well as to provide input for the decision-making processes of the people in charge of approving MCMV projects. The Urban Insertion Assessment Tool developed by the ITDP and LabCidade offers a method for meeting these needs, and its deployment in the five case studies presented in this paper highlights its potential for attaining this goal, particularly considering that it can also include specific indicators for job access.
The Urban Insertion Assessment Tool will also enable actors to challenge the different criteria leading to the implementation of social housing programs and the production of the city. It is important to remember that the prevailing model adopted by the MCMV – grounded on housing units built by private companies – is just one very specific way of dealing with Brazil’s housing deficit. Other ap-proaches – exemplified by self-construction and self-management projects headed up by non-profit organizations with ample grassroots participation – have resulted in projects that are integrated more closely with their surroundings and better adapted to the needs of their beneficiaries.
Within this context, it is vital to explore the potential for promoting the implementation of developments through the MCMV-entities option (focused on self-managed housing production) in order to assess the possibilities for expansion of this model. Furthermore, approaches need not necessarily be limited
Urban Insertion of Government Housing Projects: everyday mobility and land use | 277
to building new housing units with full ownership; although generally associated with higher costs, the use of downtown plots of land and buildings could result in lower spending for governments and users through eliminating or reducing needs for heavy infrastructure construction needed to bring basic utility services to more remote areas. Consideration must also be given to welfare leasing initiatives with subsidized rents that ensure the right to housing without transferring property ownership, a solution that is widely used in Europe and the United States.19
Finally, the urban insertion challenges faced by MCMV projects are also related to the twin targets of this program, which is designed to reduce housing shortages while boosting the economy through the civil construction sector. In practice, the pursuit of these two goals has resulted in the production of large quantities of housing to the detriment of design, location and urban integration, which have all been edged into the background. This is why the use of the assessment tools and implementation method reviews proposed in this paper are crucial to foster the political discussions needed to reevaluate the operation, institutional arrangements and governance of this program. Such a reevaluation is needed in order to make good use of the opportunities to build more harmonious cities in terms of quality of life, urban mobility and development.
REFERENCES
BONDUKI, N. Os pioneiros da habitação social: cem anos de política pública no Brasil. São Paulo: Editora Unesp, 2014. v. 1.
BRASIL. Ministério do Planejamento, Orçamento e Gestão. Pacto da mobilidade urbana investe no transporte. In: CARDOSO, A. (Org.). O programa Minha Casa Minha Vida e seus efeitos territoriais. Rio de Janeiro: Letra Capital, 2013.
______. Pacto da Mobilidade Urbana investe no transporte que brasileiro merece. Brasília: MP, 2014. Available at: <http://www.pac.gov.br/noticia/193f78a6>.
CARDOSO, A. L. (Org.). O Programa Minha Casa Minha Vida e seus efeitos territoriais. Rio de Janeiro: Letra Capital, 2013.
EBC – EMPRESA BRASILEIRA DE COMUNICAÇÃO. Dilma: governo investe R$ 143 bilhões em mobilidade urbana. Brasília: EBC, 2014. Available at: <http://goo.gl/vThDF9>.
MARICATO, E. O impasse da política urbana no Brasil. 2 ed. Petrópolis: Vozes, 2012.
19. References to welfare leasing may be found at <http://goo.gl/zfvMki> and <http://goo.gl/iFTG8S>.
City and Movement: mobilities and interactions in urban development278 |
MARQUES, E.; RODRIGUES, L. O programa Minha Casa Minha Vida na metrópole paulistana: atendimento habitacional e padrões de segregação. Revista Brasileira de Estudos Urbanos e Regionais, v. 15, n. 2, p. 159-177, nov. 2013. Available at: <http://goo.gl/2ZmPC2>. Accessed on: 12 fev. 2015.
PASTERNAK, S.; D’OTTAVIANO, C. Half a century of self-help in Brazil. In: BREDENOORD, J.; LINDERT, P.; SMETS, P. (Eds.). Affordable housing in the urban global South seeking sustainable solutions. London: Routledge, 2014. p. 241-255.
RIO DE JANEIRO. Prefeitura do Rio de Janeiro. Mapa das APs: SMU – legisla-ção bairro a bairro. Rio de Janeiro, 2014. Available at: <http://goo.gl/82EAG4>. Accessed on: 19 fev. 2015.
ROLNIK, R. Ferramenta para avaliação da inserção urbana dos empreendimen-tos do Minha Casa, Minha Vida. 2012. Available at: <http://goo.gl/99YVXK>. Accessed on: 12 fev. 2015.
SANTOS, A. M. S. P.; MEDEIROS, M. G. P.; LUFT, R. M. Direito à moradia: um direito social em construção no Brasil – A experiência do aluguel social no Rio de Janeiro. In: SEMINÁRIO INTERNACIONAL RI II, 13. Salvador, 2014. Available at: <http://goo.gl/ZWcl78>.
VASCONCELLOS, E. A cidade, o transporte e o trânsito. São Paulo: Pró Livros, 2005.
COMPLEMENTARY BIBLIOGRAPHY
BRASIL. Governo Federal. Lançamento do programa Minha Casa Minha Vida 2. Brasília, 2011. Available at: <http://goo.gl/KqXMJj>. Accessed on: 19 fev. 2015.
BRASIL. Lei no 12.424, de 16 de junho de 2011. Altera a Lei no 11.977, de 7 de julho de 2009, que dispõe sobre o Programa Minha Casa, Minha Vida (PMCMV) e a regularização fundiária de assentamentos localizados em áreas urbanas, as Leis nos 10.188, de 12 de fevereiro de 2001, 6.015, de 31 de dezembro de 1973, 6.766, de 19 de dezembro de 1979, 4.591, de 16 de dezembro de 1964, 8.212, de 24 de julho de 1991, e 10.406, de 10 de janeiro de 2002 – Código Civil; revoga dis-positivos da Medida Provisória no 2.197-43, de 24 de agosto de 2001; e dá outras providências. Diário Oficial da União, Brasília, 2011. Available at: <http://goo.gl/NksjVs>. Accessed on: 19 fev. 2015.
BRASIL. Ministério das Cidades. Portaria no 168, de 12 de abril de 2013. Diário Oficial da União, Brasília, 15 abr. 2013. Seção 1. Available at: <http://goo.gl/1CoZac>. Accessed on: 19 fev. 2015.
Urban Insertion of Government Housing Projects: everyday mobility and land use | 279
CEF – CAIXA ECONÔMICA FEDERAL. Programa Minha Casa, Minha Vida – Entidades, 2012.
CARDOSO, A. et al. Quando um direito vira produto: impactos do programa Minha Casa Minha Vida na cidade do Rio de Janeiro. In: SIMPÓSIO NACIONAL DE GEOGRAFIA URBANA – SIMPURB, 13., 2013. Available at: <http://goo.gl/BmXuxN> Accessed on: 19 fev. 2015.
CARRANO, P.; HOSHINO, T. Nosso déficit não é de casas, é de cidade. Brasil de Fato, 22 out. 2012. Available at: <http://goo.gl/HPLSUU>. Accessed on: 19 fev. 2015.
FAULHABLER, L. Rio Maravilha: práticas, projetos políticos e intervenção no território no início do século XXI. 2012. Monografia (Especialização) – Escola de Arquitetura e Urbanismo, Universidade Federal Fluminense, Rio de Janeiro, 2012.
FJP – FUNDAÇÃO JOÃO PINHEIRO. Déficit habitacional municipal no Brasil. Belo Horizonte: FJP, 2013. Available at: <http://goo.gl/sJVYSN>.
GUEDES, C.; CARVALHO, M. C. L. S. Entrevista com a assessora e coor-denadora-geral dos programas de interesse social na Secretária Municipal de Urbanismo do Rio de Janeiro. Rio de Janeiro, 14 abr. 2014.
HOOK, W. Urban transport and the millennium development goals. Global Urban Development Magazine, 2006. Available at: <https://goo.gl/cQK4KW>. Accessed on: 19 fev. 2015.
LONARDONI, F. et al. Scaling-up affordable housing supply in Brazil. Nairobi: Un Habitat, 2013.
CGPU – COORDENADORIA GERAL DE PLANEJAMENTO URBANO. Mapa de empreendimentos com concessão de habita-se e licenciados, área prioritária para AP5 do programa Minha Casa Minha Vida, principais eixos viários e de transporte. Rio de Janeiro: CGPU, abr. 2013. Available at: <http://goo.gl/aFsxad>. Accessed on: 19 fev. 2015.
MARINIS, A. Housing boom finds 190 million new customers. Bloomberg News, New York, 29 July 2009.
MCGUIRK, J. Radical cities: across Latin America in search of a new architecture. London: Verso, 2014.
OBSERVATÓRIO DAS METRÓPOLES. Acessibilidade do PMCMV no Rio de Janeiro. Rio de Janeiro, 22 nov. 2012. Available at: <http://goo.gl/jgwxiS>. Accessed on: 19 fev. 2015.
______. Evolução da frota de automóveis e motos no Brasil, 2001-2012. Rio de Janeiro, 2013. Available at: <http://goo.gl/UUckAM>. Accessed on: 19 fev. 2015.
City and Movement: mobilities and interactions in urban development280 |
RIO DE JANEIRO. Decreto no 33.310, de 21 de dezembro de 2010. Rio de Janeiro, 2010. Available at: <http://goo.gl/Yi0Zu2>. Accessed on: 19 fev. 2015.
ROLNIK, R.; NAKANO, K. As armadilhas do pacote habitacional. Le Monde Diplomatique Brasil, 5 mar. 2009.
WHITAKER, J. 41 prédios para habitação social no centro? Ótima iniciativa, mas tem que ter algo mais. Cidade para que(m)? São Paulo, 30 jun. 2014. Available at: <http://goo.gl/7CfO2c>. Accessed on: 19 fev. 2015.
Urban Insertion of Government Housing Projects: everyday mobility and land use | 281
ANNE
XES
6.1
Que
stio
nnai
re u
sed
for s
urve
y of
resi
dent
s Ap
pend
ed to
the
pape
r
Pesq
uisa
Lin
coln
Inst
itute
for L
and
Polic
y e
Fund
ação
For
d
O P
rogr
ama
Min
ha C
asa
Min
ha V
ida
e a
Mob
ilida
de U
rban
aRi
o de
Jane
iro e
São
Pau
lo
QUE
STIO
NÁR
IO C
OM
PO
PULA
ÇÃO
Entr
evis
tado
r:___
____
____
____
____
____
____
____
____
____
____
____
____
____
____
_ N
úmer
o do
Que
stio
nário
: ___
____
__
IDEN
TIFI
CAÇÃ
O
Nom
e do
em
pree
ndim
ento
:
Apar
tam
ento
:
B
loco
:
Nom
e do
Ent
revis
tado
: Da
ta d
a en
trevis
ta:
Mor
ador
reas
sent
ado/
deslo
cado
da
área
(nom
e):
Horá
rio d
e in
ício:
Data
da
mud
ança
da
fam
ília p
ara
o im
óvel
(mês
/ano
):Ho
rário
de
térm
ino:
City and Movement: mobilities and interactions in urban development282 |
I – C
OM
POSI
ÇÃO
FAM
ILIA
R1.
Qua
dro:
com
posiç
ão fa
mili
ar
1.1
Prim
eiro
nom
e1.
2Po
sição
fam
iliar
1.3
Sexo
1.4
Idad
e1.
5Es
tado
civil
1.6
Traba
lha
atua
lmen
te1.
7Po
ssui
alg
uma
defic
iênc
ia
1 2 3 4 5 6 7 8
Lege
nda
Posiç
ão fa
milia
r
1. C
hefe
2. C
ônju
ge3.
Filh
o(a)
4. E
ntea
do(a
)5.
Net
o6.
Pai
/mãe
7. S
ogro
(a)
8. Ir
mão
(ã)
9. O
utro
par
ente
10. A
greg
ado
Sexo
1. M
2. F
Idad
e
Núm
ero de
ano
s ou
mes
es
Esta
do ci
vil
1. S
olte
iro2.
Cas
ado
3.Di
vorc
iado
4. V
iúvo
5. U
nião
cons
ensu
al
Traba
lha
atua
lmen
te
1. S
im2.
Não
Pess
oa co
m d
eficiê
ncia
2. N
ão3.
Mot
ora
4. C
adei
rant
e5.
Men
tal
6. V
isual
7. A
uditi
vo8.
Mud
ez9.
Múl
tipla
Urban Insertion of Government Housing Projects: everyday mobility and land use | 283
II. T
RABA
LHO,
EST
UDO,
REN
DA E
TRA
NSP
ORT
E2.
Qua
dro:
trab
alho
, est
udo
e tra
nspo
rte [U
SP/In
stitu
to d
e Pe
squi
sa e
Pla
neja
men
to U
rban
o e
Regi
onal
(IPP
UR)/I
TDP]
Prim
eiro
nom
e(tr
ansc
reva
os
nom
es d
o qu
adro
an
terio
r na
mes
ma
sequ
ência
)
2.1
Traba
lhou
/es
tudo
u
nos
últim
ostri
nta
dias
?
2.2
Ocup
ação
(ativ
idad
e pr
incip
al)
2.3
Loca
l ond
e ex
er-
ce o
cupa
ção/
tra
balh
o(L
EIA
AS A
LTER
-NA
TIVA
S)
2.4
A es
cola
/trab
alho
es
tá si
tuad
a(o)
on
de:
(LEI
A AS
ALT
ER-
NATI
VAS)
2.5
Mei
o e
tem
po d
e tra
nspo
rte –
Cas
a At
ual
2.6
Mei
o e
tem
po d
e tra
nspo
rte –
Cas
a An
terio
r
2.5.
1M
eio
de tr
ans-
porte
usa
do
no p
rincip
al
deslo
cam
ento
at
é es
cola
/tra
balh
o
2.5.
2M
eio
utiliz
ado
para
cheg
ar
ao p
rincip
al
deslo
cam
ento
2.5.
3Te
mpo
méd
io
do p
rincip
al
deslo
cam
ento
(só
ida)
2.5.
4Te
mpo
gas
to
para
cheg
ar
ao p
rincip
al
deslo
cam
ento
(só
ida)
2.5.
5Te
mpo
tota
l de
deslo
cam
ento
de
casa
até
o lo
cal
de tr
abal
ho/
estu
do(só
ida)
2.6.
1M
eio
de tr
ans-
porte
usa
do
no p
rincip
al
deslo
cam
ento
at
é es
cola
/tra
balh
o (R
M)
2.6.
2M
eio
utiliz
ado
para
cheg
ar
ao p
rincip
al
deslo
cam
ento
2.6.
3Te
mpo
méd
io
do p
rincip
al
deslo
cam
ento
(só
ida)
2.6.
4Te
mpo
gas
to
para
cheg
ar
ao p
rincip
al
deslo
cam
ento
(só
ida)
2.6.
5Te
mpo
tota
l de
deslo
cam
ento
de
casa
até
o lo
cal
de tr
abal
ho/
estu
do(só
ida)
1 2 3 4 5 6 7 8
Lege
nda
para
pre
ench
imen
to
Ocup
ação
(ativ
idad
e pr
incip
al)
Loca
l ond
e ex
erce
oc
upaç
ão/tr
abal
hoA
esco
la o
nde
estu
da
está
situ
ada:
Mei
o de
tran
spor
teTe
mpo
méd
io d
e de
sloca
men
to(p
ara
a es
cola
)Te
mpo
gas
to p
ara
cheg
ar a
o pr
incip
al
deslo
cam
ento
(cas
a- e
scol
a-ca
sa)
CÓDI
GOS
PARA
TODO
O
QUES
TION
ÁRIO
Desc
reva
a a
tivid
ade
ou 99. N
ão se
apl
ica
1. N
o do
micí
lio2
.No
bairr
o3
.Out
ro b
airro
QUAL
?
4. O
utro
mun
icípi
o
1. N
o ba
irro
2. O
utro
bai
rro
QUAL
?
3. O
utro
Mun
icípi
o
(Aqu
ele
em q
ue re
aliza
a m
aior
par
te d
o pe
rcur
so,
em te
rmo
de d
istân
cia)
1.Ôn
ibus
com
um2.
BRT
/cor
redo
r exc
lusiv
o3.
Met
rô4.
Trem
9. B
icicle
ta5.
Van
/Kom
bi 1
0. Tr
ansp
orte
esc
olar
púb
lico
6. A
pé
11. T
rans
porte
esc
olar
priv
ado
7. C
arro
12.
Mot
otáx
i8.
Mot
o 13
. Out
ros
PREE
NCHE
R NA
TABE
LA D
IRET
AMEN
-TE
O V
ALOR
COM
O IN
FORM
ADO
PELO
EN
TREV
ISTA
DO
(CÓD
IGOS
ABA
IXO
APEN
AS P
ARA
TABU
LAÇÃ
O)1.
Até
trin
ta m
inut
os.
2. D
e 30
a 4
5 m
inut
os.
3. D
e 45
min
utos
a u
ma
hora
.4.
De
uma
hora
a u
ma
hora
e m
eia.
5. D
e um
a ho
ra e
mei
a a
duas
hor
as.
6. M
ais d
e du
as h
oras
.
PREE
NCHE
R NA
TABE
LA D
IRET
AMEN
TE
O VA
LOR
COM
O IN
FORM
ADO
PELO
EN
TREV
ISTA
DO
(CÓD
IGOS
ABA
IXO
APEN
AS P
ARA
TABU
LAÇÃ
O)1.
Até
qui
nze
min
utos
.2.
De
quin
ze a
trin
ta m
inut
os.
3. D
e 30
a 4
5 m
inut
os.
4. D
e 45
min
utos
a u
ma
hora
.5.
Mai
s de
uma
hora
.
1. S
IM2.
NÃO
99. N
ÃO S
E AP
LICA.
00. N
ÃO S
ABE
N.R.
qua
ndo
o en
trevis
tado
nã
o re
spon
deu
City and Movement: mobilities and interactions in urban development284 |
3. Q
uadr
o: tr
ansp
orte
e re
nda
[USP
/IPPU
R/IT
DP]
Prim
eiro
nom
e(tr
ansc
reva
os n
omes
do
quad
ro
ante
rior n
a m
esm
a se
quên
cia)
3.1
Qual
a d
espe
sa co
m tr
ansp
orte
(cus
to d
iário
, cas
a- e
scol
a/tra
balh
o-ca
sa
inclu
indo
tran
spor
te se
cund
ário
e tr
ansfe
rênc
ias)
3.3
Quan
tas v
ezes
por
se
man
a re
aliza
es
sa v
iage
m?
3.4.
Bilh
ete
único
3.5
Rend
a m
ensa
l (R
$)
3.6
Parti
cipa
de p
rogr
ama
de
trans
ferê
ncia
de
rend
a
3.7
Cust
o m
ensa
l com
mor
adia
par
a a
fam
ília(a
lugu
el, co
ndom
ínio
, pre
staç
ão, c
onta
s)
3.1.
1Da
casa
ant
erio
r pa
ra e
scol
a/tra
balh
o
3.1.
2Da
casa
atu
al
para
esc
ola/
traba
lho
3.7.
1M
orad
ia a
nter
ior
3.7.
2M
orad
ia a
tual
1 2 3 4 5 6 7 8
Lege
nda
para
pre
ench
imen
to
Desp
esa
com
tran
spor
te
(cus
to d
iário
)Vi
agen
s por
se
man
aRe
nda
men
sal (
R$)
(não
inclu
ir tra
nsfe
rênc
ia d
e re
nda)
Parti
cipa
de a
lgum
pro
gram
a de
tran
sferê
ncia
de
rend
a?Cu
sto
men
sal c
om m
orad
ia(a
lugu
el, co
ndom
ínio
, pre
staç
ão, c
onta
s)CÓ
DIGO
S PA
RA TO
DO O
QUE
S-TI
ONÁR
IORJ
SP
R$__
_1.
Um
a2.
Dua
s3.
Três
4. Q
uatro
5. C
inco
6. S
eis
7. S
ete
R$__
___
1. N
ão2.
Bol
sa Fa
milia
3. R
enda
Mel
hor
4.Ou
tra__
____
____
____
_
1. N
ão2.
Bol
sa Fa
milia
3. R
enda
Cid
adã
4.Ou
tra__
____
____
____
_
R$__
_1.
SIM
2. N
ÃO99
. NÃO
SE
APLIC
A.00
. NÃO
SAB
EN.
R. q
uand
o o
entre
vista
do n
ão
resp
onde
u
Urban Insertion of Government Housing Projects: everyday mobility and land use | 285
4. A
lgué
m d
a fa
míli
a po
ssui
out
ra d
eman
da d
e de
sloca
men
to a
lém
do
traba
lho?
{IP
PUR}
Prim
eiro
nom
eAt
ivida
deLo
cal o
nde
exer
ce a
ativ
idad
e:M
eio
de tr
ansp
orte
Bilh
ete
Único
Tem
po m
édio
de
deslo
cam
ento
Ida
Volta
Lege
nda
para
pre
ench
imen
to
Loca
l ond
e ex
erce
a a
tivid
ade
Mei
o de
tran
spor
teCÓ
DIGO
S PA
RA TO
DO O
QUE
STIO
NÁRI
O
1. N
o do
micí
lio2
.No
bairr
o3
.Out
ro b
airro
QUAL
?
4. O
utro
mun
icípi
o
(Aqu
ele
em q
ue re
aliza
a m
aior
par
te d
o pe
rcur
so, e
m te
rmo
de d
istân
cia)
1. Ô
nibu
s com
um2.
BRT
/ co
rredo
r exc
lusiv
o3.
Met
rô4.
Trem
5. V
an/k
ombi
6. A
pé
7. C
arro
8. M
oto
9.Bi
cicle
ta10
. Tra
nspo
rte e
scol
ar p
úblic
o11
. Tra
nspo
rte e
scol
ar p
rivad
o12
. Mot
otáx
i13
. Out
ros
1. S
IM2.
NÃO
99. N
ÃO S
E AP
LICA.
00. N
ÃO S
ABE
5. S
e o
deslo
cam
ento
secu
ndár
io é
feito
a p
é ou
de
bicic
leta
: [IT
DP]
5.1.
Há
cam
inho
s con
fortá
veis
e se
guro
s par
a o
traje
to a
pé
entre
o c
ondo
mín
io e
a e
staç
ão/p
onto
do
trans
porte
prin
cipal
? (a
pena
s se
resp
onde
u 6
no it
em 2
.5.2
)
City and Movement: mobilities and interactions in urban development286 |
1. S
im
2. N
ão
5.2.
Há
vias
con
fortá
veis
e se
gura
s par
a o
traje
to d
e bi
cicle
ta e
ntre
o c
ondo
mín
io e
a e
staç
ão/p
onto
do
trans
porte
prin
cipal
? (a
pena
s se
resp
onde
u 9
no it
em 2
.5.2
)
1. S
im
2. N
ão
5.3.
Há
bicic
letá
rios s
egur
os e
sufic
ient
es p
ara
guar
dar a
bici
cleta
pró
xim
o à
esta
ção/
pont
o do
tran
spor
te p
rincip
al?
(ape
nas s
e re
spon
deu
9 no
item
2.
5.2)
1. S
im
2. N
ão
6. A
mud
ança
de
ende
reço
influ
encio
u a
rotin
a de
alg
um m
embr
o da
fam
ília
no te
mpo
e c
usto
s com
tran
spor
tes?
[USP
]
16.1
Prim
eiro
nom
e16
.2 Te
mpo
de
deslo
cam
ento
(cas
a-tra
balh
o-ca
sa) (
IDA
E VO
LTA)
16.3
Cus
tos c
om tr
ansp
orte
s(c
oloc
ar o
valo
r em
reai
s, nã
o a
varia
ção)
1. A
umen
tou
(min
utos
)2.
Dim
inui
u(m
inut
os)
3. N
ão a
ltero
u1.
Aum
ento
u(R
$)2.
Dim
inui
u(R
$)3.
Não
alte
rou
7. P
ossu
i car
ro o
u m
oto?
[ITD
P]
1. S
im q
ual?
___
____
____
____
_ 2.
Não
7.1.
(Se
sim) F
oi a
dqui
rido
ante
s ou
após
a m
udan
ça p
ara
o co
ndom
ínio
? [IT
DP]
1. A
ntes
2.
Apó
s
Urban Insertion of Government Housing Projects: everyday mobility and land use | 287
7.2.
(Se
sim) P
arou
de
utili
zar o
tran
spor
te p
úblic
o? [I
TDP]
1. S
im
2. N
ão
por q
ue?
____
____
____
____
____
____
____
____
____
____
____
____
____
____
____
____
____
____
____
____
____
____
____
____
____
____
8. Q
ual o
tem
po a
prox
imad
o de
esp
era
do tr
ansp
orte
col
etiv
o? [U
SP]
1. A
té q
uinz
e m
inut
os.
2. E
ntre
qui
nze
e tri
nta
min
utos
.
3. D
e tri
nta
min
utos
a u
ma
hora
.
4. M
ais d
e um
a ho
ra.
III. S
EGUR
ANÇA
E T
RAN
SPO
RTE
[ITD
P]
9. Tr
ansp
orte
e se
gura
nça
no tr
ânsit
o [IT
DP]
Cons
ider
ando
a se
gura
nça
do tr
ânsit
o (p
avim
enta
ção
adeq
uada
, sin
aliza
ção,
resp
eito
às l
eis d
e trâ
nsito
e à
vel
ocid
ade,
trein
amen
to d
o m
otor
ista
etc.
), em
um
a es
cala
de
1 a
10 -
onde
1 é
mui
to in
segu
ro e
10
é co
mpl
etam
ente
segu
ro:
9.1.
Com
o vo
cê c
lass
ifica
ria o
nív
el d
e se
gura
nça
do p
ercu
rso
de su
a ca
sa a
té a
est
ação
/pon
to d
o tra
nspo
rte p
rincip
al?_
____
____
9.2.
Com
o vo
cê c
lass
ifica
ria o
nív
el d
e se
gura
nça
do tr
ajet
o fe
ito n
o tra
nspo
rte p
rincip
al?
____
____
_
10. T
rans
porte
e se
gura
nça
pess
oal [
ITDP
]
10.1
. E c
om re
laçã
o à
segu
ranç
a pe
ssoa
l (as
salto
, vio
lênc
ia e
tc.)
com
o vo
cê c
lass
ifica
ria o
nív
el d
e se
gura
nça
do p
ercu
rso
de su
a ca
sa a
té a
est
ação
/po
nto
do tr
ansp
orte
prin
cipal
? __
____
___
City and Movement: mobilities and interactions in urban development288 |
10.2
. E n
o tra
jeto
feito
no
trans
porte
prin
cipal
? __
____
___
IV. U
RBAN
IDAD
E
11. O
seu
bairr
o e/
ou re
gião
é a
tend
ido
pelo
s seg
uint
es ti
pos d
e co
mér
cio e
/ou
serv
iço?
(leia
as a
ltern
ativa
s) [IT
DP]
Serv
iços
Exist
ência
de
Serv
iços
Se a
firm
ativo
Onde
util
iza (s
e é
info
rmal,
info
rmar
)
1. S
im2.
Não
3. N
ão sa
be1.
Util
iza2.
Não
util
izaCo
ndom
ínio
Bairr
o (o
nde)
Outro
bai
rro (q
ual)
1. P
ADAR
IA
2. H
ORTI
FRUT
I
3. A
ÇOUG
UE
4. M
ERCA
DO
5. FA
RMÁC
IA
6. B
ANCO
7. L
OTÉR
ICA
8. C
ARTÓ
RIO
9. F
EIRA
12. H
á op
ções
de
laze
r no
inte
rior d
o em
pree
ndim
ento
ou
no b
airro
? [IT
DP]
a. S
im
b. N
ão
Se si
m,
12.1
. O q
uê?_
____
____
____
____
____
____
____
____
____
____
____
____
____
____
____
____
____
____
____
____
____
____
____
____
____
_
12.2
. Ond
e? a
)inte
rior d
o em
pree
ndim
ento
. b) B
airro
(loc
aliza
ção)
:___
____
____
____
____
____
____
____
____
____
____
____
____
____
____
__
Urban Insertion of Government Housing Projects: everyday mobility and land use | 289
12.3
. Fre
quen
ta?
a. S
im b
. Não
12.4
. Se
não,
por
quê
?___
____
____
____
____
____
____
____
____
____
____
____
____
____
____
____
____
____
____
____
____
____
____
___
V. A
VALI
AÇÃO
DO
MO
RAD
OR
(SAT
ISFA
ÇÃO
)
13. O
que
o sr
.(a) g
osta
ria q
ue ti
vess
e no
con
junt
o ha
bita
ciona
l? [U
SP]
____
____
____
____
____
____
____
____
____
____
____
____
____
____
____
____
____
____
____
____
____
____
____
____
____
____
____
____
__
____
____
____
____
____
____
____
____
____
____
____
____
____
____
____
____
____
____
____
____
____
____
____
____
____
____
____
____
__
14. N
a su
a av
alia
ção,
ess
e co
ndom
ínio
é v
iole
nto/
perig
oso?
[USP
]
1. S
im
2. N
ão
15. O
sr.(a
) con
sider
a qu
e aq
ui é
mai
s vio
lent
o/pe
rigos
o qu
e su
a m
orad
ia a
nter
ior?
[USP
]
1. S
im 2
. Não
16. O
sr.(a
) pre
fere
mor
ar: [
USP]
1. N
a m
orad
ia a
tual
2. N
a m
orad
ia a
nter
ior
Por q
uê?
____
____
____
____
____
____
____
____
____
____
____
____
____
____
____
____
____
____
____
____
____
____
____
____
____
____
17. O
sr.(a
) con
sider
a o
cust
o do
tran
spor
te: [
ITDP
]
a) a
lto b
) raz
oáve
l c
) bai
xo
18. A
s opç
ões d
e tra
nspo
rte a
qui s
ão: [
ITDP
]
City and Movement: mobilities and interactions in urban development290 |
a) b
oas
b) i
nsufi
cient
es
c) m
uito
frac
as
19. N
a su
a av
alia
ção,
o q
ue d
ever
ia m
elho
rar n
o sis
tem
a de
tran
spor
te?
[ITDP
]
____
____
____
____
____
____
____
____
____
____
____
____
____
____
____
____
____
____
____
____
____
____
____
____
____
____
____
____
__
____
____
____
____
____
____
____
____
____
____
____
____
____
____
____
____
____
____
____
____
____
____
____
____
____
____
____
____
__
____
____
____
____
____
____
____
____
____
____
____
____
____
____
____
____
____
____
____
____
____
____
____
____
____
____
____
____
__
____
____
____
____
____
____
____
____
____
____
____
____
____
____
____
____
____
____
____
____
____
____
____
____
____
____
____
____
__
____
____
____
____
____
____
____
____
____
____
____
____
____
____
____
____
____
____
____
____
____
____
____
____
____
____
____
____
__
20. E
ntre
as o
pçõe
s aba
ixo
esco
lha,
em
ord
em d
e im
portâ
ncia
, as t
rês q
ue o
sr.(a
) con
sider
a m
ais n
eces
sária
s par
a a
mel
horia
das
con
diçõ
es d
e tra
ns-
porte
: (m
arca
r 1, 2
e 3
) [IT
DP]
1. R
eduz
ir va
lor d
a pa
ssag
em.
2. M
aior
freq
uênc
ia d
e ôn
ibus
.
3. M
aior
div
ersid
ade
de li
nhas
par
a ac
essa
r loc
ais n
a cid
ade
não
aten
dido
s pel
as a
tuai
s.
4. M
elho
rar i
nteg
raçã
o co
m tr
ansp
orte
de
alta
cap
acid
ade
(met
rô, t
rem
, BRT
).
5. M
elho
rar o
trei
nam
ento
dos
mot
orist
as.
6. C
onst
ruir
corre
dore
s par
a re
duzir
o te
mpo
de
viag
em.
7. C
onst
ruir
ciclo
vias
par
a po
der i
r de
bicic
leta
ao
traba
lho/
esco
la.
8. B
icicle
tário
segu
ro n
as e
staç
ões d
e m
etrô
/trem
/BRT
.
9. To
rnar
o c
amin
ho d
e ca
sa a
o po
nto/
est
ação
mai
s con
fortá
vel e
segu
ro.
Urban Insertion of Government Housing Projects: everyday mobility and land use | 291
VI –
AN
OTAÇ
ÕES
CO
MPL
EMEN
TARE
S__
____
____
____
____
____
____
____
____
____
____
____
____
____
____
____
____
____
____
____
____
____
____
____
____
____
____
____
____
____
____
____
____
____
____
____
____
____
____
____
____
____
____
____
____
____
____
____
____
____
____
____
____
____
____
____
____
__
____
____
____
____
____
____
____
____
____
____
____
____
____
____
____
____
____
____
____
____
____
____
____
____
____
____
____
____
__
____
____
____
____
____
____
____
____
____
____
____
____
____
____
____
____
____
____
____
____
____
____
____
____
____
____
____
____
__
____
____
____
____
____
____
____
____
____
____
____
____
____
____
____
____
____
____
____
____
____
____
____
____
____
____
____
____
__
____
____
____
____
____
____
____
____
____
____
____
____
____
____
____
____
____
____
____
____
____
____
____
____
____
____
____
____
__
____
____
____
____
____
____
____
____
____
____
____
____
____
____
____
____
____
____
____
____
____
____
____
____
____
____
____
____
__
____
____
____
____
____
____
____
____
____
____
____
____
____
____
____
____
____
____
____
____
____
____
____
____
____
____
____
____
__
____
____
____
____
____
____
____
____
____
____
____
____
____
____
____
____
____
____
____
____
____
____
____
____
____
____
____
____
__
____
____
____
____
____
____
____
____
____
____
____
____
____
____
____
____
____
____
____
____
____
____
____
____
____
____
____
____
__
____
____
____
____
____
____
____
____
____
____
____
____
____
____
____
____
____
____
____
____
____
____
____
____
____
____
____
____
__
____
____
____
____
____
____
____
____
____
____
____
____
____
____
____
____
____
____
____
____
____
____
____
____
____
____
____
____
__
____
____
____
____
____
____
____
____
____
____
____
____
____
____
____
____
____
____
____
____
____
____
____
____
____
____
____
____
__
____
____
____
____
____
____
____
____
____
____
____
____
____
____
____
____
____
____
____
____
____
____
____
____
____
____
____
____
__
____
____
____
____
____
____
____
____
____
____
____
____
____
____
____
____
____
____
____
____
____
____
____
____
____
____
____
____
__