Embed Size (px)
Citation preview
1
THE T
OTAL
ECON
OMIC
VALU
E OF U
.S. CO
RAL R
EEFS
U.S. CORAL REEFS
Febr
uary
201
3
THE TOTAL ECONOMIC VALUE OF
A R E V I E W O F T H E L I T E R AT U R E
2
A REV
IEW O
F THE
LITE
RATU
RE
NOTE: This literature review and meta-analysis is a companion document to another report entitled “The Total Economic Value of US Coral Reefs” . This document summarizes valuation studies that were conducted over a ten year period for all US coral reef jurisdictions. This companion document is less technical than the meta-analysis and can be found here: http://coralreef.noaa.gov/Library/Publications/valuesummaryreport.pdf
AUTHORS
Luke Brander and Pieter van Beukering
This report was made possible through funding support from NOAA's Coral Reef Conservation Program.
NOAA Coral Reef Conservation Program. 2013. The Total Economic Value of U.S. Coral Reefs: A Review of the Literature. Silver Spring, MD: NOAA
1
THE T
OTAL
ECON
OMIC
VALU
E OF U
.S. CO
RAL R
EEFS
Contents1. Background...............................................................................................................................2
2. Introduction..............................................................................................................................3
3. Total Economic Value Studies for the United States...................................................4
3.1. American Samoa................................................................................................................4
3.2. Florida....................................................................................................................................6
3.3. Guam......................................................................................................................................6
3.4. Hawaii....................................................................................................................................7
3.5. Puerto Rico...........................................................................................................................9
3.6. Commonwealth of the North Mariana Islands.......................................................9
3.7. United States Virgin Islands.........................................................................................10
3.8. Total Economic Value of US coral reefs....................................................................11
4. Average coral reef values..................................................................................................13
5. Meta-analysis of US coral reef values............................................................................16
6. Discussion and conclusion...............................................................................................20
References..................................................................................................................................... 23
Annex: Policy impacts of the economic valuation studies...........................................26
2
A REV
IEW O
F THE
LITE
RATU
RE
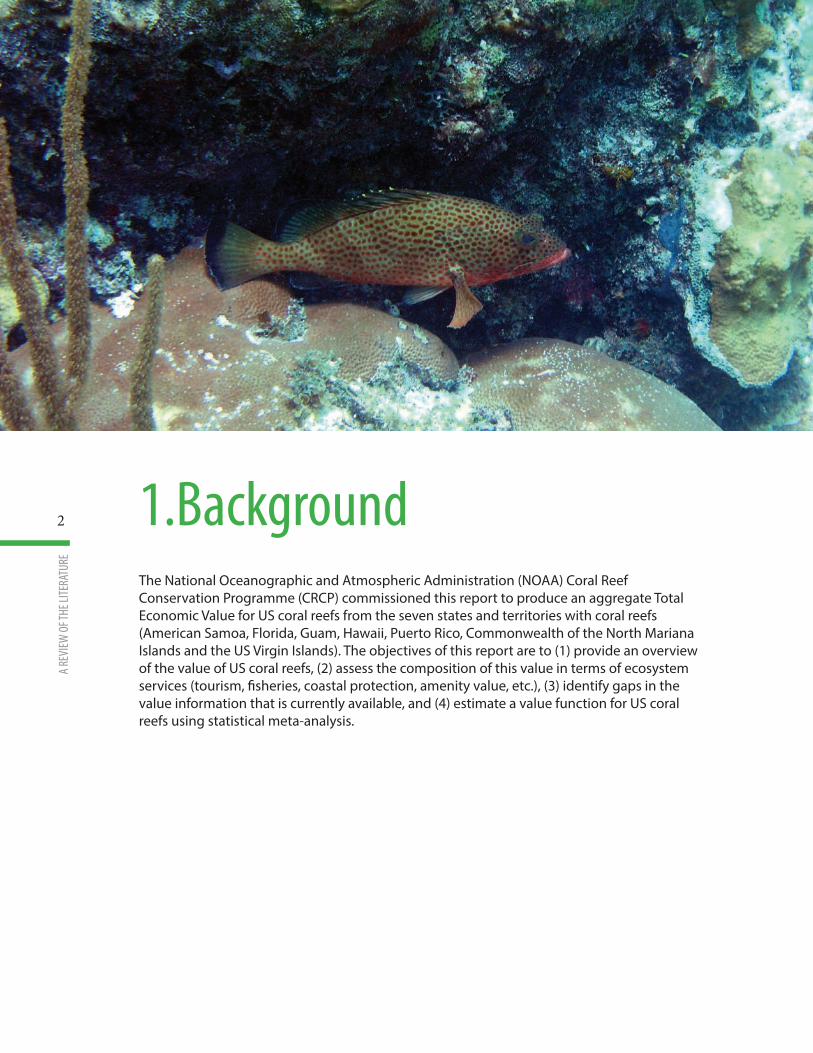
1.BackgroundThe National Oceanographic and Atmospheric Administration (NOAA) Coral Reef Conservation Programme (CRCP) commissioned this report to produce an aggregate Total Economic Value for US coral reefs from the seven states and territories with coral reefs (American Samoa, Florida, Guam, Hawaii, Puerto Rico, Commonwealth of the North Mariana Islands and the US Virgin Islands). The objectives of this report are to (1) provide an overview of the value of US coral reefs, (2) assess the composition of this value in terms of ecosystem services (tourism, fisheries, coastal protection, amenity value, etc.), (3) identify gaps in the value information that is currently available, and (4) estimate a value function for US coral reefs using statistical meta-analysis.
3
THE T
OTAL
ECON
OMIC
VALU
E OF U
.S. CO
RAL R
EEFS
2.IntroductionCoral reefs are highly productive ecosystems that provide a variety of valuable goods and services to humans (UNEP, 2006). These goods and services include recreational opportunities for swimming, diving, snorkelling, and viewing (direct use values); coastal protection and habitat/nursery functions for commercial and recreational fisheries (indirect use values); and the welfare associated with the existence of diverse natural ecosystems (non-use values). Despite the provision of multiple valuable services, tropical marine environments face a number of anthropogenic threats, including non-sustainable fishing practices; sedimentation; pollution and waste; mining and dredging; damaging tourism practices; invasive alien species; climate change related increases in temperature and sea-level (Cesar, 2000); and ocean acidification due to higher concentrations of CO2 in the atmosphere (Veron et al., 2009; Brander et al., 2012). In addition, natural threats such as disease and the occurrence of outbreaks of dominant species (e.g., crown-of-thorns starfish) are compounded by weakened ecosystem functioning (Burke et al, 2011).
Given the range and serious nature of threats to the ecological integrity of coral reefs, there is demand for information on the value of welfare losses associated with a decline in the provision of ecosystem services (Millennium Ecosystem Assessment, 2005). Value information can be used in a number of different policy making contexts including the determination of compensation payments for damage, setting of user fees, cost-benefit analysis of conservation measures, and advocacy regarding the economic importance of functioning marine ecosystems (Van Beukering et al., 2007a). In response to this need for value information there is now a sizable and developing literature on the economic value of ecosystem services from coral reefs (see for example Brander et al., 2007, for a meta-analysis of recreational values; Conservation International, 2008, for an overview of tourism, fisheries, coastal protection and biodiversity values; Laurans et al., 2013, for a review of coral reef valuations in the South Pacific).
Following the completion of the total economic value study for the US Virgin Islands (van Beukering et al., 2011), there are now value estimates for all the US states and territories that contain coral reefs. This is therefore a useful juncture to take stock of the current knowledge on the value of US corals, assess the total economic value derived from US reefs, and identify gaps and future research directions.
4
A REV
IEW O
F THE
LITE
RATU
RE
The economic valuation of ecosystem services from coral reefs located in US states and territories has received substantial attention over the past 40 years. For the overview presented in this report more than 20 studies have been collected and reviewed. The earliest US coral reef valuation study is Moncur (1973), which reports the results of a travel cost valuation of recreation sites, some of which contain coral reefs, on Oahu, Hawaii. The majority of valuation studies for US coral reefs, however, have been conducted in the past decade. Most of these studies have been funded by the National Oceanographic and Atmospheric Administration. This section provides a brief summary of the total economic value (TEV) studies for each state and territory, and an aggregate TEV for the US. The states and territories included are American Samoa, Florida, Guam, Hawaii, Puerto Rico, Commonwealth of the North Mariana Islands (CNMI) and the US Virgin Islands (USVI).
3.1. American SamoaThe Department of Commerce for American Samoa commissioned the consultancy firm Jacobs to conduct a study of the economic value of the coral reefs and adjacent habitats in the territory in 2003. The results of this study are reported in Spurgeon et al (2004). The overall aim of the study was to undertake an economic valuation of coral reefs and adjacent habitats (mangroves) in order to guide the future use of resources and management for the territory. In
3. Total Economic ValueStudies for the United States
5
THE T
OTAL
ECON
OMIC
VALU
E OF U
.S. CO
RAL R
EEFS
particular, the aim was to focus on current and potential values for corals and mangroves under a number of alternative future scenarios. The ecosystem services included in the valuation are artisanal and subsistence fisheries, shoreline protection, recreation/tourism and non-use values related to social, cultural and biodiversity aspects of coral reefs.
Regarding the methodology used, data collection was pursued along three lines: information review, village discussion meetings, and a general public questionnaire survey. The public survey included a contingent valuation questionnaire that was designed to elicit use and non-use values for coral reefs and mangroves held by local residents, visitors to American Samoa and the US public in general. The producer surplus derived from recreational activities and subsistence and artisanal fisheries are estimated using the net factor income method. Estimates of consumer surplus from recreational activities and subsistence fisheries are obtained using value transfer. In addition to the estimation of total economic value, the study used a GIS based economic model to assess the spatial variation in coral and mangrove values. This approach helped to highlight the significant differences in values between different locations.
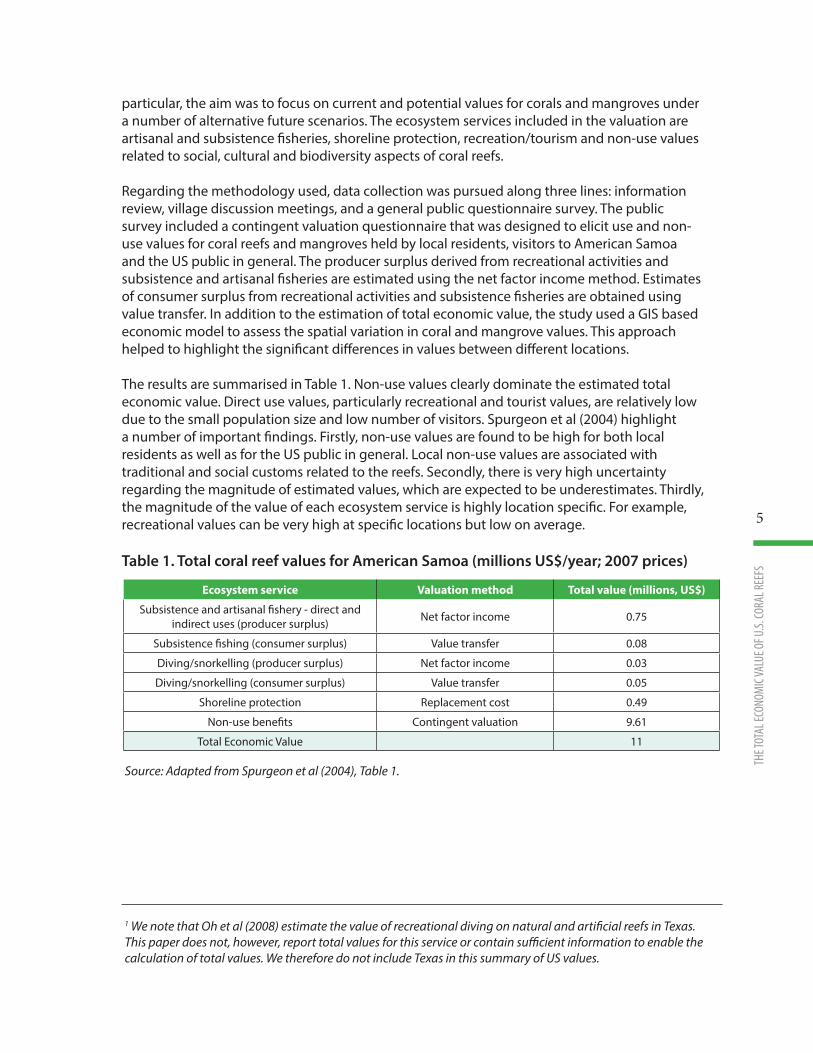
The results are summarised in Table 1. Non-use values clearly dominate the estimated total economic value. Direct use values, particularly recreational and tourist values, are relatively low due to the small population size and low number of visitors. Spurgeon et al (2004) highlight a number of important findings. Firstly, non-use values are found to be high for both local residents as well as for the US public in general. Local non-use values are associated with traditional and social customs related to the reefs. Secondly, there is very high uncertainty regarding the magnitude of estimated values, which are expected to be underestimates. Thirdly, the magnitude of the value of each ecosystem service is highly location specific. For example, recreational values can be very high at specific locations but low on average.
Table 1. Total coral reef values for American Samoa (millions US$/year; 2007 prices)
1 We note that Oh et al (2008) estimate the value of recreational diving on natural and artificial reefs in Texas. This paper does not, however, report total values for this service or contain sufficient information to enable the calculation of total values. We therefore do not include Texas in this summary of US values.
Ecosystem service Valuation method Total value (millions, US$)
Subsistence and artisanal fishery - direct and indirect uses (producer surplus) Net factor income 0.75
Subsistence fishing (consumer surplus) Value transfer 0.08
Diving/snorkelling (producer surplus) Net factor income 0.03
Diving/snorkelling (consumer surplus) Value transfer 0.05
Shoreline protection Replacement cost 0.49
Non-use benefits Contingent valuation 9.61
Total Economic Value 11
Source: Adapted from Spurgeon et al (2004), Table 1.
6
A REV
IEW O
F THE
LITE
RATU
RE
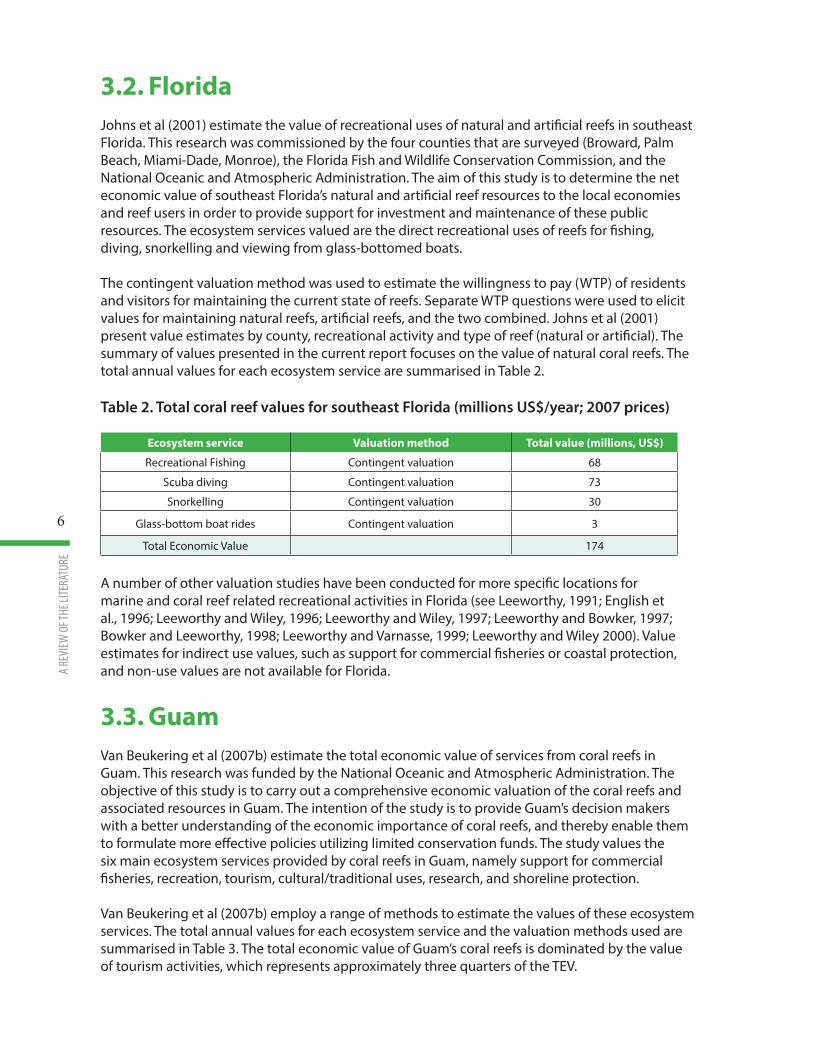
3.2. FloridaJohns et al (2001) estimate the value of recreational uses of natural and artificial reefs in southeast Florida. This research was commissioned by the four counties that are surveyed (Broward, Palm Beach, Miami-Dade, Monroe), the Florida Fish and Wildlife Conservation Commission, and the National Oceanic and Atmospheric Administration. The aim of this study is to determine the net economic value of southeast Florida’s natural and artificial reef resources to the local economies and reef users in order to provide support for investment and maintenance of these public resources. The ecosystem services valued are the direct recreational uses of reefs for fishing, diving, snorkelling and viewing from glass-bottomed boats.
The contingent valuation method was used to estimate the willingness to pay (WTP) of residents and visitors for maintaining the current state of reefs. Separate WTP questions were used to elicit values for maintaining natural reefs, artificial reefs, and the two combined. Johns et al (2001) present value estimates by county, recreational activity and type of reef (natural or artificial). The summary of values presented in the current report focuses on the value of natural coral reefs. The total annual values for each ecosystem service are summarised in Table 2.
Table 2. Total coral reef values for southeast Florida (millions US$/year; 2007 prices)
A number of other valuation studies have been conducted for more specific locations for marine and coral reef related recreational activities in Florida (see Leeworthy, 1991; English et al., 1996; Leeworthy and Wiley, 1996; Leeworthy and Wiley, 1997; Leeworthy and Bowker, 1997; Bowker and Leeworthy, 1998; Leeworthy and Varnasse, 1999; Leeworthy and Wiley 2000). Value estimates for indirect use values, such as support for commercial fisheries or coastal protection, and non-use values are not available for Florida.
3.3. GuamVan Beukering et al (2007b) estimate the total economic value of services from coral reefs in Guam. This research was funded by the National Oceanic and Atmospheric Administration. The objective of this study is to carry out a comprehensive economic valuation of the coral reefs and associated resources in Guam. The intention of the study is to provide Guam’s decision makers with a better understanding of the economic importance of coral reefs, and thereby enable them to formulate more effective policies utilizing limited conservation funds. The study values the six main ecosystem services provided by coral reefs in Guam, namely support for commercial fisheries, recreation, tourism, cultural/traditional uses, research, and shoreline protection.
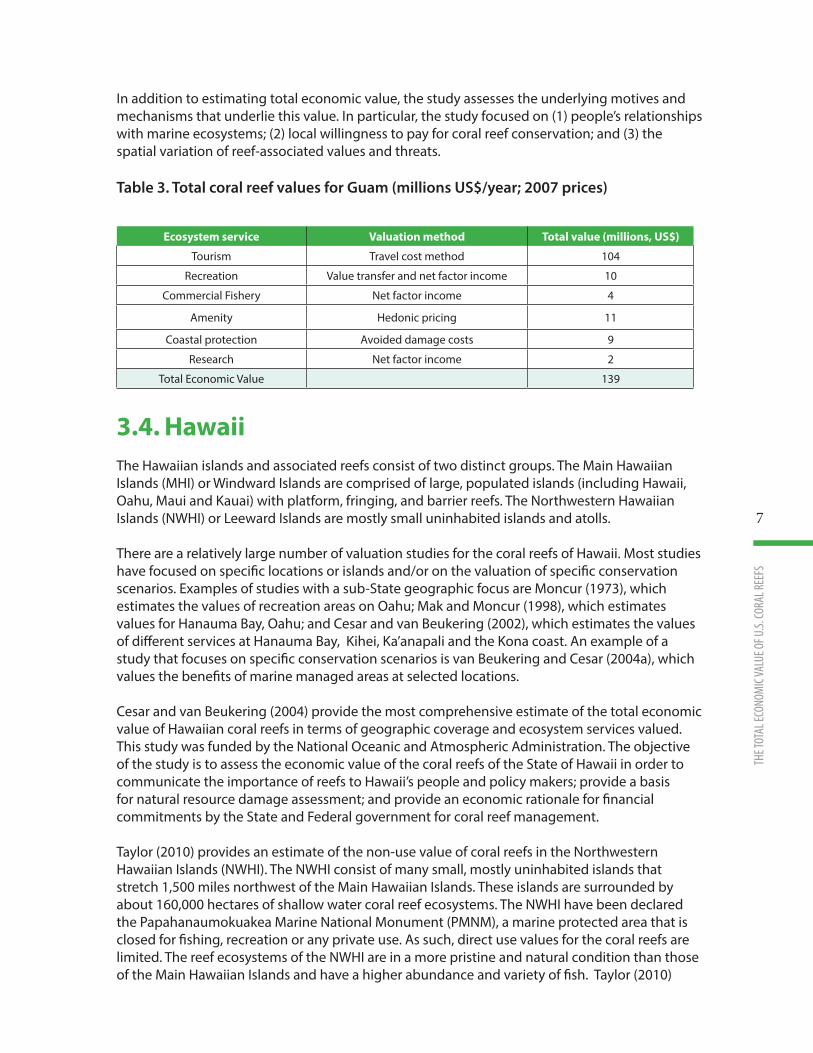
Van Beukering et al (2007b) employ a range of methods to estimate the values of these ecosystem services. The total annual values for each ecosystem service and the valuation methods used are summarised in Table 3. The total economic value of Guam’s coral reefs is dominated by the value of tourism activities, which represents approximately three quarters of the TEV.
Ecosystem service Valuation method Total value (millions, US$)
Recreational Fishing Contingent valuation 68
Scuba diving Contingent valuation 73
Snorkelling Contingent valuation 30
Glass-bottom boat rides Contingent valuation 3
Total Economic Value 174
7
THE T
OTAL
ECON
OMIC
VALU
E OF U
.S. CO
RAL R
EEFS
In addition to estimating total economic value, the study assesses the underlying motives and mechanisms that underlie this value. In particular, the study focused on (1) people’s relationships with marine ecosystems; (2) local willingness to pay for coral reef conservation; and (3) the spatial variation of reef-associated values and threats.
Table 3. Total coral reef values for Guam (millions US$/year; 2007 prices)
3.4. HawaiiThe Hawaiian islands and associated reefs consist of two distinct groups. The Main Hawaiian Islands (MHI) or Windward Islands are comprised of large, populated islands (including Hawaii, Oahu, Maui and Kauai) with platform, fringing, and barrier reefs. The Northwestern Hawaiian Islands (NWHI) or Leeward Islands are mostly small uninhabited islands and atolls.
There are a relatively large number of valuation studies for the coral reefs of Hawaii. Most studies have focused on specific locations or islands and/or on the valuation of specific conservation scenarios. Examples of studies with a sub-State geographic focus are Moncur (1973), which estimates the values of recreation areas on Oahu; Mak and Moncur (1998), which estimates values for Hanauma Bay, Oahu; and Cesar and van Beukering (2002), which estimates the values of different services at Hanauma Bay, Kihei, Ka’anapali and the Kona coast. An example of a study that focuses on specific conservation scenarios is van Beukering and Cesar (2004a), which values the benefits of marine managed areas at selected locations.
Cesar and van Beukering (2004) provide the most comprehensive estimate of the total economic value of Hawaiian coral reefs in terms of geographic coverage and ecosystem services valued. This study was funded by the National Oceanic and Atmospheric Administration. The objective of the study is to assess the economic value of the coral reefs of the State of Hawaii in order to communicate the importance of reefs to Hawaii’s people and policy makers; provide a basis for natural resource damage assessment; and provide an economic rationale for financial commitments by the State and Federal government for coral reef management.
Taylor (2010) provides an estimate of the non-use value of coral reefs in the Northwestern Hawaiian Islands (NWHI). The NWHI consist of many small, mostly uninhabited islands that stretch 1,500 miles northwest of the Main Hawaiian Islands. These islands are surrounded by about 160,000 hectares of shallow water coral reef ecosystems. The NWHI have been declared the Papahanaumokuakea Marine National Monument (PMNM), a marine protected area that is closed for fishing, recreation or any private use. As such, direct use values for the coral reefs are limited. The reef ecosystems of the NWHI are in a more pristine and natural condition than those of the Main Hawaiian Islands and have a higher abundance and variety of fish. Taylor (2010)
Ecosystem service Valuation method Total value (millions, US$)
Tourism Travel cost method 104
Recreation Value transfer and net factor income 10
Commercial Fishery Net factor income 4
Amenity Hedonic pricing 11
Coastal protection Avoided damage costs 9
Research Net factor income 2
Total Economic Value 139
8
A REV
IEW O
F THE
LITE
RATU
REestimates the non-use value for the NWHI reefs using a choice experiment. Values are assessed for both residents of Hawaii and the continental US. Annual non-use values are estimated to be US$ 1.32 billion.
The non-use values of the Main Hawaiian Islands (MHI) have been estimated by Bishop et al. (2011), also using a choice experiment. This study was initiated in 2003 and commissioned by NOAA to improve methods for measuring the economic values that the U.S. public places on the protection and restoration of coral reef ecosystems (Meade and Leeworthy, 2006). Two web-based surveys are used to elicit information from samples of the population of the continental US. Respondents to the surveys include people that have no intention of visiting Hawaiian reefs (i.e. hold purely non-use values) and people that do or potentially will visit Hawaiian reefs (i.e. hold both non-use and use values). The elicited values are therefore a mix of primarily non-use values and, to some extent, use values. The study estimates the value of two conservation measures, separately and in combination. The first is an increase in the size of no-fishing zones around the MHI from the current 1% of marine area to 25%. The second measure is the annual restoration of 5 acres (2 hectares) of reefs that have been damaged by ship groundings. The study finds that the average US household is willing to pay US$ 225 per year for the increase in no-fishing zones and US$ 63 per year for the restoration of 5 acres of coral reef. Aggregating the values of both measures across the total number of households in the US gives an annual value of US$ 34 billion. This estimate is enormous and an order of magnitude greater than the combined value of all other estimates coral reef ES values. The estimate undoubtedly reflects the high non-use values for Hawaiian coral reefs held by the population of the continental US but also raises questions about the respondents’ lack of understanding of the nature and scale of good they are valuing, particularly as the offered conservation measures and the threats that they address are quite limited. For this reason, we leave this estimate out of the summary analysis presented in the paper and discuss the challenge of estimating non-use values in the conclusions. Finally, Brouwer et al. (2011) estimates the amenity value of quality and proximity of coral reefs in the Main Hawaiian Islands. They design a hedonic price model which shows that the presence of coral reef has a significant impact on house prices whilst controlling for other conventional house and neighborhood characteristics, including the distance a property is located from the coast and whether it has an ocean view. This translates into a total annual amenity value of coral reefs in the Main Hawaiian Islands of €47 million.
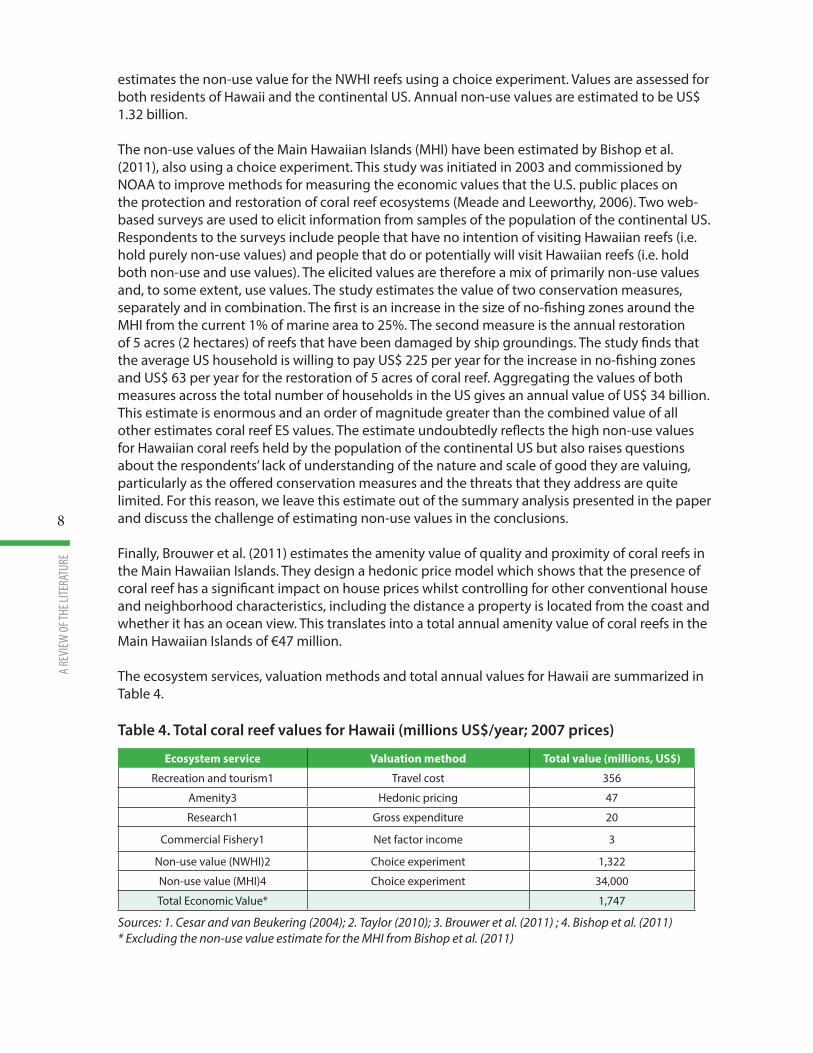
The ecosystem services, valuation methods and total annual values for Hawaii are summarized in Table 4.
Table 4. Total coral reef values for Hawaii (millions US$/year; 2007 prices)
Sources: 1. Cesar and van Beukering (2004); 2. Taylor (2010); 3. Brouwer et al. (2011) ; 4. Bishop et al. (2011)* Excluding the non-use value estimate for the MHI from Bishop et al. (2011)
Ecosystem service Valuation method Total value (millions, US$)
Recreation and tourism1 Travel cost 356
Amenity3 Hedonic pricing 47
Research1 Gross expenditure 20
Commercial Fishery1 Net factor income 3
Non-use value (NWHI)2 Choice experiment 1,322
Non-use value (MHI)4 Choice experiment 34,000
Total Economic Value* 1,747
9
THE T
OTAL
ECON
OMIC
VALU
E OF U
.S. CO
RAL R
EEFS
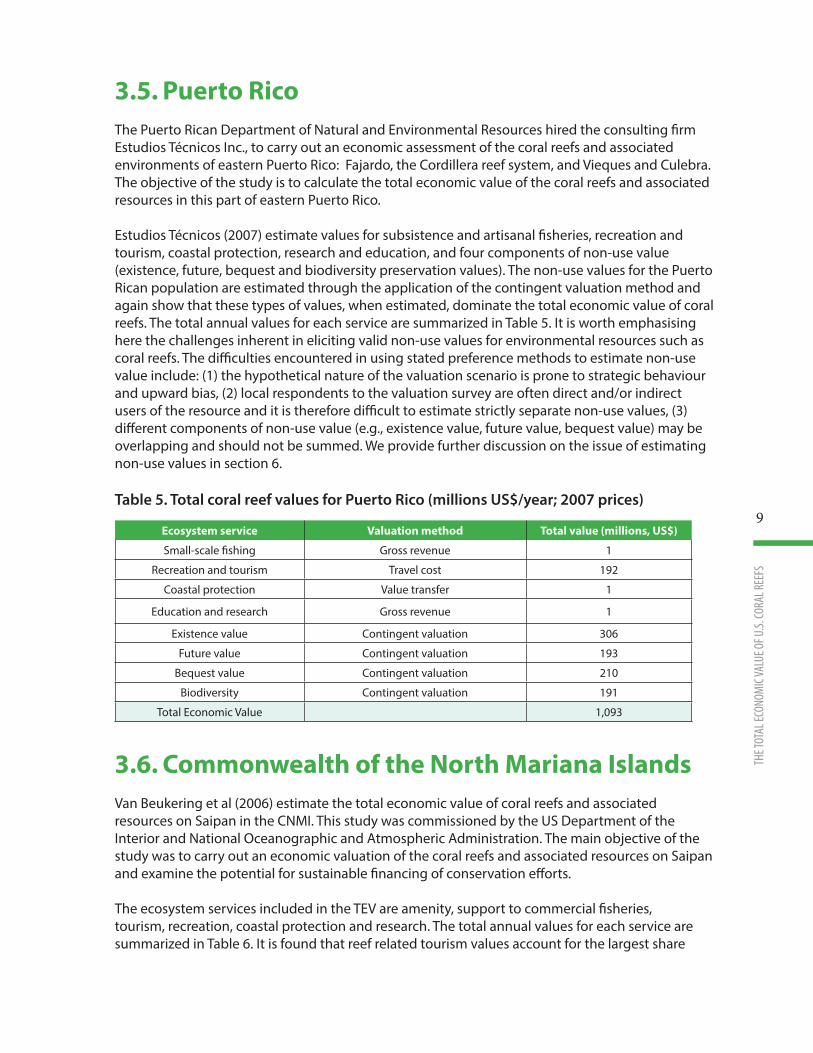
3.5. Puerto RicoThe Puerto Rican Department of Natural and Environmental Resources hired the consulting firm Estudios Técnicos Inc., to carry out an economic assessment of the coral reefs and associated environments of eastern Puerto Rico: Fajardo, the Cordillera reef system, and Vieques and Culebra. The objective of the study is to calculate the total economic value of the coral reefs and associated resources in this part of eastern Puerto Rico.
Estudios Técnicos (2007) estimate values for subsistence and artisanal fisheries, recreation and tourism, coastal protection, research and education, and four components of non-use value (existence, future, bequest and biodiversity preservation values). The non-use values for the Puerto Rican population are estimated through the application of the contingent valuation method and again show that these types of values, when estimated, dominate the total economic value of coral reefs. The total annual values for each service are summarized in Table 5. It is worth emphasising here the challenges inherent in eliciting valid non-use values for environmental resources such as coral reefs. The difficulties encountered in using stated preference methods to estimate non-use value include: (1) the hypothetical nature of the valuation scenario is prone to strategic behaviour and upward bias, (2) local respondents to the valuation survey are often direct and/or indirect users of the resource and it is therefore difficult to estimate strictly separate non-use values, (3) different components of non-use value (e.g., existence value, future value, bequest value) may be overlapping and should not be summed. We provide further discussion on the issue of estimating non-use values in section 6.
Table 5. Total coral reef values for Puerto Rico (millions US$/year; 2007 prices)
3.6. Commonwealth of the North Mariana IslandsVan Beukering et al (2006) estimate the total economic value of coral reefs and associated resources on Saipan in the CNMI. This study was commissioned by the US Department of the Interior and National Oceanographic and Atmospheric Administration. The main objective of the study was to carry out an economic valuation of the coral reefs and associated resources on Saipan and examine the potential for sustainable financing of conservation efforts.
The ecosystem services included in the TEV are amenity, support to commercial fisheries, tourism, recreation, coastal protection and research. The total annual values for each service are summarized in Table 6. It is found that reef related tourism values account for the largest share
Ecosystem service Valuation method Total value (millions, US$)
Small-scale fishing Gross revenue 1
Recreation and tourism Travel cost 192
Coastal protection Value transfer 1
Education and research Gross revenue 1
Existence value Contingent valuation 306
Future value Contingent valuation 193
Bequest value Contingent valuation 210
Biodiversity Contingent valuation 191
Total Economic Value 1,093
10
A REV
IEW O
F THE
LITE
RATU
RE
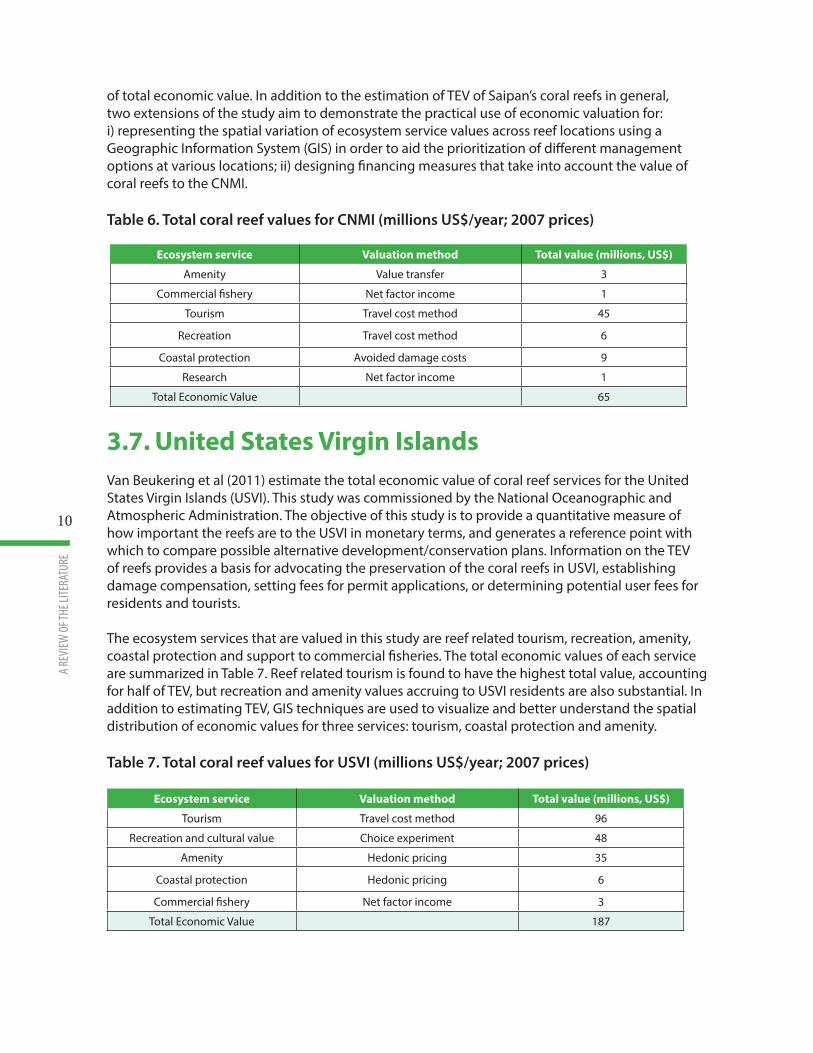
of total economic value. In addition to the estimation of TEV of Saipan’s coral reefs in general, two extensions of the study aim to demonstrate the practical use of economic valuation for: i) representing the spatial variation of ecosystem service values across reef locations using a Geographic Information System (GIS) in order to aid the prioritization of different management options at various locations; ii) designing financing measures that take into account the value of coral reefs to the CNMI.
Table 6. Total coral reef values for CNMI (millions US$/year; 2007 prices)
3.7. United States Virgin IslandsVan Beukering et al (2011) estimate the total economic value of coral reef services for the United States Virgin Islands (USVI). This study was commissioned by the National Oceanographic and Atmospheric Administration. The objective of this study is to provide a quantitative measure of how important the reefs are to the USVI in monetary terms, and generates a reference point with which to compare possible alternative development/conservation plans. Information on the TEV of reefs provides a basis for advocating the preservation of the coral reefs in USVI, establishing damage compensation, setting fees for permit applications, or determining potential user fees for residents and tourists.
The ecosystem services that are valued in this study are reef related tourism, recreation, amenity, coastal protection and support to commercial fisheries. The total economic values of each service are summarized in Table 7. Reef related tourism is found to have the highest total value, accounting for half of TEV, but recreation and amenity values accruing to USVI residents are also substantial. In addition to estimating TEV, GIS techniques are used to visualize and better understand the spatial distribution of economic values for three services: tourism, coastal protection and amenity.
Table 7. Total coral reef values for USVI (millions US$/year; 2007 prices)
Ecosystem service Valuation method Total value (millions, US$)
Amenity Value transfer 3
Commercial fishery Net factor income 1
Tourism Travel cost method 45
Recreation Travel cost method 6
Coastal protection Avoided damage costs 9
Research Net factor income 1
Total Economic Value 65
Ecosystem service Valuation method Total value (millions, US$)
Tourism Travel cost method 96
Recreation and cultural value Choice experiment 48
Amenity Hedonic pricing 35
Coastal protection Hedonic pricing 6
Commercial fishery Net factor income 3
Total Economic Value 187
11
THE T
OTAL
ECON
OMIC
VALU
E OF U
.S. CO
RAL R
EEFS
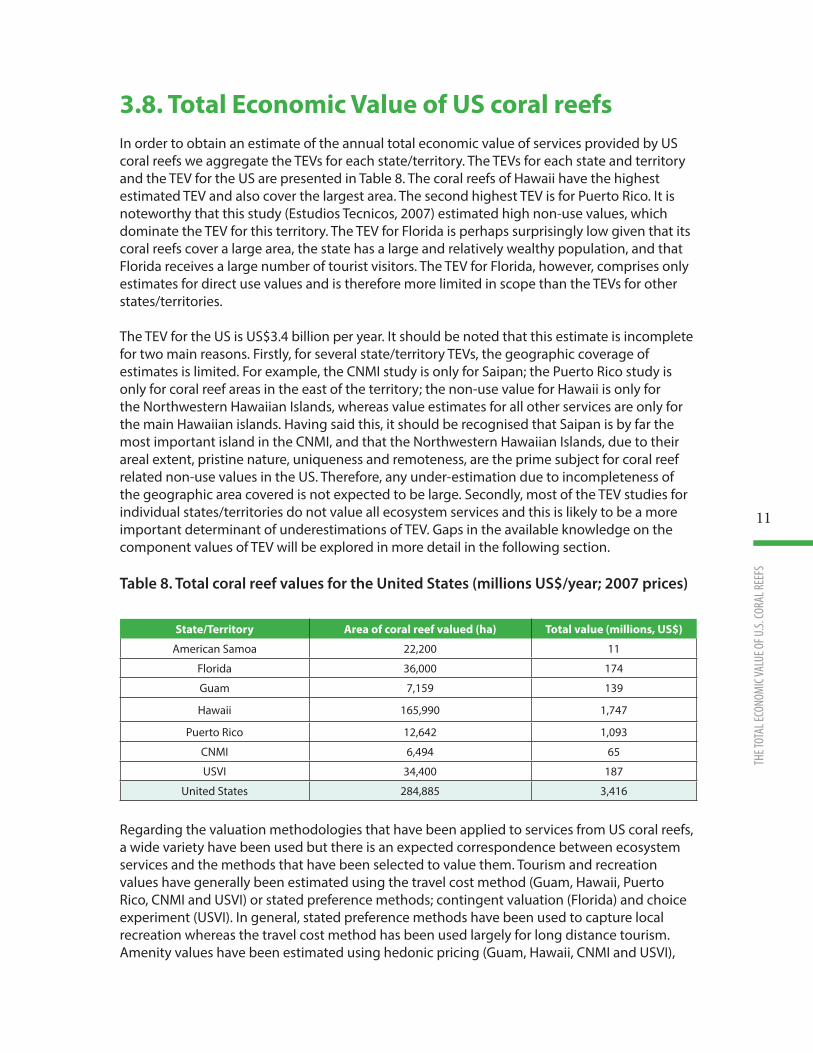
3.8. Total Economic Value of US coral reefsIn order to obtain an estimate of the annual total economic value of services provided by US coral reefs we aggregate the TEVs for each state/territory. The TEVs for each state and territory and the TEV for the US are presented in Table 8. The coral reefs of Hawaii have the highest estimated TEV and also cover the largest area. The second highest TEV is for Puerto Rico. It is noteworthy that this study (Estudios Tecnicos, 2007) estimated high non-use values, which dominate the TEV for this territory. The TEV for Florida is perhaps surprisingly low given that its coral reefs cover a large area, the state has a large and relatively wealthy population, and that Florida receives a large number of tourist visitors. The TEV for Florida, however, comprises only estimates for direct use values and is therefore more limited in scope than the TEVs for other states/territories.
The TEV for the US is US$3.4 billion per year. It should be noted that this estimate is incomplete for two main reasons. Firstly, for several state/territory TEVs, the geographic coverage of estimates is limited. For example, the CNMI study is only for Saipan; the Puerto Rico study is only for coral reef areas in the east of the territory; the non-use value for Hawaii is only for the Northwestern Hawaiian Islands, whereas value estimates for all other services are only for the main Hawaiian islands. Having said this, it should be recognised that Saipan is by far the most important island in the CNMI, and that the Northwestern Hawaiian Islands, due to their areal extent, pristine nature, uniqueness and remoteness, are the prime subject for coral reef related non-use values in the US. Therefore, any under-estimation due to incompleteness of the geographic area covered is not expected to be large. Secondly, most of the TEV studies for individual states/territories do not value all ecosystem services and this is likely to be a more important determinant of underestimations of TEV. Gaps in the available knowledge on the component values of TEV will be explored in more detail in the following section.
Table 8. Total coral reef values for the United States (millions US$/year; 2007 prices)
Regarding the valuation methodologies that have been applied to services from US coral reefs, a wide variety have been used but there is an expected correspondence between ecosystem services and the methods that have been selected to value them. Tourism and recreation values have generally been estimated using the travel cost method (Guam, Hawaii, Puerto Rico, CNMI and USVI) or stated preference methods; contingent valuation (Florida) and choice experiment (USVI). In general, stated preference methods have been used to capture local recreation whereas the travel cost method has been used largely for long distance tourism. Amenity values have been estimated using hedonic pricing (Guam, Hawaii, CNMI and USVI),
State/Territory Area of coral reef valued (ha) Total value (millions, US$)
American Samoa 22,200 11
Florida 36,000 174
Guam 7,159 139
Hawaii 165,990 1,747
Puerto Rico 12,642 1,093
CNMI 6,494 65
USVI 34,400 187
United States 284,885 3,416
12
A REV
IEW O
F THE
LITE
RATU
RE
which captures the effect of the quality of the marine environment on house prices. Coastal protection is valued using replacement cost (American Samoa) and avoided damage cost (Guam, CNMI), which are not theoretically robust valuation methods but often are the only feasible means of valuing this service. A combination of the avoided damage cost and the hedonic pricing methods has been used in the USVI to value coastal protection and perhaps offers a more theoretically attractive and comprehensive approach. The role that coral reefs play in supporting commercial fisheries has been valued using net factor income (American Samoa, Guam, Hawaii, CNMI, USVI). This is also a somewhat rough method but the data required for the more sophisticated production function valuation approach are generally not available. Non-use values can only be estimated using stated preference methods and both contingent valuation (American Samoa, Puerto Rico) and choice experiments (Hawaii) have been employed for valuing coral reefs. Value transfer has also been used in several cases to estimate coral reef service values. The accuracy of value transfers is discussed in section 6.
13
THE T
OTAL
ECON
OMIC
VALU
E OF U
.S. CO
RAL R
EEFS
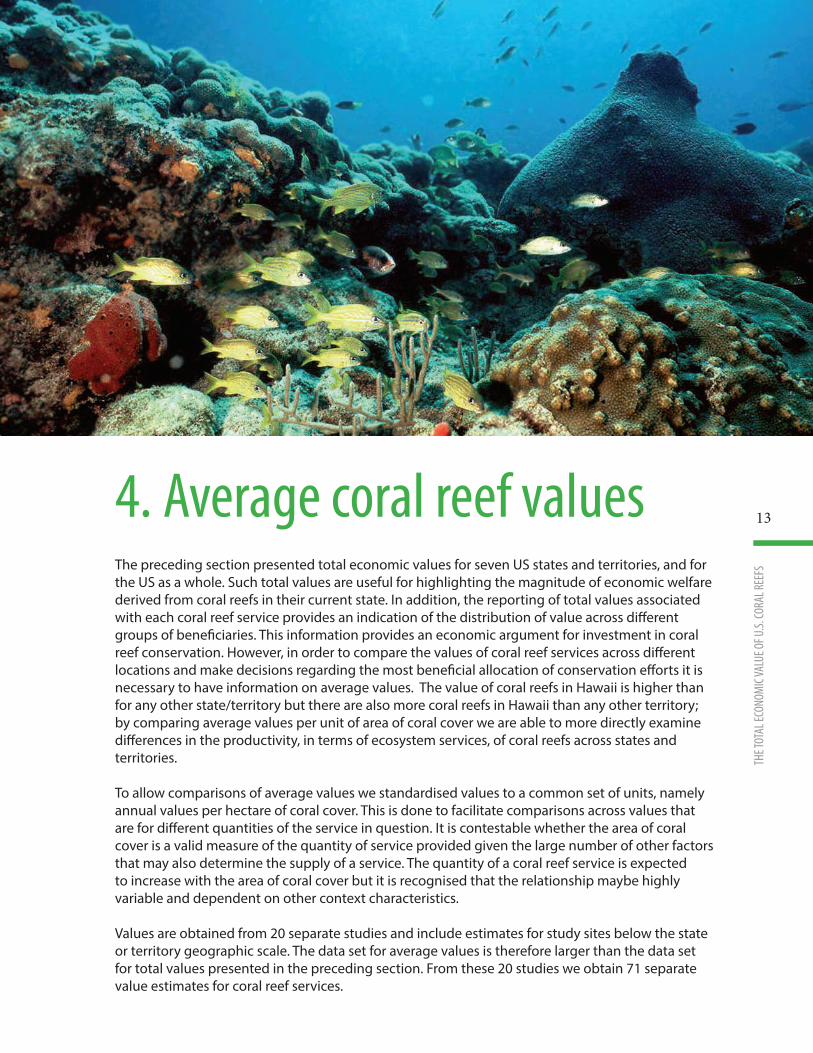
4. Average coral reef valuesThe preceding section presented total economic values for seven US states and territories, and for the US as a whole. Such total values are useful for highlighting the magnitude of economic welfare derived from coral reefs in their current state. In addition, the reporting of total values associated with each coral reef service provides an indication of the distribution of value across different groups of beneficiaries. This information provides an economic argument for investment in coral reef conservation. However, in order to compare the values of coral reef services across different locations and make decisions regarding the most beneficial allocation of conservation efforts it is necessary to have information on average values. The value of coral reefs in Hawaii is higher than for any other state/territory but there are also more coral reefs in Hawaii than any other territory; by comparing average values per unit of area of coral cover we are able to more directly examine differences in the productivity, in terms of ecosystem services, of coral reefs across states and territories.
To allow comparisons of average values we standardised values to a common set of units, namely annual values per hectare of coral cover. This is done to facilitate comparisons across values that are for different quantities of the service in question. It is contestable whether the area of coral cover is a valid measure of the quantity of service provided given the large number of other factors that may also determine the supply of a service. The quantity of a coral reef service is expected to increase with the area of coral cover but it is recognised that the relationship maybe highly variable and dependent on other context characteristics.
Values are obtained from 20 separate studies and include estimates for study sites below the state or territory geographic scale. The data set for average values is therefore larger than the data set for total values presented in the preceding section. From these 20 studies we obtain 71 separate value estimates for coral reef services.
14
A REV
IEW O
F THE
LITE
RATU
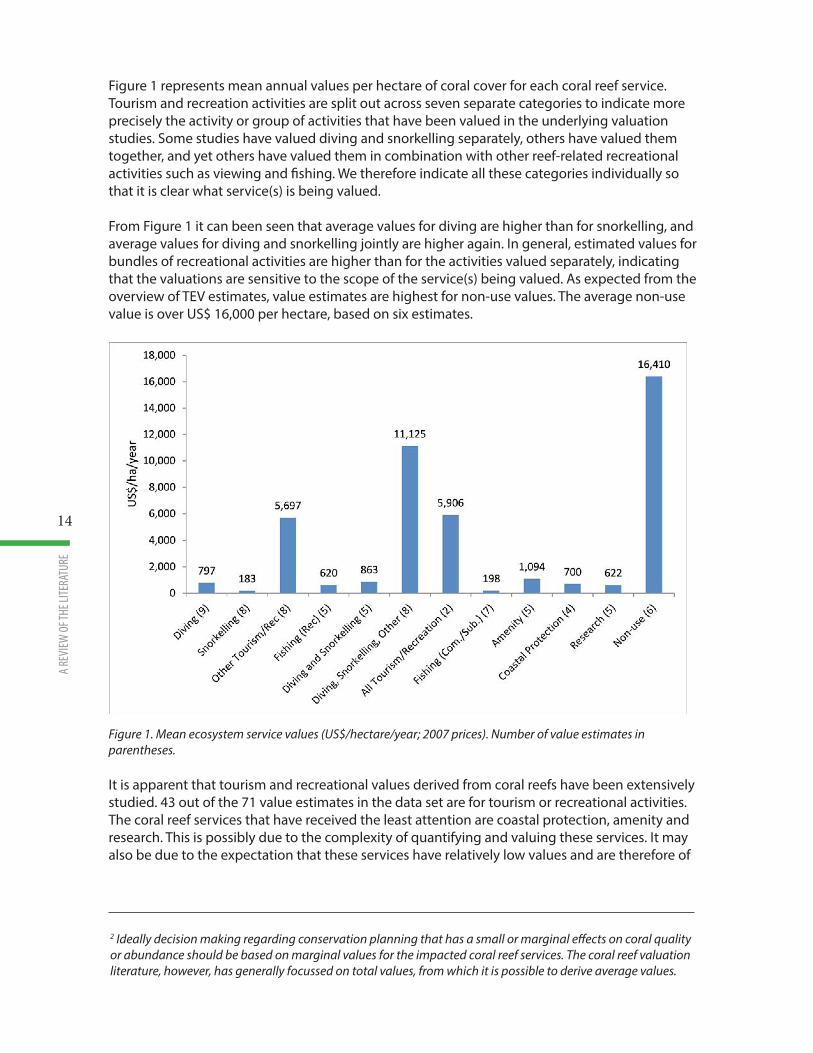
RE Figure 1 represents mean annual values per hectare of coral cover for each coral reef service. Tourism and recreation activities are split out across seven separate categories to indicate more precisely the activity or group of activities that have been valued in the underlying valuation studies. Some studies have valued diving and snorkelling separately, others have valued them together, and yet others have valued them in combination with other reef-related recreational activities such as viewing and fishing. We therefore indicate all these categories individually so that it is clear what service(s) is being valued.
From Figure 1 it can been seen that average values for diving are higher than for snorkelling, and average values for diving and snorkelling jointly are higher again. In general, estimated values for bundles of recreational activities are higher than for the activities valued separately, indicating that the valuations are sensitive to the scope of the service(s) being valued. As expected from the overview of TEV estimates, value estimates are highest for non-use values. The average non-use value is over US$ 16,000 per hectare, based on six estimates.
Figure 1. Mean ecosystem service values (US$/hectare/year; 2007 prices). Number of value estimates in parentheses.
It is apparent that tourism and recreational values derived from coral reefs have been extensively studied. 43 out of the 71 value estimates in the data set are for tourism or recreational activities. The coral reef services that have received the least attention are coastal protection, amenity and research. This is possibly due to the complexity of quantifying and valuing these services. It may also be due to the expectation that these services have relatively low values and are therefore of
2 Ideally decision making regarding conservation planning that has a small or marginal effects on coral quality or abundance should be based on marginal values for the impacted coral reef services. The coral reef valuation literature, however, has generally focussed on total values, from which it is possible to derive average values.
15
THE T
OTAL
ECON
OMIC
VALU
E OF U
.S. CO
RAL R
EEFS
less importance in the estimation of total reef values. Despite the apparent substantial magnitude of non-use values, there are only six estimates available for US coral reefs, and four of these are from a single study (Estudios Técnicos, 2007).
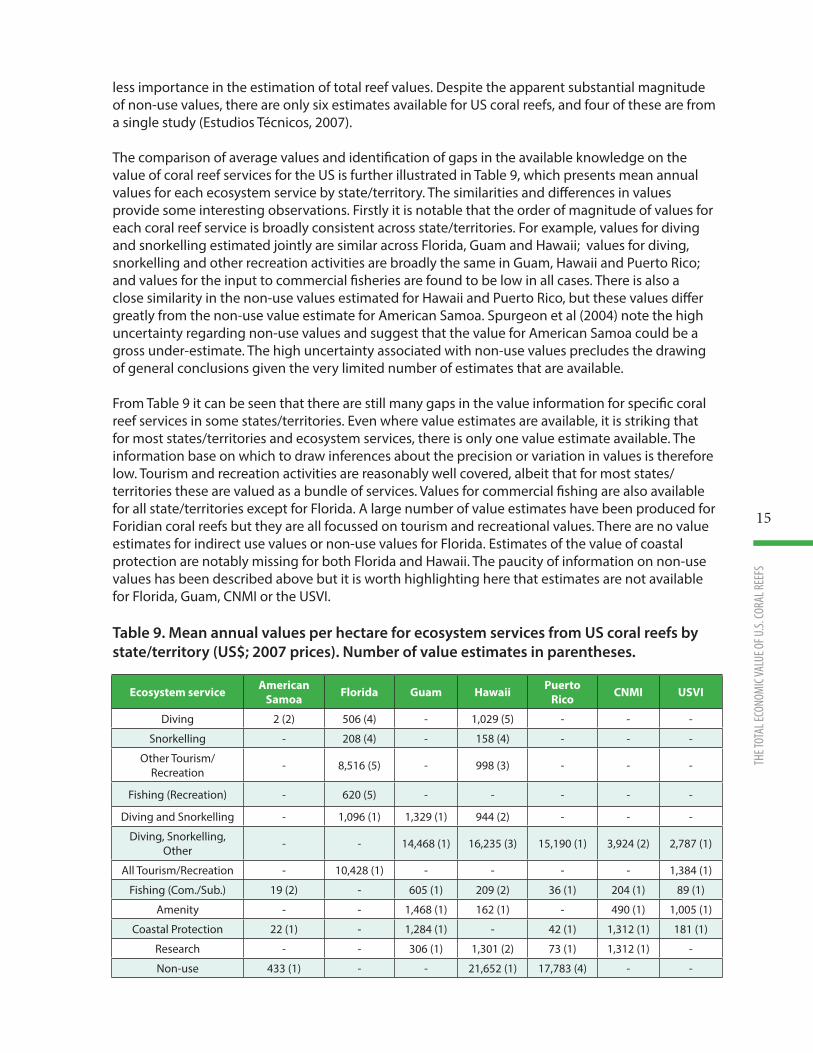
The comparison of average values and identification of gaps in the available knowledge on the value of coral reef services for the US is further illustrated in Table 9, which presents mean annual values for each ecosystem service by state/territory. The similarities and differences in values provide some interesting observations. Firstly it is notable that the order of magnitude of values for each coral reef service is broadly consistent across state/territories. For example, values for diving and snorkelling estimated jointly are similar across Florida, Guam and Hawaii; values for diving, snorkelling and other recreation activities are broadly the same in Guam, Hawaii and Puerto Rico; and values for the input to commercial fisheries are found to be low in all cases. There is also a close similarity in the non-use values estimated for Hawaii and Puerto Rico, but these values differ greatly from the non-use value estimate for American Samoa. Spurgeon et al (2004) note the high uncertainty regarding non-use values and suggest that the value for American Samoa could be a gross under-estimate. The high uncertainty associated with non-use values precludes the drawing of general conclusions given the very limited number of estimates that are available.
From Table 9 it can be seen that there are still many gaps in the value information for specific coral reef services in some states/territories. Even where value estimates are available, it is striking that for most states/territories and ecosystem services, there is only one value estimate available. The information base on which to draw inferences about the precision or variation in values is therefore low. Tourism and recreation activities are reasonably well covered, albeit that for most states/ territories these are valued as a bundle of services. Values for commercial fishing are also available for all state/territories except for Florida. A large number of value estimates have been produced for Foridian coral reefs but they are all focussed on tourism and recreational values. There are no value estimates for indirect use values or non-use values for Florida. Estimates of the value of coastal protection are notably missing for both Florida and Hawaii. The paucity of information on non-use values has been described above but it is worth highlighting here that estimates are not available for Florida, Guam, CNMI or the USVI. Table 9. Mean annual values per hectare for ecosystem services from US coral reefs by state/territory (US$; 2007 prices). Number of value estimates in parentheses.
Ecosystem service American Samoa Florida Guam Hawaii Puerto
Rico CNMI USVI
Diving 2 (2) 506 (4) - 1,029 (5) - - -
Snorkelling - 208 (4) - 158 (4) - - -
Other Tourism/Recreation - 8,516 (5) - 998 (3) - - -
Fishing (Recreation) - 620 (5) - - - - -
Diving and Snorkelling - 1,096 (1) 1,329 (1) 944 (2) - - -
Diving, Snorkelling, Other - - 14,468 (1) 16,235 (3) 15,190 (1) 3,924 (2) 2,787 (1)
All Tourism/Recreation - 10,428 (1) - - - - 1,384 (1)
Fishing (Com./Sub.) 19 (2) - 605 (1) 209 (2) 36 (1) 204 (1) 89 (1)
Amenity - - 1,468 (1) 162 (1) - 490 (1) 1,005 (1)
Coastal Protection 22 (1) - 1,284 (1) - 42 (1) 1,312 (1) 181 (1)
Research - - 306 (1) 1,301 (2) 73 (1) 1,312 (1) -
Non-use 433 (1) - - 21,652 (1) 17,783 (4) - -
16
A REV
IEW O
F THE
LITE
RATU
RE
5. Meta-analysis of US coral reef valuesIn order to further explore variation in the value of coral reef services and potential determinants of differences in values across contexts, we conduct a meta-analysis of the US coral reef value data.
Meta-analysis is the quantitative analysis of statistical summary indicators reported in a series of similar empirical studies. It is a method of synthesizing the results of multiple studies that examine the same phenomenon, through the identification of a common effect, which is then ‘explained’ using regression techniques in a meta-regression model (Stanley, 2001). Meta-analysis was first proposed as a research synthesis method by Glass (1976) and has since been developed and applied in many fields of research, not least in the area of environmental economics (Nelson and Kennedy, 2009). It is widely recognised that the large and increasing literature on economic valuations of ecosystem services and environmental impacts has become difficult to interpret and that there is a need for research synthesis techniques, and in particular statistical meta-analysis, to aggregate information and insights (Stanley, 2001; Smith and Pattanayak, 2002; Bateman and Jones, 2003; Nelson and Kennedy, 2009).
In addition to identifying consensus in results across studies, meta-analysis is also of interest as a means of transferring values from studied sites to new policy sites. Value transfer is the procedure of estimating the value of an ecosystem (or goods and services from an ecosystem) by borrowing an existing valuation estimate for a similar ecosystem. The ecosystem of current
17
THE T
OTAL
ECON
OMIC
VALU
E OF U
.S. CO
RAL R
EEFS
policy interest is generally called the “policy site” and the ecosystem from which the value estimate is borrowed is called the “study site”. This procedure is often termed benefit transfer but since the values being transferred may also be estimates of costs or damages, the term value transfer is arguably more appropriate. The meta-regression model estimated in a meta-analysis can be used for value transfer by substituting in parameter values for the policy site to estimate values. The advantage of value transfer using a meta-analytic function is that a greater degree of variation in study site characteristics can be controlled for than is the case for value functions based on single study sites.
Several meta-analyses have been conducted in the field of economic valuation of environmental resources, impacts, and services, for example for wetlands (Brouwer et al., 1999; Woodward and Wui, 2000; Brander et al., 2006; Ghermandi et al., 2010), coral reef recreation (Brander et al., 2007; Londono and Johnston, 2012), woodland recreation (Bateman and Jones, 2003), biodiversity (Nijkamp and Vindigni, 2003), outdoor recreation (Rosenberger and Loomis, 2000; Shrestha and Loomis, 2001). As far as we are aware, this is the first meta-analysis that includes values for all coral reef services and focuses only US data.
The dependent variable in this meta-analysis is the average value per hectare per year in 2007 prices. Value estimates that are themselves based on value transfer are excluded from the data, leaving 69 data points. The meta-regression model is estimated using OLS in SPSS 17.0.
Regarding explanatory variables, we include a measure of income in the form of State Domestic Product for the year in which the study took place and adjusted to 2007 price levels using a GDP deflator.3 We also include the total area of coral cover that is valued in order to examine whether values are variable with the scale of the resource. The remaining set of explanatory variables are dummy variables indicating the coral reef service that is valued. In other meta-analyses of the environmental valuation literature it has been found that methodological variables account for a substantial share of variation in estimated values. We do not, however, include variables to account for the valuation method used since methods are confounded with ecosystem services to a high degree.
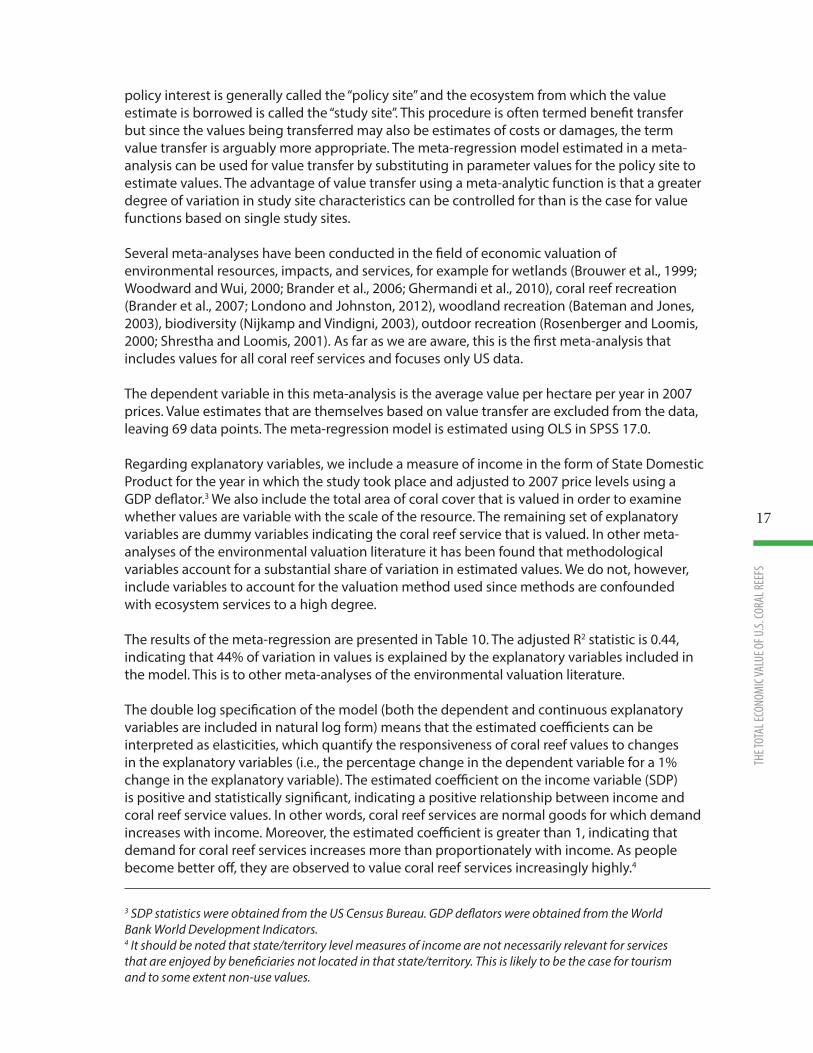
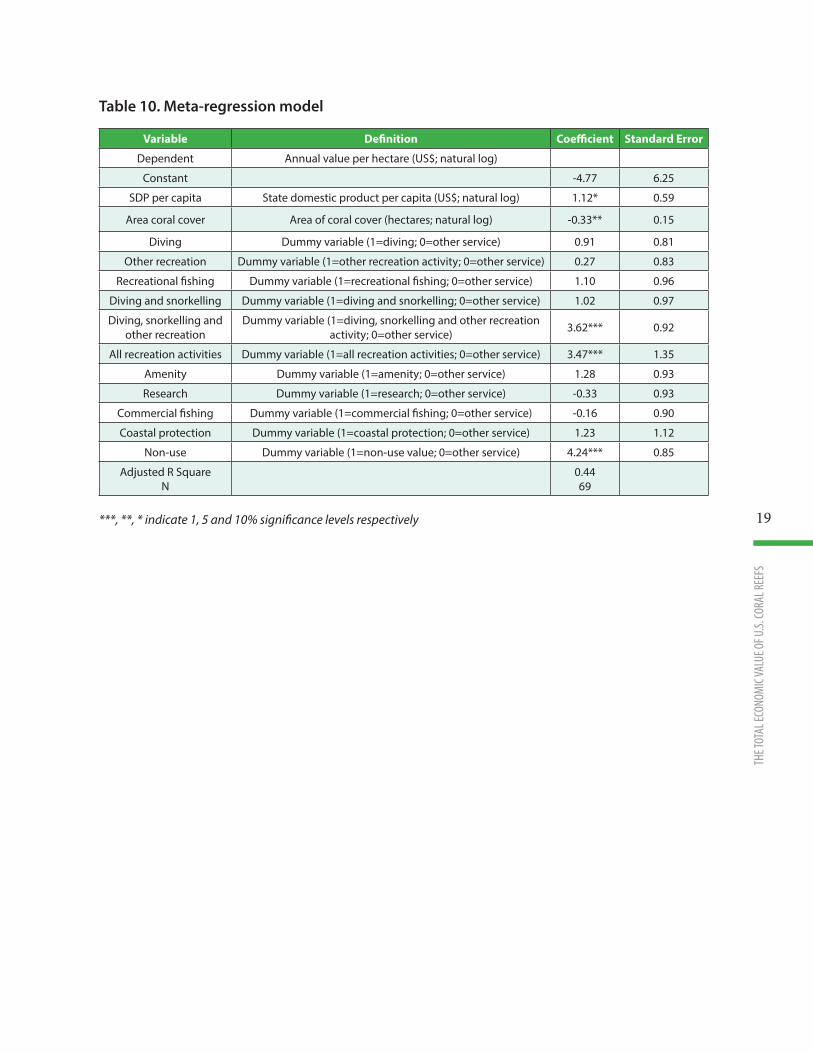
The results of the meta-regression are presented in Table 10. The adjusted R2 statistic is 0.44, indicating that 44% of variation in values is explained by the explanatory variables included in the model. This is to other meta-analyses of the environmental valuation literature.
The double log specification of the model (both the dependent and continuous explanatory variables are included in natural log form) means that the estimated coefficients can be interpreted as elasticities, which quantify the responsiveness of coral reef values to changes in the explanatory variables (i.e., the percentage change in the dependent variable for a 1% change in the explanatory variable). The estimated coefficient on the income variable (SDP) is positive and statistically significant, indicating a positive relationship between income and coral reef service values. In other words, coral reef services are normal goods for which demand increases with income. Moreover, the estimated coefficient is greater than 1, indicating that demand for coral reef services increases more than proportionately with income. As people become better off, they are observed to value coral reef services increasingly highly.4
3 SDP statistics were obtained from the US Census Bureau. GDP deflators were obtained from the World Bank World Development Indicators.4 It should be noted that state/territory level measures of income are not necessarily relevant for services that are enjoyed by beneficiaries not located in that state/territory. This is likely to be the case for tourism and to some extent non-use values.
18
A REV
IEW O
F THE
LITE
RATU
RE
The negative and statistically significant coefficient for the area of coral cover variable indicates that per hectare values for coral reef services fall as the total area of coral cover increases. In other words there are diminishing returns to scale of coral reef service provision. Another way of interpreting this result is that it reflects the scarcity or abundance of the resource, i.e. that one hectare of coral cover in a region with a high abundance of coral cover has a lower value that one hectare of coral cover in a region with a low abundance.
The estimated coefficients on the variables indicating the coral reef service that is valued are interpreted relative to the omitted service category (snorkelling). Each coefficient therefore indicates the value of the specific service relative to the value of snorkelling, which is included in the constant term of the regression model. The coefficients measure the constant proportional or relative change in the dependent variable for the case that the service is provided, following the transformation eβ – 1, where β is the estimated coefficient for the service. For example, the coefficient of 0.91 for the dummy variable indicating that the coral reef is used for diving means that, ceteris paribus, the value will be 147% (i.e., e0.91 – 1) higher than the value of snorkelling. The signs and relative magnitudes of the coefficients on the service variables are all broadly as expected, with bundles of tourism/recreation activities being more highly valued that individual activities, and non-use values being substantially higher than other values.
Regarding the practical application of these results for informing policy making, the coral reef value function presented in Table 10 can be used to estimate the value of changes in the area of coral cover. By substituting information on the parameter values for a specific policy site and context (i.e., State Domestic Product per capita, area of coral cover, and the coral reef services that are provided), the value function can provide an estimate of the annual value per hectare of coral cover. This estimated value per hectare can be multiplied by the expected change in area of coral cover under a conservation/loss scenario to provide the total annual value associated with the change. Such information can be used to inform decision making regarding the conservation or loss of existing areas. The use of the meta-analytic function for value transfer should, however, be conducted with caution since the precision of estimated values is likely to be low (Brander et al, 2007).
19
THE T
OTAL
ECON
OMIC
VALU
E OF U
.S. CO
RAL R
EEFS
Variable Definition Coefficient Standard Error
Dependent Annual value per hectare (US$; natural log)
Constant -4.77 6.25
SDP per capita State domestic product per capita (US$; natural log) 1.12* 0.59
Area coral cover Area of coral cover (hectares; natural log) -0.33** 0.15
Diving Dummy variable (1=diving; 0=other service) 0.91 0.81
Other recreation Dummy variable (1=other recreation activity; 0=other service) 0.27 0.83
Recreational fishing Dummy variable (1=recreational fishing; 0=other service) 1.10 0.96
Diving and snorkelling Dummy variable (1=diving and snorkelling; 0=other service) 1.02 0.97
Diving, snorkelling and other recreation
Dummy variable (1=diving, snorkelling and other recreation activity; 0=other service) 3.62*** 0.92
All recreation activities Dummy variable (1=all recreation activities; 0=other service) 3.47*** 1.35
Amenity Dummy variable (1=amenity; 0=other service) 1.28 0.93
Research Dummy variable (1=research; 0=other service) -0.33 0.93
Commercial fishing Dummy variable (1=commercial fishing; 0=other service) -0.16 0.90
Coastal protection Dummy variable (1=coastal protection; 0=other service) 1.23 1.12
Non-use Dummy variable (1=non-use value; 0=other service) 4.24*** 0.85
Adjusted R SquareN
0.4469
Table 10. Meta-regression model
***, **, * indicate 1, 5 and 10% significance levels respectively
20
A REV
IEW O
F THE
LITE
RATU
RE
6. Discussion and conclusionThis overview of the value of services provided by US coral reefs shows an emerging picture of the economic welfare derived from these ecosystems. The estimated total economic value of coral reef services for the US as a whole is just over US$ 3.4 billion per year. This value is considered to be a partial estimate due to (1) the limited geographical coverage of some state/territory level TEV estimates, (2) the limited set of services that are valued for some states and territories. The scant information on non-use values is likely to constitute the largest missing component of TEV. Non-use values have been estimated for the coral reefs of American Samoa, the Northwest and Main Hawaiian Islands and the Eastern part of Puerto Rico. In order to develop a full picture of the TEV of US coral reefs it is necessary to fill the information gaps on non-use values for the remaining coral reef regions. Given the high uncertainty and methodological challenges associated with estimating non-use values for environmental resources, it is requisite that any study addressing these values is carefully designed and implemented. Non-use values can only be estimated using stated preference methods and are therefore susceptible to hypothetical biases inherent in these methods. Another important issue to be addressed is the aggregation of non-use values. For the aggregation of individual or household non-use values, the identification of the economic constituency or population of beneficiaries that hold non-use values is a critically important step. It is advisable for future studies to put considerable effort into identifying the relevant economic constituency and assessing how non-use values vary with distance, location and socio-economic characteristics to ensure that the aggregation of values is valid.
21
THE T
OTAL
ECON
OMIC
VALU
E OF U
.S. CO
RAL R
EEFS
Given the gaps that have been identified in the existing knowledge of values for some coral reef services and states/territories, there is a strong policy interest in the potential and accuracy of transferring value information from study sites where values are available to other sites that are of current policy interest. The use of value transfer to provide information for decision making has a number of advantages over conducting primary research to estimate ecosystem values: (1) from a practical point of view it is generally less expensive and time consuming than conducting primary research; (2) value transfer can be applied on a scale that would be unfeasible for primary research in terms of valuing large numbers of sites across multiple states and territories; and (3) value transfer has the attraction of providing methodological consistency in the estimation of values across policy sites. The application of value transfer, however, may result in significant transfer errors, i.e., that transferred values may differ significantly from the actual value of the ecosystem under consideration. Sources of transfer error include measurement error in primary valuation estimates resulting from weak methodologies, unreliable data, analyst errors, and the whole gamut of biases and inaccuracies associated with valuation methods; biased and unrepresentative samples of values available in the literature; and generalisation error arising when values for study sites are transferred to policy sites that are different without fully accounting for those differences. Given the potential errors in applying value transfer, it is useful to examine the scale of these errors in order to inform decisions related to the use of value transfer. In making decisions based on transferred values or in choosing between commissioning a value transfer application or a primary valuation study, decision makers need to know the potential errors involved. It is therefore advisable that future work looks at the accuracy of value transfer in the context of coral reef service values.
This report has presented values for coral reef services in terms of total or average values for each state/territory in the US (e.g., Table 9). This format of presentation, however, ignores the very high variability in values within states/territories. It is certainly not the case that the value of coral reef services are constant across all reefs within a state/territory and are expected to vary spatially due to a large number of factors. For example, tourism and recreational values will be considerably higher at reefs that are heavily used for these activities. Similarly, the value of coastal protection will be higher for sections of coast where storm surges are more likely (due to bathymetry, wind direction and speed etc.) and where the value of assets that are exposed to damage is higher. A number of existing coral reef valuation studies have attempted to assess the spatial variation in values (Spurgeon et al., 2004; van Beukering et al., 2007b; van Beukering et al., 2011). These studies have made a start at examining spatial variation in coral reef values but future work is needed to develop robust methods to produce reliable value maps.
In general, the methodological rigor applied to the valuation of coral reef services has not always been high. An indication of this is the low number of coral reef valuation studies that appear in the peer reviewed academic literature. It is frequently the case that theoretically inconsistent valuation methods have been used, such as gross revenues, replacement costs or avoided damage costs. This may in part be due to the limited availability of data for the contexts in which coral reefs are located. In recent years there has been a trend towards more robust and better application of valuation methods. For this reason it may be useful to revisit some of the earlier study sites to improve the estimates on the value of coral reefs in the US.
The values summarised in this report are for the flow of services from coral reefs in their state at the time each valuation was conducted. Unfortunately, coral reefs are under pressure from a diverse array of threats and are expected to become increasingly degraded in the coming
22
A REV
IEW O
F THE
LITE
RATU
RE
decades (Burke et al, 2011). For that reason there is a need to model potential future scenarios for coral reef health, functioning and the associated provision of services. This would require collaborative work between coral reef ecologists and economists – which is not often seen.
Finally, a lot can be learned about the role of economic valuation in influencing decision making and management of coral reefs. Although, this was not systematically evaluated in this review, several small policy impacts of the economic valuation studies can be recorded (see Box 1 and Box 2 in the Annex of this report). Since justification of the public funds spent on economic valuation studies is becoming increasingly important, it is worth assessing the impact that coral reef valuation studies have had on decision making (Kushner et al, 2012). This way we can learn more on how to communicate the valuable lessons of the studies conducted in the past and in the future.
23
THE T
OTAL
ECON
OMIC
VALU
E OF U
.S. CO
RAL R
EEFS
ReferencesBateman, I.J., and Jones, A.P., (2003). Contrasting Conventional with Multi-Level Modeling Approaches
to Meta-Analysis: Expectation Consistency in U.K. Woodland Recreation Values. Land Economics 79: 235–258.
Bhat, M.G., (2003). Application of non-market valuation to the Florida Keys Marine Reserve Management. Journal Environmental Management 67 (4): 315-325.
Big Island Reef Fund http://www.malama-kai.org/
Bishop, R.C., Chapman, D.J., Kanninen, B. J., Krosnick, J.A., Leeworthy, V.R., and Meade, N.F. (2011). Non-market Valuation of Coral Reef Ecosystem Protection and Restoration: Applying the Rank-Ordered Probit Model to Internet Panel Data. Paper presented at the Association of Environmental and Resource Economists conference, Seattle, June 2011.
Bishop, R.C., Chapman, D.J., Kanninen, B. J., Krosnick, J.A., Leeworthy, V.R., and Meade, N.F. (2011). Total economic value for protecting and restoring Hawaiian coral reef ecosystems: Final Report. Silver Spring, MD: NOAA Office of National Marine Sanctuaries, Office of Response and Restoration, and Coral Reef Conservation Program. NOAA Technical Memorandum CRCP 16. 406 pp.
Brock, R.E. (1994). Beyond fisheries enhancement: artificial reefs and ecotourism. Bulletin of Marine Science, 55, 1181-1188.
Bowker, J. M., and Leeworthy, V. R., (1998). Accounting for Ethnicity in Recreation Demand: A Flexible Count Data Approach. Journal of Leisure Research, 30: 64-78.
Brander, L.M., Florax, J.G.M., and Vermaat, J.E., (2006). The empirics of wetland valuation: A comprehensive summary and meta-analysis of the literature. Environmental and Resource Economics, 33, 223-250.
Brander, L.M., Beukering van, P., and Cesar, H.S.J. (2007) The recreational value of coral reefs: a meta-analysis. Ecological Economics 63, 209-218.
Brander, L.M., Rehdanz, K., Tol, R.S.J. and van Beukering, P. (2012). The economic impact of ocean acidification on coral reefs. Climate Change Economics. DOI: 10.1142/S2010007812500029.
Brouwer, R., Langford, I.H., Bateman, I.J., and Turner, R.K., (1999). A meta-analysis of wetland contingent valuation studies. Regional Environmental Change, 1: 47-57.
Brouwer, R., Hess, S., Liu, Y., van Beukering, P., and Garcia, S., (2011). A hedonic price model of coral reef quality in Hawaii. In Bennett, J, (Ed.) The International Handbook On Non-Market Environmental Valuation. Edward Elgar, Cheltenham.
Burke, L., Reytar, K., Spalding, M., and Perry, A. (eds.), (2011) Reefs at Risk Revisited. World Resources Institute, Washington D.C.
Cesar, H.S.J. (2000). Coral reefs: their functions, threats and economic value. In: Cesar, H.S.J. (Ed.), Collected Essays on the Economics of Coral Reefs. CORDIO, Sweden.
Cesar, H., van Beukering, P., Pintz, S., Dierking, J., (2002). Economic valuation of the coral reefs of Hawaii.
Cesar, H., and van Beukering, P., (2004). Economic Valuation of the Coral reefs of Hawaii. Pacific Science, 58: 231–242.
Conservation International (2008) Economic Values of Coral Reefs, Mangroves, and Seagrasses: A Global Compilation. Center for Applied Biodiversity Science, Conservation International, Arlington, VA, USA.
English, D. B. K., Kriesel, W., Leeworthy, V.R., Wiley, P.C., 1996. Economic Contribution of Recreation Visitors to the Florida Keys/Key West. USDA Forest Service, University of Georgia, Department of Agricultural and Applied Economics, and National Oceanic and Atmospheric Administration.
24
A REV
IEW O
F THE
LITE
RATU
RE
Estudios Técnicos, 2007. Economic Assessment of Eastern Puerto Rico’s Coral Reefs and Associated Environments. San Juan, Puerto Rico.
Ghermandi, A., van den Bergh, J.C.J.M., Brander, L.M., de Groot, H.L.F., and Nunes, P.A.L.D. (2010). Values of natural and human-made wetlands: a meta-analysis. Water Resource Research, 46, 1-12.
Glass, G.V., (1976). Primary, secondary, and meta-analysis of research. Educational Researcher, 5: 3-8.
Johns, G.M., Leeworthy, V.R., Bell, F.W., and Bonn, M.A., 2003. Socioeconomic Study of Reefs in Southeast Florida. National Oceanic and Atmospheric Administration, National Ocean Service, Special Projects.
Kushner, B., Waite, R., Jungwiwattanaporn, M., and Burke, L. (2012). Influence of Coastal Economic Valuations in the Caribbean: Enabling Conditions and Lessons Learned. Working Paper. World Resources Institute, Washington, DC.
Laurans, Y., Pascal, N., Binet, T., Brander, L., Clua, E., David, G., Rojat, D., Seidl, A. (2013). Economic valuation of ecosystem services from coral reefs in the South Pacific: taking stock of recent experience. Journal of Environmental Management, 116: 135-144.
Leeworthy, V.R. & Wiley, P.C. (1996). Importance and satisfaction ratings by recreating visitors to the Florida Keys/Key West.
Leeworthy, V.R. (1991). Recreational Use Value for John Pennekamp Coral Reef State Park and Key Largo National Marine Sanctuary. NOAA.
Leeworthy, V.R. and Bowker, J.M. (1997). Nonmarket Economic User Values of the Florida Keys/Key West. NOAA/USDA.
Leeworthy, V.R. and Wiley, P.C. (1997). A Socioeconomic Analysis of the Recreation Activitiesof Monroe County Residents in the Florida Keys/Key West. NOAA.
Leeworthy, V. R. and Vanasse, P. (1999). Economic Contribution of Recreating Visitors to the Florida Keys/Key West: Updates for Years 1996-97 and 1997-98. National Oceanic and Atmospheric Administration.
Leeworthy, V.R. and Wiley, P.C. (2000). Proposed Tortugas 2000 Ecological Reserve: Final socioeconomic impact analysis of alternatives.
Londoño, L.M. and Johnston, R.J. (2012). Enhancing the reliability of benefit transfer over heterogeneous sites: A meta-analysis of international coral reef values. Ecological Economics, 78: 80-89.
Mak, J. and Moncur, J.E.T. (1998). Political Economy of Protecting Unique Recreational Resources: Hanauma Bay, Hawaii. Ambio, 27, 217-223.Maui Reef Fund http://wildhawaii.org/
Meade, N. and Leeworthy, B. (2006). NOAA’s Coral Reef Valuation Study: Understanding public preferences and values for coral reef ecosystems. NOAA’s National Ocean Service Special Projects Office, Office of Response and Restoration. Washington DC.
Millennium Ecosystem Assessment (2005) Ecosystems and human well-being: Synthesis. Washington DC, Island Press.
Moncur, J.E.T. (1973). The value of recreation areas on Oahu. Center for Governmental Development, University of Hawaii, Honolulu, Hawaii.
Nelson, J.P., and Kennedy, P.E., (2009). The use (and abuse) of meta-analysis in environmental and resource economics: an assessment. Environmental and Resource Economics, 42: 345-377.
Nijkamp, P., and Vindigni, G., 2003. The economics of biodiversity: a multivariate meta-analysis. Vrije Universiteit, Amsterdam.
Oh, C., Ditton, R.B. and J.R. Stoll. (2008). The economic value of scuba-diving use of natural and artificial reef habitats. Society & Natural Resources, 21(6), 455-468.
Rosenberger, R. S., and Loomis, J. B., (2000). Using meta-analysis for benefit transfer: in-sample convergent validity tests of an outdoor recreation database. Water Resources Research, 36: 1097-1107.
Shrestha, R. K., and Loomis, J. B., (2001). Testing a meta-analysis model for benefit transfer in international outdoor recreation. Ecological Economics, 39: 67-83.
Smith, V.K., and Pattanayak, S.K., (2002). Is Meta-Analysis a Noah’s Ark for Non-Market Valuation? Environmental and Resource Economics, 22: 271–296.
25
THE T
OTAL
ECON
OMIC
VALU
E OF U
.S. CO
RAL R
EEFS
Spurgeon, J., Roxburgh, T., O’ Gorman, S., Lindley, R., Ramsey, D., and Polunin, N., (2004). Economic Valuation of Coral Reefs and Adjacent Habitats in American Samoa. Compiled for the Department of Commerce by Jacobs in association with MRAG Americas, National Institution of Water & Atmospheric Research.
Stanley, T. D., (2001). Wheat from Chaff: Meta-Analysis as Quantitative Literature Review. Journal of Economic Perspectives, 15: 131–150.
State of Hawaii (2008) HB.3176, Relating to Administrative Penalties for Damage to Stony Coral and Live Rock. A Bill For An Act. House Of Representatives, Twenty-Fourth Legislature, 2008. State Of Hawaii.
Tabata, R.S. and Reynolds, E. (1995). Hawaii’s recreational dive industry: results and recommendations of a 1990 study.
Taylor, M.W. (2010). The existence value of Hawaiian coral reefs under conditions of cliamte changes. Masters thesis. School of Resource and Environmental Management, Simon Fraser University.
UNEP, 2006. Marine and Coastal Ecosystems and Human Well-Being: A Synthesis Report Based on the Findings of the Millennium Ecosystem Assessment. UN Environment Programme, Nairobi.
Veron, J.E.N., Hoegh-Guldberg, O., Lenton, T.M., Lough, J.M., Obura, D.O., Pearce-Kelly, P., Sheppard, C.R.C., Spalding, M., Stafford-Smith, M.G., and Rogers, A.D., (2009) The coral reef crisis: The critical importance of <350 ppm CO2. Marine Pollution Bulletin 58: 1428–1436.
Van Beukering, P. and Cesar, H. (2004a). Ecological Economic Modeling of Coral Reefs: Evaluating Tourist Overuse at Hanauma Bay and Algae Blooms at the Kı¯hei Coast, Hawaii. Pacific Science, 58: 243–260.
Van Beukering, P.J.H. & H.S.J. Cesar (2004b). Economic Analysis of Marine Managed Areas in the Main Hawaiian Islands. Report for the National Oceanic and Atmospheric Administration, Coastal Ocean Program. Washington DC. p.28.
Van Beukering, P.J.H., H.S.J. Cesar, J. Dierking and S. Atkinson (2004) Recreational Survey in Selected Marine Managed Areas in the Main Hawaiian Islands. Report for the Division of Aquatic Resources (DAR) and the Department of Business, Economic Development & Tourism (DBEDT), Honolulu, p.14.
Van Beukering, P., Haider, W., Wolfs, E., Liu, Y., van der Leeuw, K., Longland, M., Sablan, J., Beardmore, B., di Prima, S., Massey, E., Cesar, H., Hausfather, Z., (2006). The Economic Value of the Coral Reefs of Saipan, Commonwealth of the Northern Mariana Islands. Cesar Environmental Economics Consulting, Arnhem, The Netherlands.
Van Beukering, P., Brander, L., Tompkins, E. and McKenzie, E., (2007a) Valuing the Environment in Small Islands - An Environmental Economics Toolkit. Joint Nature Conservation Committee (JNCC), Peterborough, p.128.
Van Beukering, P., Haider, W., Longland, M., Cesar, H., Sablan, J., Shjegstad, S., Beardmore, B., Liu, Y., Omega Garces, G., (2007b). The economic value of Guam’s coral reefs. University of Guam Marine Laboratory Technical Report No. 116.
Van Beukering, P. Brander, L., Van Zanten, B., Verbrugge, E., Lems, K., (2011). The Economic Value of the Coral Reef Ecosystems of the United States Virgin Islands. IVM Report number: R-11/06.
Woodward, R. T., and Wui, Y.S., (2000). The economic value of wetland services: a meta-analysis. Ecological Economics, 37: 257-270.
26
A REV
IEW O
F THE
LITE
RATU
RE
Annex: Policy impacts of the economic valuation studies
Case 1. Marine Recreation Operators Join Forces with Conservationists in HawaiiHawaii’s coastal waters are blessed with miles of exquisite coral reefs. More than 25% of the islands’ marine life is found nowhere else on earth. Because government budgets for marine protection are not sufficient, particularly in Hawaii where government funding for marine management is among the lowest in the US, private action and private money are essential in helping to ensure that the Hawaiian reefs are protected.
Recognising the need to support the state’s work, dive and snorkel operators and local conservation organizations joined forces in 2005 to raise money for marine conservation on Big Island and Maui. Through an innovative new program called the Reef Fund, dive and snorkel operators solicit voluntary donations from their clients to fund high priority marine protection programs on their islands, such as the repair and installation of mooring buoys, the protection of nesting and resting beaches for rare and endangered sea turtles and monk seals, and the establishment of local education and outreach programs to protect marine resources.
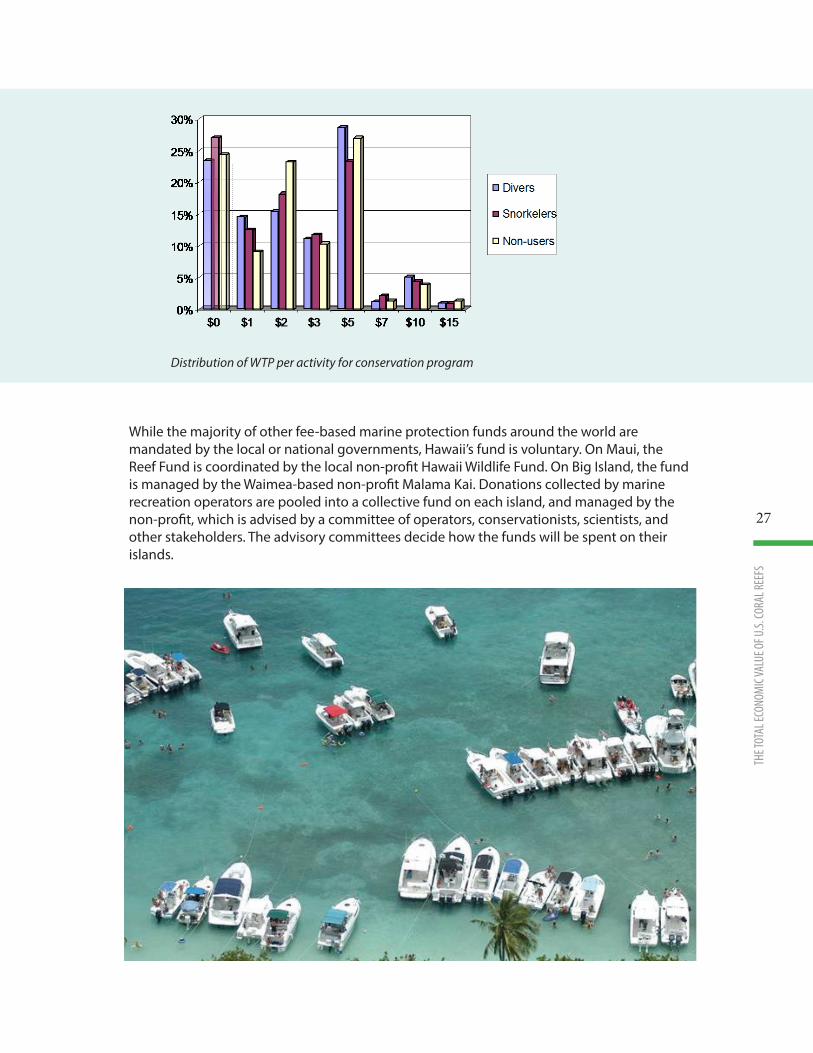
Originally, the private industry feared the negative impact for their business of requesting their customers to contribute to conservation. A 2003 survey conducted by Cesar and Van Beukering for TNC and the State Division of Aquatic Resources, however, indicated that 80% of those surveyed were willing to pay at least US$5 per snorkel/dive day for marine resource protection programs if the funds went to a private institution or non-profit and were not managed by a government agency (Van Beukering and Cesar, 2004; Van Beukering et al., 2004).
27
THE T
OTAL
ECON
OMIC
VALU
E OF U
.S. CO
RAL R
EEFS
While the majority of other fee-based marine protection funds around the world are mandated by the local or national governments, Hawaii’s fund is voluntary. On Maui, the Reef Fund is coordinated by the local non-profit Hawaii Wildlife Fund. On Big Island, the fund is managed by the Waimea-based non-profit Malama Kai. Donations collected by marine recreation operators are pooled into a collective fund on each island, and managed by the non-profit, which is advised by a committee of operators, conservationists, scientists, and other stakeholders. The advisory committees decide how the funds will be spent on their islands.
Distribution of WTP per activity for conservation program
28
A REV
IEW O
F THE
LITE
RATU
RE
Case 2. Administrative penalties for damage to coral reefs in HawaiiThroughout the years, the U.S. has enacted several laws that enable trustees to recover damages for injuries to resources under certain circumstances. Funds recovered via Natural Resource Damage Assessments (NRDAs) are commonly used to pay for restoration of the damaged resources. The original procedure of NRDAs was that trustees assess the damage, determine the amount of physical restoration that is necessary, and seek the cost of restoration from the responsible party.
Economic valuation is not traditionally used in standard NRDA. It is the cost of the restoration that matters to the trustees, not the value of the resources that are degraded. However, this approach to damage assessment is gradually changing. Increasingly, trustees have pursued both NRDA damages and civil penalties for the same incident. For example, supported by economic valuation studies, the Florida Keys National Marine Sanctuary introduced a schedule of escalating fines for injury to living coral based on the area of impact.
A similar process of integrating economic valuation in setting penalties is ongoing in Hawaii. Hawaii’s coral reef ecosystems provide a wide range of services to coastal populations, such as fisheries, tourism, biodiversity, and natural protection. These same coral reefs are under constant pressure from harmful activities such as anchoring, ship grounding and coastal development. Penalizing such damage, not only discourages potential violators from exercising pressure on the reef, but also provides the wardens with means for better management.
Because of the absence of a workable system of penalties for coral reef damage in Hawaii many violators were not punished for causing damage to the reef, despite the fact that the damage to the reef was well documented and the violator identified. It was hard to determine a reasonable penalty because of the way the present law is written. Recently, the bill H.B.3176 was proposed to give the Department of Land and Natural Resources (DLNR) the authority to impose fines for large-scale reef damage (State of Hawaii, 2008). A fine of up to US$5,000 per square meter is consistent with laws in other states and with the value of the reef. H.B.3176 addresses the urgent need to have natural resource laws that are complete, clear and enforceable, and providing appropriate opportunities for administrative enforcement. In setting the level of the penalties, use was made of the economic valuation study for coral reefs in Hawaii (Cesar and van Beukering, 2004b).
29
THE T
OTAL
ECON
OMIC
VALU
E OF U
.S. CO
RAL R
EEFS

30
A REV
IEW O
F THE
LITE
RATU
RE
http://coralreef.noaa.gov/
NOAA Coral Reef Conservation Program, N/OCRM1305 East West Highway, 10th FloorSilver Spring, MD 20910-3281