Embed Size (px)
Citation preview

US EQUITY MARKET STRUCTURE:
LESSONS FROM AUGUST 24OCTOBER 2015
The opinions expressed are as of October 2015 and may change as subsequent conditions vary.
Barbara Novick Vice Chairman
Hubert De Jesus, Co-Head of Market
Structure and
Electronic Trading
Samara CohenUS Head of iShares
Capital Markets
Supurna VedBratCo-Head of Market
Structure and
Electronic Trading
Introduction
The events in the US equity market on August 24, 2015 marked the first true
opportunity to assess the efficacy of reforms implemented in response to the 2010
“Flash Crash”,1 such as individual stock trading halts, policies to address erroneous
transactions, and the market-wide circuit breaker. For most of the day, the market
functioned and remained accessible to investors at record-setting trading levels and
volatility. But, during the first hour of trading, a tumultuous US market open
precipitated rapid, anomalous price moves in many stocks, exchange-traded
products (ETPs), and closed-end funds (CEFs). This ViewPoint examines the
events of that first hour.
August 24 reminds us that we live in a world of increasing volatility, as technology
and many other dynamics impact capital markets from equities to fixed income. For
example, it was only a year ago that we experienced the Treasury “Flash Rally” on
October 15, 2014. With the recognition that moments of high volatility and
discontinuous pricing may be a persistent aspect of today’s markets, we see a need
for market participants, exchanges, and regulators to improve the US equity market’s
ability to cope with extraordinary volatility.
In this ViewPoint, we discuss the lessons from August 24 and analyze the brief
breakdown in the arbitrage mechanism for many US-listed ETPs that invest in US
equities. We believe that the industry and regulatory response should first focus on
facilitating the free flow of pricing and order information across the US equity market
ecosystem. We share recommendations to refine trading mechanisms and “guard
rails” to enhance the resiliency of the US equity market, which we believe will
promote fair and orderly markets and benefit the functioning of both ETPs and
individual stocks. As discussed throughout this ViewPoint, proposed improvements
must balance attempts to improve market resiliency with the preservation of the
existing and well-functioning processes through which equity securities are traded
today.
Recent Volatility in the US Equity Market
In late August 2015, the US equity market experienced a rapid spike in volatility as
global market sentiment weighed bearishly on stocks. During that period, the VIX
volatility index doubled2 and equity trading volumes surged as investors reassessed
global growth prospects and inflation expectations.
Market activity on August 24 was particularly extreme. Before the market opened,
global equity markets were down 3% to 5% and the e-mini S&P 500 future was limit
down 5% in pre-market trading before wider price curbs went into effect at 9:30am.3
Due to these pre-opening factors, the morning began under selling pressure with
substantial order imbalances at the open as investors reacting to global macro
concerns flooded the marketplace with aggressive orders to sell (that is, orders to
sell without any restrictions as to price or timeframe such as market and stop-loss
sell orders). According to the New York Stock Exchange (NYSE), the volume of
Ananth Madhavan,
PhD, Global Head of
Research for iShares
Alexis RosenblumGovernment Relations
& Public Policy
Richard PragerHead of Trading &
Liquidity Strategies
Martin SmallUS Head of iShares
[ 2 ]
EXECUTIVE SUMMARY
Contributors to disruptions on the morning of August 24:
1. A confluence of US equity market issues exposed structural flaws that impeded the flow of order and pricing
information, halted trading, and delayed the open for various securities.
Widespread selling pressure led to pre-market price declines in futures and a surge in market orders.
Almost half of New York Stock Exchange (NYSE)-listed equities had not opened by 9:40am.4 Exchange rules limited pre-
open pricing information on those securities.
Many stocks that opened on time began trading at abnormally low levels (e.g., down 20%).
Trading in hundreds of securities was repeatedly halted by Limit-Up Limit-Down (LULD) rules, including 773 Limit Up halts
and 505 Limit Down halts.5
2. The US equity ETP arbitrage mechanism was temporarily impaired due to disruptions stemming from the above issues.
~20% of US-listed ETPs were halted from trading at some point during the day.6
ETPs depend on market makers to arbitrage price discrepancies between share price and underlying portfolio value.
Market makers in US equity ETPs, in particular, required near-100% price transparency across the US equity market to
determine when arbitrage opportunities were available and implement hedges.
Arbitrage ceased temporarily on many US ETPs amid the lack of price indications, widespread anomalous single stock
pricing, uncertainty around hedging due to fear of “broken trades,” delayed opens and trading halts in many stocks. The
result was price dislocations or disparate behavior between comparable ETPs, similar to the experience of individual stocks.
The issues were primarily concentrated in US-listed ETPs that invest in US equities. 7 US-listed ETPs that invest in non-US
equities or bonds and ETPs listed in other countries generally traded normally.
After the first hour, the market and ETP arbitrage functioned well. August 24 was the second-highest trading day in US
equity history; ETPs comprised 37% of that flow.8
3. Excessive use of market and stop-loss orders that seek “liquidity at any price” inflamed the situation.
When markets are volatile, liquidity can come at a cost.
Market and stop-loss orders that demand “liquidity at any price” added to selling pressure and proved especially risky on
the morning of August 24.
Recommendations for enhancing US equity market resiliency:
There is no “silver bullet” or single solution to the issues observed on August 24. We believe all of these recommendations are
important and should be considered holistically.
1. Harmonize trading rules among futures, options, individual stocks, and ETPs. Any new rules should be designed
consistently across the equity market ecosystem and its individual components, including cash equities, listed options,
futures, and ETPs, as well as their associated regulatory regimes. Discordant rules create complexity, conflicts, and
increased risk of regulatory arbitrage.
2. Recalibrate Limit-Up Limit-Down (LULD) rules. Apply a consistent price band throughout the day (instead of wider bands
at the open and close). Policy makers and market participants should work together to recalibrate LULD rules by identifying
the optimal combination of trading pause and limit state. Align LULD rules for futures, individual stocks, options, and ETPs,
recognizing linkages across markets. Recognize limitations of LULD during market-wide events.
3. Consider revising market-wide circuit breakers. Assess whether lower thresholds that would be tripped more frequently
than the current thresholds (such as thresholds that would be tripped annually) would enhance the market’s ability to respond
under stress. Second, add a market-wide circuit breaker that would be triggered if a significant number of individual
securities are halted or disrupted (further analysis needed to determine the appropriate thresholds).
4. Ensure transparency and timeliness of the primary market open. Extend automated pre-open imbalance data feeds until
each stock opens when NYSE Rule 48 is in effect. Revise auction collars and consider moving to further automated opening
procedures to ensure continuity and completeness of information.
5. Eliminate uncertainty in the determination of “clearly erroneous” trades. Create clarity of “erroneous” pricing by
aligning definitions with LULD rules – so prices executable on an exchange are inherently valid trades.
6. Issuers (of both stocks and ETPs) should be proactive in considering an exchange’s auction processes and trading
rules before listing their securities. Issuers should ensure that exchanges have procedures that promote fair and orderly
markets in their securities. ETP sponsors and public companies can shape better outcomes by engaging with exchanges to
prioritize market structure improvements that protect investors and discourage disruptive activity.
7. Educate investors on how to navigate the modern US equity market. Customer-facing broker-dealers should consider
whether there is more to do to raise investor awareness regarding usage of market and stop-loss orders in volatile periods,
especially at the open or close.
[ 3 ]
market orders on August 24 was four times the number of
market orders observed on an average trading day.
Extensive use of market and stop-loss orders overwhelmed
the immediate supply of liquidity, leading to severe price gaps
that triggered numerous LULD trading halts.
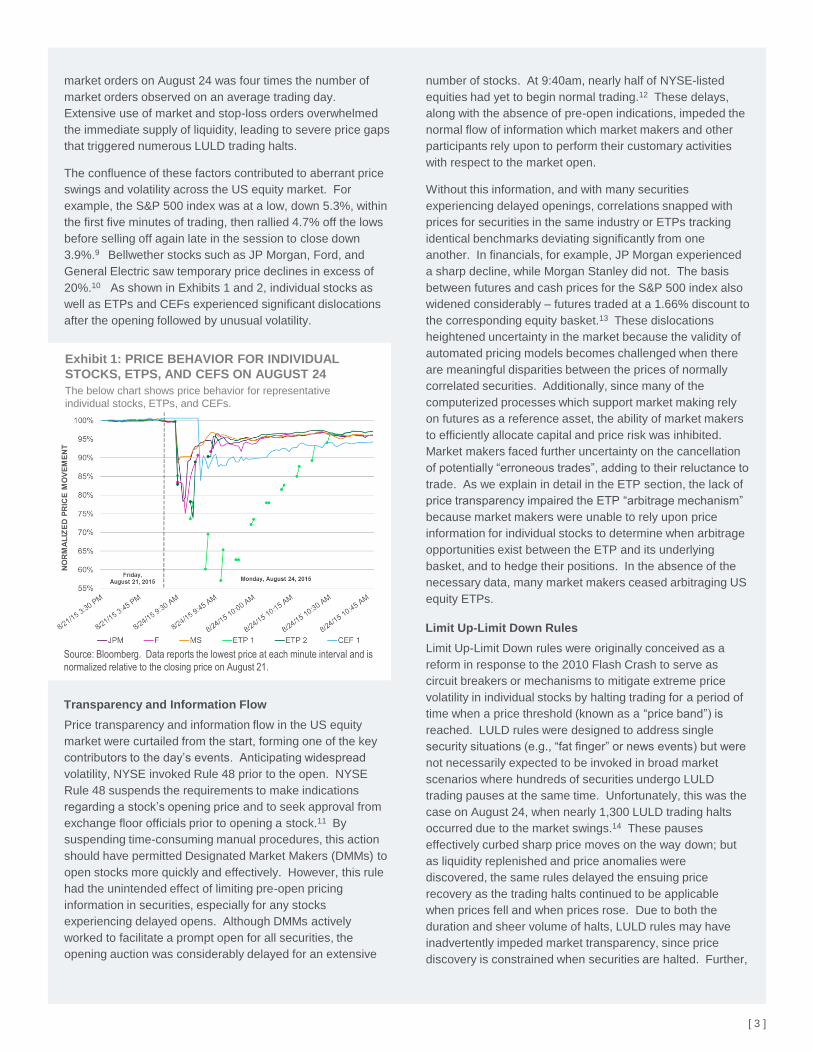
The confluence of these factors contributed to aberrant price
swings and volatility across the US equity market. For
example, the S&P 500 index was at a low, down 5.3%, within
the first five minutes of trading, then rallied 4.7% off the lows
before selling off again late in the session to close down
3.9%.9 Bellwether stocks such as JP Morgan, Ford, and
General Electric saw temporary price declines in excess of
20%.10 As shown in Exhibits 1 and 2, individual stocks as
well as ETPs and CEFs experienced significant dislocations
after the opening followed by unusual volatility.
number of stocks. At 9:40am, nearly half of NYSE-listed
equities had yet to begin normal trading.12 These delays,
along with the absence of pre-open indications, impeded the
normal flow of information which market makers and other
participants rely upon to perform their customary activities
with respect to the market open.
Without this information, and with many securities
experiencing delayed openings, correlations snapped with
prices for securities in the same industry or ETPs tracking
identical benchmarks deviating significantly from one
another. In financials, for example, JP Morgan experienced
a sharp decline, while Morgan Stanley did not. The basis
between futures and cash prices for the S&P 500 index also
widened considerably – futures traded at a 1.66% discount to
the corresponding equity basket.13 These dislocations
heightened uncertainty in the market because the validity of
automated pricing models becomes challenged when there
are meaningful disparities between the prices of normally
correlated securities. Additionally, since many of the
computerized processes which support market making rely
on futures as a reference asset, the ability of market makers
to efficiently allocate capital and price risk was inhibited.
Market makers faced further uncertainty on the cancellation
of potentially “erroneous trades”, adding to their reluctance to
trade. As we explain in detail in the ETP section, the lack of
price transparency impaired the ETP “arbitrage mechanism”
because market makers were unable to rely upon price
information for individual stocks to determine when arbitrage
opportunities exist between the ETP and its underlying
basket, and to hedge their positions. In the absence of the
necessary data, many market makers ceased arbitraging US
equity ETPs.
Limit Up-Limit Down Rules
Limit Up-Limit Down rules were originally conceived as a
reform in response to the 2010 Flash Crash to serve as
circuit breakers or mechanisms to mitigate extreme price
volatility in individual stocks by halting trading for a period of
time when a price threshold (known as a “price band”) is
reached. LULD rules were designed to address single
security situations (e.g., “fat finger” or news events) but were
not necessarily expected to be invoked in broad market
scenarios where hundreds of securities undergo LULD
trading pauses at the same time. Unfortunately, this was the
case on August 24, when nearly 1,300 LULD trading halts
occurred due to the market swings.14 These pauses
effectively curbed sharp price moves on the way down; but
as liquidity replenished and price anomalies were
discovered, the same rules delayed the ensuing price
recovery as the trading halts continued to be applicable
when prices fell and when prices rose. Due to both the
duration and sheer volume of halts, LULD rules may have
inadvertently impeded market transparency, since price
discovery is constrained when securities are halted. Further,
Source: Bloomberg. Data reports the lowest price at each minute interval and is
normalized relative to the closing price on August 21.
Exhibit 1: PRICE BEHAVIOR FOR INDIVIDUAL
STOCKS, ETPS, AND CEFS ON AUGUST 24
The below chart shows price behavior for representative
individual stocks, ETPs, and CEFs.
Transparency and Information Flow
Price transparency and information flow in the US equity
market were curtailed from the start, forming one of the key
contributors to the day’s events. Anticipating widespread
volatility, NYSE invoked Rule 48 prior to the open. NYSE
Rule 48 suspends the requirements to make indications
regarding a stock’s opening price and to seek approval from
exchange floor officials prior to opening a stock.11 By
suspending time-consuming manual procedures, this action
should have permitted Designated Market Makers (DMMs) to
open stocks more quickly and effectively. However, this rule
had the unintended effect of limiting pre-open pricing
information in securities, especially for any stocks
experiencing delayed opens. Although DMMs actively
worked to facilitate a prompt open for all securities, the
opening auction was considerably delayed for an extensive

[ 4 ]
Exhibit 2: INDIVIDUAL STOCKS AND ETPS EXPERIENCED SIMILAR ISSUES ON AUGUST 24
Representative Individual Stock (KKR)
Representative ETP
Source: TAQ, Nasdaq. For illustrative purposes only. Width of bubbles represents volume for each individual trade. Note that some of the reopening trades in the ETP
example are reported individually instead of as a block transaction meaning that there are multiple small bubbles instead of one large bubble as shown for the opening.

market makers needed to reinstate their automated pricing
systems manually to resume trading once the trading halts
were lifted. These manual and time-consuming modifications
added to the disruption as many firms were not staffed to
handle the volume of trading halts that occurred on August 24.
Exchange-Traded Products
The market forces discussed above led to a temporary
breakdown in the arbitrage mechanism of many ETPs. 327
ETPs experienced LULD halts on August 24.15 Many ETPs
also experienced brief periods where they traded at
significant discounts to the value of their underlying portfolio
holdings. As a result, the events of August 24 left many
investors dissatisfied with the prices at which trades were
executed and raised concerns about the functioning of
markets and ETPs. Further, like individual stocks, the
confluence of order imbalances, lack of information flow, and
opening issues contributed to differing experiences, even for
comparable ETPs. Retail investors who had standing stop-
loss orders were especially impacted – once the stop price
was reached, the orders were converted into market orders,
which were often executed at prices that were markedly lower
than the stop price (see Exhibit 11 for an explanation of the
various order types). As stop-loss orders are typically
intended to be used to mitigate losses, investor education
about the risks of stop-loss orders should be significantly
increased, as discussed on page 13 under “Investor
Education”.
Auction Constraints. Many ETPs experienced severe price
moves after the open or the re-open following a trading halt.
This phenomenon was heavily influenced by the size of the
NYSE Arca auction collars, which prevent the auction price
(e.g., opening price or price after a halt) from executing
outside of a specified price range. Over 85% of US ETPs are
listed on NYSE Arca, so the rules and mechanisms on this
specific exchange have an inordinately pervasive impact on
the trading activity observed in ETPs.16 The auction collars in
effect on August 24 were 5% for securities priced from $0.01
to $25.00, 2% for securities priced from $25.01 to $50.00,
and 1% for securities priced greater than $50.00.17 For
example, for an ETP whose last price was $100, the auction
collar would have been $99 to $101. Normally, these collars
ensure that a security does not open materially away from the
last trade. However, in volatile markets when there are
material imbalances of buying or selling, restrictive price
collars can constrain the auction price and result in significant
unfilled residual demand, which is then released into the
order book. The ensuing order imbalance amplifies volatility
and acutely increases the likelihood of an immediate LULD
halt following an auction. Indeed, this was the result on
August 24, as a substantial number of the ETP trading halts
were initiated within the first minute of trading after the
opening auction or resumption of trading following a LULD
pause (see Exhibit 3).
“Arbitrage Mechanism”. The experience of ETPs, in part,
reflects that ETPs are more reliant than individual stocks on
market makers to keep the price of the ETP aligned with the
value of its underlying holdings. Market makers typically will
buy ETP shares trading at a discount to the value of the
ETP’s underlying holdings in order to earn arbitrage profits.
Under most conditions, this activity keeps the ETP share
price closely aligned with the value of the underlying
holdings. If this “arbitrage mechanism” is temporarily
disrupted, the ETP will trade similarly to a closed-end fund,
which may entail significant discounts or premiums as
observed on August 24. ETP arbitrage is facilitated by the
fact that the value of most ETP shares normally can be
readily compared to the value of the ETP’s holdings. This
allows market participants to act swiftly when the exchange
price of an ETP’s shares deviates from the current value of
the ETP’s underlying holdings. This “arbitrage mechanism”
incentivizes authorized participants (APs)18 to create or
redeem ETP shares in a manner that adjusts the supply of
outstanding ETP shares to match market demand. As a
result, the ETP’s share price on the exchange is usually
aligned with the value of the ETP’s underlying holdings. An
effective ETP arbitrage mechanism requires the combination
of several distinct factors, which we group into three19 broad
categories:
(i) Valuation clarity is the ability to value ETP shares and
requires that the current intrinsic value of the ETP’s
portfolio holdings can be determined intraday without
substantial uncertainty.
(ii) Access relates to market participants’ ability to provide
liquidity by means of arbitrage trades when discrepancies
arise between an ETP’s intrinsic underlying portfolio value
and the price of the ETP’s shares. To do so, market
participants generally require the ability to construct a
hedge that offsets the risks of being long or short an
ETP’s shares. As such, if market makers and other
market participants are unable to hedge a position in an
ETP’s shares, they will not commit capital to provide
liquidity in such shares.
(iii)Certainty of execution refers to the confidence that market
participants require regarding whether both their ETP
[ 5 ]
Exhibit 3: AUGUST 24 LULD HALTS BY TIME FROM
START OF TRADING AND EXCHANGE
Trading
Time
Elapsed BATS NASDAQ NYSE
NYSE
Arca
NYSE
MKT
< 1m 2 57 11 520 1
1-5m 1 30 15 242 0
5-15m 0 25 10 96 0
>15m 0 82 42 141 3
Source: TAQ.
trades and associated hedge trades will stand or whether
they will be exposed to unhedged risks if some portion of
the trades are cancelled. When securities are able to
trade at prices which may fall within erroneous trade
guidelines, certainty of execution is absent and market
makers may be inclined to reduce trading activity rather
than potentially be exposed to unhedged risks from
subsequent trade cancellations.
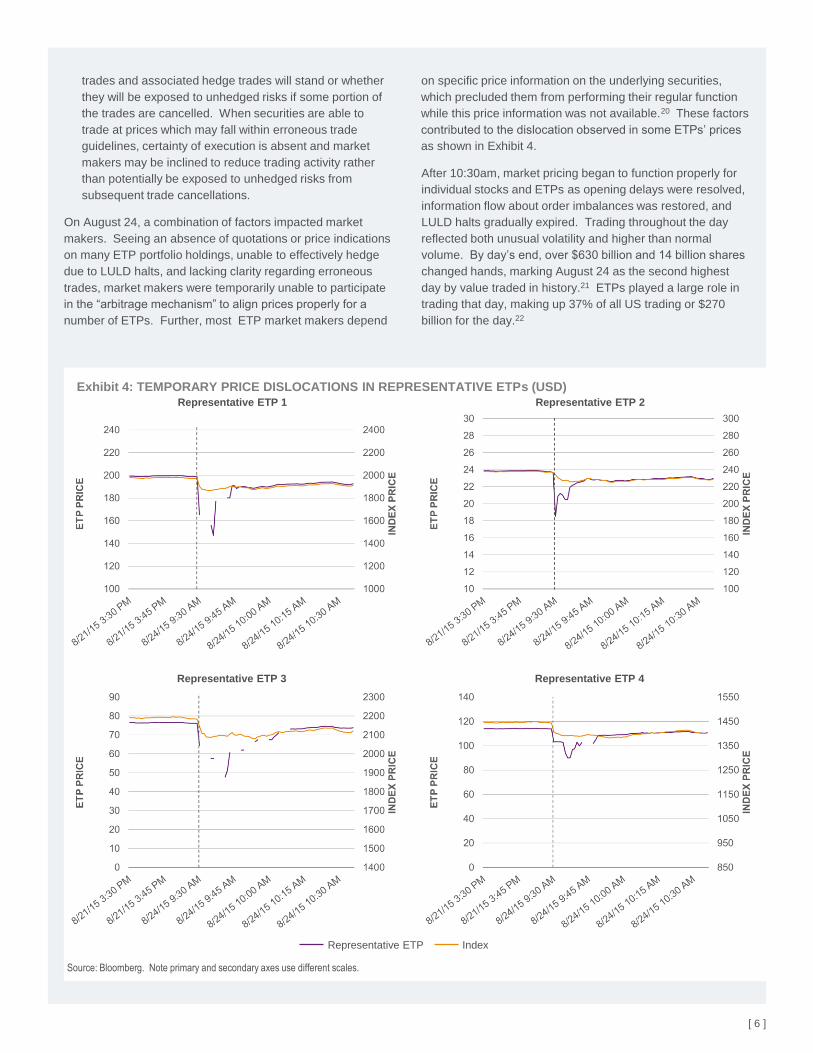
On August 24, a combination of factors impacted market
makers. Seeing an absence of quotations or price indications
on many ETP portfolio holdings, unable to effectively hedge
due to LULD halts, and lacking clarity regarding erroneous
trades, market makers were temporarily unable to participate
in the “arbitrage mechanism” to align prices properly for a
number of ETPs. Further, most ETP market makers depend
on specific price information on the underlying securities,
which precluded them from performing their regular function
while this price information was not available.20 These factors
contributed to the dislocation observed in some ETPs’ prices
as shown in Exhibit 4.
After 10:30am, market pricing began to function properly for
individual stocks and ETPs as opening delays were resolved,
information flow about order imbalances was restored, and
LULD halts gradually expired. Trading throughout the day
reflected both unusual volatility and higher than normal
volume. By day’s end, over $630 billion and 14 billion shares
changed hands, marking August 24 as the second highest
day by value traded in history.21 ETPs played a large role in
trading that day, making up 37% of all US trading or $270
billion for the day.22
[ 6 ]
Exhibit 4: TEMPORARY PRICE DISLOCATIONS IN REPRESENTATIVE ETPs (USD)
Representative ETP 1 Representative ETP 2
Representative ETP 3 Representative ETP 4
Representative ETP Index
Source: Bloomberg. Note primary and secondary axes use different scales.
There are a variety of liquidity providers in modern equity
markets as the landscape has changed strikingly over time.
Traditionally, the function was performed by broker-dealers,
exchange specialists, or designated market makers
(DMMs). However, regulations, advances in technology,
broker-dealer balance sheet constraints, and market
complexity have advantaged faster and more electronic
participants. Today, market making is primarily conducted
by electronic market makers and high frequency
arbitrageurs, collectively known as proprietary trading firms.
Market makers facilitate the exchange of securities between
end-investors by bridging the gap between the time when
natural buyers and natural sellers enter the market. A
willing buyer of a given stock is unlikely to simultaneously
arrive in the market as a willing seller, much less agree on
price. Liquidity providers intermediate the transaction
between the buyer and the seller, and by performing this
valuable function they provide immediacy of execution to
investors.
Exchange-registered market makers have responsibilities to
maintain fair and orderly markets and continuously quote on
a two-sided basis in their securities. That said, their
obligations are not unlimited. For instance, NYSE DMMs
[ 7 ]
are only required to quote at the National Best Bid or Offer
(NBBO) for 10-15% of the trading day. When they are not
quoting the best bid or offer, their quotation can be as wide
as 8% away from the last reported sale.23 Additionally,
the majority of other participants that provide liquidity to the
market are not subject to any obligations to make markets.
This is important to note because in times of extreme
stress, market makers do not “support” the market. They
are not buyers of last resort. Because market makers
must manage their risk and maintain adequate capital,
their capacity can be overwhelmed in the face of broad-
based and unabated buying or selling. During periods of
market-wide uncertainty, market makers can become risk
averse. This has always been true of liquidity providers
and has not changed as a result of the advent of electronic
or high frequency trading. The Brady Commission Report
on the 1987 crash found that market makers formally
withdrew from the markets, stopped answering their
telephones, and were only willing to fulfill their minimum
obligations at the quote.24 Recognizing that this is an
important dynamic present in today’s US equity market,
reforms should focus on ensuring appropriate mechanisms
are in place to encourage market maker participation
during periods of significant volatility.
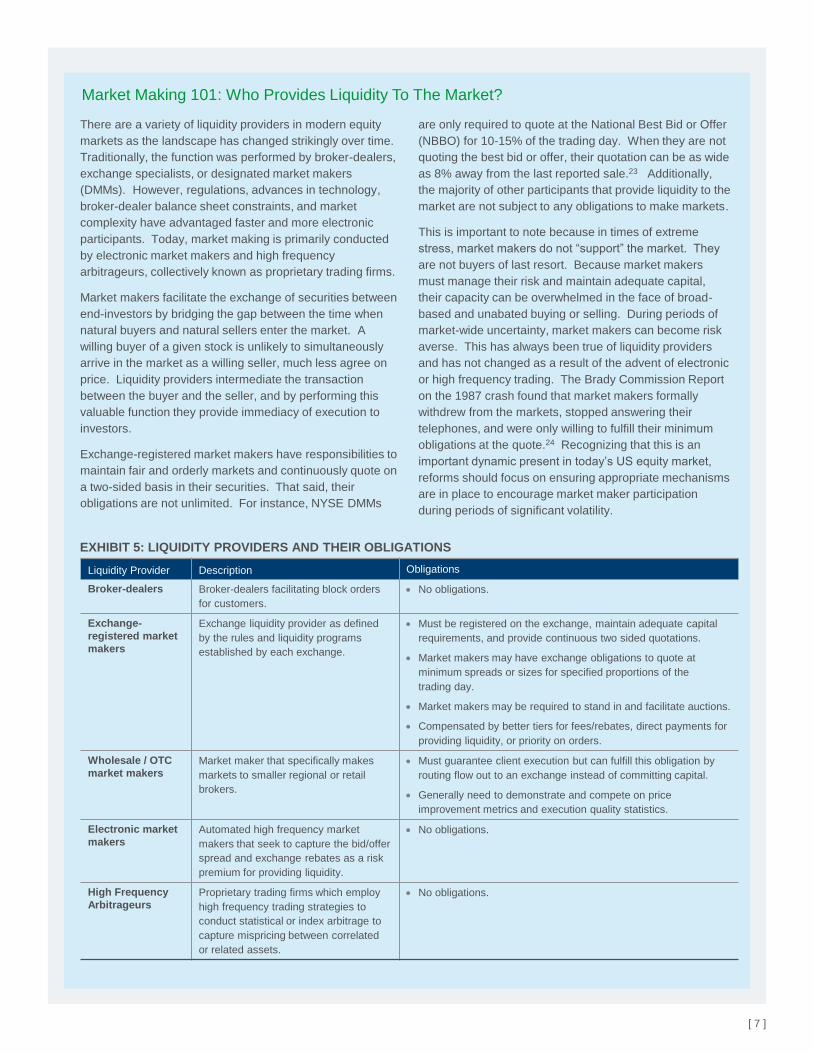
Market Making 101: Who Provides Liquidity To The Market?
Liquidity Provider Description Obligations
Broker-dealers Broker-dealers facilitating block orders
for customers.
No obligations.
Exchange-
registered market
makers
Exchange liquidity provider as defined
by the rules and liquidity programs
established by each exchange.
Must be registered on the exchange, maintain adequate capital
requirements, and provide continuous two sided quotations.
Market makers may have exchange obligations to quote at
minimum spreads or sizes for specified proportions of the
trading day.
Market makers may be required to stand in and facilitate auctions.
Compensated by better tiers for fees/rebates, direct payments for
providing liquidity, or priority on orders.
Wholesale / OTC
market makersMarket maker that specifically makes
markets to smaller regional or retail
brokers.
Must guarantee client execution but can fulfill this obligation by
routing flow out to an exchange instead of committing capital.
Generally need to demonstrate and compete on price
improvement metrics and execution quality statistics.
Electronic market
makersAutomated high frequency market
makers that seek to capture the bid/offer
spread and exchange rebates as a risk
premium for providing liquidity.
No obligations.
High Frequency
ArbitrageursProprietary trading firms which employ
high frequency trading strategies to
conduct statistical or index arbitrage to
capture mispricing between correlated
or related assets.
No obligations.
EXHIBIT 5: LIQUIDITY PROVIDERS AND THEIR OBLIGATIONS
Recommendations to Address Extraordinary
Market Volatility
In light of the market’s response to recent market volatility,
further adjustments to the existing framework are necessary.
Enhancements that increase transparency and clarity of
value in times of stress will improve the ability of market
participants to function properly. BlackRock recommends
that policy makers and market participants consider several
components of market structure:
1. Harmonize trading rules among futures, options, individual
stocks, and ETPs.
2. Recalibrate Limit Up-Limit Down rules.
3. Consider revising the market-wide circuit breakers.
4. Ensure transparency and timeliness of the primary
market open.
5. Eliminate uncertainty in the determination of “clearly
erroneous” trades.
6. Issuers (of both stocks and ETPs) should be proactive in
considering an exchange’s auction processes and trading
rules before listing their securities.
7. Educate investors on how to navigate the modern US
equity market.
Harmonize Trading Rules Among Futures, Options,
Individual Stocks, and ETPs
While references to the “equity market” often conjure up
notions of individual stocks, in today’s markets, futures,
options, and ETPs play a critical role in facilitating price
discovery and promoting the overall functioning of the equity
market ecosystem. In general, we believe that policy makers
should take a holistic approach to market structure in order to
affect meaningful change, as policies that address only one
segment tend to shift risks to other parts of the ecosystem as
opposed to mitigating those risks. We recommend that policy
responses to the events on August 24 consider all
components of the equity market ecosystem, including
stocks, futures, options, and ETPs.
In thinking about August 24 and potential recommendations,
we considered whether or not ETPs should be halted from
trading when a significant number of underlying stocks are
halted. We concluded, however, that this was not the most
effective approach given that ETPs can provide valuable
price discovery for their underlying stocks during dislocations.
For example, ETPs traded before most underlying stocks
were opened on September 17, 2001 (the first day of trading
after the September 11 attacks) and proved to be accurate
predictors of major benchmark levels once all stocks were
opened.25 Similarly, ETPs based on international stock or
fixed income benchmarks regularly trade without concurrent
price information from underlying markets (e.g., Japanese
equities during NY trading hours). Further, many ETPs based
on US large capitalization stock benchmarks traded
continuously and in line with underlying stock values through-
out the morning of August 24. As a result, we concluded that
preventing ETPs from trading when a significant number of
the underlying securities are halted is not a desirable
response and could have unintended negative consequences
for market liquidity. Although it is tempting to single out ETPs,
we believe it is essential to address the underlying equity
market structure issues to improve the investor experience in
both individual stocks and ETPs.
As discussed in more detail below, we keep coming back to
the importance of information transparency and aligning
market trading rules to reduce uncertainty and unnecessary
complexity. We recognize that these issues span regulators
and exchanges and strongly encourage a coordinated
response to avoid unintended consequences or regulatory
arbitrage from inconsistent rules.26
Limit Up-Limit Down Procedures
The LULD mechanism is a sensible safeguard introduced to
protect investors from sudden unanticipated price movements
in individual stocks. Under the LULD plan, price bands (i.e.,
thresholds) are established for each security according to its
price, its average trading volume, and the time of day. If the
quotes for a stock are outside of its specified price bands the
security enters into a 15 second “limit state”. The limit state is
a grace period during which the market can quickly reverse
an anomalous price move; trading is still permitted within the
price bands and the security can intrinsically exit the limit
state if the quotes revert. A LULD trading pause, which
suspends all trading for 5 minutes for individual stocks and
ETPs, is only declared if the stock does not exit the limit state
within 15 seconds. When the stock has been halted,
investors must wait until the primary exchange re-opens the
security before trading can resume. The LULD halt is
designed to allow market participants to react to material
supply and demand imbalances before resuming trading.
LULD is a helpful protection when idiosyncratic events impact
one or a handful of securities. However, August 24, with
nearly 1,300 LULD events, demonstrated that LULD rules are
less effective for market-wide events where multiple securities
trigger LULD halts at the same time. Notably, August 24 was
the first large-scale assessment of the LULD plan since its
implementation after the 2010 Flash Crash. To put this in
[ 8 ]
“Enhancements that increase transparency
and clarity of value in times of stress will
improve the ability of market participants to
function properly.”
perspective, there were only 8,515 LULD events since the
inception of LULD in 2013 and the end of 2014.27 Overall,
the trading halts seem to have worked as designed to stem
the sharp sell-off. However, upon further consideration, we
believe that other solutions, such as the market-wide circuit
breakers discussed in the following section would be more
effective in addressing market-wide events. That said, to
improve the overall effectiveness of LULD rules as a
protection for individual securities, we believe that there is a
need to improve the consistency of LULD rules throughout
the trading day and across the entire equity market ecosystem.
In particular, under the current LULD rules, the price bands
which trigger a LULD event are currently doubled during the
first 15 minutes and last 25 minutes of the trading day.28
We believe that this doubling is inconsistent with the objective
to address severe price volatility, as the open is precisely the
time of day when volatility is greatest and firmer controls are
needed (see Exhibit 12). Additionally, wider bands across
different windows of time create asymmetry in the market’s
ability to recover after prices have moved too far too fast. For
example, suppose a stock triggers a 10% limit down trading
pause at 9:42am (e.g., it falls from $100 to $90). In order to
fully correct, the stock must endure two 5% limit up halts
because any reversal will develop after 9:45am, when the
price bands are no longer doubled. This observation is
supported by the LULD evidence from August 24 when there
were 773 Limit Up halts, outnumbering 505 Limit Down
halts.29 The skew in the price bands arbitrarily constrains the
security and introduces delays to the market’s ability to self-
correct extraordinary price dislocations that arise within the
first 15 minutes and last 25 minutes of the trading day.
BlackRock recommends that the LULD price bands should
not be doubled around the open or close, and instead one
appropriately calibrated threshold should be used for the full
duration of the trading session.
Further, we note the inconsistency between the 5 minute
trading pause required by the LULD plan for equity securities
such as individual stocks and ETPs and the 2 minute trading
halts for CME futures. This disparity highlights the importance
of a coordinated response and a need to harmonize rules for
futures and equities. For many securities on August 24, the
length of the LULD halts appear to have prolonged the
persistence of price dislocations by preventing securities from
reverting back more rapidly to their correct prices. Another
idea that should be considered is establishing a longer
timeframe for the limit state instead of fully suspending
trading in a security, to provide a natural mechanism for the
market to recover from anomalous price moves without
resorting to a trading halt. A LULD trading pause is
inherently disruptive as it interferes with the natural
interaction of orders and precludes any possibility of a
recovery until trading resumes. In contrast, the LULD limit
state provides market participants with greater flexibility by
providing a grace period during which a correction or reversal
can take place while still preventing any executions from
occurring outside of the price bands. BlackRock believes that
recalibrating the LULD halt by extending the limit state and
reducing the trading pause, particularly to account for periods
where multiple securities are in LULD, would allow securities
to more efficiently find equilibrium trading levels. Policy
makers and market participants should jointly identify the
optimal combination of trading pause and limit state durations
based on an assessment of how much time is required for
liquidity to form again. There is also a need to consider
updating market-wide circuit breaker rules to address the
limitations of LULD rules during periods of market-wide
volatility. Given the continuing evolution of equity markets,
we recommend that these rules be reassessed periodically.30
Given the experience of August 24, we also considered the
merits of introducing LULD bands specific to US equity ETPs.
Such bands, could come in several forms. Based on our
analysis, however, we have not made recommendations in
favor of introducing ETP-specific reforms. Our view is that
investors will be better served by market participants and
regulators remedying the root causes of August 24, as
opposed to trying to curb expressions of those underlying
problems. We are also wary after August 24 of the unintended
consequences of introducing further complexity by differentiating
among different types of equity securities. Below, we
describe three ETP-specific reforms that we considered but
do not recommend.
1. Different, perhaps narrower, LULD bands for US
equity ETPs than stocks. We are concerned that
implementing different LULD bands for ETPs could
potentially introduce operational complexity and confusion.
Differentiated bands would have to account for the wide
diversity of ETPs in the US market, ranging from US equity-
based (broad market or narrowly tailored), to others based
on fixed income, foreign equities, or commodities. A rule
of this nature would introduce complexity by necessitating
differential treatment across ETPs and versus other kinds
of equity securities. Instead, we believe alignment of rules
across the equity market ecosystem would be a more
effective solution than proposing different bands for ETPs.
2. LULD bands for ETPs based on premium/discount to
the most recent NAV. As with the preceding point, we
are concerned that different LULD bands for ETPs could
potentially introduce operational complexity and confusion.
A separate issue is that basing LULD bands on the most
recent NAV – typically calculated as of the prior day’s
close – would inhibit price discovery when there is
significant overnight news, as was the case on August 24.
Such a band would be calculated off of a “stale” NAV,
creating an increase in unproductive trading halts for
ETPs. A band like this would structurally impair a key
purpose for which investors use ETPs, namely efficient,
rapid price discovery for broad-based market movement.
[ 9 ]
[ 10 ]
Market-Wide Circuit Breakers
The market-wide circuit breakers (MWCB) are measures
designed to protect investors from severe market declines by
establishing coordinated trading halts across equities, options
and futures exchanges. These controls were adopted after
the 1987 crash and have been amended over time. MWCB
procedures are currently implemented in three stages
according to severity of the price move observed in the S&P
500 index. A “Level 1” halt lasting 15 minutes is triggered
after a 7% decline, a “Level 2” halt lasting 15 minutes is
initiated after a 13% drop, and trading is suspended for the
remainder of the day for a “Level 3” halt after a 20% decline.
Since the 2010 Flash Crash, there has not been a single
instance when the S&P 500 index has exceeded the 7%
MWCB Level 1 threshold. In fact, as shown in Exhibit 6, the
MWCB threshold would only have been triggered a dozen
times since 1980. Trading halts interrupt the natural price
discovery process that occurs through trading, which can be
harmful to liquidity provision. Additionally, frequent MWCB
halts may undermine investor confidence as they suspend
trading in all securities – even those which have not
experienced any problems. That said, a market-wide halt
should be triggered when normal market mechanisms are not
working, otherwise trading at anomalous prices can
destabilize the market. On August 24, market mechanisms
were not working properly. Securities experienced sharp
price dislocations and nearly 1,300 LULD halts were triggered
as the market lacked transparency and clarity, demonstrating
a limitation of the LULD mechanism during market-wide
events. A MWCB halt may have helped to stabilize the
market and curtail the steep price declines, and might have
avoided executions at unexpected levels. In addition, a
market-wide halt may have mitigated the excessive number
of LULD trading pauses in individual securities. BlackRock
believes that policy makers should reassess the MWCB to
determine whether lower thresholds that would be tripped
more frequently than the current thresholds (such as
thresholds that would be tripped annually) would provide
better protection for investors. MWCB thresholds need to
strike the right balance between protecting the markets
against severe volatility and minimizing the discontinuity
caused by halting the entire market.
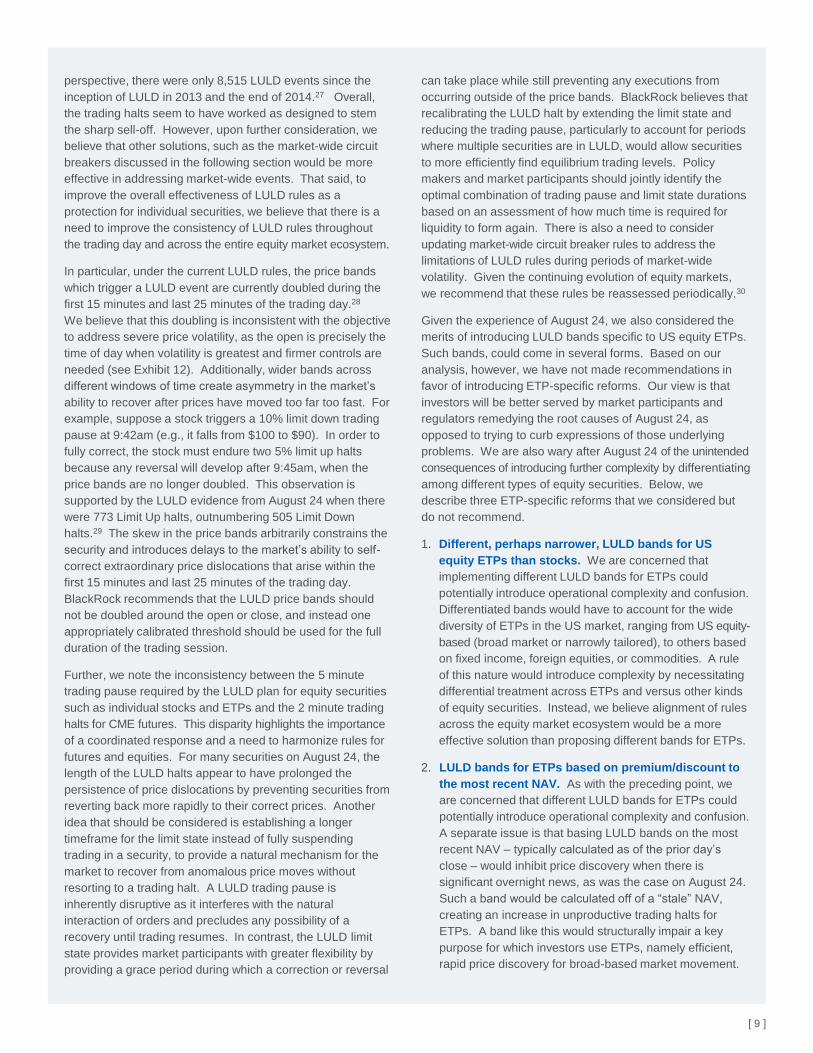
Additionally, BlackRock believes policy makers should
consider establishing a MWCB that is based on the number of
individual securities halted or disrupted. Since the current
MWCB thresholds depend on the price of the S&P 500 index,
the MWCB is susceptible to disruptions in the index
calculation. If a substantial number of the underlying stocks
in the S&P 500 are halted or subject to delayed opens, the
index level may be using stale prices. This situation may
inadvertently reduce the likelihood that a MWCB will be triggered
in stressed markets since the S&P 500 index would not reflect
real-time market conditions. In fact, due to delays in the
opening auctions for equities on August 24, 25% of S&P 500
stocks (constituting 15% of market weight) had not opened by
9:40am.31 If primary market open prices on the constituent
stocks were used to calculate the index level, the S&P 500
would likely have opened down 6.5%.32 The contrast
between this result and the -5.3% low observed in the index in
the first five minutes of trading highlights that disruption in a
high proportion of individual securities may compromise the
performance of the MWCB. Further analysis by policy
makers will be required to determine what percentage of
securities would be an appropriate MWCB trigger.
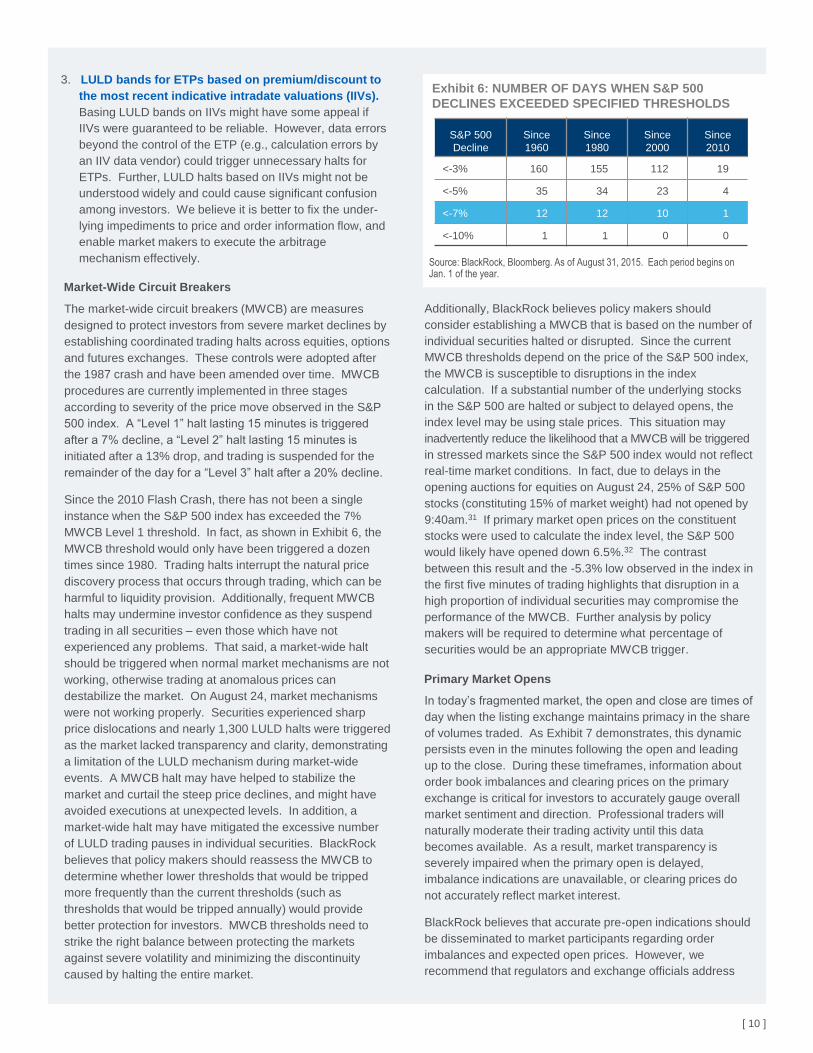
Primary Market Opens
In today’s fragmented market, the open and close are times of
day when the listing exchange maintains primacy in the share
of volumes traded. As Exhibit 7 demonstrates, this dynamic
persists even in the minutes following the open and leading
up to the close. During these timeframes, information about
order book imbalances and clearing prices on the primary
exchange is critical for investors to accurately gauge overall
market sentiment and direction. Professional traders will
naturally moderate their trading activity until this data
becomes available. As a result, market transparency is
severely impaired when the primary open is delayed,
imbalance indications are unavailable, or clearing prices do
not accurately reflect market interest.
BlackRock believes that accurate pre-open indications should
be disseminated to market participants regarding order
imbalances and expected open prices. However, we
recommend that regulators and exchange officials address
Exhibit 6: NUMBER OF DAYS WHEN S&P 500
DECLINES EXCEEDED SPECIFIED THRESHOLDS
S&P 500
Decline
Since
1960
Since
1980
Since
2000
Since
2010
<-3% 160 155 112 19
<-5% 35 34 23 4
<-7% 12 12 10 1
<-10% 1 1 0 0
Source: BlackRock, Bloomberg. As of August 31, 2015. Each period begins on Jan. 1 of the year.
3. LULD bands for ETPs based on premium/discount to
the most recent indicative intradate valuations (IIVs).
Basing LULD bands on IIVs might have some appeal if
IIVs were guaranteed to be reliable. However, data errors
beyond the control of the ETP (e.g., calculation errors by
an IIV data vendor) could trigger unnecessary halts for
ETPs. Further, LULD halts based on IIVs might not be
understood widely and could cause significant confusion
among investors. We believe it is better to fix the under-
lying impediments to price and order information flow, and
enable market makers to execute the arbitrage
mechanism effectively.
shortcomings in the NYSE Order Imbalances data feed,
rather than focusing on the much publicized NYSE Rule 48.
Rule 48 has received abundant criticism for hindering
transparency because it suspends the mandatory
dissemination of tape indications regarding the opening price
range. While Rule 48 does curb these indications, its primary
aim is to eliminate time consuming manual procedures from
the opening of NYSE equities when DMMs would be
overwhelmed by the volume of stocks in conditions of
extreme volatility. The indications suspended by Rule 48
have mandatory minimum display times which must be
observed before the stock can be opened and would likely
have introduced more delays.33
In contrast, the NYSE Order Imbalances data feed publishes
automated real-time auction imbalances and is unaffected by
Rule 48. This feed would have operated effectively on
August 24 to disseminate pre-open imbalance information to
market participants but for one key shortcoming – it stops
publishing at 9:35am. For stocks that opened prior to
9:35am, this would have provided sufficient transparency
about pre-open positioning; however, for the large number of
stocks that experienced delayed market opens, there was a
sizeable information gap. We recommend extending the
publication of this feed until each stock actually opens to
ensure the steady flow of timely and accurate information.
BlackRock believes that primary market procedures should
be reviewed to identify opportunities to improve the timeliness
of the open. Delays in the market open during periods of
extraordinary volatility are particularly harmful as they
contribute to market uncertainty and alarm investors. Most
liquidity providers do not have an obligation to make markets
– therefore they will only do so when they assess that they
can perform their normal market activities effectively. Their
appetite to provide liquidity on related instruments or
products that track equities, such as ETPs, is adversely
affected by inordinate disruption of price discovery at the
open. Exhibit 8 highlights that some exchanges like BATS
and NASDAQ were able to promptly open trading in an
automated fashion on August 24. NYSE-listed equities,
however, were subjected to excessive delays. This backlog
is perplexing since the invocation of Rule 48 should have
given NYSE DMMs the flexibility to expeditiously open
stocks. Under normal circumstances, when only a handful of
stocks may be subject to news or events such as initial public
offerings (IPOs), NYSE’s hybrid model, which combines
human oversight and technology, works well to limit volatility
and ensure an orderly open. However, on August 24 it may
have inadvertently contributed to delayed opens and
heightened market uncertainty. Manual procedures for
broad-based events are inefficient and can contribute to
debilitating delays when DMMs are not staffed to handle the
volume. We recommend that regulators examine whether
opening procedures should be further automated in order to
promote fair and effective markets during conditions of
market-wide volatility.
[ 11 ]
The impact of price collars on auctions is another area of
concern. Collars are useful controls which can prevent
errant price fluctuations. When collars are too restrictive,
however, they inhibit price discovery and result in clearing
prices which are not representative of the overall buying and
selling demand in the market. Additionally, since any
eligible, residual demand is immediately transmitted into the
order book, tight collars can cause excessive volatility after
the auction when significant order imbalances exist. On
August 24, the unprecedented number of LULD halts during
the first minute of trading in NYSE Arca listed securities
suggest that the auction collars interfered with price
formation and contributed to the disruptive volatility. NYSE
Arca has since revised its collars for the opening auction to
levels which are less restrictive and better aligned with
erroneous trade guidelines.34 We commend NYSE Arca for
Exhibit 8: NUMBER OF SECURITIES OPENED BY
EXCHANGE AND TIME ON AUGUST 24
Open
Time
NYSE
MKT
NYSE
Arca NYSE NASDAQ BATS
9:30-9:35 204 1,239 1,086 2,751 20
9:35-9:40 60 10 559 2 0
9:40-9:50 33 14 833 1 0
9:50-10:00 1 11 371 0 0
10:00-10:30 0 38 191 2 0
> 10:30 0 89 0 3 0
Source: BlackRock, TAQ Data
Source: Deutsche Bank. Data shows average for Q2 2015.
Exhibit 7: PRIMARY EXCHANGE SHARE OF TOTAL
MARKET VOLUME IN NASDAQ 100 AND NYSE 100
acting quickly and believe that this change will help to
alleviate imbalances and promote more orderly trading of
securities. However, we also note that a significant number
of LULD events were triggered less than a minute after the
resumption of trading following a LULD pause on NYSE Arca.
This phenomenon indicates that the trading halt auction that
NYSE Arca uses to re-open trading may be adversely
impacted by price collars. BlackRock recommends that
NYSE Arca widen the collars for other auctions to clear any
residual imbalances and ensure that the auction price is more
reflective of the supply and demand in the security. Auctions
which do not fully exhaust marketable buying or selling
interest leave the order book in a state of imbalance which is
vulnerable to severe price dislocations. NYSE Arca is not
unique in its use of collars; the auction processes for BATS
and NASDAQ are similarly subject to price collars. As such,
we recommend that exchanges assess the impact of price
collars on an ongoing basis to ensure that they do not
disproportionately constrain auctions or amplify volatility
following an auction.
Erroneous Trade Guidelines
The erroneous trade policies instituted by the exchanges
have helped to mitigate anxiety over the arbitrary nature of
trade cancellations in the wake of the 2010 Flash Crash.
This has increased transparency for investors and helped
participants to assess the risks and opportunities around
sizeable price moves. However, these rules were enacted at
a different time than the LULD plan. As a result, the
thresholds for LULD and the erroneous trade policies are not
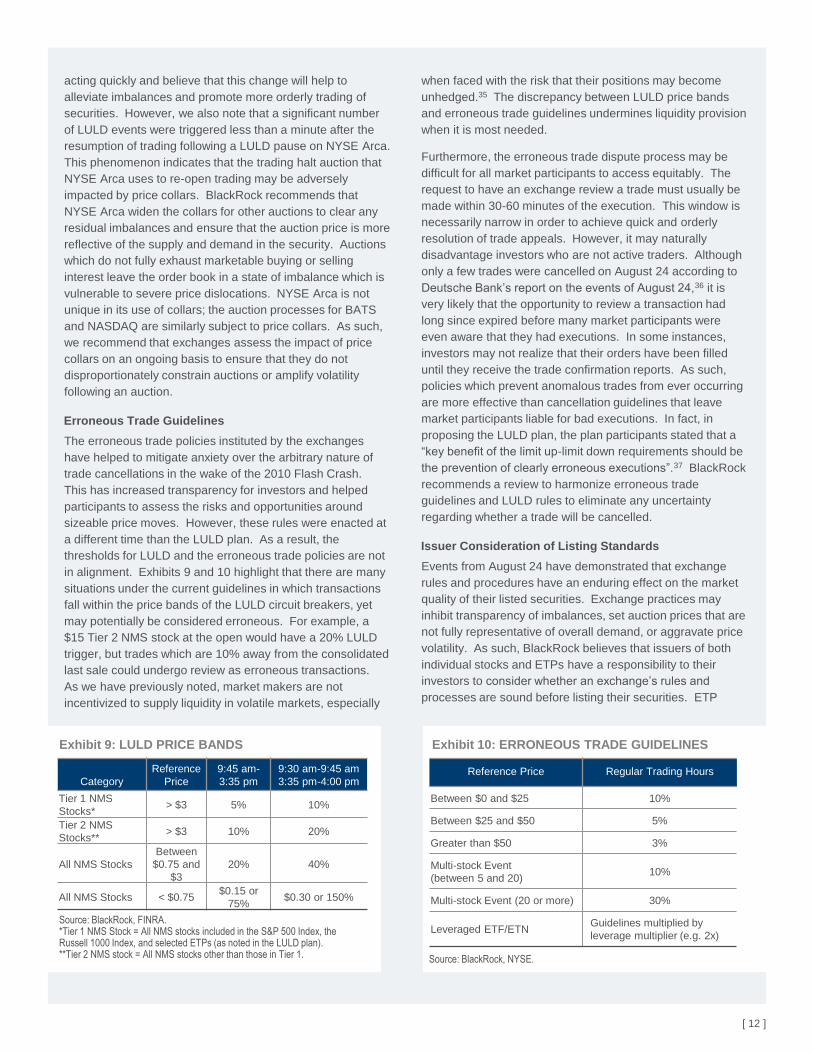
in alignment. Exhibits 9 and 10 highlight that there are many
situations under the current guidelines in which transactions
fall within the price bands of the LULD circuit breakers, yet
may potentially be considered erroneous. For example, a
$15 Tier 2 NMS stock at the open would have a 20% LULD
trigger, but trades which are 10% away from the consolidated
last sale could undergo review as erroneous transactions.
As we have previously noted, market makers are not
incentivized to supply liquidity in volatile markets, especially
when faced with the risk that their positions may become
unhedged.35 The discrepancy between LULD price bands
and erroneous trade guidelines undermines liquidity provision
when it is most needed.
Furthermore, the erroneous trade dispute process may be
difficult for all market participants to access equitably. The
request to have an exchange review a trade must usually be
made within 30-60 minutes of the execution. This window is
necessarily narrow in order to achieve quick and orderly
resolution of trade appeals. However, it may naturally
disadvantage investors who are not active traders. Although
only a few trades were cancelled on August 24 according to
Deutsche Bank’s report on the events of August 24,36 it is
very likely that the opportunity to review a transaction had
long since expired before many market participants were
even aware that they had executions. In some instances,
investors may not realize that their orders have been filled
until they receive the trade confirmation reports. As such,
policies which prevent anomalous trades from ever occurring
are more effective than cancellation guidelines that leave
market participants liable for bad executions. In fact, in
proposing the LULD plan, the plan participants stated that a
“key benefit of the limit up-limit down requirements should be
the prevention of clearly erroneous executions”.37 BlackRock
recommends a review to harmonize erroneous trade
guidelines and LULD rules to eliminate any uncertainty
regarding whether a trade will be cancelled.
Issuer Consideration of Listing Standards
Events from August 24 have demonstrated that exchange
rules and procedures have an enduring effect on the market
quality of their listed securities. Exchange practices may
inhibit transparency of imbalances, set auction prices that are
not fully representative of overall demand, or aggravate price
volatility. As such, BlackRock believes that issuers of both
individual stocks and ETPs have a responsibility to their
investors to consider whether an exchange’s rules and
processes are sound before listing their securities. ETP
[ 12 ]
Exhibit 9: LULD PRICE BANDS
Category
Reference
Price
9:45 am-
3:35 pm
9:30 am-9:45 am
3:35 pm-4:00 pm
Tier 1 NMS
Stocks*> $3 5% 10%
Tier 2 NMS
Stocks**> $3 10% 20%
All NMS Stocks
Between
$0.75 and
$3
20% 40%
All NMS Stocks < $0.75$0.15 or
75%$0.30 or 150%
Source: BlackRock, FINRA.*Tier 1 NMS Stock = All NMS stocks included in the S&P 500 Index, the Russell 1000 Index, and selected ETPs (as noted in the LULD plan).**Tier 2 NMS stock = All NMS stocks other than those in Tier 1.
Exhibit 10: ERRONEOUS TRADE GUIDELINES
Reference Price Regular Trading Hours
Between $0 and $25 10%
Between $25 and $50 5%
Greater than $50 3%
Multi-stock Event
(between 5 and 20)10%
Multi-stock Event (20 or more) 30%
Leveraged ETF/ETNGuidelines multiplied by
leverage multiplier (e.g. 2x)
Source: BlackRock, NYSE.
sponsors and public companies can shape better outcomes
by engaging with exchanges to prioritize market structure
improvements, discourage disruptive activity, and promote
fair and orderly markets in their securities. Listing standards
should include effective market maker incentives, prudent
trading rules, and robust mechanisms for managing
extraordinary volatility.
Investor Education
US equity market structure has evolved markedly over the
years. The modernization of the equity market has principally
benefited investors by increasing efficiency and reducing
costs, but it has also resulted in greater complexity and
fragmentation. It is important for market participants to adapt
to this altered landscape. More than ever, investors must
protect themselves by updating their understanding of how to
navigate the current market environment. This includes
determining the most appropriate order type to use when
considering a transaction and identifying how different
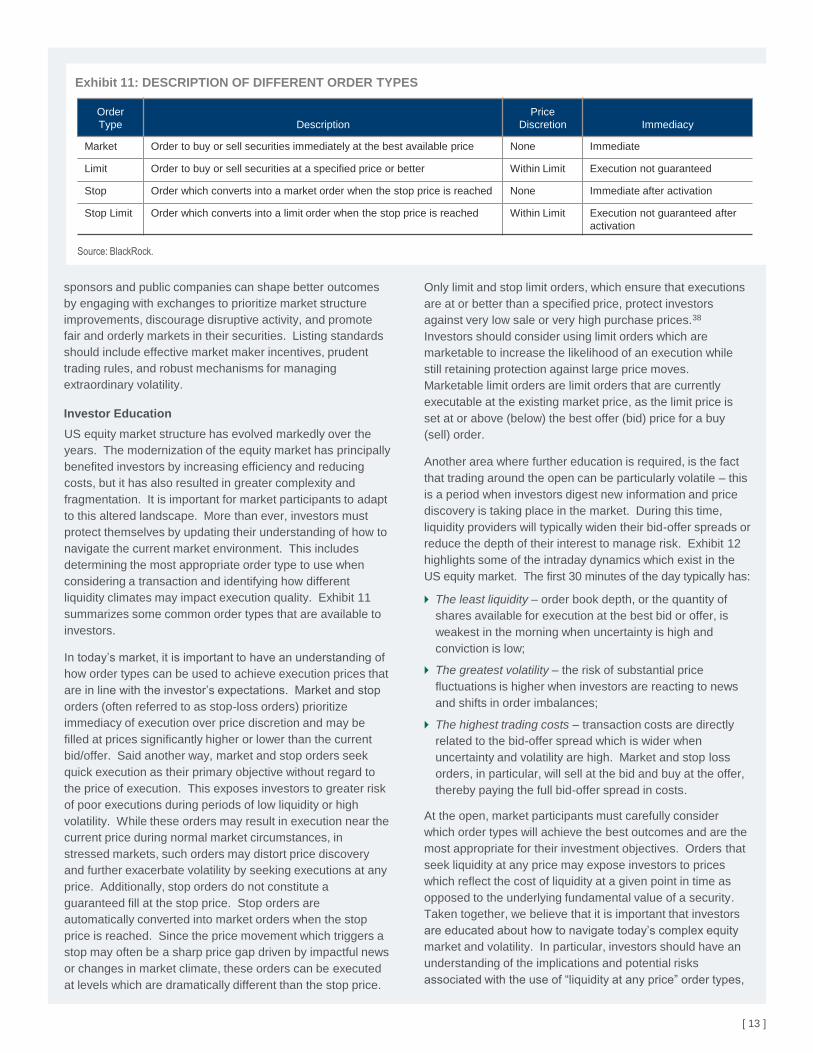
liquidity climates may impact execution quality. Exhibit 11
summarizes some common order types that are available to
investors.
In today’s market, it is important to have an understanding of
how order types can be used to achieve execution prices that
are in line with the investor’s expectations. Market and stop
orders (often referred to as stop-loss orders) prioritize
immediacy of execution over price discretion and may be
filled at prices significantly higher or lower than the current
bid/offer. Said another way, market and stop orders seek
quick execution as their primary objective without regard to
the price of execution. This exposes investors to greater risk
of poor executions during periods of low liquidity or high
volatility. While these orders may result in execution near the
current price during normal market circumstances, in
stressed markets, such orders may distort price discovery
and further exacerbate volatility by seeking executions at any
price. Additionally, stop orders do not constitute a
guaranteed fill at the stop price. Stop orders are
automatically converted into market orders when the stop
price is reached. Since the price movement which triggers a
stop may often be a sharp price gap driven by impactful news
or changes in market climate, these orders can be executed
at levels which are dramatically different than the stop price.
Only limit and stop limit orders, which ensure that executions
are at or better than a specified price, protect investors
against very low sale or very high purchase prices.38
Investors should consider using limit orders which are
marketable to increase the likelihood of an execution while
still retaining protection against large price moves.
Marketable limit orders are limit orders that are currently
executable at the existing market price, as the limit price is
set at or above (below) the best offer (bid) price for a buy
(sell) order.
Another area where further education is required, is the fact
that trading around the open can be particularly volatile – this
is a period when investors digest new information and price
discovery is taking place in the market. During this time,
liquidity providers will typically widen their bid-offer spreads or
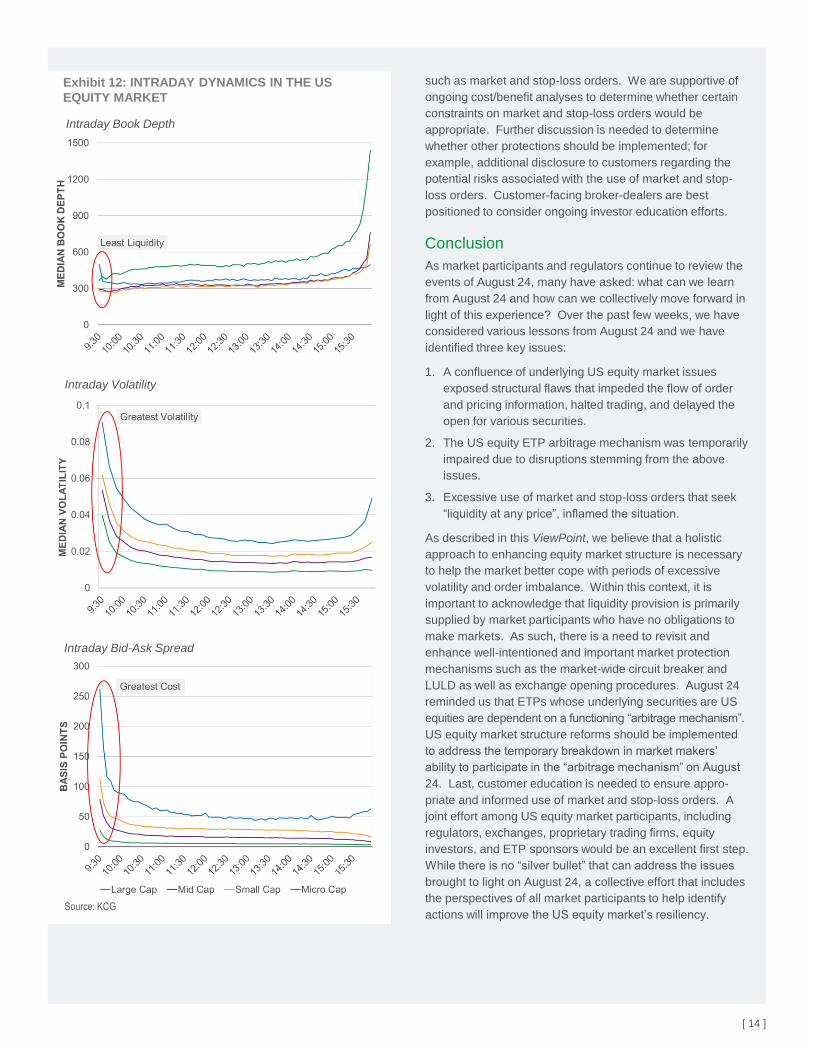
reduce the depth of their interest to manage risk. Exhibit 12
highlights some of the intraday dynamics which exist in the
US equity market. The first 30 minutes of the day typically has:
The least liquidity – order book depth, or the quantity of
shares available for execution at the best bid or offer, is
weakest in the morning when uncertainty is high and
conviction is low;
The greatest volatility – the risk of substantial price
fluctuations is higher when investors are reacting to news
and shifts in order imbalances;
The highest trading costs – transaction costs are directly
related to the bid-offer spread which is wider when
uncertainty and volatility are high. Market and stop loss
orders, in particular, will sell at the bid and buy at the offer,
thereby paying the full bid-offer spread in costs.
At the open, market participants must carefully consider
which order types will achieve the best outcomes and are the
most appropriate for their investment objectives. Orders that
seek liquidity at any price may expose investors to prices
which reflect the cost of liquidity at a given point in time as
opposed to the underlying fundamental value of a security.
Taken together, we believe that it is important that investors
are educated about how to navigate today’s complex equity
market and volatility. In particular, investors should have an
understanding of the implications and potential risks
associated with the use of “liquidity at any price” order types,
[ 13 ]
Exhibit 11: DESCRIPTION OF DIFFERENT ORDER TYPES
Source: BlackRock.
Order
Type Description
Price
Discretion Immediacy
Market Order to buy or sell securities immediately at the best available price None Immediate
Limit Order to buy or sell securities at a specified price or better Within Limit Execution not guaranteed
Stop Order which converts into a market order when the stop price is reached None Immediate after activation
Stop Limit Order which converts into a limit order when the stop price is reached Within Limit Execution not guaranteed after
activation
[ 14 ]
Source: KCG
Exhibit 12: INTRADAY DYNAMICS IN THE US
EQUITY MARKET
such as market and stop-loss orders. We are supportive of
ongoing cost/benefit analyses to determine whether certain
constraints on market and stop-loss orders would be
appropriate. Further discussion is needed to determine
whether other protections should be implemented; for
example, additional disclosure to customers regarding the
potential risks associated with the use of market and stop-
loss orders. Customer-facing broker-dealers are best
positioned to consider ongoing investor education efforts.
Conclusion
As market participants and regulators continue to review the
events of August 24, many have asked: what can we learn
from August 24 and how can we collectively move forward in
light of this experience? Over the past few weeks, we have
considered various lessons from August 24 and we have
identified three key issues:
1. A confluence of underlying US equity market issues
exposed structural flaws that impeded the flow of order
and pricing information, halted trading, and delayed the
open for various securities.
2. The US equity ETP arbitrage mechanism was temporarily
impaired due to disruptions stemming from the above
issues.
3. Excessive use of market and stop-loss orders that seek
“liquidity at any price”, inflamed the situation.
As described in this ViewPoint, we believe that a holistic
approach to enhancing equity market structure is necessary
to help the market better cope with periods of excessive
volatility and order imbalance. Within this context, it is
important to acknowledge that liquidity provision is primarily
supplied by market participants who have no obligations to
make markets. As such, there is a need to revisit and
enhance well-intentioned and important market protection
mechanisms such as the market-wide circuit breaker and
LULD as well as exchange opening procedures. August 24
reminded us that ETPs whose underlying securities are US
equities are dependent on a functioning “arbitrage mechanism”.
US equity market structure reforms should be implemented
to address the temporary breakdown in market makers’
ability to participate in the “arbitrage mechanism” on August
24. Last, customer education is needed to ensure appro-
priate and informed use of market and stop-loss orders. A
joint effort among US equity market participants, including
regulators, exchanges, proprietary trading firms, equity
investors, and ETP sponsors would be an excellent first step.
While there is no “silver bullet” that can address the issues
brought to light on August 24, a collective effort that includes
the perspectives of all market participants to help identify
actions will improve the US equity market’s resiliency.
Intraday Book Depth
Intraday Volatility
Intraday Bid-Ask Spread

Notes
[ 15 ]
1. For additional information on the May 2010 Flash Crash, see BlackRock, ViewPoint, Revisiting the Flash Crash: A Year Has Passed,
What has Changed? (May 2011), available at http://www.blackrock.com/corporate/en-us/literature/whitepaper/viewpoint-revisiting-the-
flash-crash-may-2011.pdf and BlackRock, ViewPoint, Understanding the “Flash Crash”: What Happened, Why ETFs Were Affected, and
How to Reduce the Risk of Another, (Nov. 2010), available at https://www.blackrock.com/corporate/en-
ch/literature/whitepaper/understanding-the-flash-crash-nov-2010.pdf (November 2010 Flash Crash ViewPoint).
2. Bloomberg. As of Aug. 24, 2015.
3. Id.
4. TAQ. As of Aug. 24, 2015.
5. Id.
6. JP Morgan, NYSE. As of Aug. 24, 2015.
7. Credit Suisse, Market Commentary, “Perfect Storm Leads to ETF Trading Halts” (Sep. 30, 2015), available at https://edge.credit-
suisse.com/edge/Public/Bulletin/Servefile.aspx?FileID=26992&m=-1862231407.
8. Goldman Sachs Research, “How ETFs Shaped Yesterday’s Selloff” (Aug. 25, 2015) (Goldman Sachs ETF Report).
9. Bloomberg. As of Aug. 24, 2015. Note that at 9:35am on August 24, the S&P 500 index was down 5.3% from previous close.
10. Id.
11. In the event that an extreme market volatility condition is declared with respect to trading on or through the facilities of the NYSE, the
NYSE can temporarily suspend applicable requirements to make pre-opening indications in a security (Rules 15 and 123D(1)) at the
opening of trading or reopening of trading following a market-wide trading halt. See NYSE, Rule 48: Exemptive Relief – Extreme Market
Volatility Condition, available at
http://nyserules.nyse.com/NYSETools/PlatformViewer.asp?selectednode=chp_1_3_7_14&manual=/nyse/rules/nyse-rules/.
12. TAQ. As of Aug. 24, 2015.
13. KCG, Market Insights, Examination of August 24 Market Volatility (Sep. 14, 2015).
14. NYSE. As of August 24, 2015.
15. JP Morgan, NYSE. As of Aug. 24, 2015.
16. Nasdaq, Press Release, New York Stock Exchange Remains Global Leader in Capital Raising in First Half of 2015; Leader in Tech IPOs,
REITs and ETP Listings (Jul. 6, 2015), available at http://www.nasdaq.com/press-release/new-york-stock-exchange-remains-global-
leader-in-capital-raising-in-first-half-of-2015-leader-in-20150706-00315#ixzz3n5V8UCJE.
17. NYSE Arca, Trader Update, NYSE Arca Equities Enhancements to Auction Collars (Sep. 4, 2015), available at
https://www.nyse.com/publicdocs/nyse/markets/nyse-arca/NYSE_Arca_Trader_Update_Auction_Collars_Sept_2015.pdf (NYSE Arca
Trader Update).
18. APs are sophisticated institutional trading firms that enter into a contract with the ETP specifying rules for creating and redeeming ETP
shares.
19. For many years, including most recently in our August 2015 letter to the SEC, we only included two categories – valuation clarity and
access – that are necessary for an effective arbitrage mechanism. However, in light of the events of August 24, we felt it was important
to acknowledge that certainty of execution, which was lacking for certain periods on that day, is also essential. See BlackRock, Comment
Letter, Request for Comment on Exchange-Traded Products – SEC (Aug. 11, 2015), available at
https://www.blackrock.com/corporate/en-in/literature/publication/sec-request-for-comment-exchange-traded-products-081115.pdf.
20. Harts, William R., Modern Markets Initiative, Letter to SEC (Sep. 24, 2015), available at http://modernmarketsinitiative.org/wp-
content/uploads/2015/09/Letter-to-SEC-on-ETFs.pdf.
21. ArcaVision. As of August 24, 2015.
22. Goldman Sachs ETF Report.
23. NYSE Arca Rules, Rule 104.
24. The Brady Commission Report found that: “When abnormal demands confront the equity market, the liquidity in each marketplace is
unimportant…[market makers go home with relatively small positions]…Investors must depend on the liquidity supplied by partic ipants in
the entire equity market.” See Report of the Presidential Task Force on Market Mechanisms (Jan. 1988) at 57.
25. State Street Global Advisors, “Stress Testing ETFs: Lessons from the Last Twenty Years” (Jan. 2014), available at http://spdr-
etfs.com/data/uploads/2014/01/Stress-Testing-ETFs-Lessons-from-the-Last-Twenty-Years.pdf.
26. Various elements of the US equity markets are regulated by the SEC and CFTC. While FINRA, NFA, and exchanges are self-regulatory
organizations (SROs), the SEC and CFTC have ultimate oversight powers on securities matters under their jurisdiction.
27. Angel, James J., Ph.D., CFA, “Limit Up – Limit Down: National Market System Plan Assessment to Address Extraordinary Market
Volatility”, (May 28, 2015), Georgetown University at 17.
28. Id. at 11. See also SEC, Release No. 34–64547, 76 Fed. Reg. 31647-31659 (Jun. 1, 2011), available at
http://www.gpo.gov/fdsys/pkg/FR-2011-06-01/pdf/2011-13472.pdf.
29. TAQ. As of Aug. 24, 2015.
30. MFA suggests that a reassessment be conducted by regulators at least every two years. See Managed Funds Association, “U.S. Equity
Market Structure: A Year in Review and the Push for Continued Vigilance,” (Sep. 2015), available at www.tabbgroup.com.
31. Bloomberg, TAQ. As of Aug. 24, 2015.
32. Id.
33. NYSE Rule 123D(1) requires that 3 minutes must elapse between the first indication and the market open and that an additional minute is
required after each subsequent indication, in the event that the opening price will be outside of the prior indication. See
http://nyserules.nyse.com/nyse/rules/nyse-rules/chp_1_3/chp_1_3_8/chp_1_3_8_14/default.asp.
34. NYSE Arca Trader Update.
35. November 2010 Flash Crash ViewPoint.
36. Deutsche Bank Global Market Structure, US Market Structure Commentary: Just Another Manic Monday? (Sep. 24, 2015).
37. NYSE Euronext, Response to Comments on Plan to Address Extraordinary Market Volatility Pursuant to Rule 608 of Regulation NMS
under the Securities Exchange Act of 1934 (Nov. 2, 2011), available at http://www.sec.gov/comments/4-631/4631-21.pdf.
38. Although Limit and Stop Limit orders provide investors with price protection, they may result in delayed executions and do not guarantee
a fill. Investors must assess whether the opportunity cost of not receiving an execution is outweighed by the increased certainty on the
price achieved.
This publication represents the regulatory and public policy views of BlackRock. The opinions expressed herein are as of October 2015 and are subject to change at any time due
to changes in the market, the economic or regulatory environment or for other reasons. The information in this publication should not be construed as research or relied upon in
making investment decisions with respect to a specific company or security or be used as legal advice. Any reference to a specific company or security is for illustrative purposes
and does not constitute a recommendation to buy, sell, hold or directly invest in the company or its securities, or an offer or invitation to anyone to invest in any BlackRock funds
and has not been prepared in connection with any such offer.
This material may contain ‘forward-looking’ information that is not purely historical in nature. Such information may include, among other things, projections and forecasts. There
is no guarantee that any forecasts made will come to pass.
The opinions expressed herein are as of October 2015 and are subject to change at any time due to changes in market, economic or other conditions. The information and
opinions contained herein are derived from proprietary and non-proprietary sources deemed by BlackRock to be reliable, but are not necessarily all inclusive and are not
guaranteed as to accuracy or completeness. No part of this material may be reproduced, stored in any retrieval system or transmitted in any form or by any means, electronic,
mechanical, recording or otherwise, without the prior written consent of BlackRock.
This publication is not intended for distribution to, or use by any person or entity in any jurisdiction or country where such distribution or use would be contrary to local law or
regulation.
Issued by BlackRock Investment Management (UK) Limited (authorised and regulated by the Financial Conduct Authority). Registered office: 12 Throgmorton Avenue, London,
EC2N 2DL. Registered in England No. 2020394. Tel: 020 7743 3000. For your protection, telephone calls are usually recorded. BlackRock is a trading name of BlackRock
Investment Management (UK) Limited.
In Hong Kong, this is issued by BlackRock Asset Management North Asia Limited and has not been reviewed by the Securities and Futures Commission. For distribution in Korea
for Professional Investors only (or "professional clients", as such term may apply in local jurisdictions).Issued in Singapore by BlackRock (Singapore) Limited (company
registration number: 200010143N). For investors in Taiwan: Independently operated by BlackRock Investment Management (Taiwan) Limited. Address: 28/F, No. 95, Tun Hwa
South Road, Section 2, Taipei 106, Taiwan. Tel: (02)23261600. Issued in Australia by BlackRock Investment Management (Australia) Limited ABN 13 006 165 975 AFSL 230
523 (BIMAL), for the exclusive use of the recipient who warrants by receipt of this presentation that they are a wholesale client as defined under the Australian Corporations Act
2001 (Cth). This presentation is intended only for wholesale clients and this presentation must not be relied or acted upon by retail clients. This presentation provides general
information only and has not been prepared having regard to your objectives, financial situation or needs. BIMAL, its officers, employees and agents believe that the information
in this presentation and the sources on which the information is based (which may be sourced from third parties) are correct as at the date of this presentation. While every care
has been taken in the preparation of this presentation, no warranty of accuracy or reliability is given and no responsibility for this information is accepted by BIMAL, its officers,
employees or agents. Except where contrary to law, BIMAL excludes all liability for this information. This presentation has not been prepared specifically for Australian investors.
It may contain references to dollar amounts which are not Australian dollars. It may contain financial information which is not prepared in accordance with Australian law or
practices.
©2015 BlackRock. All rights reserved. iSHARES and BLACKROCK are registered trademarks of BlackRock.
All other marks are property of their respective owners.
GOV-0053
RELATED CONTENT
ViewPoint - US Equity Market Structure: An Investor Perspective, Apr 2014
Equity Market Structure Recommendations, Letter to SEC, Sep 2014
ViewPoint - Revisiting the Flash Crash: A Year Has Passed, What Has Changed?, May 2011
ViewPoint - Understanding the "Flash Crash": What Happened, Why ETFs Were Affected, and How to Reduce the Risk of Another,
Nov 2010
For access to our full collection of public policy commentaries, including the ViewPoint series and comment letters to regulators,
please visit http://www.blackrock.com/corporate/en-us/news-and-insights/public-policy