Embed Size (px)
Citation preview
U.S. Industrial Sector Energy Productivity Improvement Pathways
William R. Morrow III, Lawrence Berkeley National Laboratory Alberta Carpenter, National Renewable Energy Laboratory Joe Cresko, Advance Manufacturing Office, EERE, DOE
Sujit Das, Oak Ridge National Laboratory Diane J. Graziano, Argonne National Laboratory
Rebecca Hanes, National Renewable Energy Laboratory Sarang D. Supekar, Argonne National Laboratory Sachin Nimbalkar, Oak Ridge National Laboratory Matthew E. Riddle, Argonne National Laboratory
Arman Shehabi, Lawrence Berkeley National Laboratory
ABSTRACT
Economy-wide energy systems forecasting models often propose deep emission reduction pathways as a course of action to achieve environmental goals such as de-carbonization. These pathways typically assume that industries adopt all possible energy efficiency measures and replace their remaining energy demand with low emissions resources, e.g., renewable or nuclear energy. However, given the significant diversity of energy sources and energy-consuming processes, this over-simplifies the real-world technology, process, and cost constraints common to the industrial sector and is a weakness in existing pathways. Moreover, these pathways do not adequately consider the importance of manufacturing to economic prosperity and for producing the technologies that achieve economy-wide environmental goals.
This paper reviews historical industrial energy productivity and introduces an analytic framework for developing industrial sector energy productivity pathways that are driven by the goal to transform both the business as usual trends within the industrial sector, as well as the downstream impacts attributable to manufactured products. The framework includes (1) metrics for quantifying energy productivity growth in terms of physical units, value-added, and service; and (2) concurrent approaches for decoupling energy use and emissions from manufacturing value-added. The framework presented here highlights that emission reduction pathways need to consider the industrial sector not in the aggregate, but as comprised of diverse manufacturing and non-manufacturing industries that affect the energy productivity of other economic sectors: electric power, transportation, and commercial sectors. Such pathways are better equipped to focus on improving the energy productivity of the US economy.
INTRODUCTION
Industrial sub-sectors utilize energy resources, labor, and capital equipment to transform raw materials into finished products. Currently in the U.S., emissions are linked to energy consumption due to the dominance of fossil fuel energy (both directly and indirectly through electricity use) and emissions being an inherent byproduct of fossil fuels during combustion. Even as renewable electricity grows and reduces future electricity related emissions, an increase in energy productivity that outpaces industry growth is needed in order to reduce future infrastructure capacity requirements and to reduce total energy-related emissions. In addition, the U.S. has an Administration goal to double energy productivity (across the economy) from 2010
3-101©2017 ACEEE Summer Study on Energy Efficiency in Industry
to 2030 (Keyser et al., 2015), which can be characterized as “producing more output (goods and services) from every unit of energy we use.” We explore relationships between this concept of productivity, current energy consumption, and future energy saving opportunities.
This paper is structured as follows. First, definitions of traditional metrics used to quantify industrial sector economics and energy productivity are summarized. Second, historical economic and energy performance data for manufacturing are reviewed. Last, approaches are described for achieving economy-wide increases in energy productivity and consequent reductions in emissions.
TRADITIONAL ENERGY PRODUCTIVITY METRICS
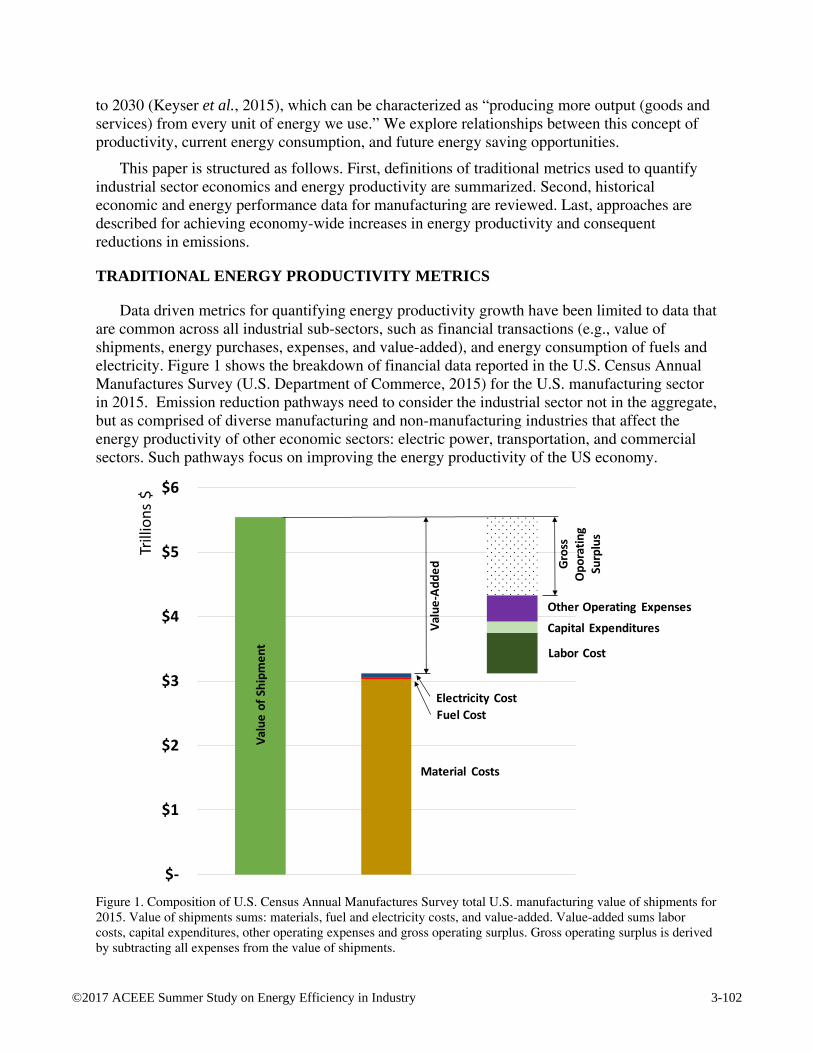
Data driven metrics for quantifying energy productivity growth have been limited to data that are common across all industrial sub-sectors, such as financial transactions (e.g., value of shipments, energy purchases, expenses, and value-added), and energy consumption of fuels and electricity. Figure 1 shows the breakdown of financial data reported in the U.S. Census Annual Manufactures Survey (U.S. Department of Commerce, 2015) for the U.S. manufacturing sector in 2015. Emission reduction pathways need to consider the industrial sector not in the aggregate, but as comprised of diverse manufacturing and non-manufacturing industries that affect the energy productivity of other economic sectors: electric power, transportation, and commercial sectors. Such pathways focus on improving the energy productivity of the US economy.
Figure 1. Composition of U.S. Census Annual Manufactures Survey total U.S. manufacturing value of shipments for 2015. Value of shipments sums: materials, fuel and electricity costs, and value-added. Value-added sums labor costs, capital expenditures, other operating expenses and gross operating surplus. Gross operating surplus is derived by subtracting all expenses from the value of shipments.
$-
$1
$2
$3
$4
$5
$6
Trill
ions
$
Electricity Cost
Valu
e of
Shi
pmen
t
Fuel Cost
Labor Cost
Capital Expenditures
Other Operating Expenses
Material Costs
Valu
e-Ad
ded Gr
oss
Opo
ratin
gSu
rplu
s
3-102©2017 ACEEE Summer Study on Energy Efficiency in Industry
Definition of the terms in Figure 1 are on the U.S. Census Annual Manufactures Survey website (U.S. Census ASM Glossery, 2017), with the exception of surplus. The U.S. Bureau of Economic Analysis defines gross operating surplus (GOS) as value-added minus labor wages and taxes (Bureau of Economic Analysis 2017). However, we calculate surplus as value-added minus labor, capital, and other operating expenses in order to show surplus as value of shipments minus all other expenses. For the purposes of this paper and analysis, the definition of value of shipments and value-added are provided here for clarity. We also define energy productivity and materials productivity. Lastly, we define two energy efficiency metrics and briefly discuss their effect on value-added.
Value of Shipment (VOS): The industrial sectors’ contribution to gross domestic product (GDP) is measured by value of shipments, which covers the net selling values, f.o.b. plant (exclusive of freight and taxes), of all products shipped as well as miscellaneous receipts. Totals for value of shipments for major industry groups within manufacturing and for manufacturing as a whole include large amounts of duplication because the products of some industries are used as materials by others. This duplication results, in part, from the combination of related industries that represent successive stages in the production of a finished manufactured product. Examples are the combination of flour mills and bakeries in the food group and of pulp mills and paper mills in the paper and allied products group.
Value-added (VA): value-added is the value of shipment minus the cost of energy, materials, and operating expenses. The Bureau of Economic Analysis calculates value-added as the industry’s gross output (consisting of sales or receipts and other operating income, commodity taxes, and inventory change) minus the cost of its intermediate inputs (including energy, raw materials, semi-finished goods, and services that are purchased from all sources).
Energy Purchases (i.e. Fuel and Electricity Cost): Cost of purchased fuels and electric energy consists of the cost of fuels consumed for heat, power, or generation of electricity whether purchased from the establishments of other companies, transferred from other establishments of the same company, or withdrawn from inventory during the year, and the cost of purchased electric energy. The cost and quantity of purchased electric energy represent the amounts actually used during the year.
Energy productivity: Energy productivity is the ratio of economic output per unit of energy (GDP per million BTU). An alternative energy productivity metric is industrial sector value add per unit of energy (value-added $ per million BTU). The U.S. Census Annual Survey of Manufactures reports energy expenditures, not physical consumption, so energy productivity is measured as value-added $/energy cost $.
Energy intensity: Reciprocal of energy productivity, which may be expressed as million BTU/GDP, million BTU/million $ value-added, or energy cost $/value-added $.
Materials productivity: The U.S. Census Annual Survey of Manufactures also reports materials expenditures, but not physical consumption of materials. Using this dataset, materials productivity is the ratio of economic output to materials expenditures. An alternative materials productivity metric is the ratio of industrial sector value-added to materials expenditures, and its reciprocal value-added materials intensity, or the ratio of industrial sector materials expenditures to value-added.
3-103©2017 ACEEE Summer Study on Energy Efficiency in Industry
Energy conservation: Reduce energy consumption by reducing energy services. Energy conservation generally requires minimal capital investment. An example is turning off lights when rooms are empty.
Energy efficiency: Reduce energy consumption but maintaining constant service. Energy efficiency generally requires some capital investment. An example is replacing incandescent lights with LEDs that provide the same lighting with less electricity.
Conserving energy without changing value of shipments increases value-added because it reduces energy expenditures. Assuming it is cost effective; energy efficiency predicated on capital investments also increases value-added because it: A) reduces energy expenses, which are excluded from value-added, while B) increasing capital expenses which are included in value-added. Similar relationships exist for materials as well. Value-added can also increase when increased energy and/or materials productivity reduces other expenses through better overall manufacturing quality and flexibility. In some cases, increased energy and/or materials productivity can increase the quality of finished products enough to make them more desirable and thus increase value of shipments.
From a manufacturer’s perspective, the goal is to maximize its value-added. Optimizing and reducing the costs of intermediate inputs (materials, energy and services) is one way of enhancing value-added. Similarly, maximizing materials productivity, energy productivity, and service productivity also enhances value-added. Ideally, maximizing productivity metrics can increase value of shipments if it increases the product’s value, hence contributing to increased value-added. Even if these decrease value of shipments (productivity increases are passed to consumers through lower priced goods), there is a net social benefit to consumers.
ENERGY USE IN THE U.S. MANUFACTURING SECTOR (THE U.S. CENSUS ANNUAL SURVEY OF MANUFACTURES)
Historically, the aggregate energy productivity of the U.S. economy has steadily increased. This is evidenced by a 30% increase in energy productivity from about $75/MMBTU in 1980 to about $134/MMBTU in 2010 (Keyser et al., 2015). In the context of this paper, however, it is instructive to understand manufacturing energy use from a more disaggregated perspective. To that point, we analyze time series data from the Annual Survey of Manufactures (ASM) from 2007 (pre-recession) to 2015 at a subsector (3-digit NAICS code) level.
Fuel and electricity used in manufacturing represent direct energy use while the most notable indirect energy use is in the form of the embodied energy in the materials used. As such, we assess both energy and material costs for the manufacturing sector as a whole as well as individual subsectors within manufacturing. To understand where the different subsectors within manufacturing stand relative to each other with regards to energy and materials use, we map their energy and materials productivity (costs per unit of value-added in year 2015) in Figure 2. The data in Figure 2 have been adjusted to real dollars using chained price indices (Bureau of Economic Analysis, 2016). For added context, we also incorporate data for the value-added and the number of employees for each subsector in this figure.
3-104©2017 ACEEE Summer Study on Energy Efficiency in Industry
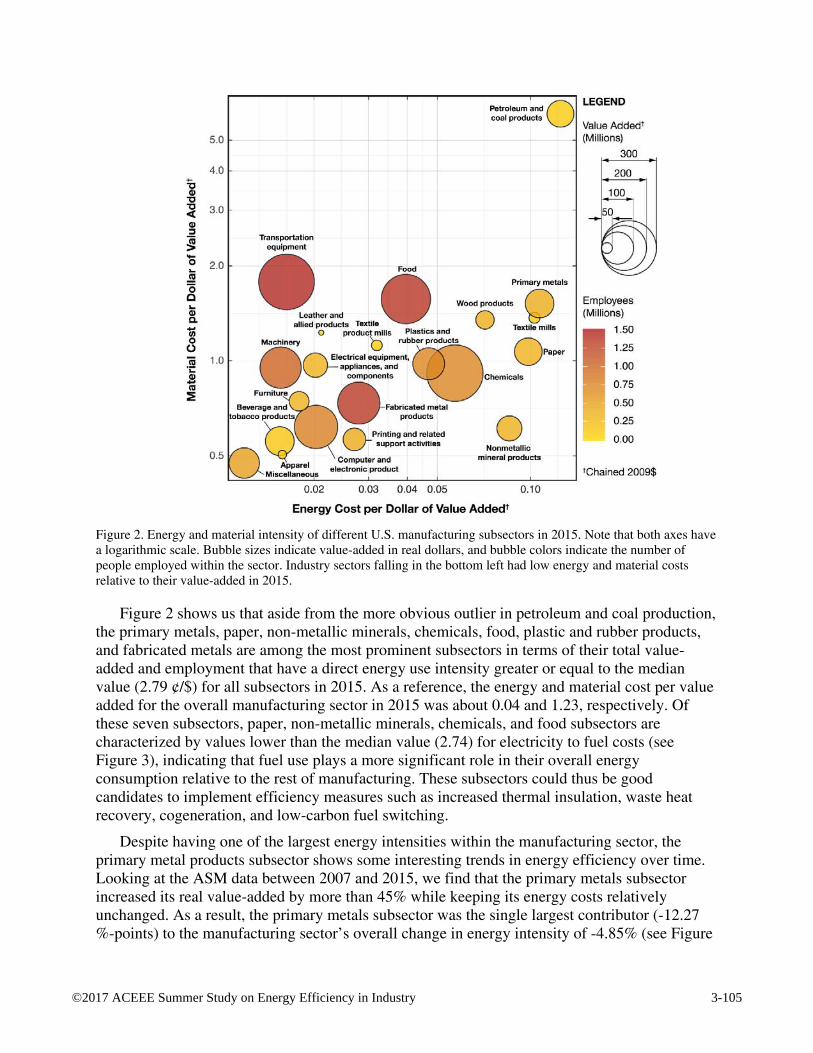
Figure 2. Energy and material intensity of different U.S. manufacturing subsectors in 2015. Note that both axes have a logarithmic scale. Bubble sizes indicate value-added in real dollars, and bubble colors indicate the number of people employed within the sector. Industry sectors falling in the bottom left had low energy and material costs relative to their value-added in 2015.
Figure 2 shows us that aside from the more obvious outlier in petroleum and coal production, the primary metals, paper, non-metallic minerals, chemicals, food, plastic and rubber products, and fabricated metals are among the most prominent subsectors in terms of their total value-added and employment that have a direct energy use intensity greater or equal to the median value (2.79 ¢/$) for all subsectors in 2015. As a reference, the energy and material cost per value added for the overall manufacturing sector in 2015 was about 0.04 and 1.23, respectively. Of these seven subsectors, paper, non-metallic minerals, chemicals, and food subsectors are characterized by values lower than the median value (2.74) for electricity to fuel costs (see Figure 3), indicating that fuel use plays a more significant role in their overall energy consumption relative to the rest of manufacturing. These subsectors could thus be good candidates to implement efficiency measures such as increased thermal insulation, waste heat recovery, cogeneration, and low-carbon fuel switching.
Despite having one of the largest energy intensities within the manufacturing sector, the primary metal products subsector shows some interesting trends in energy efficiency over time. Looking at the ASM data between 2007 and 2015, we find that the primary metals subsector increased its real value-added by more than 45% while keeping its energy costs relatively unchanged. As a result, the primary metals subsector was the single largest contributor (-12.27 %-points) to the manufacturing sector’s overall change in energy intensity of -4.85% (see Figure
3-105©2017 ACEEE Summer Study on Energy Efficiency in Industry
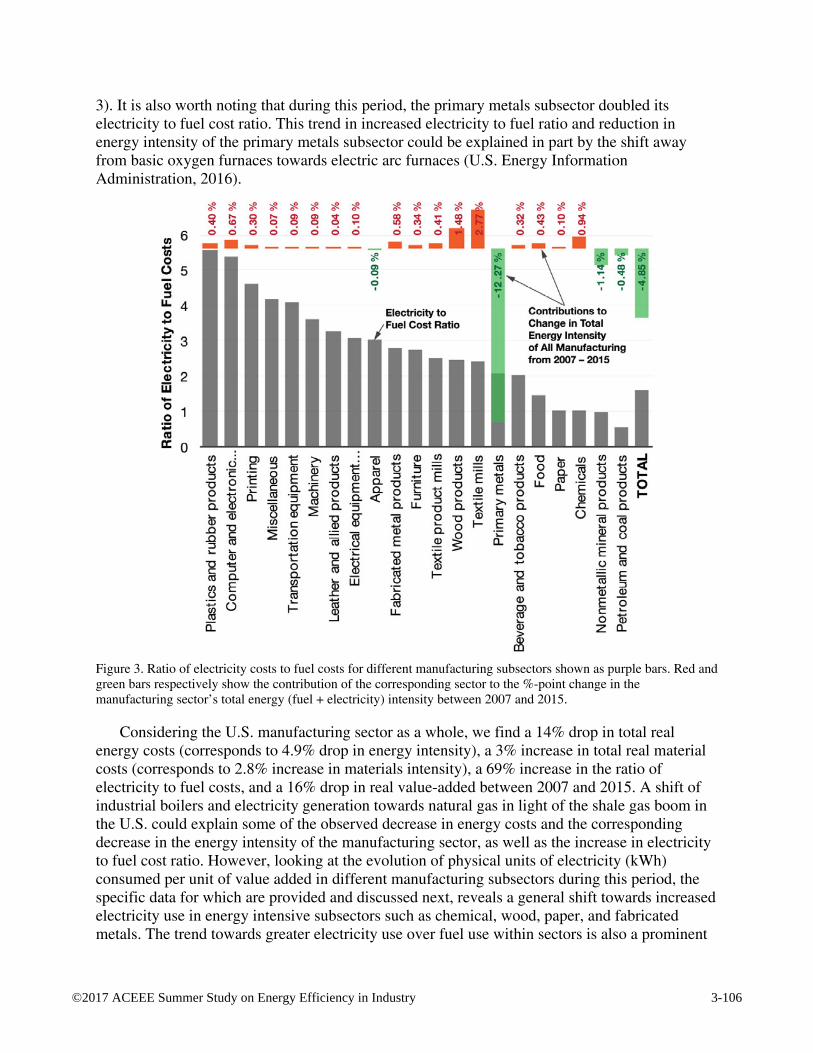
3). It is also worth noting that during this period, the primary metals subsector doubled its electricity to fuel cost ratio. This trend in increased electricity to fuel ratio and reduction in energy intensity of the primary metals subsector could be explained in part by the shift away from basic oxygen furnaces towards electric arc furnaces (U.S. Energy Information Administration, 2016).
Figure 3. Ratio of electricity costs to fuel costs for different manufacturing subsectors shown as purple bars. Red and green bars respectively show the contribution of the corresponding sector to the %-point change in the manufacturing sector’s total energy (fuel + electricity) intensity between 2007 and 2015.
Considering the U.S. manufacturing sector as a whole, we find a 14% drop in total real energy costs (corresponds to 4.9% drop in energy intensity), a 3% increase in total real material costs (corresponds to 2.8% increase in materials intensity), a 69% increase in the ratio of electricity to fuel costs, and a 16% drop in real value-added between 2007 and 2015. A shift of industrial boilers and electricity generation towards natural gas in light of the shale gas boom in the U.S. could explain some of the observed decrease in energy costs and the corresponding decrease in the energy intensity of the manufacturing sector, as well as the increase in electricity to fuel cost ratio. However, looking at the evolution of physical units of electricity (kWh) consumed per unit of value added in different manufacturing subsectors during this period, the specific data for which are provided and discussed next, reveals a general shift towards increased electricity use in energy intensive subsectors such as chemical, wood, paper, and fabricated metals. The trend towards greater electricity use over fuel use within sectors is also a prominent
3-106©2017 ACEEE Summer Study on Energy Efficiency in Industry
contributing factor to the dramatic increase observed in the manufacturing sector’s overall electricity to fuel cost ratio. A closer examination is warranted into the technological and economic factors behind these trends so that insights from it could potentially inform measures that may be extended to other subsectors to reduce their energy intensity.
Figure 2 also shows that the transportation equipment, and computer and electronic products subsectors are two of the most energy efficient subsectors, although we note that the transportation equipment sector is one of most material-intensive. These subsectors produce high value and high-tech products such as motor vehicles, aircrafts, computers, semiconductor devices, and control instrumentation (and their different parts and components). In addition to having higher than median reliance on electricity relative to fuels, historic ASM data show us that these subsectors have some of the highest expenditures on information and communication technology (ICT) as a fraction of their value-added (greater than 1.5%) among other major expenditure categories such as machinery equipment, buildings, transportation, and services. Such ICT expenditures include capital and operating costs of computer hardware and software, computer peripherals, data processing equipment and services, and communication. The negative correlation between energy intensity and ICT expenditures observed for these subsectors is also seen in other material-intensive subsectors such as machinery, electrical appliance, and leather products manufacturing. Collectively, these trends point to the vastly untapped potential of the fast-growing ICT-driven “smart manufacturing” technologies and paradigms (National Academy of Engineering, 2012; Davis et al., 2015; Gallaher et al., 2016) for reducing energy and carbon intensity in manufacturing.
ENERGY USE IN THE U.S. MANUFACTURING SECTOR (U.S. DOE MANUFACTURING ENERGY CONSUMPTION SURVEY & BANDWIDTH REPORTS)
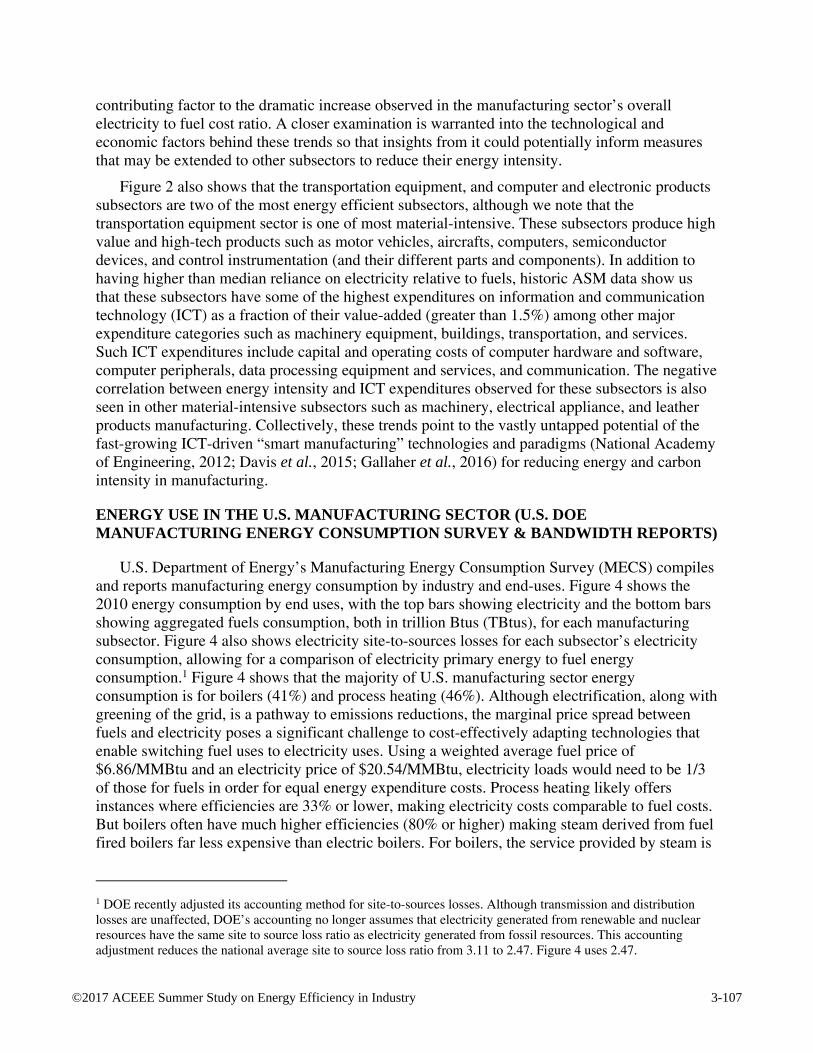
U.S. Department of Energy’s Manufacturing Energy Consumption Survey (MECS) compiles and reports manufacturing energy consumption by industry and end-uses. Figure 4 shows the 2010 energy consumption by end uses, with the top bars showing electricity and the bottom bars showing aggregated fuels consumption, both in trillion Btus (TBtus), for each manufacturing subsector. Figure 4 also shows electricity site-to-sources losses for each subsector’s electricity consumption, allowing for a comparison of electricity primary energy to fuel energy consumption.1 Figure 4 shows that the majority of U.S. manufacturing sector energy consumption is for boilers (41%) and process heating (46%). Although electrification, along with greening of the grid, is a pathway to emissions reductions, the marginal price spread between fuels and electricity poses a significant challenge to cost-effectively adapting technologies that enable switching fuel uses to electricity uses. Using a weighted average fuel price of $6.86/MMBtu and an electricity price of $20.54/MMBtu, electricity loads would need to be 1/3 of those for fuels in order for equal energy expenditure costs. Process heating likely offers instances where efficiencies are 33% or lower, making electricity costs comparable to fuel costs. But boilers often have much higher efficiencies (80% or higher) making steam derived from fuel fired boilers far less expensive than electric boilers. For boilers, the service provided by steam is
1 DOE recently adjusted its accounting method for site-to-sources losses. Although transmission and distribution losses are unaffected, DOE’s accounting no longer assumes that electricity generated from renewable and nuclear resources have the same site to source loss ratio as electricity generated from fossil resources. This accounting adjustment reduces the national average site to source loss ratio from 3.11 to 2.47. Figure 4 uses 2.47.
3-107©2017 ACEEE Summer Study on Energy Efficiency in Industry
the metric to evaluate replacing steam with electric heating. Those instances where steam use has low efficiencies (e.g. heating product by steam injection) should be identified and evaluated for electrification opportunities. In addition to direct conversion opportunities that leverage the relative efficiencies between fuel fired uses and electrical substitution, reducing the demand for heat loads will also help increase the cost effectiveness of electricity substitution. Looking at the dramatic increase in the ratio of electricity to fuel expenditures as well as increases in electricity consumption discussed earlier in the context of energy intensive subsectors (see Figure 2), it is likely that some of these electrification opportunities are already being explored in the manufacturing sector.
Figure 4. Manufacturing energy consumption in 2010 broken down by end use. For each sub-sector, the top bar shows electricity use (showing site-to-source losses); the bottom bar shows fuel use.
Figure 4 also shows that the majority of manufacturing sector fuel consumption is by four major subsectors (petroleum and coal products (28%), chemicals (20%), paper (16%), and primary metals (13%)). The Advanced Manufacturing Office within DOE has produced bandwidth reports focused on these major energy intensive subsectors (Sabine Brueske , Caroline Kramer, 2014; Brueske, Kramer and Fisher, 2015; Jamison et al., 2015; Miller, Kramer and Fisher, 2015). The bandwidth of total energy reduction opportunities for the four subsectors is presented in Figure 5.
0 500 1000 1500 2000 2500 3000 3500
Food manufacturing
Beverage and tobacco product manufacturing
Textile mills
Textile product mills
Apparel manufacturing
Leather and allied product manufacturing
Wood product manufacturing
Paper manufacturing
Printing and related support activities
Petroleum and coal products manufacturing
Chemical manufacturing
Plastics and rubber products manufacturing
Nonmetallic mineral product manufacturing
Primary metal manufacturing
Fabricated metal product manufacturing
Machinery manufacturing
Computer and electronic product manufacturing
Electrical equipment, appliance, and…
Transportation equipment manufacturing
Furniture and related product manufacturing
Miscellaneous manufacturing
TbtusIndirect Uses-Boiler Fuel Process Heating Process Cooling and Refrigeration
Machine Drive Electro-Chemical Processes Other Process Use
Direct Uses-Total Non-process End Use Not Reported Site-to-Source Losses
3-108©2017 ACEEE Summer Study on Energy Efficiency in Industry
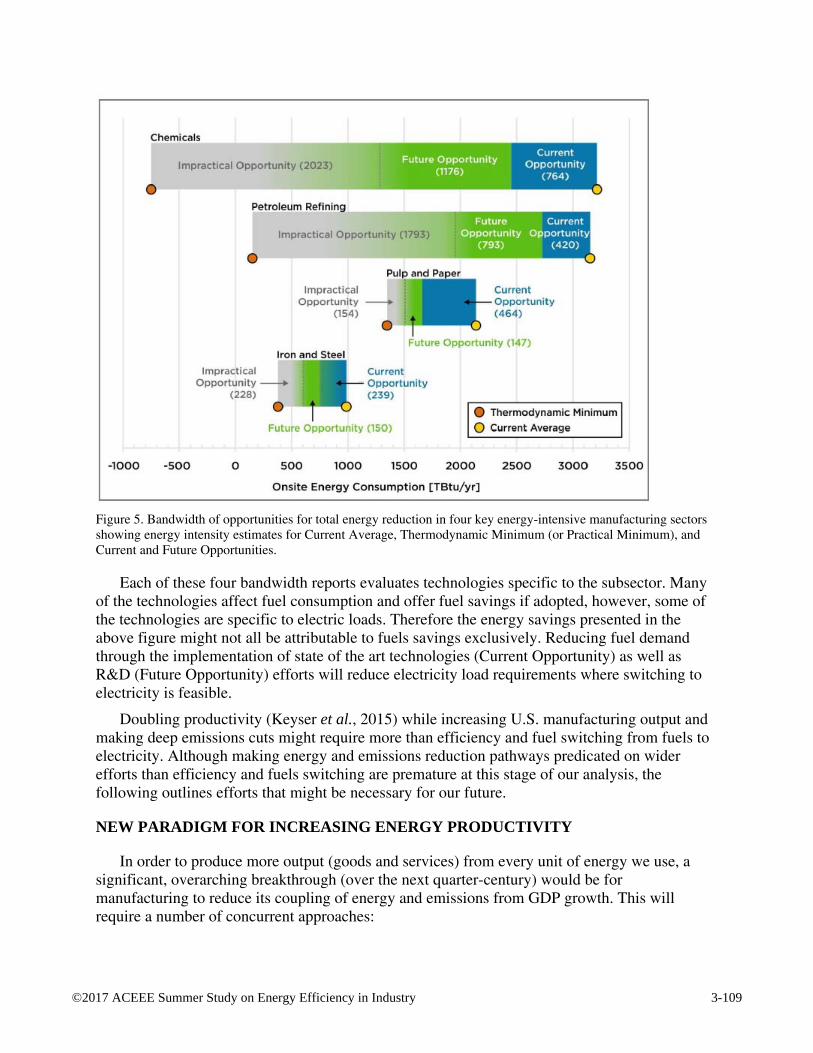
Figure 5. Bandwidth of opportunities for total energy reduction in four key energy-intensive manufacturing sectors showing energy intensity estimates for Current Average, Thermodynamic Minimum (or Practical Minimum), and Current and Future Opportunities.
Each of these four bandwidth reports evaluates technologies specific to the subsector. Many of the technologies affect fuel consumption and offer fuel savings if adopted, however, some of the technologies are specific to electric loads. Therefore the energy savings presented in the above figure might not all be attributable to fuels savings exclusively. Reducing fuel demand through the implementation of state of the art technologies (Current Opportunity) as well as R&D (Future Opportunity) efforts will reduce electricity load requirements where switching to electricity is feasible.
Doubling productivity (Keyser et al., 2015) while increasing U.S. manufacturing output and making deep emissions cuts might require more than efficiency and fuel switching from fuels to electricity. Although making energy and emissions reduction pathways predicated on wider efforts than efficiency and fuels switching are premature at this stage of our analysis, the following outlines efforts that might be necessary for our future.
NEW PARADIGM FOR INCREASING ENERGY PRODUCTIVITY
In order to produce more output (goods and services) from every unit of energy we use, a significant, overarching breakthrough (over the next quarter-century) would be for manufacturing to reduce its coupling of energy and emissions from GDP growth. This will require a number of concurrent approaches:
3-109©2017 ACEEE Summer Study on Energy Efficiency in Industry
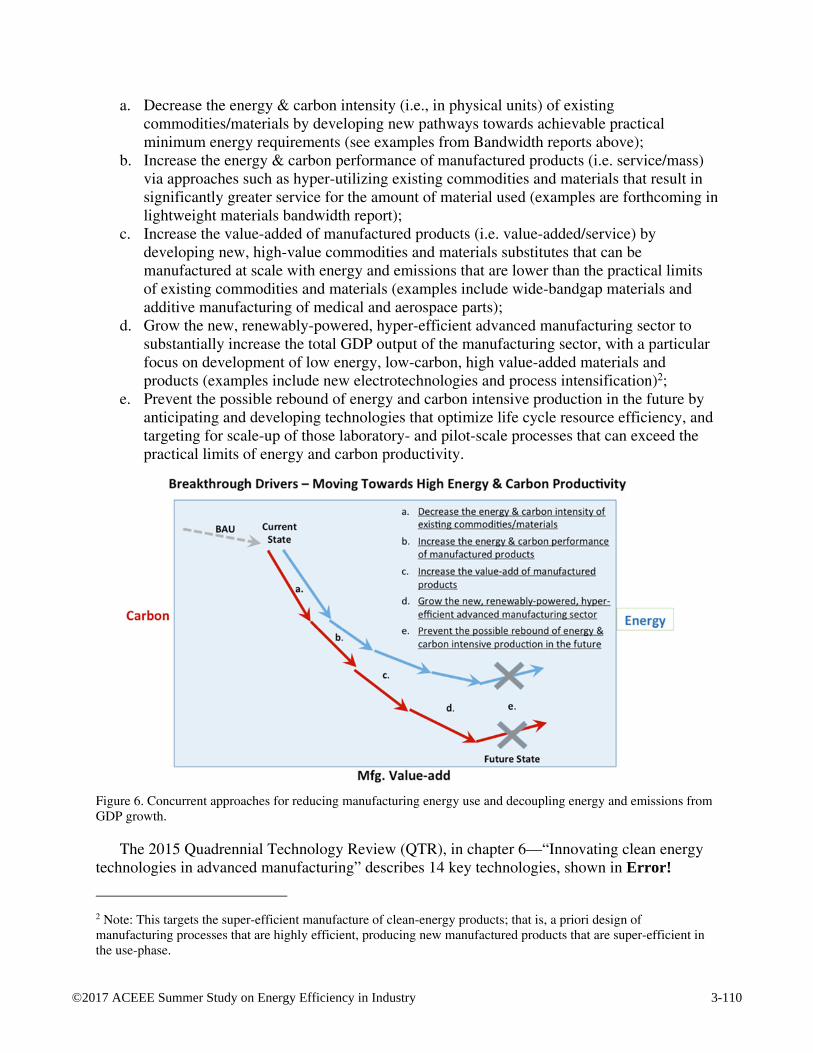
a. Decrease the energy & carbon intensity (i.e., in physical units) of existing commodities/materials by developing new pathways towards achievable practical minimum energy requirements (see examples from Bandwidth reports above);
b. Increase the energy & carbon performance of manufactured products (i.e. service/mass) via approaches such as hyper-utilizing existing commodities and materials that result in significantly greater service for the amount of material used (examples are forthcoming in lightweight materials bandwidth report);
c. Increase the value-added of manufactured products (i.e. value-added/service) by developing new, high-value commodities and materials substitutes that can be manufactured at scale with energy and emissions that are lower than the practical limits of existing commodities and materials (examples include wide-bandgap materials and additive manufacturing of medical and aerospace parts);
d. Grow the new, renewably-powered, hyper-efficient advanced manufacturing sector to substantially increase the total GDP output of the manufacturing sector, with a particular focus on development of low energy, low-carbon, high value-added materials and products (examples include new electrotechnologies and process intensification)2;
e. Prevent the possible rebound of energy and carbon intensive production in the future by anticipating and developing technologies that optimize life cycle resource efficiency, and targeting for scale-up of those laboratory- and pilot-scale processes that can exceed the practical limits of energy and carbon productivity.
Figure 6. Concurrent approaches for reducing manufacturing energy use and decoupling energy and emissions from GDP growth.
The 2015 Quadrennial Technology Review (QTR), in chapter 6—“Innovating clean energy technologies in advanced manufacturing” describes 14 key technologies, shown in Error!
2 Note: This targets the super-efficient manufacture of clean-energy products; that is, a priori design of manufacturing processes that are highly efficient, producing new manufactured products that are super-efficient in the use-phase.
3-110©2017 ACEEE Summer Study on Energy Efficiency in Industry
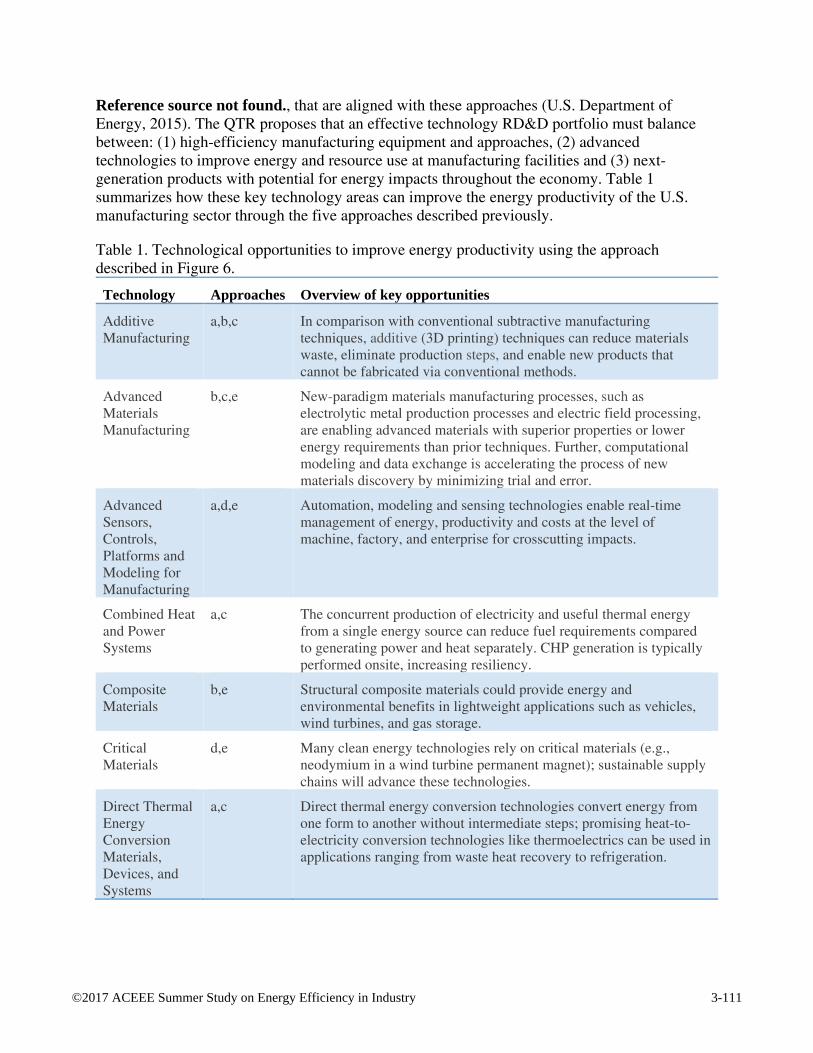
Reference source not found., that are aligned with these approaches (U.S. Department of Energy, 2015). The QTR proposes that an effective technology RD&D portfolio must balance between: (1) high-efficiency manufacturing equipment and approaches, (2) advanced technologies to improve energy and resource use at manufacturing facilities and (3) next-generation products with potential for energy impacts throughout the economy. Table 1 summarizes how these key technology areas can improve the energy productivity of the U.S. manufacturing sector through the five approaches described previously.
Table 1. Technological opportunities to improve energy productivity using the approach described in Figure 6.
Technology Approaches Overview of key opportunities
Additive Manufacturing
a,b,c In comparison with conventional subtractive manufacturing techniques, additive (3D printing) techniques can reduce materials waste, eliminate production steps, and enable new products that cannot be fabricated via conventional methods.
Advanced Materials Manufacturing
b,c,e New-paradigm materials manufacturing processes, such as electrolytic metal production processes and electric field processing, are enabling advanced materials with superior properties or lower energy requirements than prior techniques. Further, computational modeling and data exchange is accelerating the process of new materials discovery by minimizing trial and error.
Advanced Sensors, Controls, Platforms and Modeling for Manufacturing
a,d,e Automation, modeling and sensing technologies enable real-time management of energy, productivity and costs at the level of machine, factory, and enterprise for crosscutting impacts.
Combined Heat and Power Systems
a,c The concurrent production of electricity and useful thermal energy from a single energy source can reduce fuel requirements compared to generating power and heat separately. CHP generation is typically performed onsite, increasing resiliency.
Composite Materials
b,e Structural composite materials could provide energy and environmental benefits in lightweight applications such as vehicles, wind turbines, and gas storage.
Critical Materials
d,e Many clean energy technologies rely on critical materials (e.g., neodymium in a wind turbine permanent magnet); sustainable supply chains will advance these technologies.
Direct Thermal Energy Conversion Materials, Devices, and Systems
a,c Direct thermal energy conversion technologies convert energy from one form to another without intermediate steps; promising heat-to-electricity conversion technologies like thermoelectrics can be used in applications ranging from waste heat recovery to refrigeration.
3-111©2017 ACEEE Summer Study on Energy Efficiency in Industry
Technology Approaches Overview of key opportunities
Materials for Harsh Service Conditions
a,b Opportunities include higher-temperature, higher-efficiency power plants; corrosion-resistant pipelines for natural gas and hydrogen delivery; improved waste heat recovery in corrosive environments; and improved nuclear fuel claddings.
Process Heating
a,c Process heating accounts for nearly two-thirds of onsite manufacturing energy; opportunities to reduce energy consumption include lower-energy processing (e.g., microwave heating), integrated systems, waste heat recovery, and advanced controls.
Process Intensification
a,c Process intensification techniques such as the integration of multiple unit operations into a single piece of equipment and modular system design can improve manufacturing throughput, quality, and energy efficiency.
Roll-to-Roll Processing
a,b,c,e This fabrication technique enables many 2D clean energy products, such as flexible electronics for solar panels and membranes for low-energy separations.
Sustainable Manufacturing - Flow of Materials through Industry
a,c,e Material flow analyses reveal expanded technology opportunities; for example, recycled materials can require much less energy to process than primary materials, but to fully realize these benefits requires a broader systems approach, products designed for re-use, and technologies that enable greater use of secondary materials.
Waste Heat Recovery Systems
a,c Manufacturing waste heat can be captured and re-used by redirecting waste streams for use in another thermal process or by converting the waste heat to electricity.
Wide Bandgap Semiconductors for Power Electronics
b,c,e Wide bandgap semiconductors can enable smaller, lighter, and higher-efficiency power electronics compared to silicon-based devices.
Many of these technologies are cross cutting and can enhance energy and materials productivity in multiple subsectors. Mapping these technology areas to manufacturing subsectors and estimating their energy and materials productivity impacts requires more effort.
CONCLUSIONS
Manufacturing has an outsized role in affecting the economy’s energy productivity. Technologies deployed in the sector affect the energy directly and indirectly consumed in the production and use of manufactured products throughout their life cycle in the energy, transportation, industrial, commercial, and residential sectors. Consequently, concurrent approaches are needed to decouple manufacturing energy and emissions from GDP growth by: (1) decreasing energy intensity (BTU/physical product unit) of manufactured products; (2) increasing the energy performance (service/mass) of manufactured products; (3) increase the value-added (value-added/service) of manufactured products; (4) grow the renewable-powered, hyper-efficient manufacturing sector to increase GDP output; and (5) prevent rebound effects by optimizing life cycle resource efficiency.
3-112©2017 ACEEE Summer Study on Energy Efficiency in Industry
In 2007 McKinsey (Bressand et al., 2007) estimated that global energy demand will increase by 2.2% annually through 2020, driven by developing markets for buildings and transportation, and the industrial engine required to produce these goods. McKinsey also estimated that energy growth could be reduced to <1% annually via energy productivity, reducing expected demand in 2020 by 20 to 24%, which would contribute to half the GHG abatement needed to hold a global mean temperature increase to 2 degrees C. The international perspective is important given that carbon emissions are a global problem, and outsourcing is not a solution.
REFERENCES
Bressand, F. et al. (2007) Curbing global energy demand growth: The energy productivity opportunity. San Francisco, CA.
Brueske, S., Kramer, C. and Fisher, A. (2015) Bandwidth Study on Energy Ese and Potential Energy Saving Opportunities in U.S. Petroleum Refining. Washington, DC.
Bureau of Economic Analysis (2016) Industry Data, GDP-by-industry. Davis, J. et al. (2015) ‘Smart Manufacturing’, Annual Review of Chemical and Biomolecular
Engineering, 6(1), pp. 141–160. doi: 10.1146/annurev-chembioeng-061114-123255. Gallaher, M. P. et al. (2016) Economic Analysis of Technology Infrastructure Needs for
Advanced Manufacturing - Smart Manufacturing. Gaithersburg, MD: Economic Analysis OfficeNational Institute of Standards andTechnology.
Jamison, K. et al. (2015) Bandwidth Study on Energy Use and Potential Saving Opportunities in U.S. Iron and Steel Manufacturing. Washington, DC.
Keyser, D. et al. (2015) Accelerate Energy Productivity 2030: A Strategic Roadmap for American Energy Innovation, Economic Growth, and Competitiveness. U.S. Department of Energy. Available at: http://www.energy2030.org/wp-content/uploads/RoadMap-Part-11.pdf.
Miller, T., Kramer, C. and Fisher, A. (2015) Bandwidth Study on Energy Use and Potential Energy Saving Opportunities in U.S. Pulp and Paper Manufacturing. Washington, DC.
National Academy of Engineering (2012) Making Value: Integrating Manufacturing, Design and Innovation to Thrive in the Changing Global Economy. Edited by K. Whitefoot and S. Olson. National Academies Press.
Sabine Brueske , Caroline Kramer, A. F. (2014) ‘Bandwidth Study on Energy Use and Potential Energy Saving Opportunities in U.S. Chemical Manufacturing’.
U.S. Census ASM Glossery (2017). Available at: https://www.census.gov/programs-surveys/asm/about/glossary.html.
U.S. Department of Commerce (2015) United States Census Bureau, Annual Survey of Manufactures.
U.S. Department of Energy (2015) An assessment of energy technologies and research opportunities. Washington, DC.
U.S. Energy Information Administration (2016) Annual Energy Outlook. Washington, DC. doi: EIA-0383(2016).
3-113©2017 ACEEE Summer Study on Energy Efficiency in Industry