Embed Size (px)
Citation preview
CRS Report for CongressPrepared for Members and Committees of Congress
U.S. Livestock and Poultry Feed Use and Availability: Background and Emerging Issues
Randy Schnepf Specialist in Agricultural Policy
August 11, 2011
Congressional Research Service
7-5700 www.crs.gov
R41956
U.S. Livestock and Poultry Feed Use and Availability: Background and Emerging Issues
Congressional Research Service
Summary The U.S. livestock and poultry sector is presently confronting near-record high feed costs driven by the convergence of both current tight supply prospects and long-run market forces. The U.S. livestock sector, where feed costs account for 50% to 80% of cash operating expenses, has seen its profit margins steadily squeezed and its share of U.S. agricultural cash receipts decline. Since June 2010 feed cost increases have outpaced livestock price increases, squeezing the profitability of livestock and poultry producers. When profit margins turn unfavorable, producers are more likely to retain fewer breeding animals or to liquidate herds. Near-term liquidation means smaller future herds or flocks and ultimately higher retail prices for beef, pork, poultry meat, eggs, and dairy products. Persistent upward feed price movements could result in substantial and long-lasting consequences for livestock product prices throughout the marketing chain.
USDA forecasts that U.S. corn stocks will approach historic low levels relative to demand by the end of summer 2011. In addition, the current crop outlook remains uncertain due to late planting in the Northern Plains and Eastern Corn Belt and a severe drought that has dried up pasture lands from the Southern Plains into the Southeast, exposing cattle producers to expensive commercial feed markets.
From a longer-term perspective, U.S. feed grain demand has exceeded production in all but one year since 2004. This persistent trend is primarily the result of five factors: rapid growth of U.S. corn-based ethanol production (whose share of the U.S. corn crop in 2011 is forecast to exceed feed use for the first time), limited supply of available U.S. cropland to expand production, prolonged weakness of the U.S. dollar which has made U.S. agricultural exports competitive in foreign markets despite high prices, strong income growth in China and other international markets which has increased demand for livestock products and the feedstuffs (feed grains and protein meals) needed to produce them, and a substantial decline in the price responsiveness of both supply and demand in agricultural commodity markets. The convergence of these factors has resulted in falling grain and oilseed stocks, record or near-record prices for most feedstuffs—grains, oilseeds, hay, and pasture—in 2011, and increasingly volatile commodity prices. These factors are expected to persist for several more years, thus maintaining strong demand for feed grains and strong upward pressure on prices for all commodities that compete for farm land.
Issues surrounding feed use and availability are likely to be of growing interest to Congress as the House and Senate Agriculture Committees monitor the financial health and well-being of the U.S. livestock and poultry sectors, as well as any future ramifications for retail food price inflation. In addition, Congress, along with energy and agricultural market participants, will closely follow any further acceleration of unanticipated side effects on the U.S. livestock sector from continued corn use for ethanol production. Finally, feed availability and associated market price volatility are likely to play a significant role in the next farm bill debate, as the current omnibus farm bill expires in 2012.
Feed market dynamics and what they mean for the U.S. livestock sector depend on many factors. This report provides a review of the current feed market dynamic including the major emerging issues mentioned above and their implications for the U.S. livestock sector and Congress. In addition, background information on the market structure of the U.S. feed grain sector is contained in an appendix.
U.S. Livestock and Poultry Feed Use and Availability: Background and Emerging Issues
Congressional Research Service
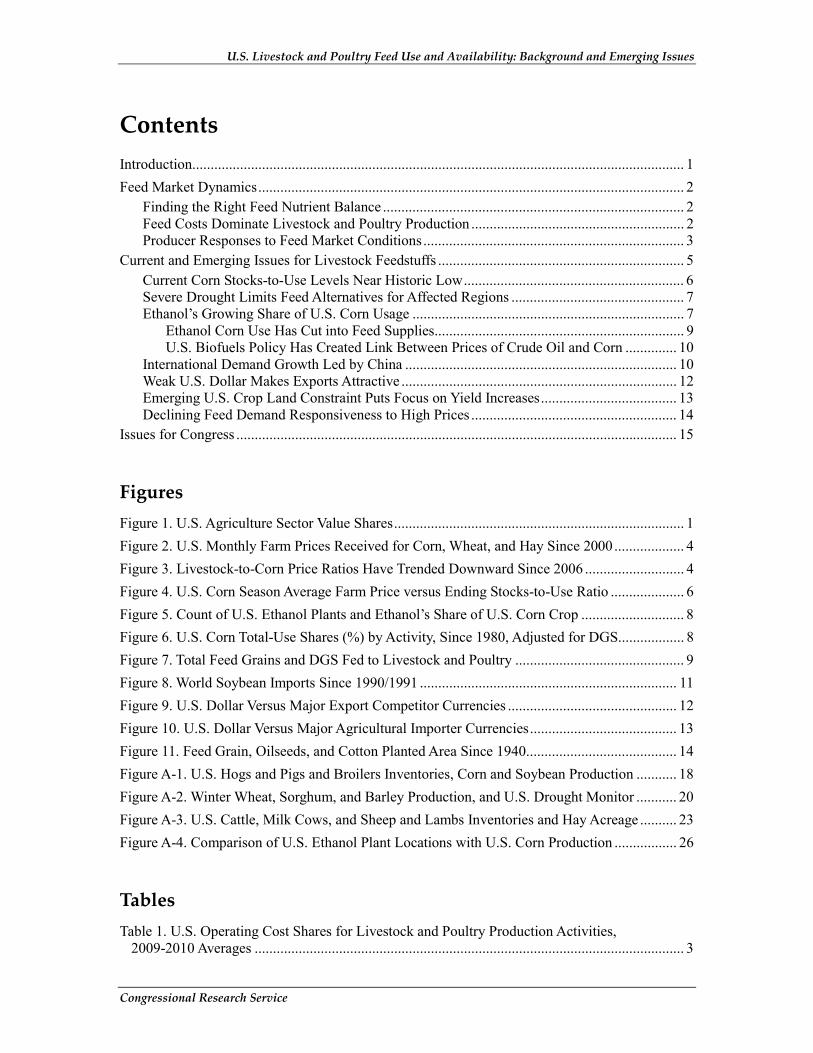
Contents Introduction...................................................................................................................................... 1 Feed Market Dynamics.................................................................................................................... 2
Finding the Right Feed Nutrient Balance .................................................................................. 2 Feed Costs Dominate Livestock and Poultry Production .......................................................... 2 Producer Responses to Feed Market Conditions....................................................................... 3
Current and Emerging Issues for Livestock Feedstuffs ................................................................... 5 Current Corn Stocks-to-Use Levels Near Historic Low............................................................ 6 Severe Drought Limits Feed Alternatives for Affected Regions ............................................... 7 Ethanol’s Growing Share of U.S. Corn Usage .......................................................................... 7
Ethanol Corn Use Has Cut into Feed Supplies.................................................................... 9 U.S. Biofuels Policy Has Created Link Between Prices of Crude Oil and Corn .............. 10
International Demand Growth Led by China .......................................................................... 10 Weak U.S. Dollar Makes Exports Attractive ........................................................................... 12 Emerging U.S. Crop Land Constraint Puts Focus on Yield Increases..................................... 13 Declining Feed Demand Responsiveness to High Prices ........................................................ 14
Issues for Congress ........................................................................................................................ 15
Figures Figure 1. U.S. Agriculture Sector Value Shares............................................................................... 1 Figure 2. U.S. Monthly Farm Prices Received for Corn, Wheat, and Hay Since 2000................... 4 Figure 3. Livestock-to-Corn Price Ratios Have Trended Downward Since 2006 ........................... 4 Figure 4. U.S. Corn Season Average Farm Price versus Ending Stocks-to-Use Ratio .................... 6 Figure 5. Count of U.S. Ethanol Plants and Ethanol’s Share of U.S. Corn Crop ............................ 8 Figure 6. U.S. Corn Total-Use Shares (%) by Activity, Since 1980, Adjusted for DGS.................. 8 Figure 7. Total Feed Grains and DGS Fed to Livestock and Poultry .............................................. 9 Figure 8. World Soybean Imports Since 1990/1991 ...................................................................... 11 Figure 9. U.S. Dollar Versus Major Export Competitor Currencies .............................................. 12 Figure 10. U.S. Dollar Versus Major Agricultural Importer Currencies........................................ 13 Figure 11. Feed Grain, Oilseeds, and Cotton Planted Area Since 1940......................................... 14 Figure A-1. U.S. Hogs and Pigs and Broilers Inventories, Corn and Soybean Production ........... 18 Figure A-2. Winter Wheat, Sorghum, and Barley Production, and U.S. Drought Monitor ........... 20 Figure A-3. U.S. Cattle, Milk Cows, and Sheep and Lambs Inventories and Hay Acreage .......... 23 Figure A-4. Comparison of U.S. Ethanol Plant Locations with U.S. Corn Production ................. 26
Tables Table 1. U.S. Operating Cost Shares for Livestock and Poultry Production Activities,
2009-2010 Averages ..................................................................................................................... 3
U.S. Livestock and Poultry Feed Use and Availability: Background and Emerging Issues
Congressional Research Service
Table A-1. Feed Conversion Ratio (FCR) for Major Livestock and Bird Species ........................ 25 Table A-2. Recommended DGS Usage Rates in Livestock and Poultry Rations .......................... 27
Appendixes Appendix. Overview of Major Feedstuffs ..................................................................................... 17
Contacts Author Contact Information........................................................................................................... 27
U.S. Livestock and Poultry Feed Use and Availability: Background and Emerging Issues
Congressional Research Service 1
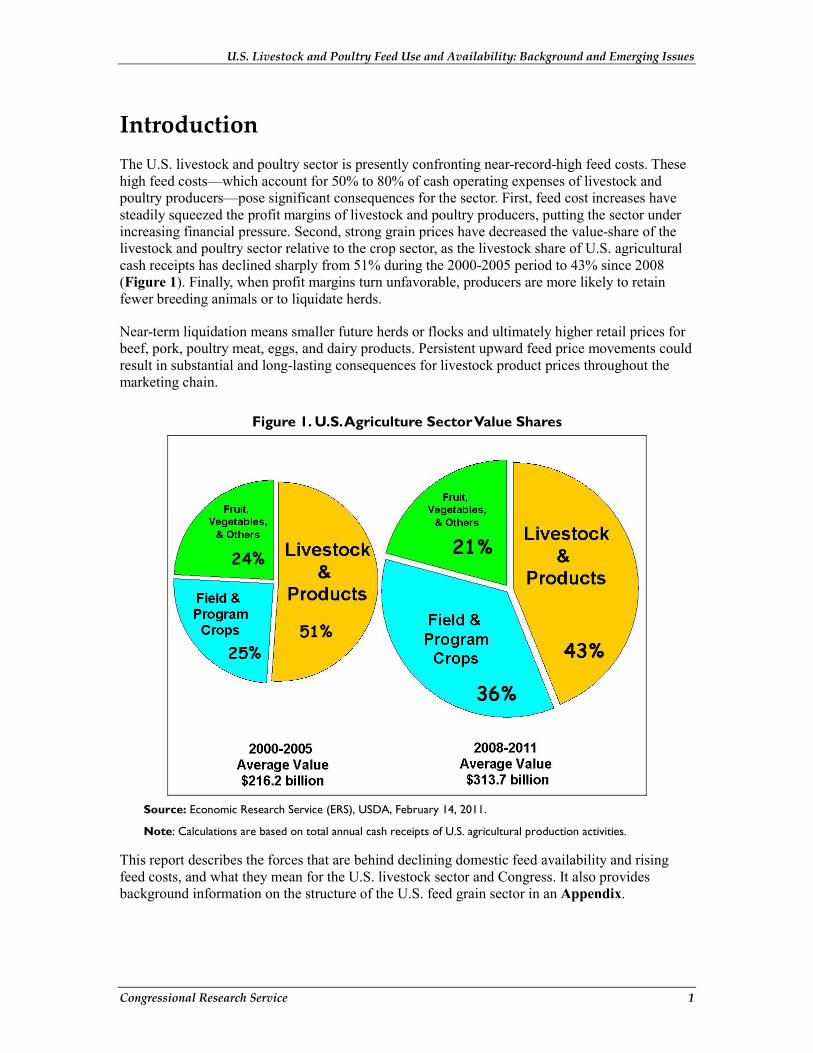
Introduction The U.S. livestock and poultry sector is presently confronting near-record-high feed costs. These high feed costs—which account for 50% to 80% of cash operating expenses of livestock and poultry producers—pose significant consequences for the sector. First, feed cost increases have steadily squeezed the profit margins of livestock and poultry producers, putting the sector under increasing financial pressure. Second, strong grain prices have decreased the value-share of the livestock and poultry sector relative to the crop sector, as the livestock share of U.S. agricultural cash receipts has declined sharply from 51% during the 2000-2005 period to 43% since 2008 (Figure 1). Finally, when profit margins turn unfavorable, producers are more likely to retain fewer breeding animals or to liquidate herds.
Near-term liquidation means smaller future herds or flocks and ultimately higher retail prices for beef, pork, poultry meat, eggs, and dairy products. Persistent upward feed price movements could result in substantial and long-lasting consequences for livestock product prices throughout the marketing chain.
Figure 1. U.S. Agriculture Sector Value Shares
Source: Economic Research Service (ERS), USDA, February 14, 2011.
Note: Calculations are based on total annual cash receipts of U.S. agricultural production activities.
This report describes the forces that are behind declining domestic feed availability and rising feed costs, and what they mean for the U.S. livestock sector and Congress. It also provides background information on the structure of the U.S. feed grain sector in an Appendix.
U.S. Livestock and Poultry Feed Use and Availability: Background and Emerging Issues
Congressional Research Service 2
Feed Market Dynamics The major commercial livestock species in the United States include beef cattle, dairy cows, hogs, and poultry. Three principal types of feedstuffs are used in livestock and poultry rations—energy feeds (primarily from feed grains such as corn and sorghum), protein feeds (primarily from oilseed meals), and roughage (primarily from grazing pasture and rangeland or from cut hay and silage).1
Finding the Right Feed Nutrient Balance Livestock and poultry producers are always looking for the most cost-effective feed sources to achieve maximum weight gain, egg production, and milk output from their herds and flocks. For overall animal health and productivity all commercial livestock and poultry species require a balanced nutrient intake of energy, protein, and roughage, supplemented by essential vitamins, minerals, and other minor additives.2 Fortunately, producers can use a wide variety of natural feed ingredients to satisfy the nutritional requirement of their livestock and poultry.
The choice of feedstuff depends critically on the type of livestock or poultry production activity, since each animal or bird species has different abilities to use any or all of the various feed types based on their digestive capabilities (e.g., ruminant versus monogastric versus avian), as well as the age, sex, breed, health, and reproductive status of the individual animals in a herd or flock. As a result, livestock producers must carefully balance their animals’ nutritional needs with the cost and availability of feed supplies.
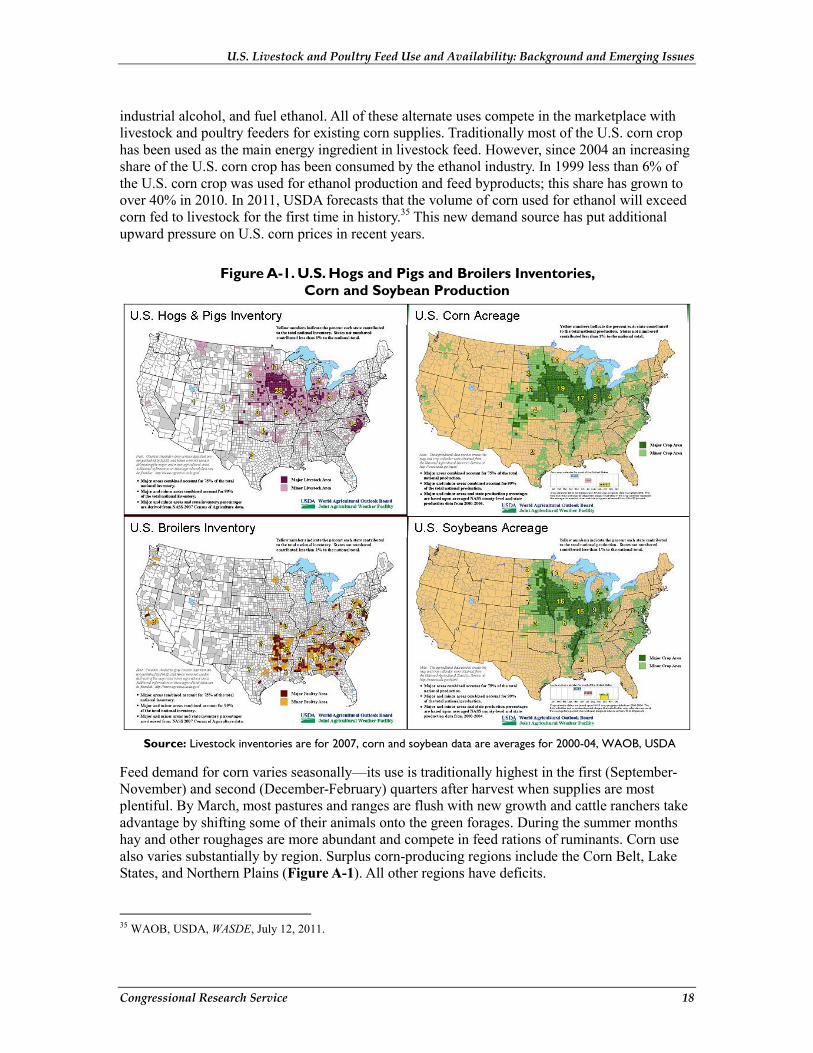
In particular, ruminant animals such as cattle, sheep, and goats are able to break down and digest the cellulose in high-fiber roughages. In contrast, monogastric species (e.g., hogs) or avian species (e.g., poultry) are not able to easily digest cellulosic material and will become ill if their feed rations are too high in fiber. As a result, swine and poultry producers rarely use pastures and ranges in their feeding operations. Instead, swine and poultry are the major consumers of both feed grains and protein meals, while cattle and dairy cows are the major consumers of roughage. For example, the hog industry is such a voracious consumer of the U.S. corn crop that a mapping of U.S. hog inventories very closely mirrors a mapping of corn production (Figure A-1). Similarly, the rapid growth of U.S. poultry meat production which has occurred in recent decades is one of the primary factors behind strong growth in U.S. protein meal consumption.
Feed Costs Dominate Livestock and Poultry Production Livestock and poultry producers have some flexibility in which feeds they use based on the specific nutritional needs of their livestock or birds, and the relative availability and price of the various feed alternatives. Supply and demand changes within and across the three major feedstuff categories impact each major species differently. In general, feed costs account for 50% to 80% of cash operating expenses for most livestock and poultry operations.
1 For a description of the various major feed sources, see the Appendix (Overview of Major Feedstuffs) to this report. 2 The material in this report draws heavily from Animal Feeds Compendium, AER No. 656, Mark Ash, Economic Research Service (ERS), USDA, May 1992.
U.S. Livestock and Poultry Feed Use and Availability: Background and Emerging Issues
Congressional Research Service 3
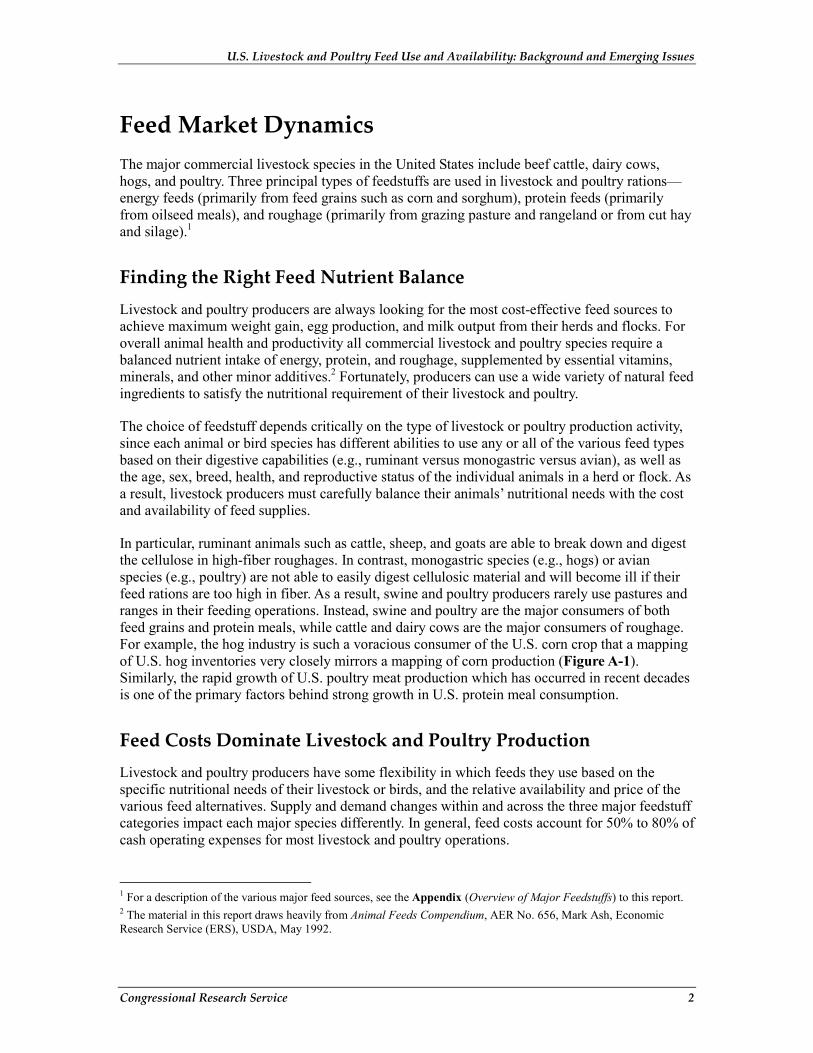
Table 1. U.S. Operating Cost Shares for Livestock and Poultry Production Activities, 2009-2010 Averages
Activity Feed Costs Other Costs Total Operating Costs
Milk 76.9% 23.1% 100%
Cow-Calf 69.5% 30.5% 100%
Hogs: All 55.4% 44.6% 100%
Hogs: Farrow to Finish 84.1% 15.9% 100%
Hogs: Feeder to Finish 52.5% 47.5% 100%
Poultry 70.0% a 30.0% 100%
Source: “Commodity Costs and Returns Data,” Data Sets, ERS, USDA, updated July 6, 2011.
Notes: Farrow to Finish is production from birth until marketed for slaughter at about 225 pounds. Feeder to Finish is production from about 50 pounds until marketed for slaughter. A farrow is a litter of pigs at birth.
a. Representative poultry cost-of-production data are not available; however, the cited figures are shares of live cost, given by Dan King, Virginia Poultry Federation, as part of his testimony at a House Committee on Agriculture, Hearing on the “State of the Poultry Industry” for the Subcommittee on Livestock, Dairy, and Poultry, April 13, 2011.
Changes in feed grain supply, primarily due to weather variations, cause most of the short-term market price changes. The total supply of feeds also depends on many other factors including producer planting choices, agricultural policies, climate, soil type, availability of processing and storage facilities, and international market conditions. Comparative market prices derived from the demand for feed by the various livestock species are also of paramount importance.
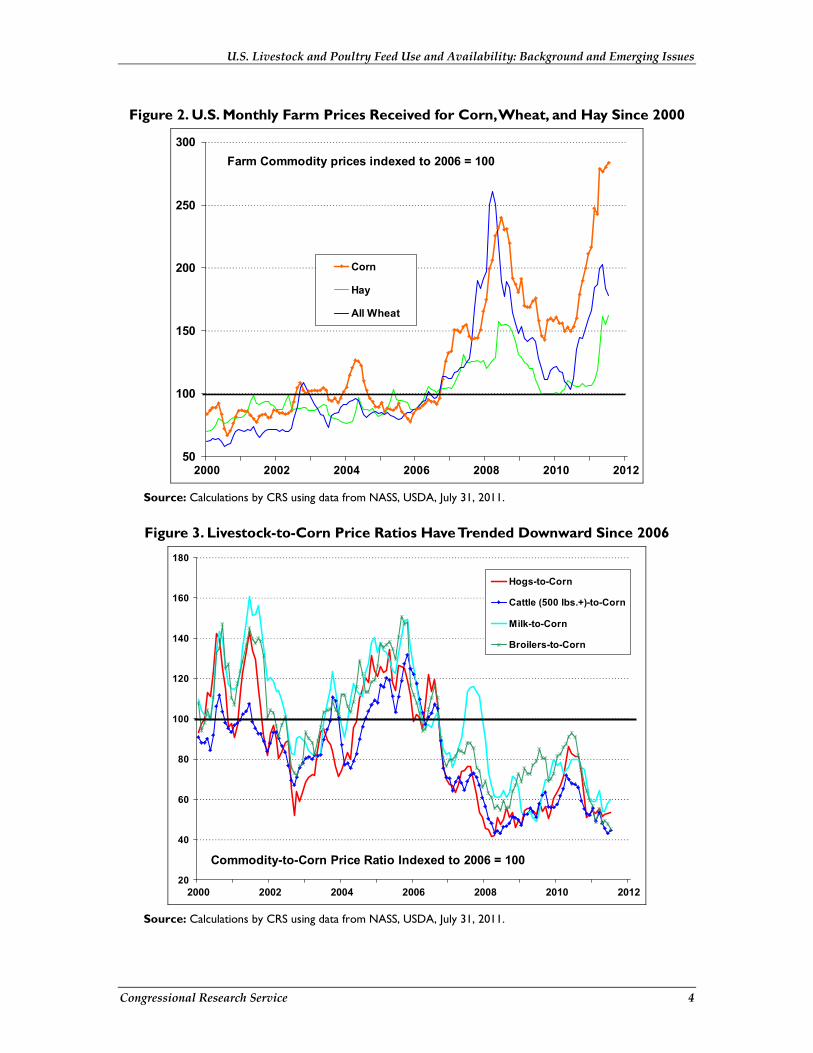
Producer Responses to Feed Market Conditions Because animal and bird nutrient requirements can be met from a variety of feed sources, livestock and poultry feeders are sensitive to comparative price changes among feedstuffs (Figure 2). They are also very sensitive to relative changes between feed prices and the prices of their livestock products (Figure 3). Often, the proximity of livestock and poultry operations to a particular feed source is as important in the feed choice as are relative feed prices and the specific nutrient requirements of each animal or poultry species. Because nutrient needs and feed availabilities usually shift with the seasons, a producer is constantly challenged to plan three to six months or more in advance to avoid being caught in a cost-price squeeze (i.e., product prices fall while feed costs rise) by an unforgiving marketplace.
Prices for various feed grain are linked by their relative feed values and their competition for cropland. As a result, feed grain prices are highly correlated and tend to respond to the same market factors such as weather conditions and changes in international supply and demand. However, because of corn’s dominant role in U.S. and world feed grain markets, the price of other feedstuffs tends to follow corn price changes (Figure 2).3
3 See the Appendix of this report (Overview of Major Feedstuffs) for a discussion of the various feed types and sources.
U.S. Livestock and Poultry Feed Use and Availability: Background and Emerging Issues
Congressional Research Service 4
Figure 2. U.S. Monthly Farm Prices Received for Corn, Wheat, and Hay Since 2000
50
100
150
200
250
300
2000 2002 2004 2006 2008 2010 2012
Corn
Hay
All Wheat
Farm Commodity prices indexed to 2006 = 100
Source: Calculations by CRS using data from NASS, USDA, July 31, 2011.
Figure 3. Livestock-to-Corn Price Ratios Have Trended Downward Since 2006
20
40
60
80
100
120
140
160
180
2000 2002 2004 2006 2008 2010 2012
Hogs-to-Corn
Cattle (500 lbs.+)-to-Corn
Milk-to-Corn
Broilers-to-Corn
Commodity-to-Corn Price Ratio Indexed to 2006 = 100
Source: Calculations by CRS using data from NASS, USDA, July 31, 2011.
U.S. Livestock and Poultry Feed Use and Availability: Background and Emerging Issues
Congressional Research Service 5
Swine and poultry producers are generally more corn-dependent than cattle producers, at least until the cattle have been placed on feed as the final stage prior to marketing. When the hog-corn or steer-corn price ratio turns unfavorable—either due to a corn price upswing, a meat price downturn or some combination—producers are more likely to market their stock earlier to minimize feed costs or to reduce the number of breeding animals that they retain to minimize future herd sizes and feed needs. Depending on the stage of the livestock cycle, changes in breeding activities can affect future market conditions. It can take several years for cattle producers to fully respond to grain market conditions due to the lengthy gestation (nine months) and growth cycle of cattle. Hog producers can respond within five to seven months due to shorter gestation and growth cycles; while broiler and egg producers can modify their operations within a few weeks.
Current and Emerging Issues for Livestock Feedstuffs High feed costs are being driven by the convergence of both current tight supply prospects and long-run market forces. With respect to current conditions, USDA forecasts that U.S. corn stocks will approach historic low levels relative to demand by the end of summer 2011. In addition, uncertainty about the current crop outlook, due to late planting in the Northern Plains and Eastern Corn Belt and a severe drought that has spread from the Southern Plains into the Southeast, has dried up pasture lands, exposing cattle producers to expensive commercial feed markets.
From a longer-term perspective, U.S. feed grain demand has exceeded production in all but one year since 2004. This persistent trend is primarily the result of five factors:
• rapid growth of U.S. corn-based ethanol production (whose share of the U.S. corn crop in 2011 is forecast to exceed feed use for the first time),
• limited supply of available U.S. cropland to expand production,
• prolonged weakness of the U.S. dollar which has made U.S. agricultural exports very competitive despite high commodity prices,
• strong income growth in China and other international markets which has increased demand for livestock products and the feed grains and protein meal needed to produce them, and
• a decline in the responsiveness of feed demand to higher prices—the result of tight stocks, limited cropland, the increased use of corn for ethanol production, and the increasing industrialization of hog and poultry production.4
These factors are expected to persist for several more years, thus maintaining strong demand for feed grains and strong upward pressure on prices for all commodities that compete for farm land. The result of these convergent forces has been falling grain and oilseed stocks, record or near-
4 For a similar discussion of the market forces behind high commodity prices and declining feed availability (but with more detail and a slightly different emphasis) see Philip Abbott, Christopher Hurt, and Wallace Tyner, What’s Driving Food Prices in 2011?, Farm Foundation Issue Report, July 2011; hereafter referred to as Abbott, Hurt, and Tyner, What is Driving Food Prices in 2011, Farm Foundation Report, July 2011.
U.S. Livestock and Poultry Feed Use and Availability: Background and Emerging Issues
Congressional Research Service 6
record prices for most feedstuffs—grains, oilseeds, hay, and pasture—in 2011, and increasingly volatile feed grain prices due to tight supplies and the declining demand responsiveness.
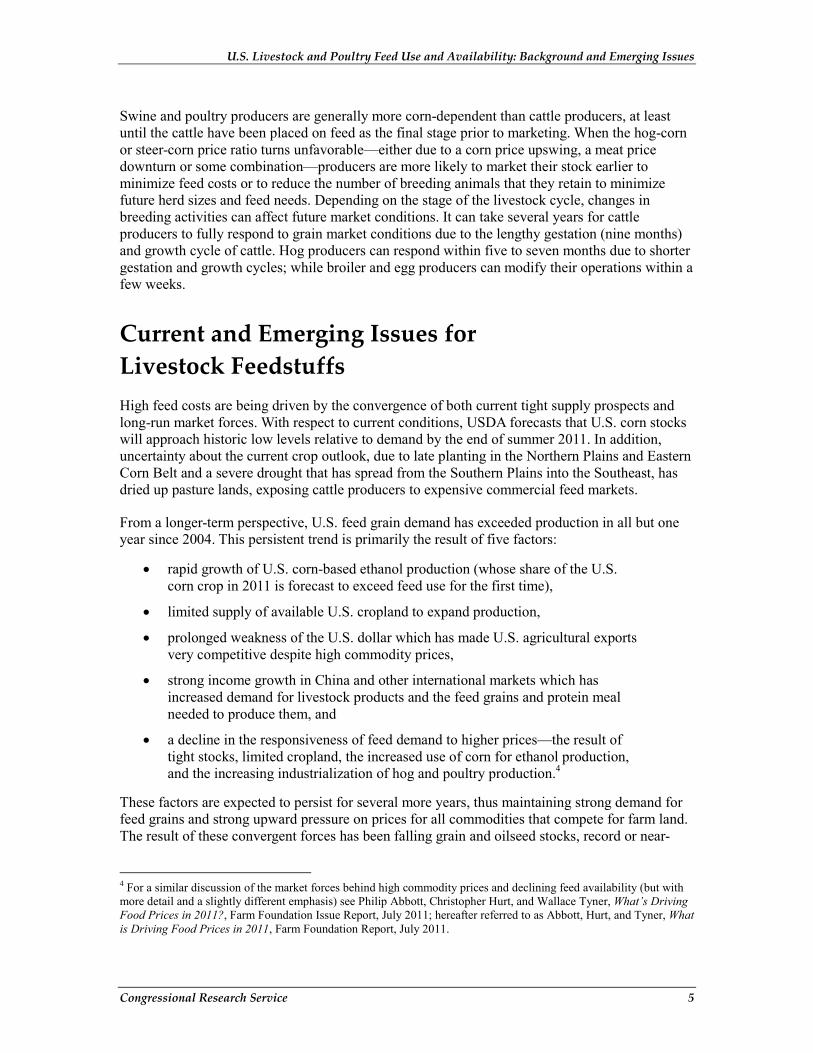
Current Corn Stocks-to-Use Levels Near Historic Low Market observers typically monitor the relative market tightness of a commodity with the ratio of end-of-season stocks to the total use during the season. Season-ending stocks of an annually produced commodity such as corn summarize the effects of both supply and demand factors during the marketing year.5 A certain amount of stocks at the end of the marketing year are necessary to provide a continuous flow of grain to processors and exporters before the new crop is harvested. These stocks are referred to as pipeline supplies. Although there is no hard and fast rule on what volume of stocks represents minimum pipeline levels for the major grain and oilseed crops, a stocks-to-use ratio below 7% clearly raises market concerns. Whenever USDA ending stock projections approach this level, market prices become very sensitive to unexpected market news and prices tend to be more volatile than during periods of abundant stocks.
Figure 4. U.S. Corn Season Average Farm Price versus Ending Stocks-to-Use Ratio
0%
10%
20%
30%
40%
50%
60%
70%
1970 1975 1980 1985 1990 1995 2000 2005 2010$0
$1
$2
$3
$4
$5
$6
$7Stocks-to-Use Ratio $ per bushel
Source: NASS and WAOB, USDA, August 11, 2011.
Notes: 2011/2012 data points are USDA forecasts.
According to USDA, by September 1, 2011 (end of the 2010/2011 corn marketing year), the ratio of U.S. corn stocks to use is expected to be 7.1%, the lowest level since 1996 when the ratio fell to 5% (Figure 4).6 USDA forecasts that the ending-stocks-to-use ratio will decline further to 5.4% in 2012. The decline in U.S. corn ending stocks was precipitated by a surge in demand (up 5 CRS Report RL33204, Price Determination in Agricultural Commodity Markets: A Primer. 6 WAOB, USDA, WASDE, July 12, 2011.
U.S. Livestock and Poultry Feed Use and Availability: Background and Emerging Issues
Congressional Research Service 7
23%) relative to production (up 9%) since 2004.7 The result has been a sharp decline in the level of domestic corn stocks relative to use.
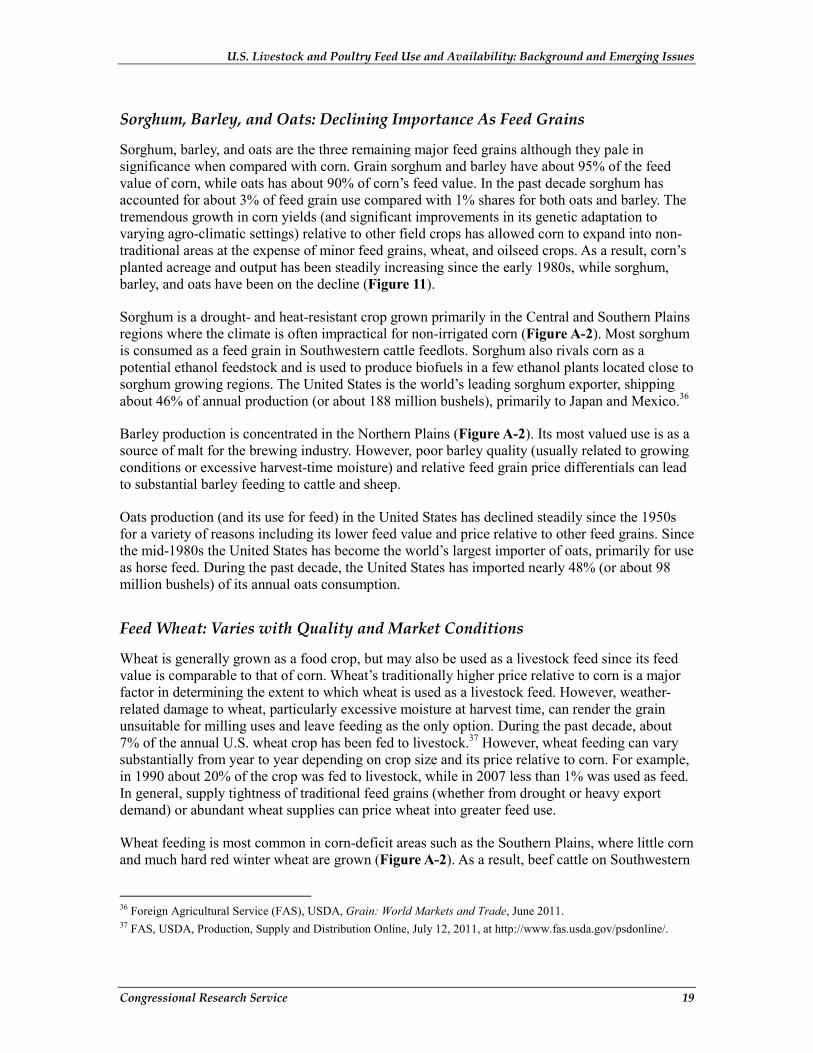
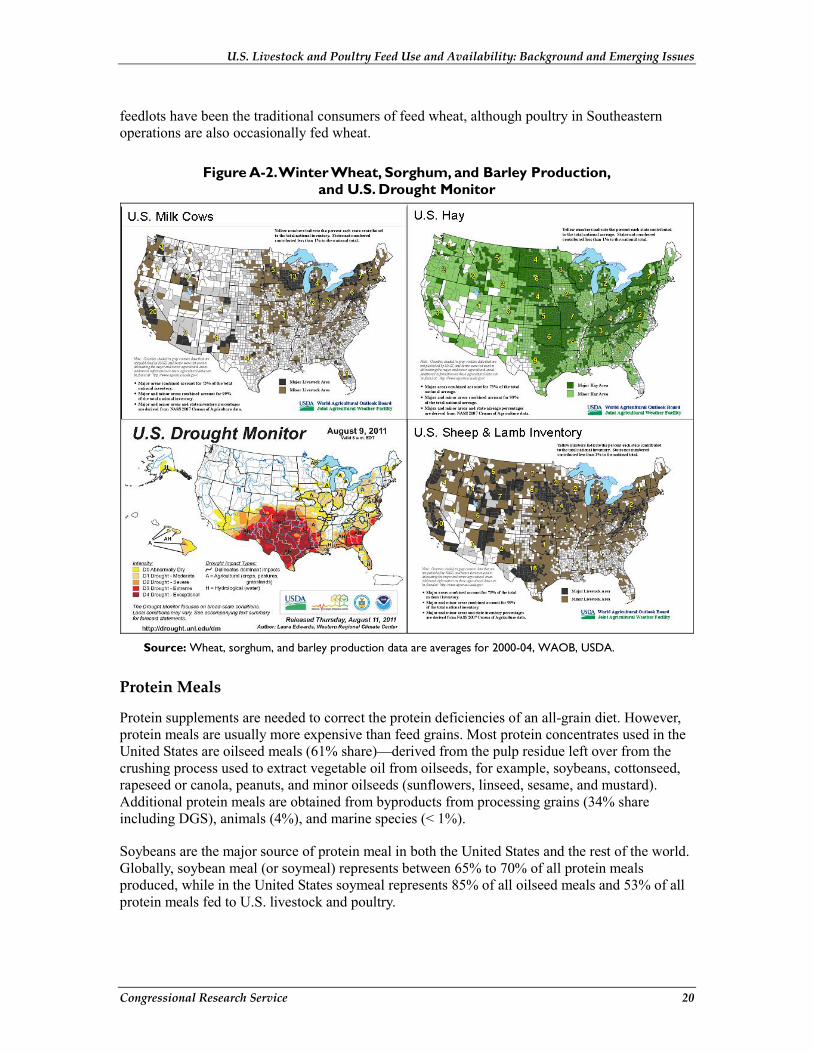
Severe Drought Limits Feed Alternatives for Affected Regions Drought conditions that emerged over the winter in the Southern Plains have worsened considerably into the summer months, and have extended eastward across the entire Southeast and westward into New Mexico and Arizona (Figure A-2). The severe drought has reduced pasture and rangeland grazing opportunities in the affected regions, making livestock producers more dependent on commercial feed markets. In addition, it will likely reduce this year’s grain crops in the affected regions, further increasing the livestock sector’s dependence on feedstuffs from outside the region and raising production costs.
The period from October 2010 through June 2011 was the driest on record in Texas.8 National Weather Service officials predict that the severe drought conditions in Texas and Oklahoma are likely to persist into early next year, and it will likely take months and a wet winter for the pasture land to recover according to a cattle market professional.9 This would be crucial because if the drought persists into October, it will likely result in lower winter wheat plantings in Texas and Oklahoma.10 A decline in winter wheat plantings would be a further blow to ranchers, who would lose key pasture lands. Southern Plains cattle often are permitted to graze on early growth of winter wheat through the winter and into early spring. At that time, depending on the relationship between livestock and wheat prices, either the cattle are allowed to continue grazing and no wheat crop is produced, or they are removed and the wheat is allowed to fill out for eventual harvest.
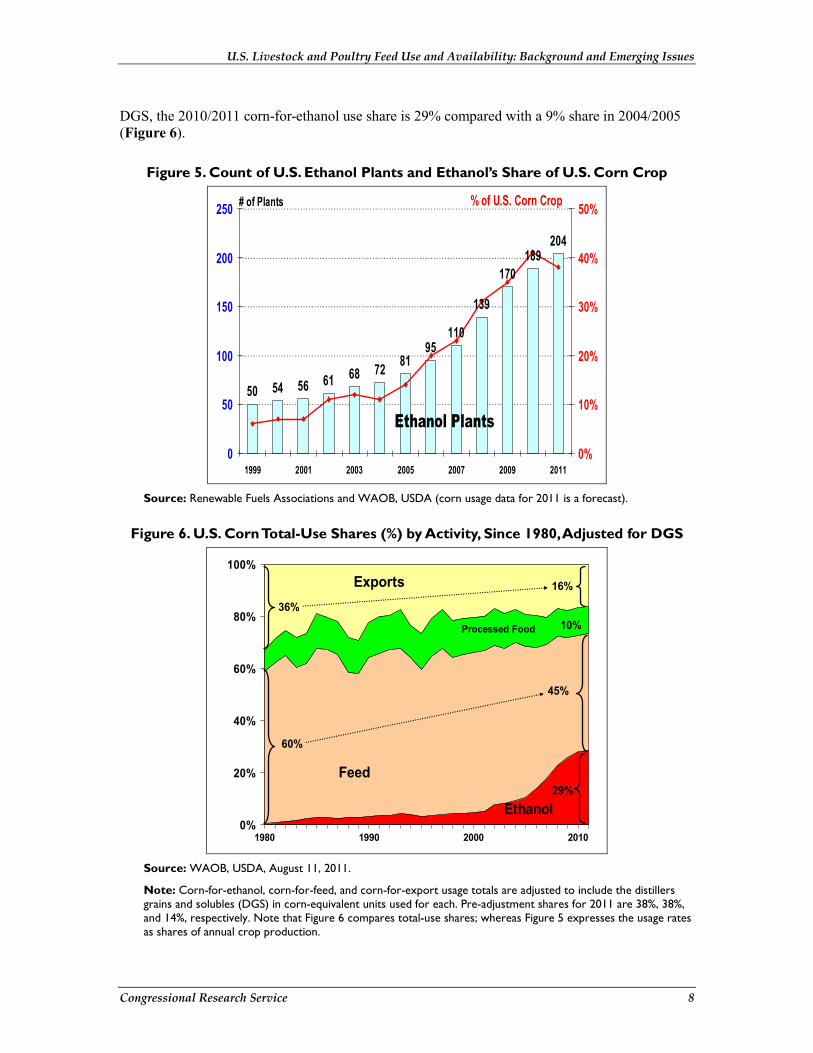
Ethanol’s Growing Share of U.S. Corn Usage The U.S. agricultural landscape has changed dramatically since 2004 with the ascendancy of the U.S. ethanol sector. Most U.S. ethanol is produced from corn starch making it a major source of demand for corn. As U.S. ethanol production has grown in recent years, so too has its usage share of the annual corn crop (Figure 5). In 2004/2005, national ethanol production used 1.3 billion bushels and accounted for 12% of total U.S. corn use; in 2010/2011 it used 5.1 billion bushels (or about 38% of total use) to produce an estimated 13.6 billion gallons of ethanol.11 Corn ethanol advocates argue that nearly 30% of corn used for ethanol is returned to livestock feed markets as high-valued distillers grains and solubles (DGS).12 When corn use estimates are adjusted for 7 The 2004/2005 corn marketing year was a year of relatively high stocks-to-use (20%), but it was also the year that preceded the “take-off” of the U.S. ethanol industry. For more details, see CRS Report R41282, Agriculture-Based Biofuels: Overview and Emerging Issues. 8 Sechler, Bob. “U.S. Lament: How Dry We Are—Forecasters Say Drought to Persist; Crops, Cattle Affected,” The Wall Street Journal, July 8, 2011. 9 Ibid., David Hutchins, cattle broker with Amarillo Brokerage, Amarillo, Texas. 10 CME Group, “Persistent Drought Threatens Wheat Planting in Southern Plains,” Commodity News for Tomorrow, (www.cmegroup.com), August 2, 2011. 11 CRS projection based on data from the “Table 10.3 Fuel Ethanol Overview,” Monthly Energy Review, U.S. Energy Information Administration (EIA), U.S. Dept. of Energy, June 2011. Note that Figure 6 compares total-use shares (excluding use for stocks); whereas Figure 5 expresses the usage rates as shares of annual crop production. 12 Abbott, Hurt, and Tyner argue that the adjustment factor is 27.6% per bushel of corn, calculated as 18 lbs. of DGS per 56 lbs. of corn corrected by DGS’ lower feed value—86% of corn; see Philip Abbott, Christopher Hurt, and Wallace Tyner, What’s Driving Food Prices in 2011?, Farm Foundation Issue Report, July 2011.
U.S. Livestock and Poultry Feed Use and Availability: Background and Emerging Issues
Congressional Research Service 8
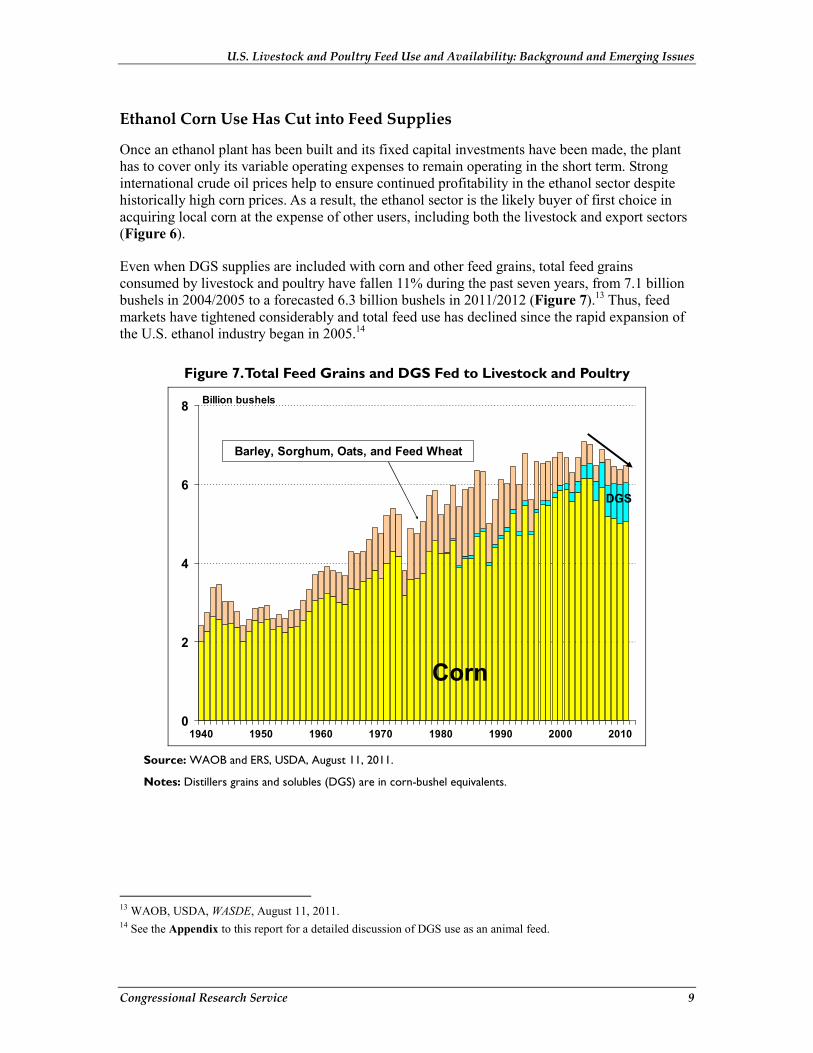
DGS, the 2010/2011 corn-for-ethanol use share is 29% compared with a 9% share in 2004/2005 (Figure 6).
Figure 5. Count of U.S. Ethanol Plants and Ethanol’s Share of U.S. Corn Crop
50 54 56 61 68 72 8195
110
139
170189
204
0
50
100
150
200
250
1999 2001 2003 2005 2007 2009 20110%
10%
20%
30%
40%
50%% of U.S. Corn Crop
Ethanol Plants
# of Plants
Source: Renewable Fuels Associations and WAOB, USDA (corn usage data for 2011 is a forecast).
Figure 6. U.S. Corn Total-Use Shares (%) by Activity, Since 1980, Adjusted for DGS
0%
20%
40%
60%
80%
100%
1980 1990 2000 2010
60%
45%
Feed
Ethanol
Processed Food
Exports36%
16%
29%
10%
Source: WAOB, USDA, August 11, 2011.
Note: Corn-for-ethanol, corn-for-feed, and corn-for-export usage totals are adjusted to include the distillers grains and solubles (DGS) in corn-equivalent units used for each. Pre-adjustment shares for 2011 are 38%, 38%, and 14%, respectively. Note that Figure 6 compares total-use shares; whereas Figure 5 expresses the usage rates as shares of annual crop production.
U.S. Livestock and Poultry Feed Use and Availability: Background and Emerging Issues
Congressional Research Service 9
Ethanol Corn Use Has Cut into Feed Supplies
Once an ethanol plant has been built and its fixed capital investments have been made, the plant has to cover only its variable operating expenses to remain operating in the short term. Strong international crude oil prices help to ensure continued profitability in the ethanol sector despite historically high corn prices. As a result, the ethanol sector is the likely buyer of first choice in acquiring local corn at the expense of other users, including both the livestock and export sectors (Figure 6).
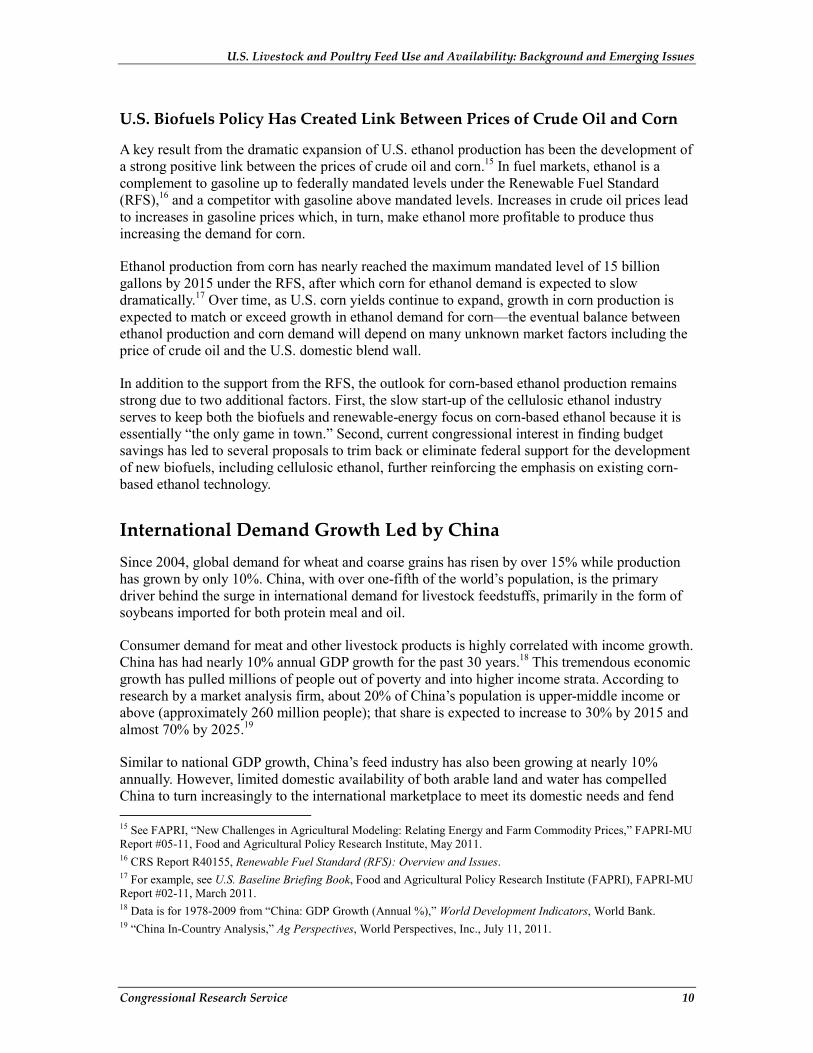
Even when DGS supplies are included with corn and other feed grains, total feed grains consumed by livestock and poultry have fallen 11% during the past seven years, from 7.1 billion bushels in 2004/2005 to a forecasted 6.3 billion bushels in 2011/2012 (Figure 7).13 Thus, feed markets have tightened considerably and total feed use has declined since the rapid expansion of the U.S. ethanol industry began in 2005.14
Figure 7. Total Feed Grains and DGS Fed to Livestock and Poultry
0
2
4
6
8
1940 1950 1960 1970 1980 1990 2000 2010
Corn
DGS
Barley, Sorghum, Oats, and Feed Wheat
Billion bushels
Source: WAOB and ERS, USDA, August 11, 2011.
Notes: Distillers grains and solubles (DGS) are in corn-bushel equivalents.
13 WAOB, USDA, WASDE, August 11, 2011. 14 See the Appendix to this report for a detailed discussion of DGS use as an animal feed.
U.S. Livestock and Poultry Feed Use and Availability: Background and Emerging Issues
Congressional Research Service 10
U.S. Biofuels Policy Has Created Link Between Prices of Crude Oil and Corn
A key result from the dramatic expansion of U.S. ethanol production has been the development of a strong positive link between the prices of crude oil and corn.15 In fuel markets, ethanol is a complement to gasoline up to federally mandated levels under the Renewable Fuel Standard (RFS),16 and a competitor with gasoline above mandated levels. Increases in crude oil prices lead to increases in gasoline prices which, in turn, make ethanol more profitable to produce thus increasing the demand for corn.
Ethanol production from corn has nearly reached the maximum mandated level of 15 billion gallons by 2015 under the RFS, after which corn for ethanol demand is expected to slow dramatically.17 Over time, as U.S. corn yields continue to expand, growth in corn production is expected to match or exceed growth in ethanol demand for corn—the eventual balance between ethanol production and corn demand will depend on many unknown market factors including the price of crude oil and the U.S. domestic blend wall.
In addition to the support from the RFS, the outlook for corn-based ethanol production remains strong due to two additional factors. First, the slow start-up of the cellulosic ethanol industry serves to keep both the biofuels and renewable-energy focus on corn-based ethanol because it is essentially “the only game in town.” Second, current congressional interest in finding budget savings has led to several proposals to trim back or eliminate federal support for the development of new biofuels, including cellulosic ethanol, further reinforcing the emphasis on existing corn-based ethanol technology.
International Demand Growth Led by China Since 2004, global demand for wheat and coarse grains has risen by over 15% while production has grown by only 10%. China, with over one-fifth of the world’s population, is the primary driver behind the surge in international demand for livestock feedstuffs, primarily in the form of soybeans imported for both protein meal and oil.
Consumer demand for meat and other livestock products is highly correlated with income growth. China has had nearly 10% annual GDP growth for the past 30 years.18 This tremendous economic growth has pulled millions of people out of poverty and into higher income strata. According to research by a market analysis firm, about 20% of China’s population is upper-middle income or above (approximately 260 million people); that share is expected to increase to 30% by 2015 and almost 70% by 2025.19
Similar to national GDP growth, China’s feed industry has also been growing at nearly 10% annually. However, limited domestic availability of both arable land and water has compelled China to turn increasingly to the international marketplace to meet its domestic needs and fend 15 See FAPRI, “New Challenges in Agricultural Modeling: Relating Energy and Farm Commodity Prices,” FAPRI-MU Report #05-11, Food and Agricultural Policy Research Institute, May 2011. 16 CRS Report R40155, Renewable Fuel Standard (RFS): Overview and Issues. 17 For example, see U.S. Baseline Briefing Book, Food and Agricultural Policy Research Institute (FAPRI), FAPRI-MU Report #02-11, March 2011. 18 Data is for 1978-2009 from “China: GDP Growth (Annual %),” World Development Indicators, World Bank. 19 “China In-Country Analysis,” Ag Perspectives, World Perspectives, Inc., July 11, 2011.
U.S. Livestock and Poultry Feed Use and Availability: Background and Emerging Issues
Congressional Research Service 11
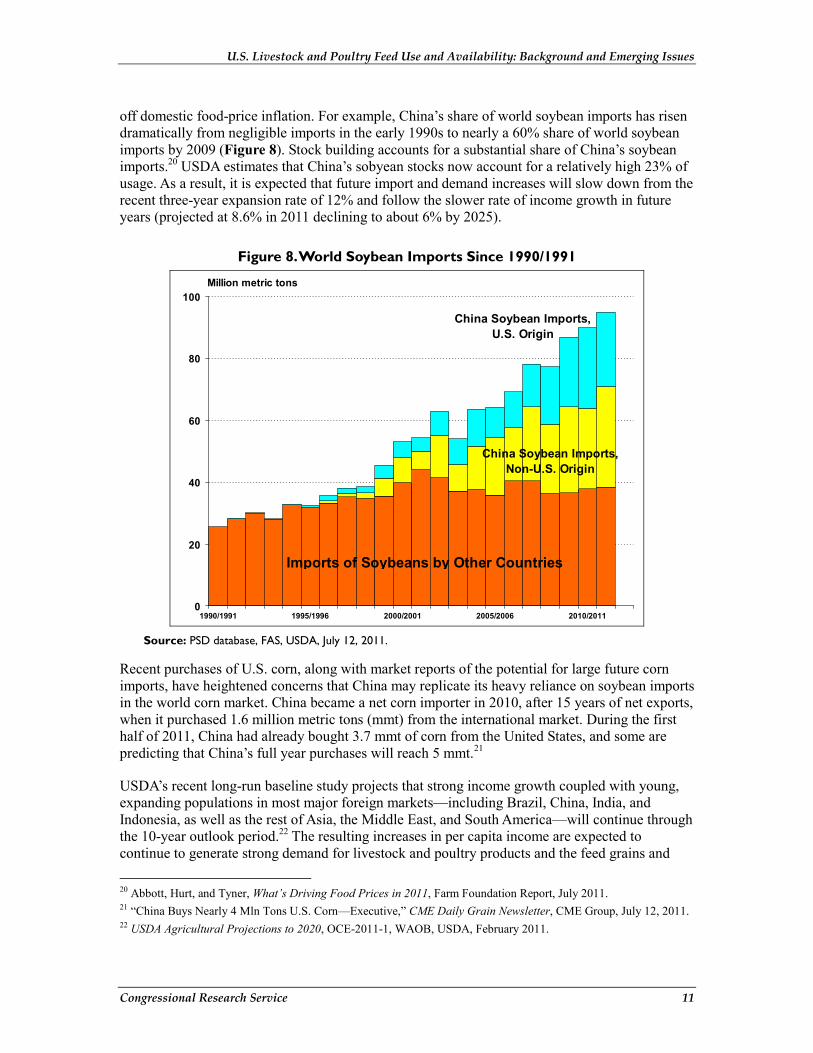
off domestic food-price inflation. For example, China’s share of world soybean imports has risen dramatically from negligible imports in the early 1990s to nearly a 60% share of world soybean imports by 2009 (Figure 8). Stock building accounts for a substantial share of China’s soybean imports.20 USDA estimates that China’s sobyean stocks now account for a relatively high 23% of usage. As a result, it is expected that future import and demand increases will slow down from the recent three-year expansion rate of 12% and follow the slower rate of income growth in future years (projected at 8.6% in 2011 declining to about 6% by 2025).
Figure 8. World Soybean Imports Since 1990/1991
0
20
40
60
80
100
1990/1991 1995/1996 2000/2001 2005/2006 2010/2011
China Soybean Imports, Non-U.S. Origin
Million metric tons
China Soybean Imports, U.S. Origin
Imports of Soybeans by Other Countries
Source: PSD database, FAS, USDA, July 12, 2011.
Recent purchases of U.S. corn, along with market reports of the potential for large future corn imports, have heightened concerns that China may replicate its heavy reliance on soybean imports in the world corn market. China became a net corn importer in 2010, after 15 years of net exports, when it purchased 1.6 million metric tons (mmt) from the international market. During the first half of 2011, China had already bought 3.7 mmt of corn from the United States, and some are predicting that China’s full year purchases will reach 5 mmt.21
USDA’s recent long-run baseline study projects that strong income growth coupled with young, expanding populations in most major foreign markets—including Brazil, China, India, and Indonesia, as well as the rest of Asia, the Middle East, and South America—will continue through the 10-year outlook period.22 The resulting increases in per capita income are expected to continue to generate strong demand for livestock and poultry products and the feed grains and
20 Abbott, Hurt, and Tyner, What’s Driving Food Prices in 2011, Farm Foundation Report, July 2011. 21 “China Buys Nearly 4 Mln Tons U.S. Corn—Executive,” CME Daily Grain Newsletter, CME Group, July 12, 2011. 22 USDA Agricultural Projections to 2020, OCE-2011-1, WAOB, USDA, February 2011.
U.S. Livestock and Poultry Feed Use and Availability: Background and Emerging Issues
Congressional Research Service 12
protein meals needed to produce them throughout the period. As a result, grain and oilseed prices are projected to remain strong and producers are likely to be challenged to keep pace with demand.
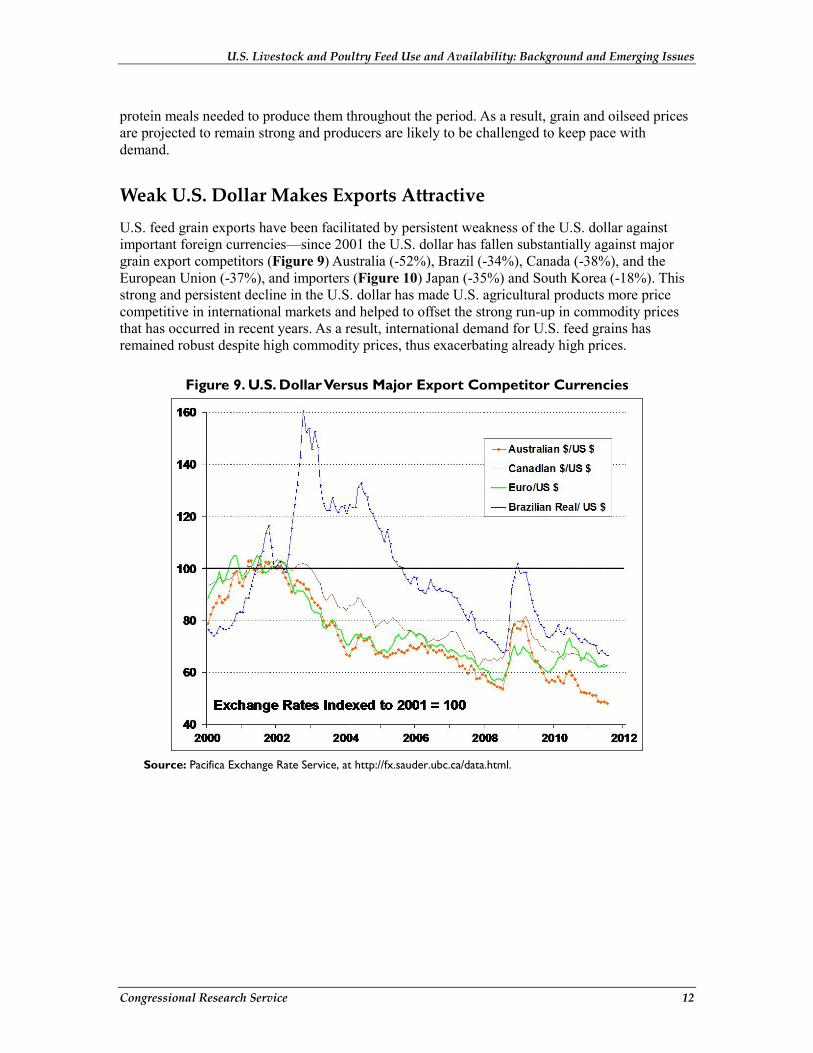
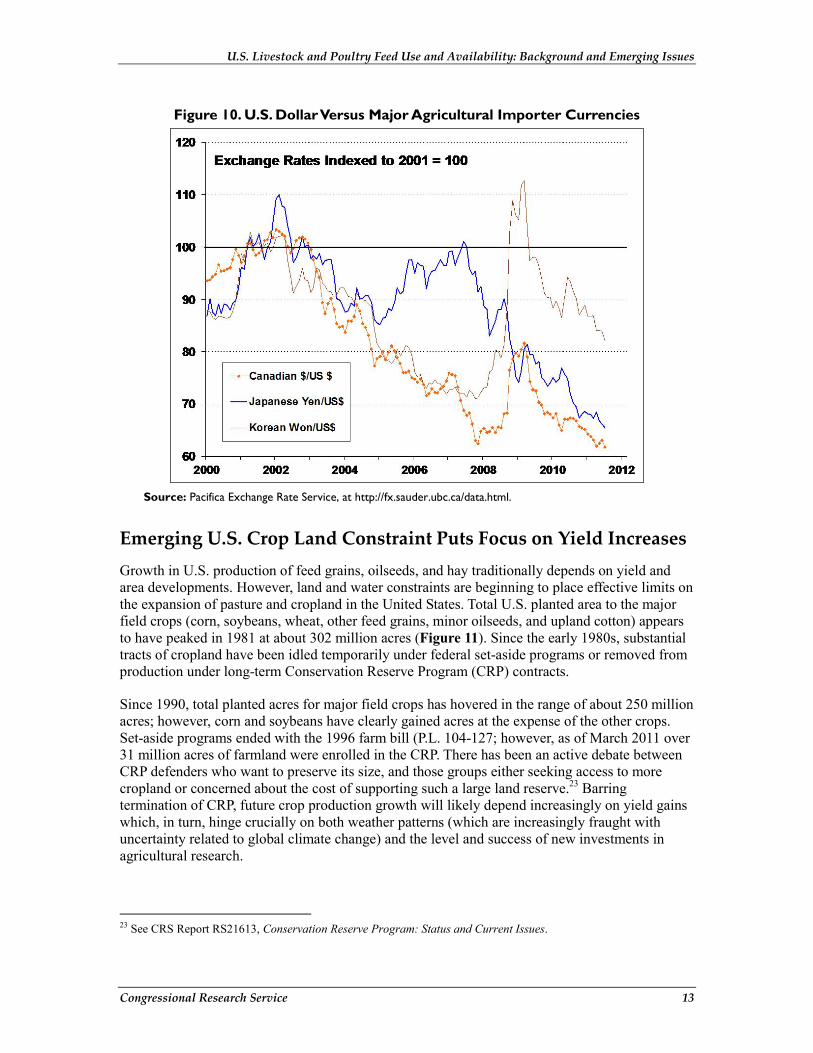
Weak U.S. Dollar Makes Exports Attractive U.S. feed grain exports have been facilitated by persistent weakness of the U.S. dollar against important foreign currencies—since 2001 the U.S. dollar has fallen substantially against major grain export competitors (Figure 9) Australia (-52%), Brazil (-34%), Canada (-38%), and the European Union (-37%), and importers (Figure 10) Japan (-35%) and South Korea (-18%). This strong and persistent decline in the U.S. dollar has made U.S. agricultural products more price competitive in international markets and helped to offset the strong run-up in commodity prices that has occurred in recent years. As a result, international demand for U.S. feed grains has remained robust despite high commodity prices, thus exacerbating already high prices.
Figure 9. U.S. Dollar Versus Major Export Competitor Currencies
Source: Pacifica Exchange Rate Service, at http://fx.sauder.ubc.ca/data.html.
U.S. Livestock and Poultry Feed Use and Availability: Background and Emerging Issues
Congressional Research Service 13
Figure 10. U.S. Dollar Versus Major Agricultural Importer Currencies
Source: Pacifica Exchange Rate Service, at http://fx.sauder.ubc.ca/data.html.
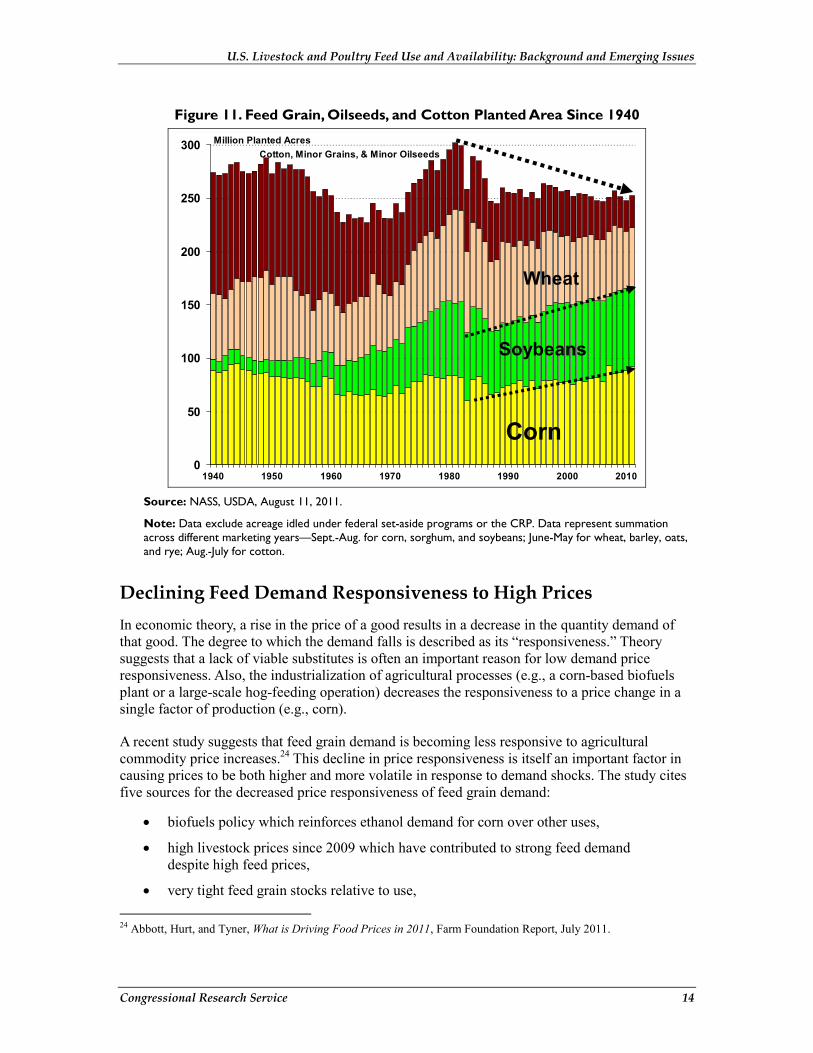
Emerging U.S. Crop Land Constraint Puts Focus on Yield Increases Growth in U.S. production of feed grains, oilseeds, and hay traditionally depends on yield and area developments. However, land and water constraints are beginning to place effective limits on the expansion of pasture and cropland in the United States. Total U.S. planted area to the major field crops (corn, soybeans, wheat, other feed grains, minor oilseeds, and upland cotton) appears to have peaked in 1981 at about 302 million acres (Figure 11). Since the early 1980s, substantial tracts of cropland have been idled temporarily under federal set-aside programs or removed from production under long-term Conservation Reserve Program (CRP) contracts.
Since 1990, total planted acres for major field crops has hovered in the range of about 250 million acres; however, corn and soybeans have clearly gained acres at the expense of the other crops. Set-aside programs ended with the 1996 farm bill (P.L. 104-127; however, as of March 2011 over 31 million acres of farmland were enrolled in the CRP. There has been an active debate between CRP defenders who want to preserve its size, and those groups either seeking access to more cropland or concerned about the cost of supporting such a large land reserve.23 Barring termination of CRP, future crop production growth will likely depend increasingly on yield gains which, in turn, hinge crucially on both weather patterns (which are increasingly fraught with uncertainty related to global climate change) and the level and success of new investments in agricultural research.
23 See CRS Report RS21613, Conservation Reserve Program: Status and Current Issues.
U.S. Livestock and Poultry Feed Use and Availability: Background and Emerging Issues
Congressional Research Service 14
Figure 11. Feed Grain, Oilseeds, and Cotton Planted Area Since 1940
0
50
100
150
200
250
300
1940 1950 1960 1970 1980 1990 2000 2010
Corn
Wheat
Cotton, Minor Grains, & Minor Oilseeds
Soybeans
Million Planted Acres
Source: NASS, USDA, August 11, 2011.
Note: Data exclude acreage idled under federal set-aside programs or the CRP. Data represent summation across different marketing years—Sept.-Aug. for corn, sorghum, and soybeans; June-May for wheat, barley, oats, and rye; Aug.-July for cotton.
Declining Feed Demand Responsiveness to High Prices In economic theory, a rise in the price of a good results in a decrease in the quantity demand of that good. The degree to which the demand falls is described as its “responsiveness.” Theory suggests that a lack of viable substitutes is often an important reason for low demand price responsiveness. Also, the industrialization of agricultural processes (e.g., a corn-based biofuels plant or a large-scale hog-feeding operation) decreases the responsiveness to a price change in a single factor of production (e.g., corn).
A recent study suggests that feed grain demand is becoming less responsive to agricultural commodity price increases.24 This decline in price responsiveness is itself an important factor in causing prices to be both higher and more volatile in response to demand shocks. The study cites five sources for the decreased price responsiveness of feed grain demand:
• biofuels policy which reinforces ethanol demand for corn over other uses,
• high livestock prices since 2009 which have contributed to strong feed demand despite high feed prices,
• very tight feed grain stocks relative to use, 24 Abbott, Hurt, and Tyner, What is Driving Food Prices in 2011, Farm Foundation Report, July 2011.
U.S. Livestock and Poultry Feed Use and Availability: Background and Emerging Issues
Congressional Research Service 15
• tightness of cropland supply and limited reallocation possibilities among crops, and
• foreign trade policies that cut off supplies from international markets thus exaggerating international market supply tightness.
The study authors conclude that, until international stocks are able to rebuild to more traditional levels, agricultural commodity markets are likely to remain vulnerable to sharp price movements. Demand growth is expected to slow as corn biofuels mandates are reached and as China builds its soybean stock levels. However, in the absence of yields well above trend, it appears that the tight world stocks for corn, soybeans, and other feedstuffs, cannot be overcome in a single crop year but will be likely to persist for several years.
Issues for Congress U.S. and global feed costs have moved sharply higher since 2007, in part due to their linkage (via biofuels policy) to energy markets, but also as a result of a tightening resource base, international market conditions, macroeconomic factors, and weather events that have contributed to a series of years where feed demand has outpaced supply. For the U.S. livestock and poultry sector—where feed costs account for 50% to 80% of cash operating expenses—this poses significant consequences including declining profit margins, increased financial pressure, and the prospects for substantial near-term liquidation of herds or flocks. Smaller future herds or flocks will ultimately translate into higher retail prices for beef, pork, poultry meat, eggs, and dairy products.
The current prolonged drought in the Southwest and Southeast has only aggravated the persistent tightening of feed supplies. Apart from buying expensive commercial feeds or liquidating herd and flock numbers, there appear to be few options in the near-term for addressing the situation. Under certain conditions—including a severe drought—ranchers and livestock producers are permitted by USDA to cut hay and graze livestock on land set aside under the Conservation Reserve Program (CRP).25 However, this may offer little relief if the CRP lands are located within a drought zone.
The 2008 farm bill authorized three new livestock assistance programs.26 The Livestock Forage Disaster Program (LFP) assists ranchers who graze livestock on drought-affected pastureland or grazing land.27 The Livestock Indemnity Program (LIP) compensates ranchers at a rate of 75% of market value for livestock mortality caused by a disaster. The Emergency Assistance for Livestock, Honey Bees, and Farm-Raised Fish Program (ELAP) compensates producers for disaster losses not covered under other disaster programs. However, all three of these programs expire on September 30, 2011, and reauthorization might be difficult since they have no baseline funding beyond FY2011.
25 See “Emergency Haying and Grazing,” Conservation Programs, Farm Service Agency (FSA), USDA, at http://www.apfo.usda.gov/FSA/webapp?area=home&subject=copr&topic=crp-eg. 26 See CRS Report RS21212, Agricultural Disaster Assistance. 27 See USDA fact sheet at http://www.fsa.usda.gov/FSA/webapp?area=home&subject=diap&topic=lfp. Also see FSA, USDA, “Livestock Forage Disaster Program and Emergency Assistance for Livestock, Honeybees, and Farm-Raised Fish; Supplemental Agricultural Disaster Assistance,” 74 Federal Register 46665-46683, Sept. 11, 2009.
U.S. Livestock and Poultry Feed Use and Availability: Background and Emerging Issues
Congressional Research Service 16
Perhaps the most effective measures for dealing with a drought and/or sharply higher feed costs are precautionary ones taken in the spring in advance of the onset of severe summer weather conditions when both federal risk management tools and commercial hedging operations can help mitigate any potential economic losses. For example, USDA offers limited livestock programs under the federal crop insurance program.28 Relatively new or pilot programs protect livestock and dairy producers from loss of gross margin or price declines. In addition, several index-based policies are available to insure against losses on pasture, rangeland, and forage.29 The U.S. dairy industry in particular has been concerned about the increasing price volatility of commercial feed markets and has been exploring the potential for developing a federal dairy program that focuses on stronger output-to-input margin protection.30 In the longer term, federal policies closely associated with the decline in feed availability and high commodity prices are both biofuels policy and land-use policy (particularly the CRP).
For major program crop producers, high market prices—at levels above commodity loan rates and target prices—have resulted in a sharp decline in payments under the price contingent marketing loan and counter-cyclical payment programs. If commodity prices are sustained at such high levels, price contingent farm programs are likely to lose much or possibly all of their long-run baseline funding. These and other issues related to livestock feed availability are likely to be of growing interest to Congress as the House and Senate Agriculture Committees monitor the financial health and well-being of the U.S. livestock and poultry sectors as well as any future ramifications for retail food price inflation.
In addition, Congress, along with energy and agricultural market participants, is expected to closely follow any further acceleration of unanticipated side-effects on the U.S. livestock sector from continued corn use for ethanol production. Finally, feed availability and associated market price volatility are likely to play a significant role in the next farm bill debate, as the current omnibus farm bill expires in 2012. The decline in price contingent program payments under high commodity prices coupled with the increased price volatility of recent years is likely to refocus interest on federal support for risk management tools to help agricultural producers manage the unpredictability of the marketplace.
28 See CRS Report R40532, Federal Crop Insurance: Background and Issues, and CRS Report R41854, Risk Management Tools for Dairy Farmers. 29 See Risk Management Agency (RMA), USDA, “Pasture, Rangeland, and Forage,” Crop Policies and Pilots, available at http://www.rma.usda.gov/policies/pasturerangeforage/. 30 See CRS Report R41141, Previewing Dairy Policy Options for the Next Farm Bill.
U.S. Livestock and Poultry Feed Use and Availability: Background and Emerging Issues
Congressional Research Service 17
Appendix. Overview of Major Feedstuffs
Primary Feedstuff Sources The three main nutrient categories—roughage, energy, and protein—can be obtained from several sources.
Feed Grains—The Main Energy Source
Feed grains—corn, sorghum, barley, oats, and feed wheat—account for about 70% of all feedstuff (energy and protein alike) consumed by livestock.31 The high starch levels of feed grains supply most of the energy needed for animal and poultry body maintenance and production of meat, milk, and eggs. Over the past decade, poultry (33%) and hogs (27%) have been the dominant users of feed grains compared with cattle on feed (24%) and dairy cows (11%).32
Corn: The King of Feed Grains
Corn is the world’s most important feed. It is the base ingredient for most dairy, beef, swine, and poultry feeds. Corn accounts for 92% of all U.S. feed grains produced, and 65% of all U.S. feedstuffs (both energy and protein) consumed.33 Corn’s nutritional advantage includes high carbohydrate and fat contents, and low fiber content. However, corn is deficient in several amino acids, calcium, and most vitamins and must, therefore, be used in coordination with other specific feedstuffs to achieve a balanced diet for livestock and poultry.
The United States is the world’s largest producer of corn. The U.S. corn crop is perennially the largest single crop of any kind grown by any country in the world. Since 2005, U.S. corn plantings have averaged over 86 million acres, with the majority of the crop grown in the Corn Belt (Figure A-1). The United States is also the world’s leading consumer (38% of world use) and exporter (60% of global exports) of corn.34 Since 2001, the United States has exported approximately 18% of its corn crop (about 2 billion bushels annually) to other countries. U.S. corn is prized in international markets for its nutritional profile and superior palatability. For example, egg producers in the Middle East value corn over other feedstuffs for its enhanced yellowing of egg yolks which adds value in retail markets.
In addition to its role as the world’s most important feed grain, corn is also processed into a multitude of food and industrial products including starch, sweeteners, corn oil, beverage and
31 Note that USDA data exclude distillers’ dried grains and solubles (DDGS) for lack of official data. However, CRS has used unofficial data sources to incorporate the DDGS feed estimates into the USDA data to produce a more complete estimate. USDA data are from “Table 29—Processed feeds: Quantities fed and feed per grain-consuming animal unit,” Feed Grains Database: Yearbook Tables, ERS, USDA, June 9, 2011. Unofficial DDGS data sources are described in Market Issues and Prospects for U.S. Distillers’ Grains: Supply, Use, and Price Relationships, FDS-10k-01, Linwood Hoffman and Allen Baker, ERS, USDA, December 2010. 32 Calculations by CRS based on data from “Table 30—Indexes of Feed Consuming Animal Units (millions),” Feed Grains Database: Yearbook Tables, ERS, USDA, June 9, 2011. 33 Based on CRS-adjusted USDA processed feed estimates as described in the earlier footnote. 34 WASDE, WAOB, USDA, July 12, 2011.
U.S. Livestock and Poultry Feed Use and Availability: Background and Emerging Issues
Congressional Research Service 18
industrial alcohol, and fuel ethanol. All of these alternate uses compete in the marketplace with livestock and poultry feeders for existing corn supplies. Traditionally most of the U.S. corn crop has been used as the main energy ingredient in livestock feed. However, since 2004 an increasing share of the U.S. corn crop has been consumed by the ethanol industry. In 1999 less than 6% of the U.S. corn crop was used for ethanol production and feed byproducts; this share has grown to over 40% in 2010. In 2011, USDA forecasts that the volume of corn used for ethanol will exceed corn fed to livestock for the first time in history.35 This new demand source has put additional upward pressure on U.S. corn prices in recent years.
Figure A-1. U.S. Hogs and Pigs and Broilers Inventories, Corn and Soybean Production
Source: Livestock inventories are for 2007, corn and soybean data are averages for 2000-04, WAOB, USDA
Feed demand for corn varies seasonally—its use is traditionally highest in the first (September-November) and second (December-February) quarters after harvest when supplies are most plentiful. By March, most pastures and ranges are flush with new growth and cattle ranchers take advantage by shifting some of their animals onto the green forages. During the summer months hay and other roughages are more abundant and compete in feed rations of ruminants. Corn use also varies substantially by region. Surplus corn-producing regions include the Corn Belt, Lake States, and Northern Plains (Figure A-1). All other regions have deficits.
35 WAOB, USDA, WASDE, July 12, 2011.
U.S. Livestock and Poultry Feed Use and Availability: Background and Emerging Issues
Congressional Research Service 19
Sorghum, Barley, and Oats: Declining Importance As Feed Grains
Sorghum, barley, and oats are the three remaining major feed grains although they pale in significance when compared with corn. Grain sorghum and barley have about 95% of the feed value of corn, while oats has about 90% of corn’s feed value. In the past decade sorghum has accounted for about 3% of feed grain use compared with 1% shares for both oats and barley. The tremendous growth in corn yields (and significant improvements in its genetic adaptation to varying agro-climatic settings) relative to other field crops has allowed corn to expand into non-traditional areas at the expense of minor feed grains, wheat, and oilseed crops. As a result, corn’s planted acreage and output has been steadily increasing since the early 1980s, while sorghum, barley, and oats have been on the decline (Figure 11).
Sorghum is a drought- and heat-resistant crop grown primarily in the Central and Southern Plains regions where the climate is often impractical for non-irrigated corn (Figure A-2). Most sorghum is consumed as a feed grain in Southwestern cattle feedlots. Sorghum also rivals corn as a potential ethanol feedstock and is used to produce biofuels in a few ethanol plants located close to sorghum growing regions. The United States is the world’s leading sorghum exporter, shipping about 46% of annual production (or about 188 million bushels), primarily to Japan and Mexico.36
Barley production is concentrated in the Northern Plains (Figure A-2). Its most valued use is as a source of malt for the brewing industry. However, poor barley quality (usually related to growing conditions or excessive harvest-time moisture) and relative feed grain price differentials can lead to substantial barley feeding to cattle and sheep.
Oats production (and its use for feed) in the United States has declined steadily since the 1950s for a variety of reasons including its lower feed value and price relative to other feed grains. Since the mid-1980s the United States has become the world’s largest importer of oats, primarily for use as horse feed. During the past decade, the United States has imported nearly 48% (or about 98 million bushels) of its annual oats consumption.
Feed Wheat: Varies with Quality and Market Conditions
Wheat is generally grown as a food crop, but may also be used as a livestock feed since its feed value is comparable to that of corn. Wheat’s traditionally higher price relative to corn is a major factor in determining the extent to which wheat is used as a livestock feed. However, weather-related damage to wheat, particularly excessive moisture at harvest time, can render the grain unsuitable for milling uses and leave feeding as the only option. During the past decade, about 7% of the annual U.S. wheat crop has been fed to livestock.37 However, wheat feeding can vary substantially from year to year depending on crop size and its price relative to corn. For example, in 1990 about 20% of the crop was fed to livestock, while in 2007 less than 1% was used as feed. In general, supply tightness of traditional feed grains (whether from drought or heavy export demand) or abundant wheat supplies can price wheat into greater feed use.
Wheat feeding is most common in corn-deficit areas such as the Southern Plains, where little corn and much hard red winter wheat are grown (Figure A-2). As a result, beef cattle on Southwestern
36 Foreign Agricultural Service (FAS), USDA, Grain: World Markets and Trade, June 2011. 37 FAS, USDA, Production, Supply and Distribution Online, July 12, 2011, at http://www.fas.usda.gov/psdonline/.
U.S. Livestock and Poultry Feed Use and Availability: Background and Emerging Issues
Congressional Research Service 20
feedlots have been the traditional consumers of feed wheat, although poultry in Southeastern operations are also occasionally fed wheat.
Figure A-2. Winter Wheat, Sorghum, and Barley Production, and U.S. Drought Monitor
Source: Wheat, sorghum, and barley production data are averages for 2000-04, WAOB, USDA.
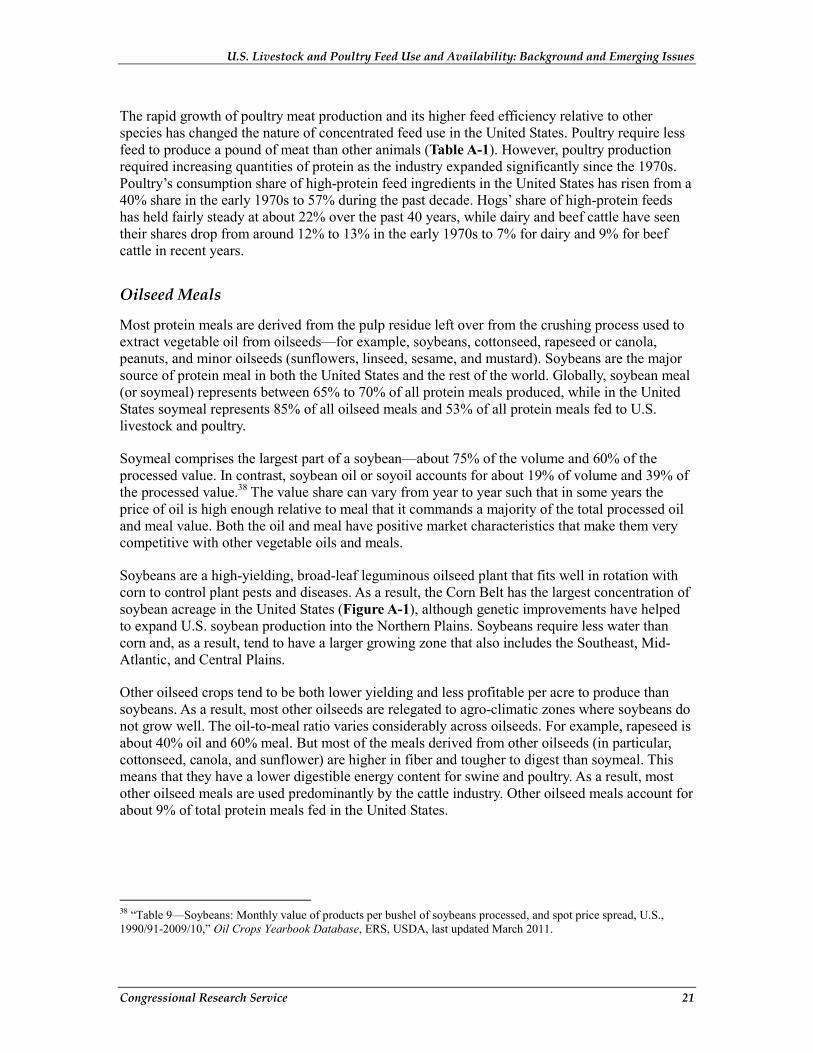
Protein Meals
Protein supplements are needed to correct the protein deficiencies of an all-grain diet. However, protein meals are usually more expensive than feed grains. Most protein concentrates used in the United States are oilseed meals (61% share)—derived from the pulp residue left over from the crushing process used to extract vegetable oil from oilseeds, for example, soybeans, cottonseed, rapeseed or canola, peanuts, and minor oilseeds (sunflowers, linseed, sesame, and mustard). Additional protein meals are obtained from byproducts from processing grains (34% share including DGS), animals (4%), and marine species (< 1%).
Soybeans are the major source of protein meal in both the United States and the rest of the world. Globally, soybean meal (or soymeal) represents between 65% to 70% of all protein meals produced, while in the United States soymeal represents 85% of all oilseed meals and 53% of all protein meals fed to U.S. livestock and poultry.
U.S. Livestock and Poultry Feed Use and Availability: Background and Emerging Issues
Congressional Research Service 21
The rapid growth of poultry meat production and its higher feed efficiency relative to other species has changed the nature of concentrated feed use in the United States. Poultry require less feed to produce a pound of meat than other animals (Table A-1). However, poultry production required increasing quantities of protein as the industry expanded significantly since the 1970s. Poultry’s consumption share of high-protein feed ingredients in the United States has risen from a 40% share in the early 1970s to 57% during the past decade. Hogs’ share of high-protein feeds has held fairly steady at about 22% over the past 40 years, while dairy and beef cattle have seen their shares drop from around 12% to 13% in the early 1970s to 7% for dairy and 9% for beef cattle in recent years.
Oilseed Meals
Most protein meals are derived from the pulp residue left over from the crushing process used to extract vegetable oil from oilseeds—for example, soybeans, cottonseed, rapeseed or canola, peanuts, and minor oilseeds (sunflowers, linseed, sesame, and mustard). Soybeans are the major source of protein meal in both the United States and the rest of the world. Globally, soybean meal (or soymeal) represents between 65% to 70% of all protein meals produced, while in the United States soymeal represents 85% of all oilseed meals and 53% of all protein meals fed to U.S. livestock and poultry.
Soymeal comprises the largest part of a soybean—about 75% of the volume and 60% of the processed value. In contrast, soybean oil or soyoil accounts for about 19% of volume and 39% of the processed value.38 The value share can vary from year to year such that in some years the price of oil is high enough relative to meal that it commands a majority of the total processed oil and meal value. Both the oil and meal have positive market characteristics that make them very competitive with other vegetable oils and meals.
Soybeans are a high-yielding, broad-leaf leguminous oilseed plant that fits well in rotation with corn to control plant pests and diseases. As a result, the Corn Belt has the largest concentration of soybean acreage in the United States (Figure A-1), although genetic improvements have helped to expand U.S. soybean production into the Northern Plains. Soybeans require less water than corn and, as a result, tend to have a larger growing zone that also includes the Southeast, Mid-Atlantic, and Central Plains.
Other oilseed crops tend to be both lower yielding and less profitable per acre to produce than soybeans. As a result, most other oilseeds are relegated to agro-climatic zones where soybeans do not grow well. The oil-to-meal ratio varies considerably across oilseeds. For example, rapeseed is about 40% oil and 60% meal. But most of the meals derived from other oilseeds (in particular, cottonseed, canola, and sunflower) are higher in fiber and tougher to digest than soymeal. This means that they have a lower digestible energy content for swine and poultry. As a result, most other oilseed meals are used predominantly by the cattle industry. Other oilseed meals account for about 9% of total protein meals fed in the United States.
38 “Table 9—Soybeans: Monthly value of products per bushel of soybeans processed, and spot price spread, U.S., 1990/91-2009/10,” Oil Crops Yearbook Database, ERS, USDA, last updated March 2011.
U.S. Livestock and Poultry Feed Use and Availability: Background and Emerging Issues
Congressional Research Service 22
Animal Meals
Many feeds make use of the byproducts generated in the meat, poultry, milk, and fish processing industries. Organic materials that would otherwise go to waste can be rendered into valuable, high-quality protein products that are useful as supplements to other energy and protein concentrates to achieve a balance of essential vitamins and amino acids.
Meatpacking byproducts include meat, bones, blood, and animal fat which can be used to produce meat and bone meal and blood meal. Their use represents about 4% of total protein meal use in the United States. However, stringent feed-use restrictions related to potential transmission of bovine spongiform encephalopathy (BSE) have been placed on certain animal byproducts which limit both their current marketability and their growth potential.39
Roughages
Roughage (i.e., cellulose-based) feedstuffs are vegetative plants that are bulky, high in crude fiber, and low in digestible nutrients. The major groups of roughage include pasture and range plants, hays, and silages. Dry roughage is obtained from cutting and harvesting hay (i.e., legumes, grasses, or grain crops cut at an early growth stage to maximize nutrient yield) grown on rotated cropland or pasture. Green forages include silage which is a type of forage (often based on chopped hay or grain crops) that is fermented in a silo, or grazing the crops (i.e., wheat and rye), grasses, or wild plants on cultivated pasture or rangeland. An advantage of silage is that it preserves a succulent forage for winter feeding.
Roughages are most suitable for use by ruminants—for example, cattle, sheep, and goats—which have micro-organisms in their digestive tracts that secrete enzymes which break down the cellulose in plant fiber. Ruminants actually require a high level of fiber in their diets to maintain a rumen environment favorable for the synthesis of nutrients. Insufficient fiber in a ruminant’s diet can lead to acute digestive disorders. Roughages supply as much as 55% to 60% of the annual feed consumption by dairy and beef cows and sheep; however, roughages do not fully replace feed grains and protein meals in a commercial feeding operation because they cannot supply the high levels of net energy and protein needed to produce rapid weight gains and high milk yields.
Since 2001, dairy cows have consumed about 18% of U.S. roughage production, while beef cattle operations account for about 70% of all roughage in the United States.40
Corn and sorghum are the most important silage crops because they have the highest per-acre yields of digestible nutrients. However, when corn and sorghum are used for silage, the entire plant—stalk, leaves, and grain—is harvested, chopped, and often mixed with other silage. Most silage is produced and used on-farm. Marketing silage is uncommon because it is costly to transport and loses its quality quickly once removed from the silo.
39 For more information see CRS Report RL32199, Bovine Spongiform Encephalopathy (BSE, or “Mad Cow Disease”): Current and Proposed Safeguards. 40 ERS, USDA, “Table 30—Indexes of feed consuming animal units,” Feed Grains Database: Yearbook Tables, June 9, 2011.
U.S. Livestock and Poultry Feed Use and Availability: Background and Emerging Issues
Congressional Research Service 23
Pasture and Range Flexibility
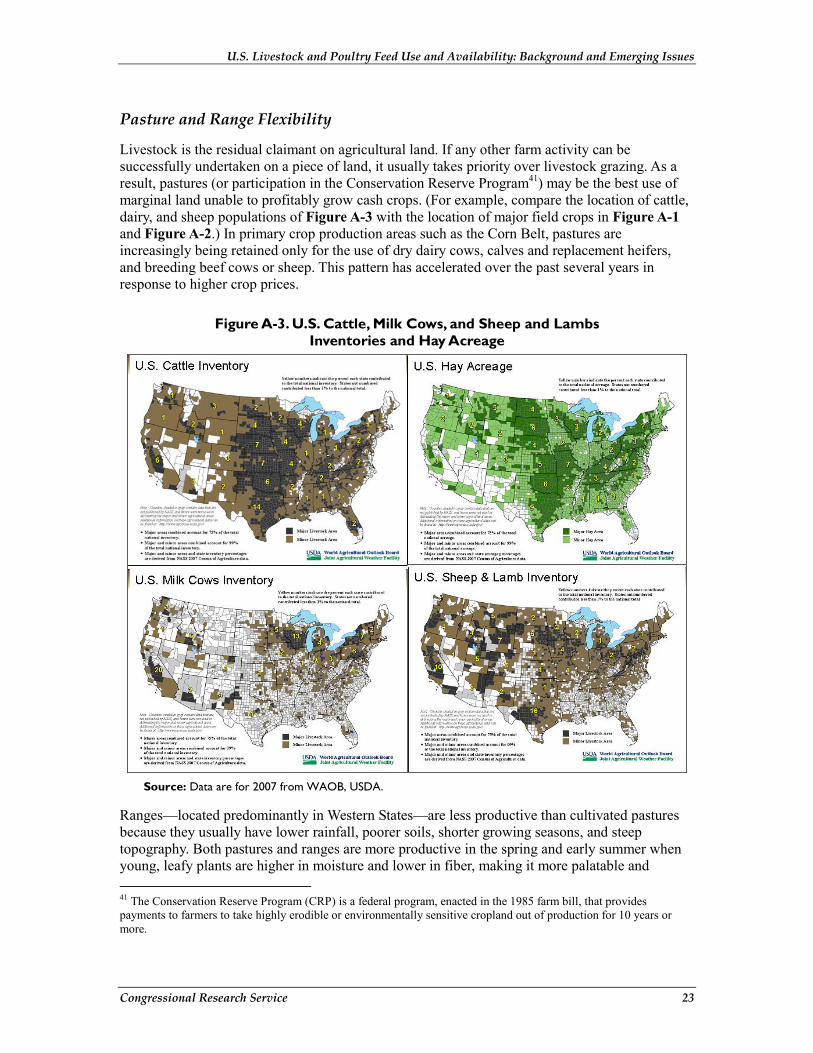
Livestock is the residual claimant on agricultural land. If any other farm activity can be successfully undertaken on a piece of land, it usually takes priority over livestock grazing. As a result, pastures (or participation in the Conservation Reserve Program41) may be the best use of marginal land unable to profitably grow cash crops. (For example, compare the location of cattle, dairy, and sheep populations of Figure A-3 with the location of major field crops in Figure A-1 and Figure A-2.) In primary crop production areas such as the Corn Belt, pastures are increasingly being retained only for the use of dry dairy cows, calves and replacement heifers, and breeding beef cows or sheep. This pattern has accelerated over the past several years in response to higher crop prices.
Figure A-3. U.S. Cattle, Milk Cows, and Sheep and Lambs Inventories and Hay Acreage
Source: Data are for 2007 from WAOB, USDA.
Ranges—located predominantly in Western States—are less productive than cultivated pastures because they usually have lower rainfall, poorer soils, shorter growing seasons, and steep topography. Both pastures and ranges are more productive in the spring and early summer when young, leafy plants are higher in moisture and lower in fiber, making it more palatable and 41 The Conservation Reserve Program (CRP) is a federal program, enacted in the 1985 farm bill, that provides payments to farmers to take highly erodible or environmentally sensitive cropland out of production for 10 years or more.
U.S. Livestock and Poultry Feed Use and Availability: Background and Emerging Issues
Congressional Research Service 24
digestible to livestock than later summer stages when it is coarser and stemmier. The period of pasture and range fertility is closely linked to weather conditions and can be extended into the summer or curtailed in early spring based on rainfall patterns.
Having access to good quality pasture, rangeland, or small grain crops for grazing provides substantial flexibility for ranchers to reduce their costs by purchasing fewer commercial feed concentrates, while minimizing their operating expenses for growing, harvesting, feeding, and storing grains or silage. When feed grain prices increase, many producers will graze cattle longer before placing them into feedlots at heavier weights to save on finishing costs, provided that there is sufficient forage. The ongoing drought in the Southern Plains and Southeast has severely limited grazing opportunities for cattlemen.
Using Feed Grains Feed grains may be purchased commercially or produced and used directly on the farm.
Commercial Feeds
Commercial feed concentrates offer the advantage of ready-to-eat form and precise nutrient composition, but are generally more expensive than home-grown feeds. Different milling procedures are used to prepare feed grains for animal consumption. Grinding the grain reduces the animal’s expenditure of energy in chewing and exposes a greater surface for improved digestion. The desired fineness of the grind depends on the type of livestock and other components being blended in the ration. Cracking grain is sufficient for cattle; fine grinds are better for poultry. Grinding also assists in handling and pelleting (compressing into pellets), but adds cost to every bushel of grain.
On-Farm Feeding
Farmers that produce both livestock and feedstuffs (whether grains, hay, or silage), will normally feed with their own-farm-produced feedstuffs before turning to commercial feed grain markets. Substantial on-farm feeding of own-produced feedstuffs occurs throughout the Corn Belt, Lake States, and Northern Plains where surplus production of feedstuffs exists. In feed-deficit regions, commercial feed markets and feed-pasture decisions tend to play a much larger role.
The amount of on-farm feeding from own-production can also be influenced by the quality of the crop. When late planting delays crop maturity, or an early frost or substantial harvest-time rain occurs, farmers may be confronted with the choice of expensive crop drying or on-farm storage of high-moisture (20% to 30% moisture) grain. Under proper storage conditions, high-moisture grain is a high-valued feed. However, because of its high-moisture content, it is not readily marketed off the farm due to rapid spoilage. As a result, a commitment to store on-farm high-moisture grain is also a commitment to feed it on farm rather than sell it in commercial markets.
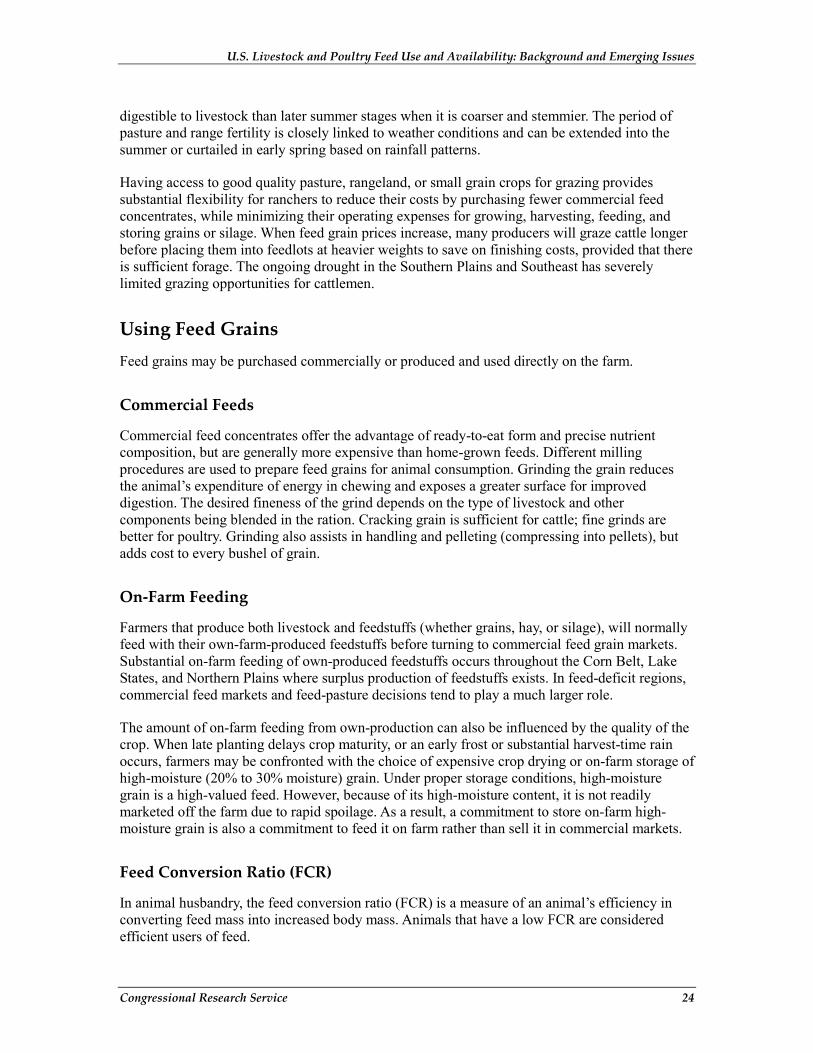
Feed Conversion Ratio (FCR)
In animal husbandry, the feed conversion ratio (FCR) is a measure of an animal’s efficiency in converting feed mass into increased body mass. Animals that have a low FCR are considered efficient users of feed.
U.S. Livestock and Poultry Feed Use and Availability: Background and Emerging Issues
Congressional Research Service 25
Table A-1. Feed Conversion Ratio (FCR) for Major Livestock and Bird Species FCR is the ratio, by weight, of feed needed to produce one pound of meat
Species Feed Conversion Ratio
Cattle 6
Sheep 5 to 6
Lambs 3 to 4
Hogs 3 to 3.2
Broilers 2
Turkey 2
Source: Compiled by CRS from various sources.
Notes: The actual FCR will vary widely based on the quality of feedstuffs, climate (extreme temperatures may require more calories for maintenance), animal activity, and other conditions.
Grain Milling Byproducts Feed grain byproducts originate primarily from milling grains and include corn, wheat, and rice mill feeds and a variety of miscellaneous feed byproducts such as hominy feed, oat mill feeds, and screenings. This group of other feed grain byproducts is fairly small, but not insignificant, accounting for about 4% total feed concentrates.
Corn milling byproducts have grown in importance with the rapid growth of the corn-based U.S. ethanol industry. Two primary corn milling processes, wet and dry milling, are used to produce fuel ethanol. Both processes also produce several categories of important byproducts that are attractive animal feed alternatives, particularly as both energy and protein concentrates.
Corn wet-milling is designed to extract starch, high-fructose corn syrup (HFCS), glucose and dextrose, and ethanol from corn. Wet-milling byproducts include corn gluten feed (CGF) and corn gluten meal (CGM).42 Corn dry-milling is used to produce distilled liquor and ethanol (fuel alcohol). Dry-milling byproducts include distillers grains and solubles (DGS).43
Distillers Grains and Solubles (DGS)
Since mid-2005 all new corn milling plants built in the United States have been corn dry milling plants such that dry milling production of ethanol and its byproducts now dominates the U.S. ethanol industry. As a result, production of distillers grains and solubles (DGS)—the major co-product of the corn-starch ethanol industry—has expanded very rapidly in the last six years with the explosive growth in corn processing for ethanol (Figure 5), rising from about 1 million metric tons (mmt) in the 1999/2000 corn marketing year (Sept. -Aug.) to 33.2 mmt in 2010/2011. 42 A 56-pound bushel of corn yields about 12.5 pounds of CGF and 2.5 pounds of CGM. Linwood Hoffman and Allen Baker, Market Issues and Prospects for U.S. Distillers’ Grains: Supply, Use, and Price Relationships, FDS-10k-01, ERS, USDA, December 2010. 43 A bushel of corn processed into ethanol by dry mills produces approximately 17.5 pounds of DGS, along with carbon dioxide, and 2.7 gallons of ethanol. Robert Wisner, “Distillers’ Grain Price Relationships and Export Developments,” AgMRC Renewable Energy and Climate Newsletter, Agricultural Marketing Resource Center (AgMRC), December 2010; at http://www.agmrc.org/.
U.S. Livestock and Poultry Feed Use and Availability: Background and Emerging Issues
Congressional Research Service 26
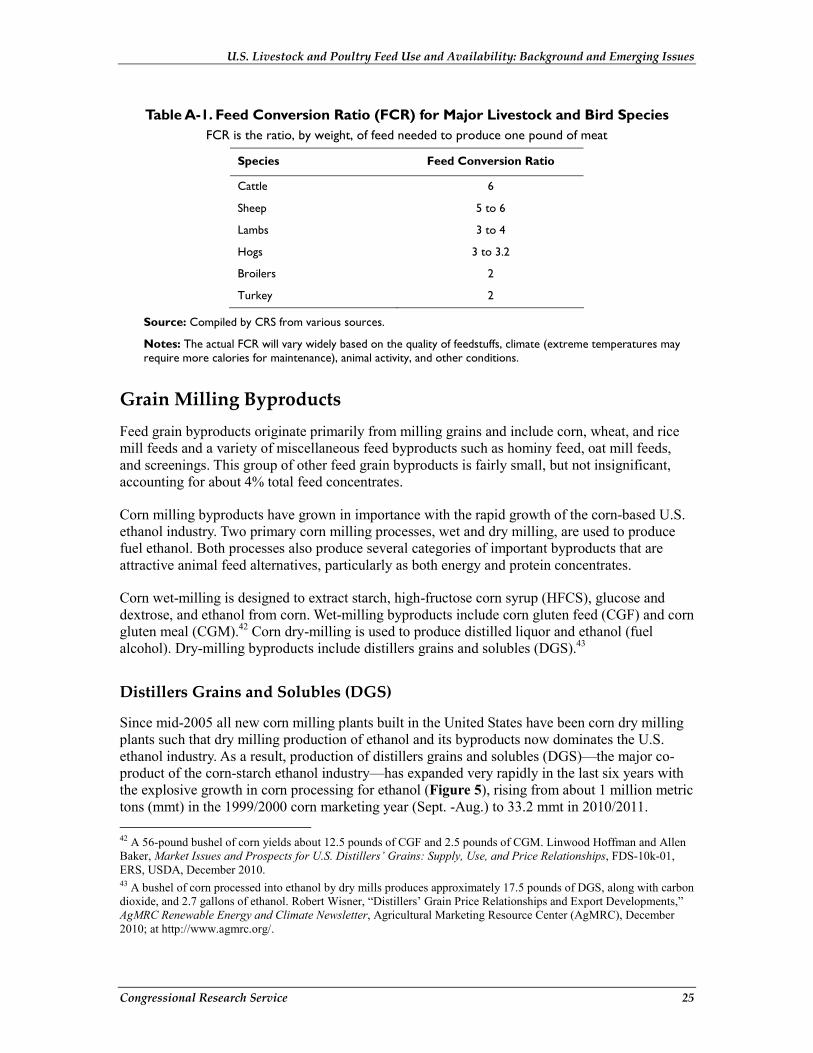
DGS is a valuable feed alternative. DGS is a medium-protein (approximately 30% protein content) feed ingredient that replaces corn, soybean meal, and other sources of phosphorus and calcium. In addition, its percentages of fiber, protein, oil, and other nutrients are concentrated to almost three times the percentages found in corn. Initially, the U.S. livestock and poultry industry was slow to adopt DGS into feed rations and instead required a time lag in order to develop systems for efficiently transporting, handling, and feeding this product.44 However, feeding of DGS is now widespread in the United States, especially in the beef cattle and dairy industries. When DGS is sold to distant domestic feed markets or for export, it must first incur a drying cost and then is sold as dried distillers’ grains and solubles (DDGS). In the last few years, DDGS exports have grown rapidly as foreign livestock and poultry producers became familiar with its potential cost savings and ways of effectively using it as a replacement for corn and soymeal.
Where ethanol plants are located close to feedlots, a portion of the DGS output typically is sold as wet or partially-dried DGS, and is moved directly to cattle feedlots. Wet and partially dried distillers grains have limited storage life, since they contain 70%-75% and 50%-55% moisture, respectively. As a result, wet DGS is sold at a discount to costlier DDGS giving a cost advantage to livestock feeders located within close proximity of a dry-mill ethanol plant (Figure A-4).
Figure A-4. Comparison of U.S. Ethanol Plant Locations with U.S. Corn Production
Source: NASS, USDA.
DDGS is best suited for feeding to ruminant animals (e.g., cattle, sheep, goats). The digestive system of these animals allows them to convert DGS fiber into energy while at the same time
44 Ibid.
U.S. Livestock and Poultry Feed Use and Availability: Background and Emerging Issues
Congressional Research Service 27
using the protein and other nutrients. Use of DDGS in hog and poultry rations is somewhat more limited, in part because of its fiber content. When DDGS is fed to these species, supplementation of some amino acids also is needed. Pork producers report that feeding high levels of DDGS during the feeding period can cause soft bellies that in turn cause problems in bacon production.
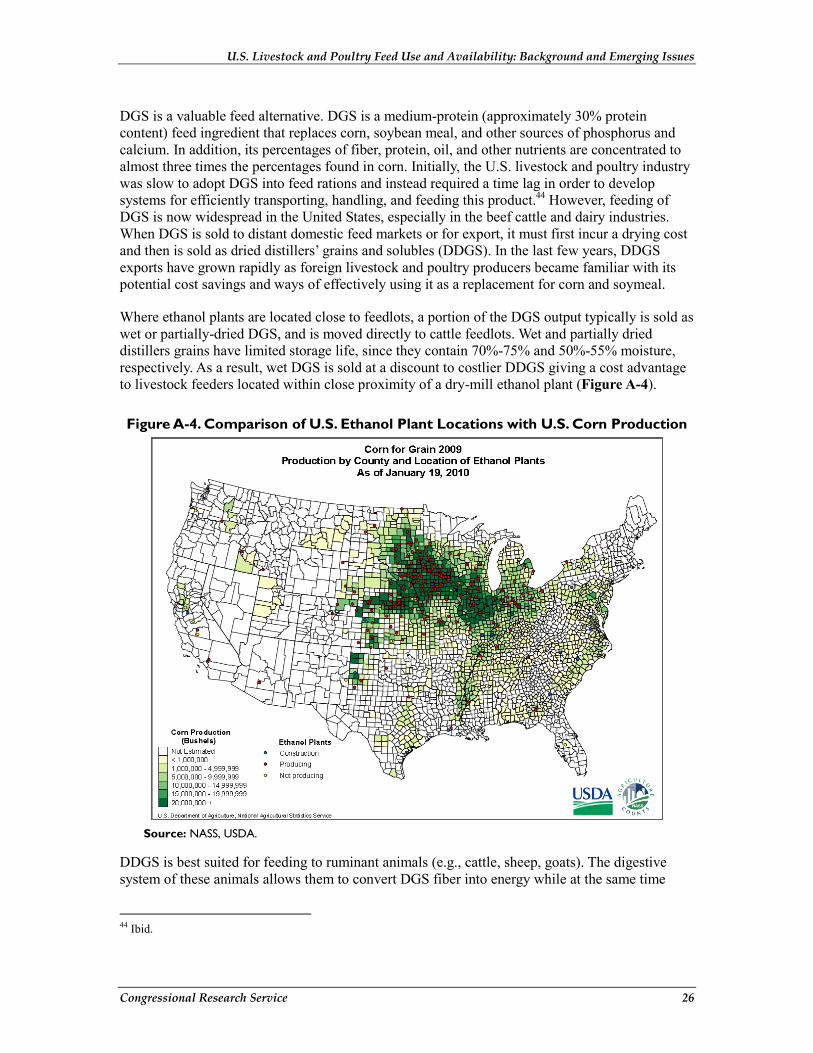
Recommended maximum DDGS percentages of the ration for swine and poultry are considerably lower than for cattle because of differences in their digestive systems (Table A-2). As a result, beef cattle are the largest market for DDGS by a considerable margin, followed by its use for dairy cows, hogs, and poultry in that order. Replacement ratios in substituting DDGS for corn and soybean meal also vary with the species of animal or bird being fed.
Table A-2. Recommended DGS Usage Rates in Livestock and Poultry Rations
One pound of DGS replacesb
Species Share of Rationa Corn Soymeal
Beef Cattle over 50% 1.1 lbs. —c
Dairy Cows up to 40% 0.6 lbs. 0.6 lbs.
Hogs 10% to 15% 0.8 lbs. 0.2 lbs.
Poultry 4% to 7% 0.6 lbs. 0.6 lbs.
Sources:
a. Ration-share estimates are compiled by CRS from various sources; however, it is noteworthy that there does not yet appear to be any consensus on the exact ranges of DDGS inclusion in rations for the various animal and bird species.
b. Feed-replacement estimates are from Robert Wisner, “Distillers’ Grain Price Relationships and Export Developments,” AgMRC Renewable Energy and Climate Newsletter, AgMRC, December 2010.
c. Very little soymeal is used in typical U.S. beef cattle feeding programs.
Author Contact Information Randy Schnepf Specialist in Agricultural Policy [email protected], 7-4277