Embed Size (px)
Citation preview
U.S. Renewables Portfolio Standards 2017 Annual Status Report
Galen BarboseLawrence Berkeley National Laboratory
July 2017
Download at: rps.lbl.gov
This work was funded by the Office of Electricity Delivery and Energy Reliability (Transmission Permitting & Technical Assistance Division) of the U.S. Department of Energy under Contract No. DE-AC02-05CH11231.
Acronyms
ACP: Alternative compliance paymentDG: Distributed generationEIA: Energy Information AdministrationGW: GigawattGWh: Gigawatt-hourIOU: Investor-owned utilityLSE: Load-serving entityMSW: Municipal solid wasteMW: MegawattMWh: Megawatt-hourNEPOOL: New England Power PoolPPA: Power purchase agreementPUC: Public utilities commissionRE: Renewable electricityREC: Renewable electricity certificate
RPS: Renewables portfolio standardSACP: Solar alternative compliance paymentSREC: Solar renewable electricity certificateTWh: Terawatt-hour
2
Highlights
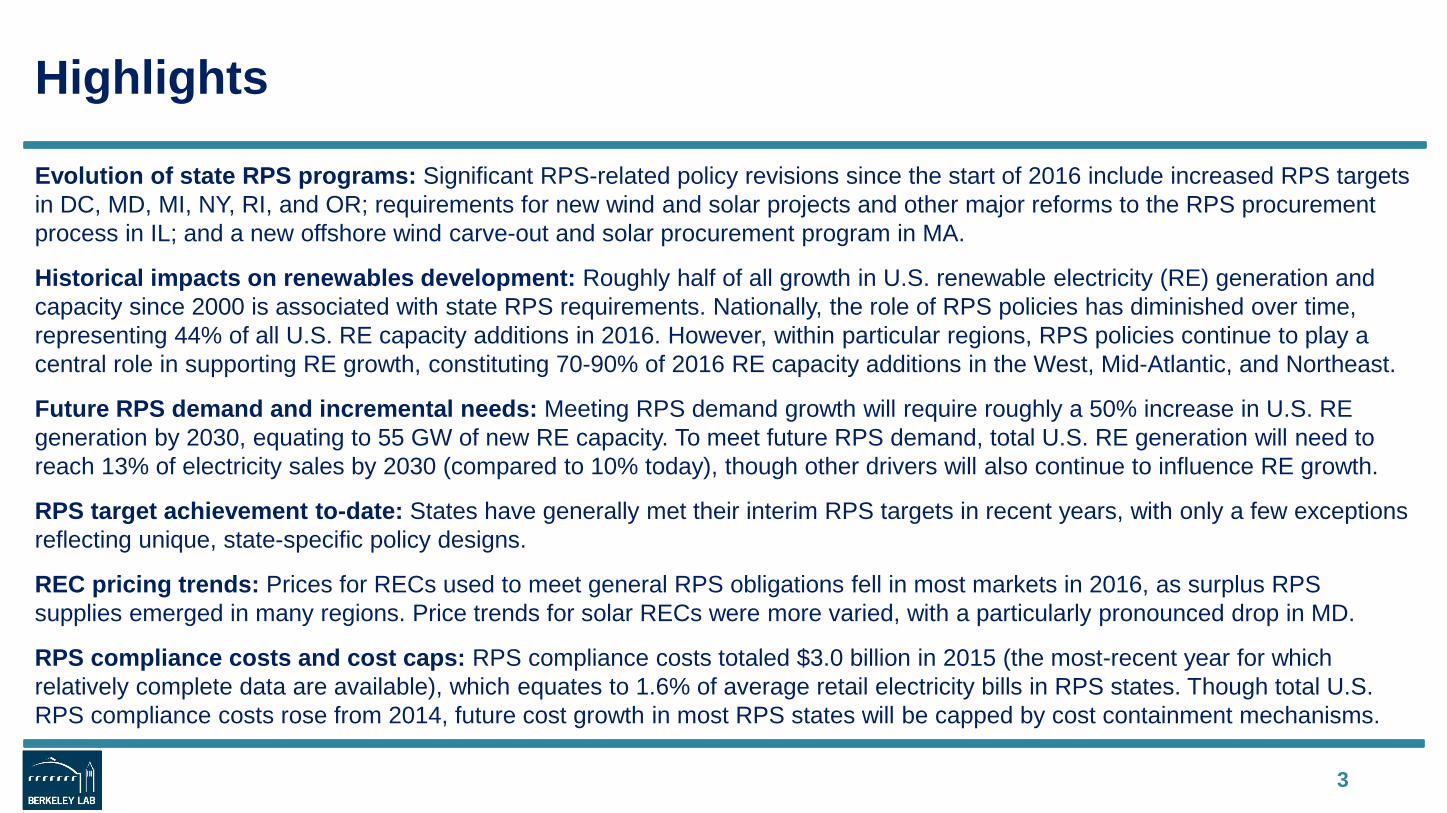
Evolution of state RPS programs: Significant RPS-related policy revisions since the start of 2016 include increased RPS targets in DC, MD, MI, NY, RI, and OR; requirements for new wind and solar projects and other major reforms to the RPS procurement process in IL; and a new offshore wind carve-out and solar procurement program in MA.
Historical impacts on renewables development: Roughly half of all growth in U.S. renewable electricity (RE) generation and capacity since 2000 is associated with state RPS requirements. Nationally, the role of RPS policies has diminished over time, representing 44% of all U.S. RE capacity additions in 2016. However, within particular regions, RPS policies continue to play a central role in supporting RE growth, constituting 70-90% of 2016 RE capacity additions in the West, Mid-Atlantic, and Northeast.
Future RPS demand and incremental needs: Meeting RPS demand growth will require roughly a 50% increase in U.S. RE generation by 2030, equating to 55 GW of new RE capacity. To meet future RPS demand, total U.S. RE generation will need to reach 13% of electricity sales by 2030 (compared to 10% today), though other drivers will also continue to influence RE growth.
RPS target achievement to-date: States have generally met their interim RPS targets in recent years, with only a few exceptions reflecting unique, state-specific policy designs.
REC pricing trends: Prices for RECs used to meet general RPS obligations fell in most markets in 2016, as surplus RPS supplies emerged in many regions. Price trends for solar RECs were more varied, with a particularly pronounced drop in MD.
RPS compliance costs and cost caps: RPS compliance costs totaled $3.0 billion in 2015 (the most-recent year for which relatively complete data are available), which equates to 1.6% of average retail electricity bills in RPS states. Though total U.S. RPS compliance costs rose from 2014, future cost growth in most RPS states will be capped by cost containment mechanisms.
3
Table of Contents
• Evolution of state RPS programs• Historical impacts on renewables development• Future RPS demand and incremental needs• RPS target achievement to-date • REC pricing trends• RPS compliance costs and cost caps• Outlook
4
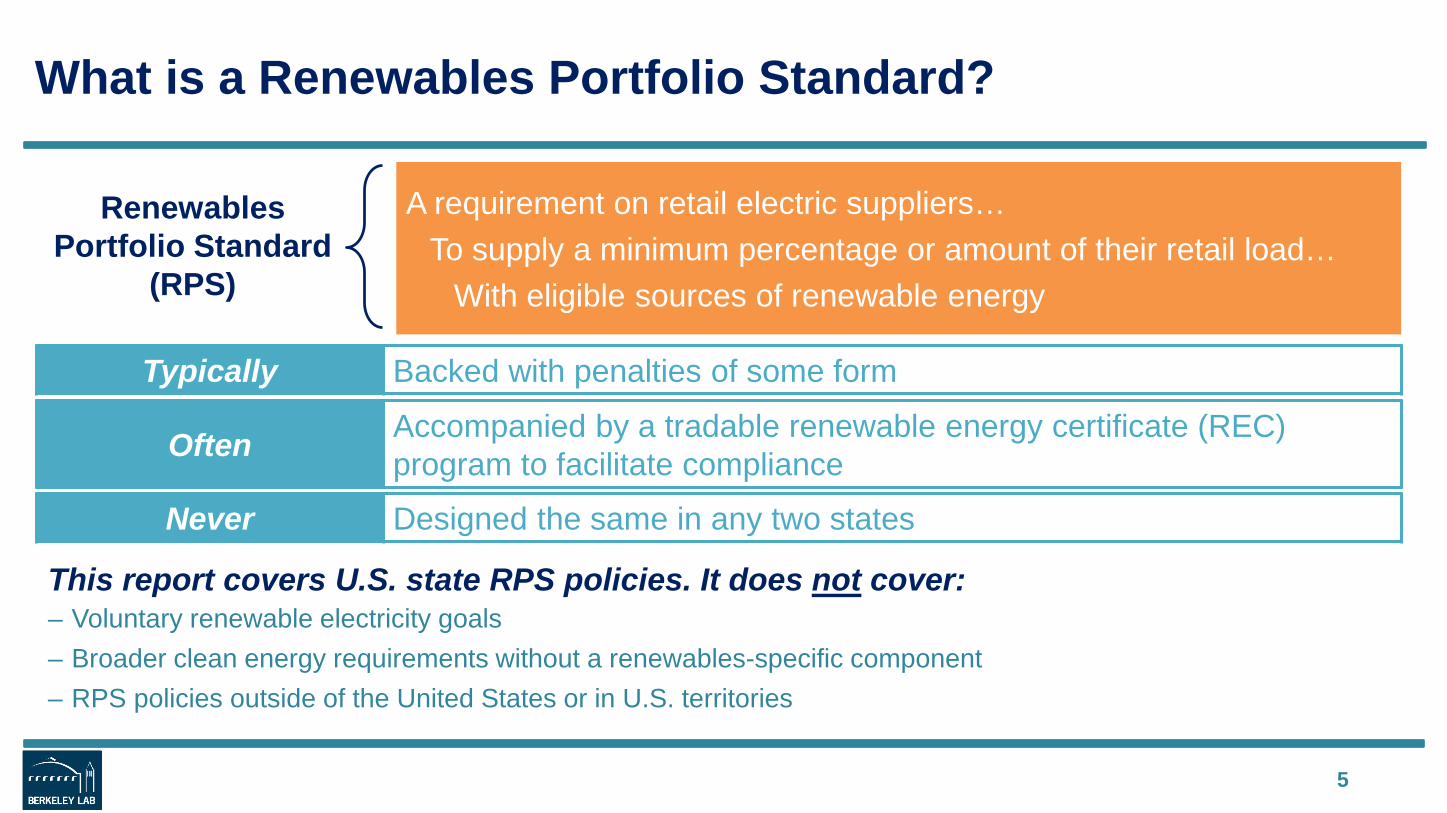
What is a Renewables Portfolio Standard?
5
Renewables Portfolio Standard
(RPS)
A requirement on retail electric suppliers…To supply a minimum percentage or amount of their retail load…
With eligible sources of renewable energy
This report covers U.S. state RPS policies. It does not cover:– Voluntary renewable electricity goals– Broader clean energy requirements without a renewables-specific component– RPS policies outside of the United States or in U.S. territories
Typically Backed with penalties of some form
Often Accompanied by a tradable renewable energy certificate (REC) program to facilitate compliance
Never Designed the same in any two states
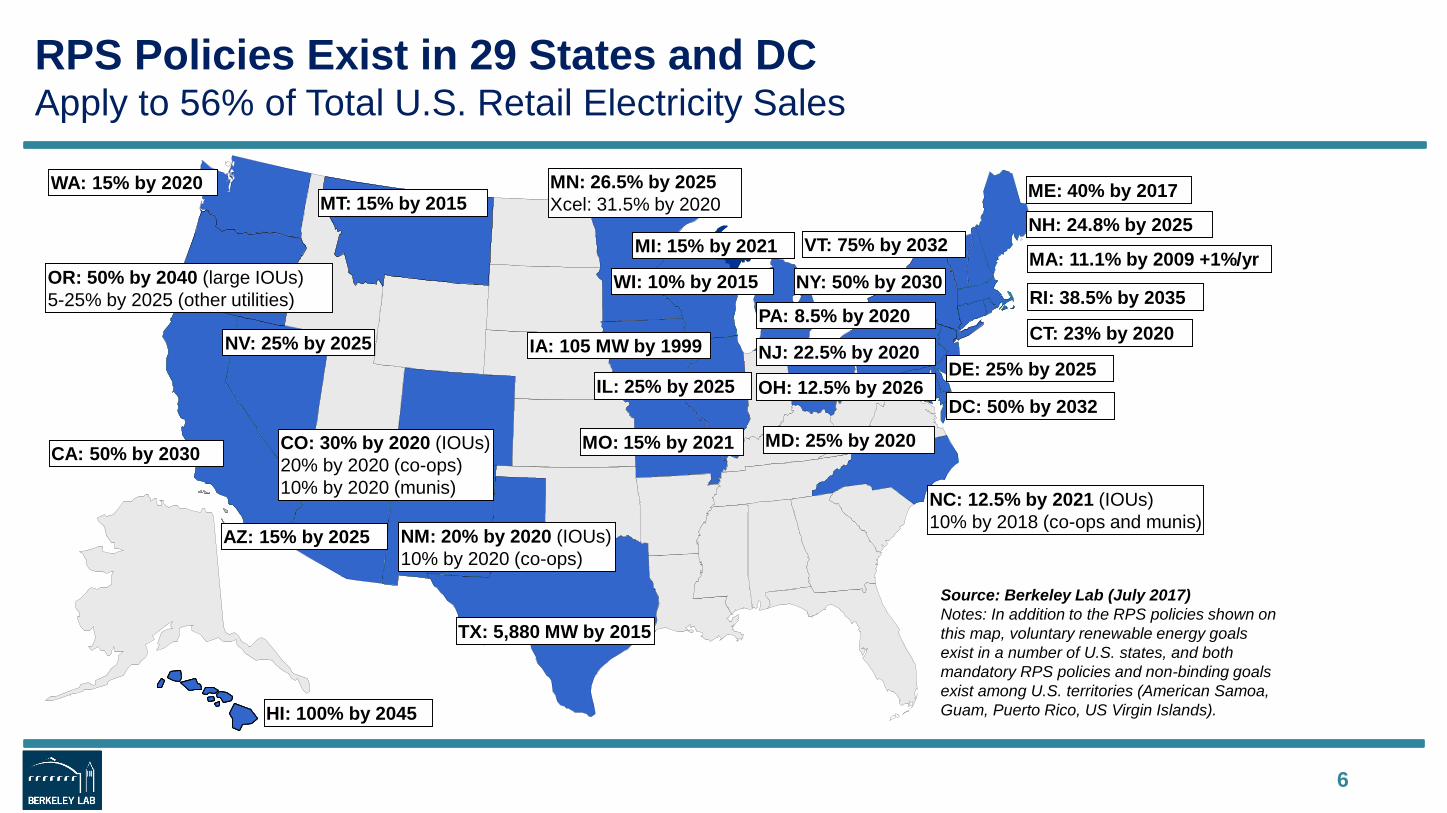
RPS Policies Exist in 29 States and DCApply to 56% of Total U.S. Retail Electricity Sales
6
Source: Berkeley Lab (July 2017)Notes: In addition to the RPS policies shown on this map, voluntary renewable energy goals exist in a number of U.S. states, and both mandatory RPS policies and non-binding goals exist among U.S. territories (American Samoa, Guam, Puerto Rico, US Virgin Islands).
WI: 10% by 2015
NV: 25% by 2025
TX: 5,880 MW by 2015
PA: 8.5% by 2020
NJ: 22.5% by 2020CT: 23% by 2020
MA: 11.1% by 2009 +1%/yr
ME: 40% by 2017
NM: 20% by 2020 (IOUs)10% by 2020 (co-ops)
CA: 50% by 2030
MN: 26.5% by 2025Xcel: 31.5% by 2020
IA: 105 MW by 1999
MD: 25% by 2020
RI: 38.5% by 2035
HI: 100% by 2045
AZ: 15% by 2025
NY: 50% by 2030
CO: 30% by 2020 (IOUs)20% by 2020 (co-ops)10% by 2020 (munis)
MT: 15% by 2015
DE: 25% by 2025
DC: 50% by 2032
WA: 15% by 2020
NH: 24.8% by 2025
OR: 50% by 2040 (large IOUs)5-25% by 2025 (other utilities)
NC: 12.5% by 2021 (IOUs)10% by 2018 (co-ops and munis)
IL: 25% by 2025
VT: 75% by 2032
MO: 15% by 2021
OH: 12.5% by 2026
MI: 15% by 2021
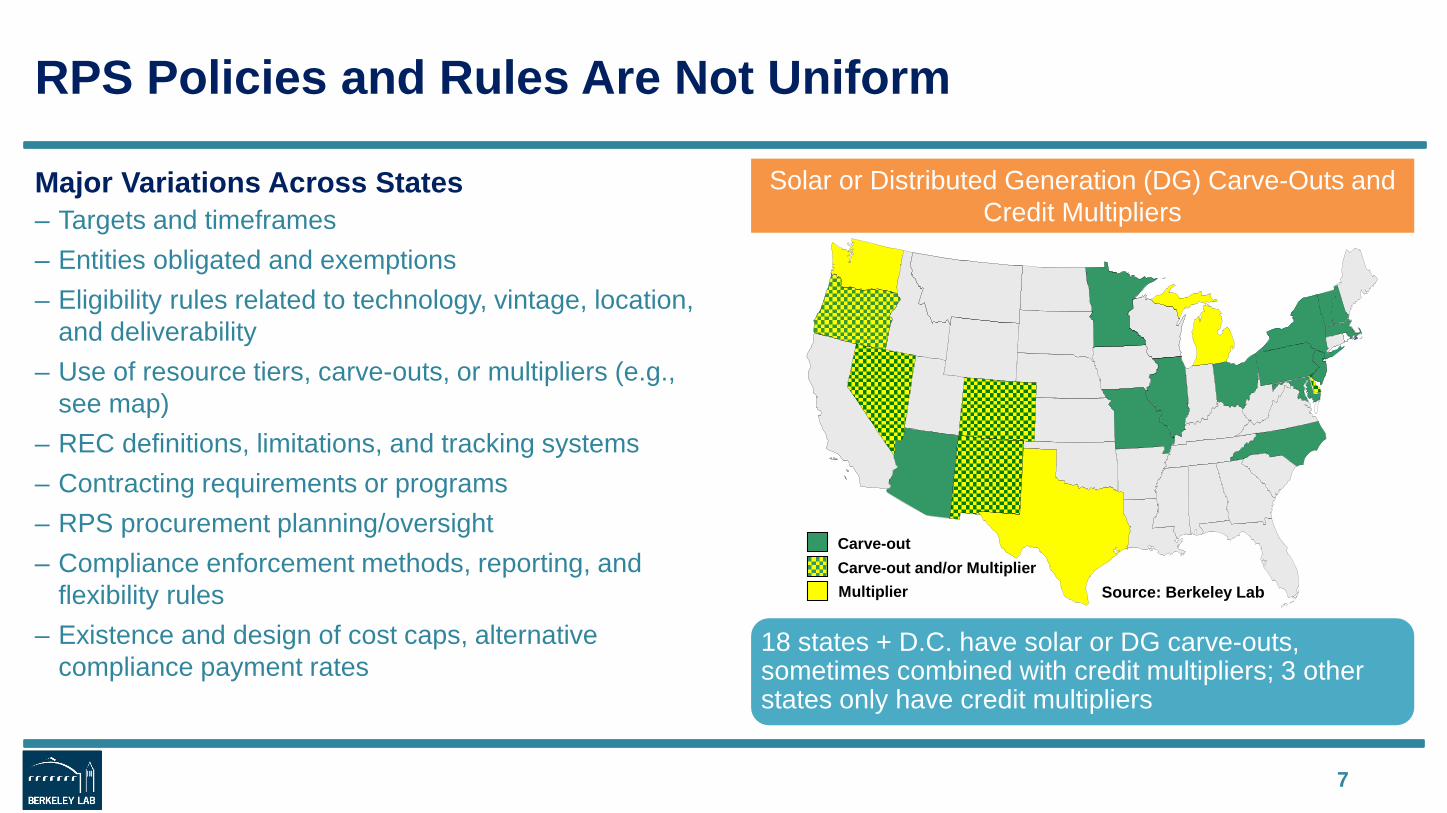
RPS Policies and Rules Are Not Uniform
Major Variations Across States– Targets and timeframes– Entities obligated and exemptions– Eligibility rules related to technology, vintage, location,
and deliverability– Use of resource tiers, carve-outs, or multipliers (e.g.,
see map)– REC definitions, limitations, and tracking systems– Contracting requirements or programs– RPS procurement planning/oversight– Compliance enforcement methods, reporting, and
flexibility rules– Existence and design of cost caps, alternative
compliance payment rates
7
Solar or Distributed Generation (DG) Carve-Outs and Credit Multipliers
18 states + D.C. have solar or DG carve-outs, sometimes combined with credit multipliers; 3 other states only have credit multipliers
Source: Berkeley Lab
Carve-out
MultiplierCarve-out and/or Multiplier
COHI IL
MA CT MD DC NH MIME PA NJ NY DE NC MO
IA MN AZ NV WI TX NM CA RI MT WA OR OH KS VT
1983 1991 1994 1996 1997 1998 1999 2000 2001 2002 2003 2004 2005 2006 2007 2008 2009 2010 2011 2012 2013 2014 2015 2016 2017IA MN AZ MN NM CT NJ CT AZ CA DC HI CO CA MA CO IL CA DC MA
WI NV MN NM CO CA CO DE IL DE CT MD CT MA CT IL MDNV PA NV CT CT HI ME IL DC NJ MD OH HI MA
TX HI DE MA MN MA DE NH MN OR KS MINJ MD MD NV MD IL NM MT WI VT NYWI ME NJ OR NJ MA NY NM OR
MN RI NY MD OH NV RINJ NCNM WIPATX
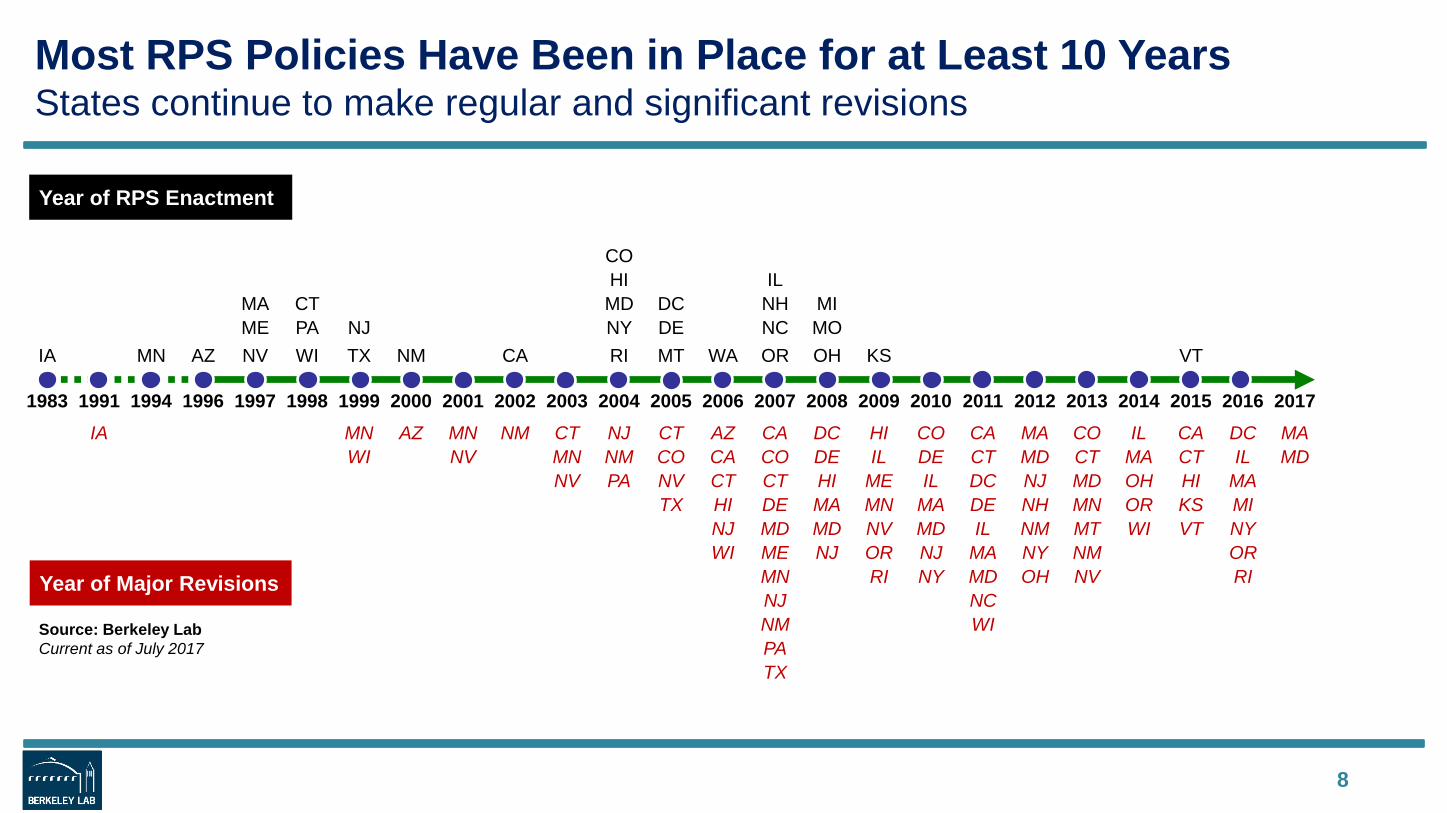
Most RPS Policies Have Been in Place for at Least 10 YearsStates continue to make regular and significant revisions
8
Source: Berkeley LabCurrent as of July 2017
Year of RPS Enactment
Year of Major Revisions
General Trends in RPS Revisions
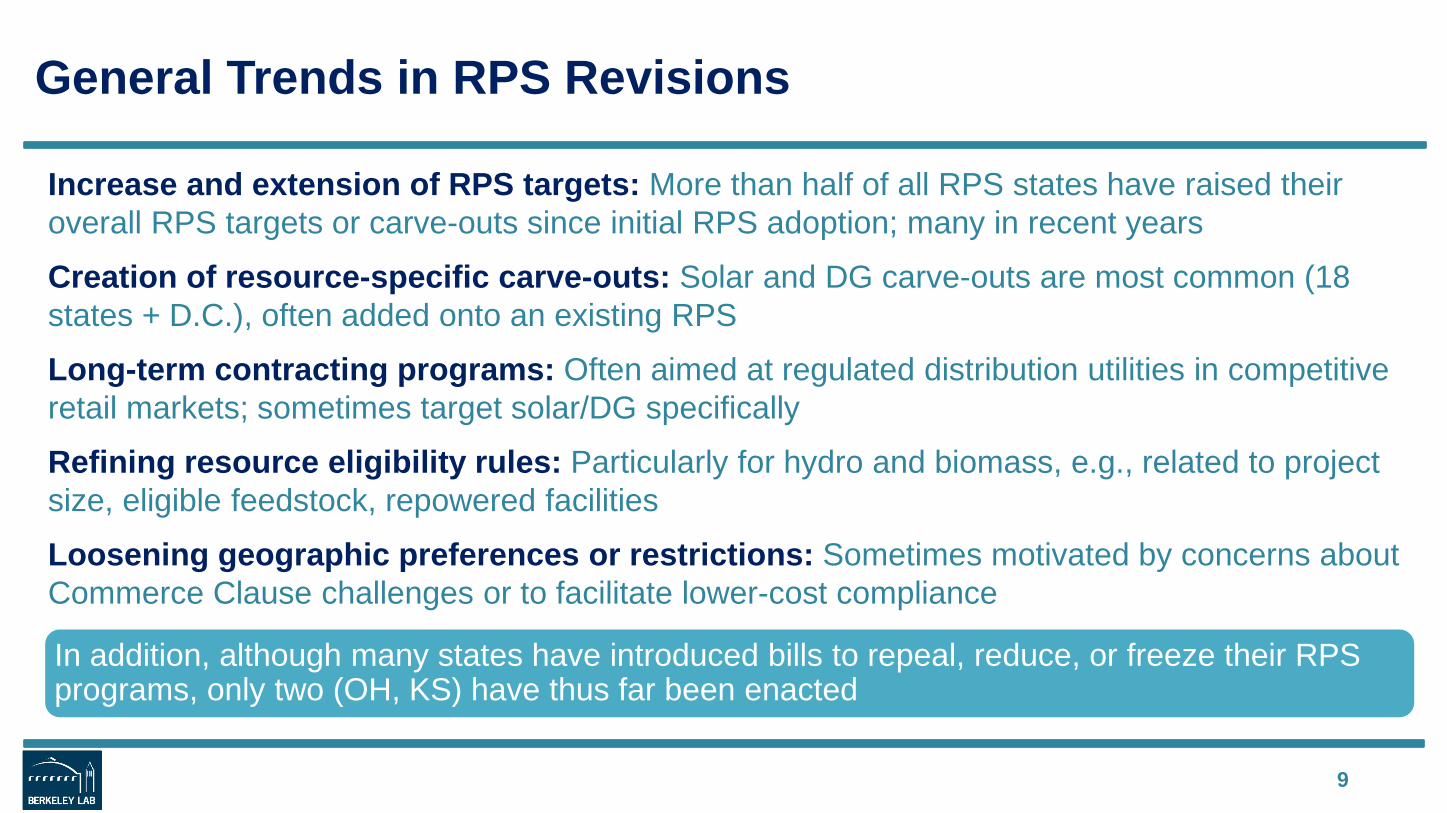
Increase and extension of RPS targets: More than half of all RPS states have raised their overall RPS targets or carve-outs since initial RPS adoption; many in recent years
Creation of resource-specific carve-outs: Solar and DG carve-outs are most common (18 states + D.C.), often added onto an existing RPS
Long-term contracting programs: Often aimed at regulated distribution utilities in competitive retail markets; sometimes target solar/DG specifically
Refining resource eligibility rules: Particularly for hydro and biomass, e.g., related to project size, eligible feedstock, repowered facilities
Loosening geographic preferences or restrictions: Sometimes motivated by concerns about Commerce Clause challenges or to facilitate lower-cost compliance
9
In addition, although many states have introduced bills to repeal, reduce, or freeze their RPS programs, only two (OH, KS) have thus far been enacted
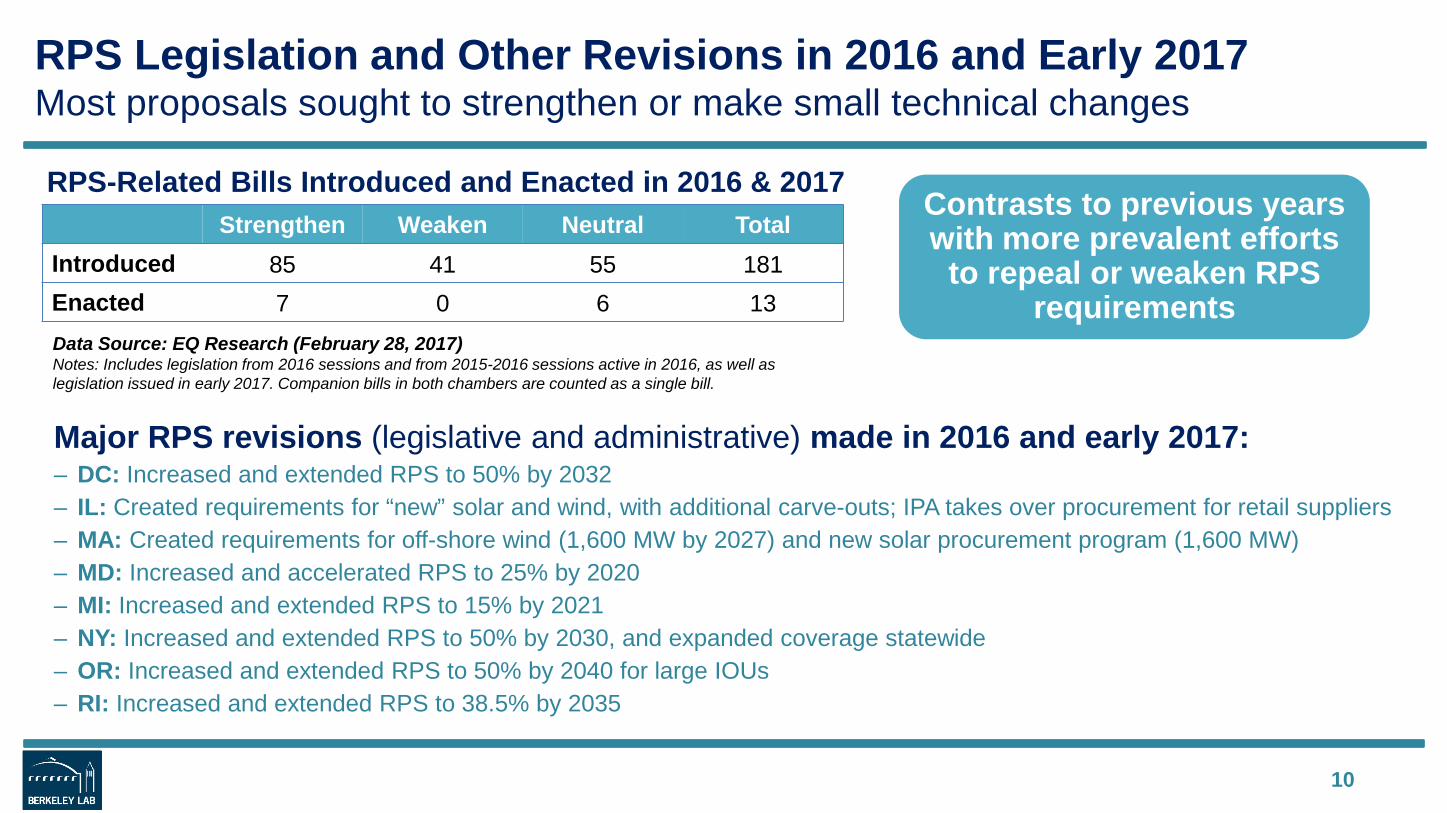
RPS Legislation and Other Revisions in 2016 and Early 2017Most proposals sought to strengthen or make small technical changes
Major RPS revisions (legislative and administrative) made in 2016 and early 2017:– DC: Increased and extended RPS to 50% by 2032– IL: Created requirements for “new” solar and wind, with additional carve-outs; IPA takes over procurement for retail suppliers– MA: Created requirements for off-shore wind (1,600 MW by 2027) and new solar procurement program (1,600 MW)– MD: Increased and accelerated RPS to 25% by 2020– MI: Increased and extended RPS to 15% by 2021– NY: Increased and extended RPS to 50% by 2030, and expanded coverage statewide– OR: Increased and extended RPS to 50% by 2040 for large IOUs– RI: Increased and extended RPS to 38.5% by 2035
10
Strengthen Weaken Neutral TotalIntroduced 85 41 55 181Enacted 7 0 6 13
RPS-Related Bills Introduced and Enacted in 2016 & 2017
Data Source: EQ Research (February 28, 2017)Notes: Includes legislation from 2016 sessions and from 2015-2016 sessions active in 2016, as well as legislation issued in early 2017. Companion bills in both chambers are counted as a single bill.
Contrasts to previous years with more prevalent efforts
to repeal or weaken RPS requirements
Table of Contents
• Evolution of state RPS programs• Historical impacts on renewables development• Future RPS demand and incremental needs• RPS target achievement to-date • REC pricing trends• RPS compliance costs and cost caps• Outlook
11
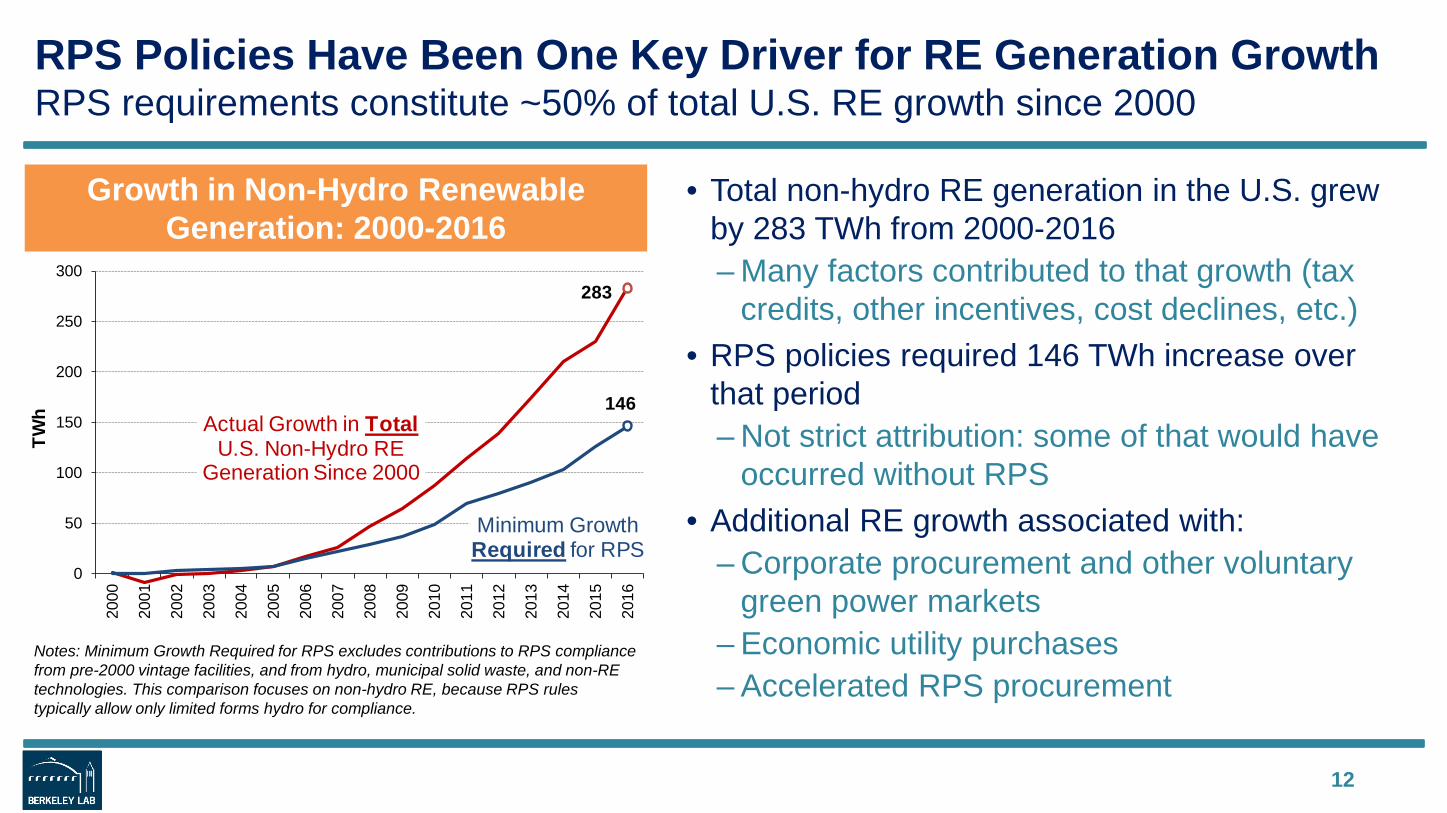
RPS Policies Have Been One Key Driver for RE Generation Growth RPS requirements constitute ~50% of total U.S. RE growth since 2000
12
Growth in Non-Hydro Renewable Generation: 2000-2016
Notes: Minimum Growth Required for RPS excludes contributions to RPS compliance from pre-2000 vintage facilities, and from hydro, municipal solid waste, and non-RE technologies. This comparison focuses on non-hydro RE, because RPS rules typically allow only limited forms hydro for compliance.
• Total non-hydro RE generation in the U.S. grew by 283 TWh from 2000-2016– Many factors contributed to that growth (tax
credits, other incentives, cost declines, etc.)• RPS policies required 146 TWh increase over
that period– Not strict attribution: some of that would have
occurred without RPS• Additional RE growth associated with:
– Corporate procurement and other voluntary green power markets
– Economic utility purchases– Accelerated RPS procurement
283
146
0
50
100
150
200
250
300
2000
2001
2002
2003
2004
2005
2006
2007
2008
2009
2010
2011
2012
2013
2014
2015
2016
TWh Actual Growth in Total
U.S. Non-Hydro RE Generation Since 2000
Minimum GrowthRequired for RPS
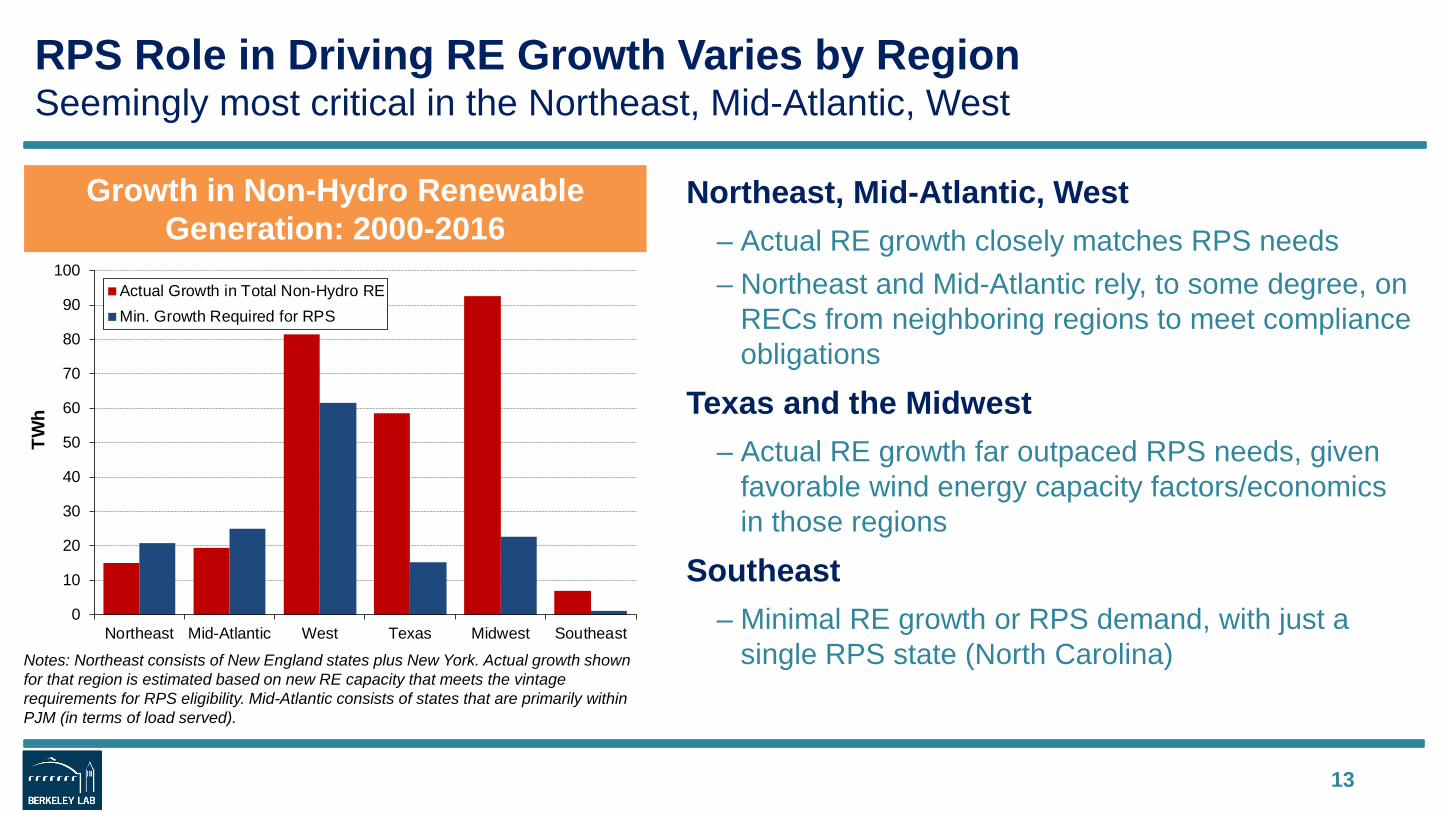
RPS Role in Driving RE Growth Varies by RegionSeemingly most critical in the Northeast, Mid-Atlantic, West
Northeast, Mid-Atlantic, West– Actual RE growth closely matches RPS needs– Northeast and Mid-Atlantic rely, to some degree, on
RECs from neighboring regions to meet compliance obligations
Texas and the Midwest– Actual RE growth far outpaced RPS needs, given
favorable wind energy capacity factors/economics in those regions
Southeast– Minimal RE growth or RPS demand, with just a
single RPS state (North Carolina)
13
Growth in Non-Hydro Renewable Generation: 2000-2016
Notes: Northeast consists of New England states plus New York. Actual growth shown for that region is estimated based on new RE capacity that meets the vintage requirements for RPS eligibility. Mid-Atlantic consists of states that are primarily within PJM (in terms of load served).
0
10
20
30
40
50
60
70
80
90
100
Northeast Mid-Atlantic West Texas Midwest Southeast
TWh
Actual Growth in Total Non-Hydro REMin. Growth Required for RPS
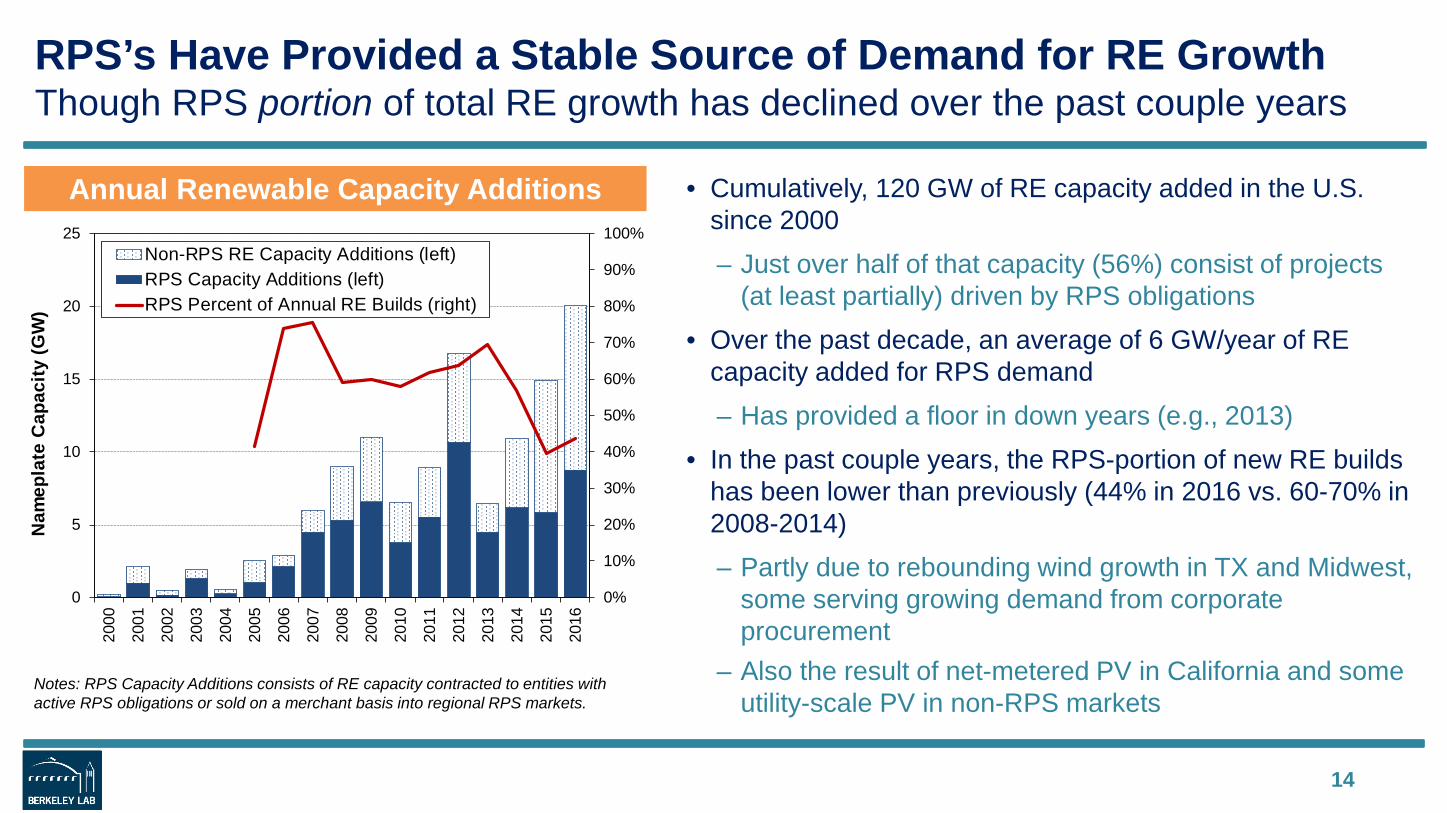
RPS’s Have Provided a Stable Source of Demand for RE GrowthThough RPS portion of total RE growth has declined over the past couple years
• Cumulatively, 120 GW of RE capacity added in the U.S. since 2000– Just over half of that capacity (56%) consist of projects
(at least partially) driven by RPS obligations• Over the past decade, an average of 6 GW/year of RE
capacity added for RPS demand– Has provided a floor in down years (e.g., 2013)
• In the past couple years, the RPS-portion of new RE builds has been lower than previously (44% in 2016 vs. 60-70% in 2008-2014)– Partly due to rebounding wind growth in TX and Midwest,
some serving growing demand from corporate procurement
– Also the result of net-metered PV in California and some utility-scale PV in non-RPS markets
14
Annual Renewable Capacity Additions
Notes: RPS Capacity Additions consists of RE capacity contracted to entities with active RPS obligations or sold on a merchant basis into regional RPS markets.
0%
10%
20%
30%
40%
50%
60%
70%
80%
90%
100%
0
5
10
15
20
25
2000
2001
2002
2003
2004
2005
2006
2007
2008
2009
2010
2011
2012
2013
2014
2015
2016
Nam
epla
te C
apac
ity (G
W)
Non-RPS RE Capacity Additions (left)RPS Capacity Additions (left)RPS Percent of Annual RE Builds (right)
Non-RPS RE Capacity Additions (left, GW) RPS Capacity Additions (left, GW)RPS Percent of Annual RE Builds (right)
0.0
0.5
1.0
1.5
2000
2005
2010
2015
Northeast
0.0
1.0
2.020
00
2005
2010
2015
Mid-Atlantic
0%
50%
100%
0.01.02.03.04.05.06.07.08.0
2000
2005
2010
2015
West
0.0
1.0
2.0
3.0
4.0
2000
2005
2010
2015
Texas
0.0
1.0
2.0
3.0
4.0
5.0
2000
2005
2010
2015
Midwest
0%
50%
100%
0.0
1.0
2.020
00
2005
2010
2015
Southeast
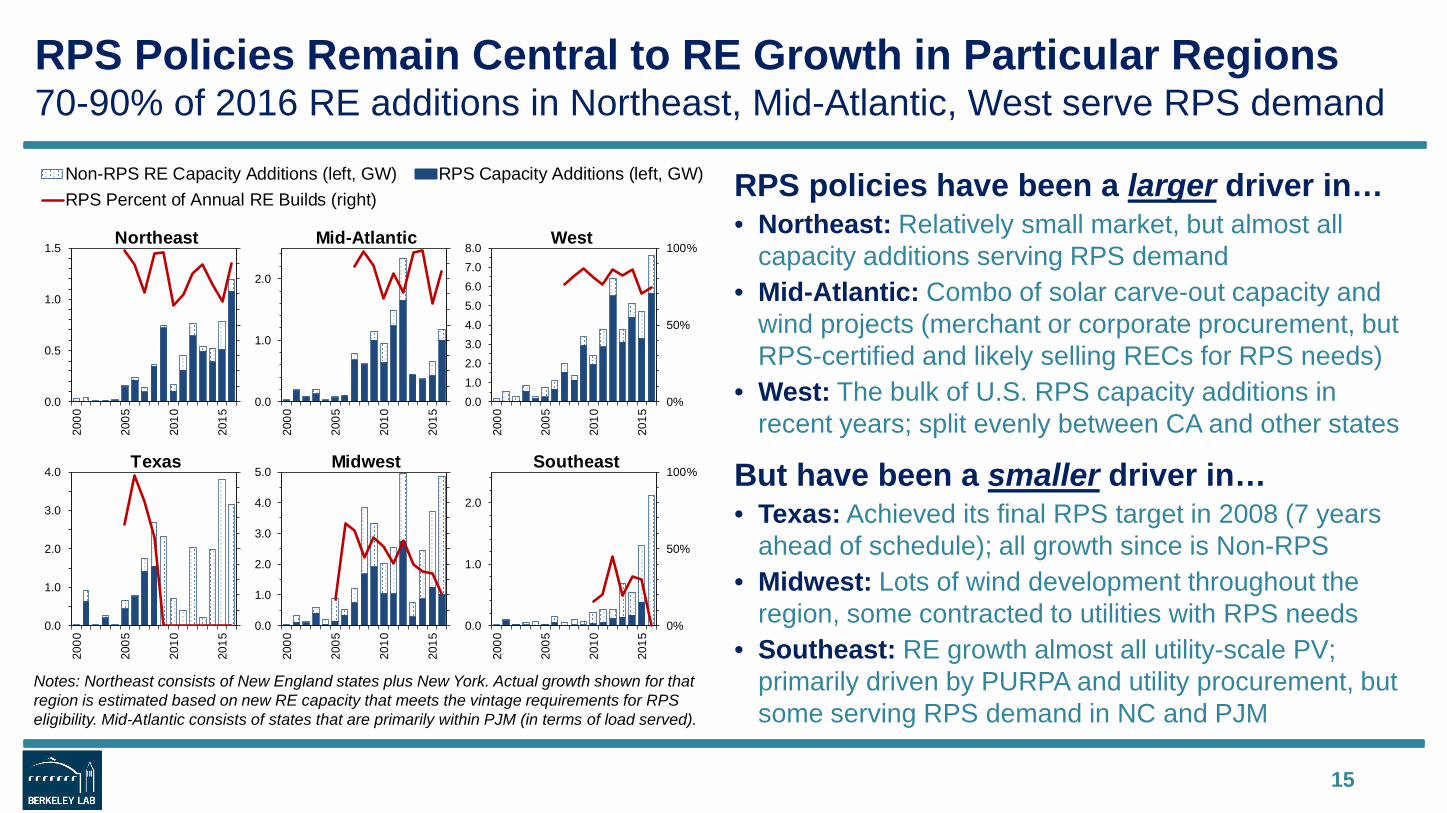
RPS Policies Remain Central to RE Growth in Particular Regions70-90% of 2016 RE additions in Northeast, Mid-Atlantic, West serve RPS demand
RPS policies have been a larger driver in…• Northeast: Relatively small market, but almost all
capacity additions serving RPS demand• Mid-Atlantic: Combo of solar carve-out capacity and
wind projects (merchant or corporate procurement, but RPS-certified and likely selling RECs for RPS needs)
• West: The bulk of U.S. RPS capacity additions in recent years; split evenly between CA and other states
But have been a smaller driver in…• Texas: Achieved its final RPS target in 2008 (7 years
ahead of schedule); all growth since is Non-RPS• Midwest: Lots of wind development throughout the
region, some contracted to utilities with RPS needs• Southeast: RE growth almost all utility-scale PV;
primarily driven by PURPA and utility procurement, but some serving RPS demand in NC and PJM
15
Notes: Northeast consists of New England states plus New York. Actual growth shown for that region is estimated based on new RE capacity that meets the vintage requirements for RPS eligibility. Mid-Atlantic consists of states that are primarily within PJM (in terms of load served).
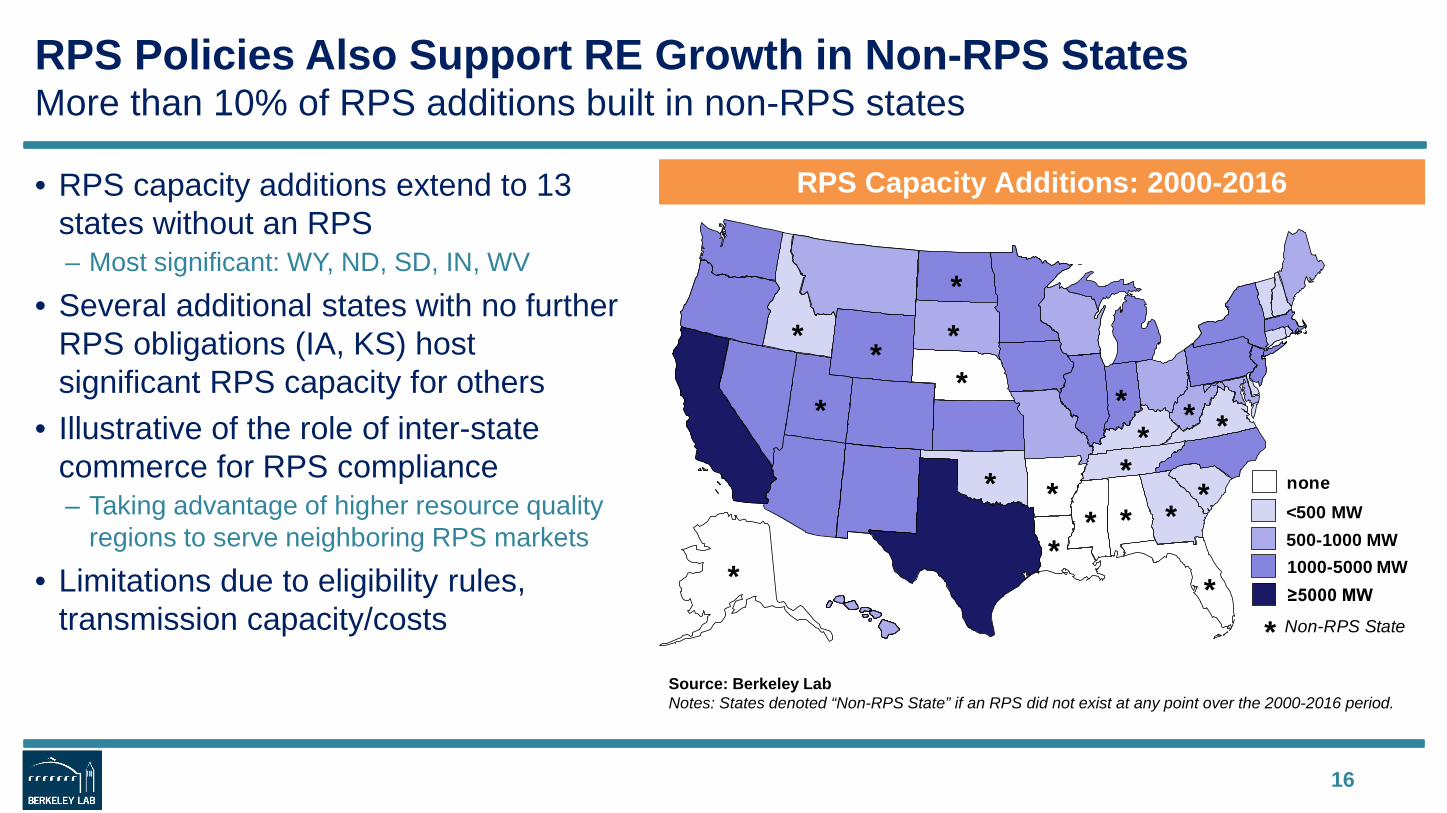
RPS Policies Also Support RE Growth in Non-RPS StatesMore than 10% of RPS additions built in non-RPS states
• RPS capacity additions extend to 13 states without an RPS– Most significant: WY, ND, SD, IN, WV
• Several additional states with no further RPS obligations (IA, KS) host significant RPS capacity for others
• Illustrative of the role of inter-state commerce for RPS compliance– Taking advantage of higher resource quality
regions to serve neighboring RPS markets
• Limitations due to eligibility rules, transmission capacity/costs
16
RPS Capacity Additions: 2000-2016
Source: Berkeley LabNotes: States denoted “Non-RPS State” if an RPS did not exist at any point over the 2000-2016 period.
<500 MW
1000-5000 MW500-1000 MW
≥5000 MW
none
Non-RPS State
**
***
**
*
*
* *
**
** * *
**
*
*
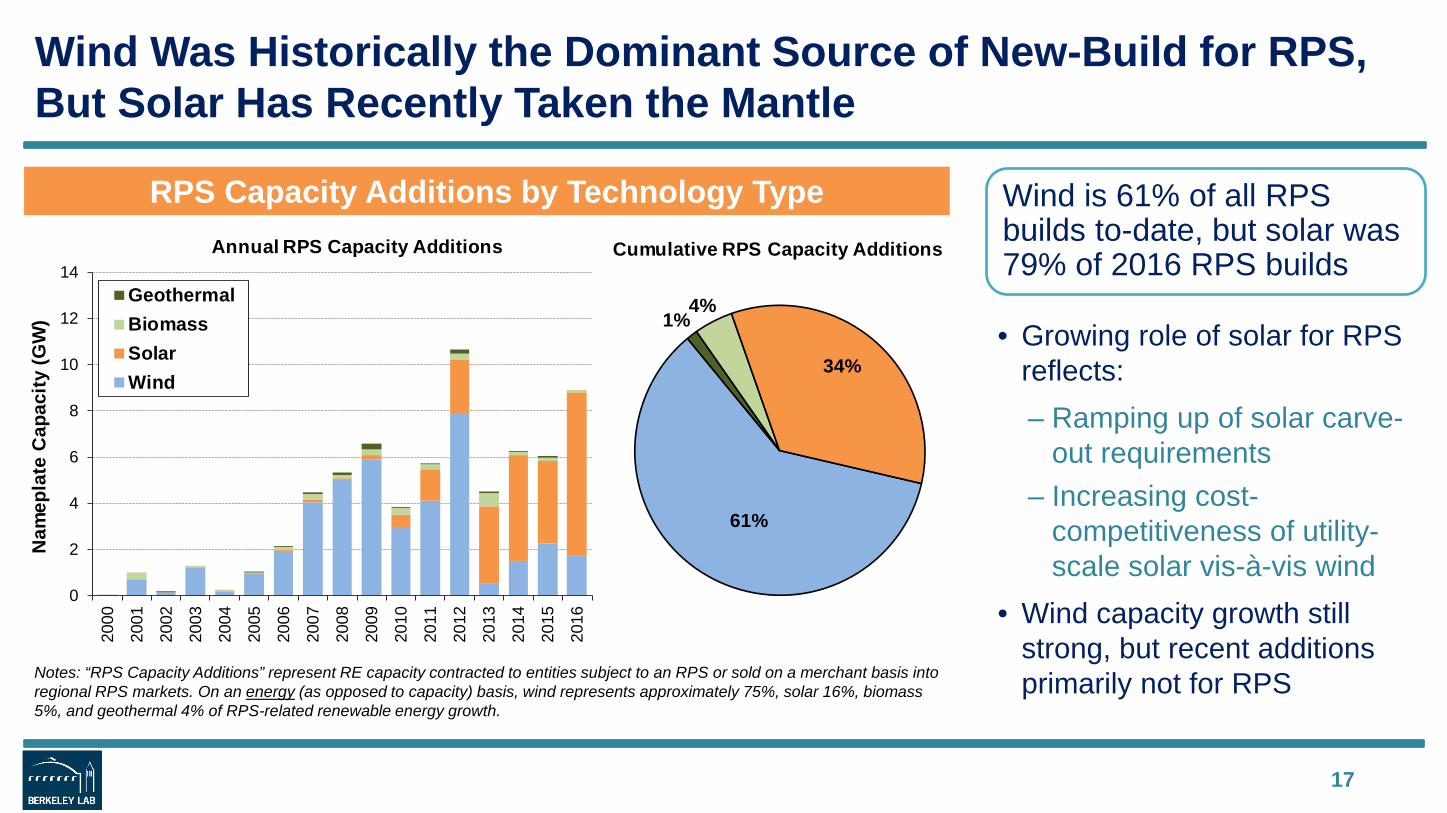
Wind Was Historically the Dominant Source of New-Build for RPS, But Solar Has Recently Taken the Mantle
17
RPS Capacity Additions by Technology Type
Notes: “RPS Capacity Additions” represent RE capacity contracted to entities subject to an RPS or sold on a merchant basis into regional RPS markets. On an energy (as opposed to capacity) basis, wind represents approximately 75%, solar 16%, biomass 5%, and geothermal 4% of RPS-related renewable energy growth.
• Growing role of solar for RPS reflects:– Ramping up of solar carve-
out requirements– Increasing cost-
competitiveness of utility-scale solar vis-à-vis wind
• Wind capacity growth still strong, but recent additions primarily not for RPS
Wind is 61% of all RPS builds to-date, but solar was 79% of 2016 RPS builds
61%
1%4%
34%
Cumulative RPS Capacity Additions
0
2
4
6
8
10
12
14
2000
2001
2002
2003
2004
2005
2006
2007
2008
2009
2010
2011
2012
2013
2014
2015
2016
Nam
epla
te C
apac
ity (G
W)
Annual RPS Capacity Additions
GeothermalBiomassSolarWind
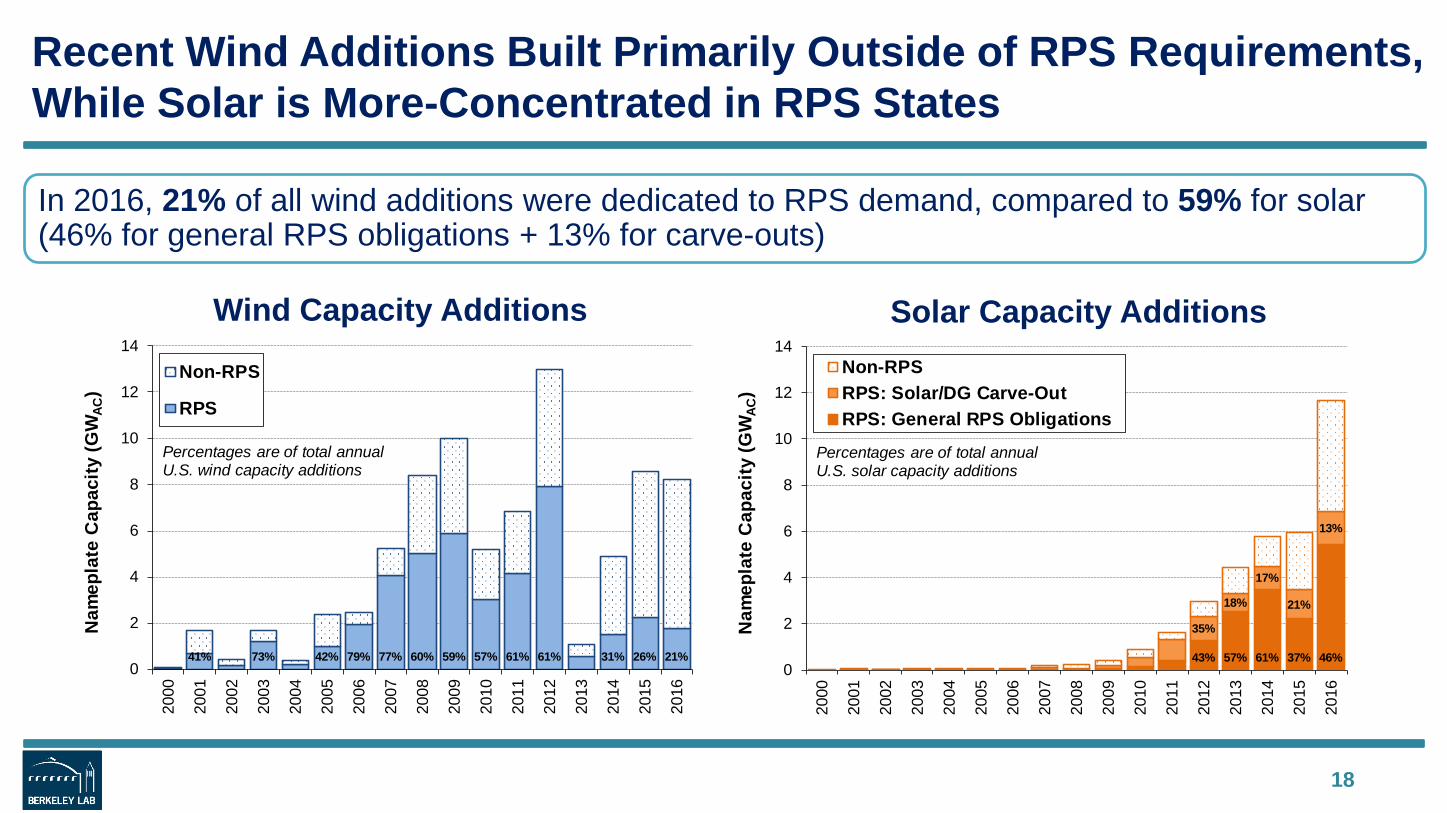
Recent Wind Additions Built Primarily Outside of RPS Requirements, While Solar is More-Concentrated in RPS States
18
Solar Capacity AdditionsWind Capacity Additions
In 2016, 21% of all wind additions were dedicated to RPS demand, compared to 59% for solar (46% for general RPS obligations + 13% for carve-outs)
41% 73% 42% 79% 77% 60% 59% 57% 61% 61% 31% 26% 21%0
2
4
6
8
10
12
14
2000
2001
2002
2003
2004
2005
2006
2007
2008
2009
2010
2011
2012
2013
2014
2015
2016
Nam
epla
te C
apac
ity (G
WAC
)
Non-RPS
RPS
Percentages are of total annual U.S. wind capacity additions
43% 57% 61% 37% 46%
35%
18%
17%
21%
13%
0
2
4
6
8
10
12
14
2000
2001
2002
2003
2004
2005
2006
2007
2008
2009
2010
2011
2012
2013
2014
2015
2016
Nam
epla
te C
apac
ity (G
WAC
)
Non-RPSRPS: Solar/DG Carve-OutRPS: General RPS Obligations
Percentages are of total annual U.S. solar capacity additions
Table of Contents
• Evolution of state RPS programs• Historical impacts on renewables development• Future RPS demand and incremental needs• RPS target achievement to-date • REC pricing trends• RPS compliance costs and cost caps• Outlook
19
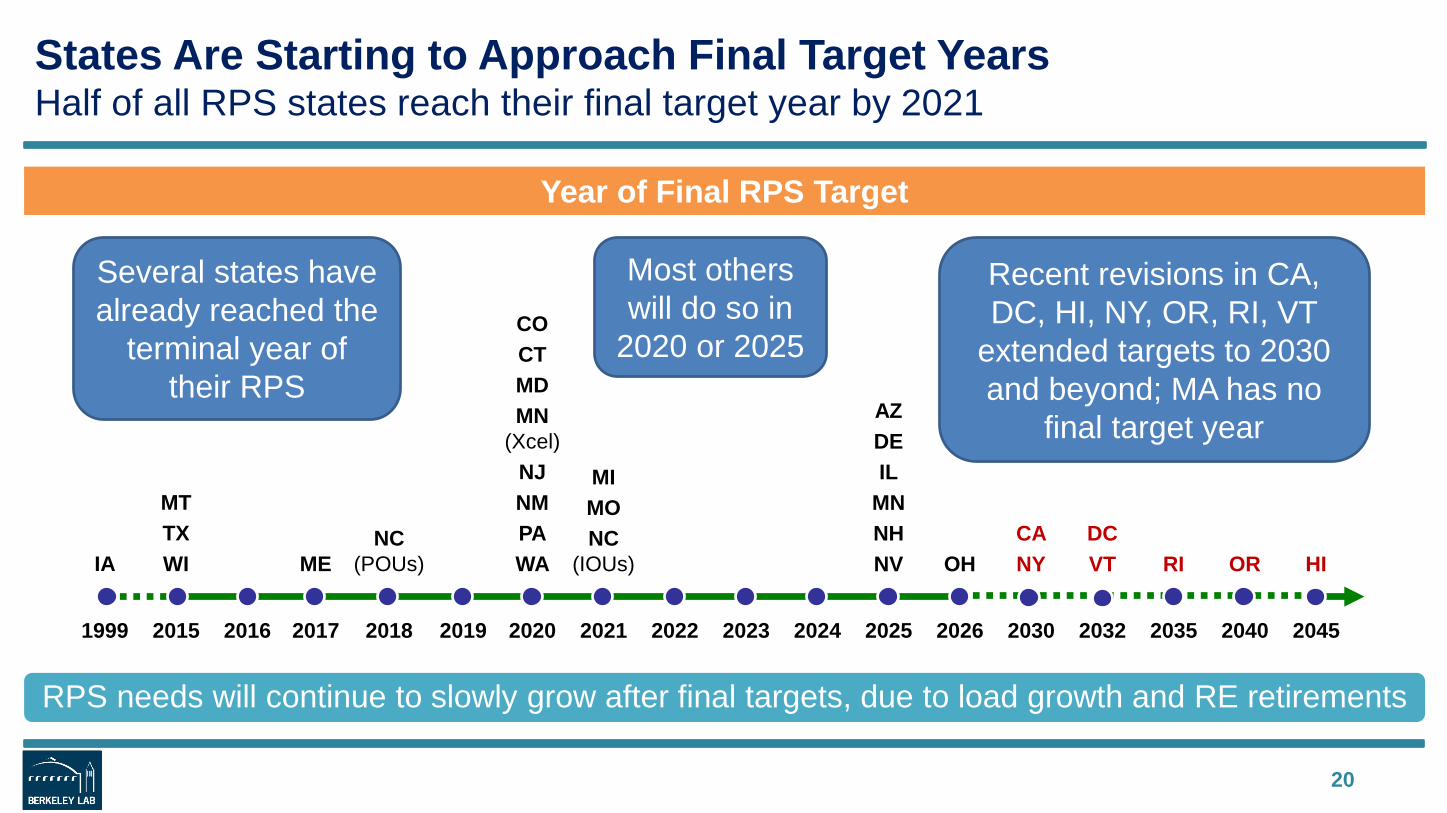
States Are Starting to Approach Final Target YearsHalf of all RPS states reach their final target year by 2021
20
Year of Final RPS Target
Several states have already reached the
terminal year of their RPS
Most others will do so in
2020 or 2025
RPS needs will continue to slowly grow after final targets, due to load growth and RE retirements
Recent revisions in CA, DC, HI, NY, OR, RI, VT
extended targets to 2030 and beyond; MA has no
final target year
IA
MTTXWI ME
NC (POUs)
COCTMDMN
(Xcel)NJNMPAWA
MIMONC
(IOUs)
AZDEIL
MNNHNV OH
CANY
DCVT RI OR HI
1999 2015 2016 2017 2018 2019 2020 2021 2022 2023 2024 2025 2026 2030 2032 2035 2040 2045
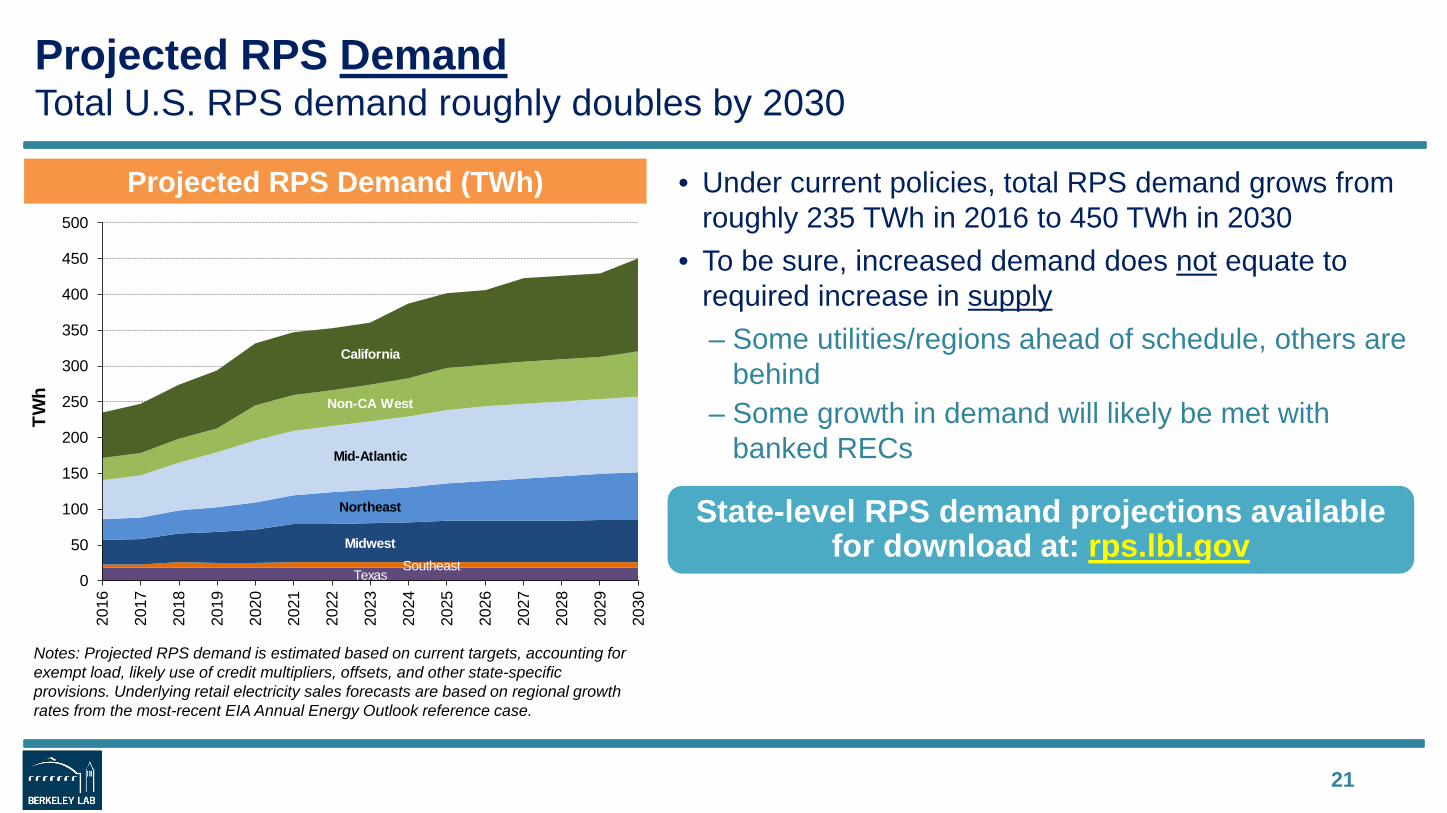
Projected RPS DemandTotal U.S. RPS demand roughly doubles by 2030
21
Projected RPS Demand (TWh)
Notes: Projected RPS demand is estimated based on current targets, accounting for exempt load, likely use of credit multipliers, offsets, and other state-specific provisions. Underlying retail electricity sales forecasts are based on regional growth rates from the most-recent EIA Annual Energy Outlook reference case.
• Under current policies, total RPS demand grows from roughly 235 TWh in 2016 to 450 TWh in 2030
• To be sure, increased demand does not equate to required increase in supply– Some utilities/regions ahead of schedule, others are
behind– Some growth in demand will likely be met with
banked RECs
State-level RPS demand projections available for download at: rps.lbl.gov
TexasSoutheast
Midwest
Northeast
Mid-Atlantic
Non-CA West
California
0
50
100
150
200
250
300
350
400
450
500
2016
2017
2018
2019
2020
2021
2022
2023
2024
2025
2026
2027
2028
2029
2030
TWh
Required Increase in RPS Generation SupplyEquates to roughly 50% increase in U.S. renewable energy generation
22
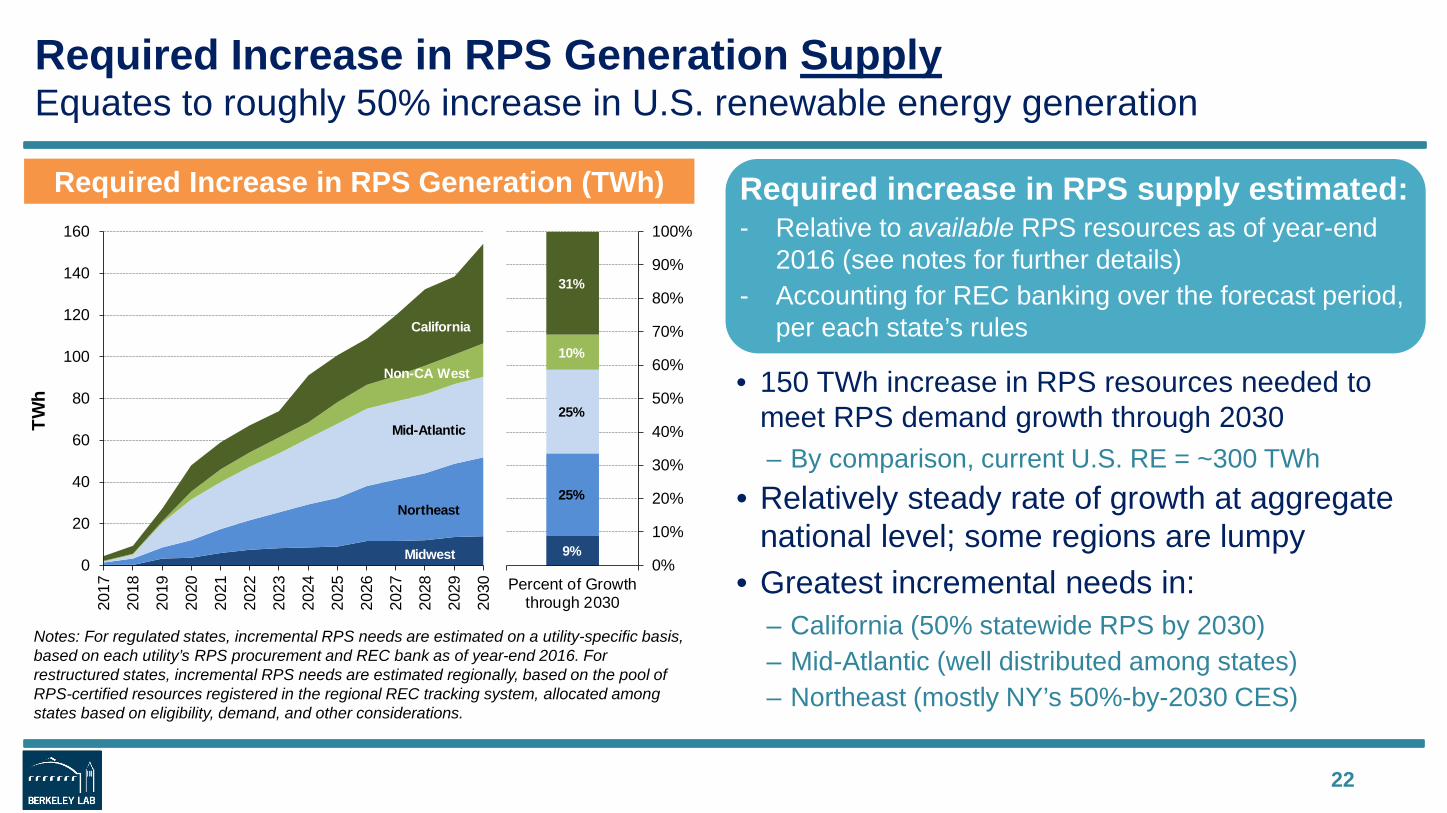
Required Increase in RPS Generation (TWh)
Notes: For regulated states, incremental RPS needs are estimated on a utility-specific basis, based on each utility’s RPS procurement and REC bank as of year-end 2016. For restructured states, incremental RPS needs are estimated regionally, based on the pool of RPS-certified resources registered in the regional REC tracking system, allocated among states based on eligibility, demand, and other considerations.
• 150 TWh increase in RPS resources needed to meet RPS demand growth through 2030– By comparison, current U.S. RE = ~300 TWh
• Relatively steady rate of growth at aggregate national level; some regions are lumpy
• Greatest incremental needs in: – California (50% statewide RPS by 2030)– Mid-Atlantic (well distributed among states)– Northeast (mostly NY’s 50%-by-2030 CES)
Required increase in RPS supply estimated:- Relative to available RPS resources as of year-end
2016 (see notes for further details)- Accounting for REC banking over the forecast period,
per each state’s rules
Midwest
Northeast
Mid-Atlantic
Non-CA West
California
0
20
40
60
80
100
120
140
160
2017
2018
2019
2020
2021
2022
2023
2024
2025
2026
2027
2028
2029
2030
TWh
9%
25%
25%
10%
31%
0%
10%
20%
30%
40%
50%
60%
70%
80%
90%
100%
Percent of Growththrough 2030
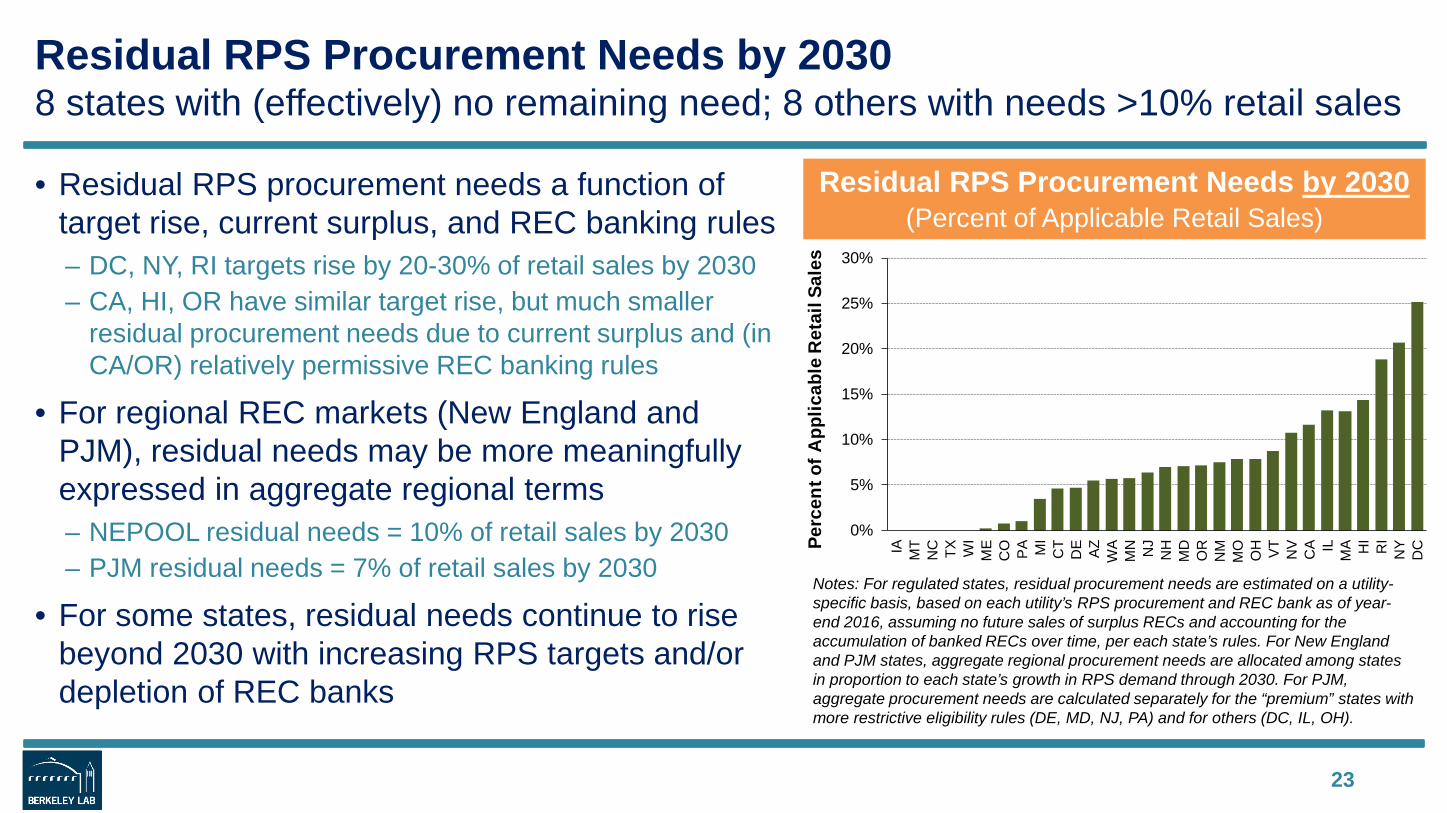
Residual RPS Procurement Needs by 20308 states with (effectively) no remaining need; 8 others with needs >10% retail sales
• Residual RPS procurement needs a function of target rise, current surplus, and REC banking rules– DC, NY, RI targets rise by 20-30% of retail sales by 2030– CA, HI, OR have similar target rise, but much smaller
residual procurement needs due to current surplus and (in CA/OR) relatively permissive REC banking rules
• For regional REC markets (New England and PJM), residual needs may be more meaningfully expressed in aggregate regional terms– NEPOOL residual needs = 10% of retail sales by 2030– PJM residual needs = 7% of retail sales by 2030
• For some states, residual needs continue to rise beyond 2030 with increasing RPS targets and/or depletion of REC banks
23
Notes: For regulated states, residual procurement needs are estimated on a utility-specific basis, based on each utility’s RPS procurement and REC bank as of year-end 2016, assuming no future sales of surplus RECs and accounting for the accumulation of banked RECs over time, per each state’s rules. For New England and PJM states, aggregate regional procurement needs are allocated among states in proportion to each state’s growth in RPS demand through 2030. For PJM, aggregate procurement needs are calculated separately for the “premium” states with more restrictive eligibility rules (DE, MD, NJ, PA) and for others (DC, IL, OH).
Residual RPS Procurement Needs by 2030(Percent of Applicable Retail Sales)
0%
5%
10%
15%
20%
25%
30%
IA MT
NC TX WI
ME
CO PA MI
CT
DE AZ
WA
MN NJ
NH
MD
OR
NM
MO
OH VT
NV
CA IL
MA HI
RI
NY
DCPe
rcen
t of A
pplic
able
Ret
ail S
ales
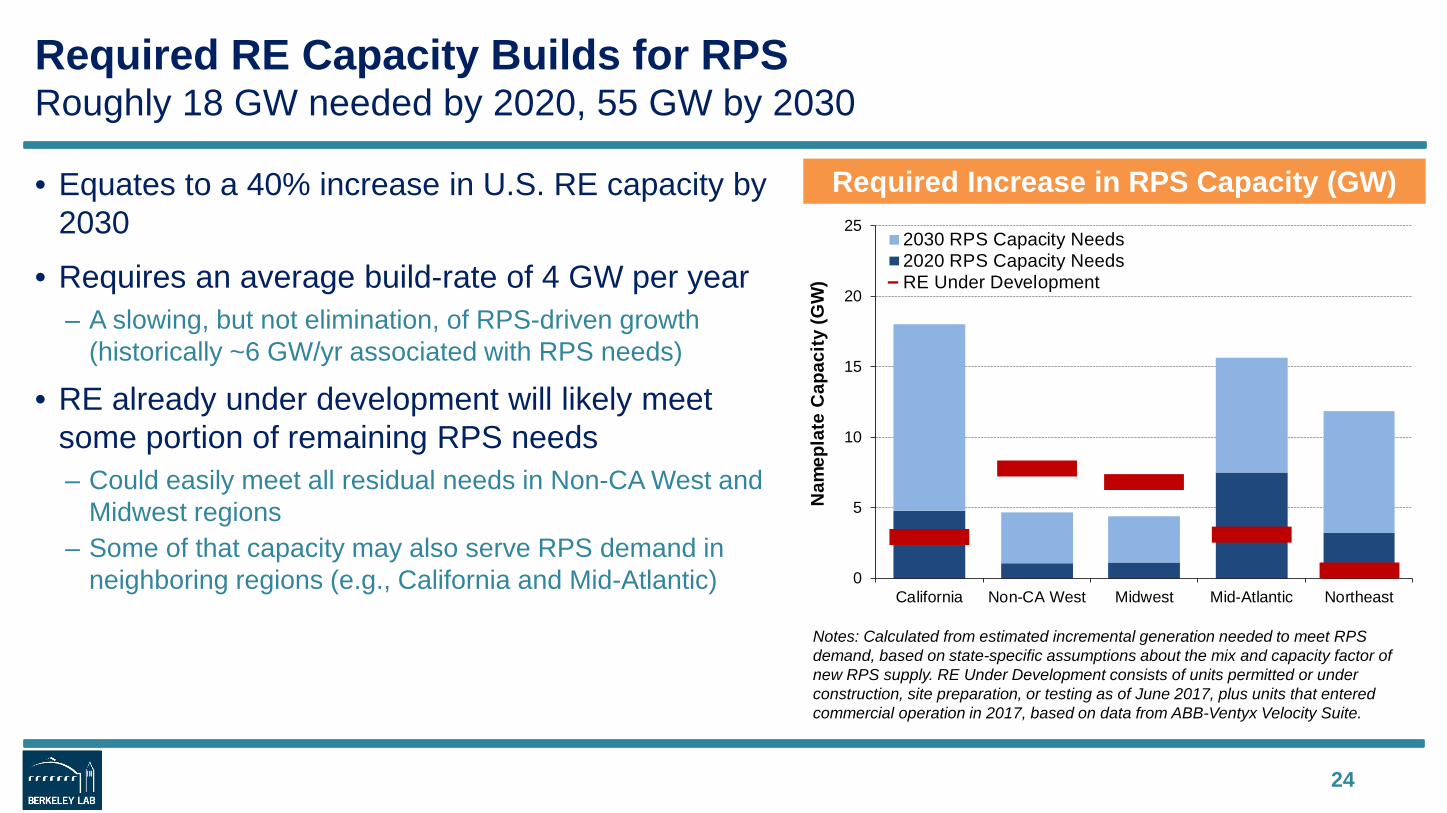
Required RE Capacity Builds for RPSRoughly 18 GW needed by 2020, 55 GW by 2030
• Equates to a 40% increase in U.S. RE capacity by 2030
• Requires an average build-rate of 4 GW per year– A slowing, but not elimination, of RPS-driven growth
(historically ~6 GW/yr associated with RPS needs)
• RE already under development will likely meet some portion of remaining RPS needs– Could easily meet all residual needs in Non-CA West and
Midwest regions– Some of that capacity may also serve RPS demand in
neighboring regions (e.g., California and Mid-Atlantic)
24
Notes: Calculated from estimated incremental generation needed to meet RPS demand, based on state-specific assumptions about the mix and capacity factor of new RPS supply. RE Under Development consists of units permitted or under construction, site preparation, or testing as of June 2017, plus units that entered commercial operation in 2017, based on data from ABB-Ventyx Velocity Suite.
Required Increase in RPS Capacity (GW)
0
5
10
15
20
25
California Non-CA West Midwest Mid-Atlantic Northeast
Nam
epla
te C
apac
ity (G
W)
2030 RPS Capacity Needs2020 RPS Capacity NeedsRE Under Development
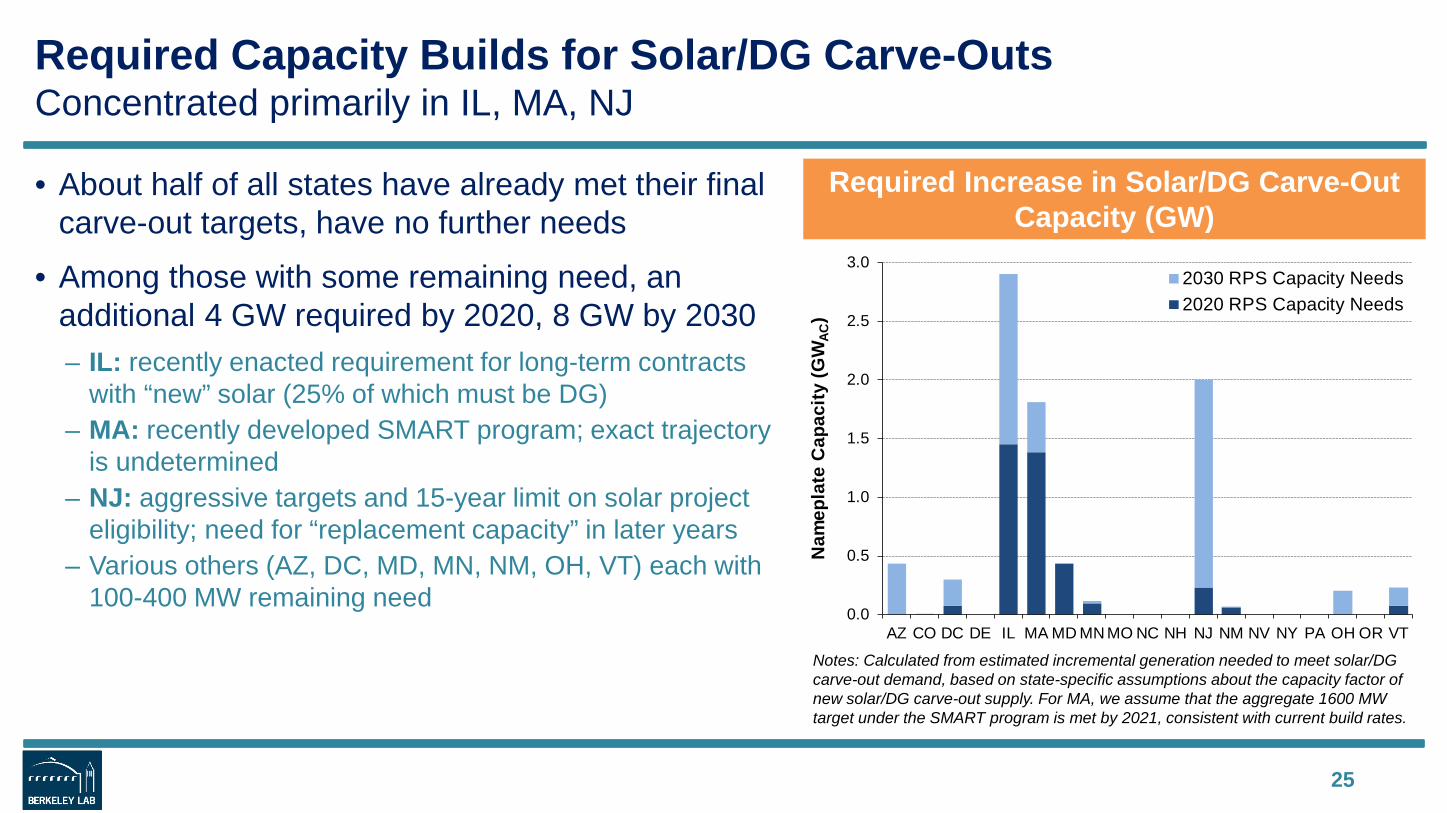
Required Capacity Builds for Solar/DG Carve-OutsConcentrated primarily in IL, MA, NJ
• About half of all states have already met their final carve-out targets, have no further needs
• Among those with some remaining need, an additional 4 GW required by 2020, 8 GW by 2030– IL: recently enacted requirement for long-term contracts
with “new” solar (25% of which must be DG)– MA: recently developed SMART program; exact trajectory
is undetermined– NJ: aggressive targets and 15-year limit on solar project
eligibility; need for “replacement capacity” in later years– Various others (AZ, DC, MD, MN, NM, OH, VT) each with
100-400 MW remaining need
25
Notes: Calculated from estimated incremental generation needed to meet solar/DG carve-out demand, based on state-specific assumptions about the capacity factor of new solar/DG carve-out supply. For MA, we assume that the aggregate 1600 MW target under the SMART program is met by 2021, consistent with current build rates.
Required Increase in Solar/DG Carve-Out Capacity (GW)
0.0
0.5
1.0
1.5
2.0
2.5
3.0
AZ CO DC DE IL MA MD MN MO NC NH NJ NM NV NY PA OH OR VT
Nam
epla
te C
apac
ity (G
WAC
)
2030 RPS Capacity Needs2020 RPS Capacity Needs
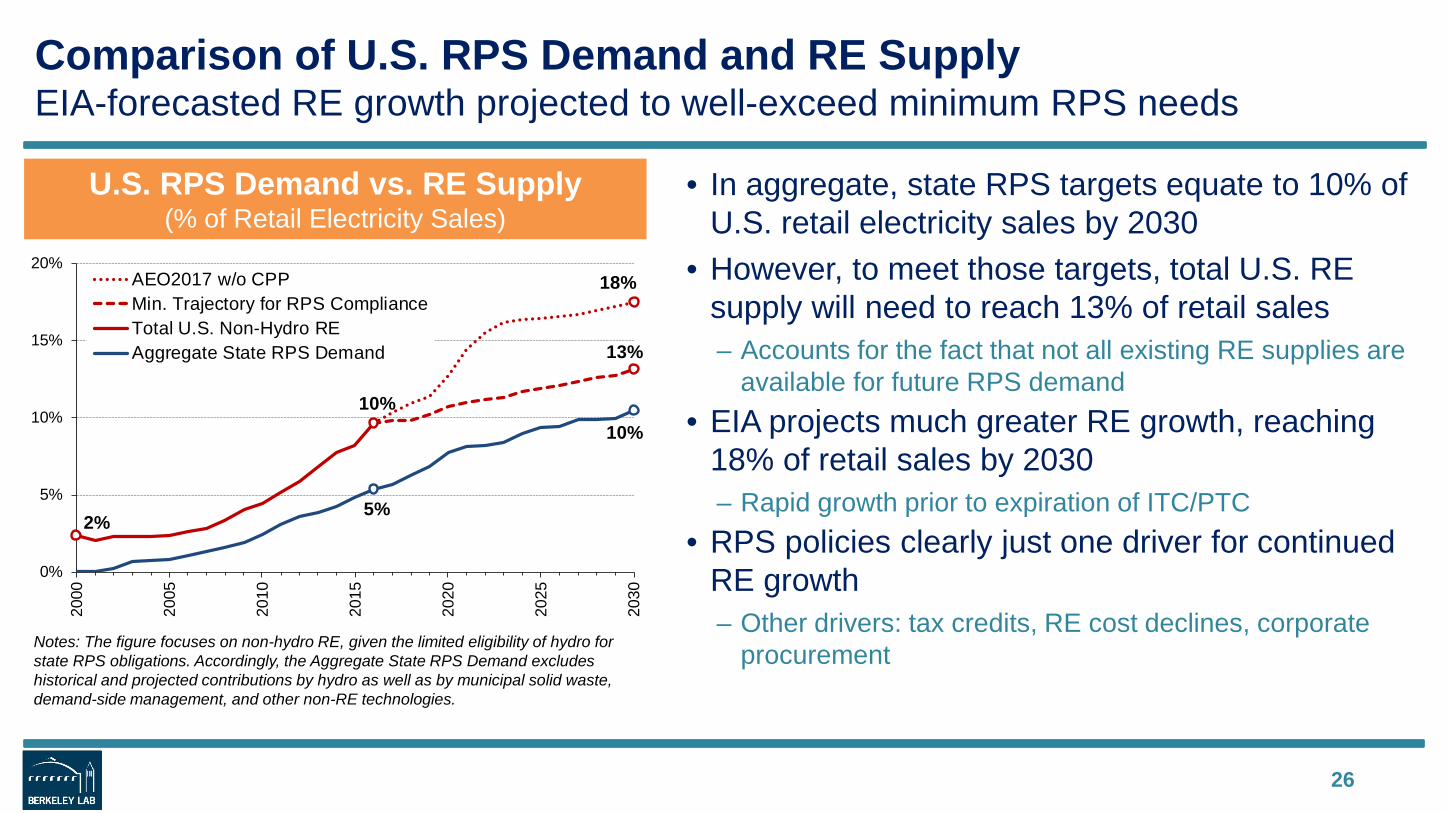
Comparison of U.S. RPS Demand and RE SupplyEIA-forecasted RE growth projected to well-exceed minimum RPS needs
• In aggregate, state RPS targets equate to 10% of U.S. retail electricity sales by 2030
• However, to meet those targets, total U.S. RE supply will need to reach 13% of retail sales– Accounts for the fact that not all existing RE supplies are
available for future RPS demand • EIA projects much greater RE growth, reaching
18% of retail sales by 2030– Rapid growth prior to expiration of ITC/PTC
• RPS policies clearly just one driver for continued RE growth– Other drivers: tax credits, RE cost declines, corporate
procurement
26
U.S. RPS Demand vs. RE Supply (% of Retail Electricity Sales)
Notes: The figure focuses on non-hydro RE, given the limited eligibility of hydro for state RPS obligations. Accordingly, the Aggregate State RPS Demand excludes historical and projected contributions by hydro as well as by municipal solid waste, demand-side management, and other non-RE technologies.
2%
10%
13%
5%
10%
18%
0%
5%
10%
15%
20%
2000
2005
2010
2015
2020
2025
2030
AEO2017 w/o CPPMin. Trajectory for RPS ComplianceTotal U.S. Non-Hydro REAggregate State RPS Demand
Table of Contents
• Evolution of state RPS programs• Historical impacts on renewables development• Future RPS demand and incremental needs• RPS target achievement to-date• REC pricing trends• RPS compliance costs and cost caps• Outlook
27
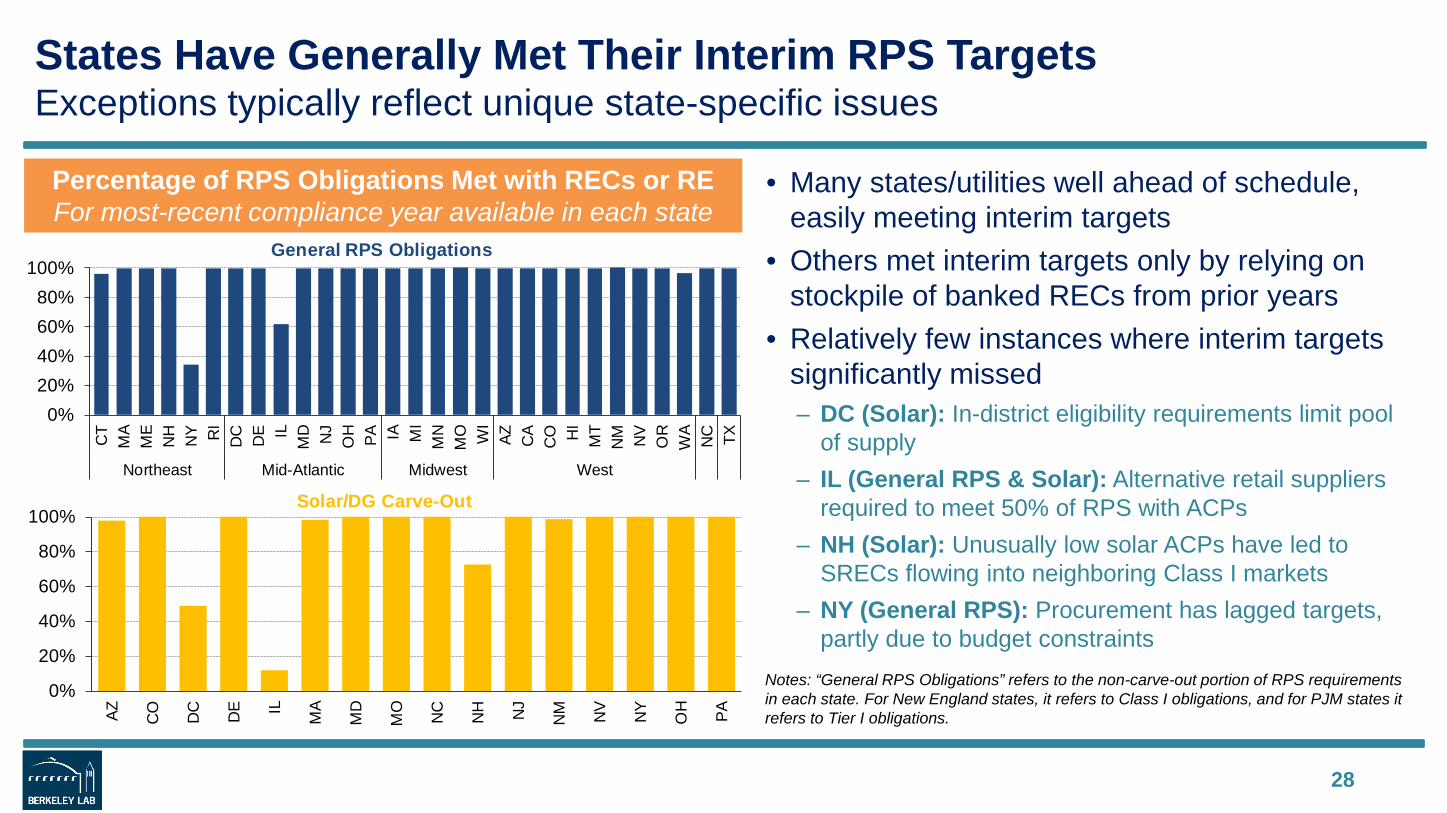
• Many states/utilities well ahead of schedule, easily meeting interim targets
• Others met interim targets only by relying on stockpile of banked RECs from prior years
• Relatively few instances where interim targets significantly missed– DC (Solar): In-district eligibility requirements limit pool
of supply– IL (General RPS & Solar): Alternative retail suppliers
required to meet 50% of RPS with ACPs– NH (Solar): Unusually low solar ACPs have led to
SRECs flowing into neighboring Class I markets– NY (General RPS): Procurement has lagged targets,
partly due to budget constraints
States Have Generally Met Their Interim RPS TargetsExceptions typically reflect unique state-specific issues
28
Percentage of RPS Obligations Met with RECs or REFor most-recent compliance year available in each state
Notes: “General RPS Obligations” refers to the non-carve-out portion of RPS requirements in each state. For New England states, it refers to Class I obligations, and for PJM states it refers to Tier I obligations.
0%20%40%60%80%
100%
CT
MA
ME
NH NY RI
DC DE IL
MD NJ
OH PA IA MI
MN
MO WI
AZ CA
CO HI
MT
NM NV
OR
WA
NC TX
Northeast Mid-Atlantic Midwest West
0%
20%
40%
60%
80%
100%
AZ CO DC DE IL MA
MD
MO
NC
NH NJ
NM NV
NY
OH PA
General RPS Obligations
Solar/DG Carve-Out

Table of Contents
• Evolution of state RPS programs• Historical impacts on renewables development• Future RPS demand and incremental needs• RPS target achievement to-date • REC pricing trends• RPS compliance costs and cost caps• Outlook
29
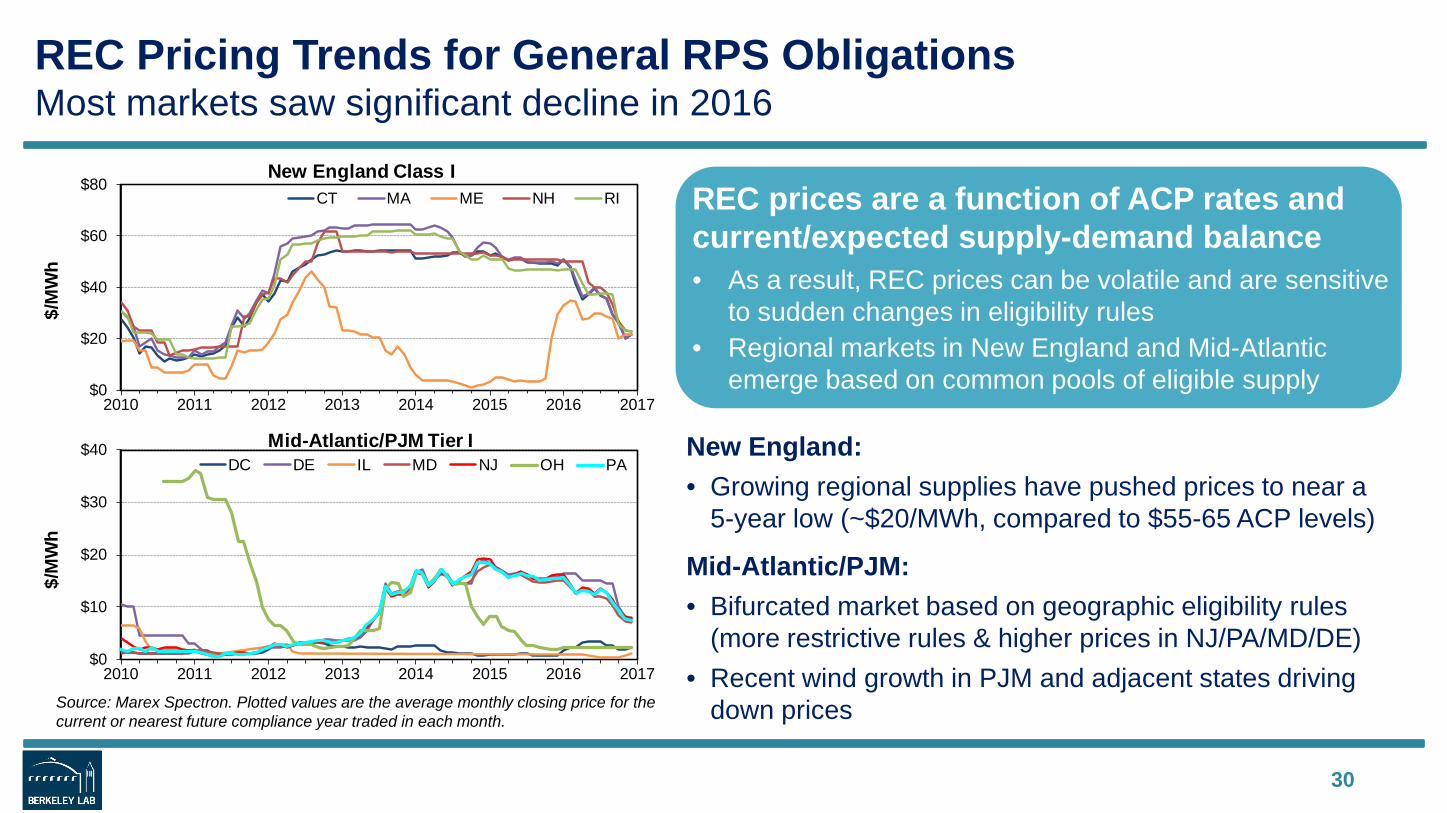
REC Pricing Trends for General RPS ObligationsMost markets saw significant decline in 2016
New England:• Growing regional supplies have pushed prices to near a
5-year low (~$20/MWh, compared to $55-65 ACP levels)
Mid-Atlantic/PJM: • Bifurcated market based on geographic eligibility rules
(more restrictive rules & higher prices in NJ/PA/MD/DE)• Recent wind growth in PJM and adjacent states driving
down prices
30
Source: Marex Spectron. Plotted values are the average monthly closing price for the current or nearest future compliance year traded in each month.
REC prices are a function of ACP rates and current/expected supply-demand balance• As a result, REC prices can be volatile and are sensitive
to sudden changes in eligibility rules• Regional markets in New England and Mid-Atlantic
emerge based on common pools of eligible supply$0
$20
$40
$60
$80
2010 2011 2012 2013 2014 2015 2016 2017
New England Class ICT MA ME NH RI
$/M
Wh
$0
$10
$20
$30
$40
2010 2011 2012 2013 2014 2015 2016 2017
Mid-Atlantic/PJM Tier IDC DE IL MD NJ OH PA
$/M
Wh
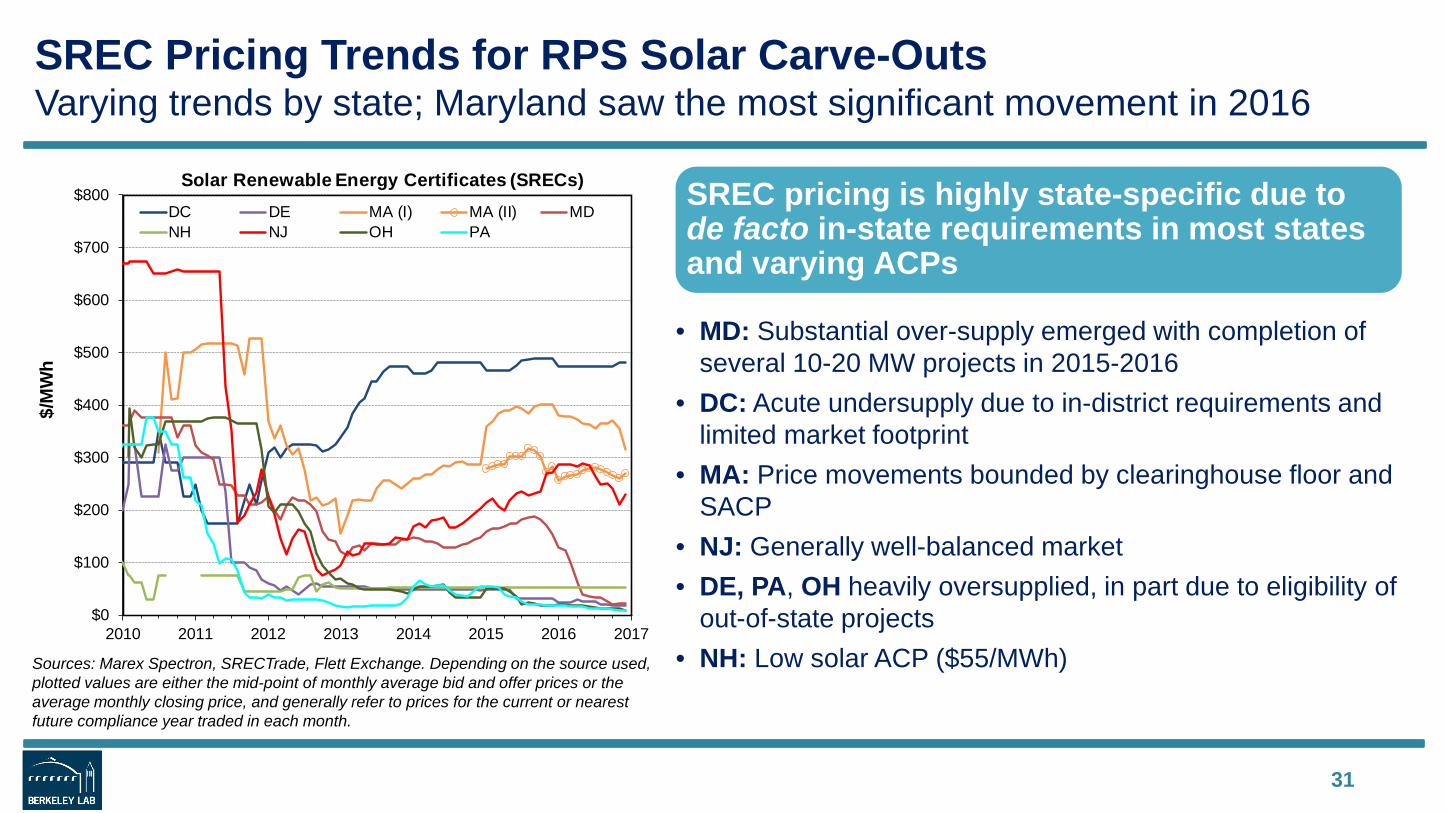
SREC Pricing Trends for RPS Solar Carve-OutsVarying trends by state; Maryland saw the most significant movement in 2016
• MD: Substantial over-supply emerged with completion of several 10-20 MW projects in 2015-2016
• DC: Acute undersupply due to in-district requirements and limited market footprint
• MA: Price movements bounded by clearinghouse floor and SACP
• NJ: Generally well-balanced market• DE, PA, OH heavily oversupplied, in part due to eligibility of
out-of-state projects• NH: Low solar ACP ($55/MWh)
31
Sources: Marex Spectron, SRECTrade, Flett Exchange. Depending on the source used, plotted values are either the mid-point of monthly average bid and offer prices or the average monthly closing price, and generally refer to prices for the current or nearest future compliance year traded in each month.
SREC pricing is highly state-specific due to de facto in-state requirements in most states and varying ACPs
$0
$100
$200
$300
$400
$500
$600
$700
$800
2010 2011 2012 2013 2014 2015 2016 2017
Solar Renewable Energy Certificates (SRECs)DC DE MA (I) MA (II) MDNH NJ OH PA
$/M
Wh
Table of Contents
• Evolution of state RPS programs• Historical impacts on renewables development• Future RPS demand and incremental needs• RPS target achievement to-date • REC pricing trends• RPS compliance costs and cost caps• Outlook
32
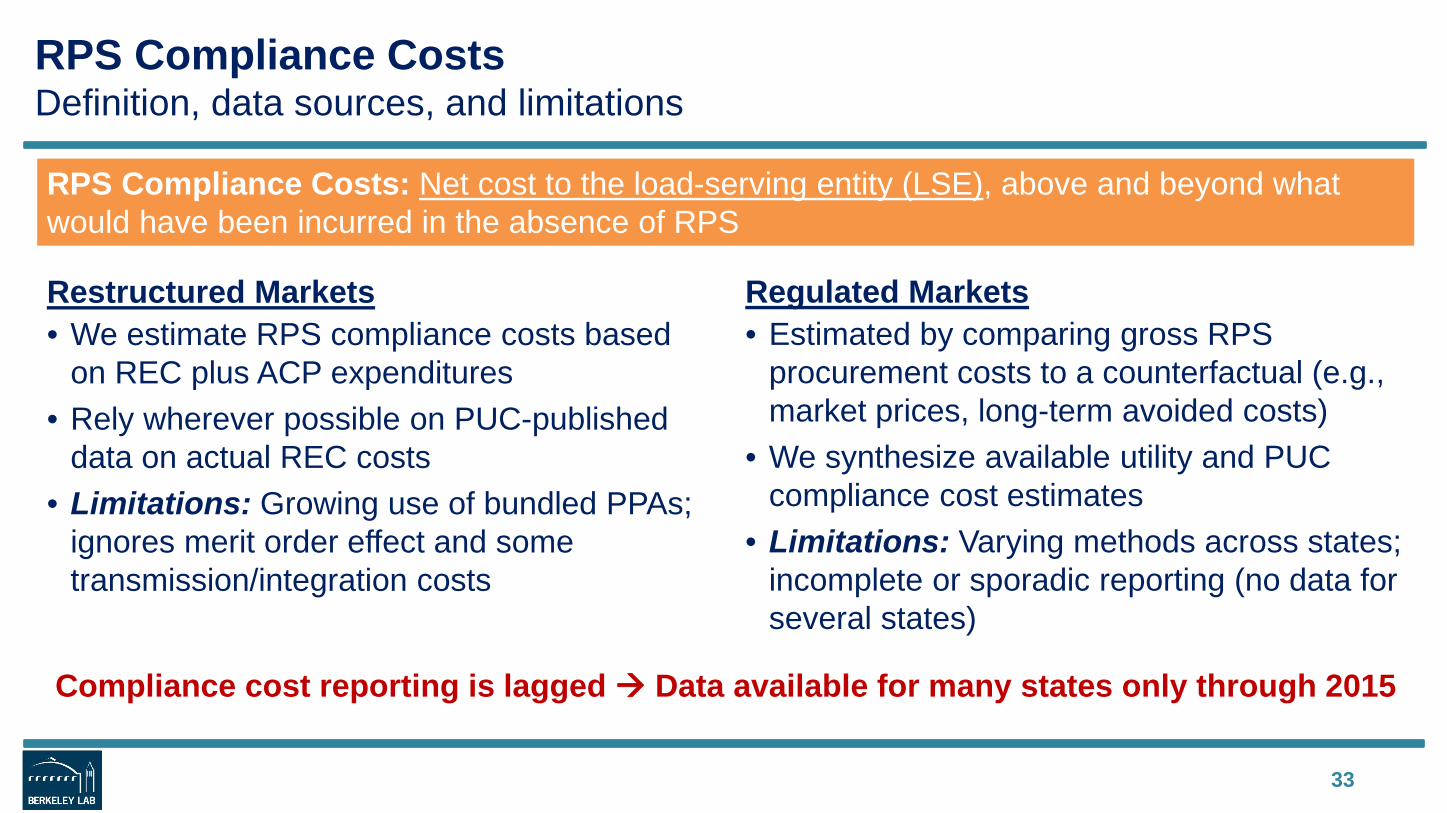
RPS Compliance CostsDefinition, data sources, and limitations
33
RPS Compliance Costs: Net cost to the load-serving entity (LSE), above and beyond what would have been incurred in the absence of RPS
Restructured Markets• We estimate RPS compliance costs based
on REC plus ACP expenditures• Rely wherever possible on PUC-published
data on actual REC costs• Limitations: Growing use of bundled PPAs;
ignores merit order effect and some transmission/integration costs
Regulated Markets• Estimated by comparing gross RPS
procurement costs to a counterfactual (e.g., market prices, long-term avoided costs)
• We synthesize available utility and PUC compliance cost estimates
• Limitations: Varying methods across states; incomplete or sporadic reporting (no data for several states)
Compliance cost reporting is lagged Data available for many states only through 2015
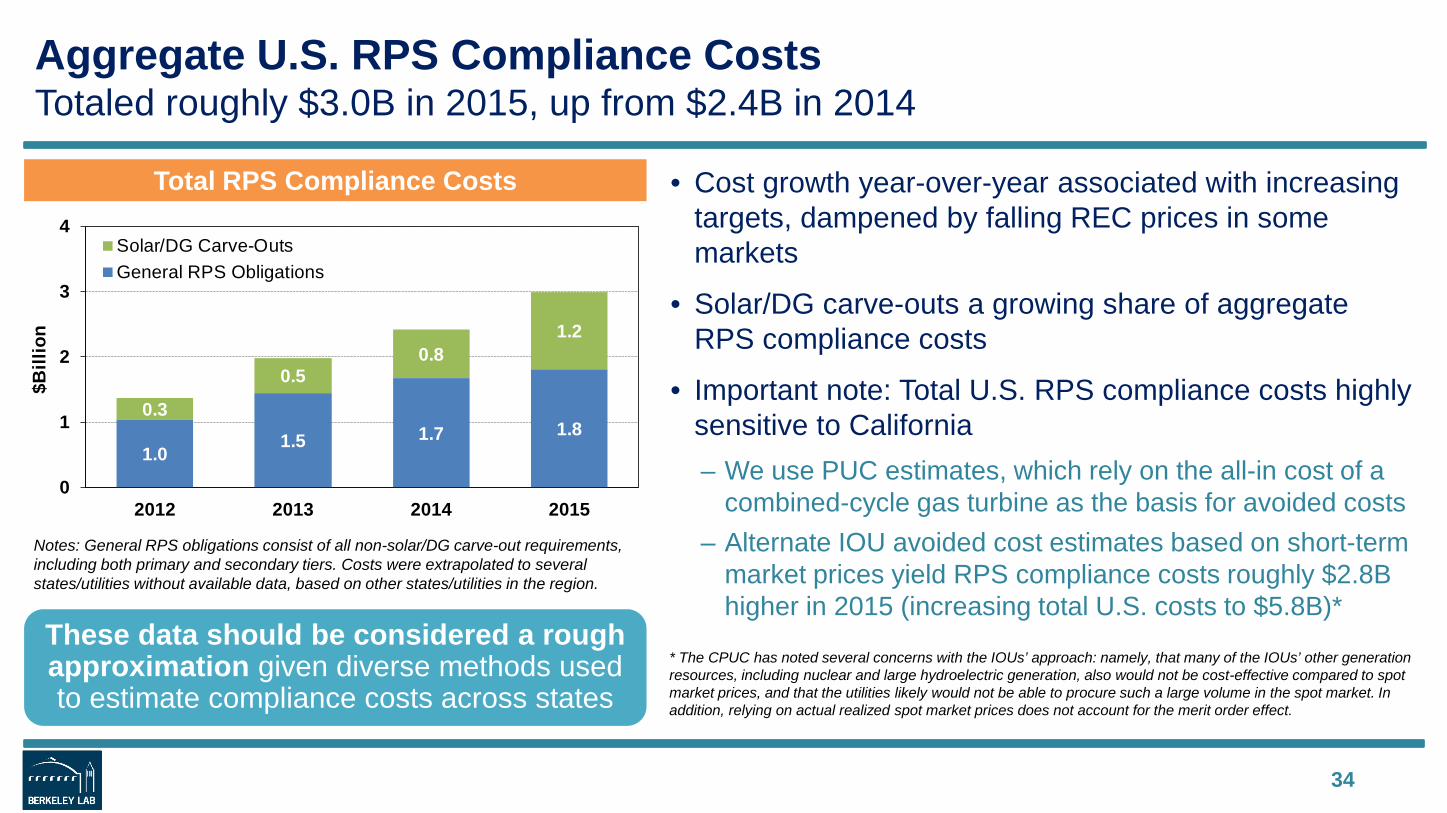
Aggregate U.S. RPS Compliance CostsTotaled roughly $3.0B in 2015, up from $2.4B in 2014
• Cost growth year-over-year associated with increasing targets, dampened by falling REC prices in some markets
• Solar/DG carve-outs a growing share of aggregate RPS compliance costs
• Important note: Total U.S. RPS compliance costs highly sensitive to California– We use PUC estimates, which rely on the all-in cost of a
combined-cycle gas turbine as the basis for avoided costs– Alternate IOU avoided cost estimates based on short-term
market prices yield RPS compliance costs roughly $2.8B higher in 2015 (increasing total U.S. costs to $5.8B)*
34
Total RPS Compliance Costs
These data should be considered a rough approximation given diverse methods used to estimate compliance costs across states
Notes: General RPS obligations consist of all non-solar/DG carve-out requirements, including both primary and secondary tiers. Costs were extrapolated to several states/utilities without available data, based on other states/utilities in the region.
* The CPUC has noted several concerns with the IOUs’ approach: namely, that many of the IOUs’ other generation resources, including nuclear and large hydroelectric generation, also would not be cost-effective compared to spot market prices, and that the utilities likely would not be able to procure such a large volume in the spot market. In addition, relying on actual realized spot market prices does not account for the merit order effect.
1.01.5 1.7 1.8
0.3
0.50.8
1.2
0
1
2
3
4
2012 2013 2014 2015
$Bill
ion
Solar/DG Carve-OutsGeneral RPS Obligations
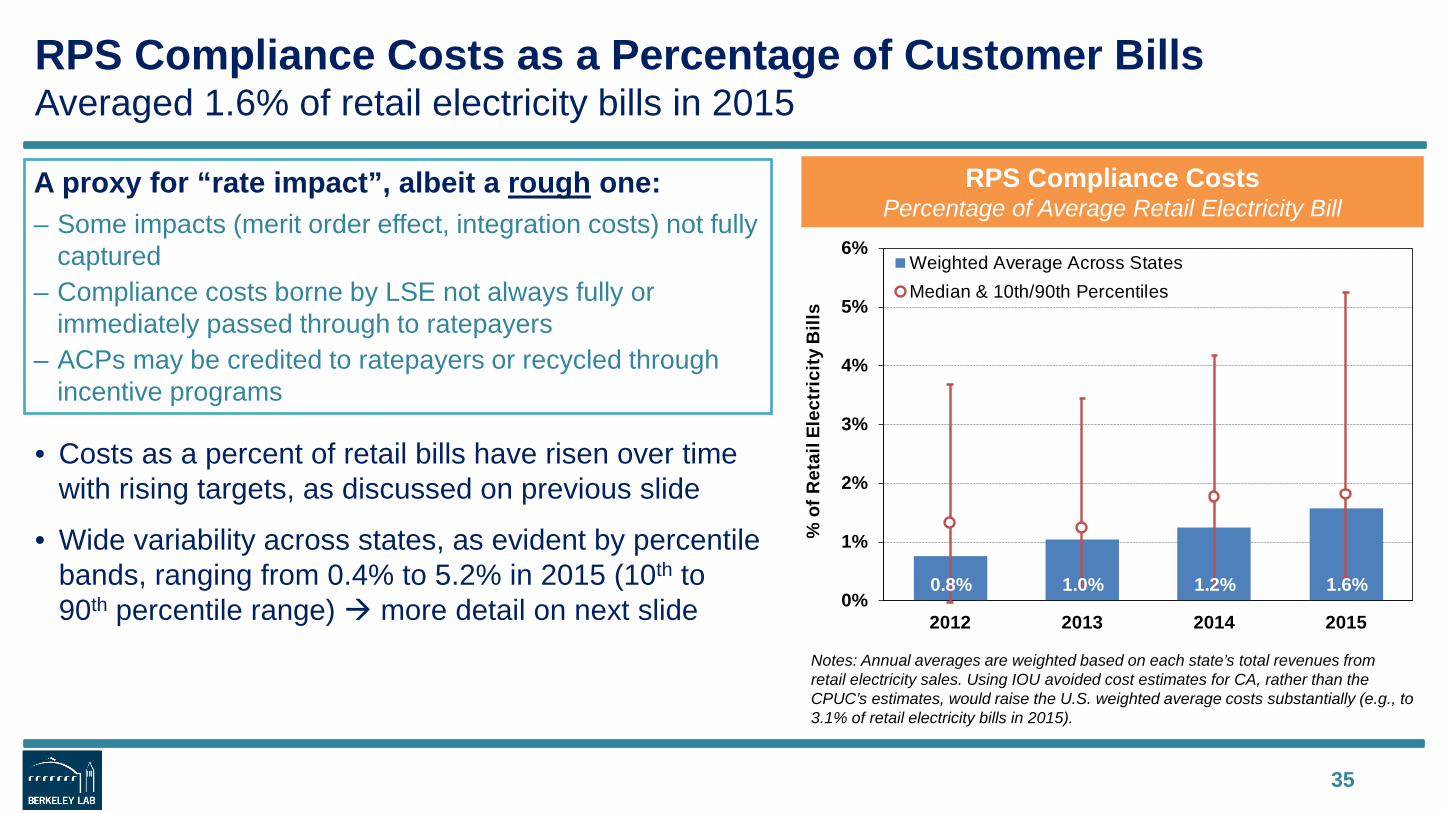
RPS Compliance Costs as a Percentage of Customer BillsAveraged 1.6% of retail electricity bills in 2015
• Costs as a percent of retail bills have risen over time with rising targets, as discussed on previous slide
• Wide variability across states, as evident by percentile bands, ranging from 0.4% to 5.2% in 2015 (10th to 90th percentile range) more detail on next slide
35
RPS Compliance CostsPercentage of Average Retail Electricity Bill
Notes: Annual averages are weighted based on each state’s total revenues from retail electricity sales. Using IOU avoided cost estimates for CA, rather than the CPUC’s estimates, would raise the U.S. weighted average costs substantially (e.g., to 3.1% of retail electricity bills in 2015).
A proxy for “rate impact”, albeit a rough one: – Some impacts (merit order effect, integration costs) not fully
captured – Compliance costs borne by LSE not always fully or
immediately passed through to ratepayers– ACPs may be credited to ratepayers or recycled through
incentive programs
0.8% 1.0% 1.2% 1.6%0%
1%
2%
3%
4%
5%
6%
2012 2013 2014 2015
Weighted Average Across StatesMedian & 10th/90th Percentiles
% o
f Ret
ail E
lect
ricity
Bill
s
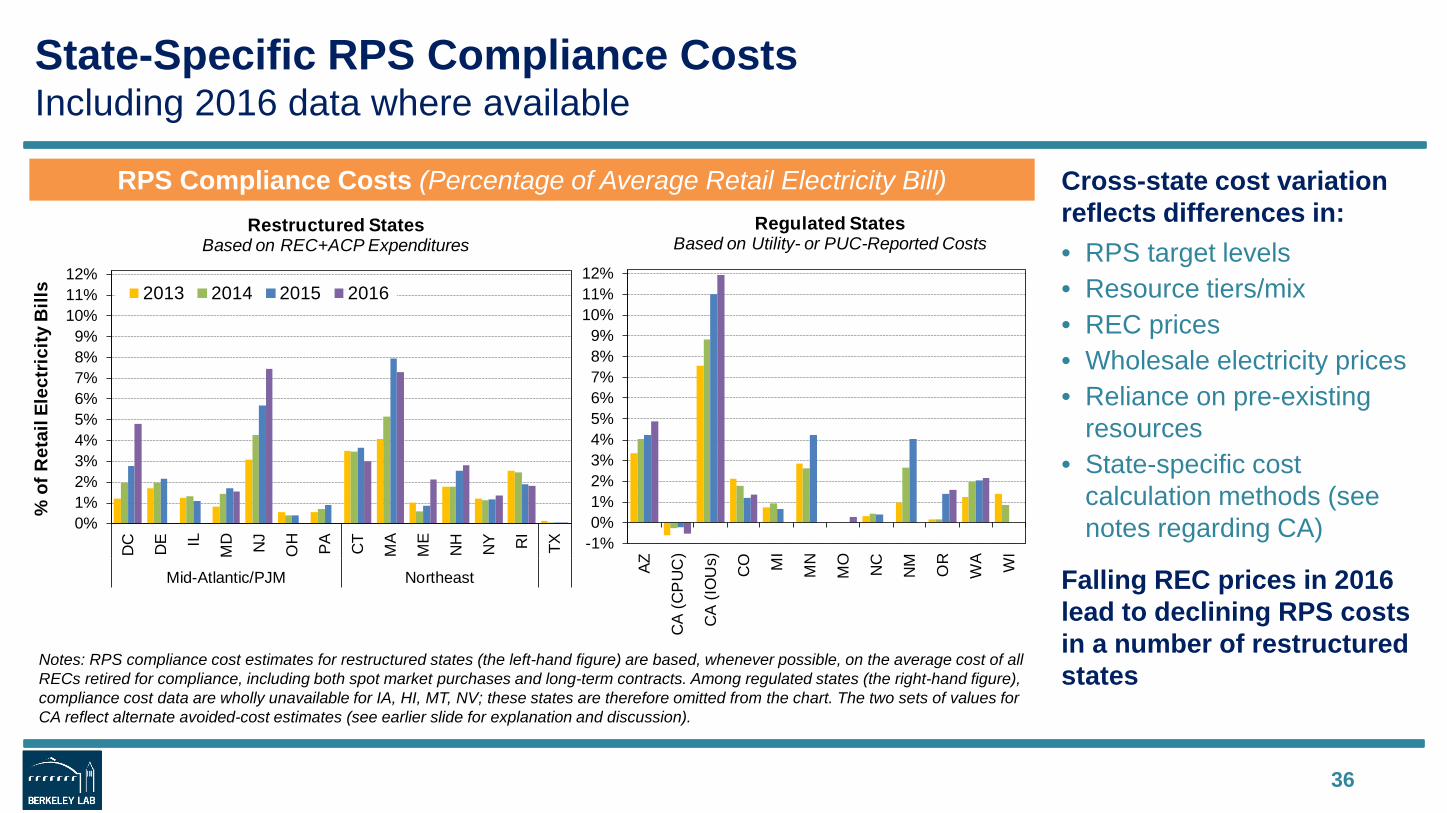
State-Specific RPS Compliance CostsIncluding 2016 data where available
36
RPS Compliance Costs (Percentage of Average Retail Electricity Bill) Cross-state cost variation reflects differences in: • RPS target levels• Resource tiers/mix• REC prices• Wholesale electricity prices• Reliance on pre-existing
resources• State-specific cost
calculation methods (see notes regarding CA)
Falling REC prices in 2016 lead to declining RPS costs in a number of restructured states
Notes: RPS compliance cost estimates for restructured states (the left-hand figure) are based, whenever possible, on the average cost of all RECs retired for compliance, including both spot market purchases and long-term contracts. Among regulated states (the right-hand figure), compliance cost data are wholly unavailable for IA, HI, MT, NV; these states are therefore omitted from the chart. The two sets of values for CA reflect alternate avoided-cost estimates (see earlier slide for explanation and discussion).
0%1%2%3%4%5%6%7%8%9%
10%11%12%
DC DE IL
MD NJ
OH PA CT
MA
ME
NH NY RI
TXMid-Atlantic/PJM Northeast
2013 2014 2015 2016
% o
f Ret
ail E
lect
ricity
Bill
s
Restructured States Based on REC+ACP Expenditures
Regulated StatesBased on Utility- or PUC-Reported Costs
-1%0%1%2%3%4%5%6%7%8%9%
10%11%12%
AZ
CA
(CP
UC
)
CA
(IO
Us)
CO MI
MN
MO
NC
NM OR
WA WI
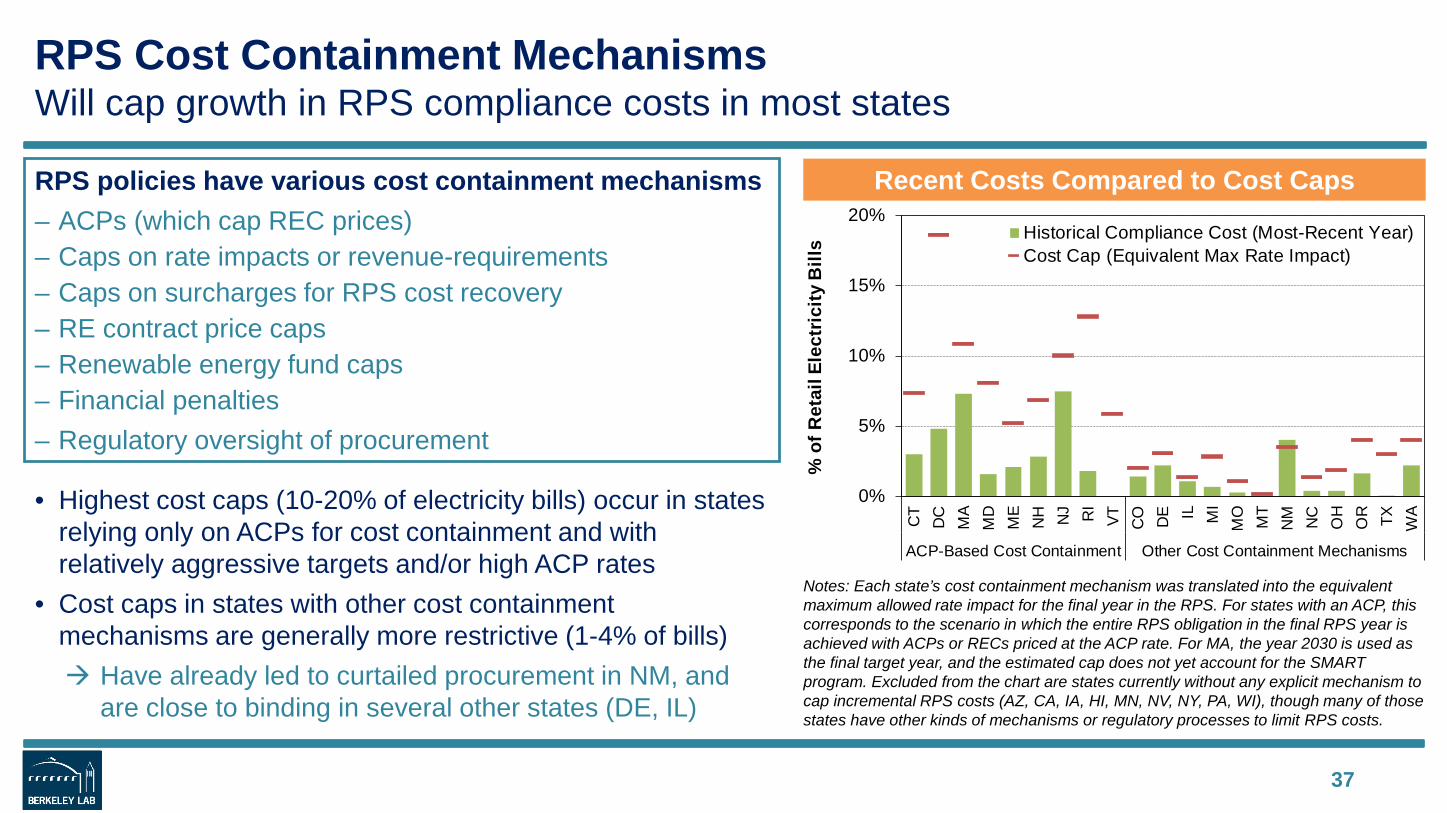
RPS Cost Containment MechanismsWill cap growth in RPS compliance costs in most states
37
• Highest cost caps (10-20% of electricity bills) occur in states relying only on ACPs for cost containment and with relatively aggressive targets and/or high ACP rates
• Cost caps in states with other cost containment mechanisms are generally more restrictive (1-4% of bills) Have already led to curtailed procurement in NM, and
are close to binding in several other states (DE, IL)
Notes: Each state’s cost containment mechanism was translated into the equivalent maximum allowed rate impact for the final year in the RPS. For states with an ACP, this corresponds to the scenario in which the entire RPS obligation in the final RPS year is achieved with ACPs or RECs priced at the ACP rate. For MA, the year 2030 is used as the final target year, and the estimated cap does not yet account for the SMART program. Excluded from the chart are states currently without any explicit mechanism to cap incremental RPS costs (AZ, CA, IA, HI, MN, NV, NY, PA, WI), though many of those states have other kinds of mechanisms or regulatory processes to limit RPS costs.
Recent Costs Compared to Cost CapsRPS policies have various cost containment mechanisms– ACPs (which cap REC prices)– Caps on rate impacts or revenue-requirements– Caps on surcharges for RPS cost recovery– RE contract price caps– Renewable energy fund caps– Financial penalties– Regulatory oversight of procurement
0%
5%
10%
15%
20%
CT
DC
MA
MD
ME
NH NJ RI
VT CO DE IL MI
MO
MT
NM NC
OH
OR TX WA
ACP-Based Cost Containment Other Cost Containment Mechanisms
Historical Compliance Cost (Most-Recent Year)Cost Cap (Equivalent Max Rate Impact)
% o
f Ret
ailE
lect
ricity
Bill
s
Table of Contents
• Evolution of state RPS programs• Historical impacts on renewables development• Future RPS demand and incremental needs• RPS target achievement to-date • REC pricing trends• RPS compliance costs and cost caps• Outlook
38
The Future Role & Impact of State RPS Programs Will Depend On…
RPS compliance costs and ACPs/cost caps Legislative and legal challenges to state RPS programs, including possible
federal pre-emption Whether additional states decide to increase and extend RPS targets as they
approach their final target year Other ongoing refinements (e.g., REC banking rules, long-term contracting
programs, eligibility rules, etc.) The many related issues affecting RE deployment (integration, transmission,
siting, net metering, etc.)
39
For Further Information
RPS reports, presentations, data files, resourcesrps.lbl.gov
All renewable energy publicationsemp.lbl.gov/reports/re
Follow the Electricity Markets & Policy Group on Twitter @BerkeleyLabEMP
Contact information:Galen Barbose, [email protected], 510-495-2593
40
AcknowledgementsThis analysis was funded by the Office of Electricity Delivery and Energy Reliability (Transmission Permitting & Technical Assistance Division) of the U.S. Department of Energy under Contract No. DE-AC02-05CH11231. We also thank the many state RPS administrators that graciously offered their time and assistance in providing and clarifying information contained in this report.