Embed Size (px)
Citation preview
1. IntroductionIn recent years, much attention has been devoted to natural substances, for example isoflavones, with antioxidant activity [1,2]. For many years, numerous major clinical studies have shown that isoflavones exert positive influence on health. The interest in isoflavones and their possible role in the prevention of diseases has mainly focused on the research on daidzein and genistein, the principal isoflavones of soy. Many dietary supplements are commercially available in order to provide the proposed beneficial health effects of isoflavones without changing the original diet [3].
Isoflavones have been separated and detected in different ways in the past. It has been shown that gas chromatography with mass spectrometric detection (GC-MS) is a highly sensitive method for determination of isoflavones [4,5]. The most commonly used separation technique is reversed phase-high performance liquid chromatography (RP-HPLC), where isoflavones can be determined without derivatization as aglycones or
glycosides, using the mixtures of methanol or acetonitrile and acidic solutions or buffers as a mobile phase. HPLC with various types of detectors, for example diode array (DAD) or ultraviolet (UV), is the most common method used for determination of isoflavone in biological fluids [6-11]. However, better sensitivity and selectivity can be obtained by means of mass spectrometry (MS or MS/MS) [12-18], amperometric [19], or coulometric electrode array detection [20]. In addition, capillary electrophoresis (CE) has also been used for the analysis of isoflavones [21], likewise an immuno-analytical method [22,23].
In this paper, the subject of study was the separation of five isoflavones (puerarin, genistein, daidzein, glycitin and biochanin A) by HPLC-DAD, whose determination in biological fluids has not been described so far. In our two works we described methods for the determination of isoflavones with other compounds (drugs and flavonoids) with using the Ultra HPLC-UV techniques without prior optimization [24,25].
Central European Journal of Chemistry
* E-mail: [email protected]
1Department of Analytical Chemistry, Chemical Faculty, Silesian University of Technology, 44-100, Gliwice, Poland
2Department of Clinical Physiology, University Hospital, SE-581 85 Linköping, Sweden
Irena Baranowska*1, Sylwia Magiera1, Jacek Baranowski2
Use of multivariate statistical techniques to optimize the separation of isoflavones
by liquid chromatographyShort Communication
Abstract:
© Versita Sp. z o.o.
Received 5 April 2011; Accepted 17 July 2011
Keywords: Central composite design • Isoflavones • HPLC • Solid-phase extraction
The aim of this paper is to optimize and validate a high performance liquid chromatography (HPLC) method for separation and quantification of five isoflavones. A statistical central composite design was used to separate all peaks. These multivariate procedures were efficient in determining the optimal separation condition using resolution, capacity factor, asymmetry and number of theoretical plates.
The effective separation of the examined compounds was applied on a Develosil RP Aqueous AR 5 RP-30 column with a gradient mobile phase system and a DAD detector.
The isolation and preconcentration of the isoflavones from urine and plasma samples were conducted by means of the solid-phase extraction (SPE). For optimize SPE conditions various sorbents were tested. Furthermore, high recoveries and good relative standard deviations were obtained when the samples were passed through the Oasis HLB column. The developed method was validated and successfully applied for determination of isoflavones in urine and plasma.
Cent. Eur. J. Chem. • 9(6) • 2011 • 972-981DOI: 10.2478/s11532-011-0093-8
972
Experimental design, particularly response surface analysis, is a valuable tool for carrying out this type of study. This design is an increasingly popular tool for the optimization of analytical methods and was applied to HPLC and CE applications [26,27].
Optimization is usually applied to reduce the analysis time and efforts, without losing the resolution between the peaks originated by the analyte migration. Moreover, the need of simultaneously taking into account different aspects of the analysis calls for the use of multi-criteria optimization. In this work we present a simple, fast and inexpensive way to optimize chromatographic conditions. A central composite design and response surface analysis were applied to separate puerarin, genistein, daidzein, glycitin and biochanin A in human urine and plasma using HPLC-DAD. Additionally, the aim was to develop a general SPE procedure which allowed the extraction of each compound without the need for the development of separate and distinct methods.
2. Experimental procedure 2.1. Reagents, standard solution and quality control samplesThe isoflavones, genistein (GT), daidzein (DA), glycitin (GLY), puerarin (PUR), biochanin A (BIO) and kaempferol (KAM) (I.S.) (≥98% purity), β-Glucuronidase/sulfatase (crude solution from Helix pomatia, type HP-2, G7017) and ascorbic acid were purchased from Sigma Chemicals (St. Louis, MO, USA) and Aldrich Chemicals (Milwaukee, WI, USA). HPLC-grade acetonitrile, methanol, water, trifluoroacetic acid and sodium acetate buffer (pH 4.66) were purchased from Merck (Darmstadt, Germany). Analytical-grade methanol, acetone, acetonitrile, ethyl acetate, phosphate buffer (pH 2.4), hydrochloric acid and formic acid were purchased from POCh (Gliwice, Poland).
Blank human urine or plasma were obtined from the volunteers who have not eaten any products containig the analysed isoflavones for longer than two weeks. Additionaly, urine and plasma were obtained from patients being on a diet rich in isoflavones and orally-administrating tablets containing isoflavones. The anticoagulant agent, used during sample collection, was heprin. Human urine and plasma were stored at -18°C.
The appropriate amounts of isoflavones were separately weighed and dissolved in methanol to make stock solutions (1 mg mL-1) and stored in the dark at 4°C. A series of working solutions of these analytes were freshly prepared by diluting the mixed standard solution in 0.05% TFA:acetonitrile (80:20; v/v) to obtain the necessary multicomponent working solutions for
spiking the urine samples. Calibration standards were prepared by spiking isoflavone-free human urine with the working solutions. The stock solution of KAM as IS at concentration of 1 mg mL-1 in methanol was used to prepare the IS working solution.
To validate this method, three concentration levels of standard solutions containing isoflavones were used to prepare the quality control (QC) urine samples. Three quality control (QC) samples were prepared by adding the appropriate working standard solutions to isoflavone-free human urine. The concentrations of isoflavones were in range 0.09–0.18 μg mL-1, 0.60–1.20 μg mL-1 and 2.40–4.80 μg mL-1 in human urine to represent low, middle and high QC samples, respectively.
2.2. Chromatographic conditionsThe HPLC system (Merck Hitachi, Germany) was equipped with a model L-2130 pump, a model L-2455 DAD detector, and a degasser module. The isoflavones were separated on a Develosil RP Aqueous AR-5 RP-30 (250 × 4.6 mm, 5.8 μm) column, equipped with a pre-column Develosil RP Aqueous AR RP-30 (Nomura Chemical, LTD., Japan) by gradient elution using 0.05% trifluoroacetic acid (TFA) in water (solvent A) and acetonitrile (solvent B). The gradient profile was: 0–5.0 min, from 20% to 30% solvent B (flow rate 1.2 mL min−1); 7.0 min, 55% solvent B (flow rate 1.0 mL min−1); 8.5 min, 90% solvent B (flow rate 1.2 mL min−1); 10.5 min, 100% solvent B (flow rate 1.2 mL min−1) and 13 min; 20% solvent B (flow rate 1.2 mL min−1). The temperature of the column oven was set to 35°C and the injection volume was 20 μL. The detector wavelengths were set at 259 nm for GLY, 249 nm for DA and PUR, 261 nm for GT, BIO and 366 nm for KAM (IS).
2.3. Central compositie design (CCD) [28]The Central Composite Design (CCD) is composed of a 2n factorial design (cube levels), 2n so-called star point design (α-levels), and m replications of the center point (0 level). The number of required experiments N need for CCD can be calculated with Eq. 1:
N = 2n + 2n + m (1)
where: 2 – Number of levels per design variable n – Number of design variables
The quantity N of experiments for a CCD with three or more design variables is considerably smaller than for a 3n factorial design, due to the combination of the 2n design and the star point design. Fig. 1 shows a systematic graph of the CCD for two and three design variables. The replications of the center point (0 level)
I. Baranowska, S. Magiera, J. Baranowski
973
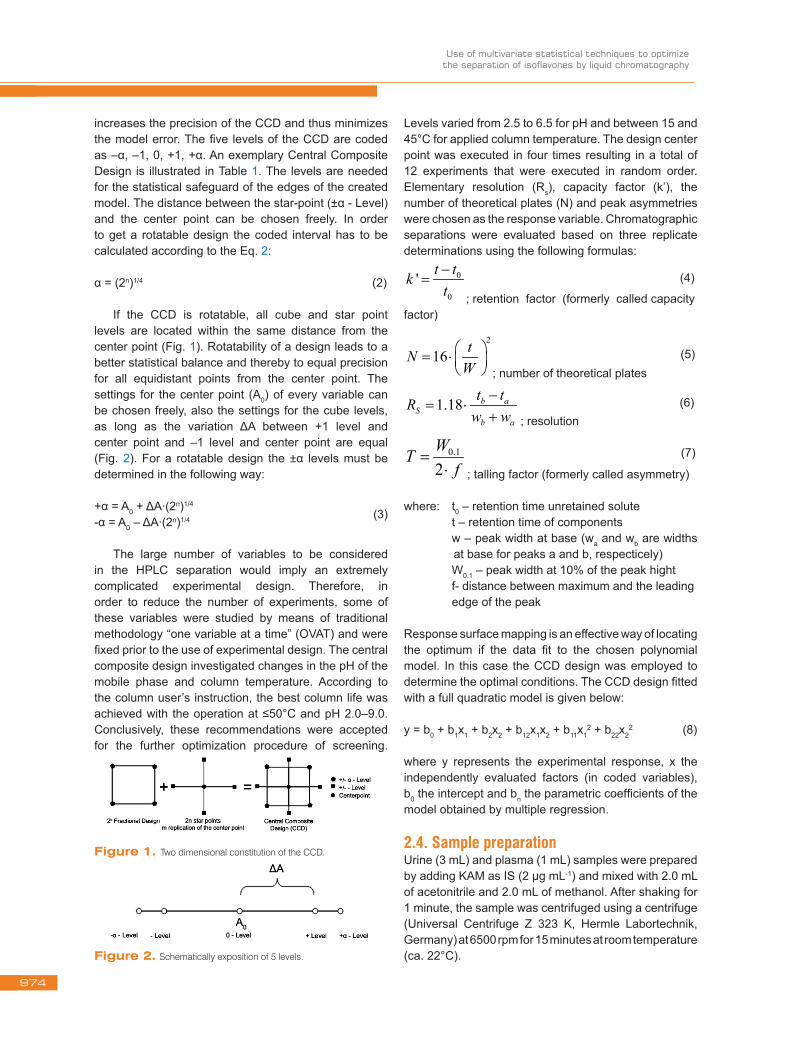
increases the precision of the CCD and thus minimizes the model error. The five levels of the CCD are coded as –α, –1, 0, +1, +α. An exemplary Central Composite Design is illustrated in Table 1. The levels are needed for the statistical safeguard of the edges of the created model. The distance between the star-point (±α - Level) and the center point can be chosen freely. In order to get a rotatable design the coded interval has to be calculated according to the Eq. 2:
α = (2n)1/4 (2)
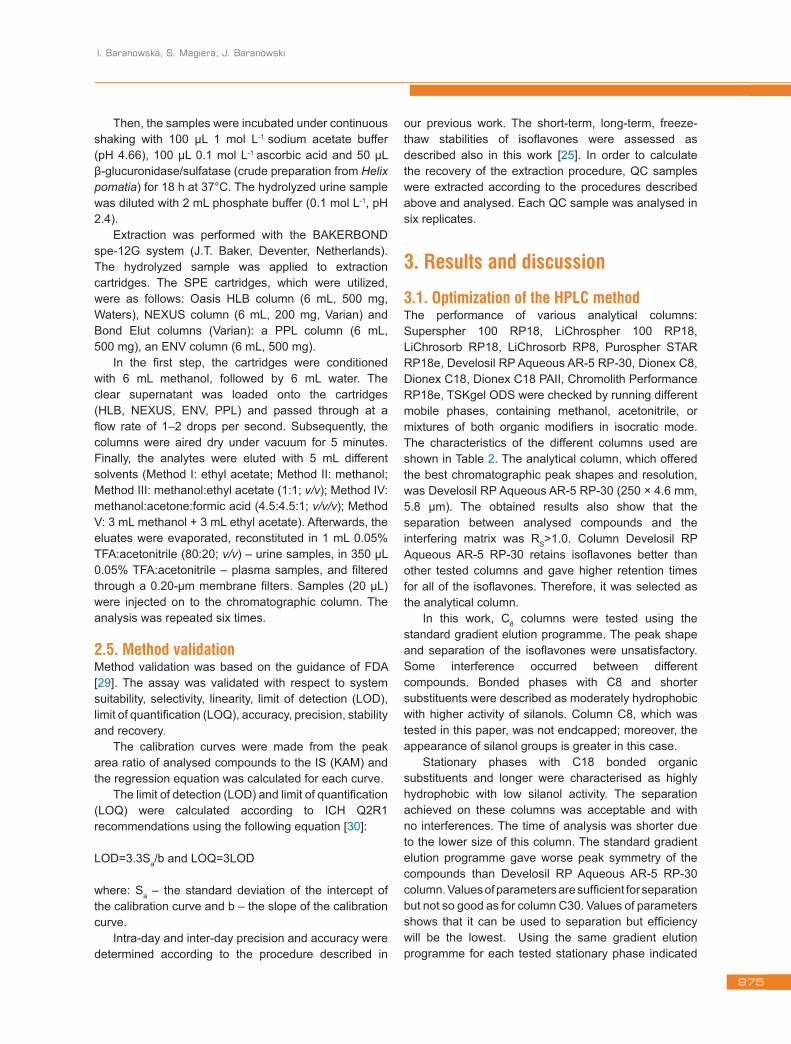
If the CCD is rotatable, all cube and star point levels are located within the same distance from the center point (Fig. 1). Rotatability of a design leads to a better statistical balance and thereby to equal precision for all equidistant points from the center point. The settings for the center point (A0) of every variable can be chosen freely, also the settings for the cube levels, as long as the variation ΔA between +1 level and center point and –1 level and center point are equal (Fig. 2). For a rotatable design the ±α levels must be determined in the following way:
+α = A0 + ΔA·(2n)1/4
-α = A0 – ΔA·(2n)1/4 (3)
The large number of variables to be considered in the HPLC separation would imply an extremely complicated experimental design. Therefore, in order to reduce the number of experiments, some of these variables were studied by means of traditional methodology “one variable at a time” (OVAT) and were fixed prior to the use of experimental design. The central composite design investigated changes in the pH of the mobile phase and column temperature. According to the column user’s instruction, the best column life was achieved with the operation at ≤50°C and pH 2.0–9.0. Conclusively, these recommendations were accepted for the further optimization procedure of screening.
Levels varied from 2.5 to 6.5 for pH and between 15 and 45°C for applied column temperature. The design center point was executed in four times resulting in a total of 12 experiments that were executed in random order. Elementary resolution (Rs), capacity factor (k’), the number of theoretical plates (N) and peak asymmetries were chosen as the response variable. Chromatographic separations were evaluated based on three replicate determinations using the following formulas:
0
0
' t tkt−
=; retention factor (formerly called capacity
factor)
2
16 tNW = ⋅ ; number of theoretical plates
1.18 b aS
b a
t tRw w
−= ⋅
+ ; resolution
0.1
2WT
f=
⋅ ; talling factor (formerly called asymmetry) where: t0 – retention time unretained solute t – retention time of components w – peak width at base (wa and wb are widths at base for peaks a and b, respecticely) W0.1 – peak width at 10% of the peak hight f- distance between maximum and the leading edge of the peak
Response surface mapping is an effective way of locating the optimum if the data fit to the chosen polynomial model. In this case the CCD design was employed to determine the optimal conditions. The CCD design fitted with a full quadratic model is given below:
y = b0 + b1x1 + b2x2 + b12x1x2 + b11x12 + b22x2
2 (8)
where y represents the experimental response, x the independently evaluated factors (in coded variables), b0 the intercept and bn the parametric coefficients of the model obtained by multiple regression.
2.4. Sample preparationUrine (3 mL) and plasma (1 mL) samples were prepared by adding KAM as IS (2 μg mL-1) and mixed with 2.0 mL of acetonitrile and 2.0 mL of methanol. After shaking for 1 minute, the sample was centrifuged using a centrifuge (Universal Centrifuge Z 323 K, Hermle Labortechnik, Germany) at 6500 rpm for 15 minutes at room temperature (ca. 22°C).
(4)
(5)
(6)
(7)
Figure 1. Two dimensional constitution of the CCD.
Figure 2. Schematically exposition of 5 levels.
Use of multivariate statistical techniques to optimize the separation of isoflavones by liquid chromatography
974
Then, the samples were incubated under continuous shaking with 100 μL 1 mol L-1 sodium acetate buffer (pH 4.66), 100 μL 0.1 mol L-1 ascorbic acid and 50 μL β-glucuronidase/sulfatase (crude preparation from Helix pomatia) for 18 h at 37°C. The hydrolyzed urine sample was diluted with 2 mL phosphate buffer (0.1 mol L-1, pH 2.4).
Extraction was performed with the BAKERBOND spe-12G system (J.T. Baker, Deventer, Netherlands). The hydrolyzed sample was applied to extraction cartridges. The SPE cartridges, which were utilized, were as follows: Oasis HLB column (6 mL, 500 mg, Waters), NEXUS column (6 mL, 200 mg, Varian) and Bond Elut columns (Varian): a PPL column (6 mL, 500 mg), an ENV column (6 mL, 500 mg).
In the first step, the cartridges were conditioned with 6 mL methanol, followed by 6 mL water. The clear supernatant was loaded onto the cartridges (HLB, NEXUS, ENV, PPL) and passed through at a flow rate of 1–2 drops per second. Subsequently, the columns were aired dry under vacuum for 5 minutes. Finally, the analytes were eluted with 5 mL different solvents (Method I: ethyl acetate; Method II: methanol; Method III: methanol:ethyl acetate (1:1; v/v); Method IV: methanol:acetone:formic acid (4.5:4.5:1; v/v/v); Method V: 3 mL methanol + 3 mL ethyl acetate). Afterwards, the eluates were evaporated, reconstituted in 1 mL 0.05% TFA:acetonitrile (80:20; v/v) – urine samples, in 350 μL 0.05% TFA:acetonitrile – plasma samples, and filtered through a 0.20-μm membrane filters. Samples (20 μL) were injected on to the chromatographic column. The analysis was repeated six times.
2.5. Method validationMethod validation was based on the guidance of FDA [29]. The assay was validated with respect to system suitability, selectivity, linearity, limit of detection (LOD), limit of quantification (LOQ), accuracy, precision, stability and recovery.
The calibration curves were made from the peak area ratio of analysed compounds to the IS (KAM) and the regression equation was calculated for each curve.
The limit of detection (LOD) and limit of quantification (LOQ) were calculated according to ICH Q2R1 recommendations using the following equation [30]:
LOD=3.3Sa/b and LOQ=3LOD where: Sa – the standard deviation of the intercept of the calibration curve and b – the slope of the calibration curve.
Intra-day and inter-day precision and accuracy were determined according to the procedure described in
our previous work. The short-term, long-term, freeze- thaw stabilities of isoflavones were assessed as described also in this work [25]. In order to calculate the recovery of the extraction procedure, QC samples were extracted according to the procedures described above and analysed. Each QC sample was analysed in six replicates.
3. Results and discussion
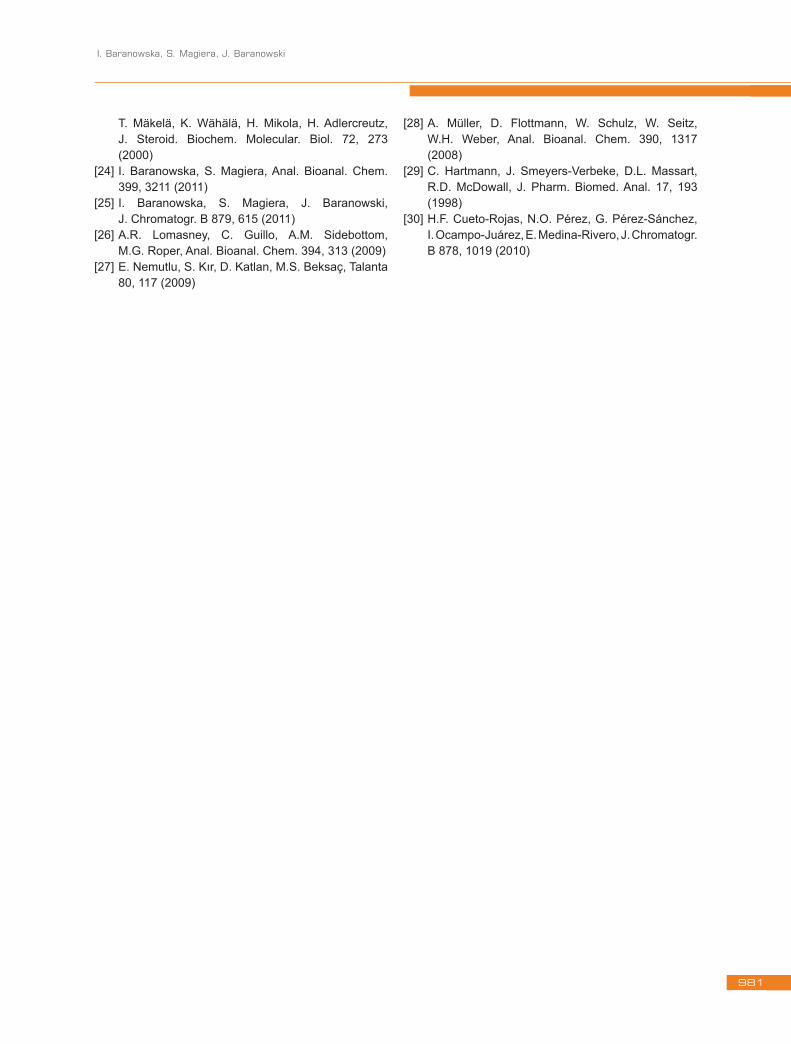
3.1. Optimization of the HPLC methodThe performance of various analytical columns: Superspher 100 RP18, LiChrospher 100 RP18, LiChrosorb RP18, LiChrosorb RP8, Purospher STAR RP18e, Develosil RP Aqueous AR-5 RP-30, Dionex C8, Dionex C18, Dionex C18 PAII, Chromolith Performance RP18e, TSKgel ODS were checked by running different mobile phases, containing methanol, acetonitrile, or mixtures of both organic modifiers in isocratic mode. The characteristics of the different columns used are shown in Table 2. The analytical column, which offered the best chromatographic peak shapes and resolution, was Develosil RP Aqueous AR-5 RP-30 (250 × 4.6 mm, 5.8 μm). The obtained results also show that the separation between analysed compounds and the interfering matrix was RS>1.0. Column Develosil RP Aqueous AR-5 RP-30 retains isoflavones better than other tested columns and gave higher retention times for all of the isoflavones. Therefore, it was selected as the analytical column.
In this work, C8 columns were tested using the standard gradient elution programme. The peak shape and separation of the isoflavones were unsatisfactory. Some interference occurred between different compounds. Bonded phases with C8 and shorter substituents were described as moderately hydrophobic with higher activity of silanols. Column C8, which was tested in this paper, was not endcapped; moreover, the appearance of silanol groups is greater in this case.
Stationary phases with C18 bonded organic substituents and longer were characterised as highly hydrophobic with low silanol activity. The separation achieved on these columns was acceptable and with no interferences. The time of analysis was shorter due to the lower size of this column. The standard gradient elution programme gave worse peak symmetry of the compounds than Develosil RP Aqueous AR-5 RP-30 column. Values of parameters are sufficient for separation but not so good as for column C30. Values of parameters shows that it can be used to separation but efficiency will be the lowest. Using the same gradient elution programme for each tested stationary phase indicated
I. Baranowska, S. Magiera, J. Baranowski
975
on the fact that different behaviour was registered for the analysed isoflavones. The mean capacity factor (k’), resolution (Rs), the number of theoretical plates (N) and asymmetry (As) are presented in Table 2.
Since the isoflavone exhibited a slight peak tail in all chromatographic conditions, an acid percentage was added to the mobile phase in order to optimize the peak shapes. Solutions of acetic acid, formic acid and trifluoroacetic acid (TFA) were tested on the separation of isoflavones. The better resolutions and peak shapes were obtained with TFA in water.
The effects of an organic modifier in the mobile phase were investigated by using the different percentages of a methanol, acetonitrile or methanol:acetonitrile mixture. Acetonitrile was chosen as an organic modifier since it provided sharper and higher chromatographic peaks than the ones obtained by using methanol or mixtures of both. Flow rate in range 1.0–1.2 mL min-1 was selected to investigate flow rate effects on the retention times and the resolutions of isoflavones.
The pH of the aqueous component of the mobile phase was excluded from this CCD because it was observed that pH mainly influences the time of the analysis. The best peak height, peak symmetry and resolution values for the isoflavones detection and separation were obtained using the lowest pH mobile phase. Increasing the pH from 2.5 to 6.5 had several negative effects on the separation. Using TFA in water at pH 6.0 increased the peak width, peak asymmetry, retention time and resolution. In addition, we observed a large decrease in the number of theoretical plates at pH 6.0. Therefore, further studies of the chromatographic conditions were made using 0.05% TFA in water, pH 2.0, as a one component of the mobile phase.
The effect of increasing the column temperature from 15°C to 45°C was evaluated. The best chromatographic separation we obtained by using 35°C as a column temperature. Temperatures lower than 35°C had a
negative effect on the separation and peak symmetry. Decreasing the temperature reduced the retention times that, in turn, further reduced the separation of the unresolved. By using the temperatures higher than 35°C increased the average peak width and peak asymmetry and decreased the selectivity and resolution.
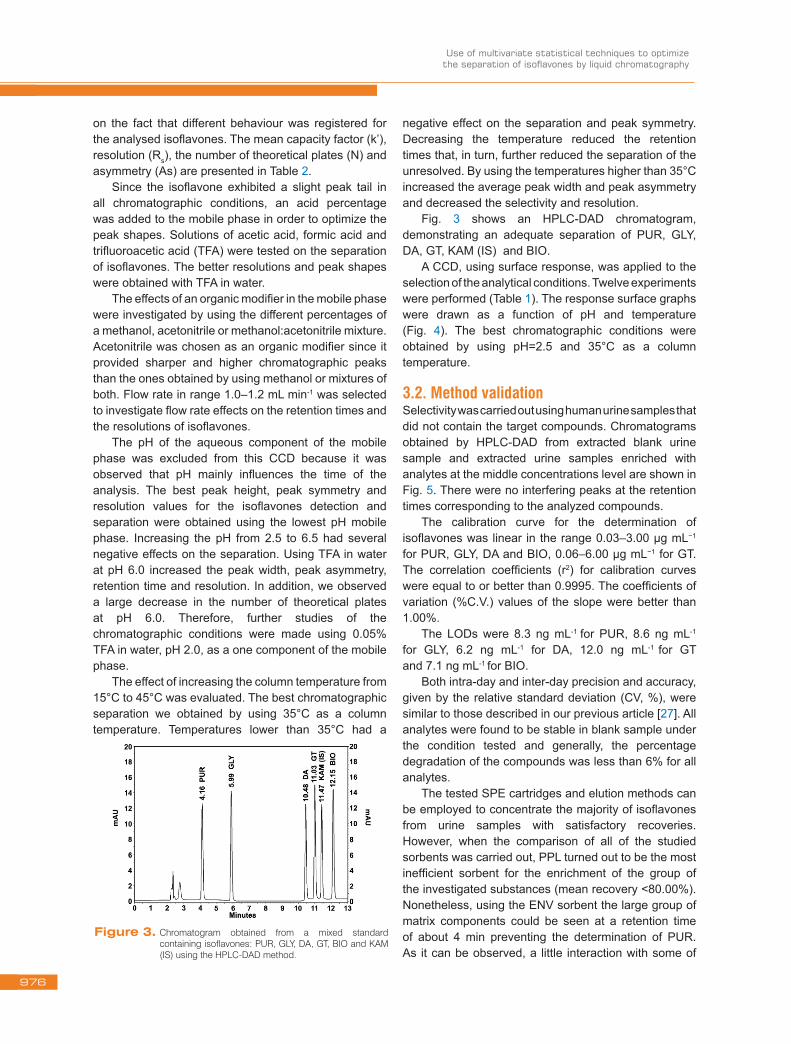
Fig. 3 shows an HPLC-DAD chromatogram, demonstrating an adequate separation of PUR, GLY, DA, GT, KAM (IS) and BIO.
A CCD, using surface response, was applied to the selection of the analytical conditions. Twelve experiments were performed (Table 1). The response surface graphs were drawn as a function of pH and temperature (Fig. 4). The best chromatographic conditions were obtained by using pH=2.5 and 35°C as a column temperature.
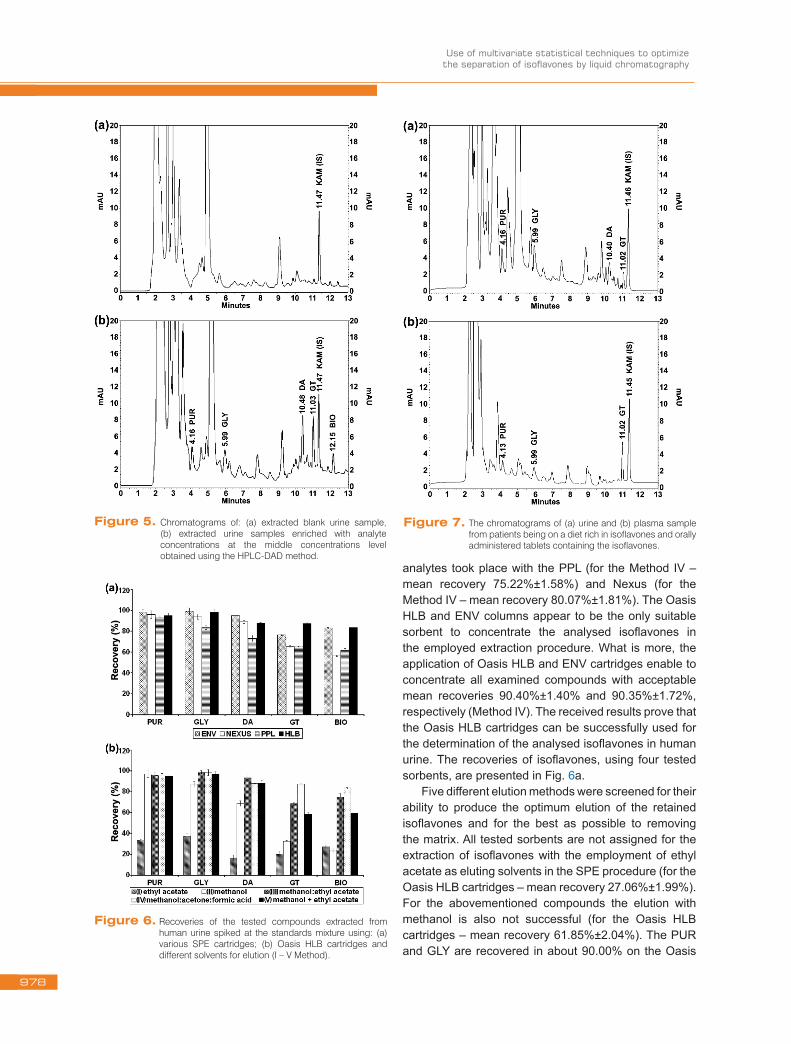
3.2. Method validationSelectivity was carried out using human urine samples that did not contain the target compounds. Chromatograms obtained by HPLC-DAD from extracted blank urine sample and extracted urine samples enriched with analytes at the middle concentrations level are shown in Fig. 5. There were no interfering peaks at the retention times corresponding to the analyzed compounds.
The calibration curve for the determination of isoflavones was linear in the range 0.03–3.00 µg mL−1 for PUR, GLY, DA and BIO, 0.06–6.00 µg mL−1 for GT. The correlation coefficients (r2) for calibration curves were equal to or better than 0.9995. The coefficients of variation (%C.V.) values of the slope were better than 1.00%.
The LODs were 8.3 ng mL-1 for PUR, 8.6 ng mL-1
for GLY, 6.2 ng mL-1 for DA, 12.0 ng mL-1 for GT and 7.1 ng mL-1 for BIO.
Both intra-day and inter-day precision and accuracy, given by the relative standard deviation (CV, %), were similar to those described in our previous article [27]. All analytes were found to be stable in blank sample under the condition tested and generally, the percentage degradation of the compounds was less than 6% for all analytes.
The tested SPE cartridges and elution methods can be employed to concentrate the majority of isoflavones from urine samples with satisfactory recoveries. However, when the comparison of all of the studied sorbents was carried out, PPL turned out to be the most inefficient sorbent for the enrichment of the group of the investigated substances (mean recovery <80.00%). Nonetheless, using the ENV sorbent the large group of matrix components could be seen at a retention time of about 4 min preventing the determination of PUR. As it can be observed, a little interaction with some of
Figure 3. Chromatogram obtained from a mixed standard containing isoflavones: PUR, GLY, DA, GT, BIO and KAM (IS) using the HPLC-DAD method.
Use of multivariate statistical techniques to optimize the separation of isoflavones by liquid chromatography
976
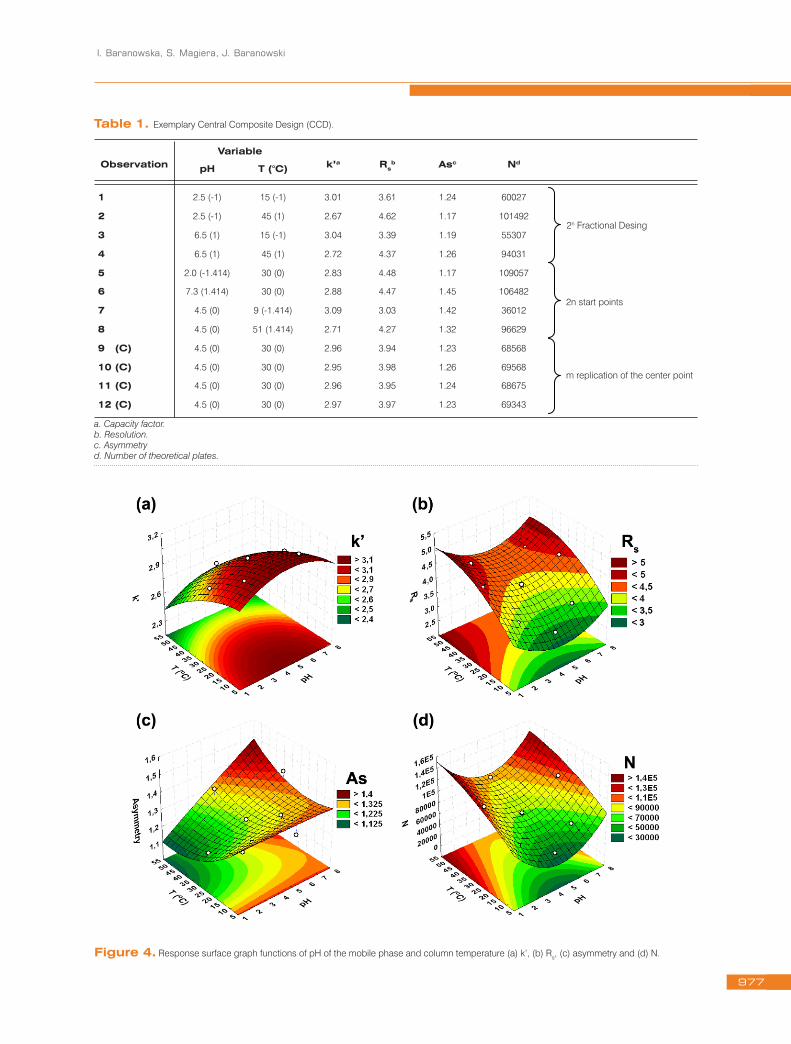
Table 1. Exemplary Central Composite Design (CCD).
ObservationVariable
k’a Rsb Asc Nd
pH T (°C)
1 2.5 (-1) 15 (-1) 3.01 3.61 1.24 60027
2 2.5 (-1) 45 (1) 2.67 4.62 1.17 101492
3 6.5 (1) 15 (-1) 3.04 3.39 1.19 55307
4 6.5 (1) 45 (1) 2.72 4.37 1.26 94031
5 2.0 (-1.414) 30 (0) 2.83 4.48 1.17 109057
6 7.3 (1.414) 30 (0) 2.88 4.47 1.45 106482
7 4.5 (0) 9 (-1.414) 3.09 3.03 1.42 36012
8 4.5 (0) 51 (1.414) 2.71 4.27 1.32 96629
9 (C) 4.5 (0) 30 (0) 2.96 3.94 1.23 68568
10 (C) 4.5 (0) 30 (0) 2.95 3.98 1.26 69568
11 (C) 4.5 (0) 30 (0) 2.96 3.95 1.24 68675
12 (C) 4.5 (0) 30 (0) 2.97 3.97 1.23 69343
a. Capacity factor. b. Resolution. c. Asymmetry d. Number of theoretical plates.
2n Fractional Desing
2n start points
m replication of the center point
Figure 4. Response surface graph functions of pH of the mobile phase and column temperature (a) k’, (b) Rs, (c) asymmetry and (d) N.
I. Baranowska, S. Magiera, J. Baranowski
977
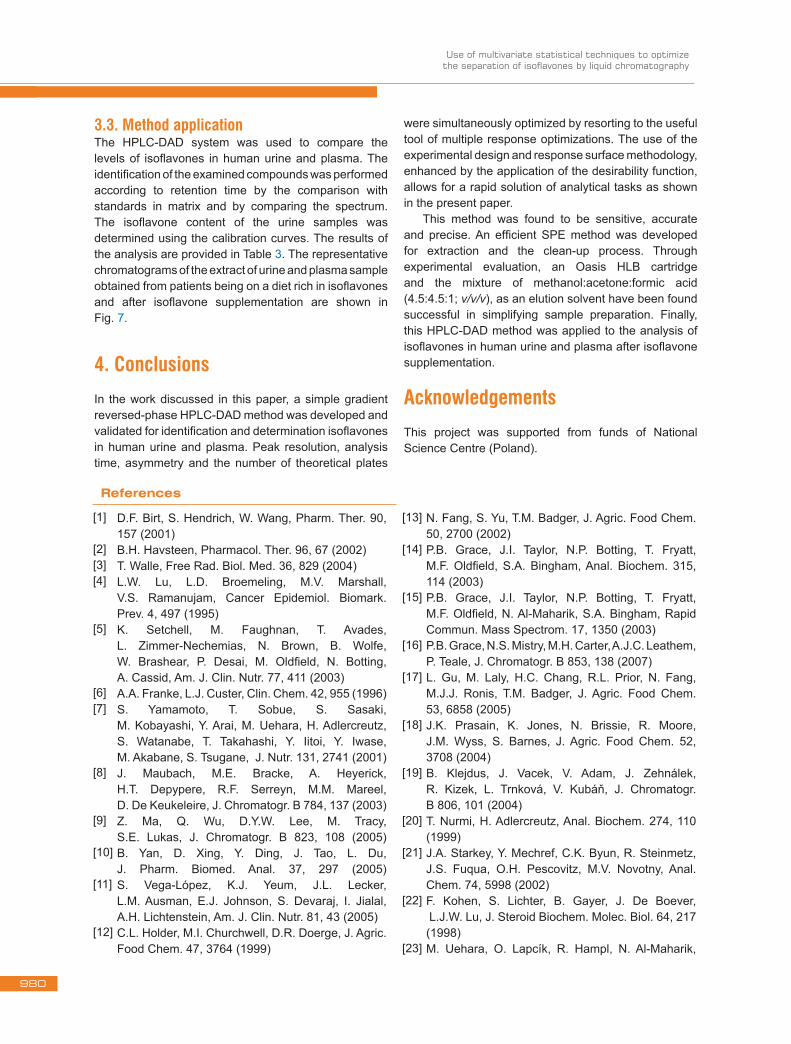
analytes took place with the PPL (for the Method IV – mean recovery 75.22%±1.58%) and Nexus (for the Method IV – mean recovery 80.07%±1.81%). The Oasis HLB and ENV columns appear to be the only suitable sorbent to concentrate the analysed isoflavones in the employed extraction procedure. What is more, the application of Oasis HLB and ENV cartridges enable to concentrate all examined compounds with acceptable mean recoveries 90.40%±1.40% and 90.35%±1.72%, respectively (Method IV). The received results prove that the Oasis HLB cartridges can be successfully used for the determination of the analysed isoflavones in human urine. The recoveries of isoflavones, using four tested sorbents, are presented in Fig. 6a.
Five different elution methods were screened for their ability to produce the optimum elution of the retained isoflavones and for the best as possible to removing the matrix. All tested sorbents are not assigned for the extraction of isoflavones with the employment of ethyl acetate as eluting solvents in the SPE procedure (for the Oasis HLB cartridges – mean recovery 27.06%±1.99%). For the abovementioned compounds the elution with methanol is also not successful (for the Oasis HLB cartridges – mean recovery 61.85%±2.04%). The PUR and GLY are recovered in about 90.00% on the Oasis
Figure 5. Chromatograms of: (a) extracted blank urine sample, (b) extracted urine samples enriched with analyte concentrations at the middle concentrations level obtained using the HPLC-DAD method.
Figure 6. Recoveries of the tested compounds extracted from human urine spiked at the standards mixture using: (a) various SPE cartridges; (b) Oasis HLB cartridges and different solvents for elution (I – V Method).
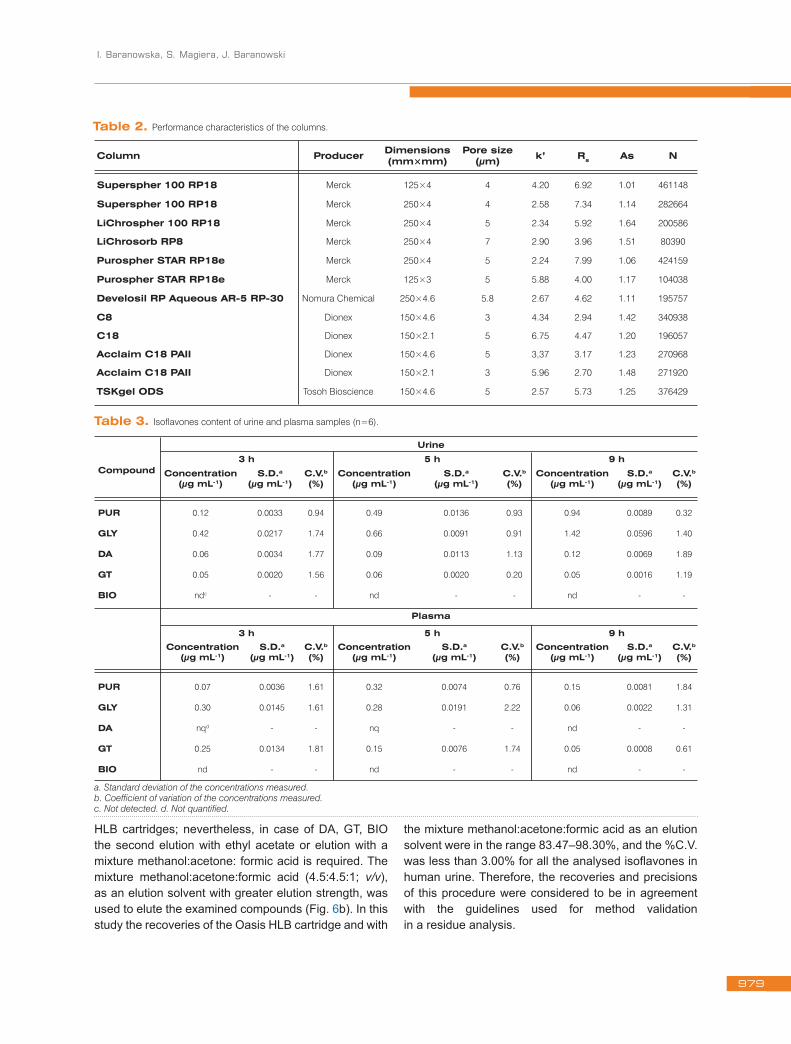
Figure 7. The chromatograms of (a) urine and (b) plasma sample from patients being on a diet rich in isoflavones and orally administered tablets containing the isoflavones.
Use of multivariate statistical techniques to optimize the separation of isoflavones by liquid chromatography
978
HLB cartridges; nevertheless, in case of DA, GT, BIO the second elution with ethyl acetate or elution with a mixture methanol:acetone: formic acid is required. The mixture methanol:acetone:formic acid (4.5:4.5:1; v/v), as an elution solvent with greater elution strength, was used to elute the examined compounds (Fig. 6b). In this study the recoveries of the Oasis HLB cartridge and with
the mixture methanol:acetone:formic acid as an elution solvent were in the range 83.47–98.30%, and the %C.V. was less than 3.00% for all the analysed isoflavones in human urine. Therefore, the recoveries and precisions of this procedure were considered to be in agreement with the guidelines used for method validationin a residue analysis.
Table 2. Performance characteristics of the columns.
Column Producer Dimensions(mm×mm)
Pore size(μm) k’ Rs As N
Superspher 100 RP18 Merck 125×4 4 4.20 6.92 1.01 461148
Superspher 100 RP18 Merck 250×4 4 2.58 7.34 1.14 282664
LiChrospher 100 RP18 Merck 250×4 5 2.34 5.92 1.64 200586
LiChrosorb RP8 Merck 250×4 7 2.90 3.96 1.51 80390
Purospher STAR RP18e Merck 250×4 5 2.24 7.99 1.06 424159
Purospher STAR RP18e Merck 125×3 5 5.88 4.00 1.17 104038
Develosil RP Aqueous AR‑5 RP‑30 Nomura Chemical 250×4.6 5.8 2.67 4.62 1.11 195757
C8 Dionex 150×4.6 3 4.34 2.94 1.42 340938
C18 Dionex 150×2.1 5 6.75 4.47 1.20 196057
Acclaim C18 PAII Dionex 150×4.6 5 3,37 3.17 1.23 270968
Acclaim C18 PAII Dionex 150×2.1 3 5.96 2.70 1.48 271920
TSKgel ODS Tosoh Bioscience 150×4.6 5 2.57 5.73 1.25 376429
Table 3. Isoflavones content of urine and plasma samples (n=6).
Compound
Urine
3 h 5 h 9 h
Concentration (μg mL‑1)
S.D.a
(μg mL‑1)C.V.b
(%)Concentration
(μg mL‑1)S.D.a
(μg mL‑1)C.V.b
(%)Concentration
(μg mL‑1)S.D.a
(μg mL‑1)C.V.b
(%)
PUR 0.12 0.0033 0.94 0.49 0.0136 0.93 0.94 0.0089 0.32
GLY 0.42 0.0217 1.74 0.66 0.0091 0.91 1.42 0.0596 1.40
DA 0.06 0.0034 1.77 0.09 0.0113 1.13 0.12 0.0069 1.89
GT 0.05 0.0020 1.56 0.06 0.0020 0.20 0.05 0.0016 1.19
BIO ndc - - nd - - nd - -
Plasma
3 h 5 h 9 h
Concentration (μg mL‑1)
S.D.a
(μg mL‑1)C.V.b
(%)Concentration
(μg mL‑1)S.D.a
(μg mL‑1)C.V.b
(%)Concentration
(μg mL‑1)S.D.a
(μg mL‑1)C.V.b
(%)
PUR 0.07 0.0036 1.61 0.32 0.0074 0.76 0.15 0.0081 1.84
GLY 0.30 0.0145 1.61 0.28 0.0191 2.22 0.06 0.0022 1.31
DA nqd - - nq - - nd - -
GT 0.25 0.0134 1.81 0.15 0.0076 1.74 0.05 0.0008 0.61
BIO nd - - nd - - nd - -
a. Standard deviation of the concentrations measured. b. Coefficient of variation of the concentrations measured. c. Not detected. d. Not quantified.
I. Baranowska, S. Magiera, J. Baranowski
979
3.3. Method applicationThe HPLC-DAD system was used to compare the levels of isoflavones in human urine and plasma. The identification of the examined compounds was performed according to retention time by the comparison with standards in matrix and by comparing the spectrum. The isoflavone content of the urine samples was determined using the calibration curves. The results of the analysis are provided in Table 3. The representative chromatograms of the extract of urine and plasma sample obtained from patients being on a diet rich in isoflavones and after isoflavone supplementation are shown in Fig. 7.
4. ConclusionsIn the work discussed in this paper, a simple gradient reversed-phase HPLC-DAD method was developed and validated for identification and determination isoflavones in human urine and plasma. Peak resolution, analysis time, asymmetry and the number of theoretical plates
were simultaneously optimized by resorting to the useful tool of multiple response optimizations. The use of the experimental design and response surface methodology, enhanced by the application of the desirability function, allows for a rapid solution of analytical tasks as shown in the present paper.
This method was found to be sensitive, accurate and precise. An efficient SPE method was developed for extraction and the clean-up process. Through experimental evaluation, an Oasis HLB cartridge and the mixture of methanol:acetone:formic acid (4.5:4.5:1; v/v/v), as an elution solvent have been found successful in simplifying sample preparation. Finally, this HPLC-DAD method was applied to the analysis of isoflavones in human urine and plasma after isoflavone supplementation.
Acknowledgements
This project was supported from funds of National Science Centre (Poland).
D.F. Birt, S. Hendrich, W. Wang, Pharm. Ther. 90, 157 (2001)B.H. Havsteen, Pharmacol. Ther. 96, 67 (2002)T. Walle, Free Rad. Biol. Med. 36, 829 (2004)L.W. Lu, L.D. Broemeling, M.V. Marshall, V.S. Ramanujam, Cancer Epidemiol. Biomark. Prev. 4, 497 (1995)K. Setchell, M. Faughnan, T. Avades, L. Zimmer-Nechemias, N. Brown, B. Wolfe, W. Brashear, P. Desai, M. Oldfield, N. Botting, A. Cassid, Am. J. Clin. Nutr. 77, 411 (2003)A.A. Franke, L.J. Custer, Clin. Chem. 42, 955 (1996)S. Yamamoto, T. Sobue, S. Sasaki, M. Kobayashi, Y. Arai, M. Uehara, H. Adlercreutz, S. Watanabe, T. Takahashi, Y. Iitoi, Y. Iwase, M. Akabane, S. Tsugane, J. Nutr. 131, 2741 (2001)J. Maubach, M.E. Bracke, A. Heyerick, H.T. Depypere, R.F. Serreyn, M.M. Mareel, D. De Keukeleire, J. Chromatogr. B 784, 137 (2003)Z. Ma, Q. Wu, D.Y.W. Lee, M. Tracy, S.E. Lukas, J. Chromatogr. B 823, 108 (2005)B. Yan, D. Xing, Y. Ding, J. Tao, L. Du, J. Pharm. Biomed. Anal. 37, 297 (2005)S. Vega-López, K.J. Yeum, J.L. Lecker, L.M. Ausman, E.J. Johnson, S. Devaraj, I. Jialal, A.H. Lichtenstein, Am. J. Clin. Nutr. 81, 43 (2005)C.L. Holder, M.I. Churchwell, D.R. Doerge, J. Agric. Food Chem. 47, 3764 (1999)
N. Fang, S. Yu, T.M. Badger, J. Agric. Food Chem. 50, 2700 (2002)P.B. Grace, J.I. Taylor, N.P. Botting, T. Fryatt, M.F. Oldfield, S.A. Bingham, Anal. Biochem. 315, 114 (2003)P.B. Grace, J.I. Taylor, N.P. Botting, T. Fryatt, M.F. Oldfield, N. Al-Maharik, S.A. Bingham, Rapid Commun. Mass Spectrom. 17, 1350 (2003)P.B. Grace, N.S. Mistry, M.H. Carter, A.J.C. Leathem, P. Teale, J. Chromatogr. B 853, 138 (2007)L. Gu, M. Laly, H.C. Chang, R.L. Prior, N. Fang, M.J.J. Ronis, T.M. Badger, J. Agric. Food Chem. 53, 6858 (2005)J.K. Prasain, K. Jones, N. Brissie, R. Moore, J.M. Wyss, S. Barnes, J. Agric. Food Chem. 52, 3708 (2004)B. Klejdus, J. Vacek, V. Adam, J. Zehnálek, R. Kizek, L. Trnková, V. Kubáň, J. Chromatogr. B 806, 101 (2004)T. Nurmi, H. Adlercreutz, Anal. Biochem. 274, 110 (1999)J.A. Starkey, Y. Mechref, C.K. Byun, R. Steinmetz, J.S. Fuqua, O.H. Pescovitz, M.V. Novotny, Anal. Chem. 74, 5998 (2002)F. Kohen, S. Lichter, B. Gayer, J. De Boever, L.J.W. Lu, J. Steroid Biochem. Molec. Biol. 64, 217 (1998)M. Uehara, O. Lapcík, R. Hampl, N. Al-Maharik,
References
[1]
[2][3][4]
[5]
[6][7]
[8]
[9]
[10]
[11]
[12]
[13]
[14]
[15]
[16]
[17]
[18]
[19]
[20]
[21]
[22]
[23]
Use of multivariate statistical techniques to optimize the separation of isoflavones by liquid chromatography
980
T. Mäkelä, K. Wähälä, H. Mikola, H. Adlercreutz, J. Steroid. Biochem. Molecular. Biol. 72, 273 (2000)I. Baranowska, S. Magiera, Anal. Bioanal. Chem. 399, 3211 (2011)I. Baranowska, S. Magiera, J. Baranowski, J. Chromatogr. B 879, 615 (2011) A.R. Lomasney, C. Guillo, A.M. Sidebottom, M.G. Roper, Anal. Bioanal. Chem. 394, 313 (2009)E. Nemutlu, S. Kır, D. Katlan, M.S. Beksaç, Talanta 80, 117 (2009)
A. Müller, D. Flottmann, W. Schulz, W. Seitz, W.H. Weber, Anal. Bioanal. Chem. 390, 1317 (2008)C. Hartmann, J. Smeyers-Verbeke, D.L. Massart, R.D. McDowall, J. Pharm. Biomed. Anal. 17, 193 (1998)H.F. Cueto-Rojas, N.O. Pérez, G. Pérez-Sánchez, I. Ocampo-Juárez, E. Medina-Rivero, J. Chromatogr. B 878, 1019 (2010)
[24]
[25]
[26]
[27]
[28]
[29]
[30]
I. Baranowska, S. Magiera, J. Baranowski
981981