Embed Size (px)
Citation preview
TANGIBLE RESULT #2
Use Resources Wisely
MDOT receives resources from our customers and they expect products and services in return. In order to better serve our customers, MDOT must maximize the value of every dollar we spend.
RESULT DRIVER:Corey Stottlemyer The Secretary’s Office (TSO)
13
Use Resources Wisely
TANGIBLE RESULT DRIVER:Corey Stottlemyer The Secretary’s Office (TSO)
PERFORMANCE MEASURE DRIVER:David Fleming The Secretary’s Office (TSO)
PURPOSE OF MEASURE:To track the efficiency of capital spending
FREQUENCY:Quarterly / Annually
DATA COLLECTION METHODOLOGY:Tracking capital project spending versus the Consolidated Transportation Plan appropriated funds
BENCHMARK:N/A
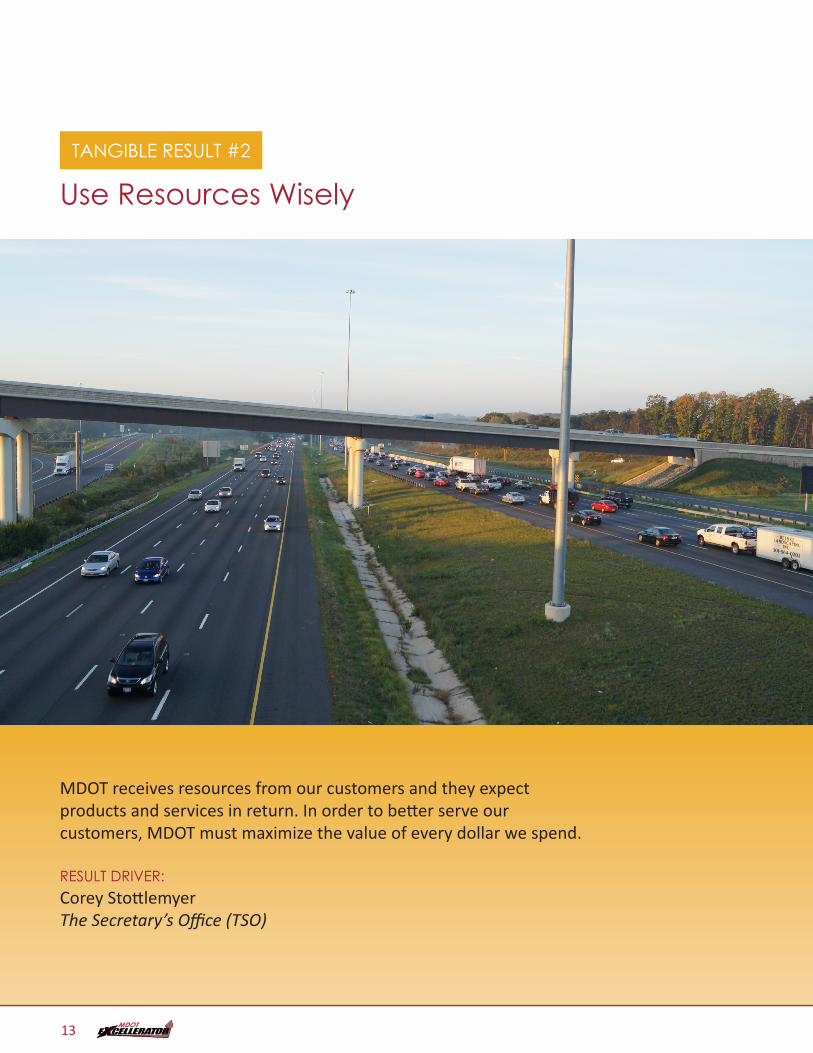
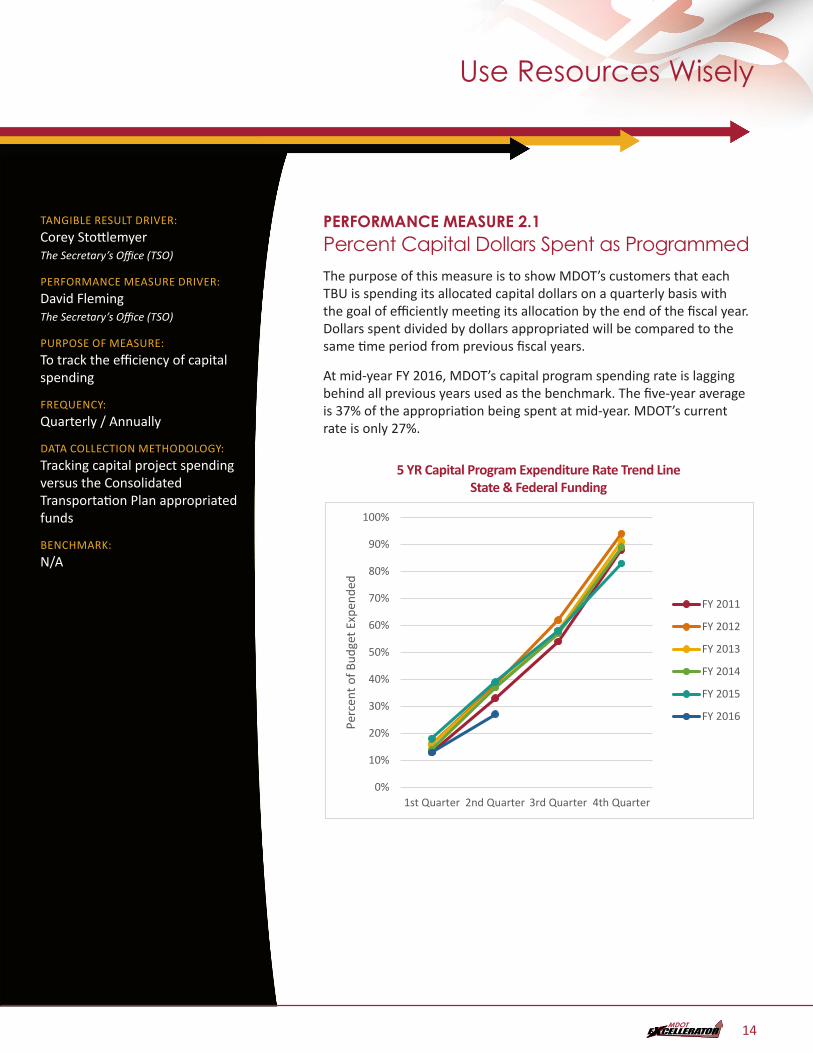
PERFORMANCE MEASURE 2.1Percent Capital Dollars Spent as ProgrammedThe purpose of this measure is to show MDOT’s customers that each TBU is spending its allocated capital dollars on a quarterly basis with the goal of efficiently meeting its allocation by the end of the fiscal year. Dollars spent divided by dollars appropriated will be compared to the same time period from previous fiscal years.
At mid-year FY 2016, MDOT’s capital program spending rate is lagging behind all previous years used as the benchmark. The five-year average is 37% of the appropriation being spent at mid-year. MDOT’s current rate is only 27%.
5 YR Capital Program Expenditure Rate Trend Line State & Federal FundingPM2.1 - 5 YR Capital Program Expenditure Rate Trend Line State & Federal Funding - DONE
0%
10%
20%
30%
40%
50%
60%
70%
80%
90%
100%
1st Quarter 2nd Quarter 3rd Quarter 4th Quarter
Perc
ent o
f Bud
get E
xpen
ded
FY 2011
FY 2012
FY 2013
FY 2014
FY 2015
FY 2016
14
PERFORMANCE MEASURE 2.1Percent Capital Dollars Spent as Programmed
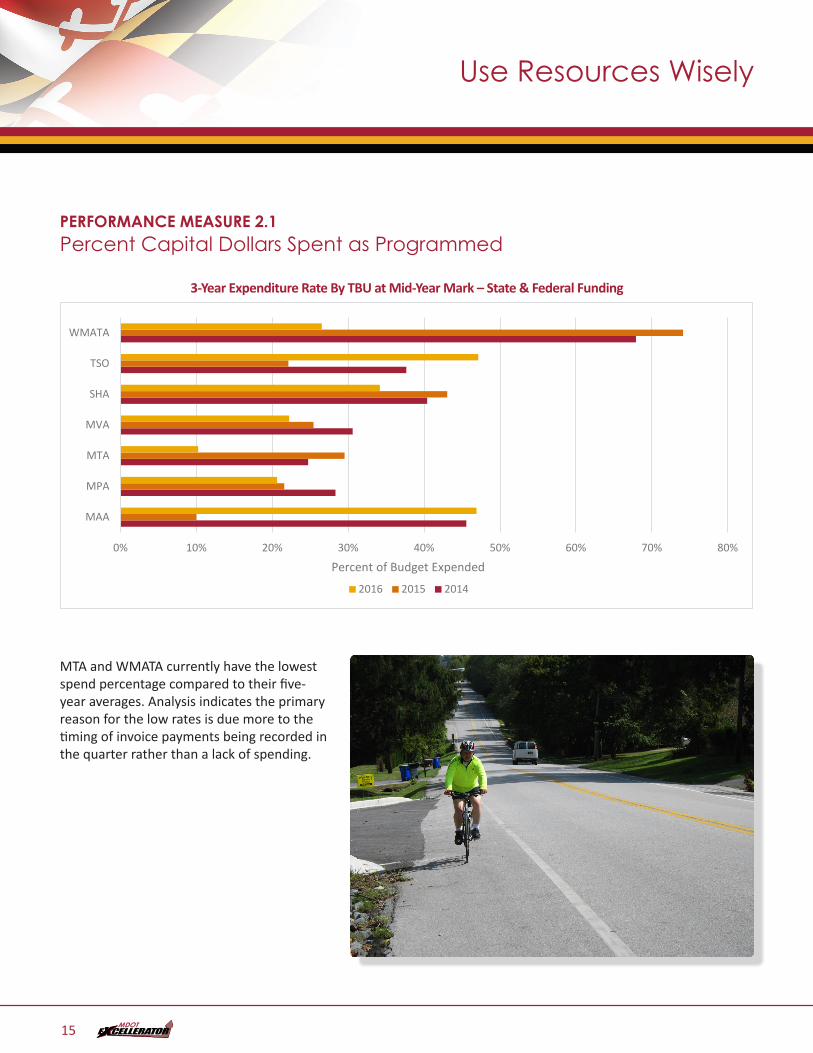
3-Year Expenditure Rate By TBU at Mid-Year Mark – State & Federal FundingPM2.1b
0% 10% 20% 30% 40% 50% 60% 70% 80%
MAA
MPA
MTA
MVA
SHA
TSO
WMATA
Percent of Budget Expended
2016 2015 2014
MTA and WMATA currently have the lowest spend percentage compared to their five-year averages. Analysis indicates the primary reason for the low rates is due more to the timing of invoice payments being recorded in the quarter rather than a lack of spending.
Use Resources Wisely
15
PERFORMANCE MEASURE 2.1Percent Capital Dollars Spent as Programmed
Use Resources Wisely
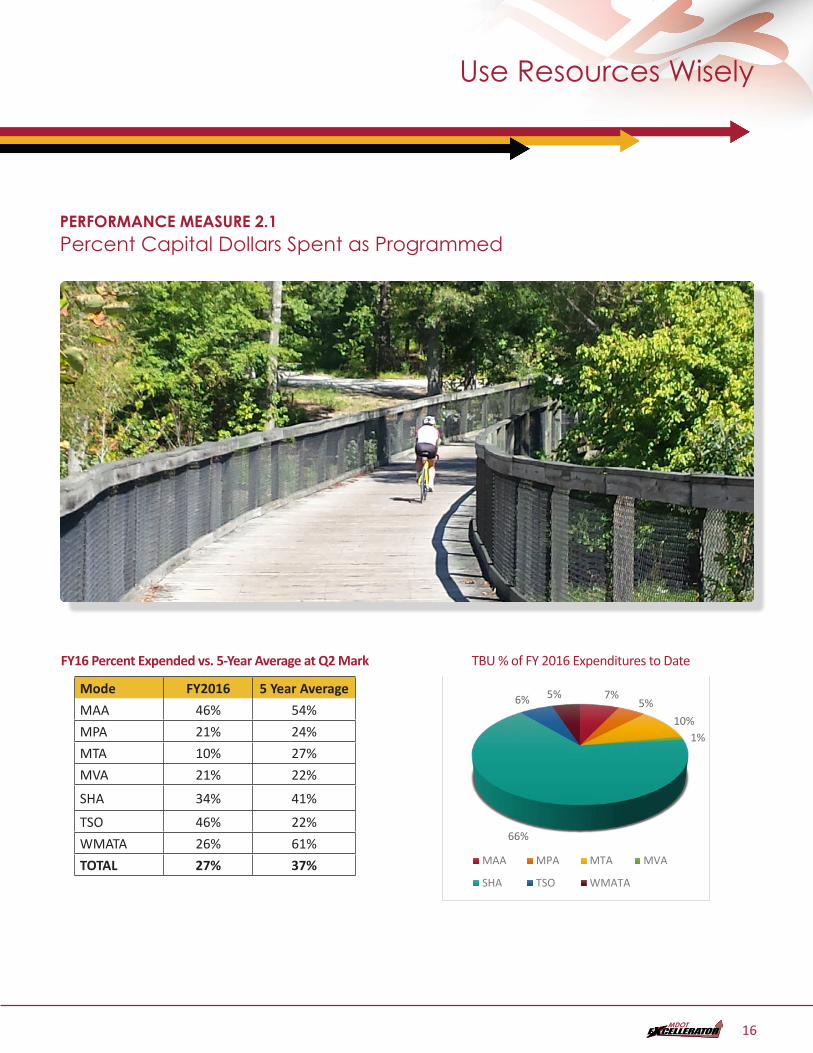
FY16 Percent Expended vs. 5-Year Average at Q2 Mark
Mode FY2016 5 Year AverageMAA 46% 54%MPA 21% 24%MTA 10% 27%MVA 21% 22%
SHA 34% 41%
TSO 46% 22%WMATA 26% 61%TOTAL 27% 37%
TBU % of FY 2016 Expenditures to DatePM2.1d - DONE
7%5%
10%1%
66%
6% 5%
MAA MPA MTA MVA
SHA TSO WMATA
16
TANGIBLE RESULT DRIVER:Corey Stottlemyer The Secretary’s Office (TSO)
PERFORMANCE MEASURE DRIVER:David Fleming The Secretary’s Office (TSO)
PURPOSE OF MEASURE:To measure the level of other sources utilized to fund capital projects
FREQUENCY:Annually
DATA COLLECTION METHODOLOGY:Track capital projects using 10% or more of other funds
BENCHMARK:N/A
PERFORMANCE MEASURE 2.2Percent of Projects Leveraging Other Funding SourcesThe purpose of this measure is to track and highlight opportunities to leverage Transportation Trust Fund (TTF) dollars with local and private dollars. Projects included under this measure involve at least 10%of the cost being covered by partners. Information will be presented in two values: percent of projects and percent of additional dollars contributed from partners.
FY 2016 – FY 2021 Consolidated Transportation Program Projects using 10% or more funds from other sources
As a Percentage of Projects
Number Projects % of ProjectsTotal Projects 1,389 100%Projects w/No Other Funding 1,328 96%
Projects w/Other Funding 61 4%
As a Percentage of Funding
Source Funding % of FundingTotal $15,817,983 100%State $9,647,987 61%Federal $4.956.488 31%Other $1,213,508 8%
Use Resources Wisely
17
Use Resources Wisely
18
Use Resources Wisely
TANGIBLE RESULT DRIVER:Corey Stottlemyer The Secretary’s Office (TSO)
PERFORMANCE MEASURE DRIVER:Amber Harvey Maryland Transportation Authority (MDTA)
PURPOSE OF MEASURE:To track the commitment of our employees in furthering MDOT’s reputation, mission and interests by identifying key motivators and obstacles in the workplace
FREQUENCY:Annually
DATA COLLECTION METHODOLOGY:Develop and implement one MDOT employee engagement survey administered to all employees. Online and hard copies will be made available. Cloud-based and mobile platforms are a consideration.
NATIONAL BENCHMARK:*GALLUP 2015 national engagement percentages:
32% Engaged employees
50.8% not engaged
17.2% actively disengaged
*International Public Management Association for Human Resources 2012 and 2014 data available
PERFORMANCE MEASURE 2.3Employee EngagementEngagement accounts for the emotional commitment an employee has for an organization and the amount of discretionary effort the employee expends on behalf of that organization. Engaged employees go beyond what they “have to do” to what they “want to do” for their employer.
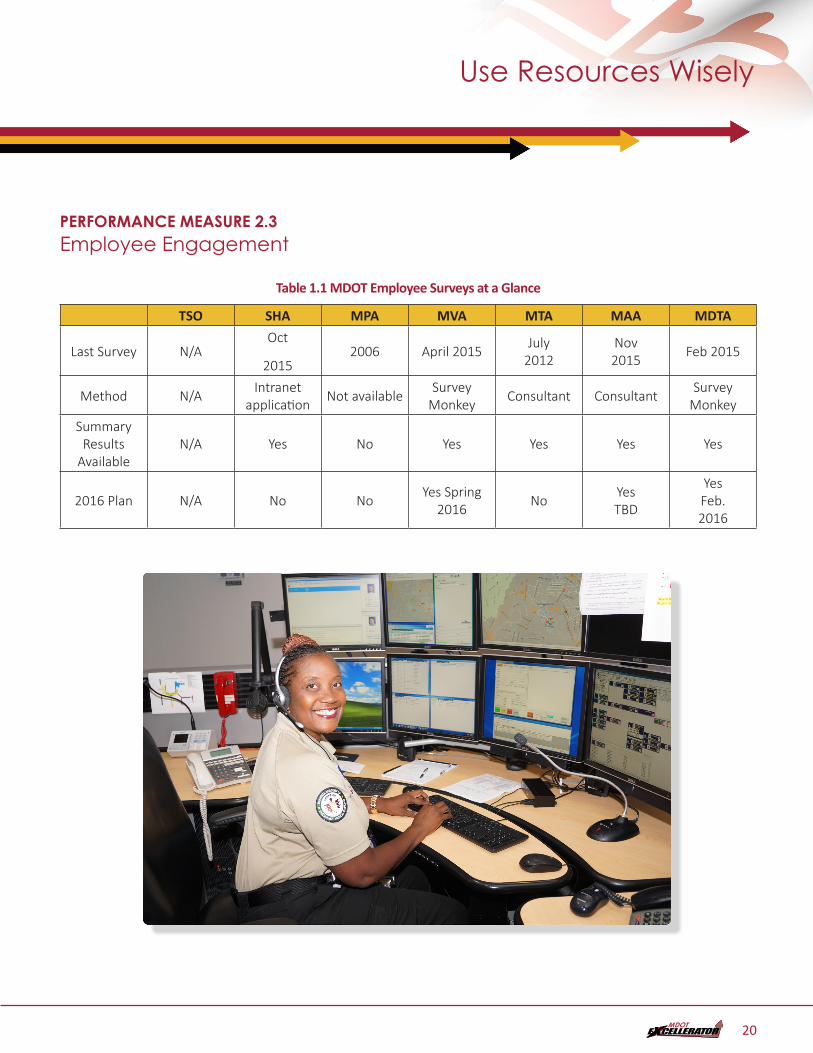
MDOT’s TBUs acknowledge the importance of employee engagement initiatives. Recent practices elicit workforce feedback through the use of employee surveys. Table 1.1 (MDOT Employee Surveys at a Glance) shows an overview of these efforts. Throughout the TBUs, fluctuations in staff and financial limitations in recent years have been noted as a source of hardship for employee engagement efforts.
Combining talent, effort and resources under one, comprehensive agency-wide survey would allow MDOT to ensure a systematic and consistent approach to employee engagement while avoiding overlaps and minimizing expense. By partnering with an outside entity to administer the survey, MDOT can:
• Ease employee concerns regarding anonymity;
• Provide survey access across multiple platforms and devices;
• Ensure all TBUs can actively monitor engagement activities with the same level of resources and effectiveness;
• Analyze results quickly with minimal impact to internal personnel resources, and;
• Focus internal staff on developing best practices and implementing new initiatives aimed at increasing employee satisfaction, productivity and retention.
19
Use Resources Wisely
PERFORMANCE MEASURE 2.3Employee Engagement
Table 1.1 MDOT Employee Surveys at a Glance
TSO SHA MPA MVA MTA MAA MDTA
Last Survey N/AOct
20152006 April 2015 July
2012Nov 2015 Feb 2015
Method N/A Intranet application Not available Survey
Monkey Consultant Consultant Survey Monkey
Summary Results
AvailableN/A Yes No Yes Yes Yes Yes
2016 Plan N/A No No Yes Spring 2016 No Yes
TBD
Yes Feb. 2016
20
TANGIBLE RESULT DRIVER:Corey Stottlemyer The Secretary’s Office (TSO)
PERFORMANCE MEASURE DRIVER:Amber Harvey Maryland Transportation Authority (MDTA)
PURPOSE OF MEASURE:To identify the percentage of employees who leave MDOT and analyze trends in voluntary and involuntary separations.
FREQUENCY:Quarterly
DATA COLLECTION METHODOLOGY:Quarterly reports of employee separations are provided by TSO HRIS Unit. These reports show the number of separations during a given period of time for each TBU broken down by all available separation codes (i.e. reasons).
NATIONAL BENCHMARK:U.S. Department of Labor (DOL) Bureau of Labor Statistics for U.S. state and Local Governments
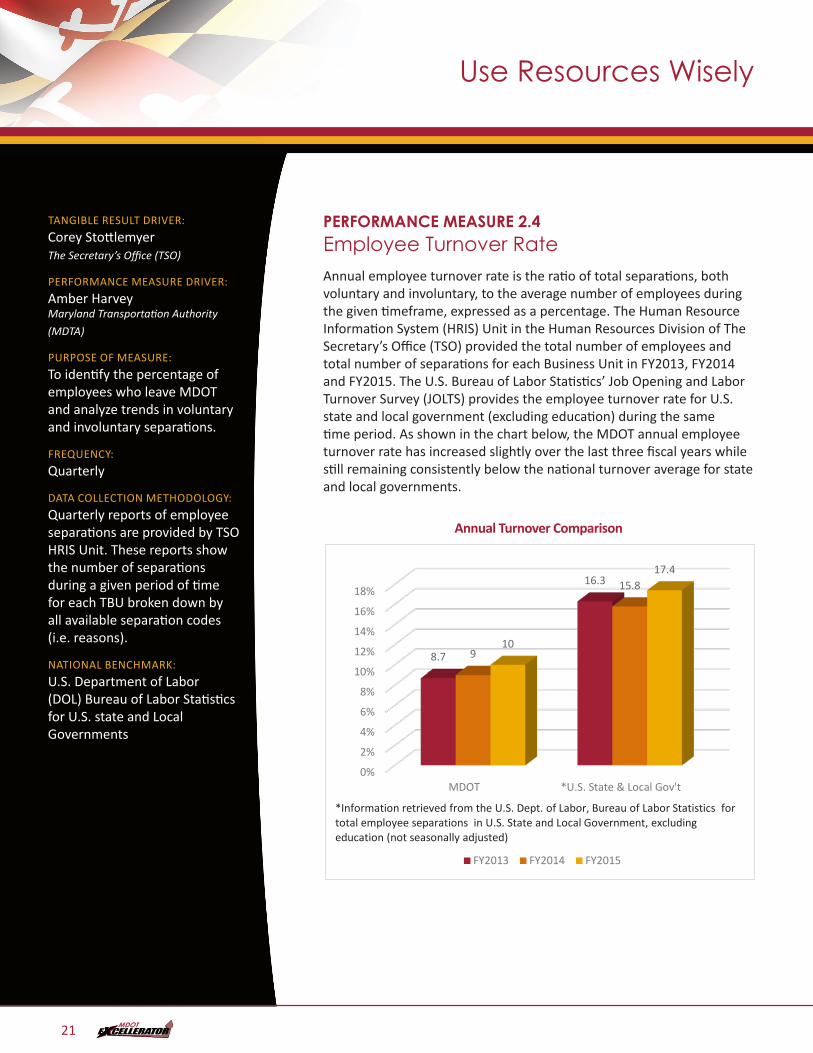
PERFORMANCE MEASURE 2.4Employee Turnover RateAnnual employee turnover rate is the ratio of total separations, both voluntary and involuntary, to the average number of employees during the given timeframe, expressed as a percentage. The Human Resource Information System (HRIS) Unit in the Human Resources Division of The Secretary’s Office (TSO) provided the total number of employees and total number of separations for each Business Unit in FY2013, FY2014 and FY2015. The U.S. Bureau of Labor Statistics’ Job Opening and Labor Turnover Survey (JOLTS) provides the employee turnover rate for U.S. state and local government (excluding education) during the same time period. As shown in the chart below, the MDOT annual employee turnover rate has increased slightly over the last three fiscal years while still remaining consistently below the national turnover average for state and local governments.
Annual Turnover ComparisonPM2.4a – Annual Turnover Comparison - DONE
0%
2%
4%
6%
8%
10%
12%
14%
16%
18%
MDOT *U.S. State & Local Gov't
8.7
16.3
9
15.8
10
17.4
FY2013 FY2014 FY2015
*Information retrieved from the U.S. Dept. of Labor, Bureau of Labor Statistics for total employee separations in U.S. State and Local Government, excluding education (not seasonally adjusted)
Use Resources Wisely
21
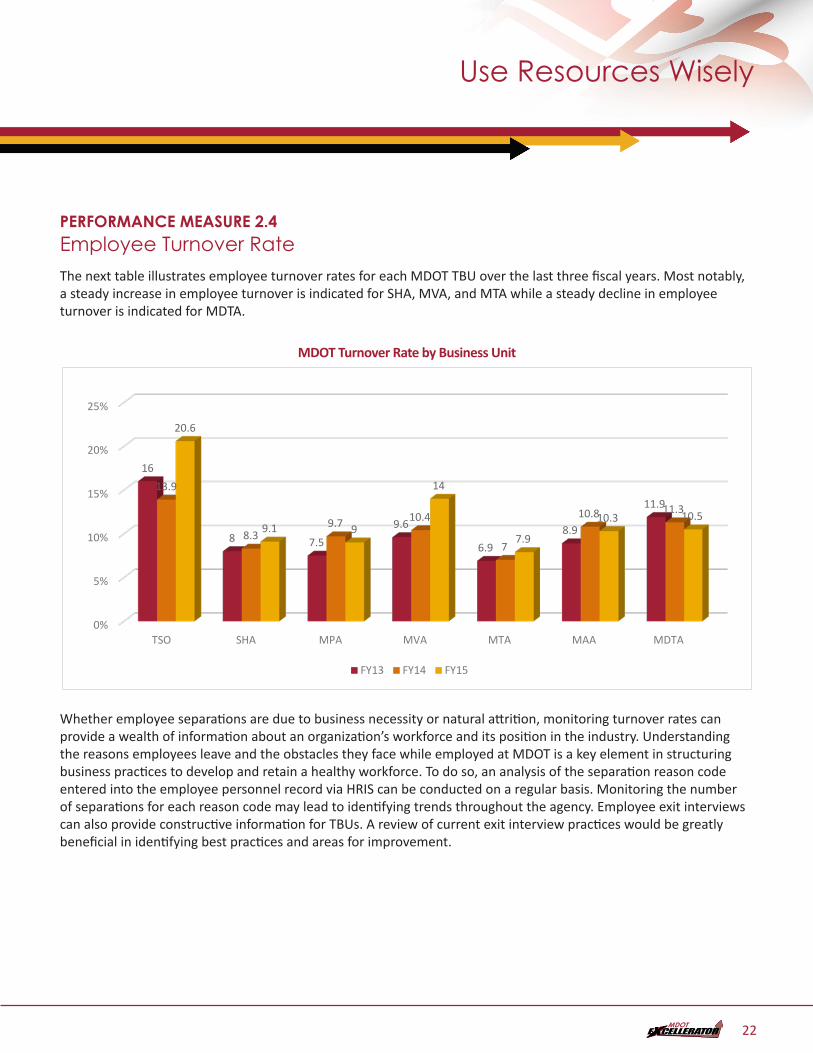
PERFORMANCE MEASURE 2.4Employee Turnover Rate The next table illustrates employee turnover rates for each MDOT TBU over the last three fiscal years. Most notably, a steady increase in employee turnover is indicated for SHA, MVA, and MTA while a steady decline in employee turnover is indicated for MDTA.
MDOT Turnover Rate by Business Unit
PM2.4b - MDOT TURNOVER RATE BY BUSINESS UNIT - DONE
0%
5%
10%
15%
20%
25%
TSO SHA MPA MVA MTA MAA MDTA
16
8 7.59.6
6.98.9
11.913.9
8.39.7 10.4
7
10.8 11.3
20.6
9.1 9
14
7.9
10.3 10.5
FY13 FY14 FY15
Whether employee separations are due to business necessity or natural attrition, monitoring turnover rates can provide a wealth of information about an organization’s workforce and its position in the industry. Understanding the reasons employees leave and the obstacles they face while employed at MDOT is a key element in structuring business practices to develop and retain a healthy workforce. To do so, an analysis of the separation reason code entered into the employee personnel record via HRIS can be conducted on a regular basis. Monitoring the number of separations for each reason code may lead to identifying trends throughout the agency. Employee exit interviews can also provide constructive information for TBUs. A review of current exit interview practices would be greatly beneficial in identifying best practices and areas for improvement.
Use Resources Wisely
22
Use Resources Wisely
TANGIBLE RESULT DRIVERCorey Stottlemyer TSO
PERFORMANCE MEASURE DRIVER:Deborah Hammel SHA
PURPOSE OF MEASURE:Demonstrates efficient use of available PINs and identifies opportunities for improvement in our recruitment and selection processes.
FREQUENCY:Quarterly
DATA COLLECTION METHODOLOGY:Quarterly report for MDOT and each TBU from HRIS housed at TSO, with input from TBU HR Directors
NATIONAL BENCHMARK:N/A
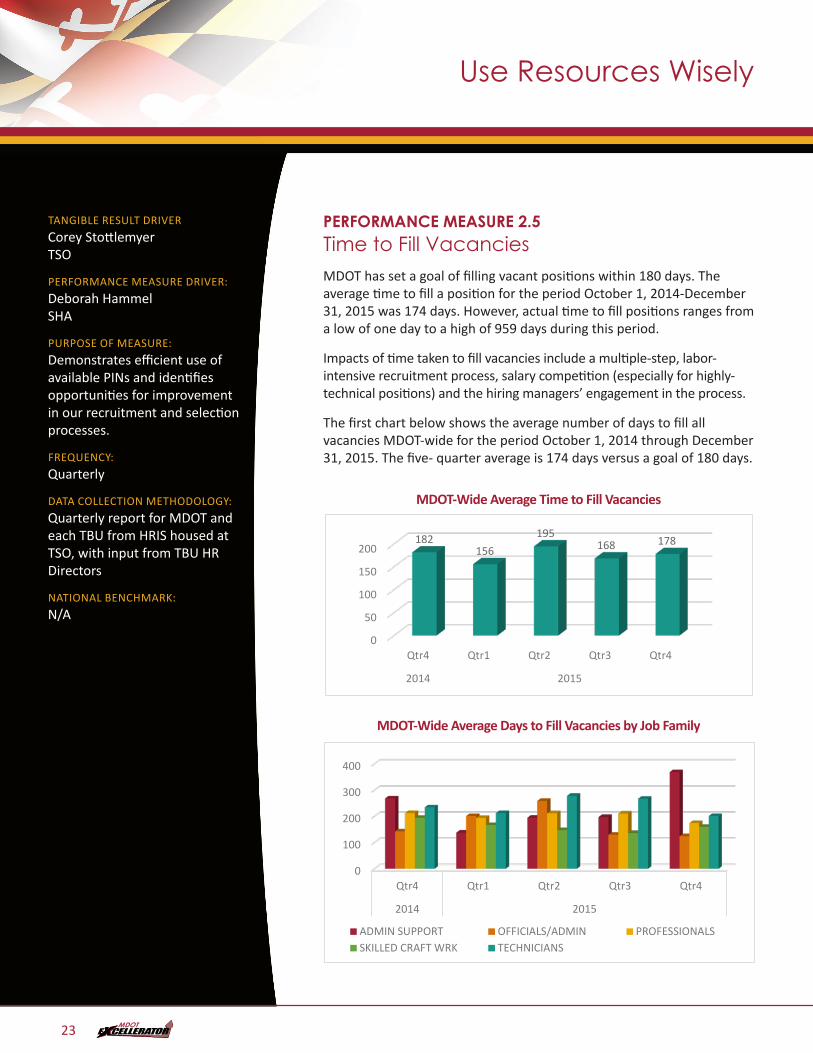
PERFORMANCE MEASURE 2.5Time to Fill VacanciesMDOT has set a goal of filling vacant positions within 180 days. The average time to fill a position for the period October 1, 2014-December 31, 2015 was 174 days. However, actual time to fill positions ranges from a low of one day to a high of 959 days during this period.
Impacts of time taken to fill vacancies include a multiple-step, labor-intensive recruitment process, salary competition (especially for highly-technical positions) and the hiring managers’ engagement in the process.
The first chart below shows the average number of days to fill all vacancies MDOT-wide for the period October 1, 2014 through December 31, 2015. The five- quarter average is 174 days versus a goal of 180 days.
MDOT-Wide Average Time to Fill VacanciesPM2.5a - MDOT-Wide Average Time to Fill Vacancies -DONE
0
50
100
150
200
Qtr4 Qtr1 Qtr2 Qtr3 Qtr4
2014 2015
182156
195168 178
MDOT-Wide Average Days to Fill Vacancies by Job Family PM2.5b - DONE
0
100
200
300
400
Qtr4 Qtr1 Qtr2 Qtr3 Qtr4
2014 2015
ADMIN SUPPORT OFFICIALS/ADMIN PROFESSIONALSSKILLED CRAFT WRK TECHNICIANS
23
Use Resources Wisely
TANGIBLE RESULT DRIVER:Corey Stottlemyer The Secretary’s Office (TSO)
PERFORMANCE MEASURE DRIVER:Bill Bertrand State Highway Administration (SHA)
PURPOSE OF MEASURE:Calculate the percentage of Fixed Asset Units identified during the Annual Physical Inventory of Fixed Assets
FREQUENCY:Annually
DATA COLLECTION METHODOLOGY:Data will be collected when TBUs conduct Annual Fixed Asset Physical Inventories
NATIONAL BENCHMARK:N/A
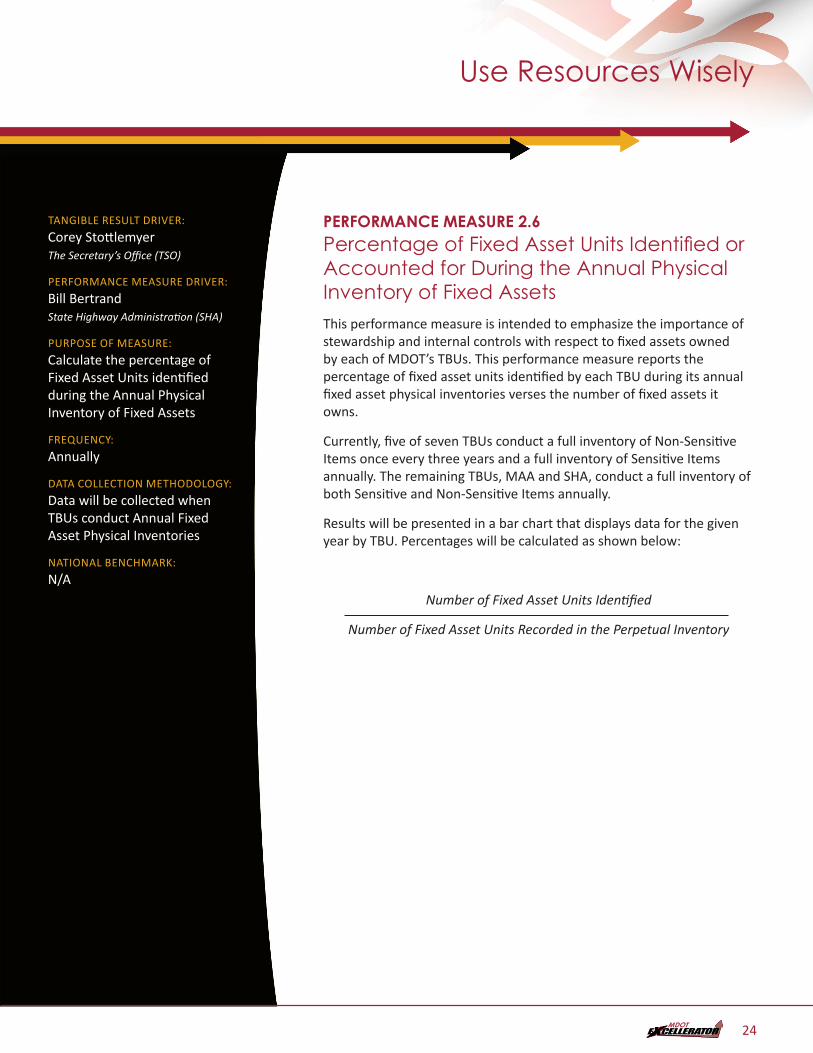
PERFORMANCE MEASURE 2.6Percentage of Fixed Asset Units Identified or Accounted for During the Annual Physical Inventory of Fixed AssetsThis performance measure is intended to emphasize the importance of stewardship and internal controls with respect to fixed assets owned by each of MDOT’s TBUs. This performance measure reports the percentage of fixed asset units identified by each TBU during its annual fixed asset physical inventories verses the number of fixed assets it owns.
Currently, five of seven TBUs conduct a full inventory of Non-Sensitive Items once every three years and a full inventory of Sensitive Items annually. The remaining TBUs, MAA and SHA, conduct a full inventory of both Sensitive and Non-Sensitive Items annually.
Results will be presented in a bar chart that displays data for the given year by TBU. Percentages will be calculated as shown below:
Number of Fixed Asset Units Identified
Number of Fixed Asset Units Recorded in the Perpetual Inventory
24
TANGIBLE RESULT DRIVER:Corey Stottlemyer The Secretary’s Office (TSO)
PERFORMANCE MEASURE DRIVER:Tony Moore Maryland Port Administration (MPA)
PURPOSE OF MEASURE:Provide an overview which shows how Transportation Business Units monitor asset management activities
FREQUENCY:Semi-Annually
DATA COLLECTION METHODOLOGY:Asset inspection condition surveys and asset life-cycle cost analysis
NATIONAL BENCHMARK:N/A
PERFORMANCE MEASURE 2.7Managing Capital AssetsA state of good repair results from the strategic application of transportation asset management concepts. Each Transportation Business Unit maintain its physical assets according to policies which minimize asset life-cycle cost while avoiding negative impacts on the delivery of transit services.
The Transportation Business Units manage different categories of assets in the delivery of transportation services to its customers. Selected performance measures are collected and mathematically weighted to create a TBU specific asset management index. This index makes it possible to compare the outcomes of asset management programs implemented by all TBUs.
Use Resources Wisely
25
Use Resources Wisely
PERFORMANCE MEASURE 2.7Managing Capital Assets INSPECTIONS:The TBU asset condition must be determined before the specific TBU asset management regimen can be implemented. Physical inspections are the primary technique use to assess asset conditions. Asset inspection can occur annually or over a series of years based on the asset life and use.
Below are examples of the type of inspections conducted by the TBUs:
• SHA – # of years of service life, # miles of pavement inspected, # of inspection defects
• MTA – # of buses inspected, # of safety inspection failures
• MAA – # airside and landside pavement inspections, # of landside and terminal facility inspections # of inspection improvements initiated
• MVA – # annual building inspections
• MDTA – # priority 1 defect inspections, % of priority 1 defects assigned to contractors, % of priority 1 defects assigned to task orders
• MPA – # of pile inspections per year, # of manhole inspections per year, pile inspection interval
Selected TBU inspections are included in the TBU’s Asset Management Index. The individual inspection index is calculated by dividing the actual inspection by the number of estimated asset category annual inspections. (As an example, SHA has 15 actual service life inspections ÷ 20 annual estimated inspection × 100 equals an index number of 75). All of the SHA indexes are added together and compared to similar calculated indexes for the remaining TBUs.
ASSET CONDITION:During inspection an evaluation is made to quantify the asset condition. The evaluation is used to determine which assets are good and need minimal remedies; which assets are fair and are in need of some attention; and which assets are in poor condition and either will be abandoned or require a substantial investment.
The asset condition index shows what percentage of the TBU assets are in good, fair or poor condition. This index can be used to measure the change in asset condition between annual reporting periods.
26
Use Resources Wisely
TANGIBLE RESULT DRIVER:Corey Stottlemyer The Secretary’s Office (TSO)
PERFORMANCE MEASURE DRIVER:Pretam Harry Motor Vehicle Administration (MVA)
PURPOSE OF MEASURE:To track the timeliness and ability to match the budgets of the procurement process
FREQUENCY:Quarterly
DATA COLLECTION METHODOLOGY:Quarterly Focus reports MDOT wide showing all active BPO for the quarter
NATIONAL BENCHMARK:N/A
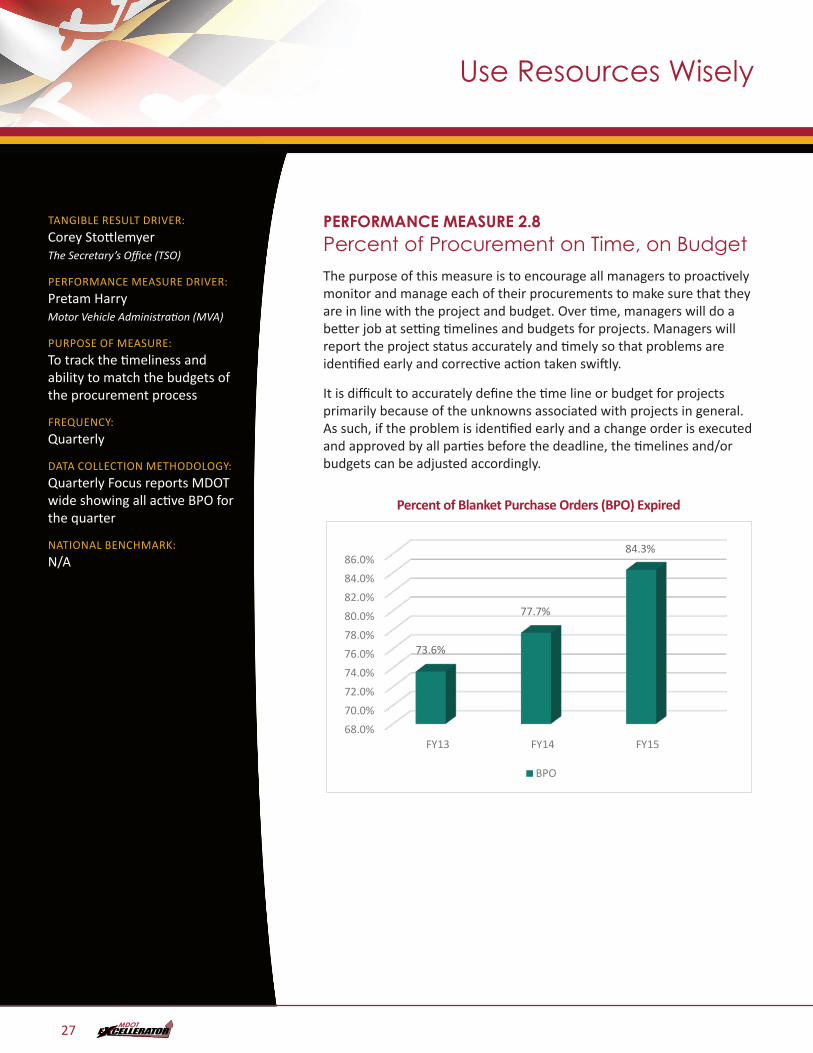
PERFORMANCE MEASURE 2.8Percent of Procurement on Time, on BudgetThe purpose of this measure is to encourage all managers to proactively monitor and manage each of their procurements to make sure that they are in line with the project and budget. Over time, managers will do a better job at setting timelines and budgets for projects. Managers will report the project status accurately and timely so that problems are identified early and corrective action taken swiftly.
It is difficult to accurately define the time line or budget for projects primarily because of the unknowns associated with projects in general. As such, if the problem is identified early and a change order is executed and approved by all parties before the deadline, the timelines and/or budgets can be adjusted accordingly.
Percent of Blanket Purchase Orders (BPO) ExpiredPM2.8 - Percent of Blanket Purchase Orders (BPO) Expired - DONE
68.0%70.0%72.0%74.0%76.0%78.0%80.0%82.0%84.0%86.0%
FY13 FY14 FY15
73.6%
77.7%
84.3%
BPO
27
Use Resources Wisely
TANGIBLE RESULT DRIVER:Corey Stottlemyer The Secretary’s Office (TSO)
PERFORMANCE MEASURE DRIVER:Pretam Harry Motor Vehicle Administration (MVA)
PURPOSE OF MEASURE:To measure (a) the percent of occurrences and (b) the dollar value of unanticipated change orders on procurement contracts
FREQUENCY:Quarterly
DATA COLLECTION METHODOLOGY:MDOT wide showing active unanticipated change orders equal to or greater than $1 million for the quarter
NATIONAL BENCHMARK:N/A
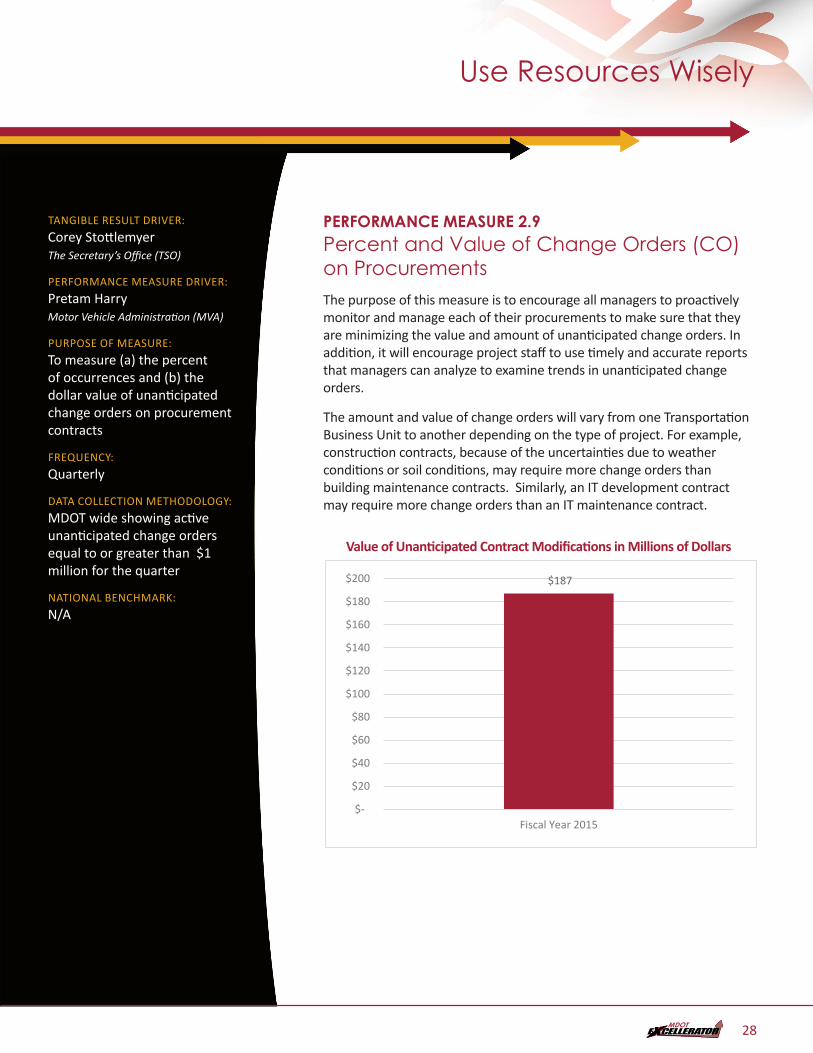
PERFORMANCE MEASURE 2.9Percent and Value of Change Orders (CO)on ProcurementsThe purpose of this measure is to encourage all managers to proactively monitor and manage each of their procurements to make sure that they are minimizing the value and amount of unanticipated change orders. In addition, it will encourage project staff to use timely and accurate reports that managers can analyze to examine trends in unanticipated change orders.
The amount and value of change orders will vary from one Transportation Business Unit to another depending on the type of project. For example, construction contracts, because of the uncertainties due to weather conditions or soil conditions, may require more change orders than building maintenance contracts. Similarly, an IT development contract may require more change orders than an IT maintenance contract.
Value of Unanticipated Contract Modifications in Millions of DollarsPM2.9a – Percent of CO - DONE
$187
$-
$20
$40
$60
$80
$100
$120
$140
$160
$180
$200
Fiscal Year 2015
28
Use Resources Wisely
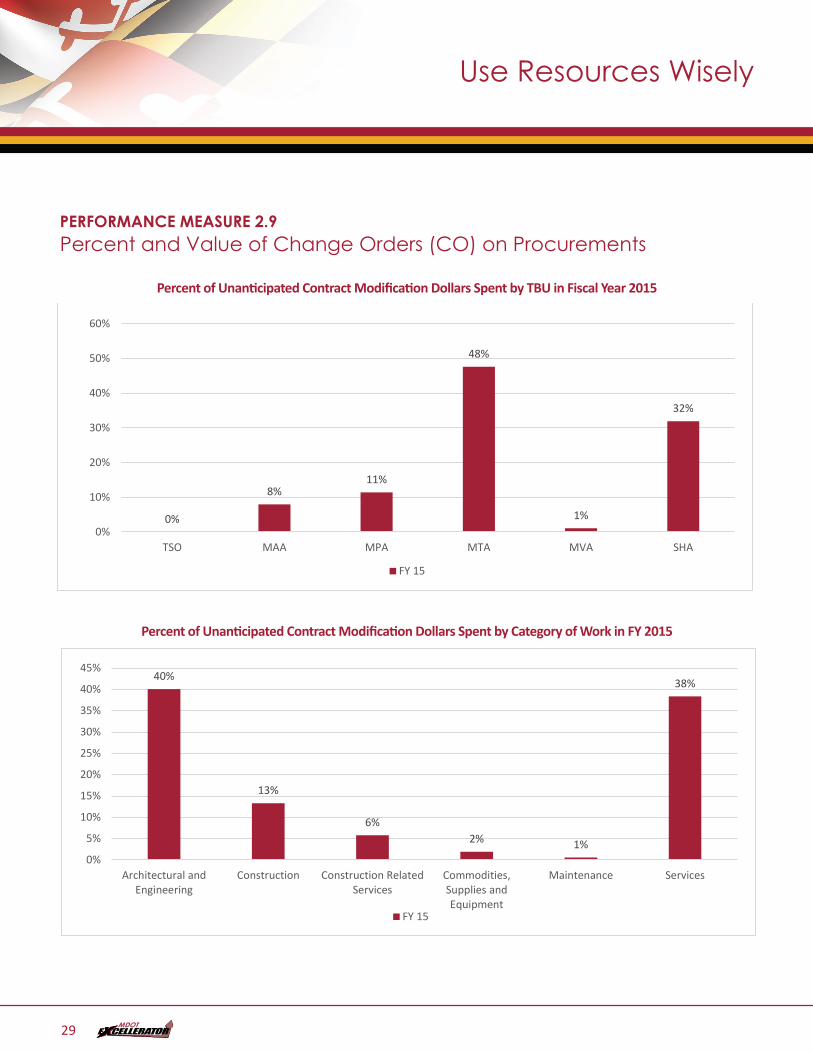
PERFORMANCE MEASURE 2.9Percent and Value of Change Orders (CO) on Procurements
Percent of Unanticipated Contract Modification Dollars Spent by TBU in Fiscal Year 2015PM2.9b – Value of Change Orders - DONE
0%
8%11%
48%
1%
32%
0%
10%
20%
30%
40%
50%
60%
TSO MAA MPA MTA MVA SHA
FY 15
Percent of Unanticipated Contract Modification Dollars Spent by Category of Work in FY 2015
PM2.9c – DONE
40%
13%
6%2% 1%
38%
0%
5%
10%
15%
20%
25%
30%
35%
40%
45%
Architectural andEngineering
Construction Construction RelatedServices
Commodities,Supplies andEquipment
Maintenance Services
FY 15
29
TANGIBLE RESULT DRIVER:Corey Stottlemyer The Secretary’s Office (TSO)
PERFORMANCE MEASURE DRIVER:Laura Getty Maryland Transit Administration (MTA)
PURPOSE OF MEASURE:To understand how procurement competition impacts MDOT resources
FREQUENCY:Quarterly
DATA COLLECTION METHODOLOGY:Data was collected on each TBU procurement contract over $200,000 during Q2 FY 2016. Sole Source, Emergency, and Intergovernmental Cooperative Purchasing procurements were not included. Procurement contract ID, number of bids, estimated cost and final contract amount were the used data points.
NATIONAL BENCHMARK:N/A
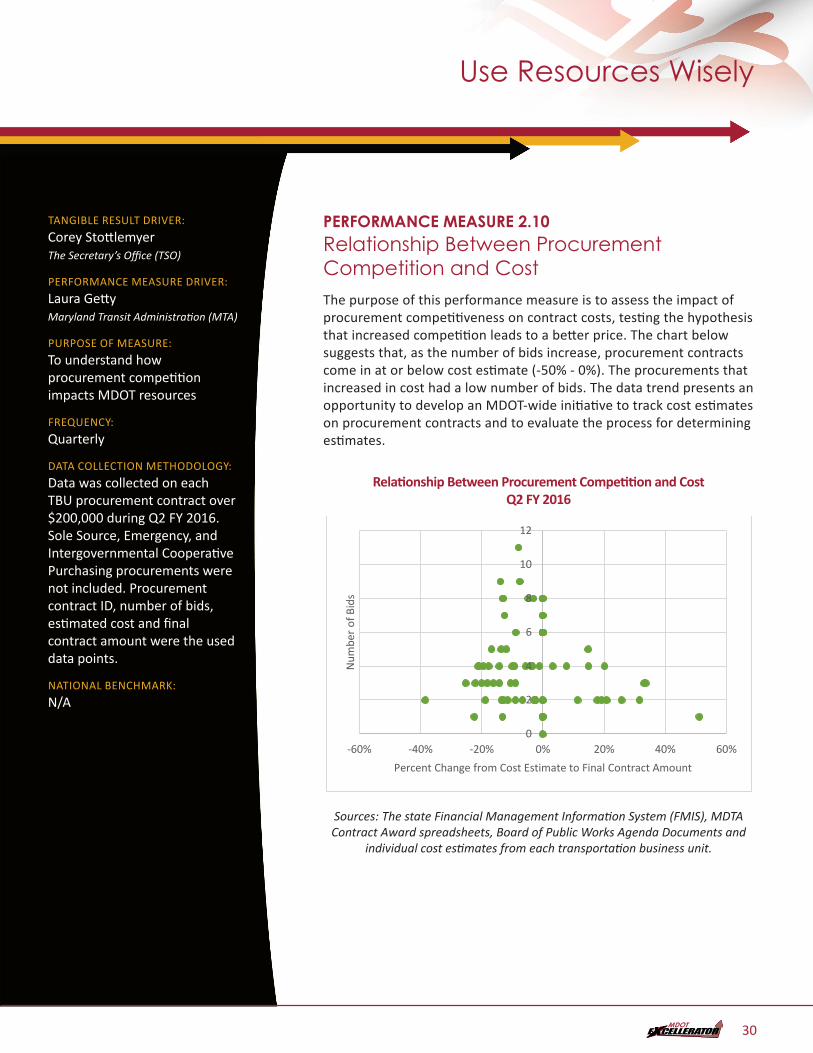
PERFORMANCE MEASURE 2.10Relationship Between Procurement Competition and CostThe purpose of this performance measure is to assess the impact of procurement competitiveness on contract costs, testing the hypothesis that increased competition leads to a better price. The chart below suggests that, as the number of bids increase, procurement contracts come in at or below cost estimate (-50% - 0%). The procurements that increased in cost had a low number of bids. The data trend presents an opportunity to develop an MDOT-wide initiative to track cost estimates on procurement contracts and to evaluate the process for determining estimates.
Relationship Between Procurement Competition and Cost Q2 FY 2016PM2.10 – Relationship between Procurement Competition and Cost Q2 FY2016
0
2
4
6
8
10
12
-60% -40% -20% 0% 20% 40% 60%
Num
ber o
f Bid
s
Percent Change from Cost Estimate to Final Contract Amount
Sources: The state Financial Management Information System (FMIS), MDTA Contract Award spreadsheets, Board of Public Works Agenda Documents and
individual cost estimates from each transportation business unit.
Use Resources Wisely
30
TANGIBLE RESULT DRIVER:Corey Stottlemyer The Secretary’s Office (TSO)
PERFORMANCE MEASURE DRIVER:Patrick Bradley Maryland Aviation Administration (MAA)
PURPOSE OF MEASURE:To track the number of Internal Audit Findings and the number of Repeat Internal Audit Findings
FREQUENCY:Annually
DATA COLLECTION METHODOLOGY:TBU Audit databases for FY13, FY14 and FY15
NATIONAL BENCHMARK:N/A
PERFORMANCE MEASURE 2.11Number of Internal Audit Findings and Number of Repeat Internal Audit FindingsThe purpose of this performance measure is to track the number of Internal Audit Findings and the number of Repeat Internal Audit Findings in FY2013, FY2014 and FY2015. Data will be presented by TBU in the number of audit findings and repeat audit findings on an annual basis. This will encourage MDOT and each TBU to avoid audit and repeat audit findings.
In FY 2013-2015, there were 451 total Internal Findings.
The number of Repeat Internal Audit Findings totaled 19 in FY 2013 – FY2015, dealing with periodic inventory reviews of sensitive items (four findings), promotional expense documentation and authorizations (five findings) and materials and supplies management (ten findings). The materials and supplies management findings include items such as segregation of duties, access to storeroom, non-signed receipts, perpetual inventory records not being accurate, documentation issues and inventory turning over less than three times per year.
Six of nineteen Repeat Internal Audit Findings have been resolved.
Of the remaining unresolved 13 Repeat Internal Audit Findings, 12 are made of the same six findings in two different audit years and one additional repeat finding.
Use Resources Wisely
31
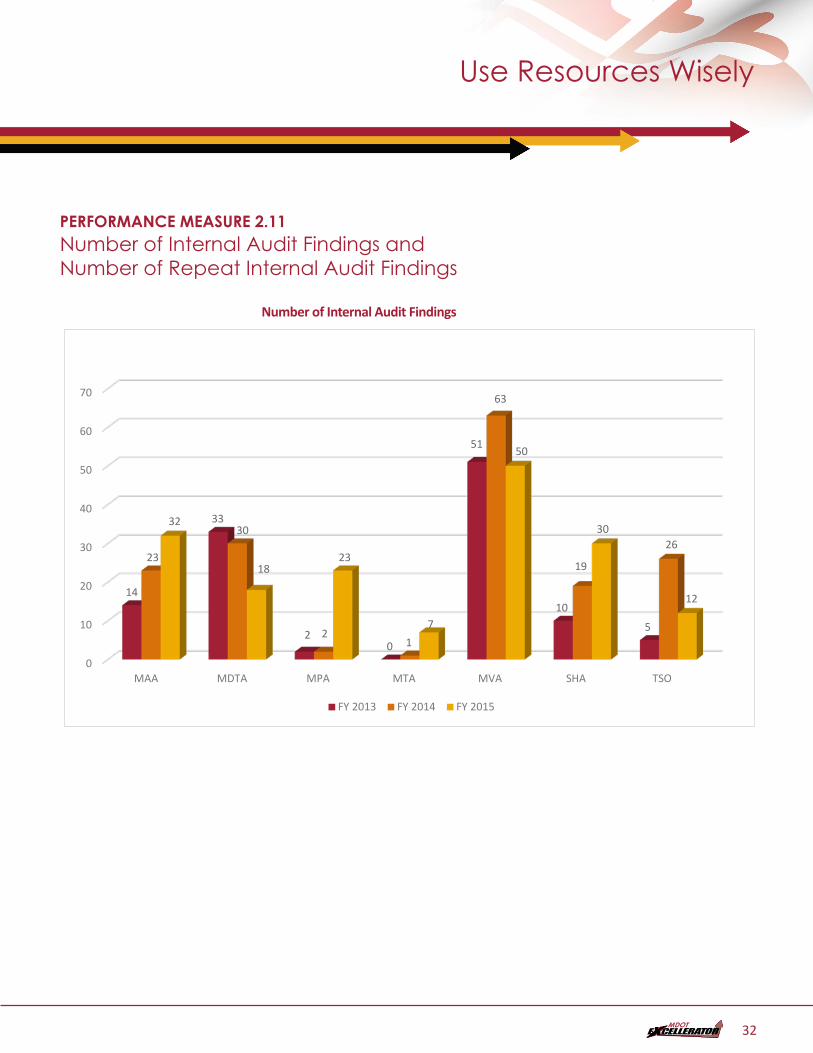
PERFORMANCE MEASURE 2.11Number of Internal Audit Findings and Number of Repeat Internal Audit Findings
Number of Internal Audit FindingsPM2.11 - 2.11 Number of Internal Audit Findings - DONE
0
10
20
30
40
50
60
70
MAA MDTA MPA MTA MVA SHA TSO
14
33
20
51
10
5
23
30
21
63
19
26
32
1823
7
50
30
12
FY 2013 FY 2014 FY 2015
Use Resources Wisely
32
PERFORMANCE MEASURE 2.11Number of Internal Audit Findings and Number of Repeat Internal Audit Findings
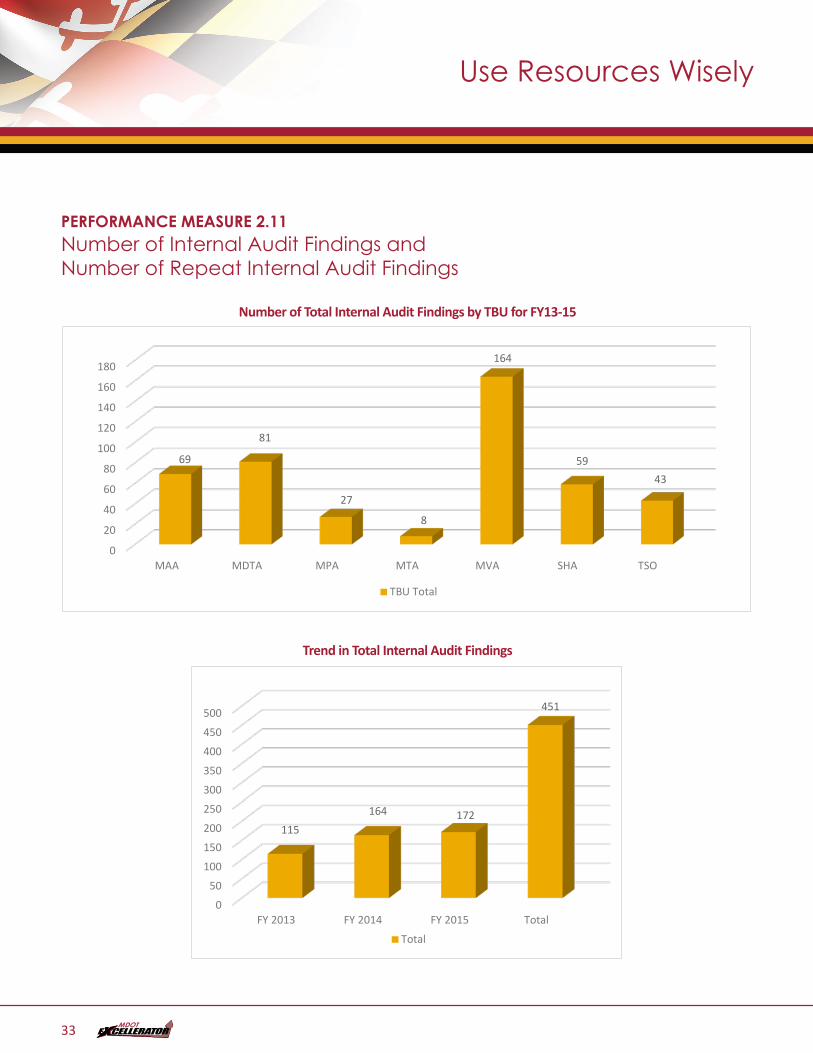
Number of Total Internal Audit Findings by TBU for FY13-15PM2.11b - 2.11 Number of Total Internal Audit Findings by TBU for FY13-15 - DONE
Trend in Total Internal Audit FIndings
0
20
40
60
80
100
120
140
160
180
MAA MDTA MPA MTA MVA SHA TSO
69
81
27
8
164
5943
TBU Total
0
50
100
150
200
250
300
350
400
450
500
FY 2013 FY 2014 FY 2015 Total
115164 172
451
Total
Trend in Total Internal Audit Findings
PM2.11b - 2.11 Number of Total Internal Audit Findings by TBU for FY13-15 - DONE
Trend in Total Internal Audit FIndings
0
20
40
60
80
100
120
140
160
180
MAA MDTA MPA MTA MVA SHA TSO
69
81
27
8
164
5943
TBU Total
0
50
100
150
200
250
300
350
400
450
500
FY 2013 FY 2014 FY 2015 Total
115164 172
451
Total
Use Resources Wisely
33
Use Resources Wisely
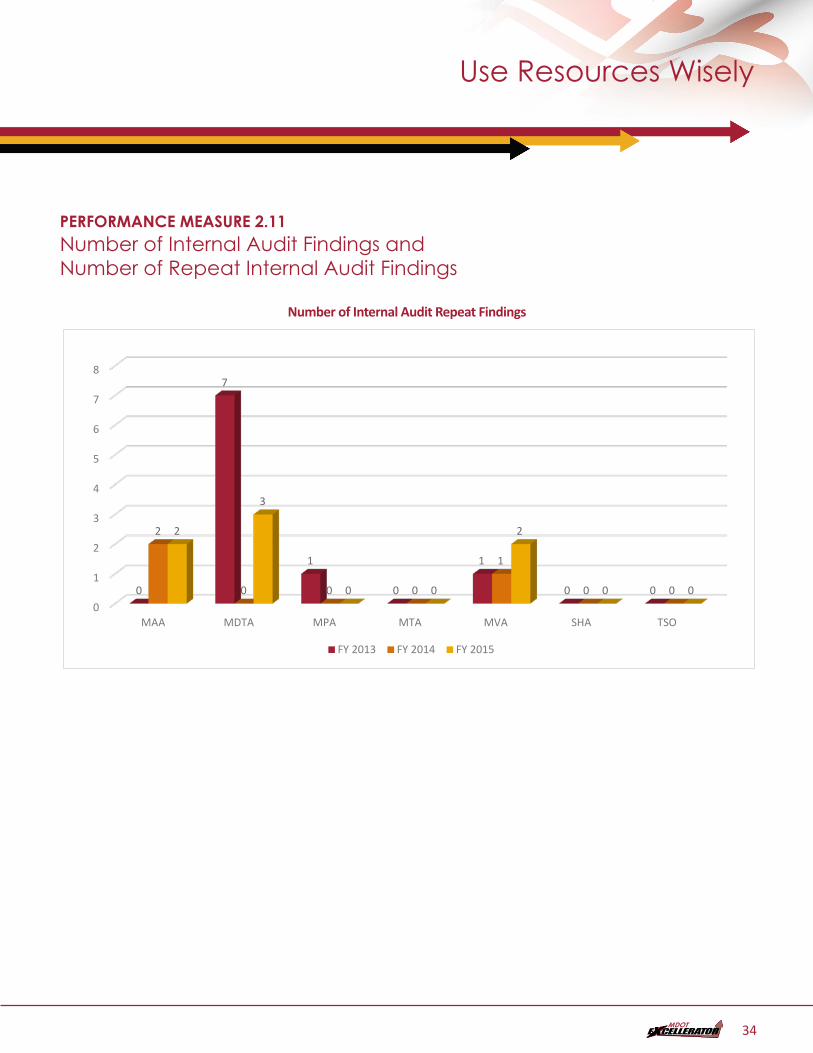
PERFORMANCE MEASURE 2.11Number of Internal Audit Findings and Number of Repeat Internal Audit Findings
Number of Internal Audit Repeat FindingsPM2.11c - 2.11 Number of Internal Audit Repeat Findings - DONE
0
1
2
3
4
5
6
7
8
MAA MDTA MPA MTA MVA SHA TSO
0
7
1
0
1
0 0
2
0 0 0
1
0 0
2
3
0 0
2
0 0
FY 2013 FY 2014 FY 2015
34
Use Resources Wisely
TANGIBLE RESULT DRIVER:Corey Stottlemyer Maryland Department of Transportation (MDOT)
PERFORMANCE MEASURE DRIVER:Patrick Bradley Maryland Aviation Administration (MAA)
PURPOSE OF MEASURE:To track the number of Legislative Repeat Audit Findings
FREQUENCY:Annually
DATA COLLECTION METHODOLOGY:TBU Audit databases for FY 13, FY14 and FY15
NATIONAL BENCHMARK:Zero Legislative Repeat Audit Findings
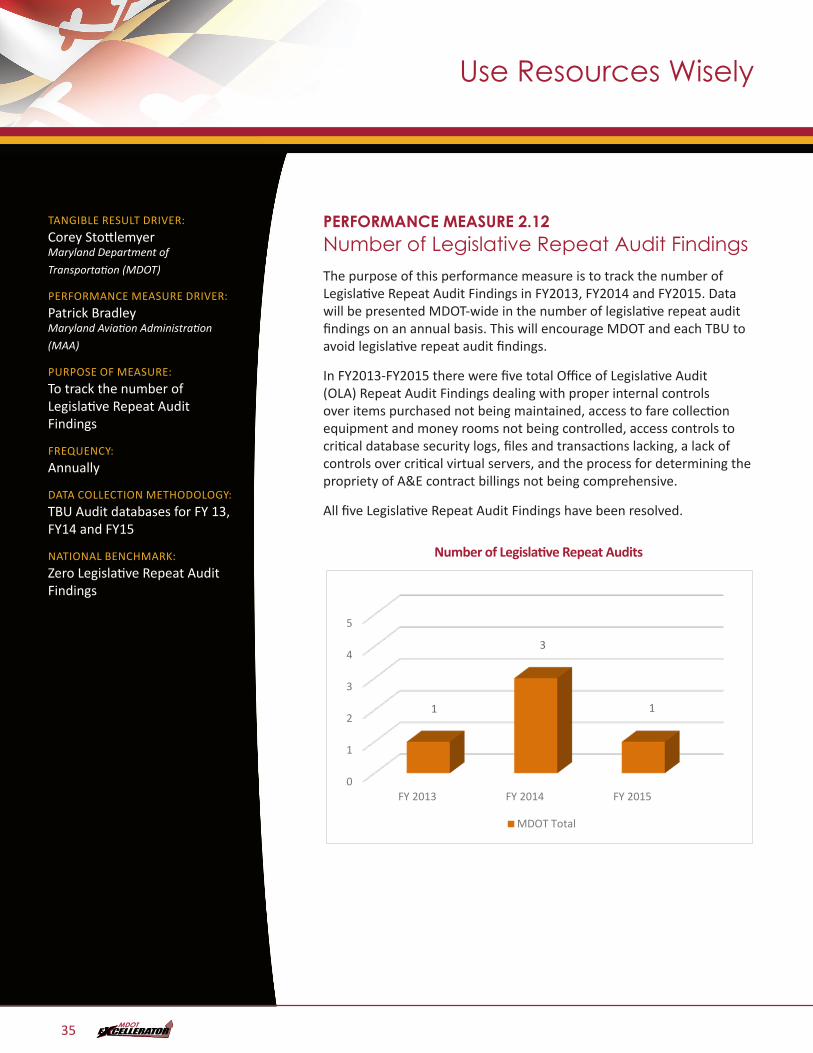
PERFORMANCE MEASURE 2.12Number of Legislative Repeat Audit FindingsThe purpose of this performance measure is to track the number of Legislative Repeat Audit Findings in FY2013, FY2014 and FY2015. Data will be presented MDOT-wide in the number of legislative repeat audit findings on an annual basis. This will encourage MDOT and each TBU to avoid legislative repeat audit findings.
In FY2013-FY2015 there were five total Office of Legislative Audit (OLA) Repeat Audit Findings dealing with proper internal controls over items purchased not being maintained, access to fare collection equipment and money rooms not being controlled, access controls to critical database security logs, files and transactions lacking, a lack of controls over critical virtual servers, and the process for determining the propriety of A&E contract billings not being comprehensive.
All five Legislative Repeat Audit Findings have been resolved.
Number of Legislative Repeat AuditsPM2.12 - 2.12 Number of Legislative Repeat Audit Findings - DONE
0
1
2
3
4
5
FY 2013 FY 2014 FY 2015
1
3
1
MDOT Total
35
Use Resources Wisely
36