Embed Size (px)
Citation preview
Using Climate Information in Fisheries Stock Assessments
(with a focus on Pacific Whiting)
Ian TaylorSMA 550: Climate Impacts
on the Pacific Northwest
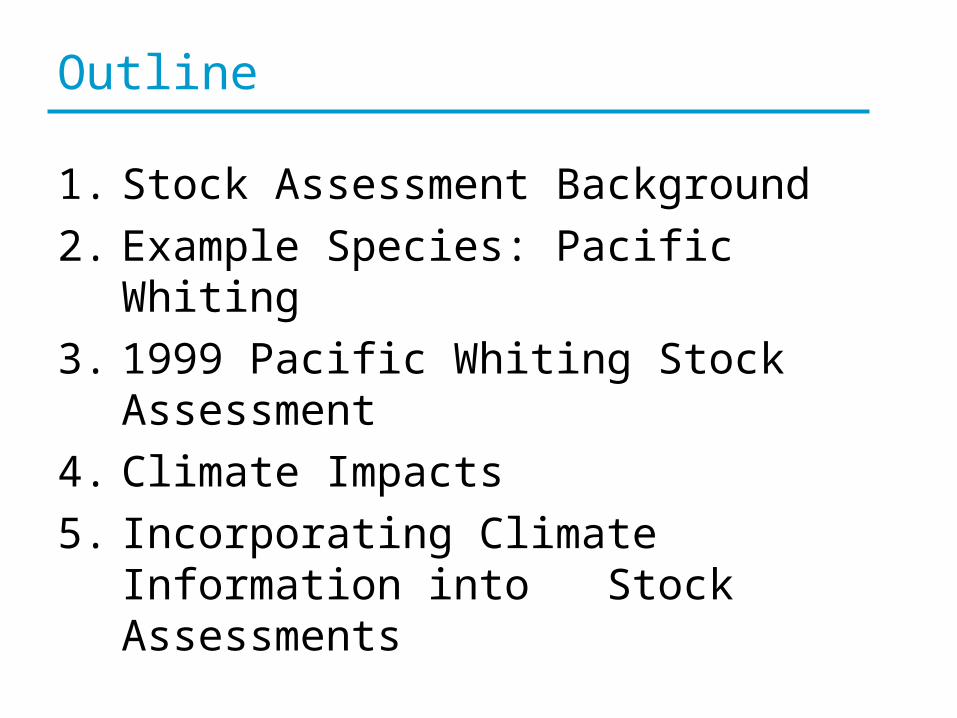
Outline
1. Stock Assessment Background
2. Example Species: Pacific Whiting
3. 1999 Pacific Whiting Stock Assessment
4. Climate Impacts
5. Incorporating Climate Information into Stock Assessments
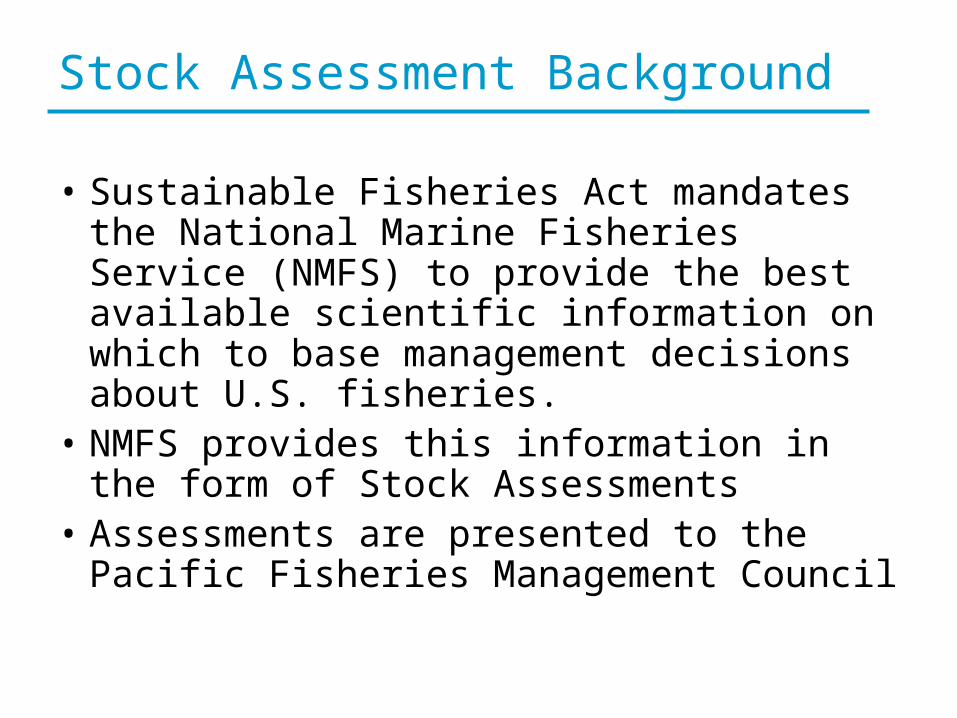
Stock Assessment Background
• Sustainable Fisheries Act mandates the National Marine Fisheries Service (NMFS) to provide the best available scientific information on which to base management decisions about U.S. fisheries.
• NMFS provides this information in the form of Stock Assessments
• Assessments are presented to the Pacific Fisheries Management Council
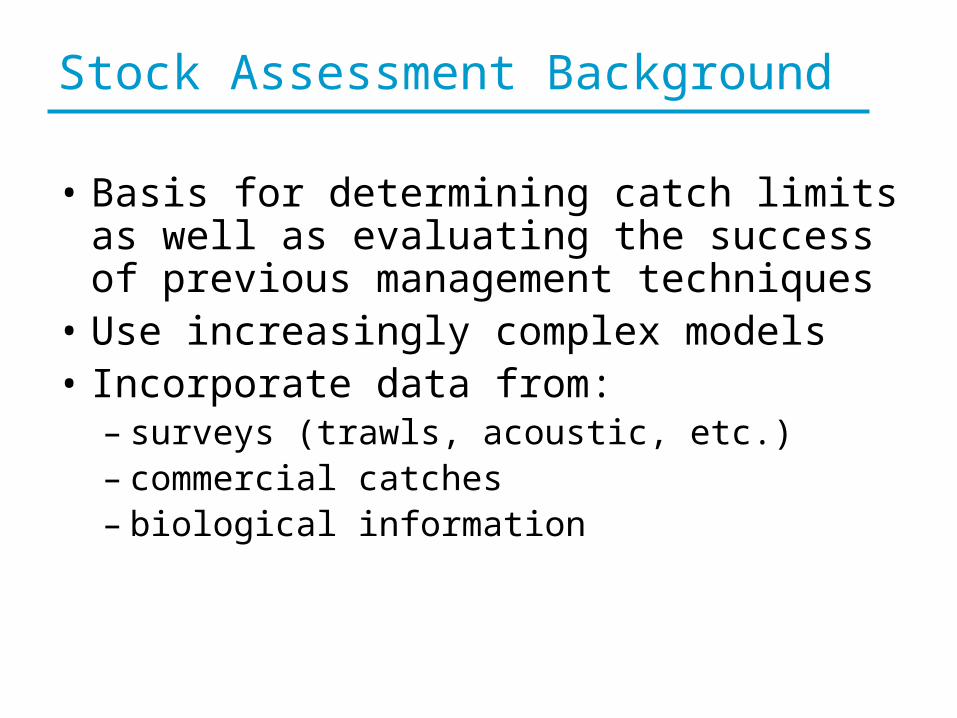
Stock Assessment Background
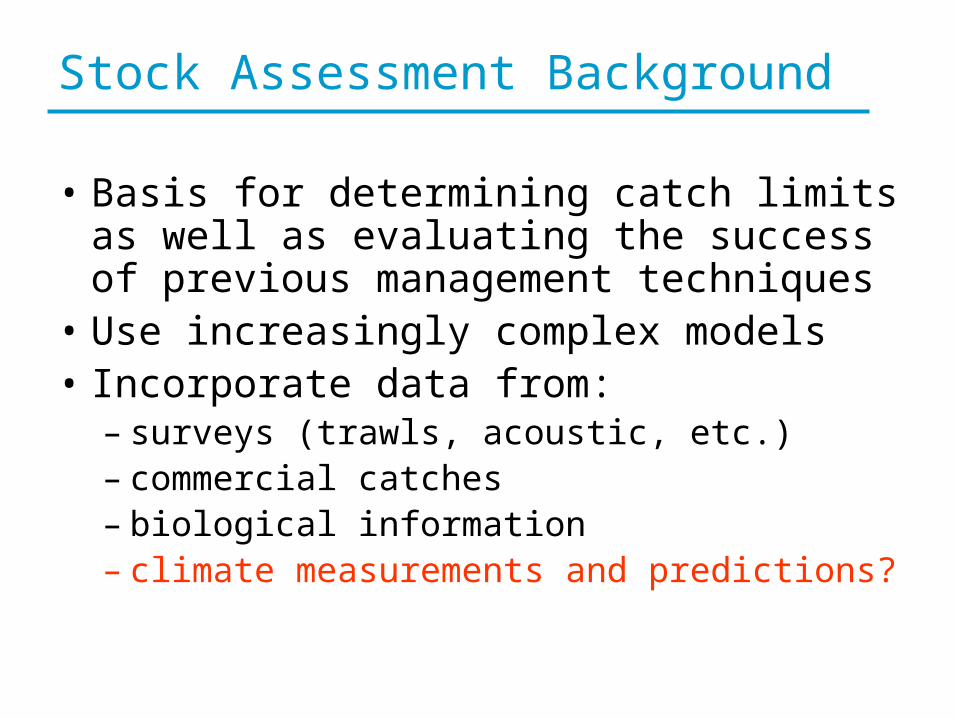
• Basis for determining catch limits as well as evaluating the success of previous management techniques
• Use increasingly complex models• Incorporate data from:
– surveys (trawls, acoustic, etc.)– commercial catches– biological information– climate measurements and predictions?
Stock Assessment Background
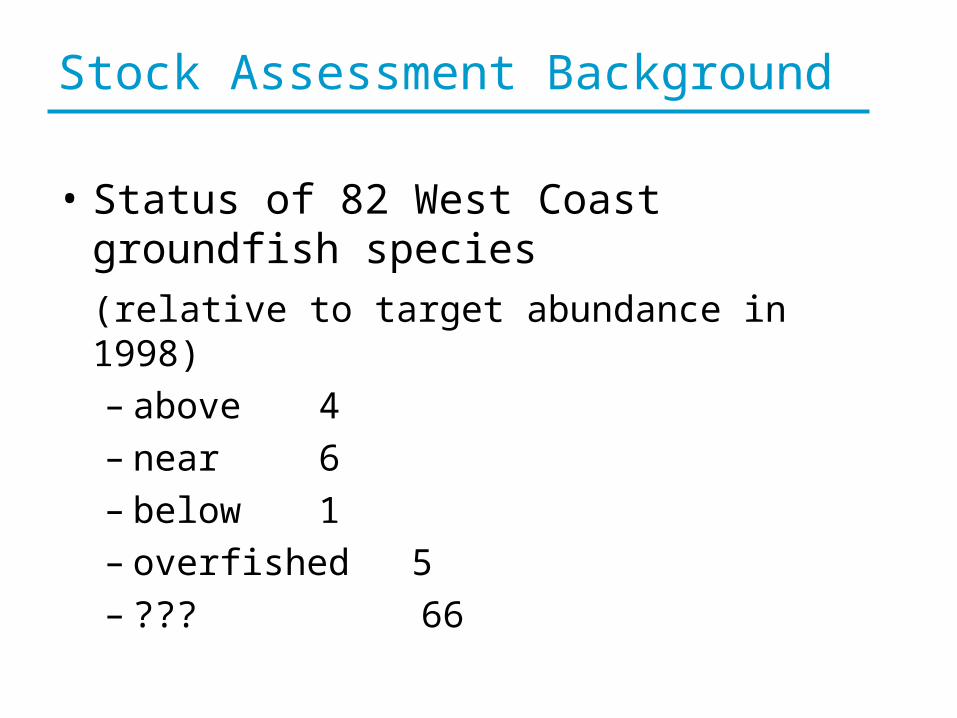
• Status of 82 West Coast groundfish species
(relative to target abundance in 1998)
– above 4 – near 6 – below 1 – overfished 5– ??? 66
Stock Assessment Background
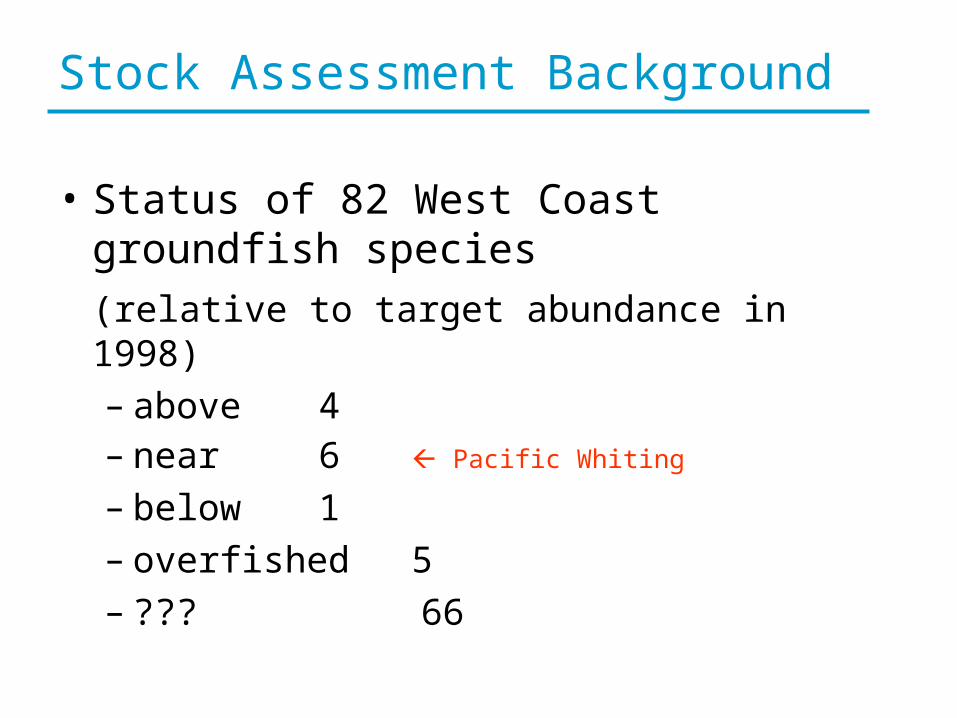
• Status of 82 West Coast groundfish species
(relative to target abundance in 1998)
– above 4 – near 6 Pacific Whiting
– below 1 – overfished 5– ??? 66
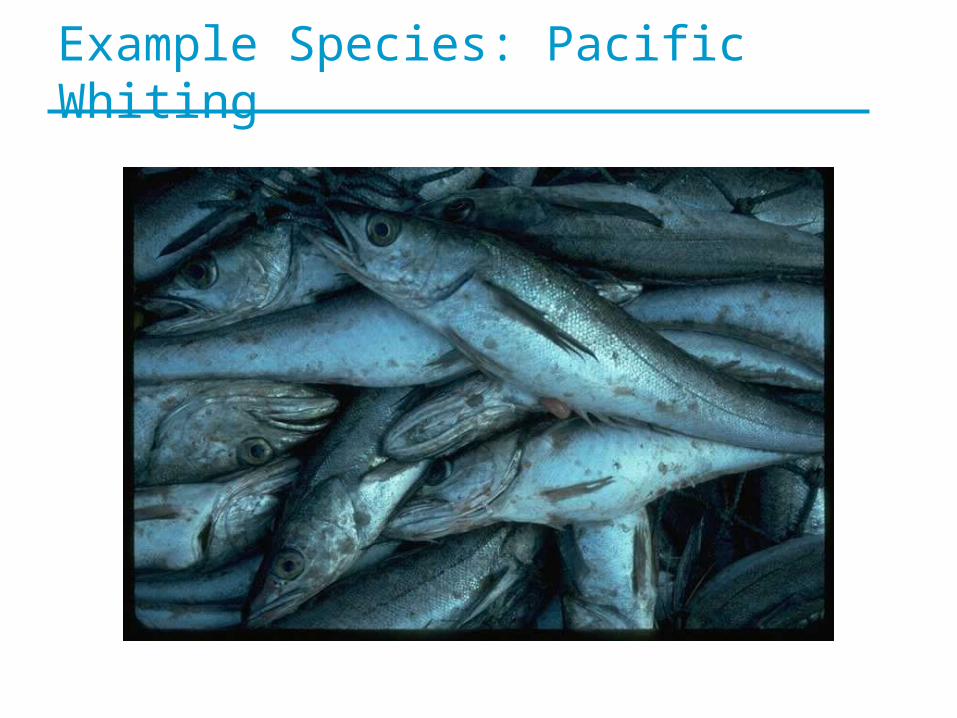
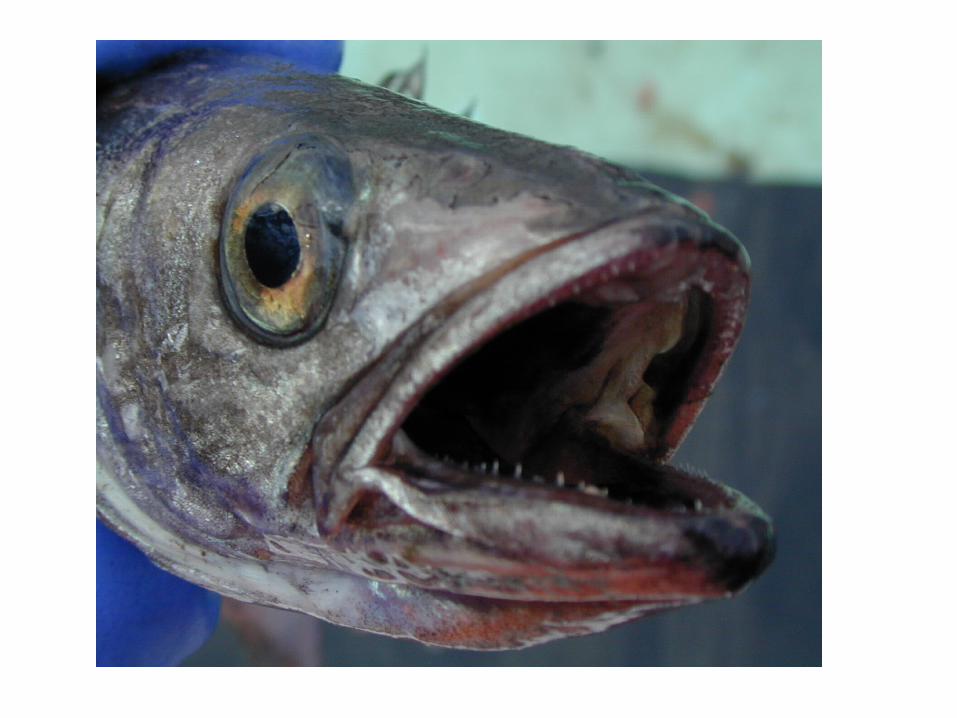
Example Species: Pacific Whiting
Example Species: Pacific Whiting
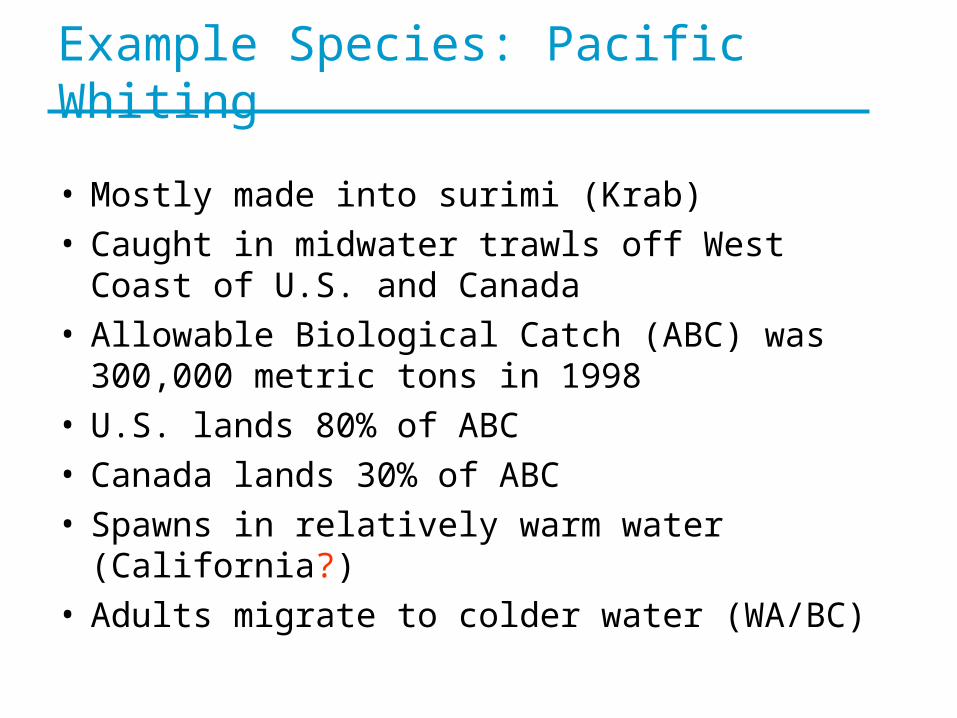
• Mostly made into surimi (Krab)• Caught in midwater trawls off West Coast of U.S.
and Canada• Allowable Biological Catch (ABC) was 300,000
metric tons in 1998• U.S. lands 80% of ABC• Canada lands 30% of ABC• Spawns in relatively warm water (California?)• Adults migrate to colder water (WA/BC)
Example Species: Pacific Whiting
1999 Pacific Whiting Stock Assessment
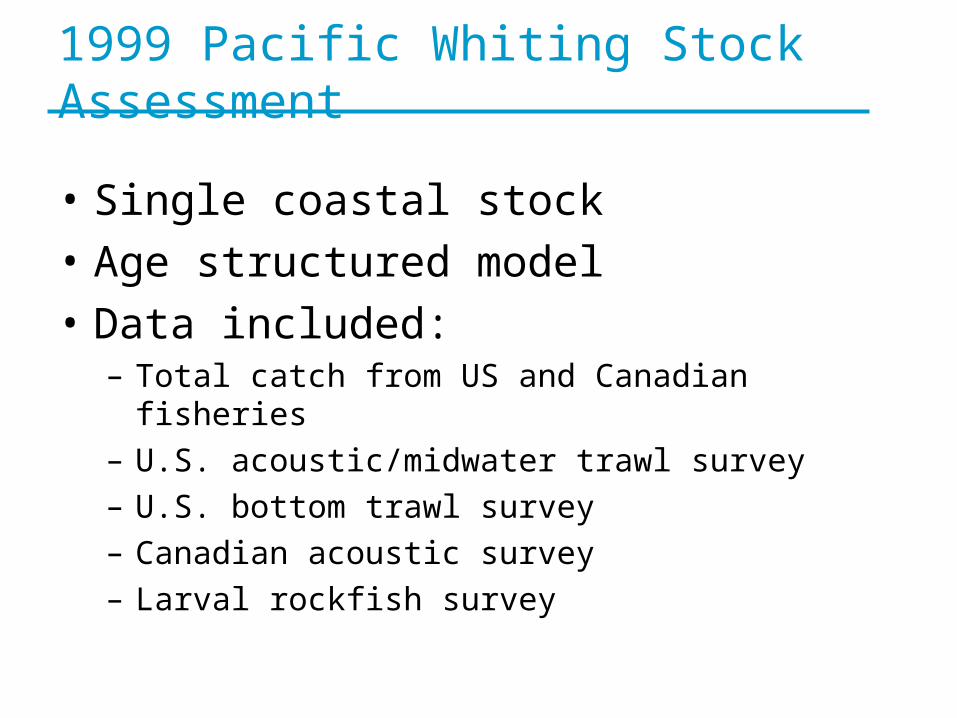
• Single coastal stock
• Age structured model
• Data included:– Total catch from US and Canadian fisheries
– U.S. acoustic/midwater trawl survey
– U.S. bottom trawl survey
– Canadian acoustic survey
– Larval rockfish survey

1999 Pacific Whiting Stock Assessment
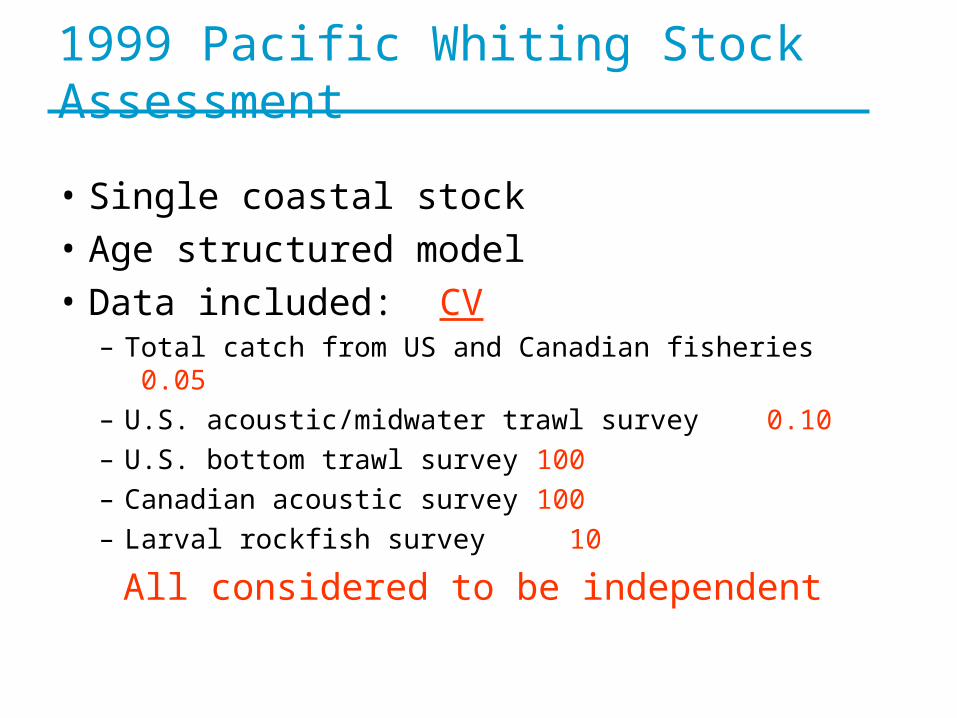
• Single coastal stock
• Age structured model
• Data included: CV– Total catch from US and Canadian fisheries 0.05
– U.S. acoustic/midwater trawl survey 0.10
– U.S. bottom trawl survey 100
– Canadian acoustic survey 100
– Larval rockfish survey 10
1999 Pacific Whiting Stock Assessment
• Single coastal stock
• Age structured model
• Data included: CV– Total catch from US and Canadian fisheries 0.05
– U.S. acoustic/midwater trawl survey 0.10
– U.S. bottom trawl survey 100
– Canadian acoustic survey 100
– Larval rockfish survey 10
All considered to be independent
1999 Pacific Whiting Stock Assessment
• Projections are extremely uncertain due to unpredictable recruitment
• Projections do not include the potential for spatial changes in the population
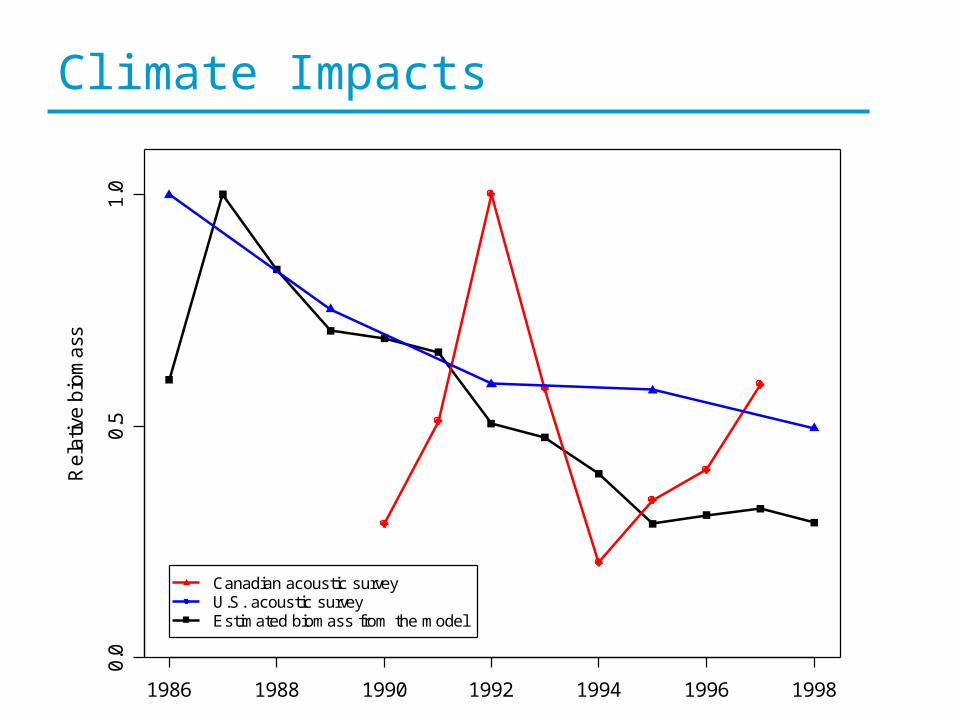
Climate ImpactsR
ela
tive
bio
ma
ss
1986 1988 1990 1992 1994 1996 1998
0.0
0.5
1.0
Canadian acoustic surveyU.S. acoustic surveyEstimated biomass from the model
Climate Impacts
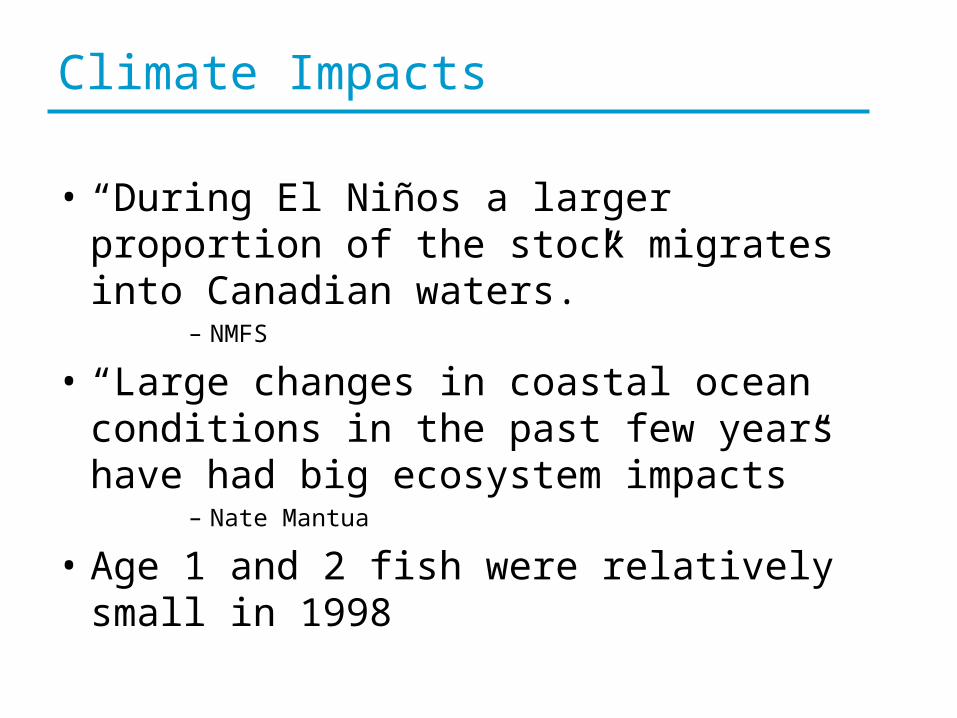
• “During El Niños a larger proportion of the stock migrates into Canadian waters.”
– NMFS
• “Large changes in coastal ocean conditions in the past few years have had big ecosystem impacts”
– Nate Mantua
• Age 1 and 2 fish were relatively small in 1998
Incorporating Climate Information into Stock Assessments
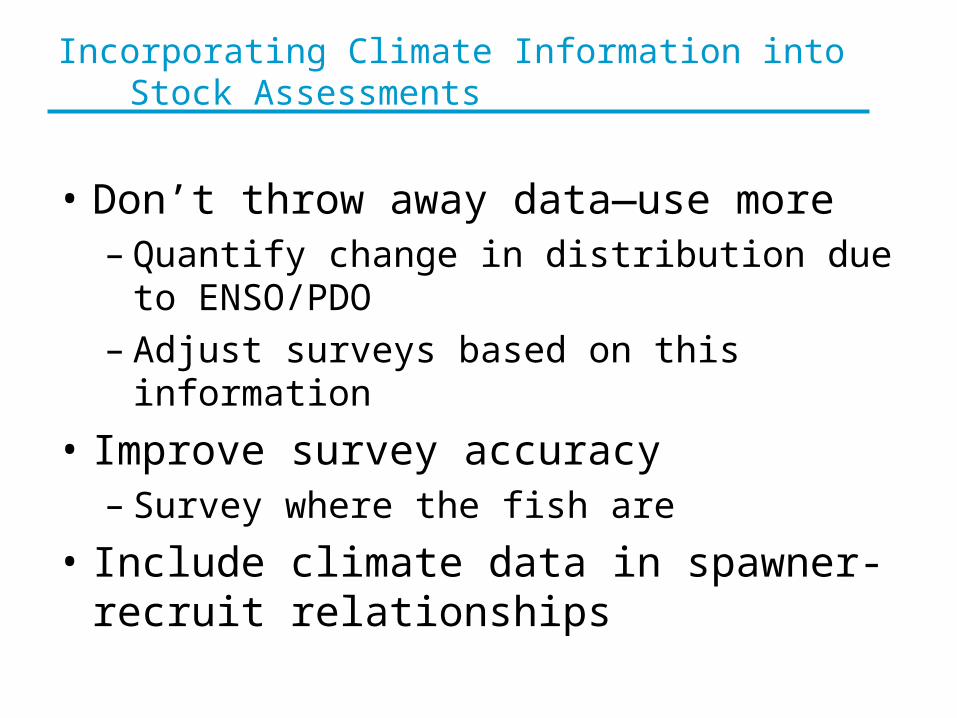
• Don’t throw away data—use more– Quantify change in distribution due to ENSO/PDO– Adjust surveys based on this information
• Improve survey accuracy– Survey where the fish are
• Include climate data in spawner-recruit relationships
Incorporating Climate Information into Stock Assessments
• Include climate forecasts in short-term projections
• Multiple long-term projections based on alternative climate scenarios
FOR MANAGERS:
• Does it make sense to have constant catch rates in the U.S. and Canada?