Embed Size (px)
Citation preview
Using Excel to Analyze OSAT Results
Download OSAT results from the internet
Analyze results with formulae
Create blank calculation pages
Filter and copy groups to blank pages
Let’s Talk About Data Files
American Standard Code for Information Interchange (ASCII) .txt in Windows jargon Delimited Files (records made up of fields)
Field separators (comma, tab, space, fixed length) Carriage return at the end of each record (¶)
Demonstration of creating an ASCII file .csv files are ASCII files that are renamed so
that Excel will recognize them and import them automatically
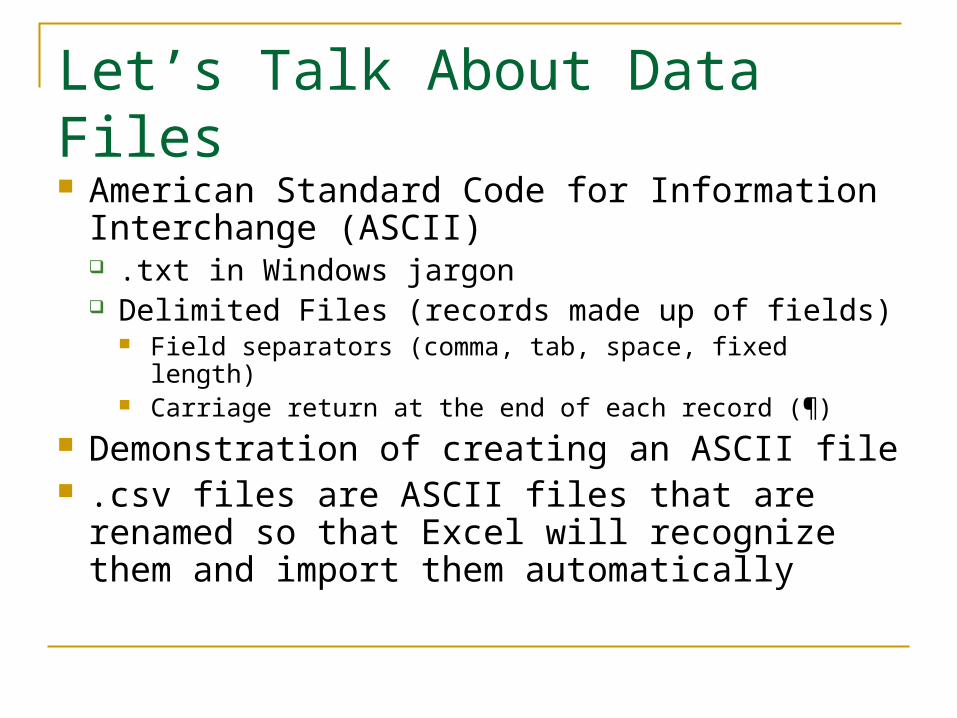
Let’s Get the OSAT Data Demo If you can get your district password…
Open Internet Explorer Type http://district.ode.state.or.us onto the address line and
click go Enter District ID Enter Password Click Login There are many options to downloading data
Now you can get the data
Go to our site (www.omla.net/EPFA506) Save target as… with Math05.csv and save it
to your desktop Double click to open
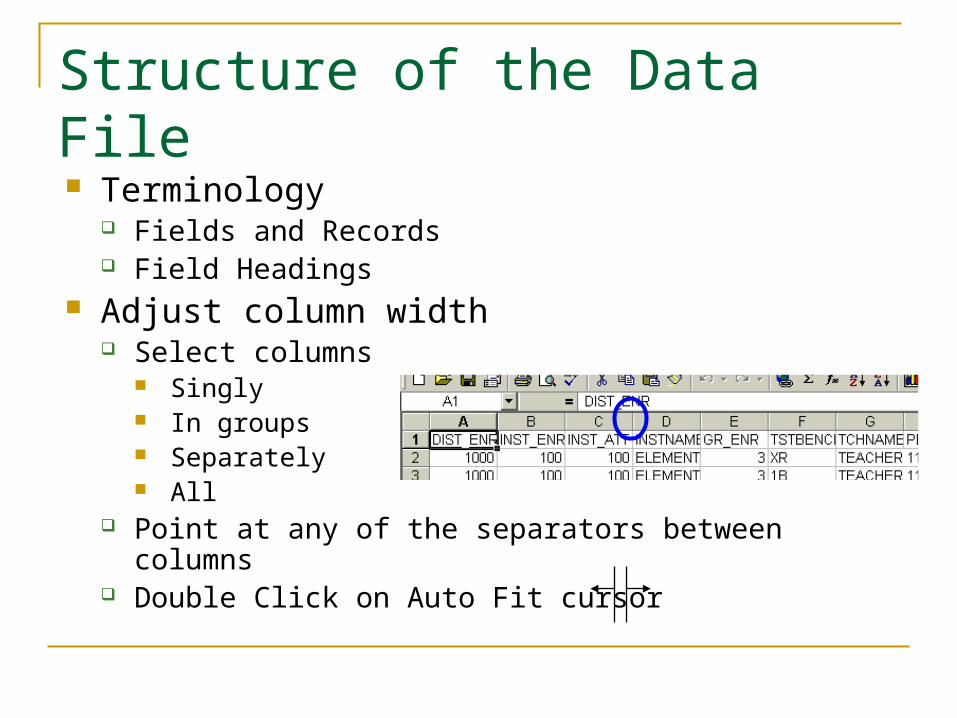
Structure of the Data File
Terminology Fields and Records Field Headings
Adjust column width Select columns
Singly In groups Separately All
Point at any of the separators between columns Double Click on Auto Fit cursor
Structure of the Data File (Cont.)
Save As an Excel Workbook to preserve formatting and formulae Click on File / Save Navigate to Desktop / COSA Workshop folder Set Save as type to Microsoft Excel Workbook (.xls) Click Save
Look at cryptic field headings on Excel file Look them up in Word file Let’s look at what’s here (and what’s not)
Overview of What You’ll Learn Adding useful analysis formulae to calculate the
performance of the group(s) Creating a blank sheet with no data but with all the
calculations Using the blank sheet to create as many sheets
onto which the groups can be copied as you wish Using Auto Filter to isolate the group you want to
study Copying subgroups onto your blank calculation
pages and renaming them appropriately
Adding calculations
Most common calculations Averaging RIT scores Counting Not Mets, Mets, and Exceededs Calculating Percentage Not Met, Met, Exceeded
Let’s create some space for calculations Highlight rows 1 through 9 by clicking on the 1 and
dragging down to 9 and releasing Click on Insert / Rows
Why create space at the top?
Averaging group’s RIT scores
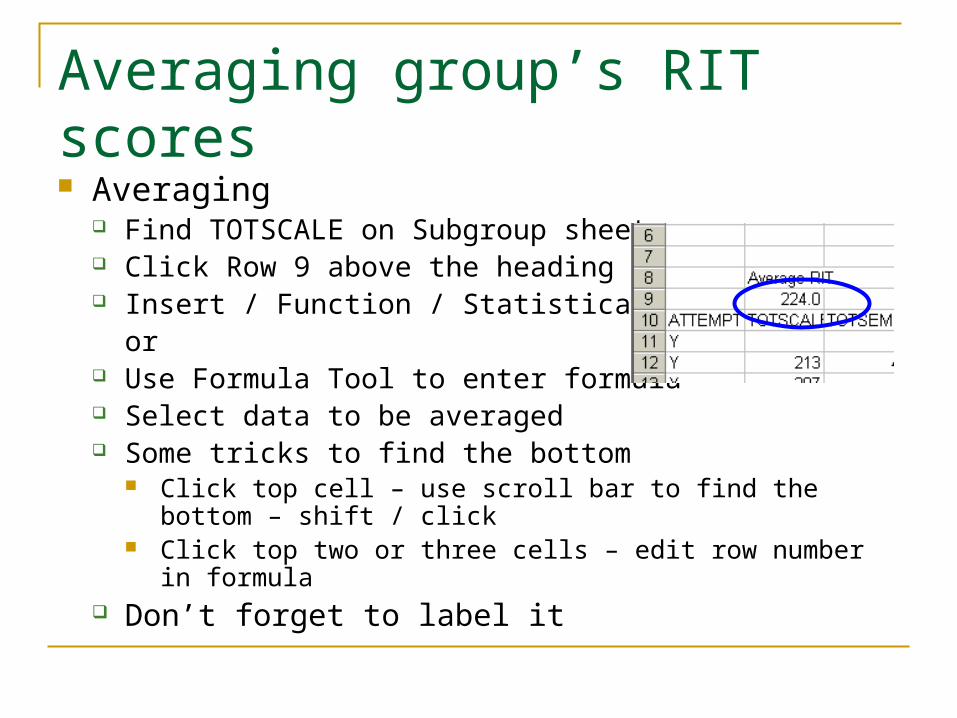
Averaging Find TOTSCALE on Subgroup sheet Click Row 9 above the heading Insert / Function / Statistical / Average
or Use Formula Tool to enter formula Select data to be averaged Some tricks to find the bottom
Click top cell – use scroll bar to find the bottom – shift / click Click top two or three cells – edit row number in formula
Don’t forget to label it
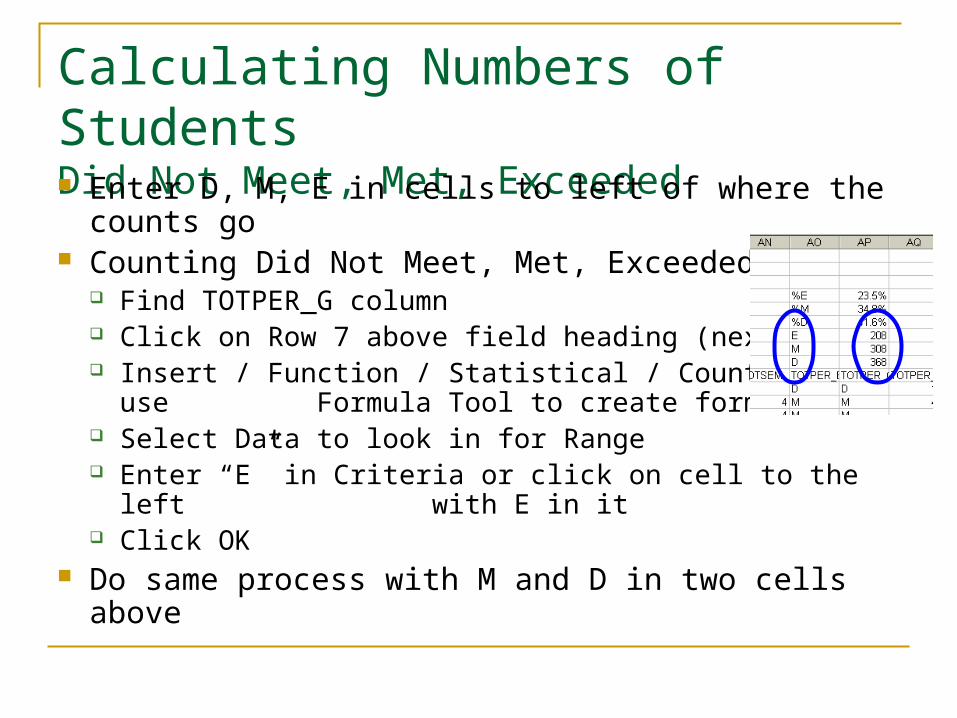
Calculating Numbers of Students Did Not Meet, Met, Exceeded Enter D, M, E in cells to left of where the counts go Counting Did Not Meet, Met, Exceeded
Find TOTPER_G column Click on Row 7 above field heading (next to E) Insert / Function / Statistical / CountIf or use
Formula Tool to create formula Select Data to look in for Range Enter “E” in Criteria or click on cell to the left
with E in it Click OK
Do same process with M and D in two cells above
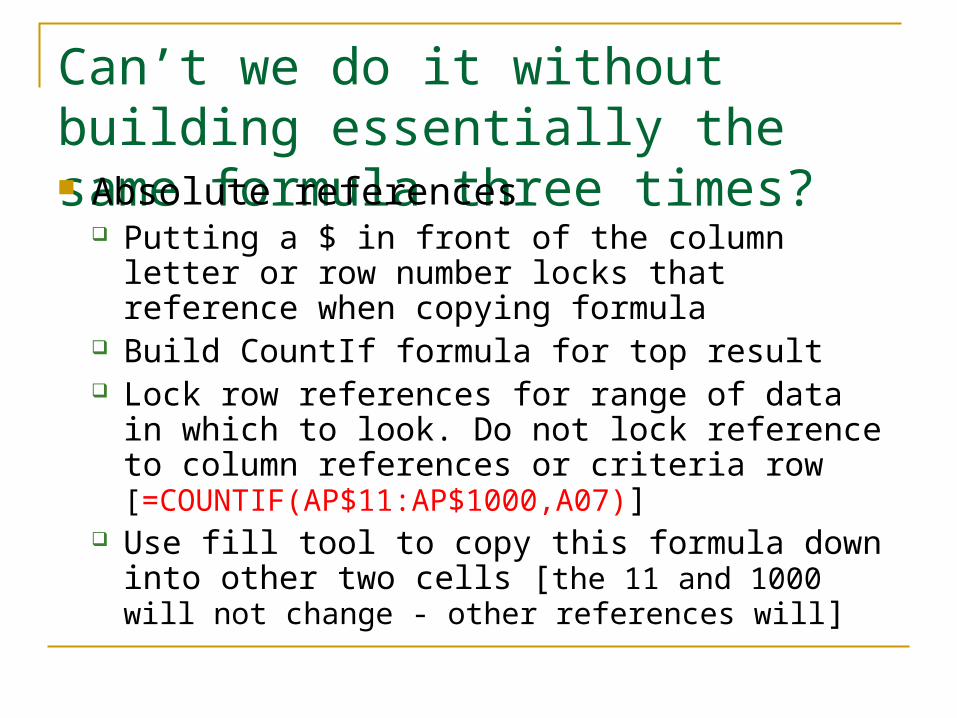
Can’t we do it without building essentially the same formula three times? Absolute references
Putting a $ in front of the column letter or row number locks that reference when copying formula
Build CountIf formula for top result Lock row references for range of data in which to
look. Do not lock reference to column references or criteria row [=COUNTIF(AP$11:AP$1000,A07)]
Use fill tool to copy this formula down into other two cells [the 11 and 1000 will not change - other references will]
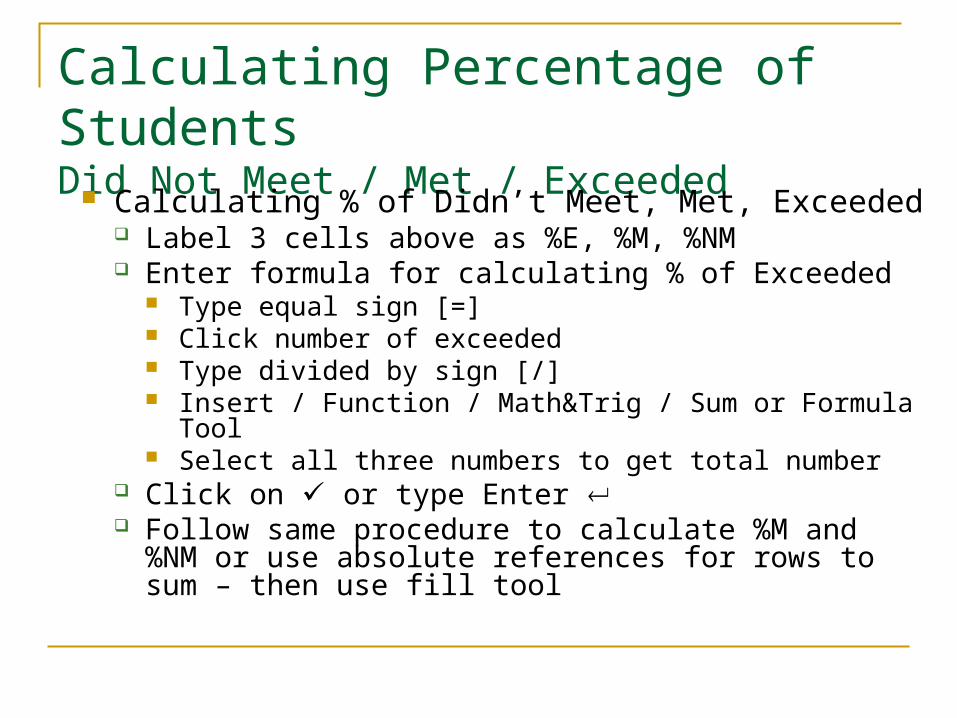
Calculating Percentage of StudentsDid Not Meet / Met / Exceeded Calculating % of Didn’t Meet, Met, Exceeded
Label 3 cells above as %E, %M, %NM Enter formula for calculating % of Exceeded
Type equal sign [=] Click number of exceeded Type divided by sign [/] Insert / Function / Math&Trig / Sum or Formula Tool Select all three numbers to get total number
Click on or type Enter Follow same procedure to calculate %M and %NM or
use absolute references for rows to sum – then use fill tool
Copying Calculations
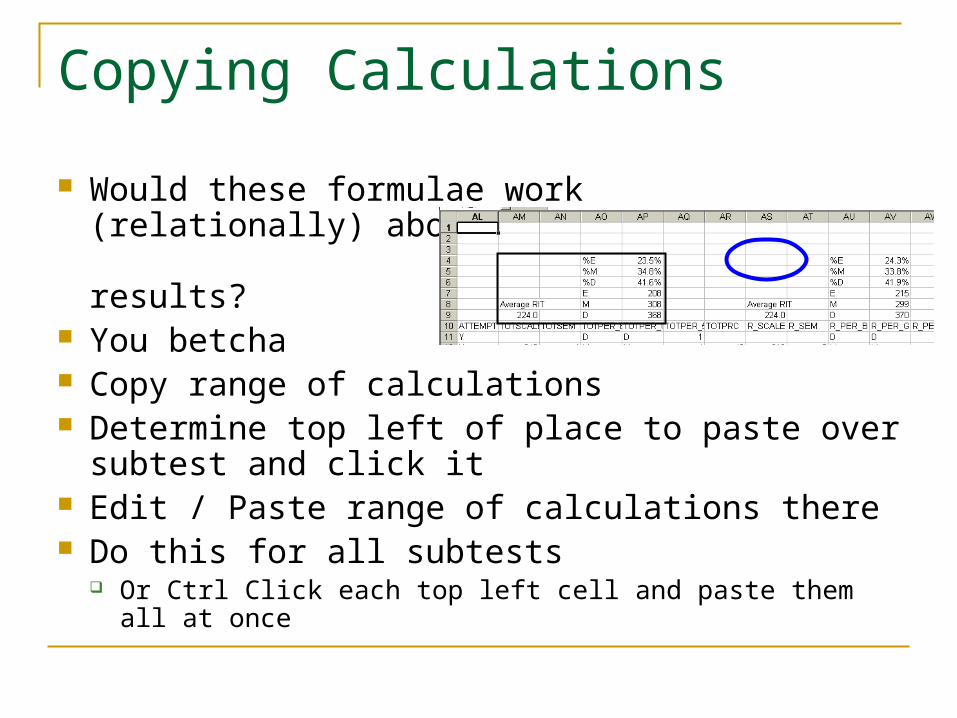
Would these formulae work (relationally) above the subtest results?
You betcha Copy range of calculations Determine top left of place to paste over subtest
and click it Edit / Paste range of calculations there Do this for all subtests
Or Ctrl Click each top left cell and paste them all at once
Let’s Review
You can create space for calculations by inserting rows
You can have the computer average, count, and find percentages using built-in formulae
You can copy the formulae to any place where the data is arranged in the same way
Now let’s separate out some subgroups and put them on their own pages
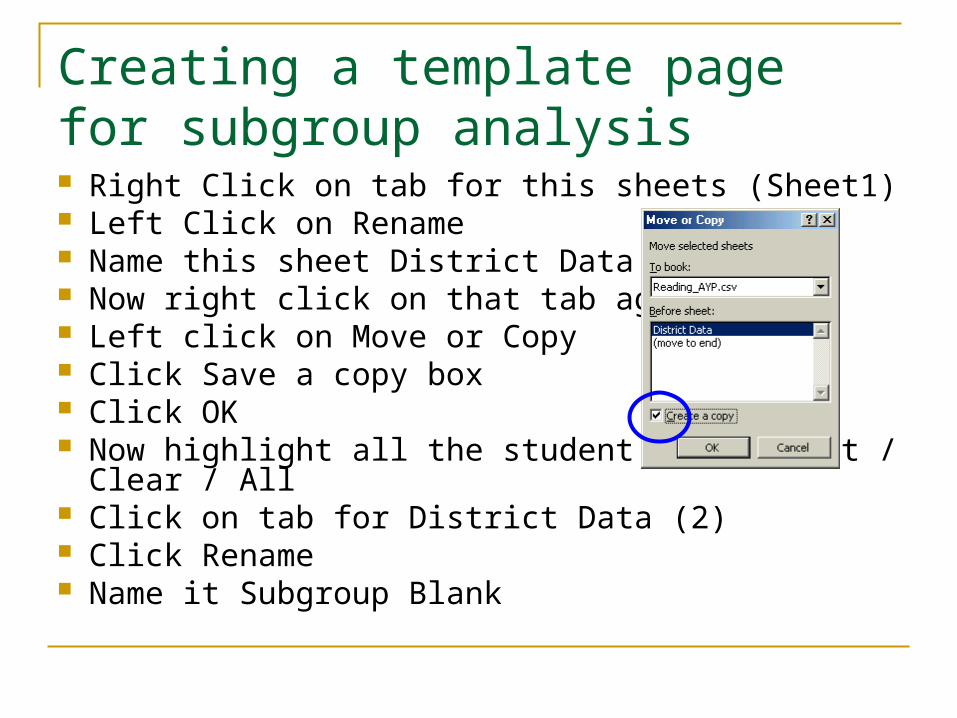
Creating a template page for subgroup analysis Right Click on tab for this sheets (Sheet1) Left Click on Rename Name this sheet District Data Now right click on that tab again Left click on Move or Copy Click Save a copy box Click OK Now highlight all the student data / Edit / Clear / All Click on tab for District Data (2) Click Rename Name it Subgroup Blank
Creating Subgroup Pages
Rearrange the order of the sheet tabs Click and drag the template sheet to the right
Now right click on Subgroup Blank tab Left click on Move or Copy Click on Sheet 2 so the new copy will go before that
sheet Click Create a copy Click OK Do this as many times as you have subgroups
Separating Groups
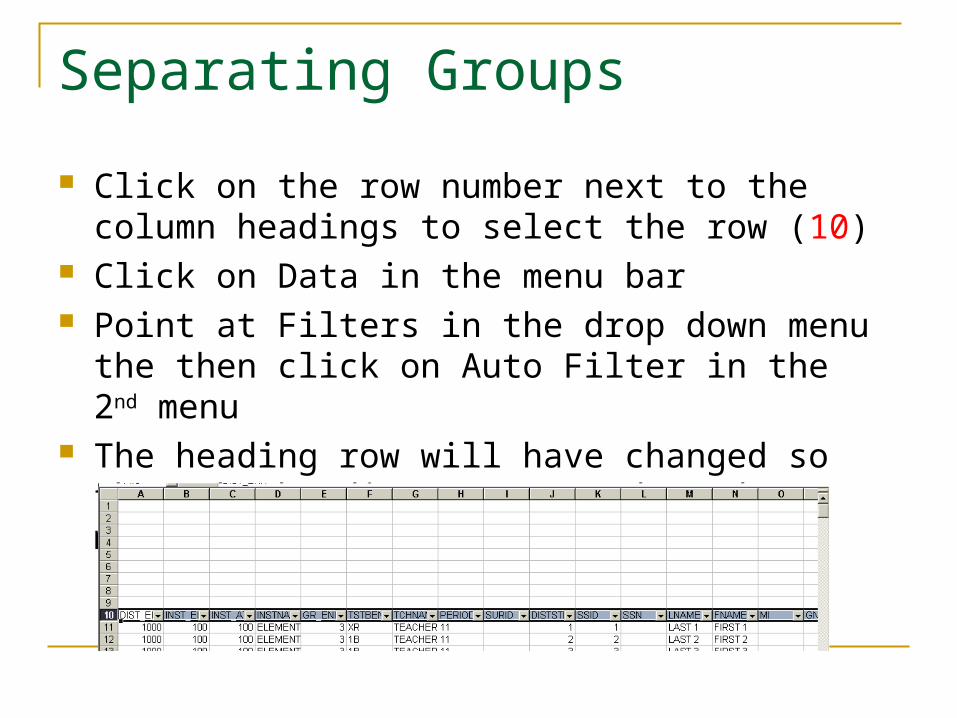
Click on the row number next to the column headings to select the row (10)
Click on Data in the menu bar Point at Filters in the drop down menu the then
click on Auto Filter in the 2nd menu The heading row will have changed so that the
headings are now drop down menus
Separating Groups (cont.)
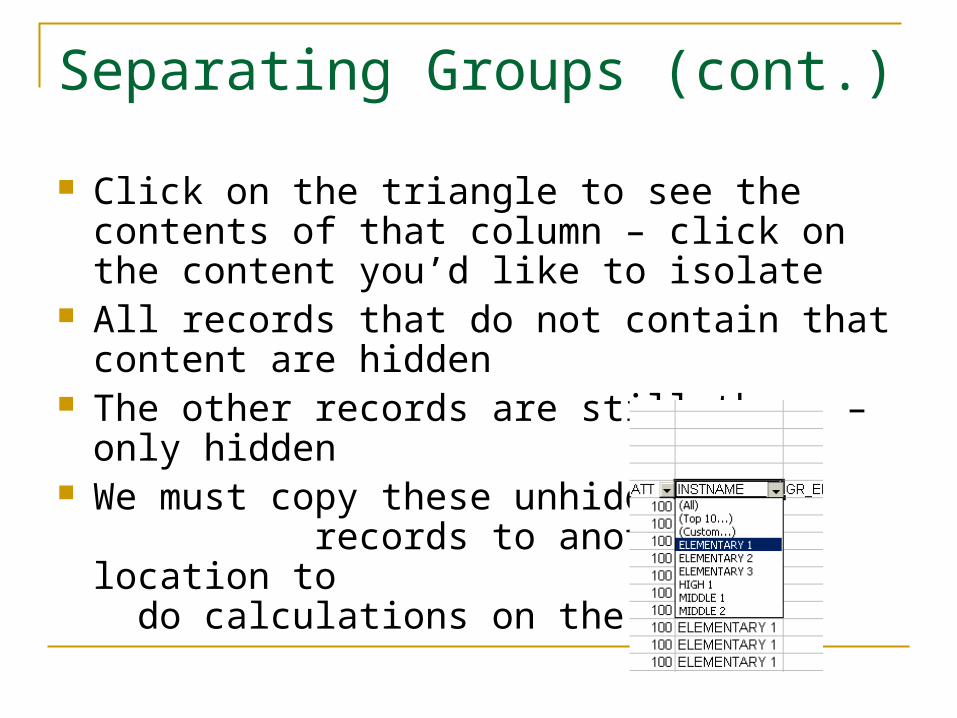
Click on the triangle to see the contents of that column – click on the content you’d like to isolate
All records that do not contain that content are hidden
The other records are still there – only hidden We must copy these unhidden
records to another location to do calculations on the subgroup
Separating Groups (Cont.)
Select the entire group you’ve separated Select the topmost row – click on its number Scroll down to last row of group using scroll bar so you
don’t overrun the end Shift / Click on number of last row
Click on Edit / Copy Click on tab of an empty copy of Subgroup Blank Click on top left cell under headings (A11) Click Edit / Paste Rename to page to reflect the sub-group Go look at the results
Let’s Review
Create a page containing all the calculations but no data
Make as many copies of the blank page as you want Use Data / Filters / Auto Filter to turn on filtering Select contents to preserve by using drop down
menus on headings Select the unhidden group Copy that group to a Subgroup Blank page Rename it Disaggregate as many groups as you want
Printing a Large Spreadsheet
Hiding Columns Do this to multiple sheets (group) at a time?
Rt Click tab – Select All Sheets or Ctrl Click the sheets you want
Select Columns to hide using Ctrl Click Format / Columns / Hide
Unhide by selecting columns on both sides of hidden – then Format / Columns / Unhide
If you selected multiple sheets to hide columns… Can’t print multiple sheets at once Select the one you want to print after making changes
to multiple sheets
Printing a Large Spreadsheet (cont.) Page Setup
Page options Orientation Scaling Paper
Margins Headings / Footers Sheet
Print Area Titles Print Options
Printing a Large Spreadsheet (cont.) View / Page Break Preview
Suggests Breaks based on Page Setup Pull breaks to reduce page contents
Print Preview
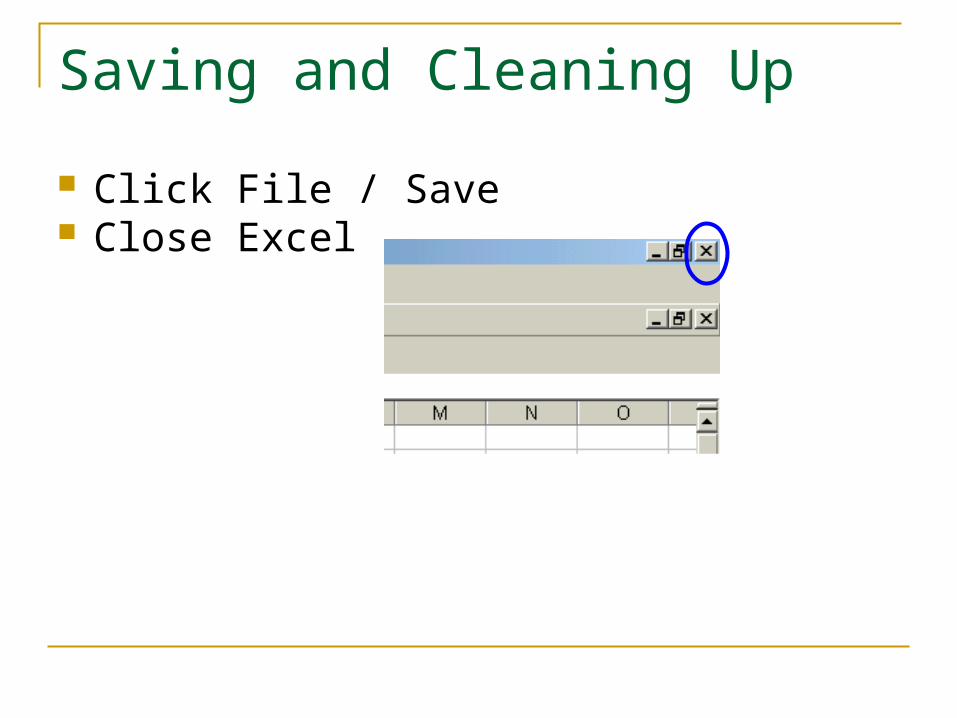
Saving and Cleaning Up
Click File / Save Close Excel
You are now Master Disaggregators!
Use the Slide Show on your CD and the File you’ve just created to do this at home with your data