Embed Size (px)
Citation preview
USING MODAL ANALYSIS TO INVESTIGATE BAT-BALL
PERFORMANCE OF BASEBALL BATS
BY
ANDREW D. SUTTON
B.S. UNIVERSITY OF MASSACHUSETTS LOWELL (2008)
SUBMITTED IN PARTIAL FULFILLMENT OF THE REQUIREMENTS
FOR THE DEGREE OF MASTER OF SCIENCE
DEPARTMENT OF MECHANICAL ENGINEERING
UNIVERSITY OF MASSACHUSETTS LOWELL
Signature of Author: ____________________________________________________
ANDREW D SUTTON Date: __________
Signature of Thesis
Supervisor: ___________________________________________________________
JAMES A. SHERWOOD, PH.D. MECHANICAL ENGINEERING DEPARTMENT, UMASS
LOWELL
Committee Member Signature: ____________________________________________
PETER AVITABILE, PH.D. MECHANICAL ENGINEERING DEPARTMENT, UMASS
LOWELL
Committee Member Signature: ____________________________________________
DANIEL A. RUSSELL, PH. D PHYSICS DEPARTMENT, KETTERING UNIVERSITY
ii
USING MODAL ANALYSIS TO INVESTIGATE BAT-BALL
PERFORMANCE OF BASEBALL BATS
BY
ANDREW D. SUTTON
B.S. UNIVERSITY OF MASSACHUSETTS LOWELL (2010)
SUBMITTED IN PARTIAL FULFILLMENT OF THE REQUIREMENTS
FOR THE DEGREE OF MASTER OF SCIENCE
DEPARTMENT OF MECHANICAL ENGINEERING
UNIVERSITY OF MASSACHUSETTS LOWELL
Signature of Author:
ANDREW D SUTTON Date: MAY 14, 2010
Signature of Thesis Supervisor:
JAMES A. SHERWOOD, PH.D. MECHANICAL ENGINEERING DEPARTMENT, UMASS LOWELL
Committee Member Signature:
PETER AVITABILE, PH.D. MECHANICAL ENGINEERING DEPARTMENT, UMASS LOWELL
DANIEL A. RUSSELL, PH. D PHYSICS DEPARTMENT, KETTERING UNIVERSITY
iii
USING MODAL ANALYSIS TO INVESTIGATE BAT-BALL
PERFORMANCE OF BASEBALL BATS
BY
ANDREW D. SUTTON
SUBMITTED IN PARTIAL FULFILLMENT OF THE REQUIREMENTS
FOR THE DEGREE OF MASTER OF SCIENCE
DEPARTMENT OF MECHANICAL ENGINEERING
UNIVERSITY OF MASSACHUSETTS LOWELL
2010
Thesis Supervisor: James A. Sherwood, Ph.D.
Professor, Department of Mechanical Engineering
iv
ABSTRACT
The relationship between the vibration response of wood and nonwood baseball bats and
batted-ball performance was investigated for a representative set of collegiate and major
league bats of various lengths. The nonwood bats had hollow barrels of either aluminum
or fiber-reinforced composite. The bats were performance tested using a high-speed air
cannon where the baseball was projected at a stationary bat. Performance metrics of Ball
Exit Speed Ratio (BESR), Batted-Ball Speed (BBS) and Bat-Ball Coefficient of
Restitution (BBCOR) were calculated using the speeds measured in the air cannon tests
and the appropriate physical properties of the bats and balls. Modal analysis was
performed on the bats to measure the first and second bending mode frequencies for the
wood and nonwood bats and to measure the first and second hoop mode frequencies of
the nonwood bats. The hoop modes were used to examine the trampoline effect of the
hollow nonwood bats. A nonlinear mass-spring-damper model was used to explore the
effect of the hoop-mode frequency on performance. For wood bats, it was found that the
performance increases as the frequency of the first bending mode increases. For nonwood
bats, it was observed that the performance increases as the frequency of the first hoop
mode approaches the optimal value which is ~1250 Hz.
v
ACKNOWLEDGMENTS
I would like to acknowledge the NCAA (Ty Halpin and Todd Petr) for allowing me to
use baseball bats submitted for certification testing to be used for study in this thesis.
In addition, I would like to thank the following individuals for their support and help with
this research.
Prof. James Sherwood, my graduate advisor, for allowing me to have the
opportunity to perform this research at the Baseball Research Center and for
lending his expertise and support throughout my college career.
Prof. Peter Avitabile, for all his help and support with modal analysis and
vibrations studies.
Prof. Daniel Russell, for all his support and help of modeling the bat-ball
collision.
Patrick Drane, for all of his support and advice on testing and analysis.
Glen Bousquet for allowing the use of mechanical engineering laboratory
equipment.
All of the graduates and undergraduates from the UMLBRC and ACMTRL and
Modal lab for giving me their support: Josh Jones, Matt Broe, Brian Munroe, Tim
Connelly, Renzo Colossimo, Evan Gauthier, Steve Natoli, Jacqueline Buckley,
Zeke Radik, Nicole Rondo, Dr. Samira Farboodmanesh, John Fitek, Joe Sargent,
Konstantine Fetfatsidis, Dave Cloutier, and Chris Warren
I must thank my Father Charlie, Mother Mary, Sister Elizabeth, and most
importantly I must thank my Wife Julie, for their continuous support and
encouragement throughout my life.
vi
Terminology
BESR: Ball Exit Speed Ratio; Bat performance test based on inbound and rebound
speeds of the baseball.
BBCOR: Bat Ball Coefficient Of Restitution; Bat performance test based on inbound
and rebound speeds of the baseball, physical properties of the bat, and the mass of the
baseball.
BBS: Batted-Ball Speed; Calculation of the projected speed of the baseball in the field
based on data from an inbound/rebound performance test and an empirical swing-speed
model.
COR: Coefficient Of Restitution; Measure of the liveliness of the baseball by
comparing the inbound and rebound speeds of a ball impacting a stationary wall.
CCOR: Cylindrical Coefficient Of Restitution; Measure of the liveliness of the baseball
by comparing the inbound and rebound speeds of a ball impacting a steel cylindrical
surface.
MOI: Moment Of Inertia; Often referred to as the ‗swing weight‘ of the bat.
DROP: The numerical difference between the weight of the bat in ounces and the length
of the bat in inches.
vii
Table of Contents
1 INTRODUCTION ...................................................................................................... 1
2 BACKGROUND ........................................................................................................ 4
2.1 BAT PROPERTIES ...................................................................................................... 4 2.1.1 Bat Construction ............................................................................................. 4 2.1.2 Drop ................................................................................................................ 5 2.1.3 Moment of Inertia (MOI) ................................................................................ 6
2.2 SWING SPEED ........................................................................................................... 6 2.3 PERFORMANCE METRICS ......................................................................................... 8
2.3.1 Ball Exit Speed Ratio (BESR) ........................................................................ 8 2.3.2 Batted-Ball Speed (BBS) .............................................................................. 10 2.3.3 Bat-Ball Coefficient of Restitution (BBCOR) .............................................. 10
2.4 DYNAMIC RESPONSE OF BASEBALL BATS .............................................................. 11 2.4.1 Previous Research on the Vibration Response of Bats ................................. 13
2.5 SUMMARY .............................................................................................................. 17
3 METHODOLOGY ................................................................................................... 18
3.1 BAT IDENTIFICATION ............................................................................................. 18 3.2 BASEBALL BAT PROFILING .................................................................................... 19
3.2.1 Bat Profiling – Moment of Inertia ................................................................ 20 3.3 LAB CONDITIONS ................................................................................................... 21 3.4 BASEBALL CONDITIONS ......................................................................................... 22 3.5 PERFORMANCE TESTING ........................................................................................ 23 3.6 MODAL ANALYSIS ................................................................................................. 26 3.7 SUMMARY .............................................................................................................. 30
4 RESULTS ................................................................................................................. 31
4.1 WOOD BAT DATA .................................................................................................. 32 4.1.1 Performance versus MOI .............................................................................. 32 4.1.2 Performance vs. Drop ................................................................................... 35 4.1.3 Correlation of Wood Bat Dynamic Response to Performance ..................... 38
4.2 PERFORMANCE VS. MOI FOR NONWOOD BASEBALL BATS ..................................... 43 4.2.1 BESR vs. MOI for Nonwood Bats ................................................................ 43 4.2.2 BBS vs. MOI for Nonwood Baseball Bats ................................................... 47
viii
4.2.3 BBCOR vs. MOI for Nonwood Baseball Bats ............................................. 51 4.3 PERFORMANCE VS. BENDING FREQUENCY FOR NONWOOD BASEBALL BATS ......... 55
4.3.1 BESR vs. Bending Frequencies .................................................................... 55 4.3.2 BBS vs. First Bending Frequency ................................................................. 58 4.3.3 BBCOR versus First Bending Frequency ..................................................... 61
4.4 MODELING THE TRAMPOLINE EFFECT OF A HOLLOW BASEBALL BAT ................... 64 4.4.1 Bat Model...................................................................................................... 64
4.5 PERFORMANCE VS. THE FIRST HOOP FREQUENCY FOR NONWOOD BASEBALL BATS
68 4.5.1 BESR vs. the First Hoop Frequency for Nonwood Bats .............................. 70 4.5.2 BBS versus the First Hoop Frequency for Nonwood Bats ........................... 73 4.5.3 BBCOR versus Hoop Frequency for Nonwood Bats ................................... 76
4.6 MONITORING A BASEBALL BAT GOING THROUGH AN ACCELERATED BREAK-IN
(ABI) PROCEDURE ......................................................................................................... 78 4.7 THE EFFECT OF THE BASEBALL ON THE HOOP FREQUENCY DURING THE COLLISION
81 4.8 SUMMARY .............................................................................................................. 83
5 CONCLUSIONS....................................................................................................... 86
6 RECOMMENDATIONS .......................................................................................... 89
7 LITERATURE CITED ............................................................................................. 91
APPENDIX A .................................................................................................................. A1
APPENDIX B: .................................................................................................................. B1
APPENDIX C ................................................................................................................... C1
APPENDIX D .................................................................................................................. D1
APPENDIX E: .................................................................................................................. E1
ix
List of Figures
Figure 1: Bending modes of baseball bats ........................................................................ 12 Figure 2: Hoop modes of baseball bats ............................................................................. 13
Figure 3: Mass-spring model of the ball-bat collision [8] ................................................ 15 Figure 4: Normalized collision efficiency versus hoop frequency [8] ............................. 16
Figure 5: Hoop frequency versus batted ball speed [8] .................................................... 17 Figure 6: MOI fixture........................................................................................................ 21 Figure 7: LVSports cannon ............................................................................................... 23 Figure 8: Light gate box .................................................................................................... 25
Figure 9: Baseball bat placed in the free-free condition ................................................... 27 Figure 10: Accelerometer placements on the barrel of the bat ......................................... 27 Figure 11: Coherence function of two accelerometers ..................................................... 28
Figure 12: Overlaid FRF from both accelerometers ......................................................... 28 Figure 13: BESR vs. MOI for wood bats .......................................................................... 32
Figure 14: BBS vs. MOI for wood bats ............................................................................ 34 Figure 15: BBCOR vs. MOI for wood bats ...................................................................... 35 Figure 16: BESR vs. Drop for wood bats ......................................................................... 36
Figure 17: BBS vs. Drop for wood bats ............................................................................ 37
Figure 18: BBCOR vs. Drop for wood bats ...................................................................... 38 Figure 19: BESR vs. First bending frequency for wood bats .......................................... 40 Figure 20: Batted-ball speed vs. First bending frequency for wood bats ........................ 41
Figure 21: Bat-Ball COR vs. First bending frequency for wood bats ............................. 42 Figure 22: BESR vs. MOI for 31-in. nonwood bats ......................................................... 44
Figure 23: BESR vs. MOI for 32-in. nonwood bats ......................................................... 45 Figure 24: BESR vs. MOI for 33-in. nonwood bats ......................................................... 45 Figure 25: BESR vs. MOI for 34-in. nonwood bats ......................................................... 46 Figure 26: BESR vs. MOI for all lengths of nonwood bats .............................................. 46
Figure 27: BBS vs. MOI for all 31-in. nonwood bats ....................................................... 48 Figure 28: BBS vs. MOI for all 32-in. nonwood bats ....................................................... 49 Figure 29: BBS vs. MOI for all 33-in. nonwood bats ....................................................... 49 Figure 30: BBS vs. MOI for all 34-in. nonwood bats ....................................................... 50
Figure 31: BBS vs. MOI for all nonwood bats ................................................................. 50 Figure 32: BBCOR vs. MOI for all 31-in. nonwood bats ................................................. 52 Figure 33: BBCOR vs. MOI for all 32-in. nonwood bats ................................................. 53
Figure 34: BBCOR vs. MOI for all 33-in. nonwood bats ................................................. 53 Figure 35: BBCOR vs. MOI for all 34-in. nonwood bats ................................................. 54 Figure 36: BBCOR vs. MOI for all nonwood bats ........................................................... 54
Figure 37: BESR vs. First bending frequency for all 31-in. nonwood bats ...................... 56
x
Figure 38: BESR vs. First bending frequency for all 32-in. nonwood bats ...................... 56
Figure 39: BESR vs. First bending frequency for all 33-in. nonwood bats ...................... 57 Figure 40: BESR vs. First bending frequency for all 34-in. nonwood bats ...................... 57 Figure 41: BESR vs. First bending frequency for all nonwood bats ................................ 58
Figure 42: BBS vs. First bending frequency for all 31-in. nonwood bats ........................ 59 Figure 43: BBS vs. First bending frequency for all 32-in. nonwood bats ........................ 59 Figure 44: BBS vs. First bending frequency for all 33-in. nonwood bats ........................ 60 Figure 45: BBS vs. First bending frequency for all 34-in. nonwood bats ........................ 60 Figure 46: BBS vs. First bending frequency for all nonwood bats ................................... 61
Figure 47: BBCOR vs. First bending frequency for all 31-in. nonwood bats .................. 62 Figure 48: BBCOR vs. First bending frequency for all 32-in. nonwood bats .................. 62 Figure 49: BBCOR vs. First bending frequency for all 33-in. nonwood bats ................. 63 Figure 50: BBCOR vs. First bending frequency for all 34-in. nonwood bats .................. 63
Figure 51: BBCOR vs. First bending frequency for all nonwood bats ............................. 64 Figure 52: Mass-spring-damper model of the baseball/bat collision ................................ 65
Figure 53: Analytical CCOR data compared to experimental data .................................. 67 Figure 54: Normalized collision efficiency versus Hoop frequency ................................ 68
Figure 55: BESR vs. Hoop frequency for all 31-in. nonwood bats .................................. 71 Figure 56: BESR versus Hoop frequency for all 32-in. nonwood bats ............................ 71 Figure 57: BESR versus Hoop frequency for all 33-in. nonwood bats ............................ 72
Figure 58: BESR versus Hoop frequency for all 34-in. nonwood bats ............................ 72 Figure 59: BBS versus Hoop frequency for all 31-in. nonwood bats ............................... 74
Figure 60: BBS versus Hoop frequency for all 32-in. nonwood bats ............................... 74 Figure 61: BBS versus Hoop frequency for all 33-in. nonwood bats ............................... 75 Figure 62: BBS versus Hoop frequency for all 34-in. nonwood bats ............................... 75
Figure F63: BBCOR versus Hoop frequency for all 31-in. nonwood bats ....................... 76
Figure F64: BBCOR versus Hoop frequency for all 32-in. nonwood bats ....................... 77 Figure F65: BBCOR versus Hoop frequency for all 33-in. nonwood bats ....................... 77 Figure 66: BBCOR versus Hoop frequency for all 34-in. nonwood bats ......................... 78
Figure 67: BESR vs. Hoop frequency for ABI test of one bat ......................................... 79 Figure 68: BBS vs. Hoop frequency for ABI test of one bat ............................................ 80
Figure 69: BBCOR vs. Hoop frequency for ABI test of one bat ...................................... 80 Figure 70: (a) Baseball impacting an aluminum baseball bat (b) Finite element model of
a baseball impacting an aluminum baseball bat ................................................................ 83 Figure A1: Aluminum cylinder in a simulated free-free condition with points labeled .... 1 Figure A2: ME-Scope animation of the first mode shape of the aluminum cylinder ........ 2 Figure A3: Measured FRF of aluminum cylinder using two accelerometers ..................... 3 Figure A4: Labeled barrel of baseball bat........................................................................... 4
Figure A5: ME-Scope animation of the first hoop mode of a baseball bat barrel .............. 5
Figure A6: Accelerometers mounted on the barrel of the bat approximately 90 degrees
apart..................................................................................................................................... 5 Figure A7: Baseball bat barrel FRF of two accelerometers overlaid................................. 6 Figure C1 BBS vs. MOI for 32-in. nonwood bats with BBCOR certification bats ............ 1 Figure C2: BBS vs. MOI for 33-in. nonwood bats with BBCOR cert bats ........................ 2 Figure C3: BBS vs. MOI for 34-in. nonwood bats with BBCOR cert bats ........................ 2 Figure E1: Roller used in ABI procedure .......................................................................... 1
xi
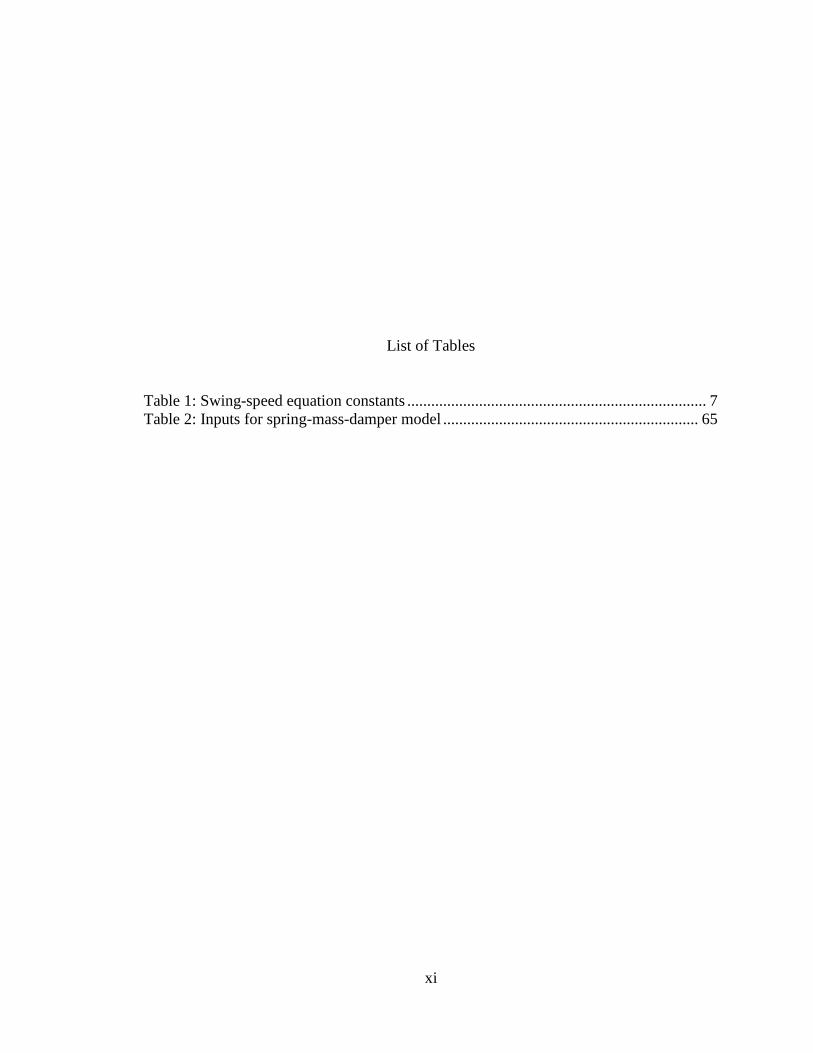
List of Tables
Table 1: Swing-speed equation constants ........................................................................... 7
Table 2: Inputs for spring-mass-damper model ................................................................ 65
1
1 INTRODUCTION
Nonwood baseball bats were introduced to amateur baseball in the 1970s. The
first nonwood bats were aluminum. These bats had an initial higher cost than wood
baseball bats but were more durable than wood and could last an entire season or
more. Youth leagues, high schools and colleges were drawn to the cost-saving
potential offered by replacing their wood bats with aluminum bats. Bat designers
soon found another potential in these bats over wood—increased batted-ball speeds
(BBS). Over the past 40 years, these nonwood bats have become a majority of the
bats sold in the baseball market and the cost advantage has been overshadowed by the
performance advantage.
In the 1990s, aluminum baseball bats started to increase in performance as
manufacturers began to understand how to take advantage of the additional design
options that were available with a hollow bat design over that of solid wood. By
reducing the weight of the bat, a player was able to swing the bat faster and make
contact with the ball more consistently. Manufactures were able to increase the barrel
size from wood, which had been typically around 2½ in., to 2¾ in. without adding
2
swing weight. It was soon realized that thin walls in the barrel could develop a
―trampoline effect‖ on the barrel of the baseball bat. The trampoline effect is only
found in hollow-barrel baseball bats and can be recognized by the pinging sound
heard when the bat-ball collision takes place on aluminum-barrel bats.
In the past decade, manufacturers have also been producing bats made of
composite materials, using carbon and glass fibers embedded in a resilient polymer
matrix. Composites can exhibit good damping and, hence, can be used to help reduce
the stinging sensation a player feels in his hands when the baseball is not hit on the
―sweet spot‖ location of the barrel. However, the biggest advantage composites have
is the ability to design and control the properties of the bat more than what can be
done with aluminum. In contrast to the ping of aluminum bats, composite-barrel bats
make a ―thud‖ sound during the impact with the ball.
The trampoline effect and the stinging sensation are due to modal
characteristics of the bat. The stinging sensation can be attributed to the bending
modes over the length of the bat, in which the bat bends and flexes much like a guitar
string. The trampoline effect is a dynamic response of the barrel of the bat where the
barrel moves in and out, as in a trampoline, during the collision between the bat and
the ball. The trampoline effect is also known as a hoop mode (or bell mode) of the
barrel of the bat.
Previous research has been performed to investigate the ―inertial properties‖
(length, weight, moment of inertia) of the bats as they relate to and affect the
performance characteristics of baseball bats. This previous research has helped bat
companies to understand how to produce a high-performing baseball bat and has
3
given the governing bodies insight as to what properties need to be regulated to
ensure the balance of the game does not become compromised by increased offense.
For example, the NCAA has placed regulations on the minimum weights, the
minimum moment of inertia, and maximum performance for the baseball bats used in
its games [1, 2]. Some research has been directed toward studying the relationship
between the modal properties of baseball bats and batted-ball performance [3-8], but
there has been no comprehensive modal study for a representative set of bats that are
currently used in colligate and high school baseball. The goal of this thesis is to
perform such a comprehensive study.
The scope of this thesis is to investigate the relationship among bending and
hoop modes and batted-ball performance for wood and nonwood bats. Modal
analysis is used to measure the natural frequencies of the bending and hoop modes of
a representative sample of baseball bats. Models of the bat-ball collision are used to
determine the effects of hoop mode frequencies on performance. The effect the
baseball has on the hoop mode, while in contact with the bat, is investigated using
finite element models of a bat-ball collision. Various performance metrics are
measured using a high-speed air cannon. This research will give an improved
understanding of the dynamic effects that the bat and baseball contribute to the
overall performance of the baseball bat.
4
2 BACKGROUND
This chapter will discuss the different materials used to make baseball bats and their
relevance to bat performance. The performance metrics of Ball Exit Speed Ratio
(BESR), Bat-Ball Coefficient of Restitution (BBCOR), and Batted-Ball Speed (BBS) will
be presented. The importance of moment of inertia (MOI) and swing speed will be
discussed. Previous models used in research describing the relationship of the natural
frequencies of softball bats to performance will be reviewed.
2.1 Bat Properties
Brief descriptions of various bat properties are presented in the following sections.
2.1.1 Bat Construction
A traditional baseball bat used in the major leagues is required to be made from a
single piece of solid wood, while bats used in college and high school baseball are
allowed to be constructed of more than one piece of wood, e.g. laminated strips of wood,
5
and several different materials. The most common materials used in college and high
school bats are aluminum and composites. Composite baseball bats are comprised of
either carbon or glass fibers or a combination of the two. The most common barrel
construction is a single-walled barrel, but there are also multi-walled bats.
According to the NCAA specifications, a baseball bat can be composed of multiple
pieces or sections, e.g. a composite handle paired with an aluminum barrel. To prohibit
any modifications to the bat by the end user, the bat is required to be tamperproof.
2.1.2 Drop
The NCAA bat specifications prescribe a maximum allowable drop. The intent of
the NCAA drop rule is to ensure that the overall weight of the nonwood bat is not
significantly different from that of a typical solid wood bat. The drop of a bat is defined
by:
Drop = weight - length (1)
where the weight is measured in ounces and the length is measured in inches. The most
common drop is the largest drop that is allowed for an NCAA certified bat, i.e. -3. Most
companies produce and sell -3 drop bats because the lighter the bat the easier it is to
swing. However, manufacturers are able to distribute weight in the bat to affect the
Moment of Inertia, which in turn influences the swing speed. In this thesis, only -3 (by
classification) drop bats were considered for nonwood bats. Any bat with a drop between
6
2.1 and 3.0 oz from its length in inches is classified as a -3 drop bat. The MOI is
specified with respect to an axis located 6 in. from the base of the knob.
2.1.3 Moment of Inertia (MOI)
The NCAA baseball rules also specify a minimum allowable MOI (weight moment
of inertia). The intent of the minimum allowable MOI is to ensure that the swing weight
of a nonwood bat is not significantly different from that of a solid wood bat. The drop of
the bat and how the bat is weighted, i.e. mass added by putting a polymer or similar filler
in the handle and the barrel ends of the bat, affects the total MOI of the bat. The MOI is
best considered to be the effective swing weight of the bat. As the MOI of the bat
increases, the harder it is for the bat to be swung. The MOI of a solid wood bat is a result
of the wood used, and thus there is little that can be done to vary the MOI of a wood bat
other than by varying the profile of the bat, i.e. diameters of the barrel, handle and taper.
Because the weight distribution of a nonwood bat can potentially be varied for any
location along the bat by changes in diameter, wall thickness and addition of mass, the
NCAA has imposed regulations stating minimum allowable MOI values for each length
of bat.
2.2 Swing Speed
The swing speed is a result of the combination of the bat MOI and the strength of
the player. Several different swing-speed models have been developed based on MOI by
Fleisig [9], Adair [10], Nathan [11] and Bahill [12].
One of the most comprehensive swing-speed studies was by Crisco and Greenwald
[13]. They used high school and collegiate level bats and players in a batting cage, where
7
the conditions were very controlled and repeatable. A laser system was used to track ball
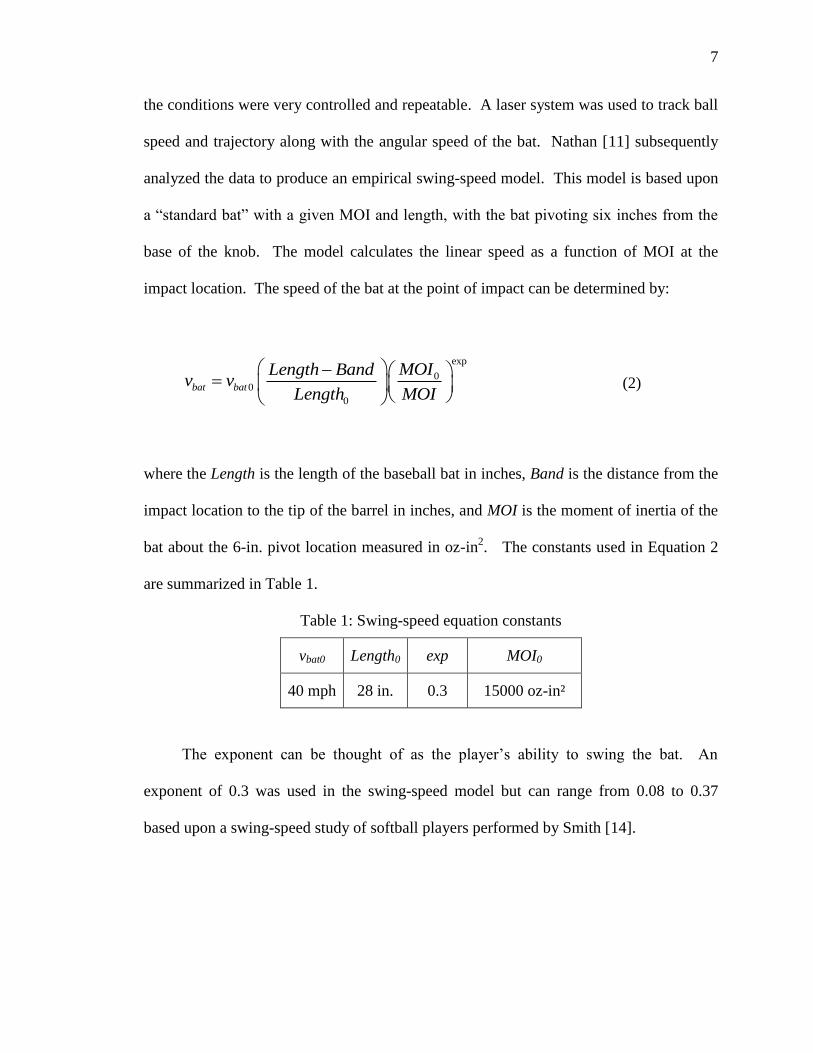
speed and trajectory along with the angular speed of the bat. Nathan [11] subsequently
analyzed the data to produce an empirical swing-speed model. This model is based upon
a ―standard bat‖ with a given MOI and length, with the bat pivoting six inches from the
base of the knob. The model calculates the linear speed as a function of MOI at the
impact location. The speed of the bat at the point of impact can be determined by:
exp
00
0
bat bat
MOILength Bandv v
Length MOI
(2)
where the Length is the length of the baseball bat in inches, Band is the distance from the
impact location to the tip of the barrel in inches, and MOI is the moment of inertia of the
bat about the 6-in. pivot location measured in oz-in2. The constants used in Equation 2
are summarized in Table 1.
Table 1: Swing-speed equation constants
vbat0 Length0 exp MOI0
40 mph 28 in. 0.3 15000 oz-in²
The exponent can be thought of as the player‘s ability to swing the bat. An
exponent of 0.3 was used in the swing-speed model but can range from 0.08 to 0.37
based upon a swing-speed study of softball players performed by Smith [14].
8
2.3 Performance Metrics
This research will consider several different metrics to quantify bat performance.
The Ball Exit Speed Ratio, Batted-Ball Speed, and Bat-Ball Coefficient of Restitution are
the metrics currently used to quantify the performance of a baseball bat. Each of these
metrics analyzes the effectiveness of the bat-ball collision in its own particular manner.
2.3.1 Ball Exit Speed Ratio (BESR)
The BESR test is the metric used to certify bats for the NCAA for bats used
between 2000 and 2010. This metric was first used in September 1999 in preparation for
bats used in 2000. The test involves the measurements of the inbound (pitched) and
rebound (batted) speeds of the baseball. The BESR test can be used for any combination
of bat-ball scenarios from a moving bat and stationary ball (tee test), to a moving bat and
ball, to a moving ball and stationary bat. In the currently implemented test setup for
measuring BESR, the moving ball and stationary bat is method is used. The bat is
initially at rest but is allowed to pivot about the 6-in. location on the handle—as
measured from the base of the knob. A ball is ―pitched‖ at the bat at a speed that
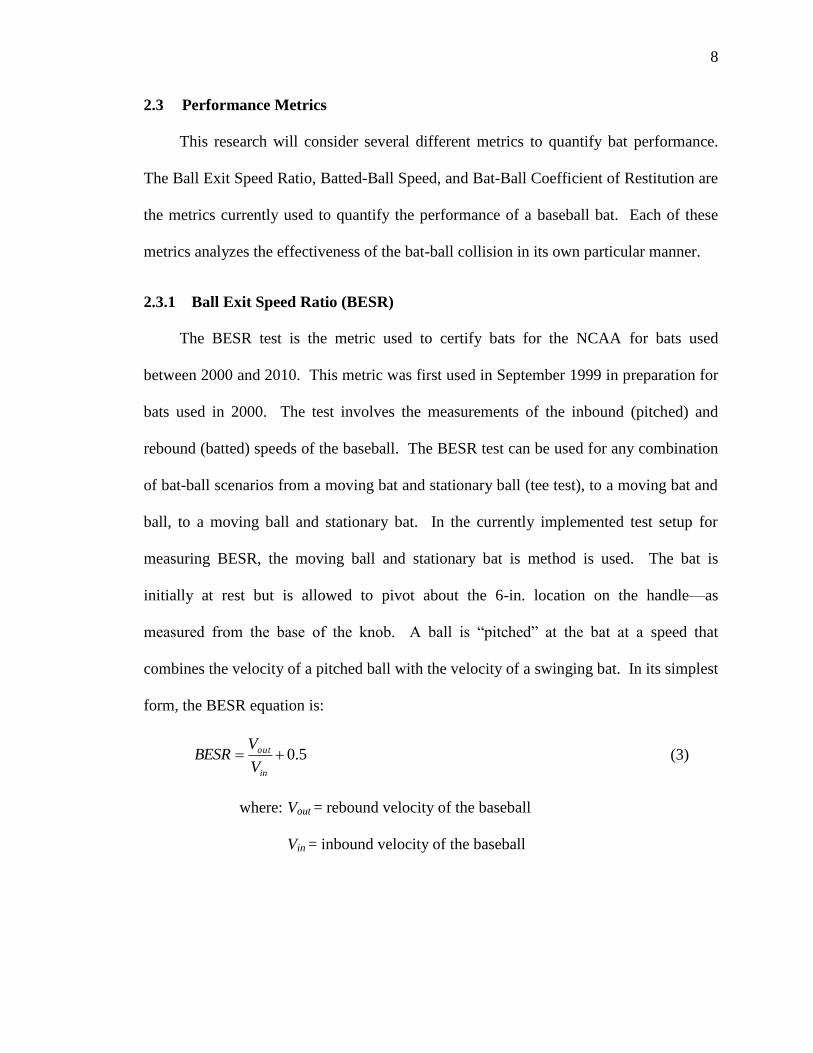
combines the velocity of a pitched ball with the velocity of a swinging bat. In its simplest
form, the BESR equation is:
5.0in
out
V
VBESR (3)
where: Vout = rebound velocity of the baseball
Vin = inbound velocity of the baseball
9
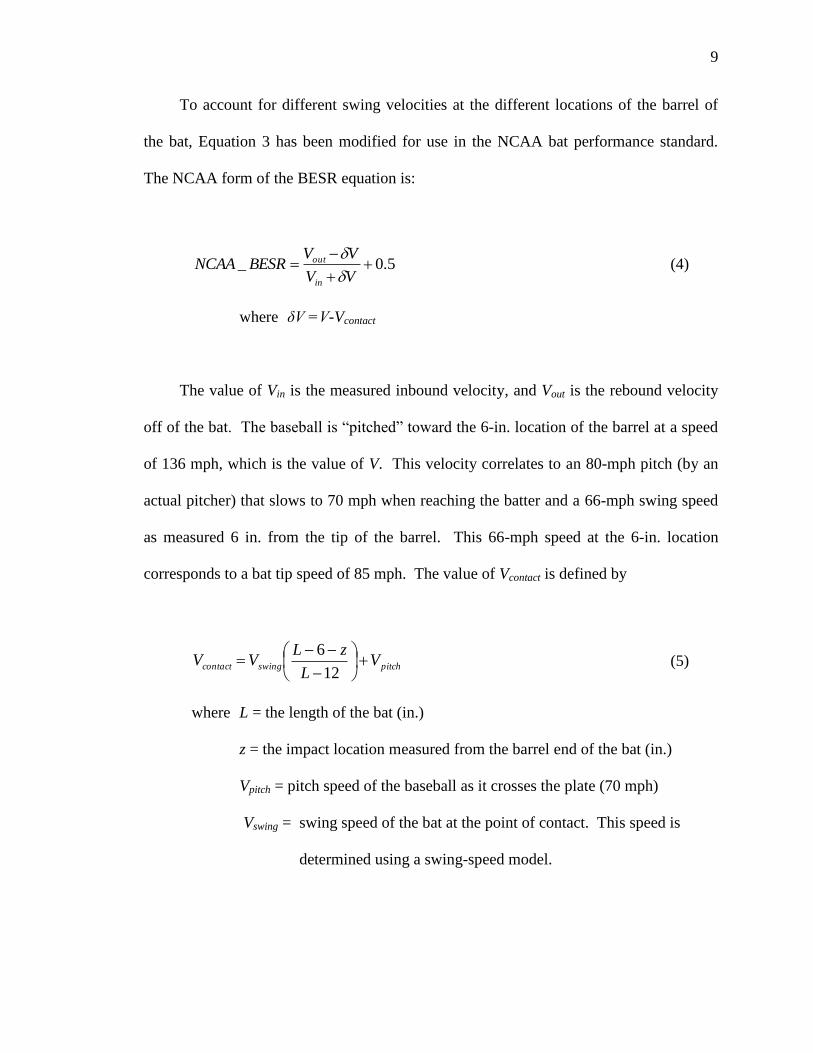
To account for different swing velocities at the different locations of the barrel of
the bat, Equation 3 has been modified for use in the NCAA bat performance standard.
The NCAA form of the BESR equation is:
5.0_
VV
VVBESRNCAA
in
out
(4)
where δV =V-Vcontact
The value of Vin is the measured inbound velocity, and Vout is the rebound velocity
off of the bat. The baseball is ―pitched‖ toward the 6-in. location of the barrel at a speed
of 136 mph, which is the value of V. This velocity correlates to an 80-mph pitch (by an
actual pitcher) that slows to 70 mph when reaching the batter and a 66-mph swing speed
as measured 6 in. from the tip of the barrel. This 66-mph speed at the 6-in. location
corresponds to a bat tip speed of 85 mph. The value of Vcontact is defined by
pitchswingcontact VL
zLVV
12
6 (5)
where L = the length of the bat (in.)
z = the impact location measured from the barrel end of the bat (in.)
Vpitch = pitch speed of the baseball as it crosses the plate (70 mph)
Vswing = swing speed of the bat at the point of contact. This speed is
determined using a swing-speed model.
10
2.3.2 Batted-Ball Speed (BBS)
The batted-ball speed is the speed of the ball immediately after the batter has hit the
ball with the bat. This metric quantifies bat performance on the field of play, where the
speed of the baseball as it comes off the bat can be measured. The BBS accounts for the
total momentum of the collision between the ball and the bat. The BBS equation is given
by:
5.05.0 BESRVBESRVBBS swingpitch (6)
where: Vpitch = the speed of the pitch as it crosses the plate
Vswing = the speed of the bat at the contact point.
The BBS values calculated in this thesis use the swing-speed model developed by Nathan
[11] as described in Section 2.2.
2.3.3 Bat-Ball Coefficient of Restitution (BBCOR)
The Bat-Ball Coefficient of Restitution (BBCOR) is a performance metric that
accounts for the inertial effects of the bat and ball. This metric correlates the effect of
MOI of the bat based on the impact location of the ball and the pivot location. The
BBCOR equation is given by:
kkBESRBBCOR )1(5.0 (7)
where: MOI
xmk ball
2
11
and where mball is the mass of the ball in oz, x is the distance between the pivot location
and the impact location in inches and the MOI is the moment of inertia about the pivot
location.
2.4 Dynamic Response of Baseball Bats
A baseball player can feel the dynamic response of a wood baseball bat when the
bat makes contact with the ball. The dynamic response of a wood baseball bat during the
collision excites the bending modes of the bat. The most predominant modes noticed by
a player are the first and second bending modes, in which the player will notice a sting in
their hands. In a nonwood hollow bat, hoop modes (also known as bell modes) exist in
the barrel, and these modes are excited during the collision along with the bending
modes. The presence of the hoop modes is most noticeable to the casual observer by the
pinging sound that is heard after contact of the ball with an aluminum bat.
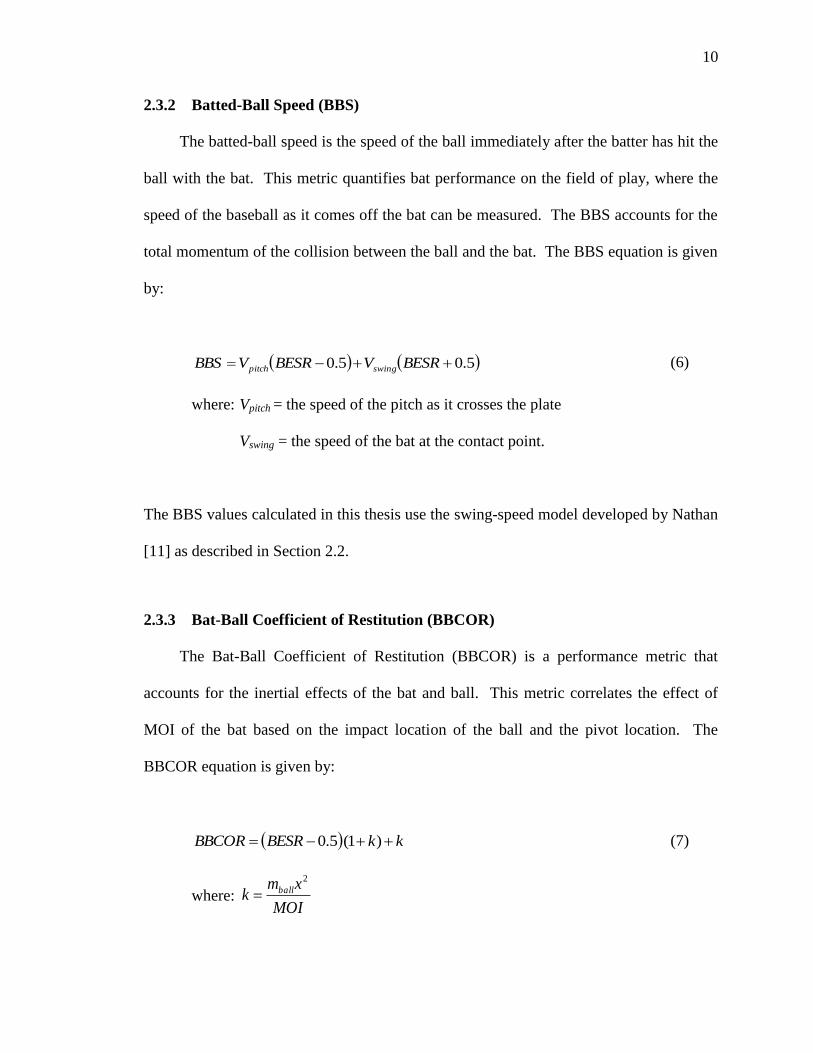
Figure 1 shows the first three bending modes that a baseball bat exhibits. The knob
of the baseball bat is on the left-hand side. The frequencies shown above each bending
mode are an approximate typical value for wood baseball bats. The dots located on each
of the modes represent the nodes of the modes. The nodes of the modes are locations on
the bat where if an input excitation is placed at a node location, that mode will not be
excited. The node for the first bending mode on the barrel is located approximately 6 in.
from the end cap. The node on the barrel for the second bending mode is approximately
5 in. from the end cap. The region between the nodes for the first and second mode is
related to the ―sweet zone‖ location as defined by Cross [3]. This area will cause little
excitation of both modes and have a good feel to a player when a baseball is hit in this
section of the bat.
12
Figure 1: Bending modes of baseball bats
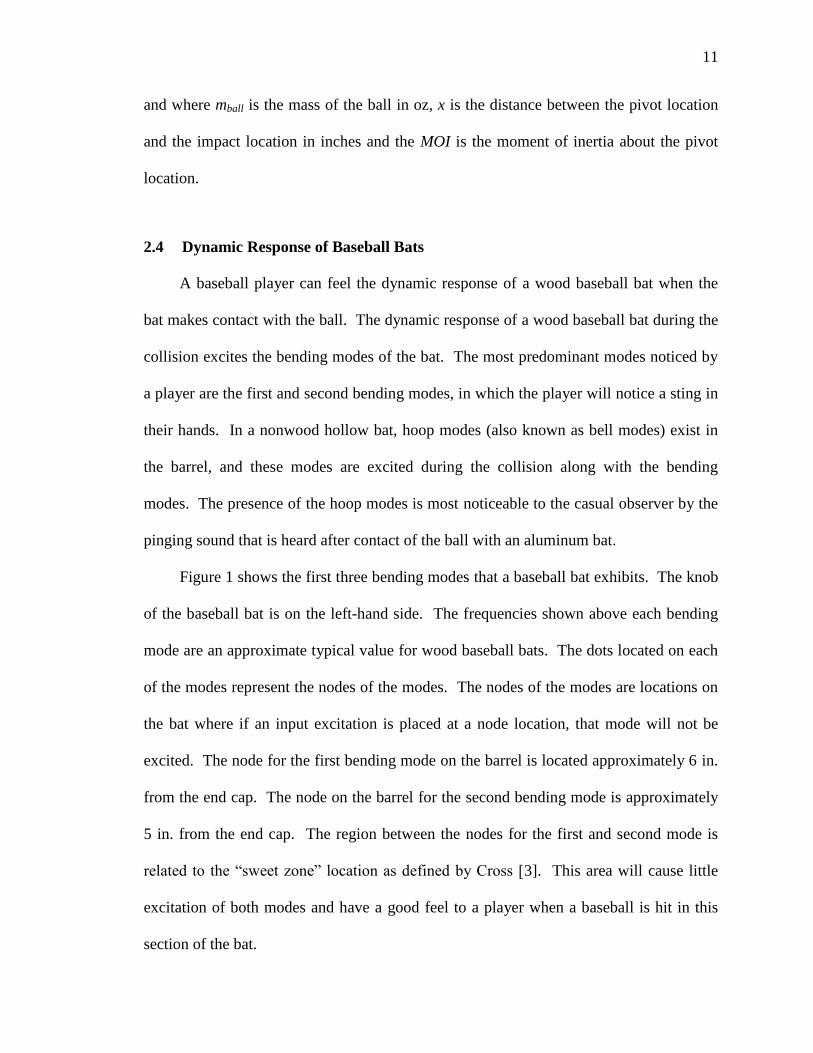
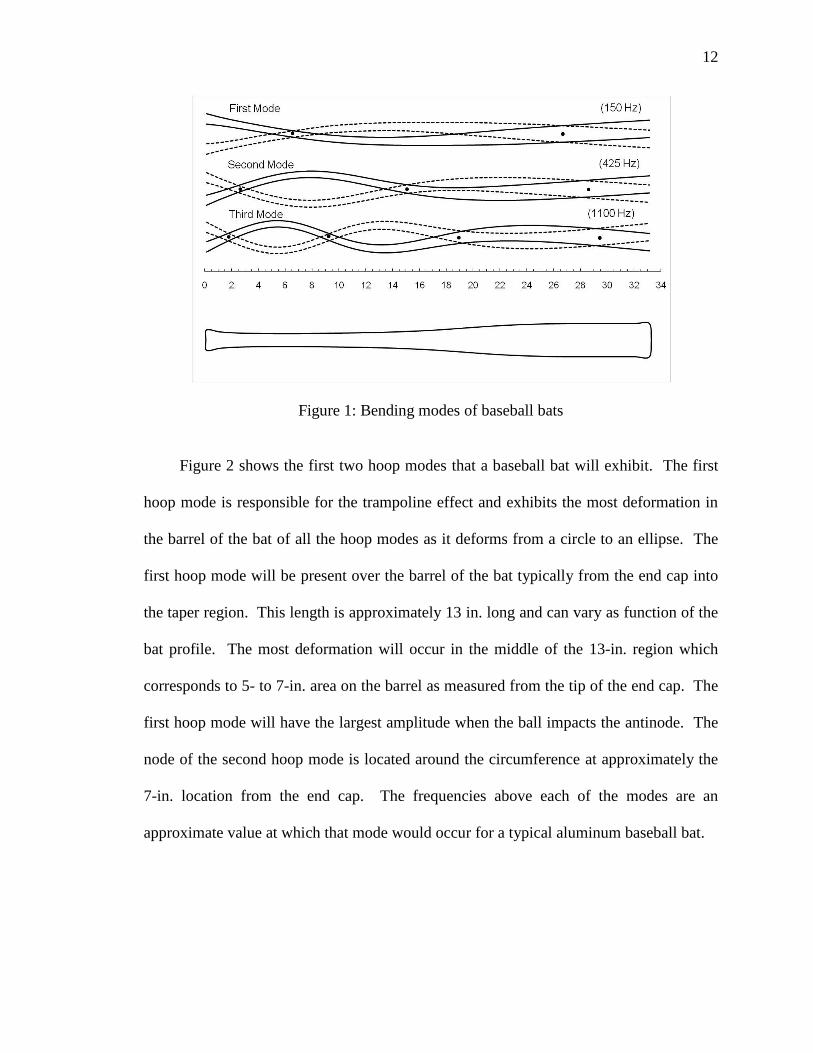
Figure 2 shows the first two hoop modes that a baseball bat will exhibit. The first
hoop mode is responsible for the trampoline effect and exhibits the most deformation in
the barrel of the bat of all the hoop modes as it deforms from a circle to an ellipse. The
first hoop mode will be present over the barrel of the bat typically from the end cap into
the taper region. This length is approximately 13 in. long and can vary as function of the
bat profile. The most deformation will occur in the middle of the 13-in. region which
corresponds to 5- to 7-in. area on the barrel as measured from the tip of the end cap. The
first hoop mode will have the largest amplitude when the ball impacts the antinode. The
node of the second hoop mode is located around the circumference at approximately the
7-in. location from the end cap. The frequencies above each of the modes are an
approximate value at which that mode would occur for a typical aluminum baseball bat.
13
Figure 2: Hoop modes of baseball bats
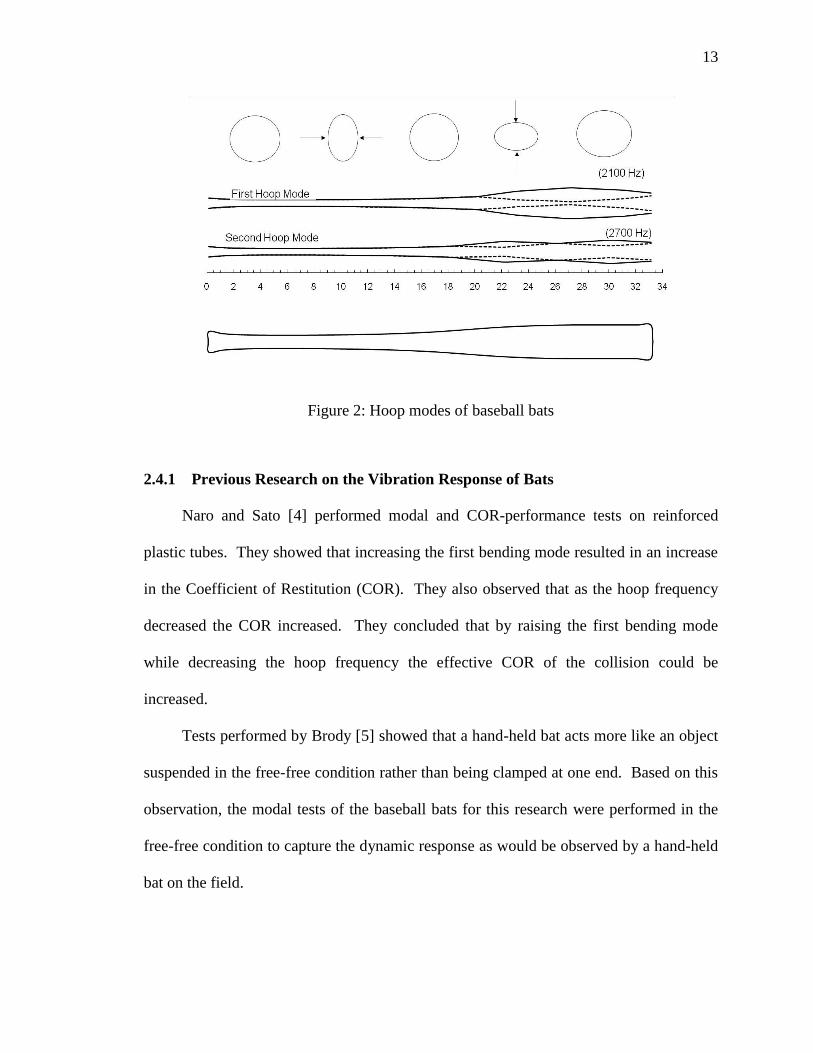
2.4.1 Previous Research on the Vibration Response of Bats
Naro and Sato [4] performed modal and COR-performance tests on reinforced
plastic tubes. They showed that increasing the first bending mode resulted in an increase
in the Coefficient of Restitution (COR). They also observed that as the hoop frequency
decreased the COR increased. They concluded that by raising the first bending mode
while decreasing the hoop frequency the effective COR of the collision could be
increased.
Tests performed by Brody [5] showed that a hand-held bat acts more like an object
suspended in the free-free condition rather than being clamped at one end. Based on this
observation, the modal tests of the baseball bats for this research were performed in the
free-free condition to capture the dynamic response as would be observed by a hand-held
bat on the field.
14
Noble [6] theorized that the performance of bats will increase as the bending
stiffness of the bat increases thereby resulting in higher natural frequencies for the
bending modes. According to Noble, manufacturers should tune the vibration
characteristics of the bending and diving board modes to produce the best performing
bats.
Noble [7] performed studies that looked at the ―diving board mode‖ or
―springboard‖ effect of softball bats where the bat was considered to be fixed at the knob
end such that the bat acted like a cantilever beam. The experiments were performed
using college males and females and several high-performing aluminum softball bats. A
strain gauge on the handle measured the vibration response of the bat as the players hit
softballs. A radar gun was used to record the rebound velocity of the ball. Noble found
that the oscillation from the bat did not correlate to a cantilever boundary condition.
Noble also did not find a correlation between the diving board mode and performance for
the study performed.
Russell [8] studied the effect of hoop frequency as a predictor of performance for
softball bats. Russell used a two degree of freedom system model from a golf ball model
that was previously developed by Cochran [15]. Russell‘s model predicted the
performance of softball bats given different hoop frequencies. A nonlinear spring was
chosen for the ball to describe the reaction of the ball coming into contact with the bat.
The barrel of the bat was considered to be a simple mass, spring and dashpot system.
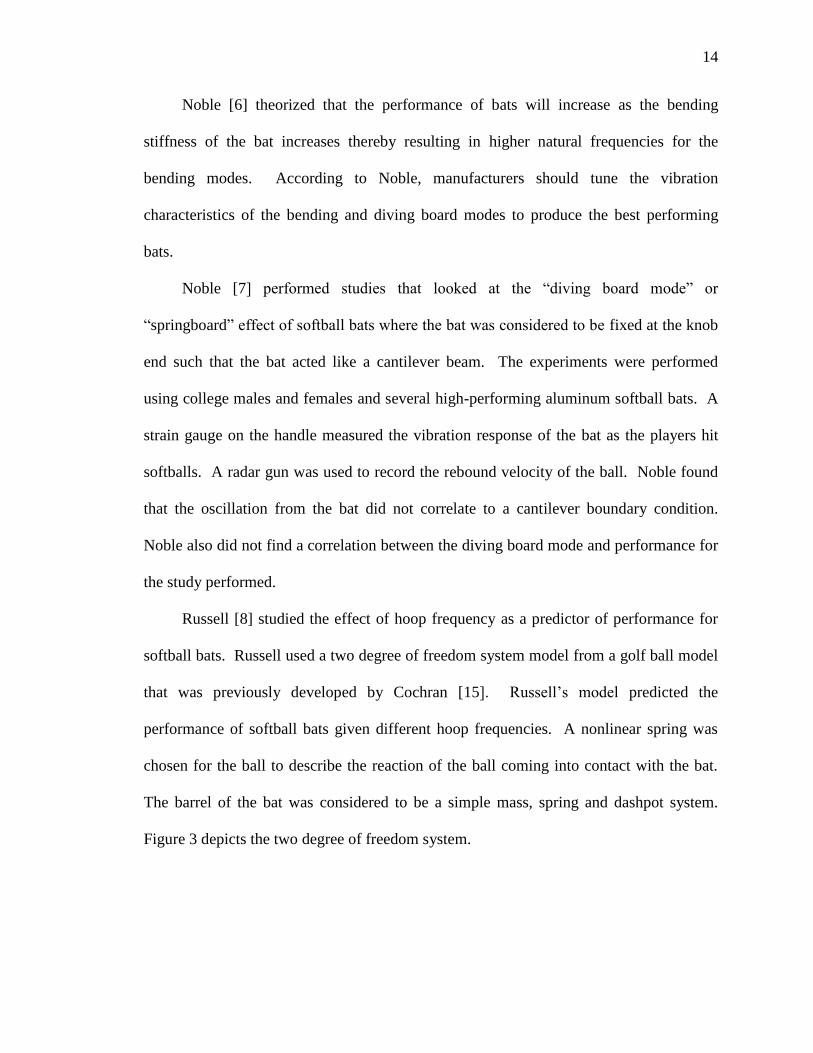
Figure 3 depicts the two degree of freedom system.
15
Figure 3: Mass-spring model of the ball-bat collision [8]
The equations of motion for the system shown in Figure 3 are:
baxxxxcxxxxkxm 212112121111 (8a)
baxxxxcxxxxkxcxkxm 212112121122222 (8b)
Russell found the properties for the softball to be m1=0.180 kg, k1 =40.6*106 N/m
and c1= 4700 N-s/m. The given properties for the softball bat are c2=100.5 N-s/m and
m2=0.16 kg. The spring stiffness of the softball bat k2 was found through an iteration
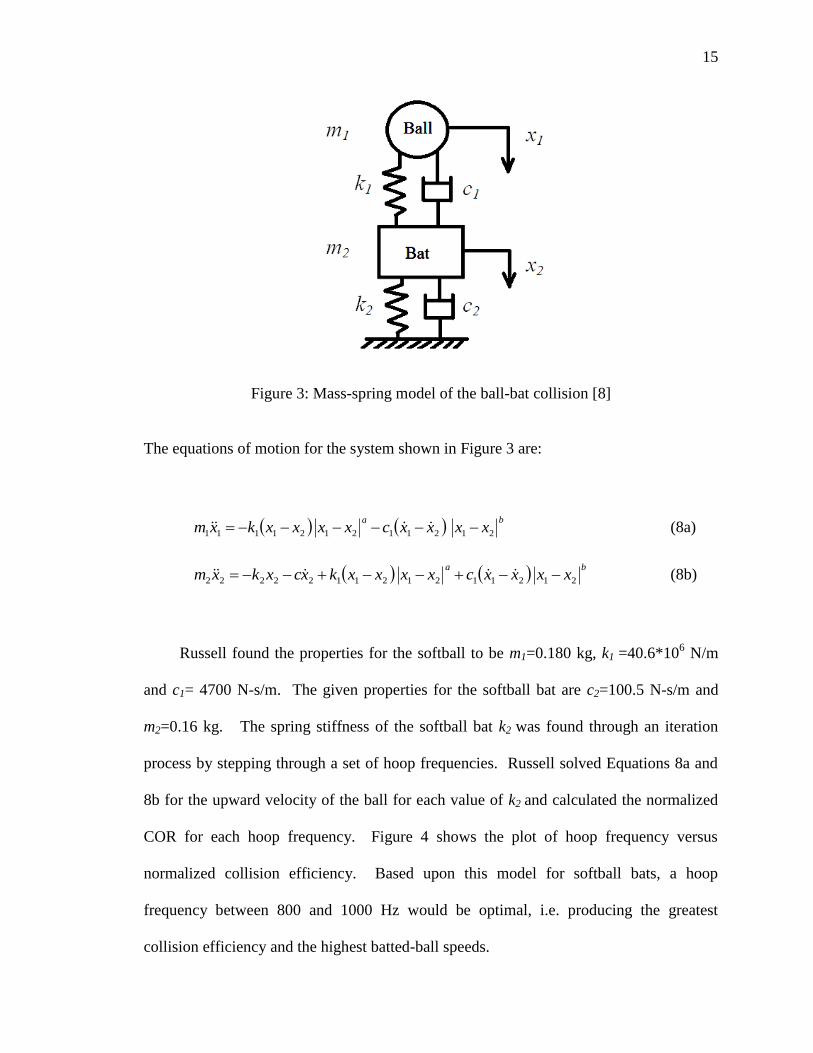
process by stepping through a set of hoop frequencies. Russell solved Equations 8a and
8b for the upward velocity of the ball for each value of k2 and calculated the normalized
COR for each hoop frequency. Figure 4 shows the plot of hoop frequency versus
normalized collision efficiency. Based upon this model for softball bats, a hoop
frequency between 800 and 1000 Hz would be optimal, i.e. producing the greatest
collision efficiency and the highest batted-ball speeds.
16
Figure 4: Normalized collision efficiency versus hoop frequency [8]
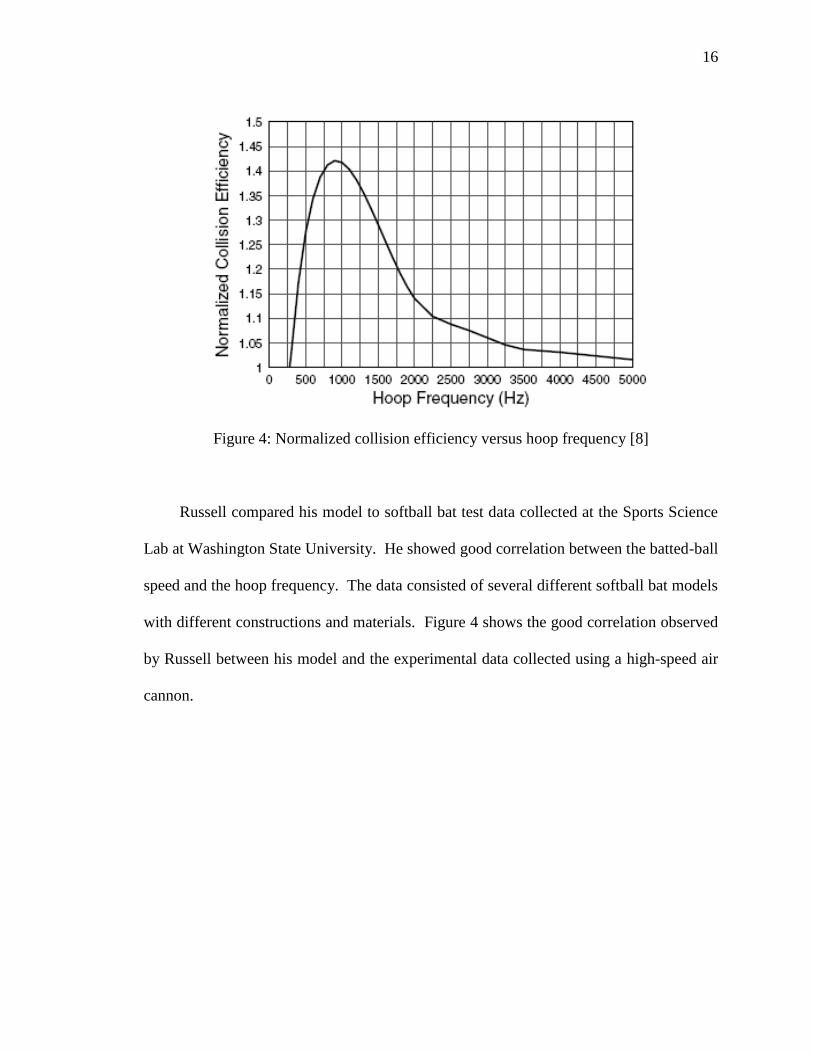
Russell compared his model to softball bat test data collected at the Sports Science
Lab at Washington State University. He showed good correlation between the batted-ball
speed and the hoop frequency. The data consisted of several different softball bat models
with different constructions and materials. Figure 4 shows the good correlation observed
by Russell between his model and the experimental data collected using a high-speed air
cannon.
17
Figure 5: Hoop frequency versus batted ball speed [8]
2.5 Summary
Bats can range in the type of material used in their construction along with the
ability to control properties such as drop and MOI. The performance-metric calculations
that will be used in this thesis were outlined. Previous research exploring the dynamic
response of bats was reviewed.
18
3 Methodology
This chapter outlines the process and tests performed on the baseball bats for this
research. The NCAA protocol for profiling and performance testing will be covered as it
pertains to this thesis. Topics include Bat Identification, Bat Profiling for Moment of
Inertia, Baseball Conditioning, Performance Testing and Modal Analysis.
3.1 Bat Identification
The bats used in this study included bats that had been submitted by various
companies for NCAA certification and other bats that had been obtained by the
UMLBRC for the purpose of academic studies. Each bat used in this thesis was assigned
a unique Thesis ID prior to testing. The Thesis ID starts with the letters ―AS‖ and was
given to the bat during the modal testing phase of the research. The first bat identified
during modal testing was AS001. The Thesis ID was assigned to each bat to remove any
information about the manufacturer and model of the baseball bat for reporting purposes
in this research. This blinding of the data was done so as not to disseminate information
19
that could help or hurt any manufacturer or aid anyone in the selection of a bat for use in
play. The NCAA authorized use of the certification bats for this research.
3.2 Baseball Bat Profiling
Baseball bats specified for NCAA BESR certification go through a profiling
procedure according to the NCAA BESR protocol [1] prior to being tested for
performance. Length measurements are taken to the nearest 1/16th
(0.0625) in. Seven
rings are drawn onto the barrel of the bat in one-inch increments starting at the 3-in. axial
location as measured from the barrel end of the bat. Diameter measurements of the barrel
are recorded at each of the lines using a vernier caliper to the nearest 0.001 in. A handle
diameter measurement is also recorded at a point 6 in. from the base of the knob.
The overall weight is recorded to the nearest 0.005 oz. For this research, all bats
tested fell within the -3 weight class. The drop of the bat is checked to ensure that the bat
falls within the specified weight class. The balance point, or center of gravity (CG), is
measured by balancing the bat on a knife edge and marked. The CG is measured from
the tip of the barrel end of the bat to the nearest 1/16th
in.
20
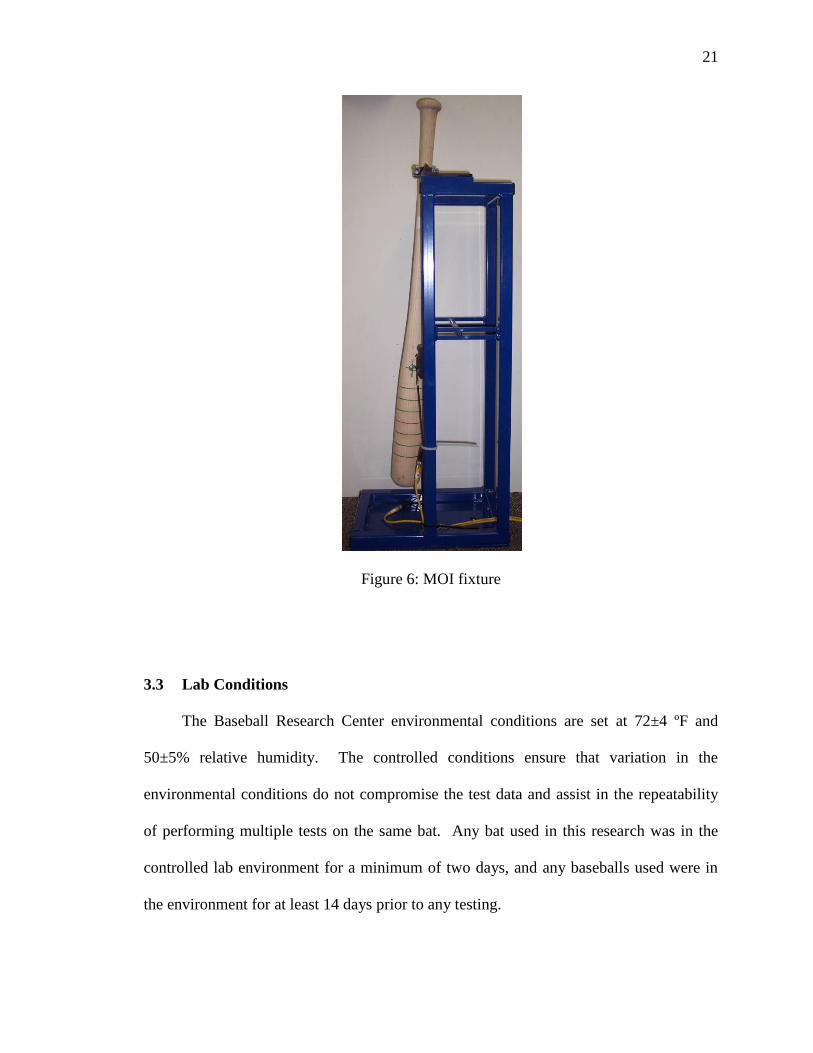
3.2.1 Bat Profiling – Moment of Inertia
The baseball bat Moment of Inertia (MOI) is measured according to ASTM F2398
[16]. The baseball bat is clamped at the 6-in. location on the handle and placed on the
MOI fixture as shown in Figure 6. The bat is set to swing through a set of light gates
which measure the period of oscillation and the number of periods. A LabVIEW VI is
used to measure the period of oscillation and compute the MOI about an axis that is 6 in.
from the base of the knob. A minimum MOI is prescribed for each length in the NCAA
BESR protocol. The MOI was calculated by
2
2
4
gWatMOI (1)
where: t = the average period of oscillation (sec)
g = acceleration due to gravity (386.4 in/s2)
W = total weight of the bat (oz)
a = the distance from the CG to the pivot point (in)
21
Figure 6: MOI fixture
3.3 Lab Conditions
The Baseball Research Center environmental conditions are set at 72±4 ºF and
50±5% relative humidity. The controlled conditions ensure that variation in the
environmental conditions do not compromise the test data and assist in the repeatability
of performing multiple tests on the same bat. Any bat used in this research was in the
controlled lab environment for a minimum of two days, and any baseballs used were in
the environment for at least 14 days prior to any testing.
22
3.4 Baseball Conditions
Baseballs are required to perform bat performance testing. Rawlings model
R1NCAA baseballs are stored in the lab for a minimum of two weeks prior to being
selected for a ball lot. Baseballs lots are typically made of 120 to 160 baseballs. The
baseballs weights are required to be 145.4±1.0 g. Each ball is marked with a lot number
and ball number. Lot preparations are performed by taking a random sample of baseballs
from the lot to achieve 30 valid hits on the standard baseball bat at the 6-in. location
(measured from the end cap) at a velocity, which is a target speed of V = 136 mph. The
rebound speed, v, is measured for each baseball. The correction factor, ε, for each ball
was determined by:
V
v 231.0 (2)
The average of the individual ball correction factors, ε1, determines the correction factor,
ε, for entire lot.
Each baseball weight is measured to the nearest 0.1 g prior to being used in the
performance test. The relative moisture content of the baseball is measured by using a
Delmohrst wood moisture meter by sticking the prongs into the stitches of ball. While
this moisture reading is not an absolute value, it does give a relative value of the ball-
moisture content from test to test and from ball to ball. The mass, moisture, and date are
recorded on the side of the ball. Each baseball is allowed up to eight total impacts, twice
on each ear (or face) before the ball is removed from testing.
23
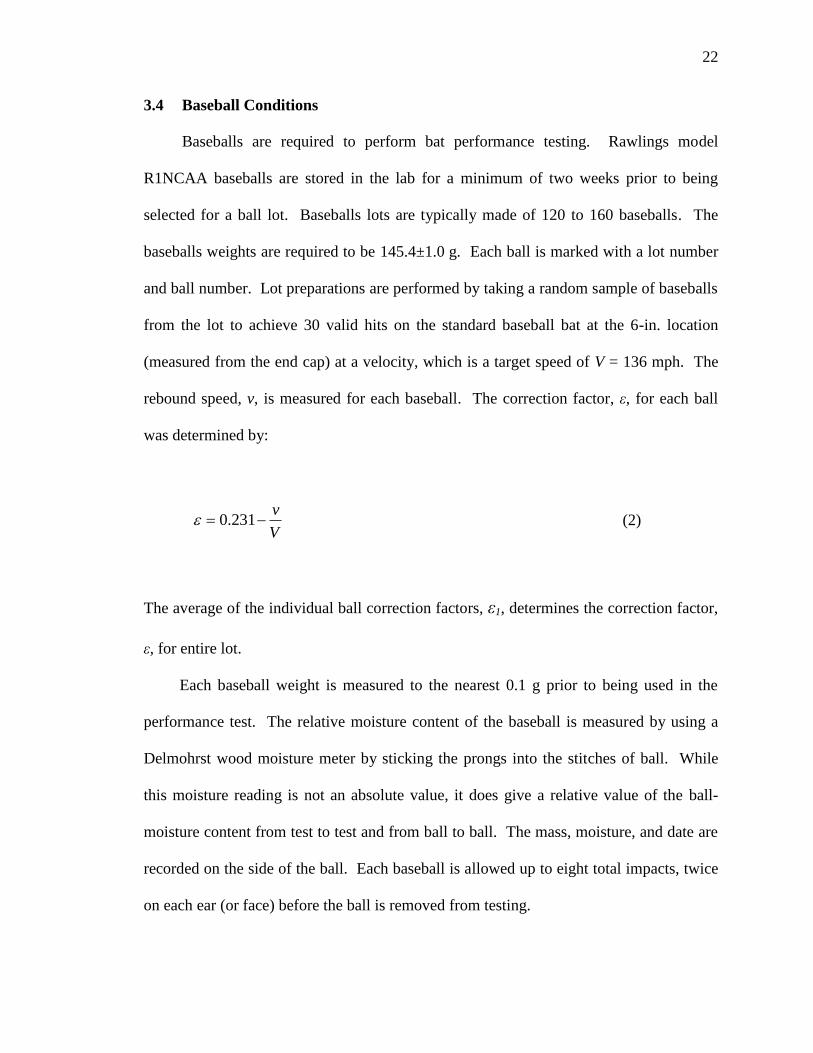
3.5 Performance Testing
Performance testing of the baseball bats was completed according to the NCAA
BESR protocol [1]. The air cannon used in the performance testing was the LVSports bat
performance system. Figure 7 shows the LVSports cannon used to perform the testing.
Figure 7: LVSports cannon
Astroturf is used on the grip of the bat at the point of contact with the clamp to
allow the bat to rotate and to allow some flex. Each bat was clamped so the axis of
rotation pivoted around the 6-in. location measured from the base of the knob. The
clamp is mounted to a table of a milling-machine base used to control the horizontal and
vertical position of the bat in front of the cannon. The heavy weight of the mill base
makes the base an essentially rigid support.
24
The target speed at which the ball is fired at the 6-in. location is 136 mph. This
collision velocity is based upon a bat swing velocity of 66 mph, at the 6-in. location
(which corresponds to a tip speed of 85 mph), and a ball pitch velocity of 70 mph at the
time of contact (which corresponds to a pitch speed as released from the pitcher of
80 mph). For other impact locations, the speed at which the ball contacts the bat is
determined by
mphL
zLmphVcontact 70
12
666
(4)
where L = the length of the bat (in.)
z = impact location measured from the barrel of the bat (in.)
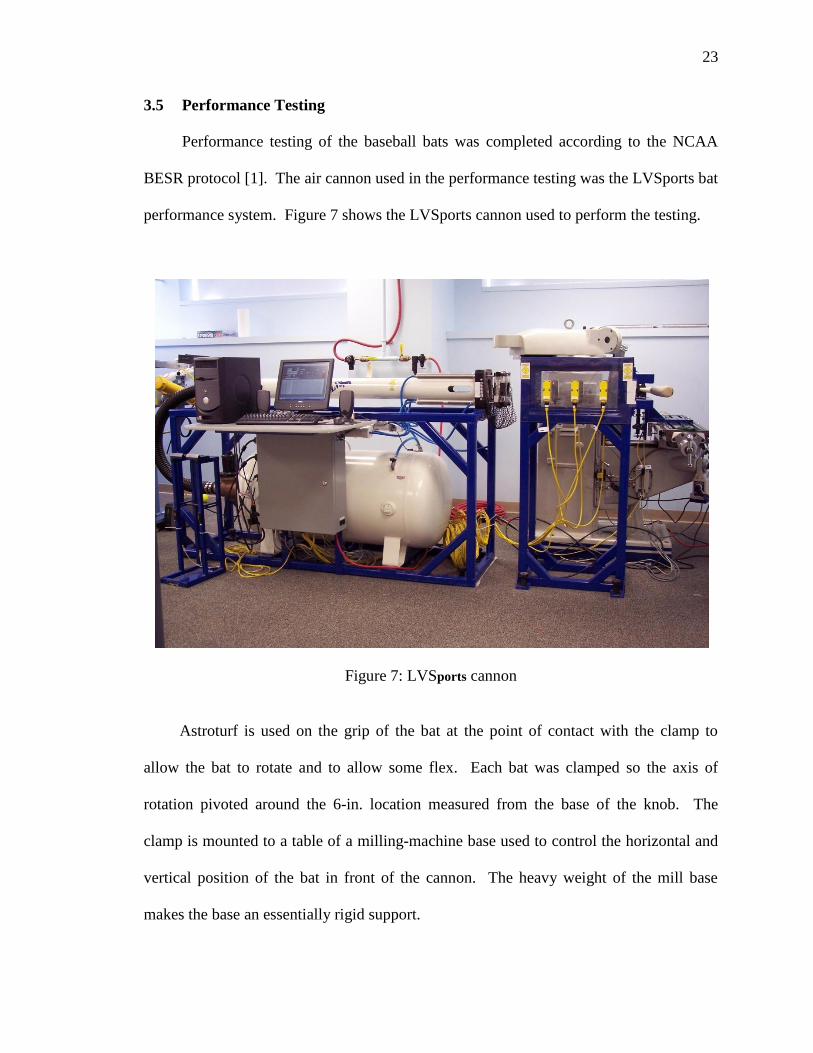
The velocity of the ball is measured by sets of light gates. There are three pairs of
light gates evenly spaced at 6-in. apart. The time is recorded as the baseball breaks the
plane of each light gate and the velocity is calculated. The velocity of the ball must be
within ±2 mph of the target velocity, Vcontact, to be considered a valid inbound speed. The
rebound velocity of the ball is measured using the same light gates. Figure 3 shows the
light-gate setup.
25
Figure 8: Light gate box
Baseballs selected from the lot are individually loaded into a sabot so the ball does
not experience any rotation during the test. The sabot yields the necessary consistency in
speed. The test is performed by pitching the baseballs at the desired impact velocity and
by achieving six valid shots for each test location. A shot is determined valid when the
ball passes back through the light gates at no more than ±5° vertically and the difference
in velocity between each pair of light is no more than ±1.5 mph. The bat is scanned by
testing locations along the barrel until the performance at one location is determined to be
the maximum or ―sweet spot‖ location. Testing begins by impacting the 6.0-in. location,
measured from the barrel end, and is repeated for the 5.0- and 7.0-in. locations. Based
upon the values of the performance at these three locations, either the 5.5-in. or the
6.5-in. location is tested. If the 5.0- or 7.0-in. location has a higher value, then testing
moves out or in a 0.5-in. increment from that location. The sweet spot location is
Light Gates
26
considered to be isolated when the performance at a location on the barrel of the bat is
0.003 BESR points higher than the locations that are ±0.5 in. on either side of it.
3.6 Modal Analysis
The modal tests were completed on each bat before performance testing in the air
cannon due to the chance that some change could occur in the barrel, e.g. cracking and/or
delamination of a composite barrel, denting of an aluminum barrel or cracking of a wood
barrel, that could alter the modal response of the bat. The first and second bending
modes were measured for all bats, and the first and second hoop modes were measured
for all hollow bats, e.g. aluminum and composite constructions. A Dactron Photon II
four-channel FFT analyzer was used for the modal testing along with a PCB force gauge
on an impact hammer and two PCB 303A accelerometers. An RT Pro Photon 6.06 data
acquisition program analyzed the frequency response of the bat. The frequency range
selected for the hollow baseball bats was 4000 Hz at 800 spectral lines of resolution. The
frequency range for wood baseball bats was selected to be 1000 Hz at 800 spectral lines
of resolution. No windows or weighting functions were applied to the data.
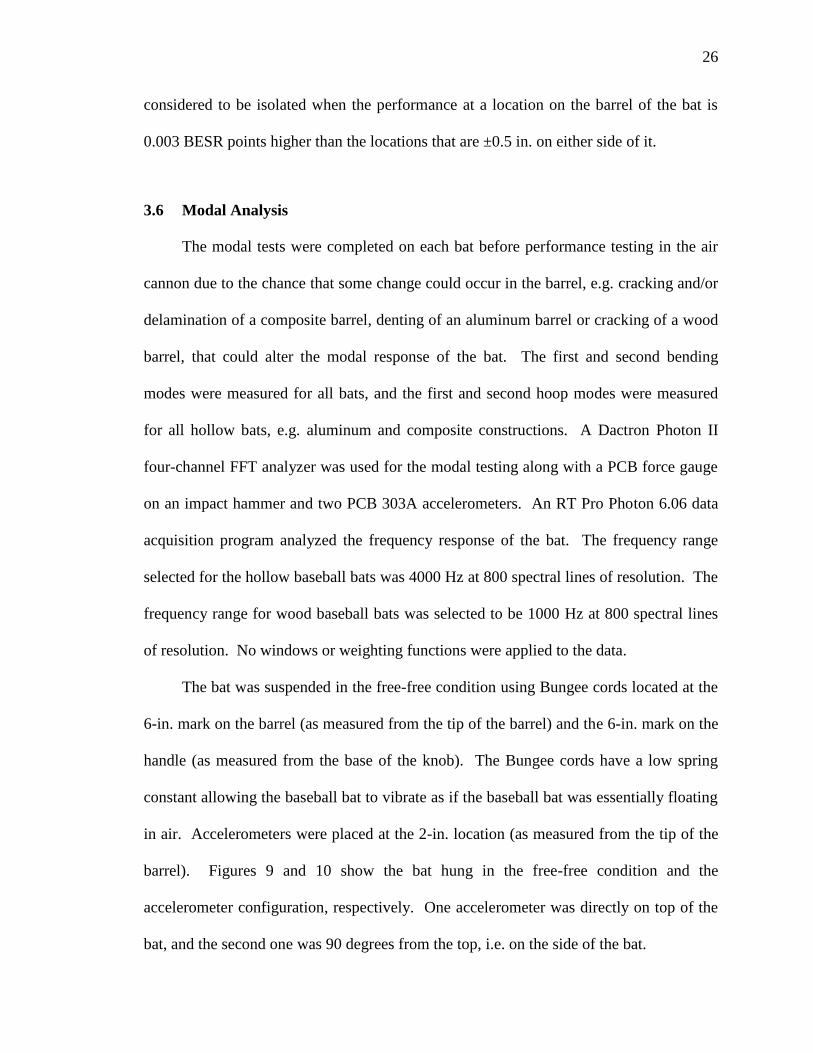
The bat was suspended in the free-free condition using Bungee cords located at the
6-in. mark on the barrel (as measured from the tip of the barrel) and the 6-in. mark on the
handle (as measured from the base of the knob). The Bungee cords have a low spring
constant allowing the baseball bat to vibrate as if the baseball bat was essentially floating
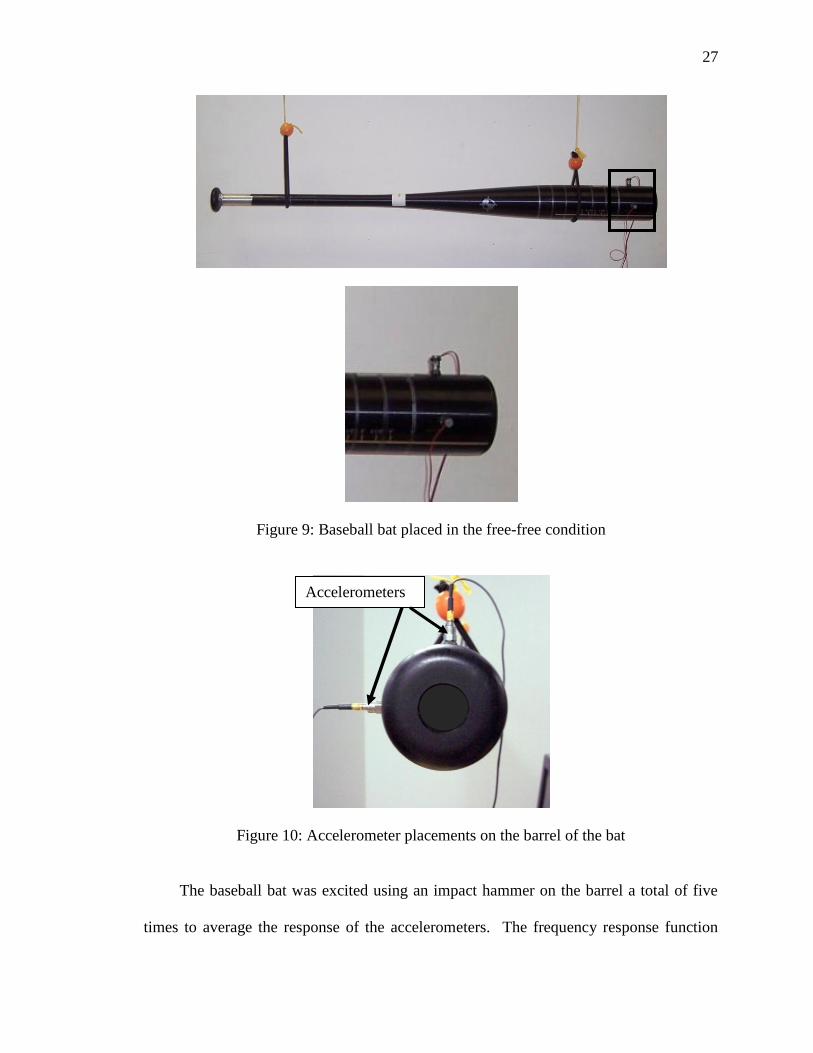
in air. Accelerometers were placed at the 2-in. location (as measured from the tip of the
barrel). Figures 9 and 10 show the bat hung in the free-free condition and the
accelerometer configuration, respectively. One accelerometer was directly on top of the
bat, and the second one was 90 degrees from the top, i.e. on the side of the bat.
27
Figure 9: Baseball bat placed in the free-free condition
Figure 10: Accelerometer placements on the barrel of the bat
The baseball bat was excited using an impact hammer on the barrel a total of five
times to average the response of the accelerometers. The frequency response function
Accelerometers
28
(FRF) was computed from the time response using the Fast Fourier transform based on
the ratio of acceleration output to force input. The frequency response functions were
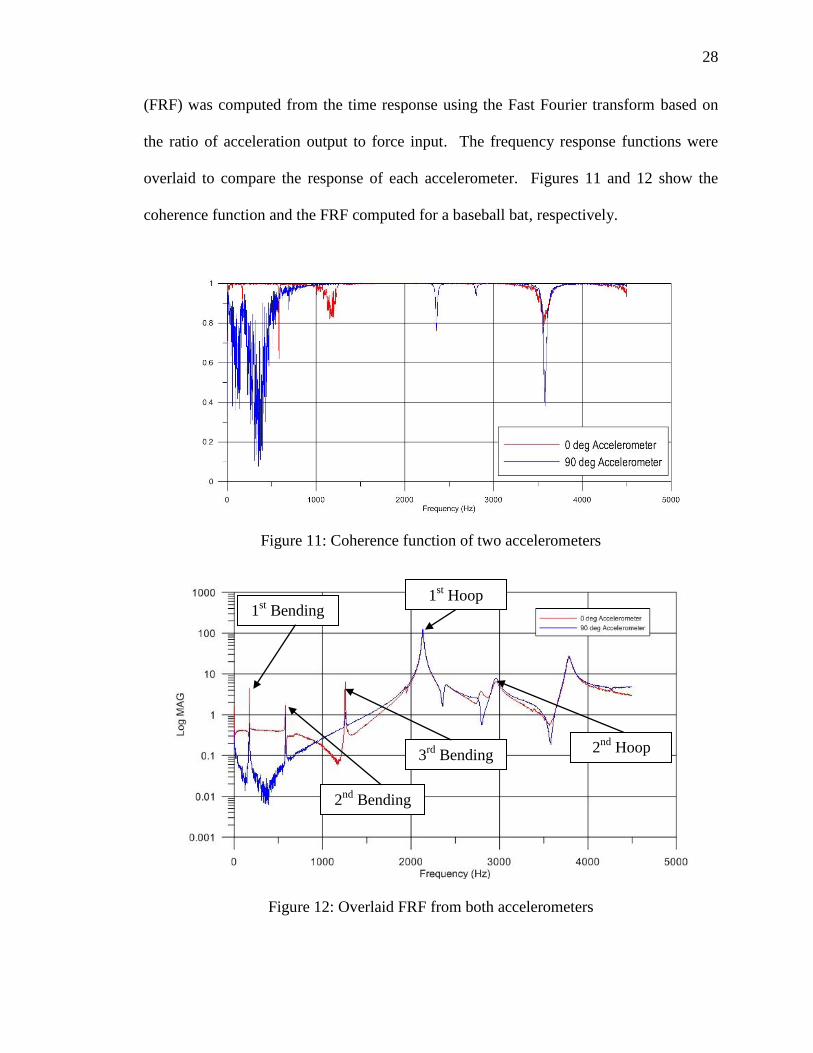
overlaid to compare the response of each accelerometer. Figures 11 and 12 show the
coherence function and the FRF computed for a baseball bat, respectively.
Figure 11: Coherence function of two accelerometers
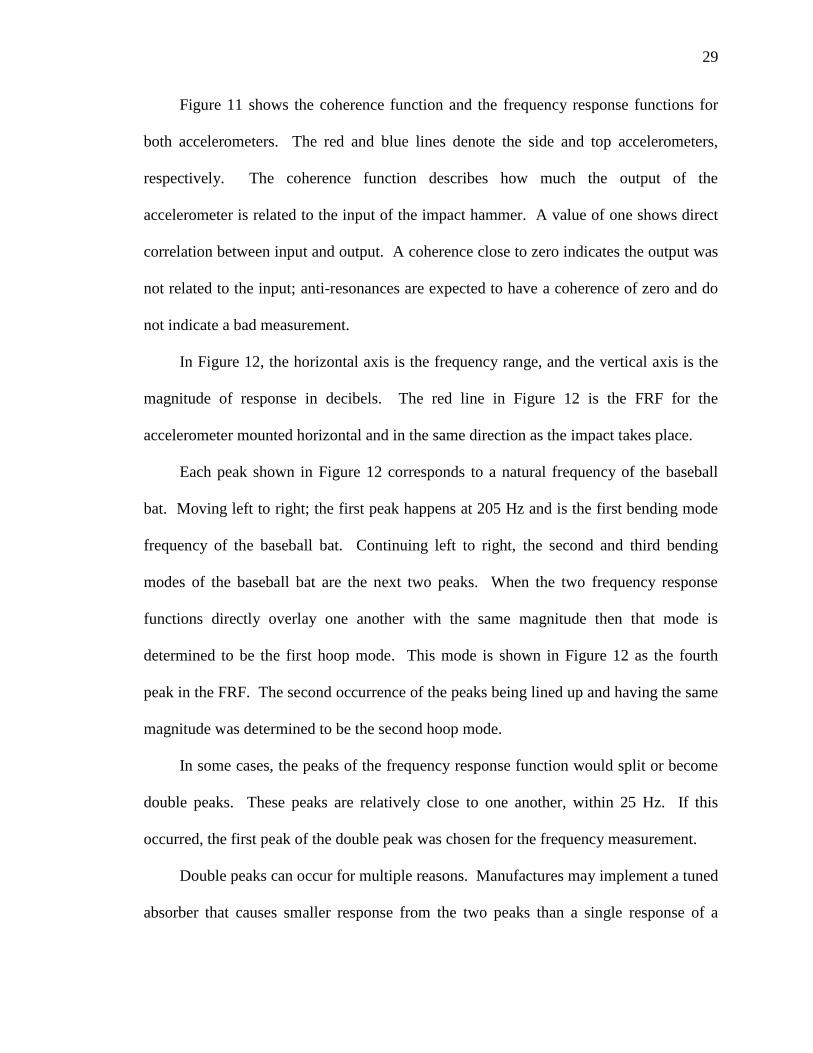
Figure 12: Overlaid FRF from both accelerometers
2nd
Bending
1st Bending
3rd
Bending
1st Hoop
2nd
Hoop
29
Figure 11 shows the coherence function and the frequency response functions for
both accelerometers. The red and blue lines denote the side and top accelerometers,
respectively. The coherence function describes how much the output of the
accelerometer is related to the input of the impact hammer. A value of one shows direct
correlation between input and output. A coherence close to zero indicates the output was
not related to the input; anti-resonances are expected to have a coherence of zero and do
not indicate a bad measurement.
In Figure 12, the horizontal axis is the frequency range, and the vertical axis is the
magnitude of response in decibels. The red line in Figure 12 is the FRF for the
accelerometer mounted horizontal and in the same direction as the impact takes place.
Each peak shown in Figure 12 corresponds to a natural frequency of the baseball
bat. Moving left to right; the first peak happens at 205 Hz and is the first bending mode
frequency of the baseball bat. Continuing left to right, the second and third bending
modes of the baseball bat are the next two peaks. When the two frequency response
functions directly overlay one another with the same magnitude then that mode is
determined to be the first hoop mode. This mode is shown in Figure 12 as the fourth
peak in the FRF. The second occurrence of the peaks being lined up and having the same
magnitude was determined to be the second hoop mode.
In some cases, the peaks of the frequency response function would split or become
double peaks. These peaks are relatively close to one another, within 25 Hz. If this
occurred, the first peak of the double peak was chosen for the frequency measurement.
Double peaks can occur for multiple reasons. Manufactures may implement a tuned
absorber that causes smaller response from the two peaks than a single response of a
30
larger magnitude. Double peaks can also be a sign that there is a crack or damage in the
bat or some slight variation in the wall thickness and/or material properties that induces a
measurable cylindrical asymmetry in the bat.
The nodes of the bending modes on the barrel were determined by impacting along
the length from the barrel end of the bat to the taper region. Averages were not
performed, and the FRF was recalculated for each impact. Impacts started at the 3-in.
location on the barrel of the bat and moved in 0.25-in. increments toward the handle of
the bat. The node of the mode was determined when the peak of the FRF at the first or
second bending mode approached a minimum. Several impacts were then performed
around the minimum location to ensure the node of the mode was determined. The node
was marked and measured from the barrel end to the nearest 0.125 in.
Full modal tests were performed on several baseball bats to confirm the quick
approach of determining the bending and hoop modes of baseball bats. The results of
these tests can be seen in Appendix A.
3.7 Summary
Bats for testing undergo a profiling procedure that gives the bat a unique Bat ID
along with measurements of length, weight, barrel diameters, center of gravity and MOI.
Performance testing is done using a high-speed air cannon and light-gate sensors to
record the inbound and rebound velocities of the baseball. The modal analysis procedure
uses two accelerometers placed on the barrel of the bat 90 degrees from one another to
measure the bending and hoop modes. An overlaid plot of the FRF responses of the two
accelerometers is used to identify the hoop modes.
31
4 Results
This chapter presents the results collected from the modal analyses, performance
testing and computer models. Baseball bats are categorized as being either wood or
nonwood. For nonwood bats, classifications are made by barrel material—either
aluminum or composite. Baseball bats that had aluminum barrels and composite handles
are identified to be made of aluminum because the objective of the research is to explore
the hoop response of the hollow-barrel bats. All performance testing was done according
to the NCAA protocol as specified in Section 3.5. Values of BESR, BBS, and BBCOR
were calculated for all baseball bats tested and are presented in multiple ways for data
analysis.
Ideally, to explore how a change in one design parameter for a bat affects the modal
and batted-ball performance, all other design variables should be the same respective
values. However, the samples of bats used in this research are from commercially
available bats and prototypes by manufacturers, so the holding of all other design
parameters constant while changing only one was not possible. Thus, this limitation must
be kept in mind when exploring any one parameter.
32
4.1 Wood Bat Data
A set of wood baseball bats, ranging in length from 30 to 34 in. was investigated.
The following sections will examine the relationship between performance and inertial
properties, e.g. moment of inertia and drop. Later sections will examine the relationship
between the bending mode frequencies and performance.
4.1.1 Performance versus MOI
To understand and potentially isolate how the bending frequency contributes to the
performance of wood baseball bats, other characteristics of baseball bats also need to be
considered as to how they contribute to performance. The MOI has been found to exhibit
a correlation with several different performance metrics as observed by Jones et al. [17].
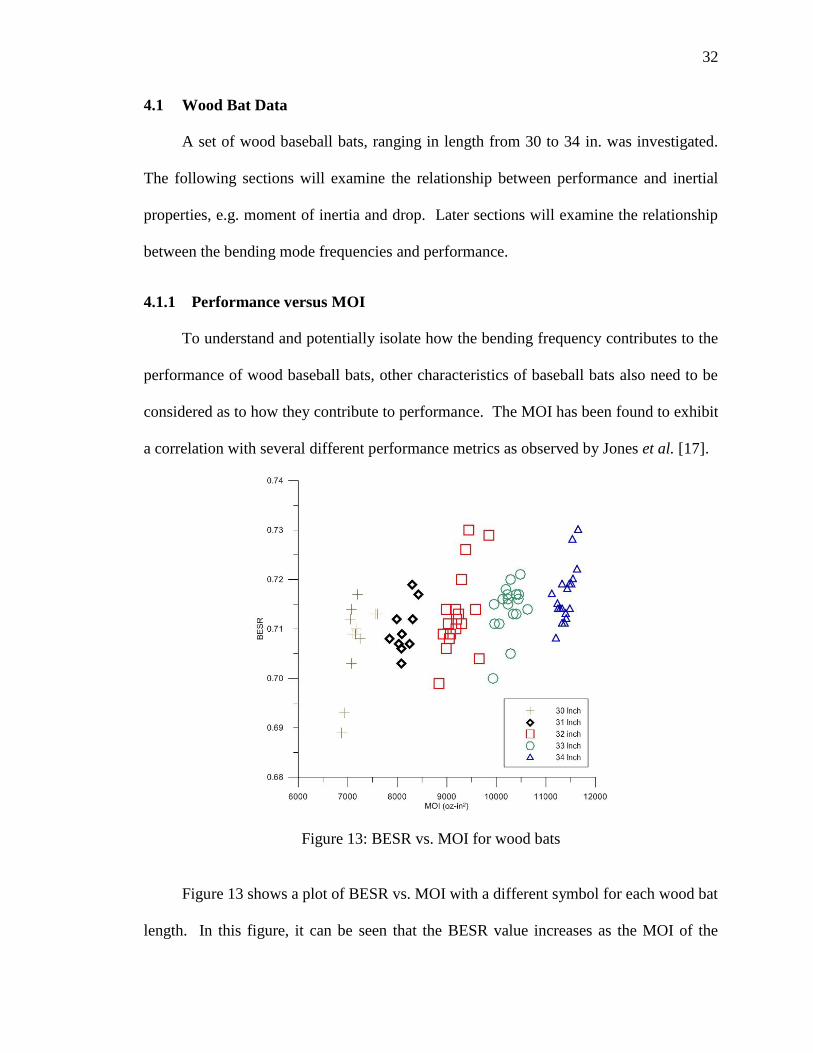
Figure 13: BESR vs. MOI for wood bats
Figure 13 shows a plot of BESR vs. MOI with a different symbol for each wood bat
length. In this figure, it can be seen that the BESR value increases as the MOI of the
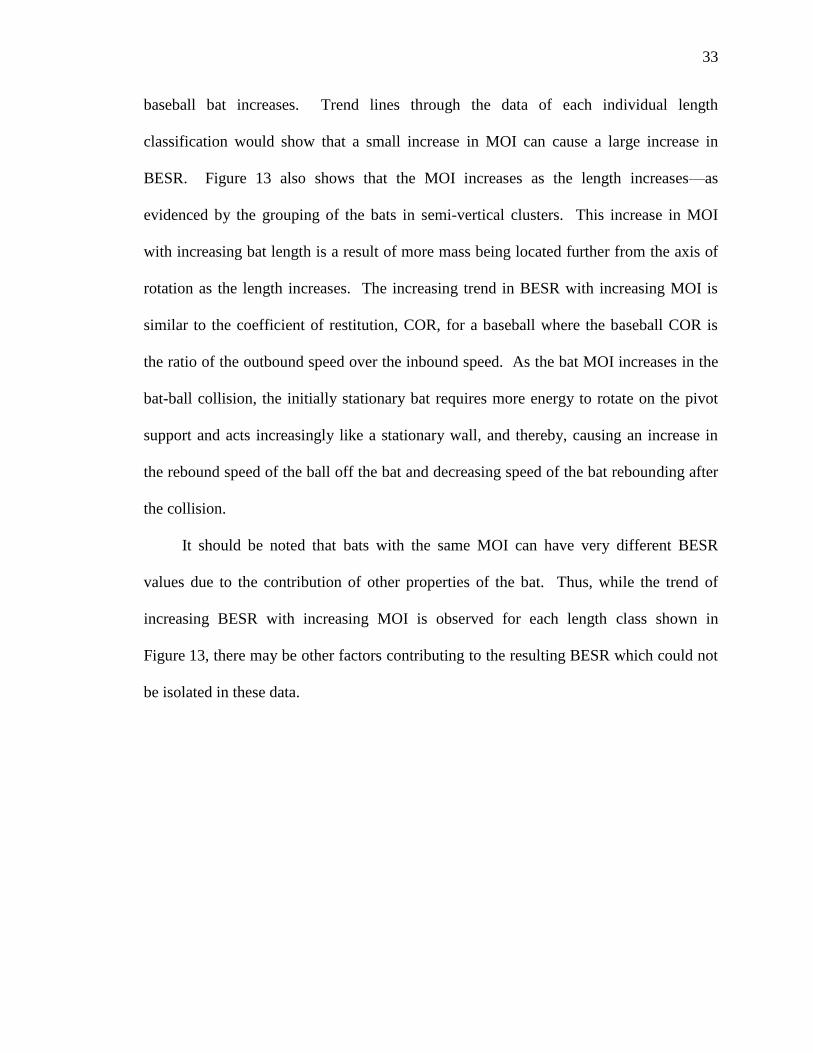
33
baseball bat increases. Trend lines through the data of each individual length
classification would show that a small increase in MOI can cause a large increase in
BESR. Figure 13 also shows that the MOI increases as the length increases—as
evidenced by the grouping of the bats in semi-vertical clusters. This increase in MOI
with increasing bat length is a result of more mass being located further from the axis of
rotation as the length increases. The increasing trend in BESR with increasing MOI is
similar to the coefficient of restitution, COR, for a baseball where the baseball COR is
the ratio of the outbound speed over the inbound speed. As the bat MOI increases in the
bat-ball collision, the initially stationary bat requires more energy to rotate on the pivot
support and acts increasingly like a stationary wall, and thereby, causing an increase in
the rebound speed of the ball off the bat and decreasing speed of the bat rebounding after
the collision.
It should be noted that bats with the same MOI can have very different BESR
values due to the contribution of other properties of the bat. Thus, while the trend of
increasing BESR with increasing MOI is observed for each length class shown in
Figure 13, there may be other factors contributing to the resulting BESR which could not
be isolated in these data.
34
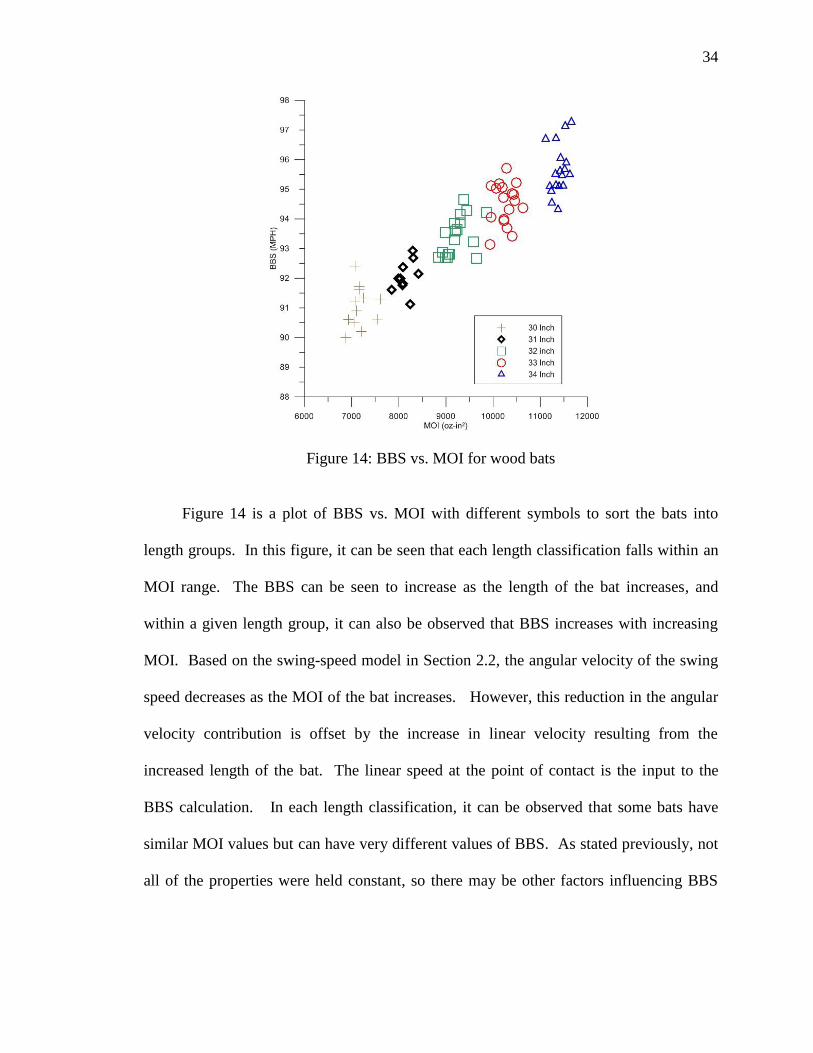
Figure 14: BBS vs. MOI for wood bats
Figure 14 is a plot of BBS vs. MOI with different symbols to sort the bats into
length groups. In this figure, it can be seen that each length classification falls within an
MOI range. The BBS can be seen to increase as the length of the bat increases, and
within a given length group, it can also be observed that BBS increases with increasing
MOI. Based on the swing-speed model in Section 2.2, the angular velocity of the swing
speed decreases as the MOI of the bat increases. However, this reduction in the angular
velocity contribution is offset by the increase in linear velocity resulting from the
increased length of the bat. The linear speed at the point of contact is the input to the
BBS calculation. In each length classification, it can be observed that some bats have
similar MOI values but can have very different values of BBS. As stated previously, not
all of the properties were held constant, so there may be other factors influencing BBS
35
that could not be isolated. However, the data in Figure 14 do imply that BBS increases
with increasing MOI.
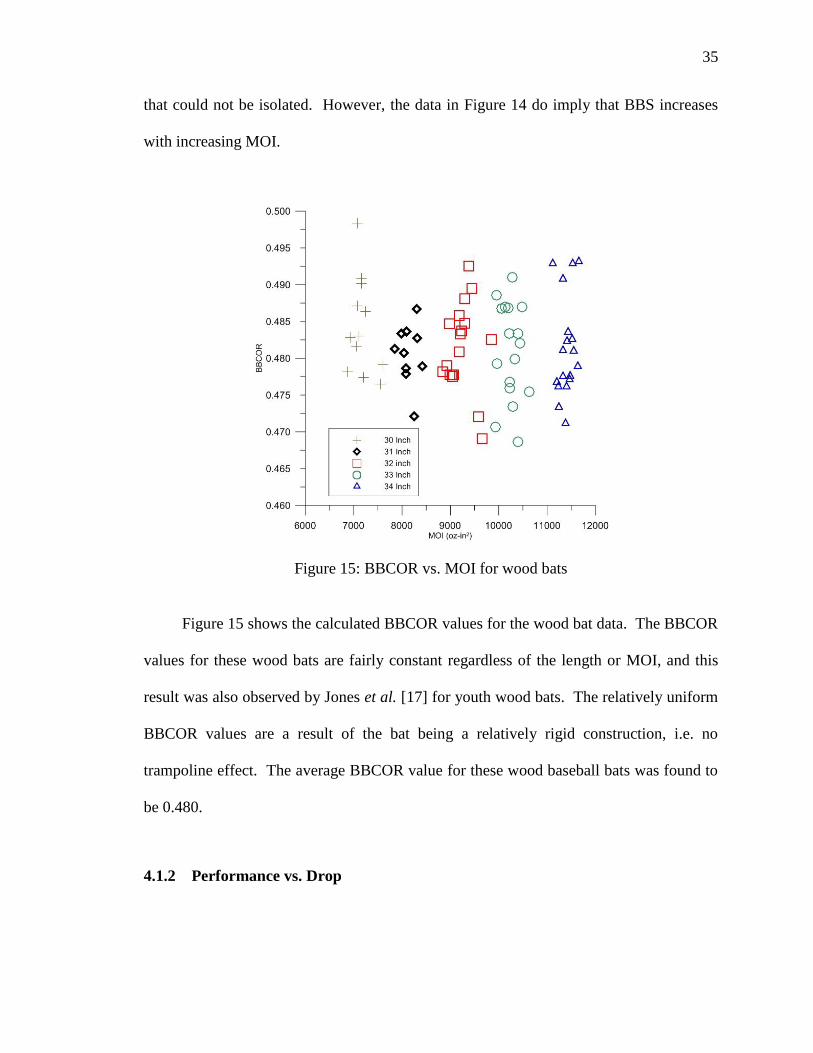
Figure 15: BBCOR vs. MOI for wood bats
Figure 15 shows the calculated BBCOR values for the wood bat data. The BBCOR
values for these wood bats are fairly constant regardless of the length or MOI, and this
result was also observed by Jones et al. [17] for youth wood bats. The relatively uniform
BBCOR values are a result of the bat being a relatively rigid construction, i.e. no
trampoline effect. The average BBCOR value for these wood baseball bats was found to
be 0.480.
4.1.2 Performance vs. Drop
36
Each of the performance metrics was compared against the drop for the wood
baseball bats. It was shown in Section 4.1.1 that a correlation exists between the BESR
and BBS performance metrics and MOI. Therefore, it is assumed that there will be a
correlation between performance and drop, i.e. as the drop (weight minus length)
becomes more positive, the MOI will increase. However, MOI is dependent on the total
mass plus how that total mass of the bat is distributed along the length of the bat. Thus,
two bats of the same mass can potentially have different MOIs, and vice versa.
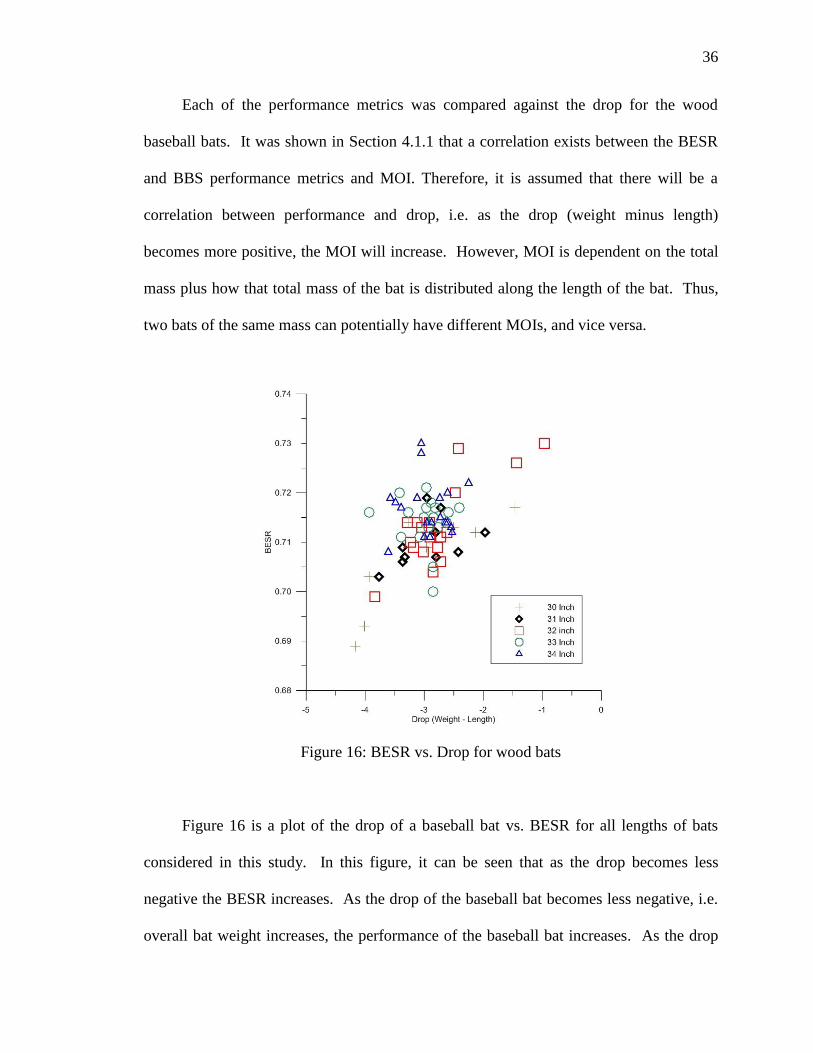
Figure 16: BESR vs. Drop for wood bats
Figure 16 is a plot of the drop of a baseball bat vs. BESR for all lengths of bats
considered in this study. In this figure, it can be seen that as the drop becomes less
negative the BESR increases. As the drop of the baseball bat becomes less negative, i.e.
overall bat weight increases, the performance of the baseball bat increases. As the drop
37
for a bat becomes more negative, the weight of the bat decreases, and the MOI should
also decrease. It was shown previously in Figure 13 that as the MOI for the bat increases
the BESR also increases. Individual plots of BESR vs. drop for each length group of
wood bats can be found in Appendix B.
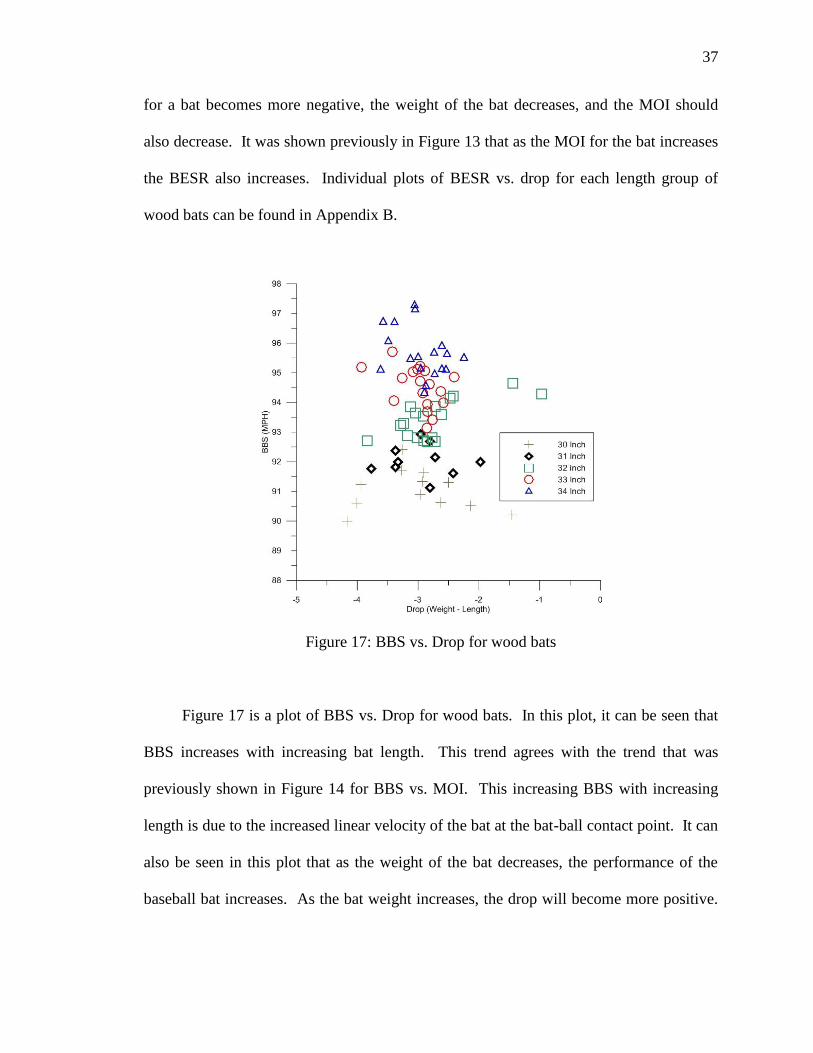
Figure 17: BBS vs. Drop for wood bats
Figure 17 is a plot of BBS vs. Drop for wood bats. In this plot, it can be seen that
BBS increases with increasing bat length. This trend agrees with the trend that was
previously shown in Figure 14 for BBS vs. MOI. This increasing BBS with increasing
length is due to the increased linear velocity of the bat at the bat-ball contact point. It can
also be seen in this plot that as the weight of the bat decreases, the performance of the
baseball bat increases. As the bat weight increases, the drop will become more positive.
38
This observation implies that the increase in the linear speed at the point of contact is
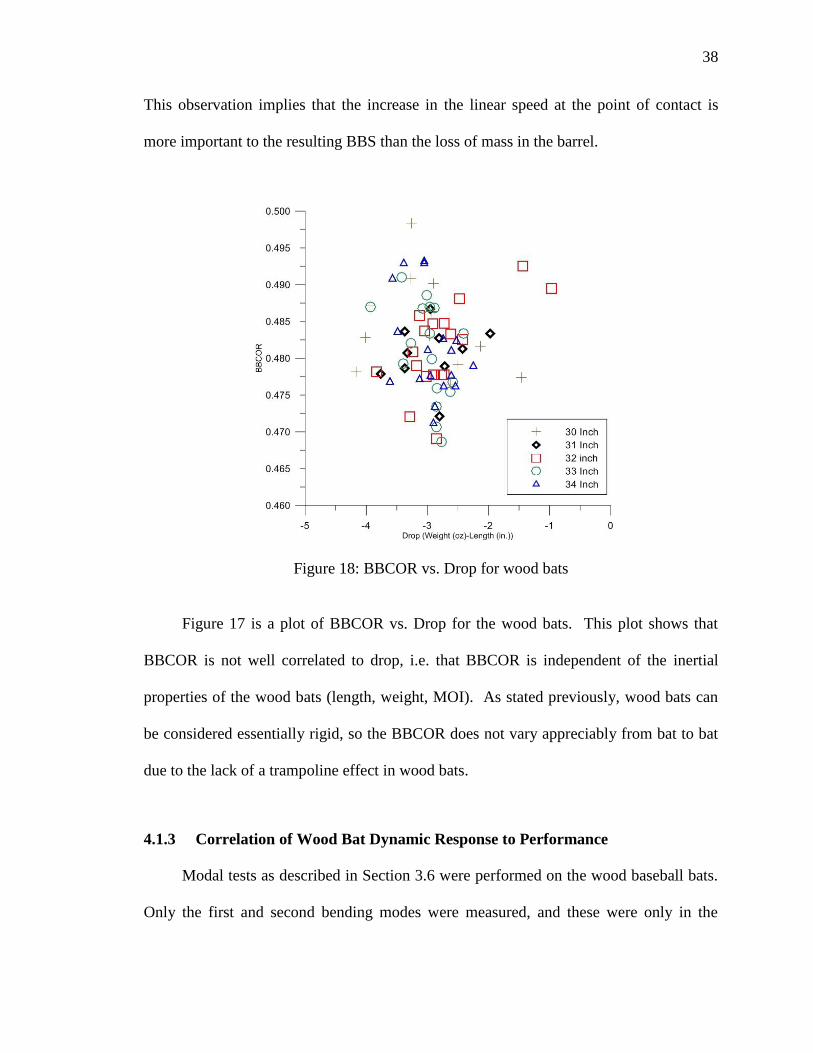
more important to the resulting BBS than the loss of mass in the barrel.
Figure 18: BBCOR vs. Drop for wood bats
Figure 17 is a plot of BBCOR vs. Drop for the wood bats. This plot shows that
BBCOR is not well correlated to drop, i.e. that BBCOR is independent of the inertial
properties of the wood bats (length, weight, MOI). As stated previously, wood bats can
be considered essentially rigid, so the BBCOR does not vary appreciably from bat to bat
due to the lack of a trampoline effect in wood bats.
4.1.3 Correlation of Wood Bat Dynamic Response to Performance
Modal tests as described in Section 3.6 were performed on the wood baseball bats.
Only the first and second bending modes were measured, and these were only in the
39
direction excited by impacting the ball impact side of the bat. The first bending modes
were recorded and were compared to each of the three performance metrics. In general,
the first bending frequency decreases as the length of the bat increases. The mass of the
bat increases with increasing length, and the stiffness decreases with increasing length.
Because the natural frequency is proportional to the square root of the stiffness divided
by the mass, the modal test data agree qualitatively with theory.
An effort was made to investigate if a hoop mode was present in the solid wood
bats, and thus the presence of a trampoline effect in the wood bats. It was concluded that
a hoop mode did exist, but its frequency was so high that this mode required a very large
mass to excite it. Thus, this mode would not be excited during a bat/ball impact and,
thus, would have no influence on the resulting performance. It will be shown for the
hollow bats that for a hoop mode to effect performance, the mode has to be under 2 kHz.
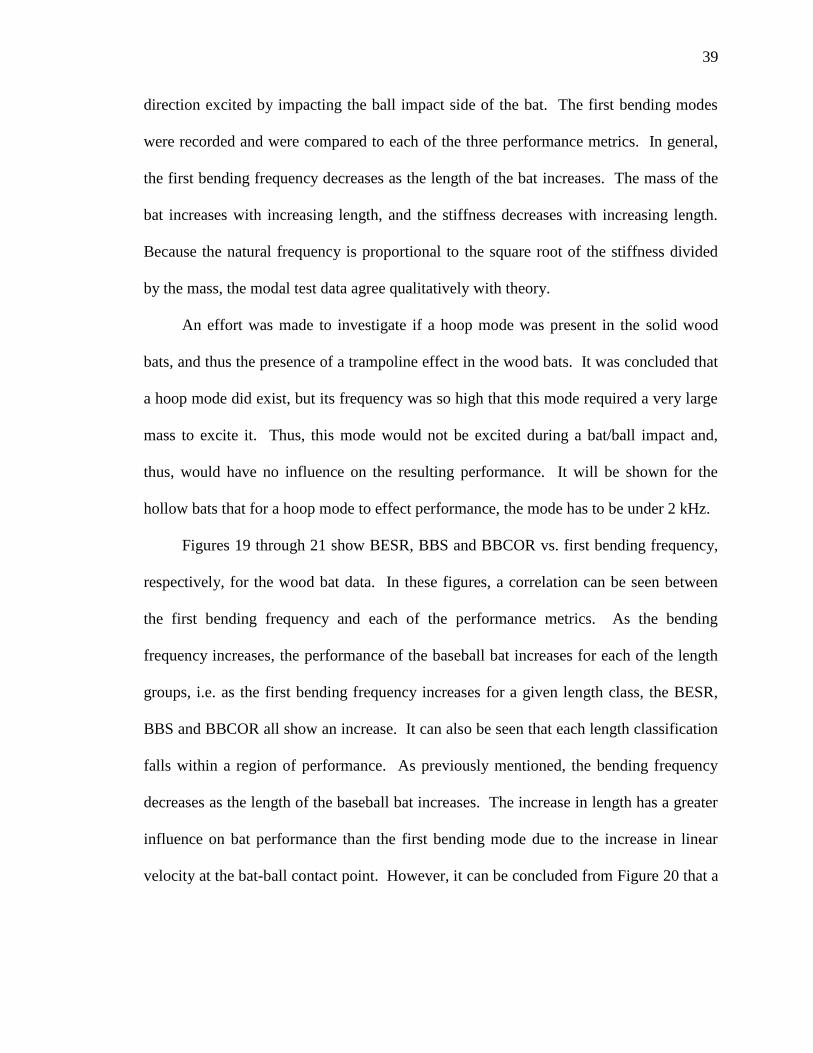
Figures 19 through 21 show BESR, BBS and BBCOR vs. first bending frequency,
respectively, for the wood bat data. In these figures, a correlation can be seen between
the first bending frequency and each of the performance metrics. As the bending
frequency increases, the performance of the baseball bat increases for each of the length
groups, i.e. as the first bending frequency increases for a given length class, the BESR,
BBS and BBCOR all show an increase. It can also be seen that each length classification
falls within a region of performance. As previously mentioned, the bending frequency
decreases as the length of the baseball bat increases. The increase in length has a greater
influence on bat performance than the first bending mode due to the increase in linear
velocity at the bat-ball contact point. However, it can be concluded from Figure 20 that a
40
long baseball bat with a relatively high bending frequency will have the relatively highest
batted-ball performance. Figures 19 and 21 also imply this conclusion.
Figure 19: BESR vs. First bending frequency for wood bats
Figure 19 shows BESR vs. the first bending frequency. This figure shows that the
shorter bats have will have the higher first bending frequencies. As the length increases
the first bending frequency decreases. The 33-in. bats in Figure 19 show the best
correlation between first bending frequency and BESR.
41
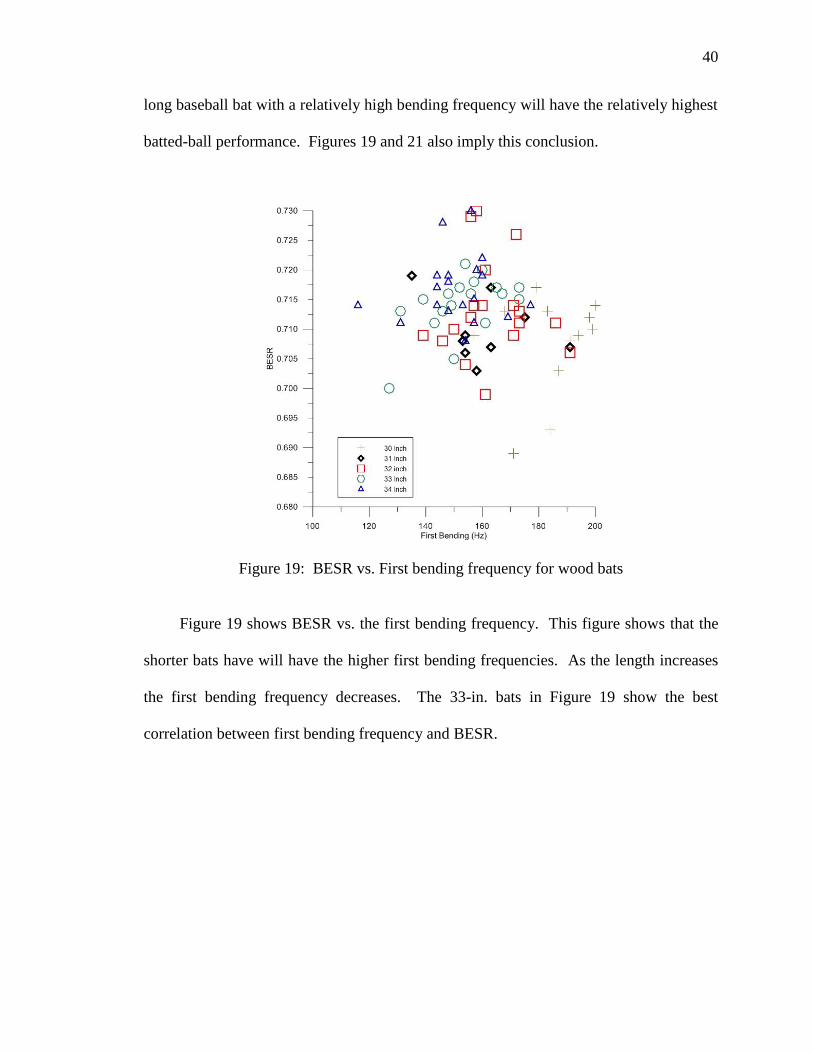
Figure 20: Batted-ball speed vs. First bending frequency for wood bats
Figure 20 shows BBS vs. first bending frequency. Initially the data look to
contradict the statement that as first bending frequency increases BBS increases.
However, Figure 20 clearly shows the separation between length classifications of bats.
Within each length classification, it is observed that the BBS increases as the first
bending frequency increases. The relative increase in performance as length
classification increases is due to the increasing linear speed at the contact point with
increasing bat length. Figure 20 shows the 32-in. bats have similar performance but vary
in first bending frequency. As with all length classes of bats, the inertial properties were
not held constant when comparing to first bending frequency to batted-ball performance,
and hence there can be secondary effects that are not isolated in this interpretation of the
42
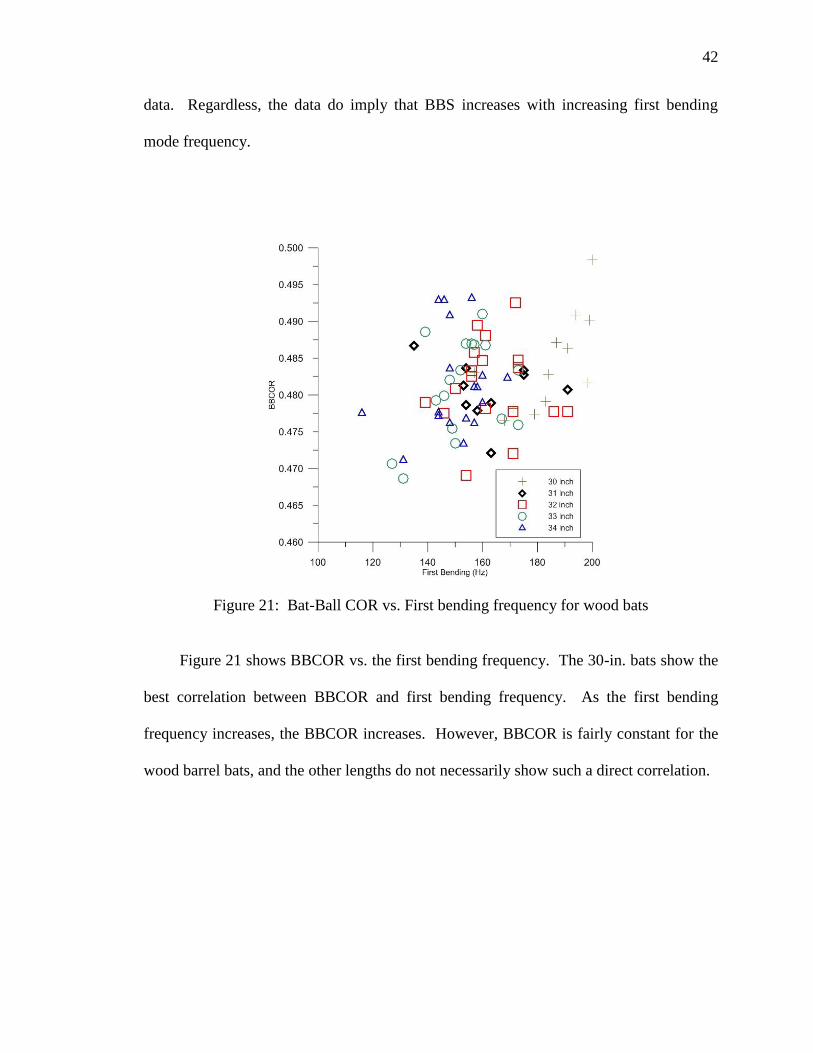
data. Regardless, the data do imply that BBS increases with increasing first bending
mode frequency.
Figure 21: Bat-Ball COR vs. First bending frequency for wood bats
Figure 21 shows BBCOR vs. the first bending frequency. The 30-in. bats show the
best correlation between BBCOR and first bending frequency. As the first bending
frequency increases, the BBCOR increases. However, BBCOR is fairly constant for the
wood barrel bats, and the other lengths do not necessarily show such a direct correlation.
43
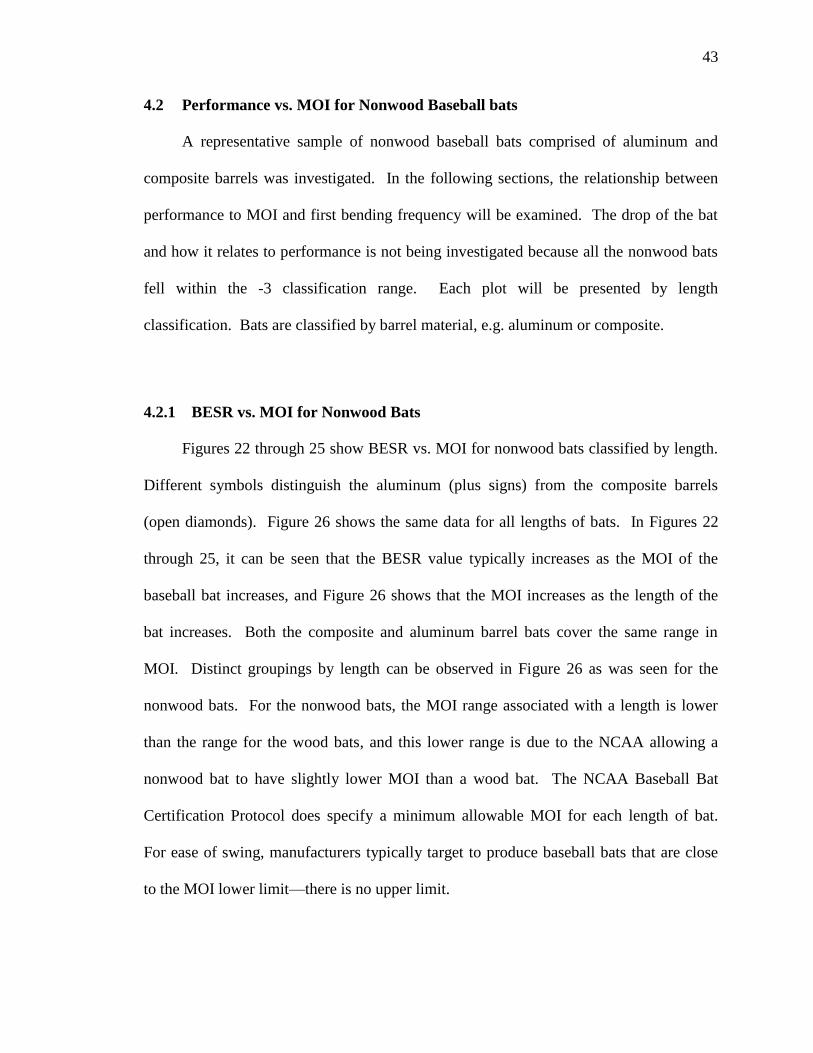
4.2 Performance vs. MOI for Nonwood Baseball bats
A representative sample of nonwood baseball bats comprised of aluminum and
composite barrels was investigated. In the following sections, the relationship between
performance to MOI and first bending frequency will be examined. The drop of the bat
and how it relates to performance is not being investigated because all the nonwood bats
fell within the -3 classification range. Each plot will be presented by length
classification. Bats are classified by barrel material, e.g. aluminum or composite.
4.2.1 BESR vs. MOI for Nonwood Bats
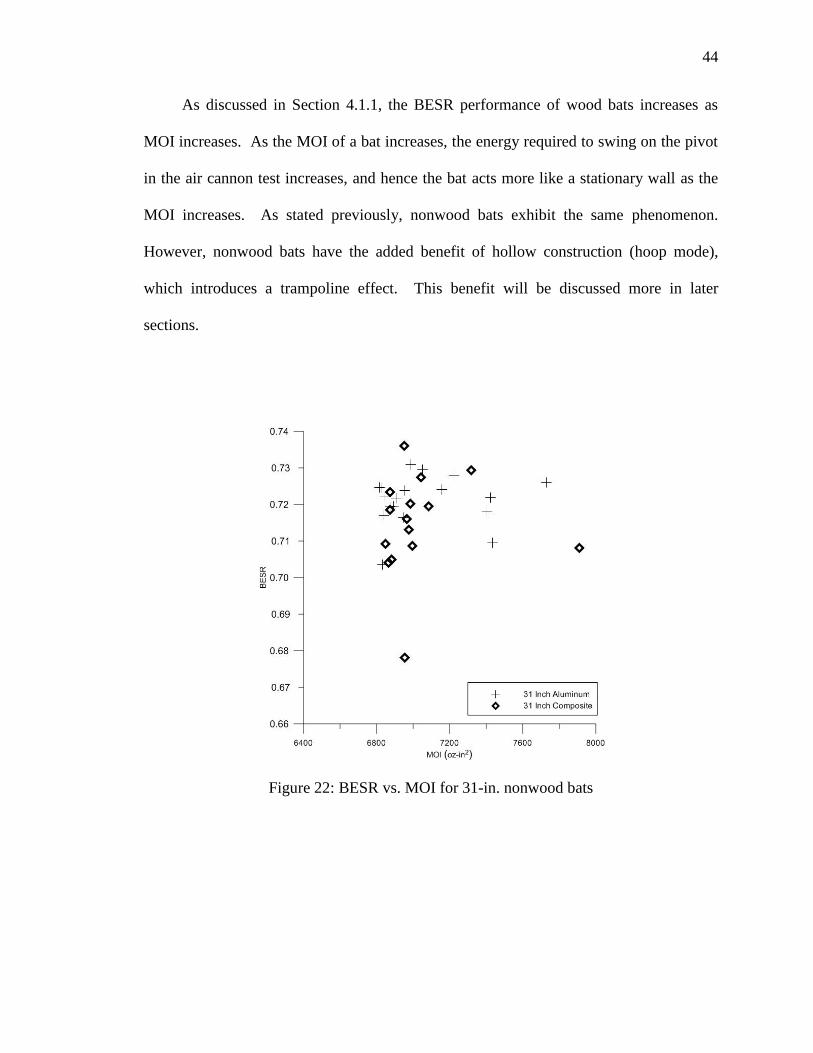
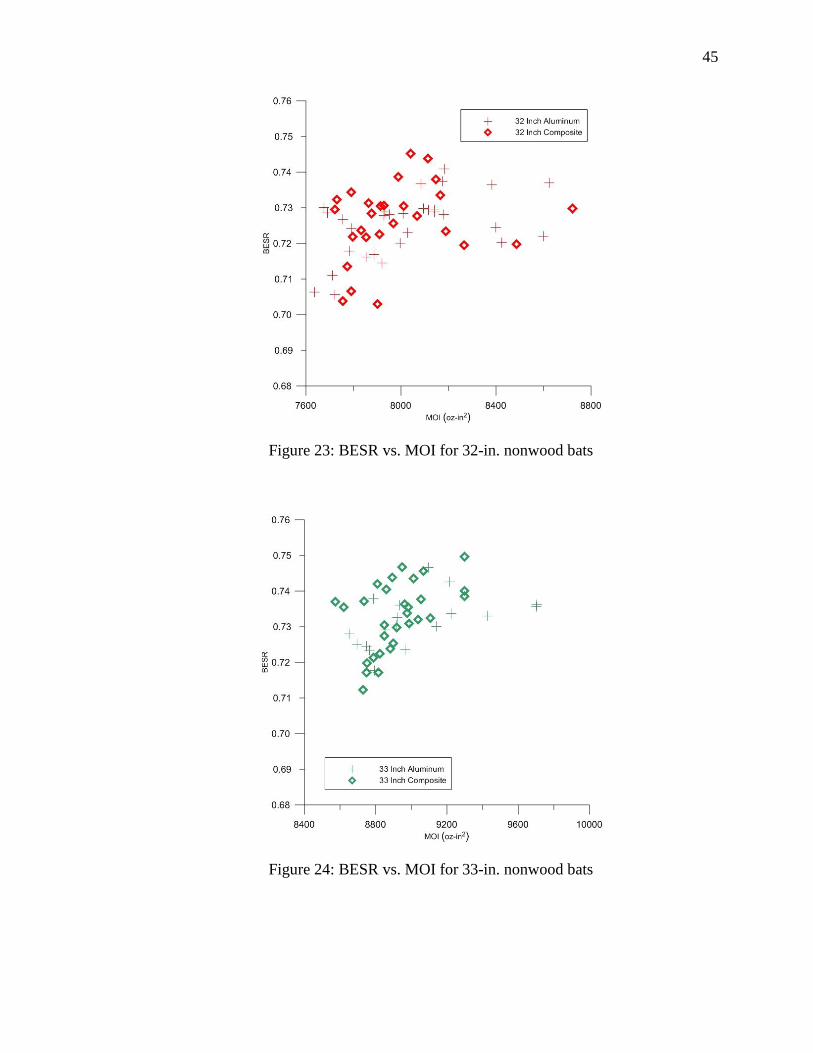
Figures 22 through 25 show BESR vs. MOI for nonwood bats classified by length.
Different symbols distinguish the aluminum (plus signs) from the composite barrels
(open diamonds). Figure 26 shows the same data for all lengths of bats. In Figures 22
through 25, it can be seen that the BESR value typically increases as the MOI of the
baseball bat increases, and Figure 26 shows that the MOI increases as the length of the
bat increases. Both the composite and aluminum barrel bats cover the same range in
MOI. Distinct groupings by length can be observed in Figure 26 as was seen for the
nonwood bats. For the nonwood bats, the MOI range associated with a length is lower
than the range for the wood bats, and this lower range is due to the NCAA allowing a
nonwood bat to have slightly lower MOI than a wood bat. The NCAA Baseball Bat
Certification Protocol does specify a minimum allowable MOI for each length of bat.
For ease of swing, manufacturers typically target to produce baseball bats that are close
to the MOI lower limit—there is no upper limit.
44
As discussed in Section 4.1.1, the BESR performance of wood bats increases as
MOI increases. As the MOI of a bat increases, the energy required to swing on the pivot
in the air cannon test increases, and hence the bat acts more like a stationary wall as the
MOI increases. As stated previously, nonwood bats exhibit the same phenomenon.
However, nonwood bats have the added benefit of hollow construction (hoop mode),
which introduces a trampoline effect. This benefit will be discussed more in later
sections.
Figure 22: BESR vs. MOI for 31-in. nonwood bats
45
Figure 23: BESR vs. MOI for 32-in. nonwood bats
Figure 24: BESR vs. MOI for 33-in. nonwood bats
46
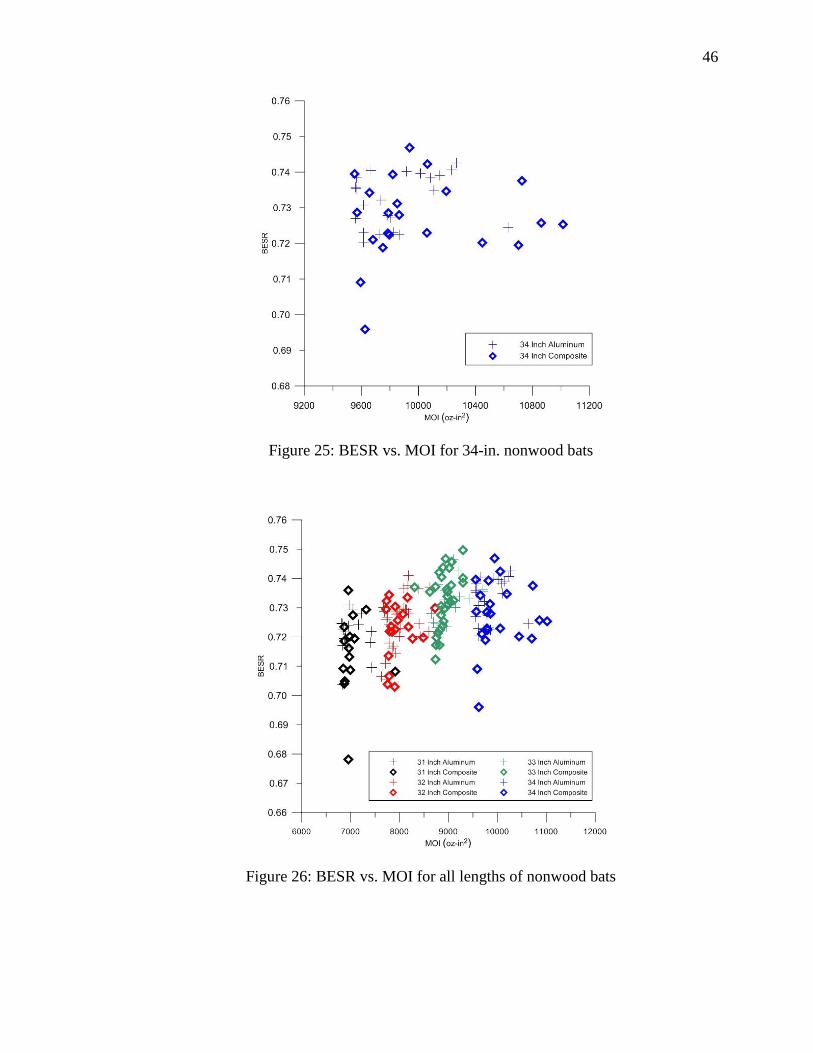
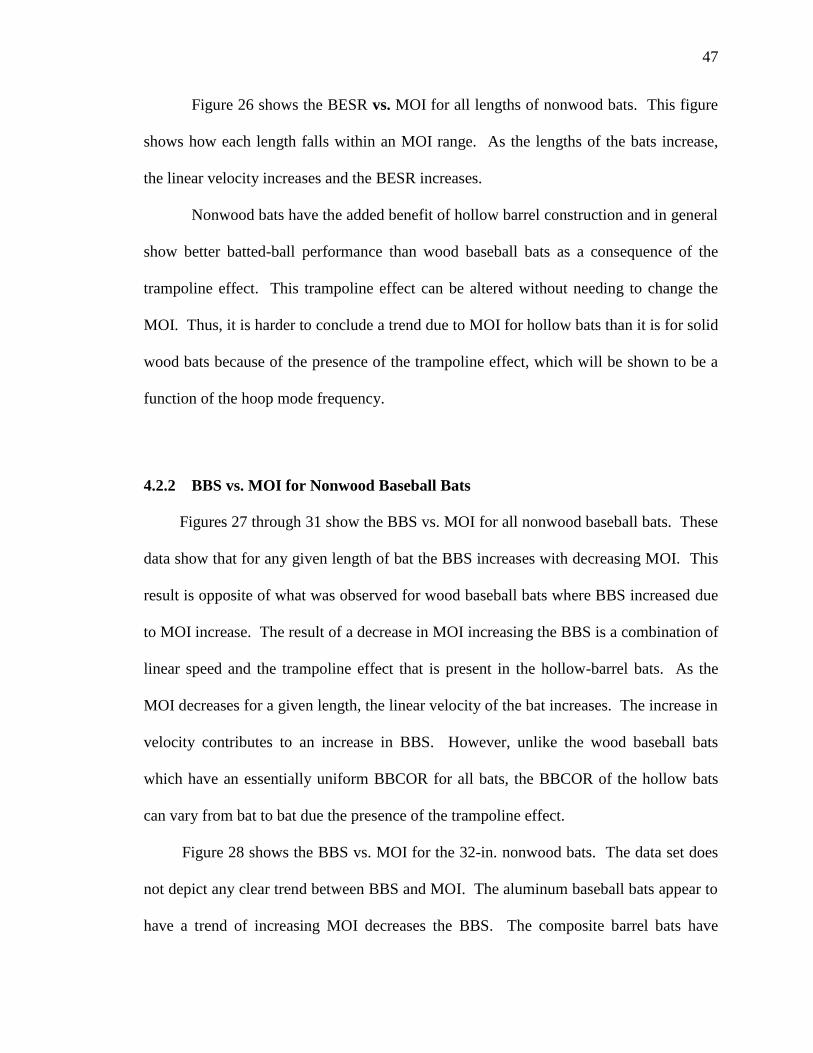
Figure 25: BESR vs. MOI for 34-in. nonwood bats
Figure 26: BESR vs. MOI for all lengths of nonwood bats
47
Figure 26 shows the BESR vs. MOI for all lengths of nonwood bats. This figure
shows how each length falls within an MOI range. As the lengths of the bats increase,
the linear velocity increases and the BESR increases.
Nonwood bats have the added benefit of hollow barrel construction and in general
show better batted-ball performance than wood baseball bats as a consequence of the
trampoline effect. This trampoline effect can be altered without needing to change the
MOI. Thus, it is harder to conclude a trend due to MOI for hollow bats than it is for solid
wood bats because of the presence of the trampoline effect, which will be shown to be a
function of the hoop mode frequency.
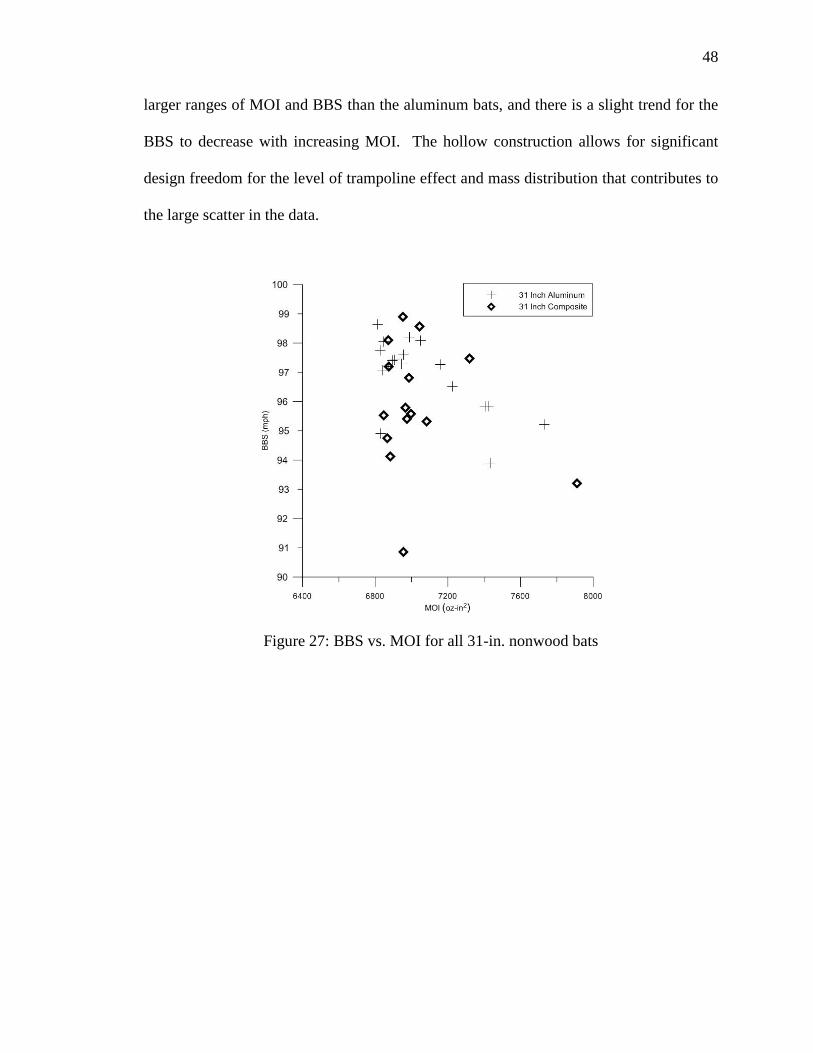
4.2.2 BBS vs. MOI for Nonwood Baseball Bats
Figures 27 through 31 show the BBS vs. MOI for all nonwood baseball bats. These
data show that for any given length of bat the BBS increases with decreasing MOI. This
result is opposite of what was observed for wood baseball bats where BBS increased due
to MOI increase. The result of a decrease in MOI increasing the BBS is a combination of
linear speed and the trampoline effect that is present in the hollow-barrel bats. As the
MOI decreases for a given length, the linear velocity of the bat increases. The increase in
velocity contributes to an increase in BBS. However, unlike the wood baseball bats
which have an essentially uniform BBCOR for all bats, the BBCOR of the hollow bats
can vary from bat to bat due the presence of the trampoline effect.
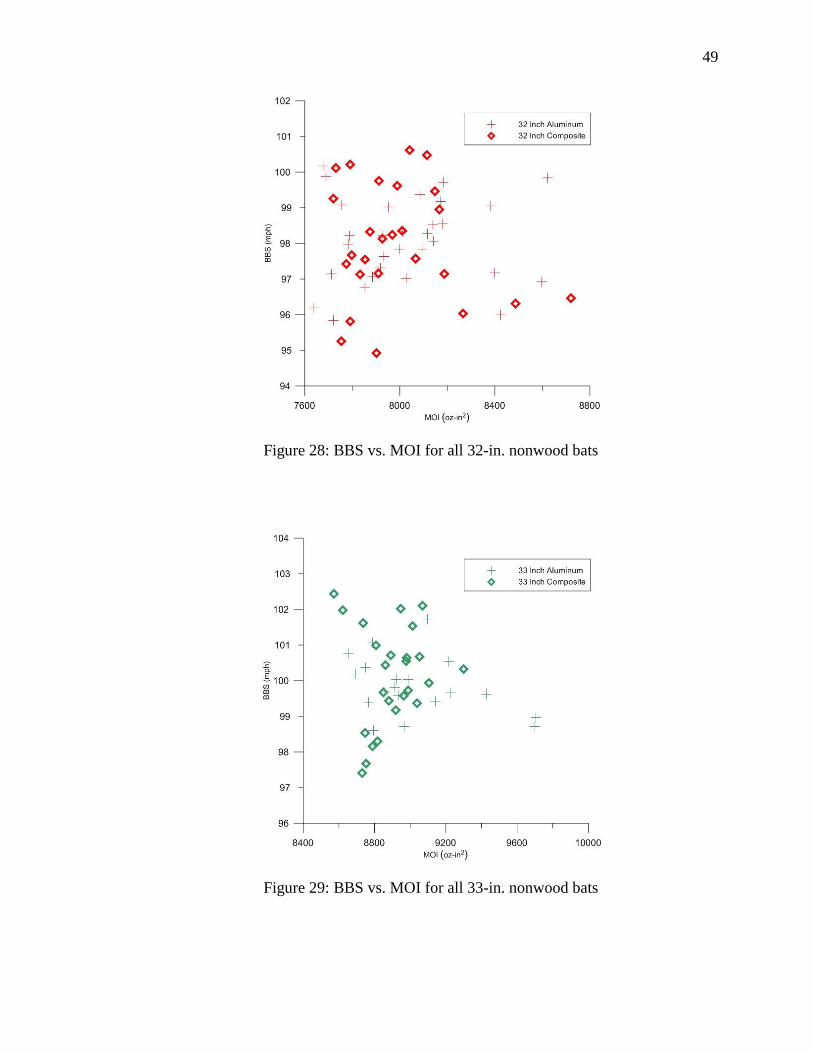
Figure 28 shows the BBS vs. MOI for the 32-in. nonwood bats. The data set does
not depict any clear trend between BBS and MOI. The aluminum baseball bats appear to
have a trend of increasing MOI decreases the BBS. The composite barrel bats have
48
larger ranges of MOI and BBS than the aluminum bats, and there is a slight trend for the
BBS to decrease with increasing MOI. The hollow construction allows for significant
design freedom for the level of trampoline effect and mass distribution that contributes to
the large scatter in the data.
Figure 27: BBS vs. MOI for all 31-in. nonwood bats
49
Figure 28: BBS vs. MOI for all 32-in. nonwood bats
Figure 29: BBS vs. MOI for all 33-in. nonwood bats
50
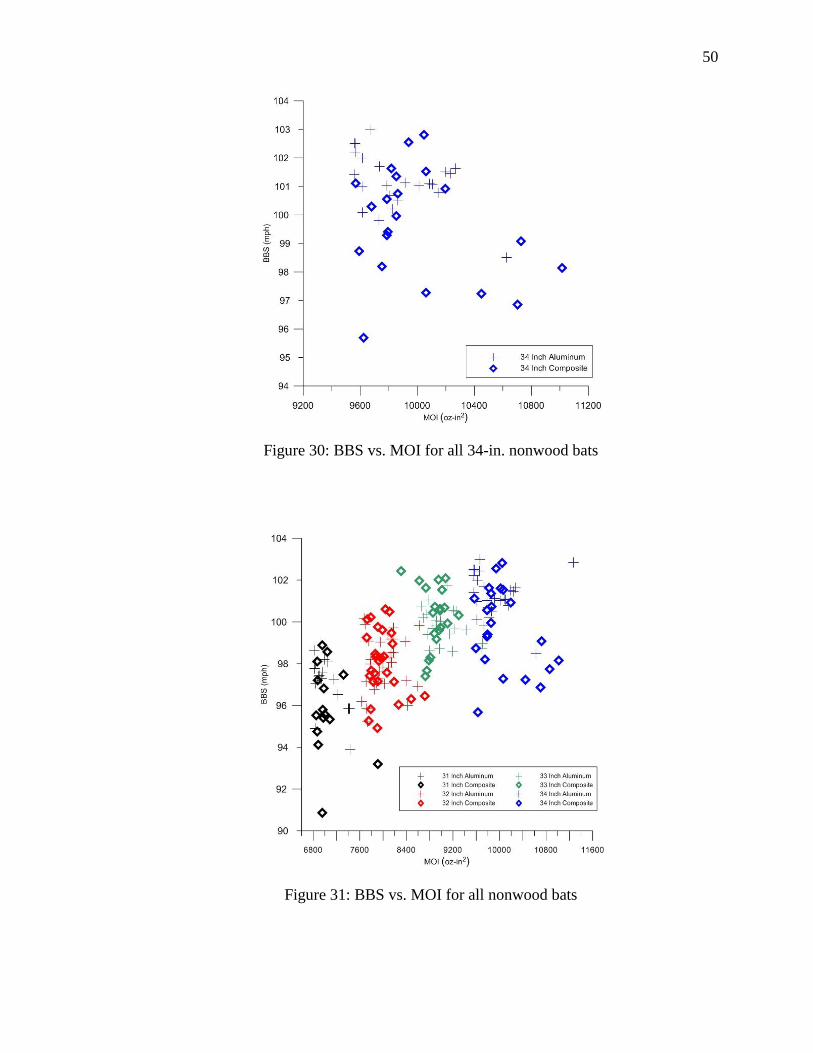
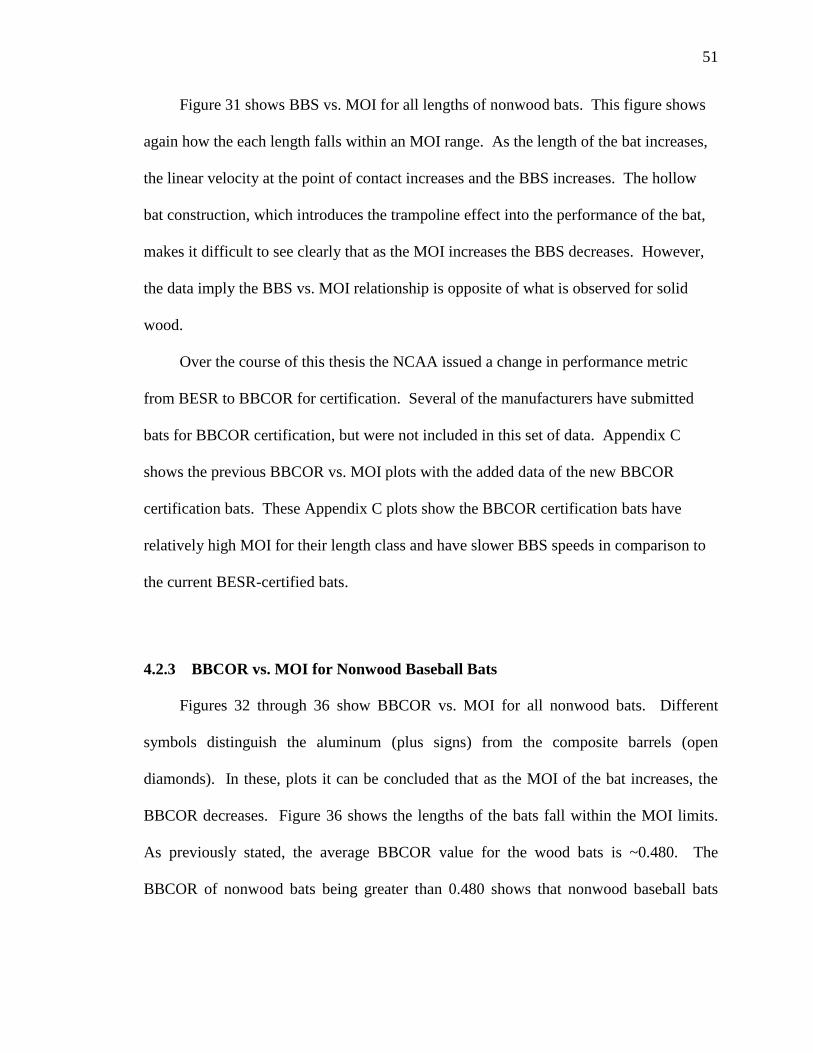
Figure 30: BBS vs. MOI for all 34-in. nonwood bats
Figure 31: BBS vs. MOI for all nonwood bats
51
Figure 31 shows BBS vs. MOI for all lengths of nonwood bats. This figure shows
again how the each length falls within an MOI range. As the length of the bat increases,
the linear velocity at the point of contact increases and the BBS increases. The hollow
bat construction, which introduces the trampoline effect into the performance of the bat,
makes it difficult to see clearly that as the MOI increases the BBS decreases. However,
the data imply the BBS vs. MOI relationship is opposite of what is observed for solid
wood.
Over the course of this thesis the NCAA issued a change in performance metric
from BESR to BBCOR for certification. Several of the manufacturers have submitted
bats for BBCOR certification, but were not included in this set of data. Appendix C
shows the previous BBCOR vs. MOI plots with the added data of the new BBCOR
certification bats. These Appendix C plots show the BBCOR certification bats have
relatively high MOI for their length class and have slower BBS speeds in comparison to
the current BESR-certified bats.
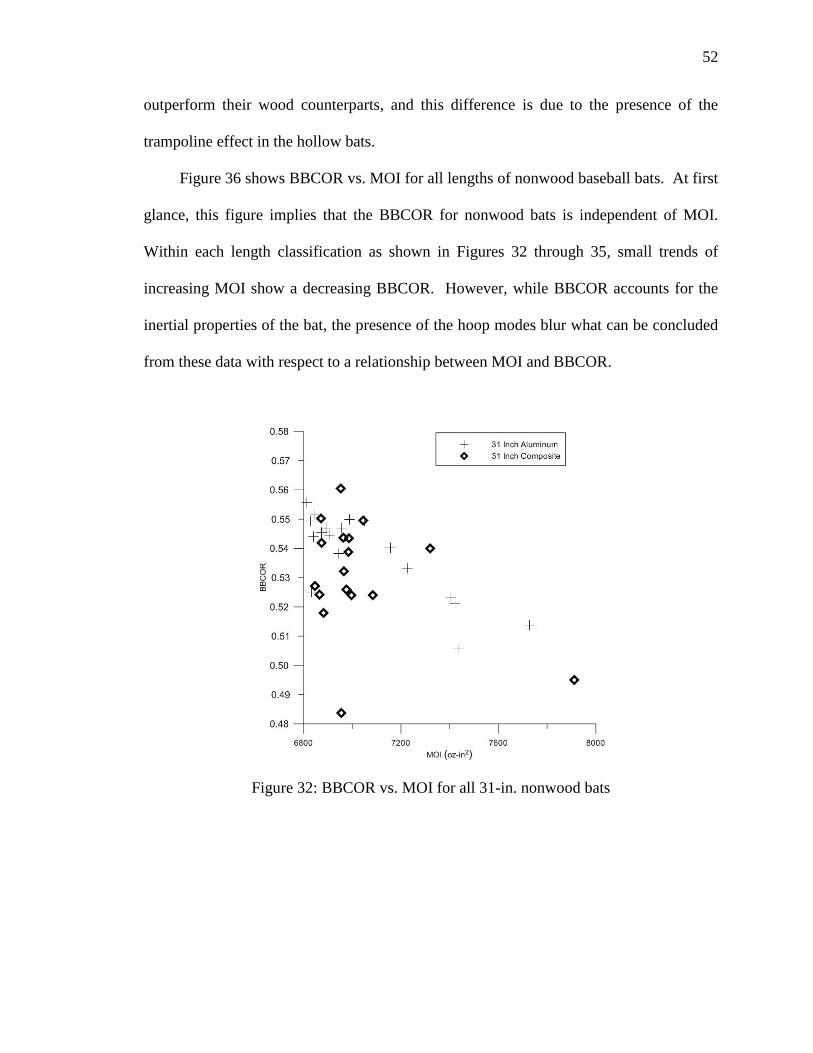
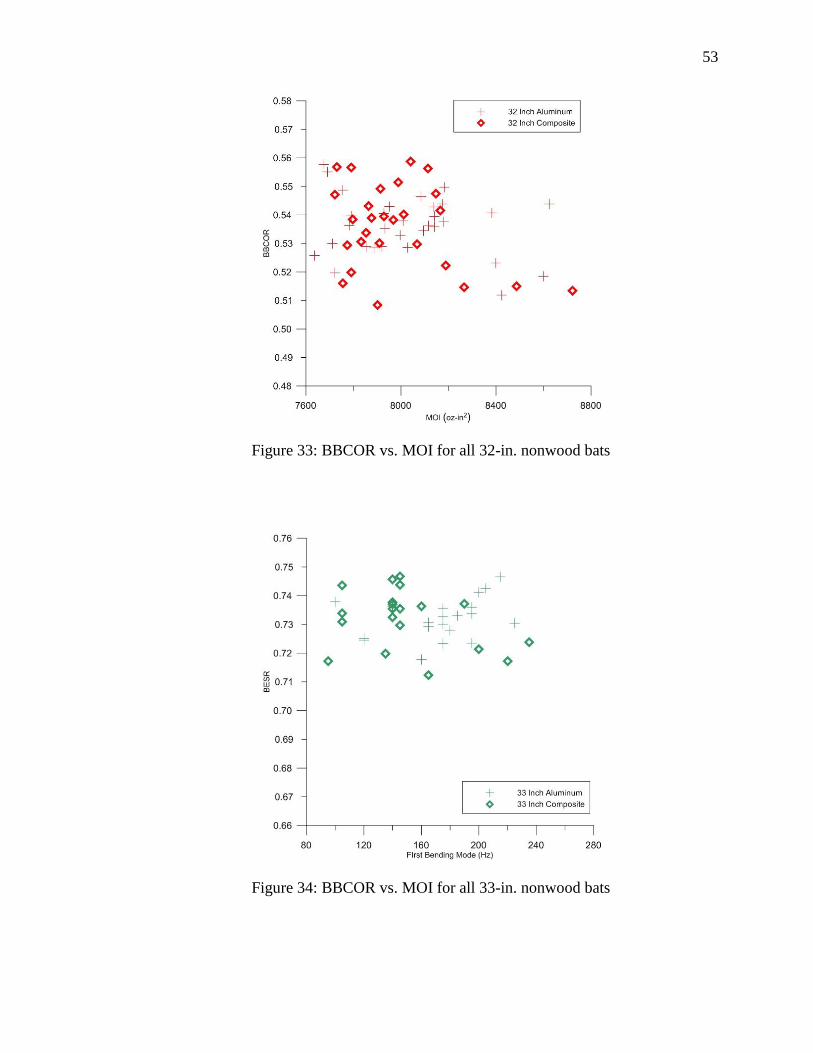
4.2.3 BBCOR vs. MOI for Nonwood Baseball Bats
Figures 32 through 36 show BBCOR vs. MOI for all nonwood bats. Different
symbols distinguish the aluminum (plus signs) from the composite barrels (open
diamonds). In these, plots it can be concluded that as the MOI of the bat increases, the
BBCOR decreases. Figure 36 shows the lengths of the bats fall within the MOI limits.
As previously stated, the average BBCOR value for the wood bats is ~0.480. The
BBCOR of nonwood bats being greater than 0.480 shows that nonwood baseball bats
52
outperform their wood counterparts, and this difference is due to the presence of the
trampoline effect in the hollow bats.
Figure 36 shows BBCOR vs. MOI for all lengths of nonwood baseball bats. At first
glance, this figure implies that the BBCOR for nonwood bats is independent of MOI.
Within each length classification as shown in Figures 32 through 35, small trends of
increasing MOI show a decreasing BBCOR. However, while BBCOR accounts for the
inertial properties of the bat, the presence of the hoop modes blur what can be concluded
from these data with respect to a relationship between MOI and BBCOR.
Figure 32: BBCOR vs. MOI for all 31-in. nonwood bats
53
Figure 33: BBCOR vs. MOI for all 32-in. nonwood bats
Figure 34: BBCOR vs. MOI for all 33-in. nonwood bats
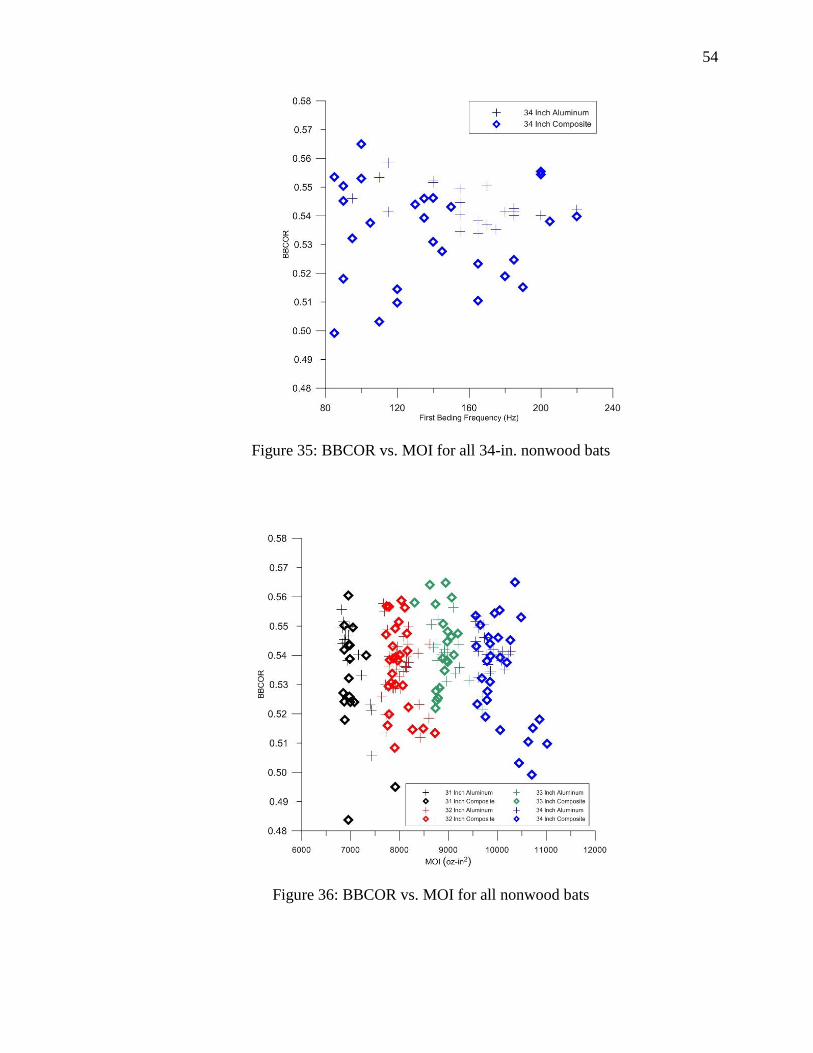
54
Figure 35: BBCOR vs. MOI for all 34-in. nonwood bats
Figure 36: BBCOR vs. MOI for all nonwood bats
55
4.3 Performance vs. Bending Frequency for Nonwood Baseball Bats
Modal tests were performed on the nonwood bats. The first bending modes were
recorded and were compared to BESR, BBS and BBCOR. As discussed in Section 4.1.3
for the wood bats, as the length and mass increase, the stiffness decreases, and the first
bending mode frequency decreases. The plots presented for the nonwood bats in
Section 4.3 are by classification of length and barrel material.
Other parameters such as MOI, and hoop mode could not be isolated from the
frequency information. Thus, the data presented in Section 4.3 are not solely a
consequence of a variation in the modal variations amongst the bats. However, this
limitation does not negate making some important observations as to a relationship
between modal behavior and bat performance.
4.3.1 BESR vs. Bending Frequencies
Figures 37 through 41 show plots of BESR vs. the frequency of the first bending
mode for the nonwood baseball bats. Similar to the wood bat data, a correlation can be
seen between the first bending frequency and BESR. As the first bending frequency
increases, the performance increases slightly for the nonwood bats. This slight increase
in performance with increasing bending frequency is not as significant as was observed
for the wood bats. The range of bending frequencies was 100 to 200 Hz for the wood
baseball bats, while the range of bending frequencies was from 80 to 280 Hz for the
nonwood bats. The various constructions of the nonwood bats contribute to the wide
range in bending frequencies among these bats.
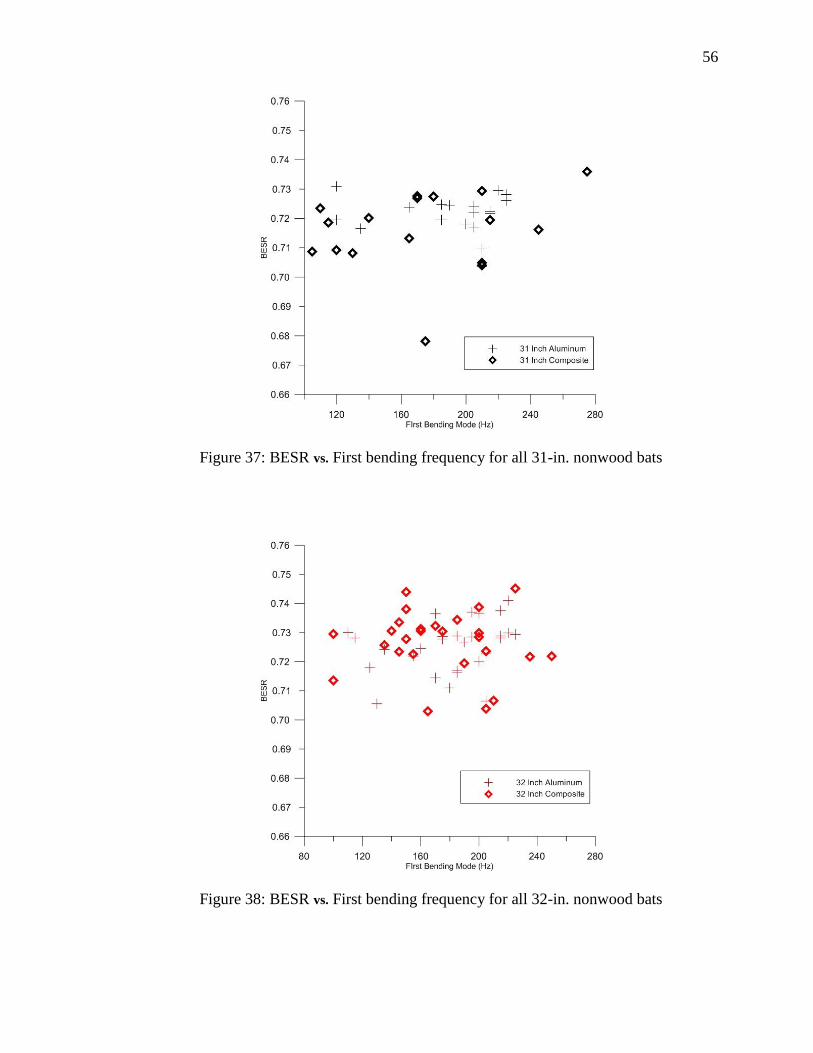
56
Figure 37: BESR vs. First bending frequency for all 31-in. nonwood bats
Figure 38: BESR vs. First bending frequency for all 32-in. nonwood bats

57
Figure 39: BESR vs. First bending frequency for all 33-in. nonwood bats
Figure 40: BESR vs. First bending frequency for all 34-in. nonwood bats
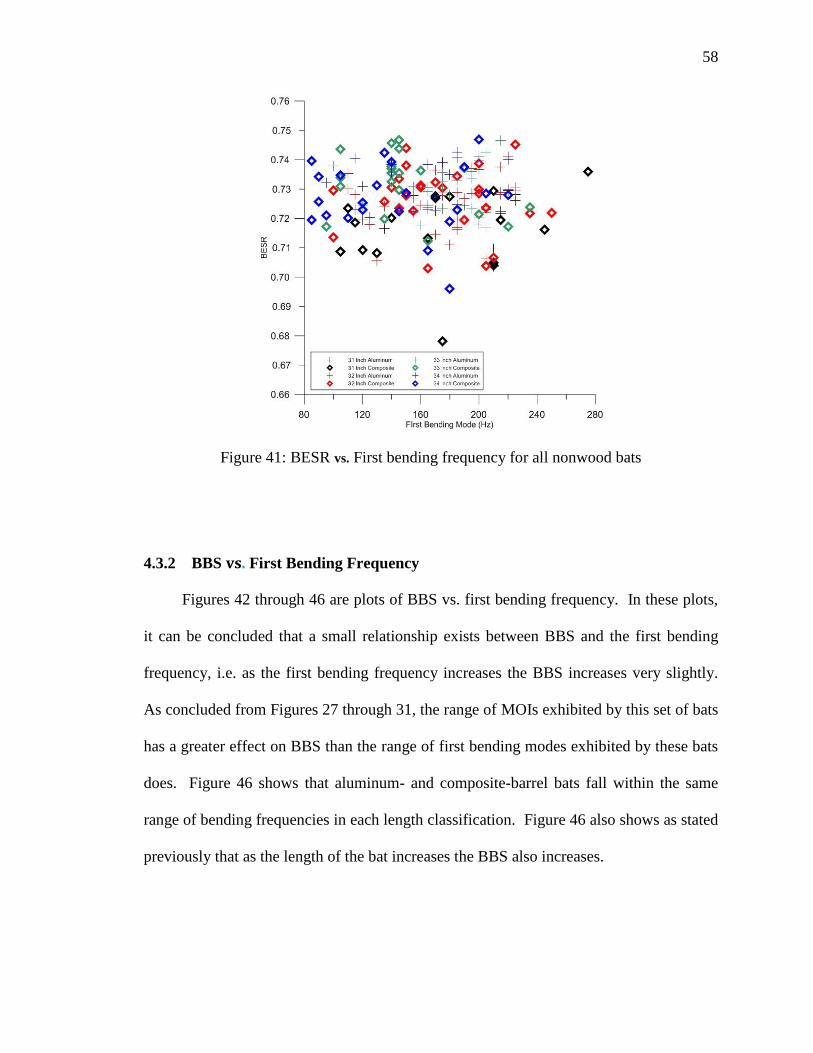
58
Figure 41: BESR vs. First bending frequency for all nonwood bats
4.3.2 BBS vs. First Bending Frequency
Figures 42 through 46 are plots of BBS vs. first bending frequency. In these plots,
it can be concluded that a small relationship exists between BBS and the first bending
frequency, i.e. as the first bending frequency increases the BBS increases very slightly.
As concluded from Figures 27 through 31, the range of MOIs exhibited by this set of bats
has a greater effect on BBS than the range of first bending modes exhibited by these bats
does. Figure 46 shows that aluminum- and composite-barrel bats fall within the same
range of bending frequencies in each length classification. Figure 46 also shows as stated
previously that as the length of the bat increases the BBS also increases.
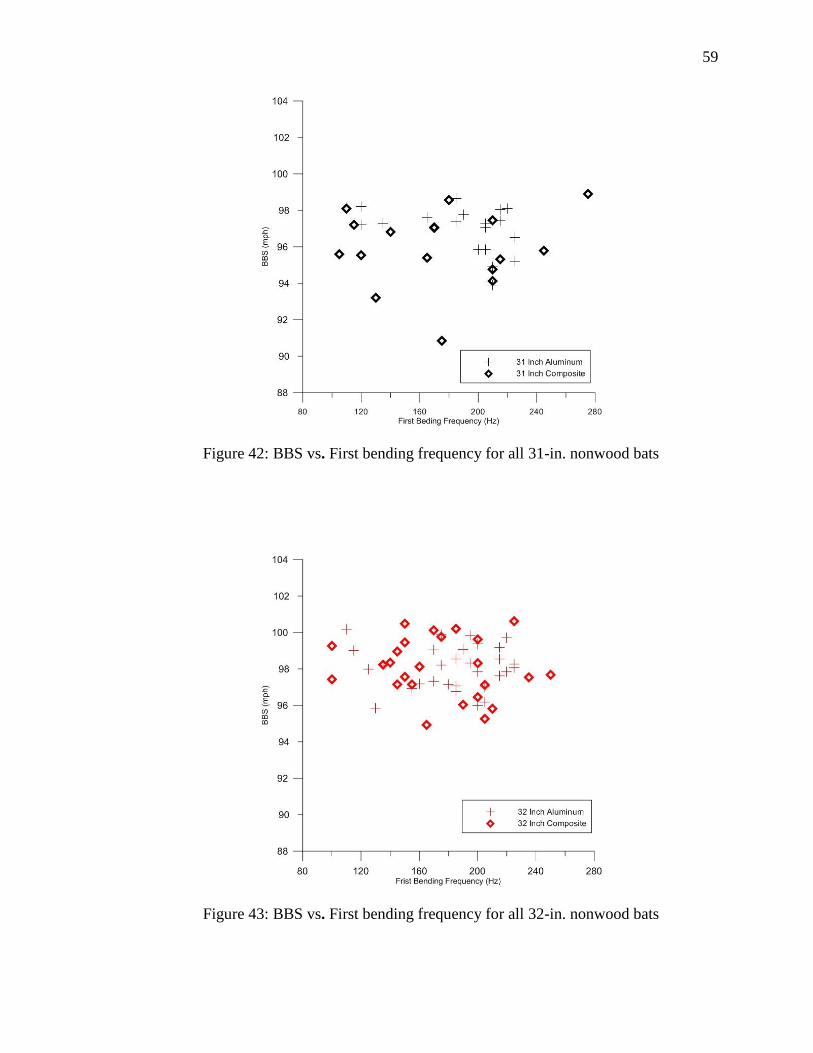
59
Figure 42: BBS vs. First bending frequency for all 31-in. nonwood bats
Figure 43: BBS vs. First bending frequency for all 32-in. nonwood bats
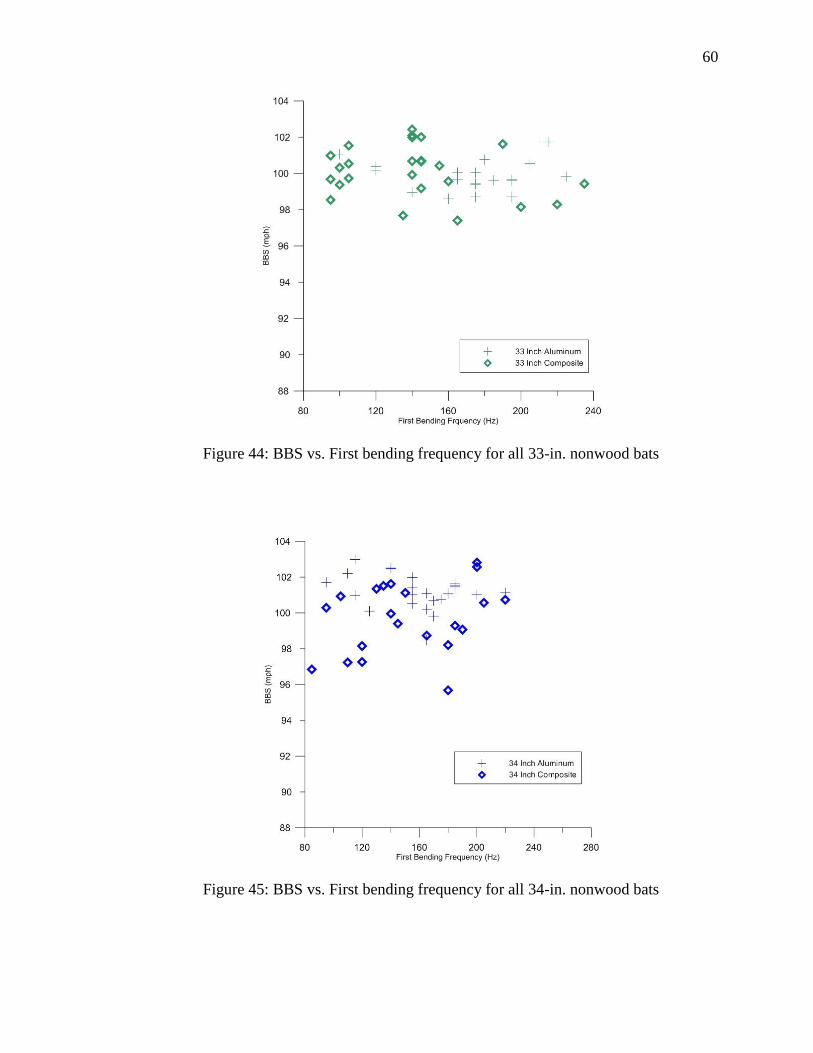
60
Figure 44: BBS vs. First bending frequency for all 33-in. nonwood bats
Figure 45: BBS vs. First bending frequency for all 34-in. nonwood bats
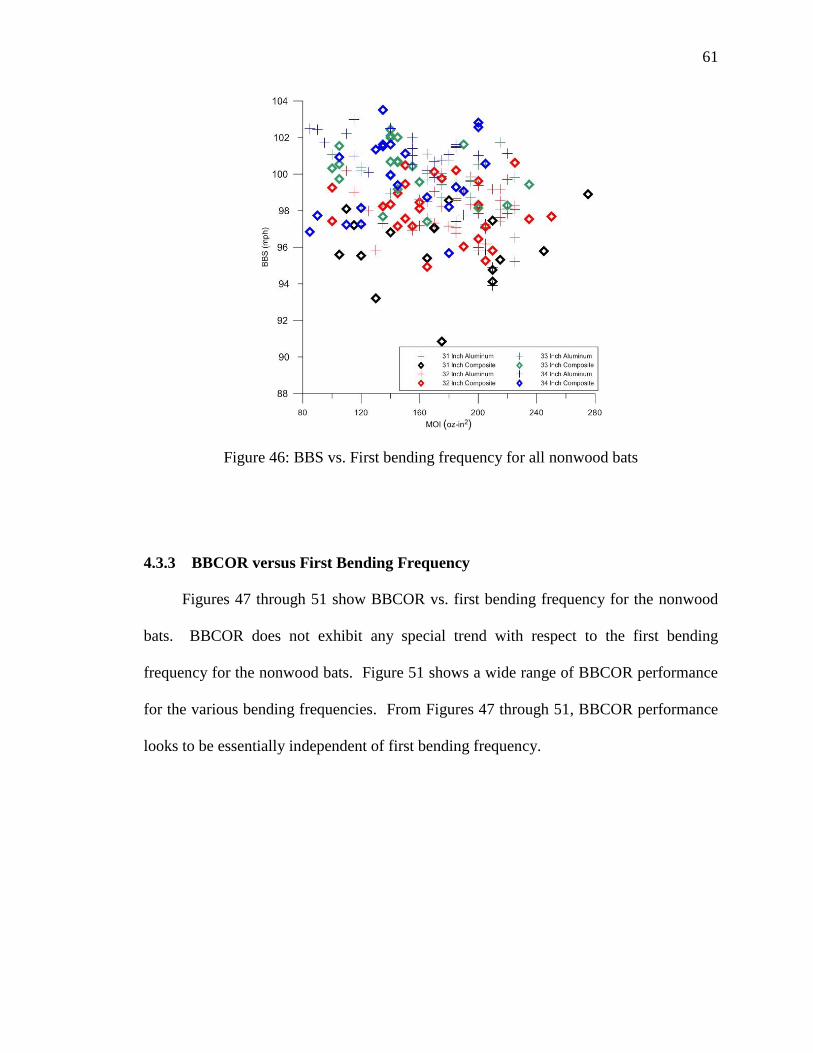
61
Figure 46: BBS vs. First bending frequency for all nonwood bats
4.3.3 BBCOR versus First Bending Frequency
Figures 47 through 51 show BBCOR vs. first bending frequency for the nonwood
bats. BBCOR does not exhibit any special trend with respect to the first bending
frequency for the nonwood bats. Figure 51 shows a wide range of BBCOR performance
for the various bending frequencies. From Figures 47 through 51, BBCOR performance
looks to be essentially independent of first bending frequency.
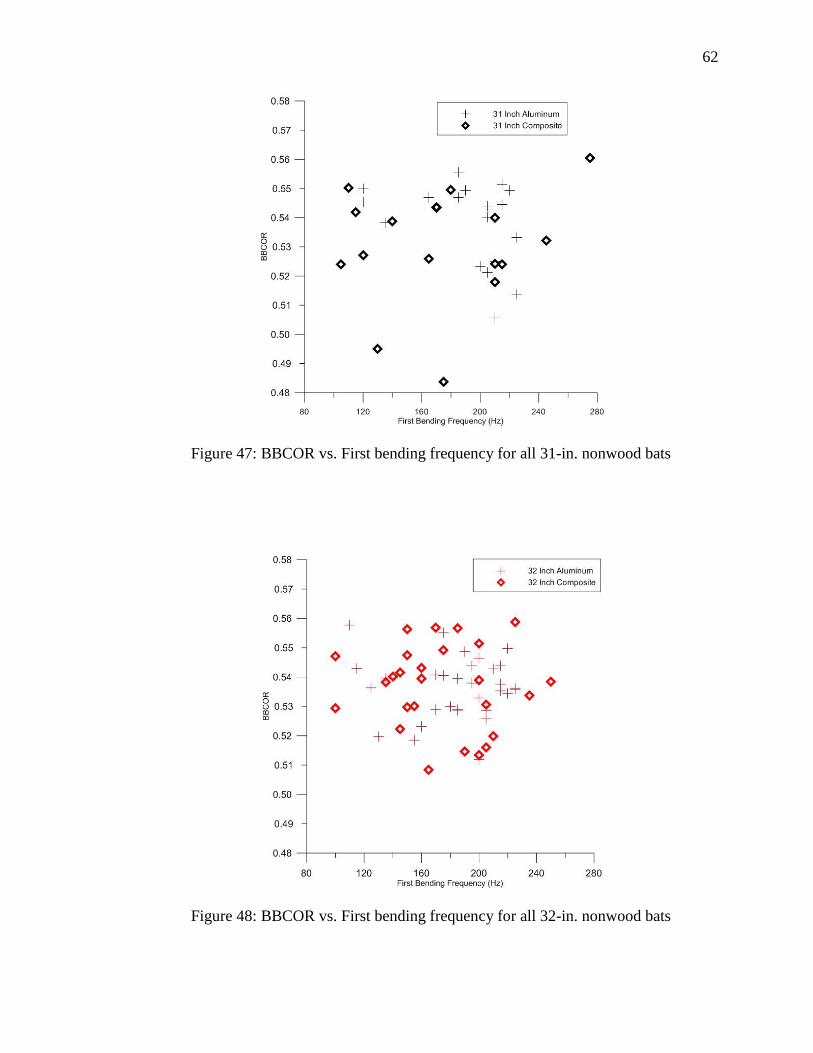
62
Figure 47: BBCOR vs. First bending frequency for all 31-in. nonwood bats
Figure 48: BBCOR vs. First bending frequency for all 32-in. nonwood bats
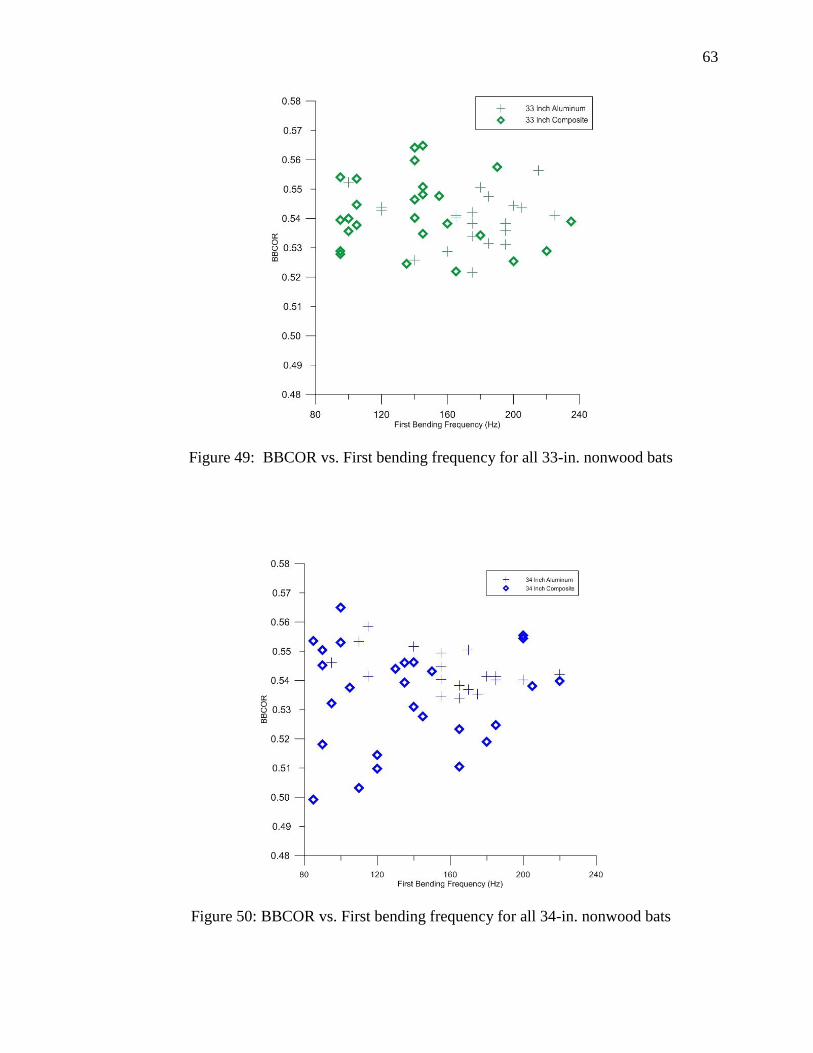
63
Figure 49: BBCOR vs. First bending frequency for all 33-in. nonwood bats
Figure 50: BBCOR vs. First bending frequency for all 34-in. nonwood bats
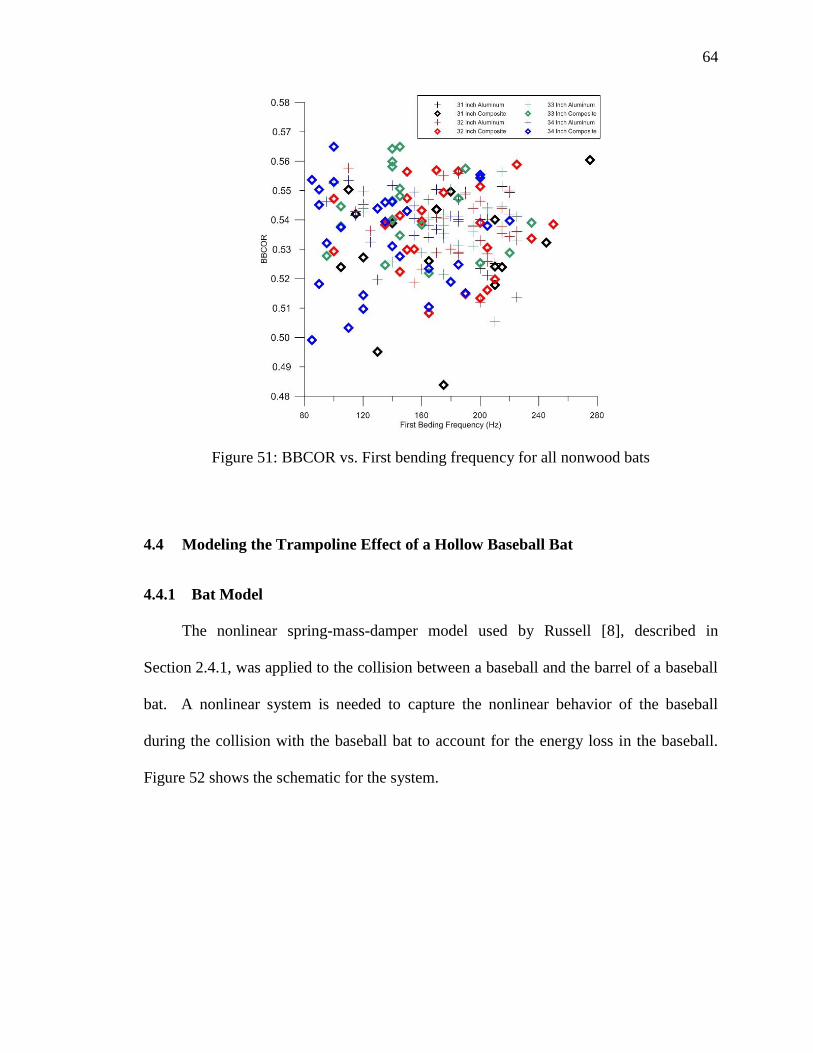
64
Figure 51: BBCOR vs. First bending frequency for all nonwood bats
4.4 Modeling the Trampoline Effect of a Hollow Baseball Bat
4.4.1 Bat Model
The nonlinear spring-mass-damper model used by Russell [8], described in
Section 2.4.1, was applied to the collision between a baseball and the barrel of a baseball
bat. A nonlinear system is needed to capture the nonlinear behavior of the baseball
during the collision with the baseball bat to account for the energy loss in the baseball.
Figure 52 shows the schematic for the system.
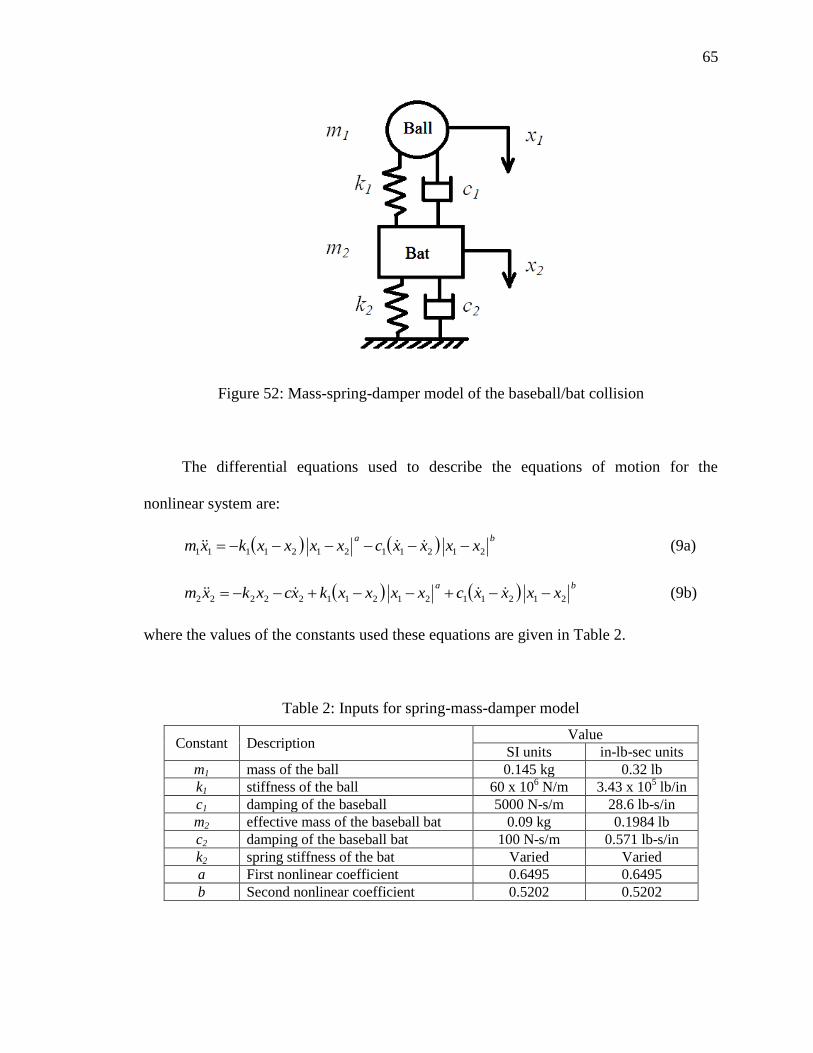
65
Figure 52: Mass-spring-damper model of the baseball/bat collision
The differential equations used to describe the equations of motion for the
nonlinear system are:
baxxxxcxxxxkxm 212112121111 (9a)
baxxxxcxxxxkxcxkxm 212112121122222 (9b)
where the values of the constants used these equations are given in Table 2.
Table 2: Inputs for spring-mass-damper model
Constant Description Value
SI units in-lb-sec units
m1 mass of the ball 0.145 kg 0.32 lb
k1 stiffness of the ball 60 x 106 N/m 3.43 x 10
5 lb/in
c1 damping of the baseball 5000 N-s/m 28.6 lb-s/in m2 effective mass of the baseball bat 0.09 kg 0.1984 lb c2 damping of the baseball bat 100 N-s/m 0.571 lb-s/in k2 spring stiffness of the bat Varied Varied a First nonlinear coefficient 0.6495 0.6495 b Second nonlinear coefficient 0.5202 0.5202
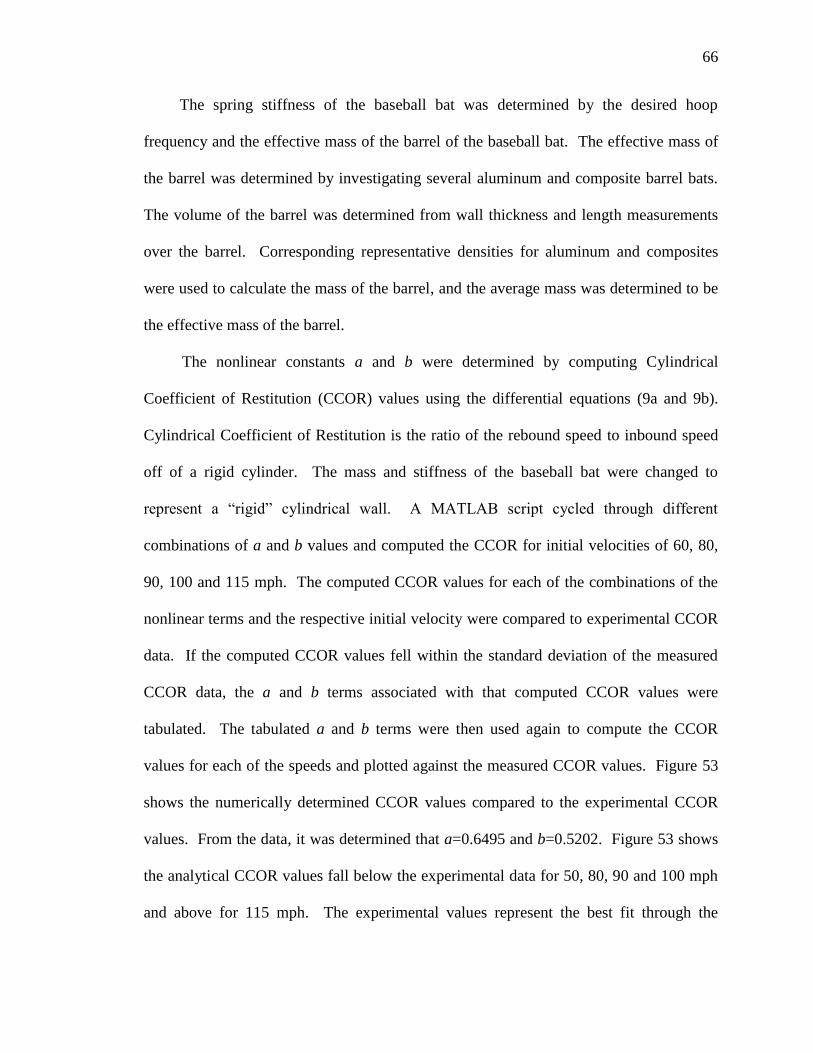
66
The spring stiffness of the baseball bat was determined by the desired hoop
frequency and the effective mass of the barrel of the baseball bat. The effective mass of
the barrel was determined by investigating several aluminum and composite barrel bats.
The volume of the barrel was determined from wall thickness and length measurements
over the barrel. Corresponding representative densities for aluminum and composites
were used to calculate the mass of the barrel, and the average mass was determined to be
the effective mass of the barrel.
The nonlinear constants a and b were determined by computing Cylindrical
Coefficient of Restitution (CCOR) values using the differential equations (9a and 9b).
Cylindrical Coefficient of Restitution is the ratio of the rebound speed to inbound speed
off of a rigid cylinder. The mass and stiffness of the baseball bat were changed to
represent a ―rigid‖ cylindrical wall. A MATLAB script cycled through different
combinations of a and b values and computed the CCOR for initial velocities of 60, 80,
90, 100 and 115 mph. The computed CCOR values for each of the combinations of the
nonlinear terms and the respective initial velocity were compared to experimental CCOR
data. If the computed CCOR values fell within the standard deviation of the measured
CCOR data, the a and b terms associated with that computed CCOR values were
tabulated. The tabulated a and b terms were then used again to compute the CCOR
values for each of the speeds and plotted against the measured CCOR values. Figure 53
shows the numerically determined CCOR values compared to the experimental CCOR
values. From the data, it was determined that a=0.6495 and b=0.5202. Figure 53 shows
the analytical CCOR values fall below the experimental data for 50, 80, 90 and 100 mph
and above for 115 mph. The experimental values represent the best fit through the
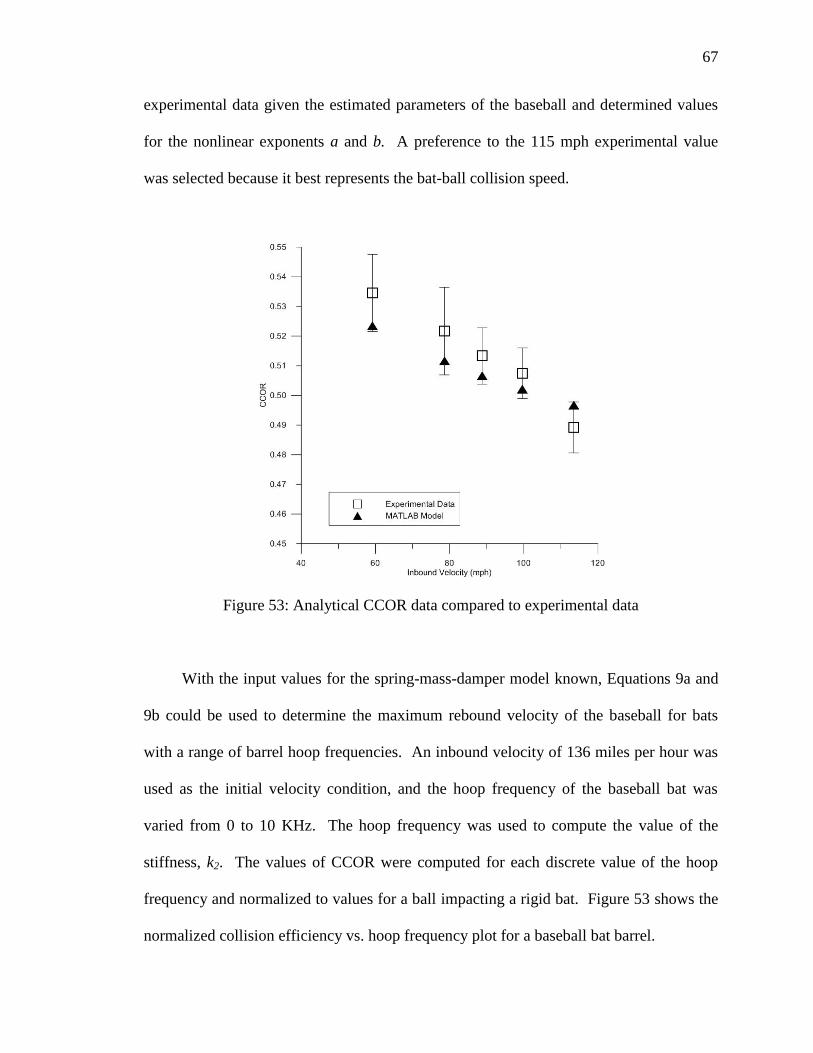
67
experimental data given the estimated parameters of the baseball and determined values
for the nonlinear exponents a and b. A preference to the 115 mph experimental value
was selected because it best represents the bat-ball collision speed.
Figure 53: Analytical CCOR data compared to experimental data
With the input values for the spring-mass-damper model known, Equations 9a and
9b could be used to determine the maximum rebound velocity of the baseball for bats
with a range of barrel hoop frequencies. An inbound velocity of 136 miles per hour was
used as the initial velocity condition, and the hoop frequency of the baseball bat was
varied from 0 to 10 KHz. The hoop frequency was used to compute the value of the
stiffness, k2. The values of CCOR were computed for each discrete value of the hoop
frequency and normalized to values for a ball impacting a rigid bat. Figure 53 shows the
normalized collision efficiency vs. hoop frequency plot for a baseball bat barrel.
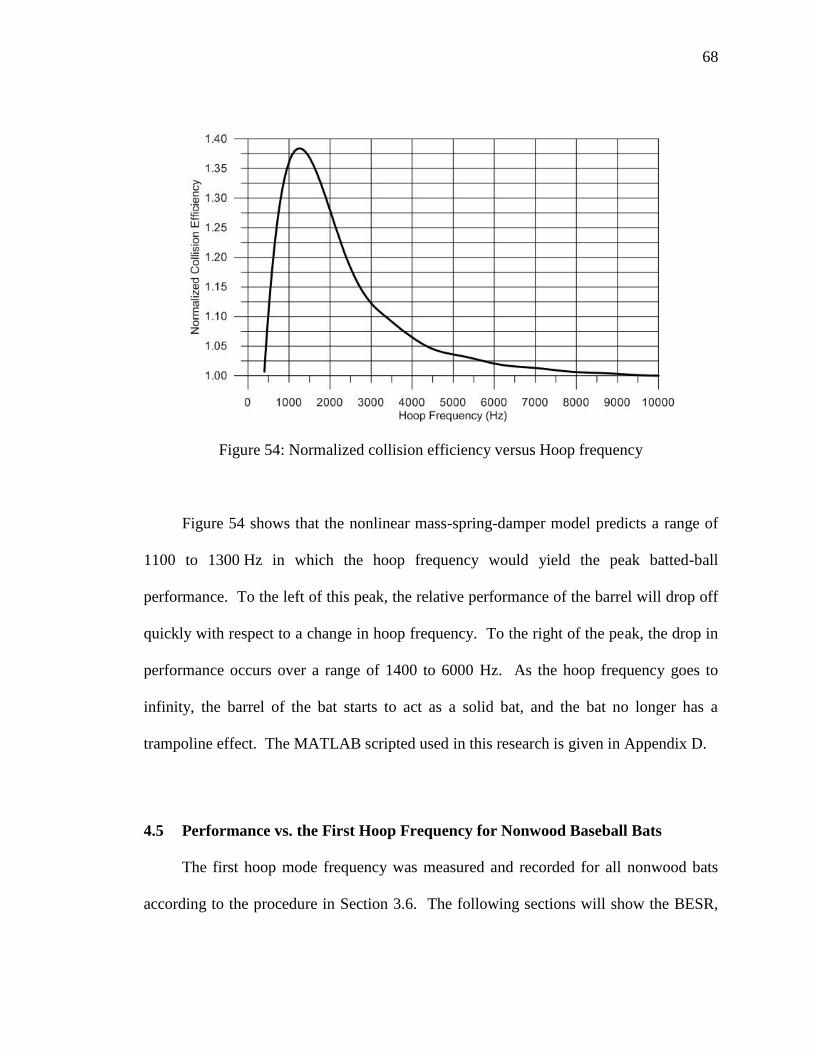
68
Figure 54: Normalized collision efficiency versus Hoop frequency
Figure 54 shows that the nonlinear mass-spring-damper model predicts a range of
1100 to 1300 Hz in which the hoop frequency would yield the peak batted-ball
performance. To the left of this peak, the relative performance of the barrel will drop off
quickly with respect to a change in hoop frequency. To the right of the peak, the drop in
performance occurs over a range of 1400 to 6000 Hz. As the hoop frequency goes to
infinity, the barrel of the bat starts to act as a solid bat, and the bat no longer has a
trampoline effect. The MATLAB scripted used in this research is given in Appendix D.
4.5 Performance vs. the First Hoop Frequency for Nonwood Baseball Bats
The first hoop mode frequency was measured and recorded for all nonwood bats
according to the procedure in Section 3.6. The following sections will show the BESR,
69
BBS and BBCOR performance metrics compared to the first hoop mode frequency. Plots
are presented by length classification and contain aluminum- and composite-barrel bats.
Composite baseball-bat barrels are more susceptible to damage than aluminum
barrels. As a composite-barrel bat is used, the barrel can develop microcracks in the resin
and between layers that tend to soften the barrel, i.e. causes the barrel stiffness to
decrease. Recall that natural frequency is proportional to the square root of the stiffness
divided by the mass. A decrease in the hoop frequency will occur as the barrel softens.
Broe [18] studied the effects of ―breaking in‖ composite barrel bats using an ABI
(accelerated break-in) process. The ABI procedure compresses the barrel of the bat by
either a prescribed displacement or prescribed load in a rolling device—similar to the pair
of rollers used for the ringer on an old washing machine. The rollers apply a pressure to
the barrel of the bat, and the bat is rolled back and forth until a change in barrel stiffness
is observed due to micracracking induced in the barrel as a consequence of
microcracking, delamination and fiber breakage. A similar study performed by Cruz [19]
investigated the performance increase in softball bats.
A set of composite-barrel bats that has undergone this ABI procedure was
evaluated as part of this research. The hoop frequency was measured prior to each
performance test. This ABI procedure was performed according to the NCAA standard
[20] and is given in Appendix E. The performance was monitored each time the barrel
was rolled. Several of the plots in this thesis show bats that have undergone this ABI
procedure, and these bats are denoted in the plots by solid diamond symbols. Bats that
have been used in college-level game play and have subsequently been tested at the
UMLBRC also fall into this category.
70
In the following sections, it will be shown that composite bats which have been
―used‖ either in the field or through an ABI process have much lower hoop frequencies
and increased performance values in comparison to new composite bats and typical
aluminum bats. The composite baseball bats range in hoop frequency from 2800 Hz for
new, i.e. ―bats right out of the wrapper‖, down to 1300 Hz, for bats that have been
―used‖. The aluminum bats span a relatively narrower range of 1800 to 2400 Hz.
Composite bats which have undergone the ABI process are the highest performing and
have the lowest hoop frequencies.
In comparison to aluminum-barrel bats, manufacturers have more control over the
effective properties of the composite-barrel bats, thereby allowing for the larger range of
hoop frequencies occurring for the composite- versus the aluminum-barrel bats.
Composite bat designs can differ in wall thickness and in the effective material stiffness
along the length of the barrel by varying the directions of the fiber reinforcements. The
only variable for aluminum bats is the wall thickness. The effective material stiffness is a
consequence of the aluminum alloy used to make the barrel.
4.5.1 BESR vs. the First Hoop Frequency for Nonwood Bats
Figures 55 through 58 show plots of BESR vs. the first hoop frequency for
nonwood bats. It can be seen in all of these figures that as the first hoop frequency
decreases the BESR increases. Composite barrel bats have a relatively wide hoop
frequency range from 1300 to 2800 Hz, while aluminum-barrel bats have a much
narrower range from 1800 to 2400 Hz. Figure 58 also shows that composite bats that
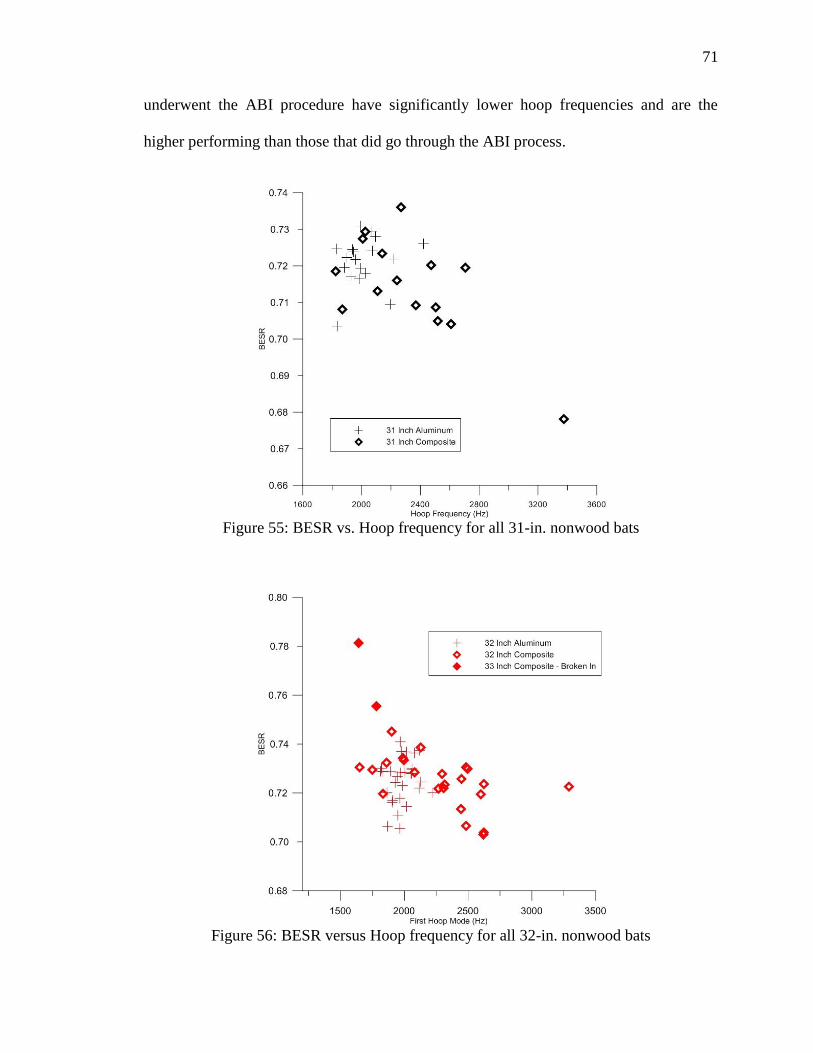
71
underwent the ABI procedure have significantly lower hoop frequencies and are the
higher performing than those that did go through the ABI process.
Figure 55: BESR vs. Hoop frequency for all 31-in. nonwood bats
Figure 56: BESR versus Hoop frequency for all 32-in. nonwood bats
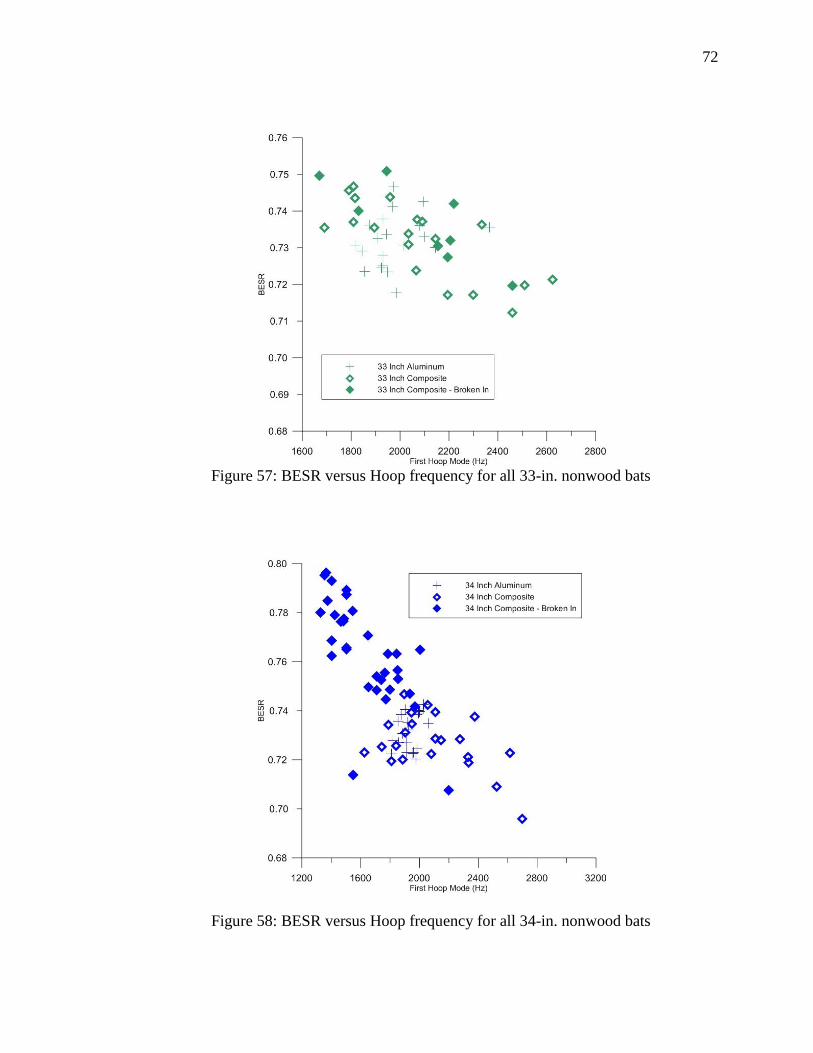
72
Figure 57: BESR versus Hoop frequency for all 33-in. nonwood bats
Figure 58: BESR versus Hoop frequency for all 34-in. nonwood bats
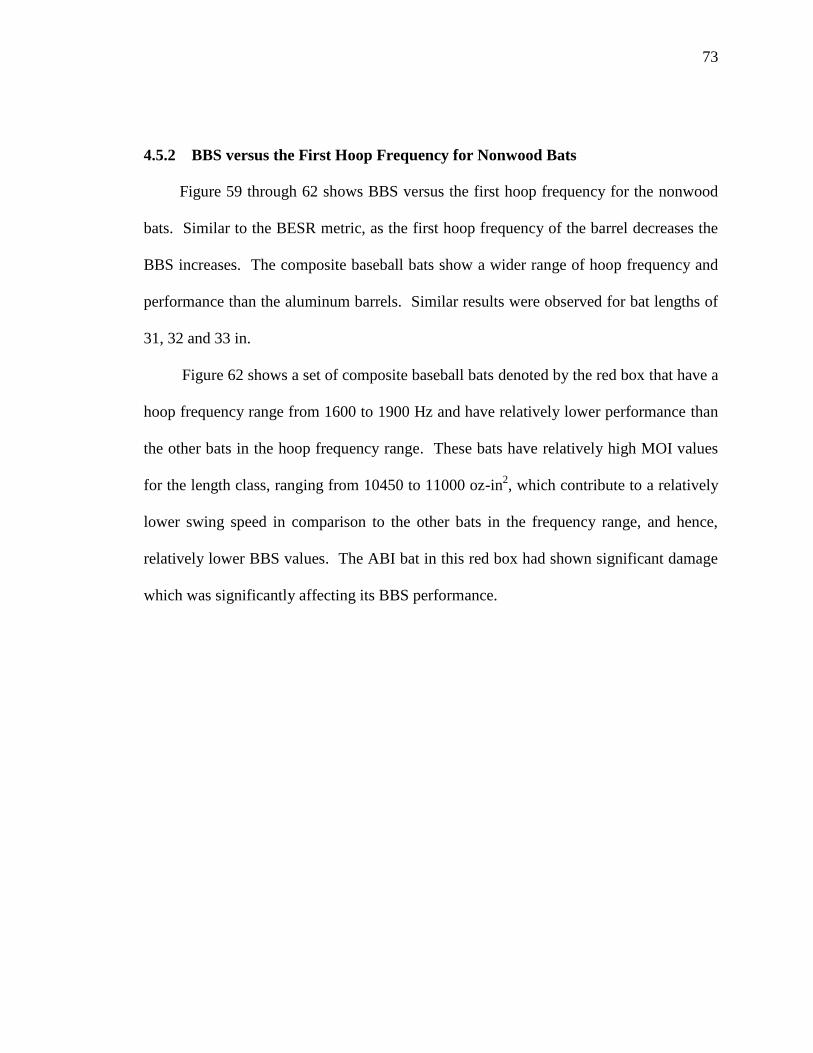
73
4.5.2 BBS versus the First Hoop Frequency for Nonwood Bats
Figure 59 through 62 shows BBS versus the first hoop frequency for the nonwood
bats. Similar to the BESR metric, as the first hoop frequency of the barrel decreases the
BBS increases. The composite baseball bats show a wider range of hoop frequency and
performance than the aluminum barrels. Similar results were observed for bat lengths of
31, 32 and 33 in.
Figure 62 shows a set of composite baseball bats denoted by the red box that have a
hoop frequency range from 1600 to 1900 Hz and have relatively lower performance than
the other bats in the hoop frequency range. These bats have relatively high MOI values
for the length class, ranging from 10450 to 11000 oz-in2, which contribute to a relatively
lower swing speed in comparison to the other bats in the frequency range, and hence,
relatively lower BBS values. The ABI bat in this red box had shown significant damage
which was significantly affecting its BBS performance.
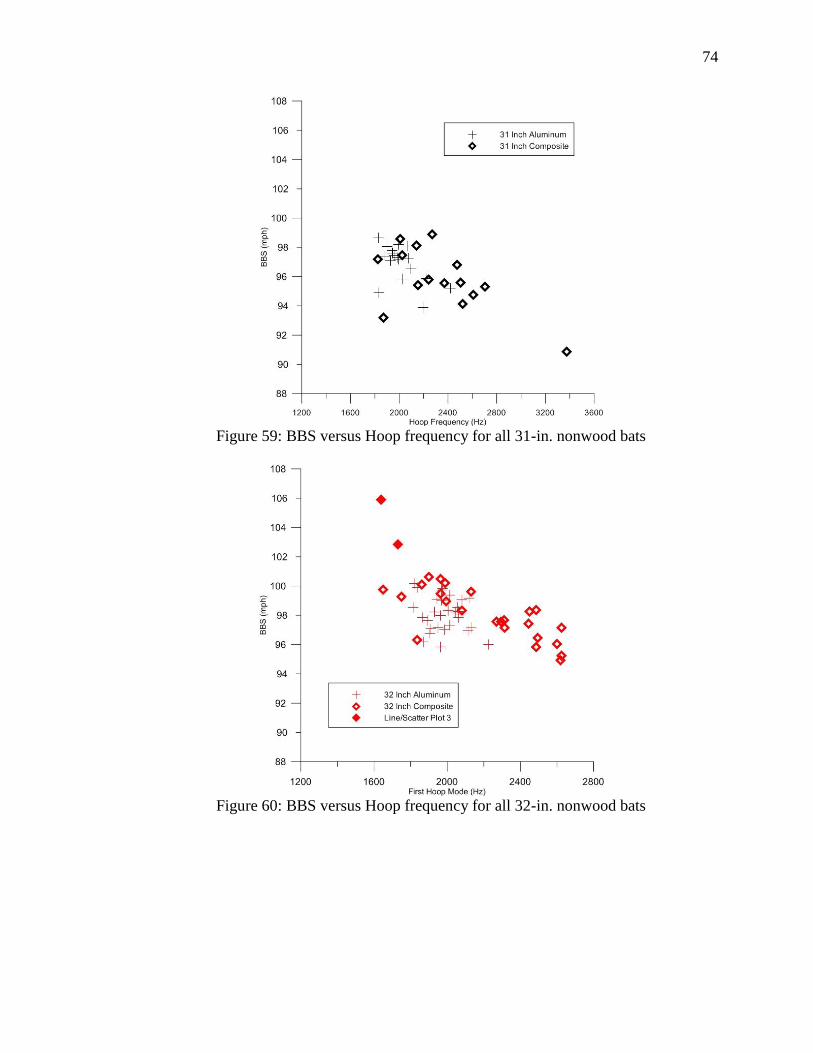
74
Figure 59: BBS versus Hoop frequency for all 31-in. nonwood bats
Figure 60: BBS versus Hoop frequency for all 32-in. nonwood bats
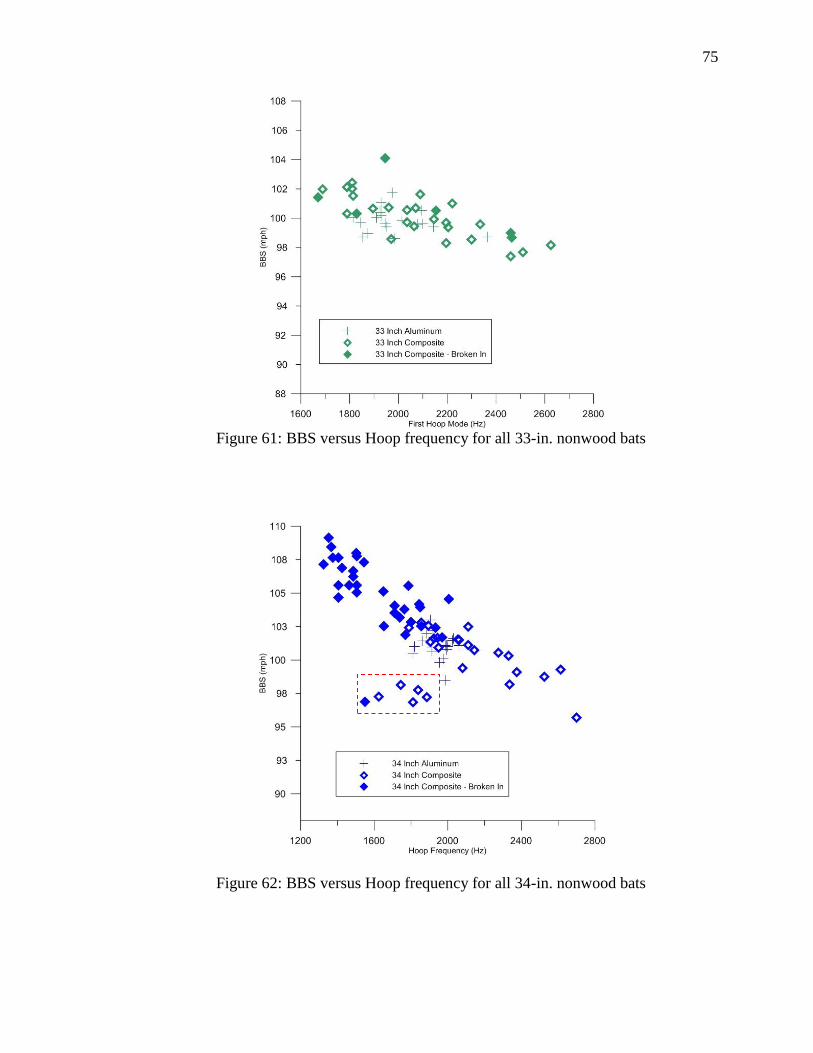
75
Figure 61: BBS versus Hoop frequency for all 33-in. nonwood bats
Figure 62: BBS versus Hoop frequency for all 34-in. nonwood bats
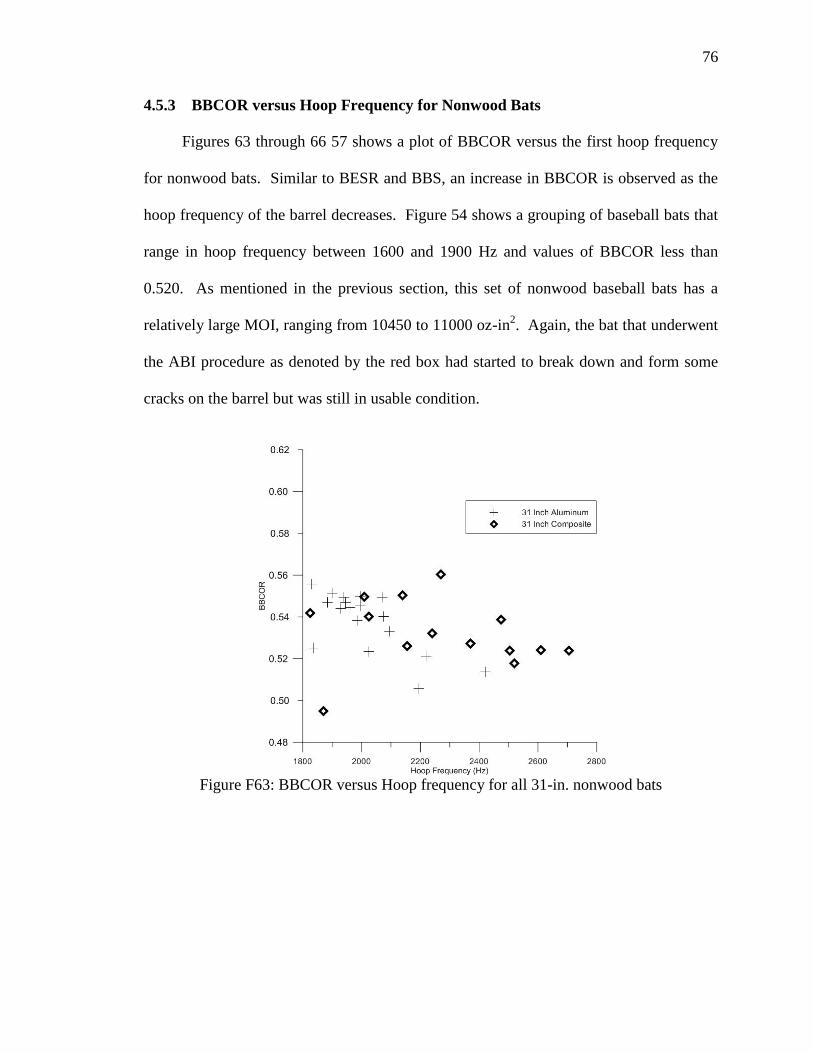
76
4.5.3 BBCOR versus Hoop Frequency for Nonwood Bats
Figures 63 through 66 57 shows a plot of BBCOR versus the first hoop frequency
for nonwood bats. Similar to BESR and BBS, an increase in BBCOR is observed as the
hoop frequency of the barrel decreases. Figure 54 shows a grouping of baseball bats that
range in hoop frequency between 1600 and 1900 Hz and values of BBCOR less than
0.520. As mentioned in the previous section, this set of nonwood baseball bats has a
relatively large MOI, ranging from 10450 to 11000 oz-in2. Again, the bat that underwent
the ABI procedure as denoted by the red box had started to break down and form some
cracks on the barrel but was still in usable condition.
Figure F63: BBCOR versus Hoop frequency for all 31-in. nonwood bats
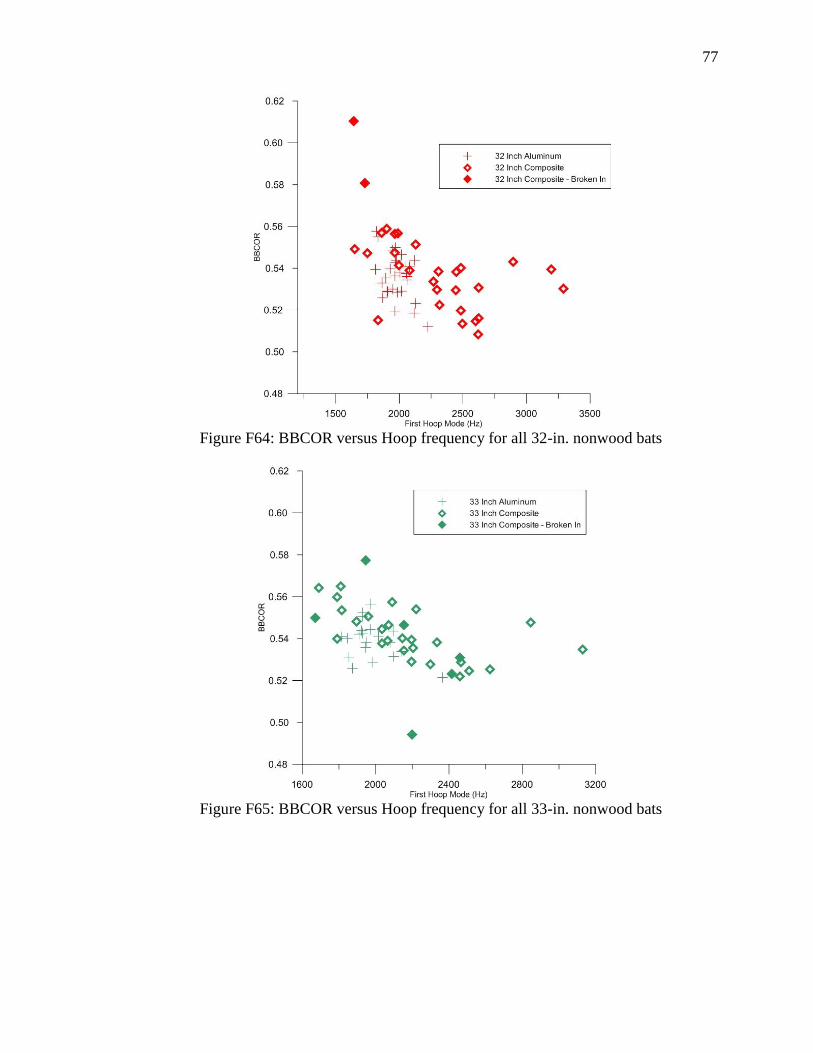
77
Figure F64: BBCOR versus Hoop frequency for all 32-in. nonwood bats
Figure F65: BBCOR versus Hoop frequency for all 33-in. nonwood bats
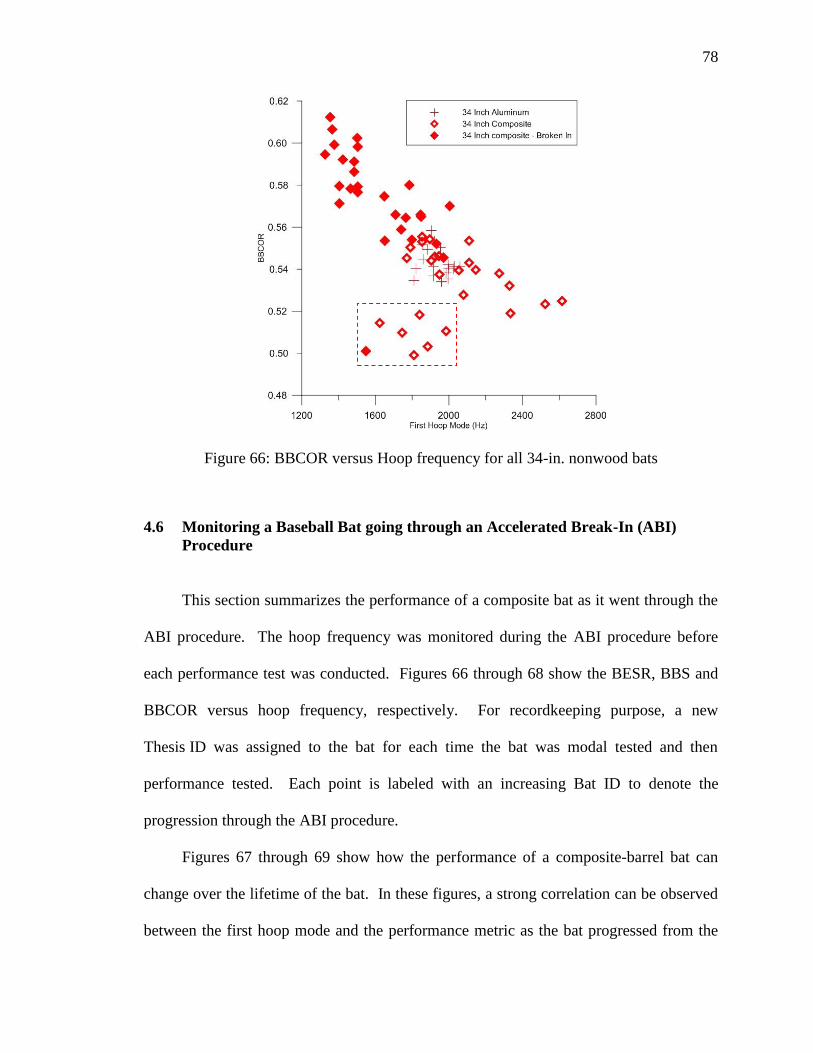
78
Figure 66: BBCOR versus Hoop frequency for all 34-in. nonwood bats
4.6 Monitoring a Baseball Bat going through an Accelerated Break-In (ABI)
Procedure
This section summarizes the performance of a composite bat as it went through the
ABI procedure. The hoop frequency was monitored during the ABI procedure before
each performance test was conducted. Figures 66 through 68 show the BESR, BBS and
BBCOR versus hoop frequency, respectively. For recordkeeping purpose, a new
Thesis ID was assigned to the bat for each time the bat was modal tested and then
performance tested. Each point is labeled with an increasing Bat ID to denote the
progression through the ABI procedure.
Figures 67 through 69 show how the performance of a composite-barrel bat can
change over the lifetime of the bat. In these figures, a strong correlation can be observed
between the first hoop mode and the performance metric as the bat progressed from the
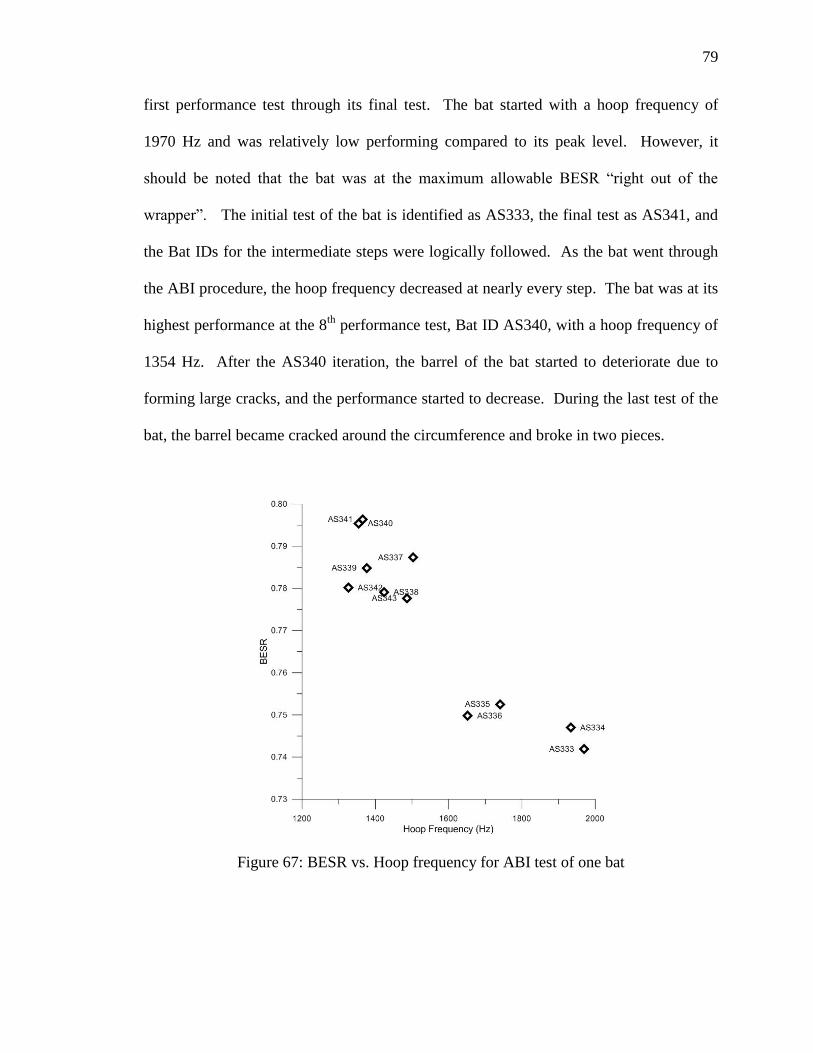
79
first performance test through its final test. The bat started with a hoop frequency of
1970 Hz and was relatively low performing compared to its peak level. However, it
should be noted that the bat was at the maximum allowable BESR ―right out of the
wrapper‖. The initial test of the bat is identified as AS333, the final test as AS341, and
the Bat IDs for the intermediate steps were logically followed. As the bat went through
the ABI procedure, the hoop frequency decreased at nearly every step. The bat was at its
highest performance at the 8th
performance test, Bat ID AS340, with a hoop frequency of
1354 Hz. After the AS340 iteration, the barrel of the bat started to deteriorate due to
forming large cracks, and the performance started to decrease. During the last test of the
bat, the barrel became cracked around the circumference and broke in two pieces.
Figure 67: BESR vs. Hoop frequency for ABI test of one bat
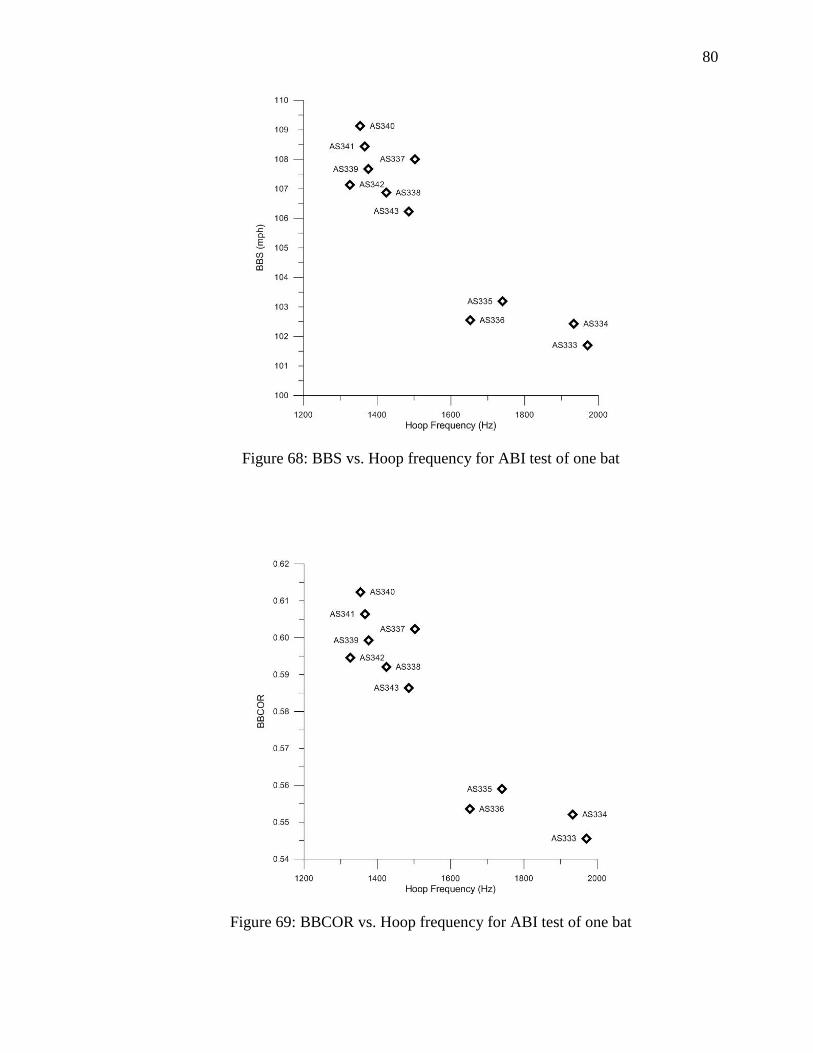
80
Figure 68: BBS vs. Hoop frequency for ABI test of one bat
Figure 69: BBCOR vs. Hoop frequency for ABI test of one bat
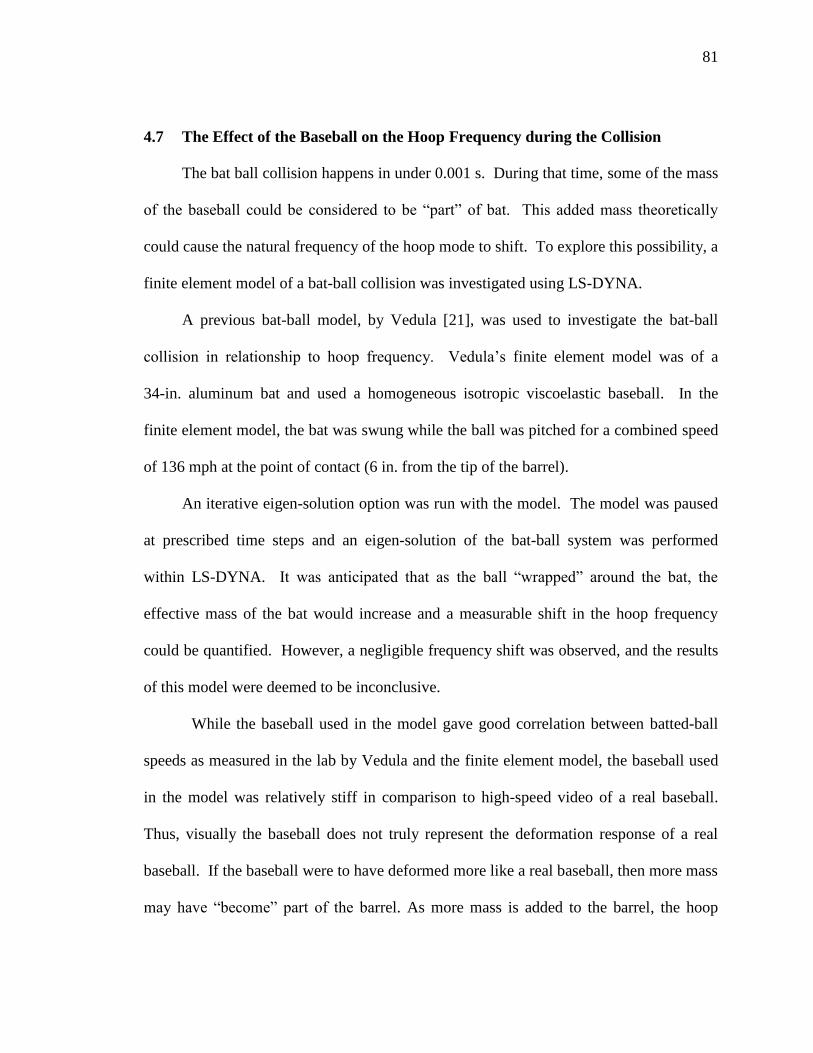
81
4.7 The Effect of the Baseball on the Hoop Frequency during the Collision
The bat ball collision happens in under 0.001 s. During that time, some of the mass
of the baseball could be considered to be ―part‖ of bat. This added mass theoretically
could cause the natural frequency of the hoop mode to shift. To explore this possibility, a
finite element model of a bat-ball collision was investigated using LS-DYNA.
A previous bat-ball model, by Vedula [21], was used to investigate the bat-ball
collision in relationship to hoop frequency. Vedula‘s finite element model was of a
34-in. aluminum bat and used a homogeneous isotropic viscoelastic baseball. In the
finite element model, the bat was swung while the ball was pitched for a combined speed
of 136 mph at the point of contact (6 in. from the tip of the barrel).
An iterative eigen-solution option was run with the model. The model was paused
at prescribed time steps and an eigen-solution of the bat-ball system was performed
within LS-DYNA. It was anticipated that as the ball ―wrapped‖ around the bat, the
effective mass of the bat would increase and a measurable shift in the hoop frequency
could be quantified. However, a negligible frequency shift was observed, and the results
of this model were deemed to be inconclusive.
While the baseball used in the model gave good correlation between batted-ball
speeds as measured in the lab by Vedula and the finite element model, the baseball used
in the model was relatively stiff in comparison to high-speed video of a real baseball.
Thus, visually the baseball does not truly represent the deformation response of a real
baseball. If the baseball were to have deformed more like a real baseball, then more mass
may have ―become‖ part of the barrel. As more mass is added to the barrel, the hoop
82
frequency should decrease because of the relationship among natural frequency, mass and
stiffness.
Figure 70(a) shows a high-speed video image of a baseball impacting an
aluminum-barrel bat, and Figure 70(b) shows the same condition as modeled in
LS-DYNA. It can be concluded from these figures that the deformation of the baseball in
the model does not fully replicate the deformation seen in the experiment. Research is
currently being pursued at the UMLBRC using a layer-by-layer approach to develop
accurate finite element models of the Rawlings Major League and R1NCAA baseballs.
Implementing one of these more accurate baseball models may show a very different
result.
To explore the extreme condition, a finite element model of the baseball ―welded‖
to the bat was investigated using the eigen-solution. With the ―welded‖ ball, the hoop
frequency of the bat changed from 2300 Hz to 1600 Hz. This drop in hoop frequency
was expected as the mass of the baseball was added to the system. Thus, it is expected
that upon the availability of a more credible finite element model of the baseball the
frequency shift can be better explored than was done in the current research.
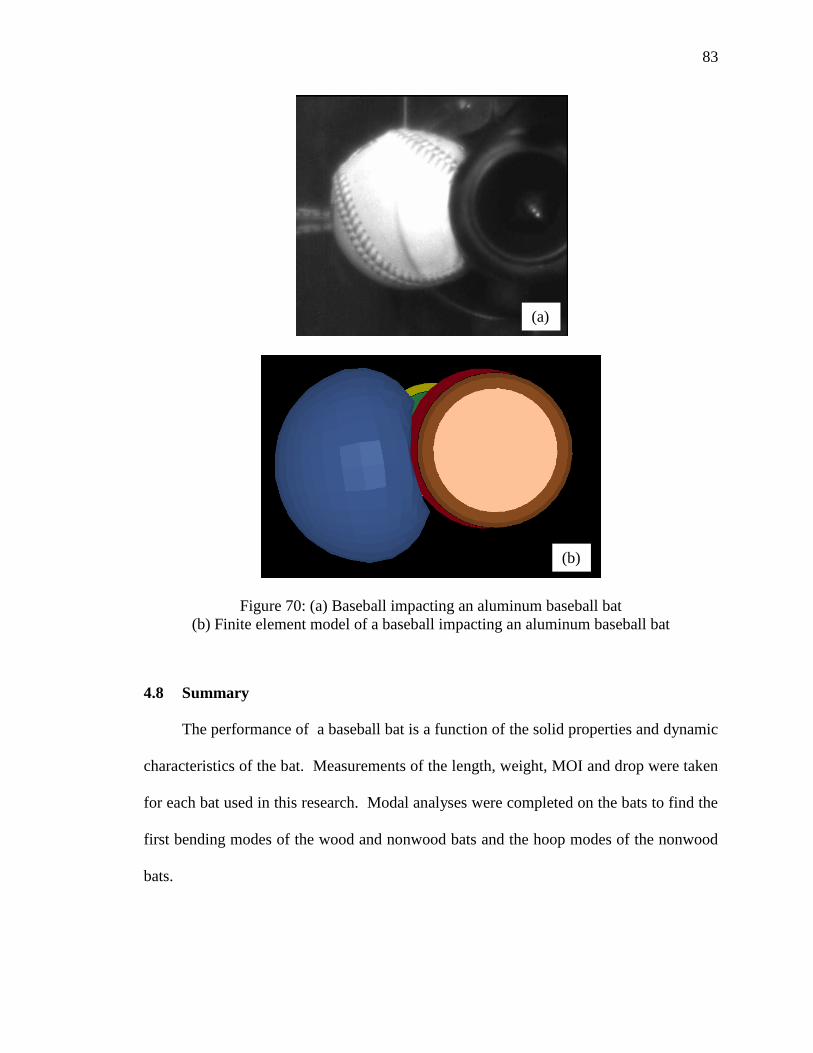
83
Figure 70: (a) Baseball impacting an aluminum baseball bat
(b) Finite element model of a baseball impacting an aluminum baseball bat
4.8 Summary
The performance of a baseball bat is a function of the solid properties and dynamic
characteristics of the bat. Measurements of the length, weight, MOI and drop were taken
for each bat used in this research. Modal analyses were completed on the bats to find the
first bending modes of the wood and nonwood bats and the hoop modes of the nonwood
bats.
(a)
(b)
84
The MOI and the drop of the wood baseball bats were found to contribute to the
BESR and BBS performance metrics, but the BBCOR was fairly independent of MOI.
As the lengths of the wood bats increased, the linear velocities increased and the BESR
and BBS metrics increased with increasing bat length. It was observed that as the first
bending modes increased, all performance metrics increased.
For the nonwood bats, it was observed that as the MOI increased, the BESR
increased but the BBS and BBCOR decreased. The drop for the nonwood bats was not
compared to performance because all of the nonwood bats fell within the -3
classification. A correlation was found that as the first bending mode increased, the
BESR and BBS performance metrics increased. Composite bats were found to have a
wider range of hoop frequencies than aluminum bats. All performance metrics increased
as the first hoop frequency decreased. Composite bats that underwent the accelerated
break-in procedure had the lowest hoop frequencies and the highest performance, as
quantified by all metrics.
A nonlinear mass-spring model was used to simulate the collision between a
nonwood bat and the ball. Model constants were empirically determined using a
MATLAB code and experimental CCOR data. The model showed that the maximum
batted-ball performance occurred in a hoop frequency range of 1100 to 1300 Hz.
The hoop frequency of a baseball bat was thought to change as the ball impacts the
barrel of the bat. A finite element model was used to investigate the evolution of the first
hoop frequency during the bat-ball collision. A negligible change in the hoop frequency
was observed as the ball moved in and out during the collision. However, the ball used in
85
this simulation did not accurately represent the characteristic of a real baseball, so the
analysis was most likely not representative of a real bat-ball collision.
86
5 Conclusions
The dynamic response of baseball bats has been studied in an effort to develop an
understanding of the relationship between the modal characteristics of collegiate and
major league bats and their associated batted-ball performance. The physical properties
of MOI and drop were also studied to see if and what relationships exist between these
properties and bat performance. A simple two degree of freedom mass-spring-damper
model was used as a complementary tool for insight into studying these relationships.
Several conclusions have been made as result of these studies:
As the length of the bat increased, the linear velocity increased causing an
increase in BESR and BBS for both the wood and nonwood bats.
As the moment of inertia increased, the BESR and BBS performances increased
for both the wood and nonwood bats.
The BBCOR performance was essentially the same for the wood bats regardless
of the MOI. This result is because the barrel of a wood bat is essentially rigid, so
these bats do not have a trampoline effect.
87
For wood bats, the drop of the wood bat has an effect on the performance metrics
of BESR and BBS. As the drop became more positive, the BESR increased. A
wood bat with a more negative drop will have an increase in swing speed and
therefore will have an increase in BBS.
As the length of the wood bat decreased, the bending frequencies increased. This
result is due to the combination of the decrease in length, which leads to an
increase in the effective bending stiffness, and the decrease in mass. As the first
bending frequency of the wood bats increased, an increase in performance for all
metrics was observed.
For the nonwood bats, it was found that as the MOI increased, the BESR
increased while the BBS and BBCOR values decreased. The drop was not
considered because all of the nonwood bats fell within the -3 classification, so this
parameter was not varied. The performance metrics of BESR and BBS were
found to have a correlation to the first bending mode where the higher the first
bending frequency the higher the performance. However, there was no
correlation found between the first bending mode and BBCOR.
A mass-spring-damper model was used to simulate the bat-ball collision for
nonwood bats with varying hoop frequencies. The model showed there is an
optimal hoop frequency range for the barrel of the bat to produce an efficient
collision, and this range is 1100 to 1300 Hz.
88
The first hoop mode of the nonwood bats was measured using impact testing and
compared to the performance metrics. As the hoop frequency decreased the
performance across all performance metrics increased. This phenomenon agrees
with the two degree of freedom model used in this research.
Composite bats were found to have the widest range of hoop frequency and
performance. This wide range of hoop frquencies is a reflection of the wide
variations that result from the manufacturing processes used for these composite
bats.
A composite bat was tested using the accelerated break in procedure. The hoop
frequency of the bat decreased, and an increase in performance was observed.
A finite element model of the bat-ball collision was used to investigate how the
―added‖ mass of the baseball influences any variation in the hoop mode during
the bat-ball collision. The finite element model showed negligible change in the
hoop frequency as the ball moved in and out of the collision. However, the
stiffness of the ball was not necessarily representative of a real baseball.
89
6 Recommendations
Work done in this thesis gave a good understanding on how the natural frequencies of
the baseball bats affect the performance. Recommendations for future research to further
this understanding include:
Investigate baseball bats with hoop frequencies at and bellow 1300 Hz to try to
establish the peak hoop frequency and roll off after 1100 Hz. This study could
further validate the nonlinear mass-spring-damper model.
Another option for exploring the effect of hoop frequency is to use finite element
models of bats with hoop frequencies at and below 1300 Hz. However, such a
computational study would require the use of a credible and robust finite clement
model of a baseball, and such a model does not yet exist. However, a qualitative
understanding may possibly be developed even with a fairly good finite element
model of a baseball.
90
A study could be performed investigating how the baseball affects the dynamic
response of the baseball bat. As mentioned in the previous bullet, a more accurate
finite element model of a baseball than was used in this research would be
required.
Investigate the relationship between durability of a baseball bat as it relates to
hoop frequencies. As the hoop frequency drops does the durability drop, too?
Before aluminum bats were strictly regulated, it was not uncommon for a very
thin-walled aluminum bat to last only 10 impacts.
Studying the dynamic response of a bat while in the hands of a player may
contribute to a better understanding of modal contributions to performance.
Accelerometers could be mounted to the baseball bat in several locations so as to
measure the frequency response as a player swings and makes contact with the
ball.
Further investigate the hoop modes of wood bats and composite wood bats.
Composite would bats would be constructed of a hollow composite core with a
hollow wood shell around the outside.
Continue investigating the relationship between the breaking in of composite bats
to the resulting change in performance. Samples of composite bats from multiple
manufacturers should be considered so as to include a representative range of
manufacturing methods and a range of qualities. Various techniques for
modifying the bat physical properties to change the dynamic response could be
performed. Barrel walls could be machined to reduce the wall thickness and
hence reduce the hoop frequency (maybe below 1300 Hz).
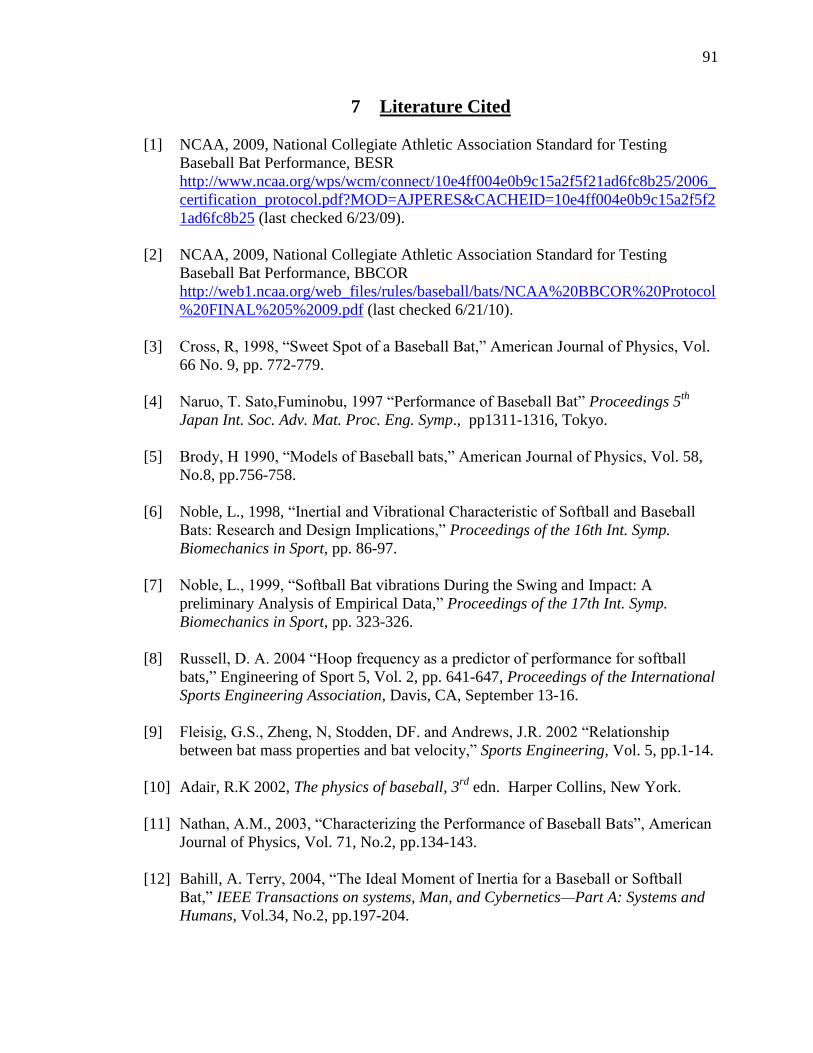
91
7 Literature Cited
[1] NCAA, 2009, National Collegiate Athletic Association Standard for Testing
Baseball Bat Performance, BESR
http://www.ncaa.org/wps/wcm/connect/10e4ff004e0b9c15a2f5f21ad6fc8b25/2006_
certification_protocol.pdf?MOD=AJPERES&CACHEID=10e4ff004e0b9c15a2f5f2
1ad6fc8b25 (last checked 6/23/09).
[2] NCAA, 2009, National Collegiate Athletic Association Standard for Testing
Baseball Bat Performance, BBCOR
http://web1.ncaa.org/web_files/rules/baseball/bats/NCAA%20BBCOR%20Protocol
%20FINAL%205%2009.pdf (last checked 6/21/10).
[3] Cross, R, 1998, ―Sweet Spot of a Baseball Bat,‖ American Journal of Physics, Vol.
66 No. 9, pp. 772-779.
[4] Naruo, T. Sato,Fuminobu, 1997 ―Performance of Baseball Bat‖ Proceedings 5th
Japan Int. Soc. Adv. Mat. Proc. Eng. Symp., pp1311-1316, Tokyo.
[5] Brody, H 1990, ―Models of Baseball bats,‖ American Journal of Physics, Vol. 58,
No.8, pp.756-758.
[6] Noble, L., 1998, ―Inertial and Vibrational Characteristic of Softball and Baseball
Bats: Research and Design Implications,‖ Proceedings of the 16th Int. Symp.
Biomechanics in Sport, pp. 86-97.
[7] Noble, L., 1999, ―Softball Bat vibrations During the Swing and Impact: A
preliminary Analysis of Empirical Data,‖ Proceedings of the 17th Int. Symp.
Biomechanics in Sport, pp. 323-326.
[8] Russell, D. A. 2004 ―Hoop frequency as a predictor of performance for softball
bats,‖ Engineering of Sport 5, Vol. 2, pp. 641-647, Proceedings of the International
Sports Engineering Association, Davis, CA, September 13-16.
[9] Fleisig, G.S., Zheng, N, Stodden, DF. and Andrews, J.R. 2002 ―Relationship
between bat mass properties and bat velocity,‖ Sports Engineering, Vol. 5, pp.1-14.
[10] Adair, R.K 2002, The physics of baseball, 3rd
edn. Harper Collins, New York.
[11] Nathan, A.M., 2003, ―Characterizing the Performance of Baseball Bats‖, American
Journal of Physics, Vol. 71, No.2, pp.134-143.
[12] Bahill, A. Terry, 2004, ―The Ideal Moment of Inertia for a Baseball or Softball
Bat,‖ IEEE Transactions on systems, Man, and Cybernetics—Part A: Systems and
Humans, Vol.34, No.2, pp.197-204.
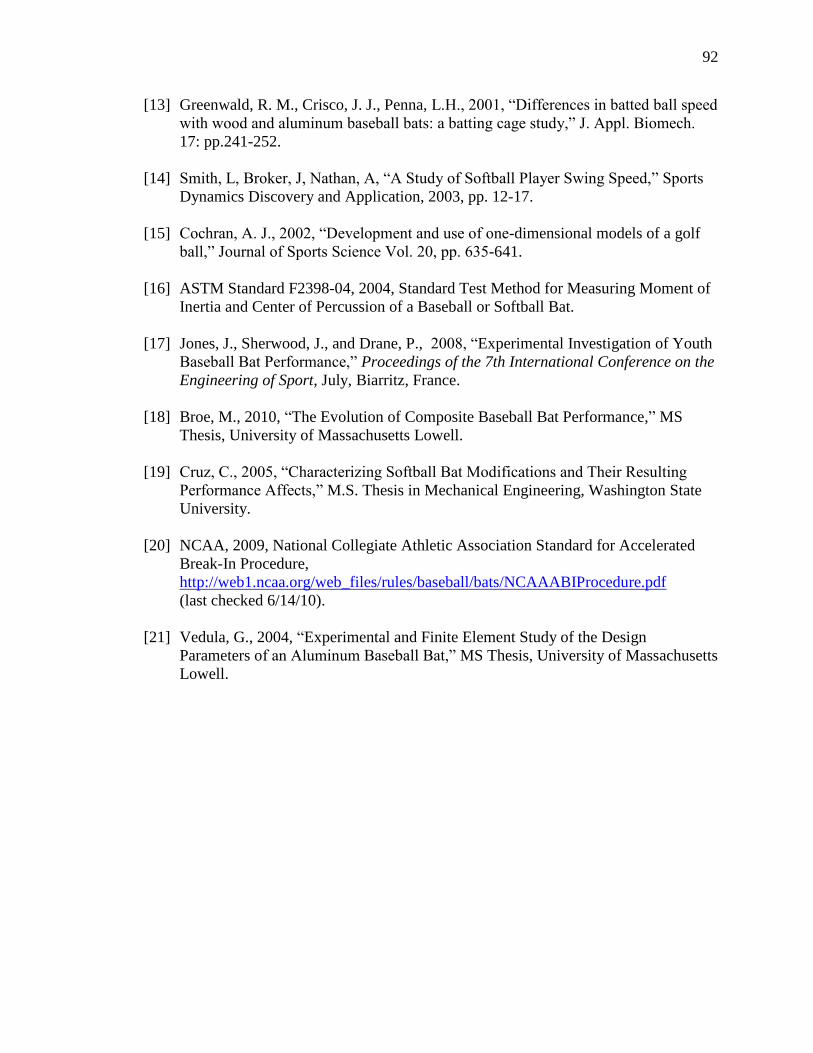
92
[13] Greenwald, R. M., Crisco, J. J., Penna, L.H., 2001, ―Differences in batted ball speed
with wood and aluminum baseball bats: a batting cage study,‖ J. Appl. Biomech.
17: pp.241-252.
[14] Smith, L, Broker, J, Nathan, A, ―A Study of Softball Player Swing Speed,‖ Sports
Dynamics Discovery and Application, 2003, pp. 12-17.
[15] Cochran, A. J., 2002, ―Development and use of one-dimensional models of a golf
ball,‖ Journal of Sports Science Vol. 20, pp. 635-641.
[16] ASTM Standard F2398-04, 2004, Standard Test Method for Measuring Moment of
Inertia and Center of Percussion of a Baseball or Softball Bat.
[17] Jones, J., Sherwood, J., and Drane, P., 2008, ―Experimental Investigation of Youth
Baseball Bat Performance,‖ Proceedings of the 7th International Conference on the
Engineering of Sport, July, Biarritz, France.
[18] Broe, M., 2010, ―The Evolution of Composite Baseball Bat Performance,‖ MS
Thesis, University of Massachusetts Lowell.
[19] Cruz, C., 2005, ―Characterizing Softball Bat Modifications and Their Resulting
Performance Affects,‖ M.S. Thesis in Mechanical Engineering, Washington State
University.
[20] NCAA, 2009, National Collegiate Athletic Association Standard for Accelerated
Break-In Procedure,
http://web1.ncaa.org/web_files/rules/baseball/bats/NCAAABIProcedure.pdf
(last checked 6/14/10).
[21] Vedula, G., 2004, ―Experimental and Finite Element Study of the Design
Parameters of an Aluminum Baseball Bat,‖ MS Thesis, University of Massachusetts
Lowell.
A1
Appendix A: Quick Modal Test Validation
Full modal tests were performed on several nonwood bats and one aluminum
cylinder. The purpose of these tests was to validate a procedure to measure the hoop
frequencies of nonwood baseball bats without having to perform a full modal test.
A simple structure of an aluminum cylinder was investigated. The cylinder had
four lines drawn around the circumference using 1-in. spacing. Eight points were placed
on each line spaced evenly around the circumference. The cylinder was hung in a
simulated free-free condition as shown in Figure A1.
Figure A71: Aluminum cylinder in a simulated free-free condition with points labeled
An accelerometer was placed at one of the points. The average of five impacts was
taken at each location. The frequency response function (FRF) data computed by the RT
Pro Photon 6.0 data acquisition program was imported into ME-Scope, a computer
program used to analyze modal data and animate mode shapes.
A structure of the tested section of the aluminum tube was created in ME-Scope.
The imported test data were used to extract the mode shapes. The structure was then
animated to visually show an animation of the mode shapes of the section of the
A2
aluminum tube. Figure A2 shows a screen shot of the animation along with the FRF.
The first peak of the FRF was determined to be the first hoop mode of the cylinder.
Because the cylinder is so short, the first bending mode does not occur until ~ 3000 Hz.
Figure A72: ME-Scope animation of the first mode shape of the aluminum cylinder
A second modal test was preformed to help create a fast test for measuring the hoop
frequencies. Two accelerometers were placed on the cylinder approximately 90 degrees
from one another with the impacts on the same side as one of the accelerometers. The
average of five impacts was taken on the barrel. The FRF was computed for each
accelerometer and overlaid. Figure A3 shows the overlay plot of the FRF.
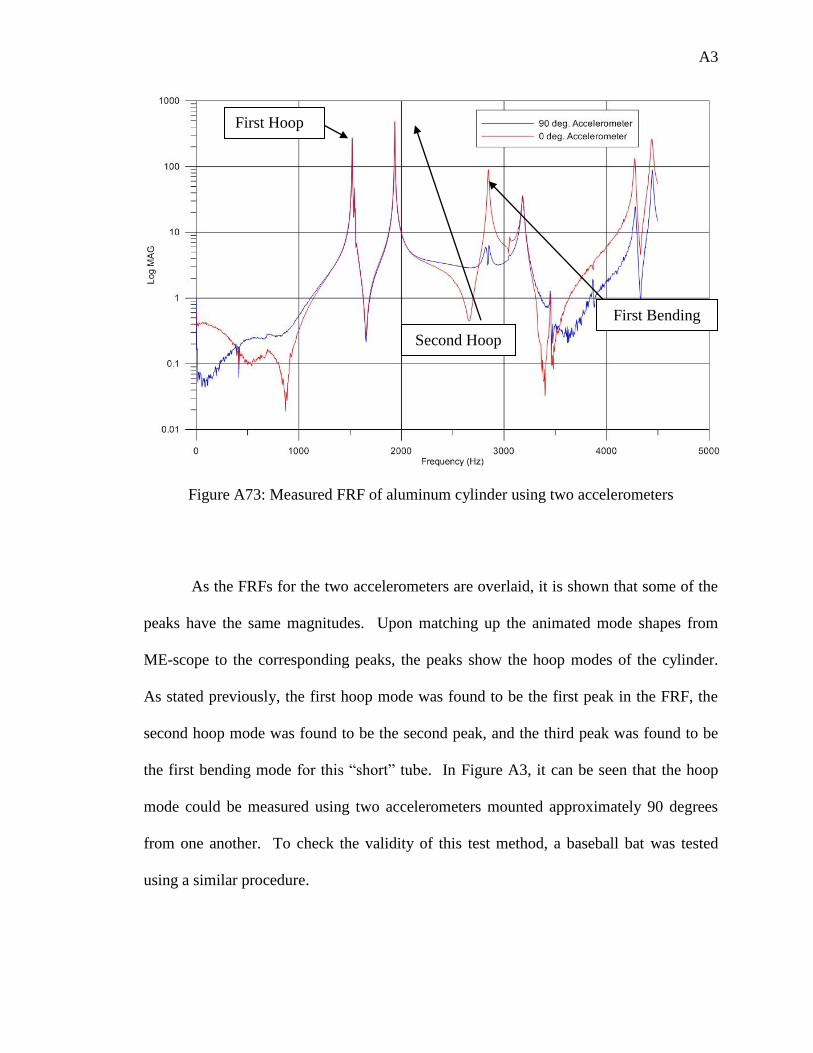
A3
Figure A73: Measured FRF of aluminum cylinder using two accelerometers
As the FRFs for the two accelerometers are overlaid, it is shown that some of the
peaks have the same magnitudes. Upon matching up the animated mode shapes from
ME-scope to the corresponding peaks, the peaks show the hoop modes of the cylinder.
As stated previously, the first hoop mode was found to be the first peak in the FRF, the
second hoop mode was found to be the second peak, and the third peak was found to be
the first bending mode for this ―short‖ tube. In Figure A3, it can be seen that the hoop
mode could be measured using two accelerometers mounted approximately 90 degrees
from one another. To check the validity of this test method, a baseball bat was tested
using a similar procedure.
First Hoop
Second Hoop
First Bending
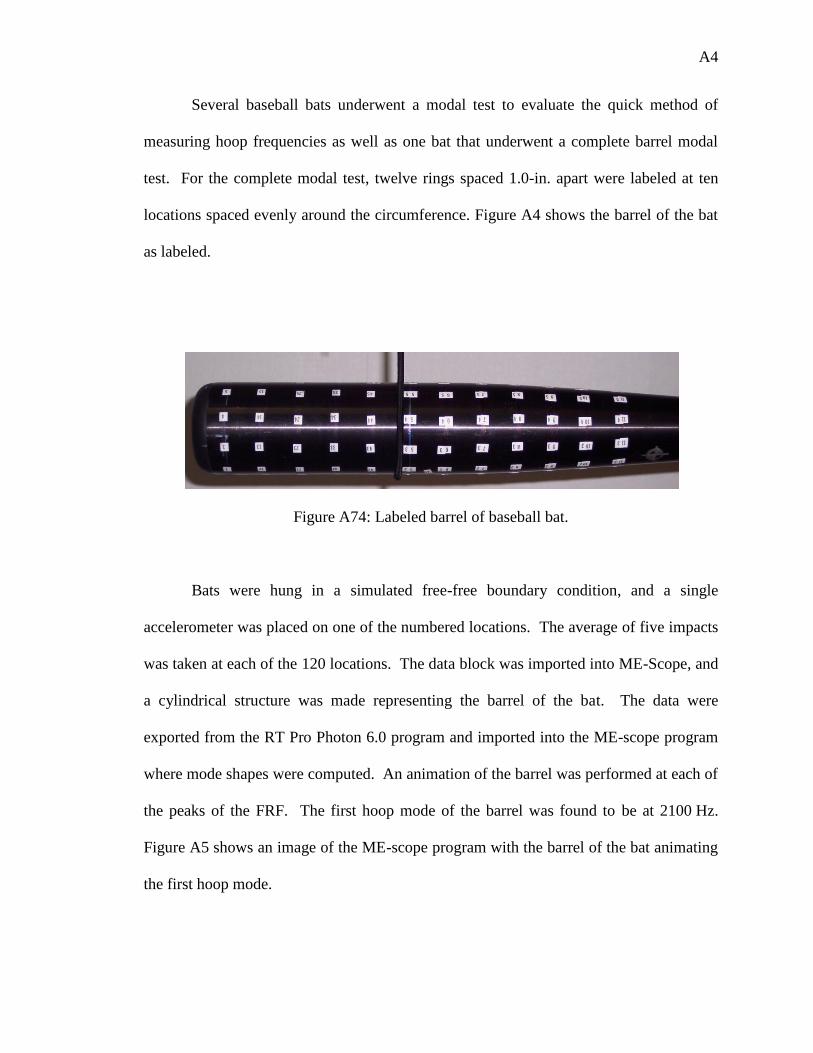
A4
Several baseball bats underwent a modal test to evaluate the quick method of
measuring hoop frequencies as well as one bat that underwent a complete barrel modal
test. For the complete modal test, twelve rings spaced 1.0-in. apart were labeled at ten
locations spaced evenly around the circumference. Figure A4 shows the barrel of the bat
as labeled.
Figure A74: Labeled barrel of baseball bat.
Bats were hung in a simulated free-free boundary condition, and a single
accelerometer was placed on one of the numbered locations. The average of five impacts
was taken at each of the 120 locations. The data block was imported into ME-Scope, and
a cylindrical structure was made representing the barrel of the bat. The data were
exported from the RT Pro Photon 6.0 program and imported into the ME-scope program
where mode shapes were computed. An animation of the barrel was performed at each of
the peaks of the FRF. The first hoop mode of the barrel was found to be at 2100 Hz.
Figure A5 shows an image of the ME-scope program with the barrel of the bat animating
the first hoop mode.
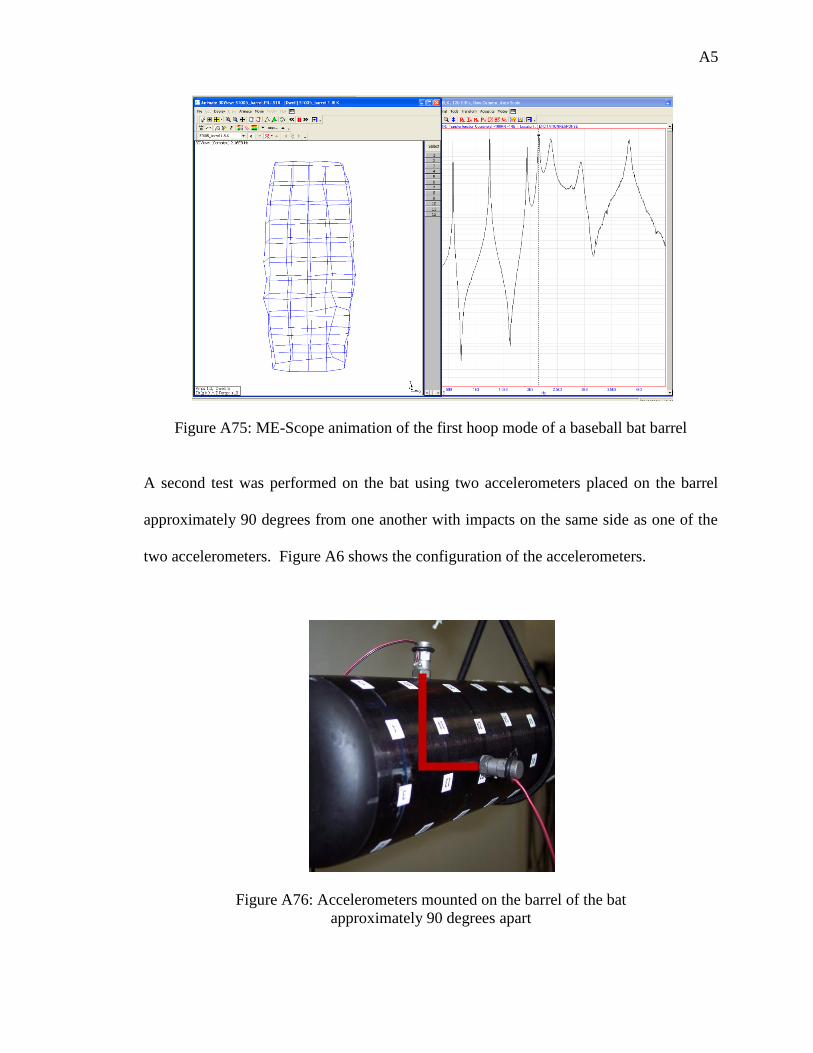
A5
Figure A75: ME-Scope animation of the first hoop mode of a baseball bat barrel
A second test was performed on the bat using two accelerometers placed on the barrel
approximately 90 degrees from one another with impacts on the same side as one of the
two accelerometers. Figure A6 shows the configuration of the accelerometers.
Figure A76: Accelerometers mounted on the barrel of the bat
approximately 90 degrees apart
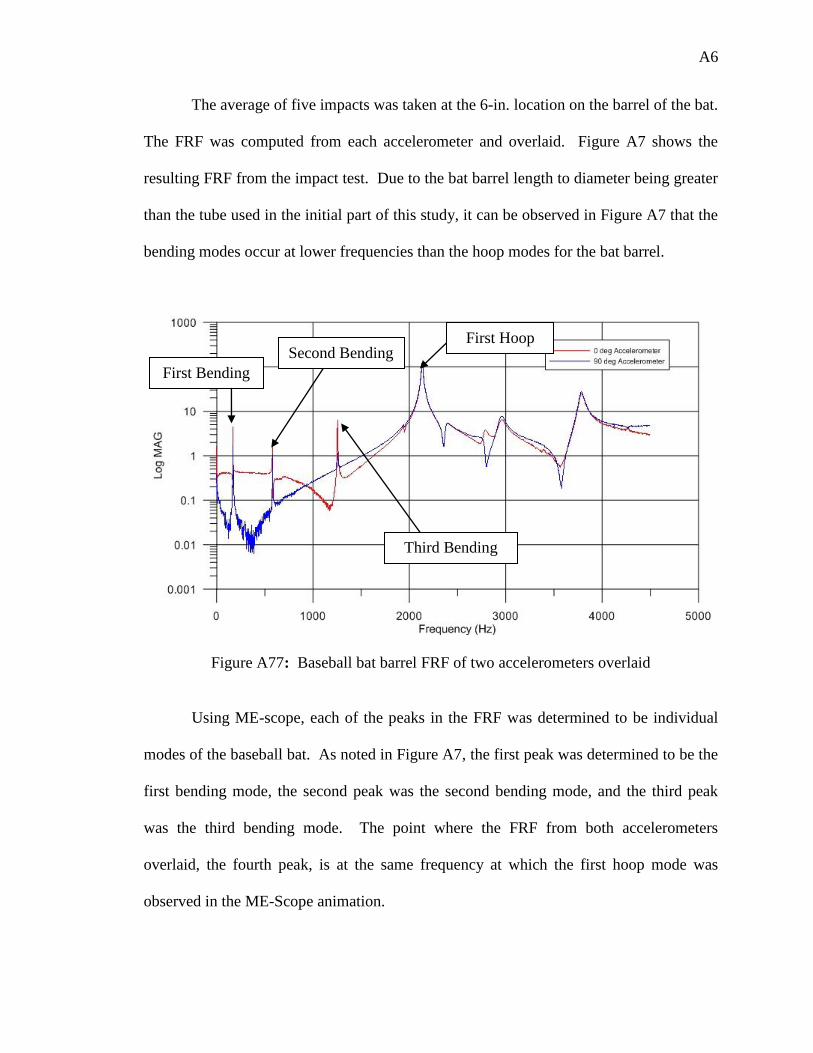
A6
The average of five impacts was taken at the 6-in. location on the barrel of the bat.
The FRF was computed from each accelerometer and overlaid. Figure A7 shows the
resulting FRF from the impact test. Due to the bat barrel length to diameter being greater
than the tube used in the initial part of this study, it can be observed in Figure A7 that the
bending modes occur at lower frequencies than the hoop modes for the bat barrel.
Figure A77: Baseball bat barrel FRF of two accelerometers overlaid
Using ME-scope, each of the peaks in the FRF was determined to be individual
modes of the baseball bat. As noted in Figure A7, the first peak was determined to be the
first bending mode, the second peak was the second bending mode, and the third peak
was the third bending mode. The point where the FRF from both accelerometers
overlaid, the fourth peak, is at the same frequency at which the first hoop mode was
observed in the ME-Scope animation.
First Bending
Second Bending First Hoop
Third Bending
A7
From these results and the aluminum cylinder, it was determined that using two
accelerometers to measure the hoop frequency is a valid test methodology to determine
the hoop modes.
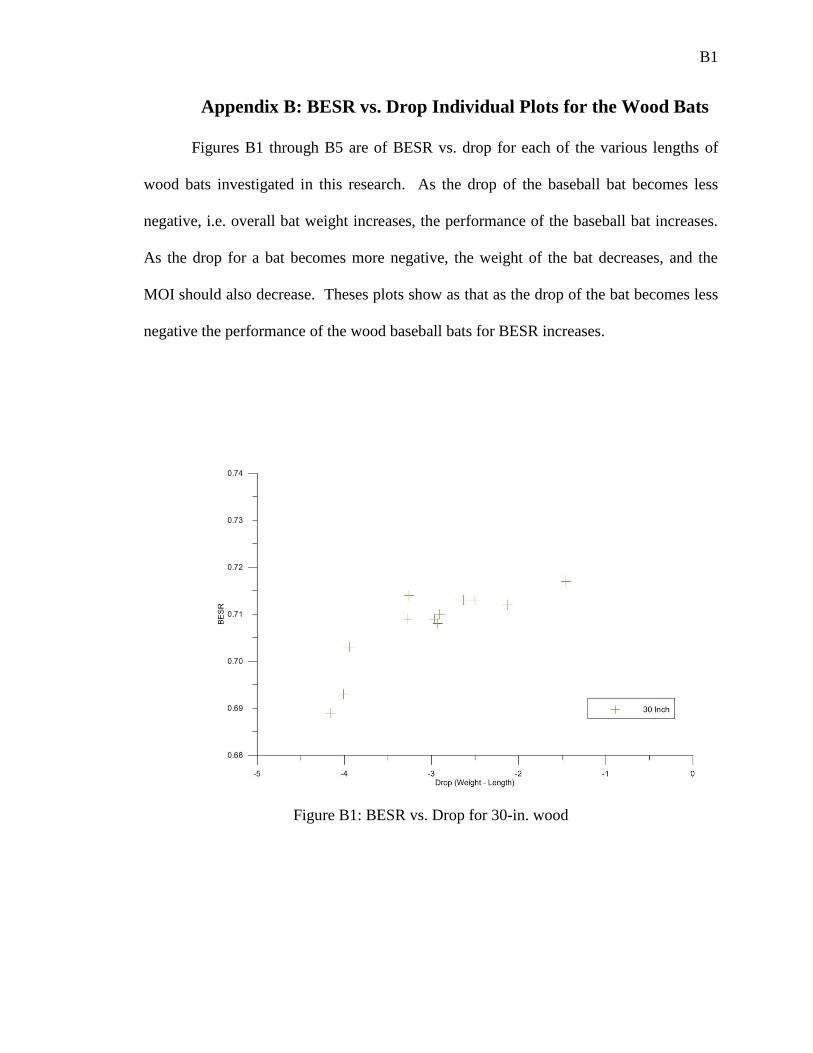
B1
Appendix B: BESR vs. Drop Individual Plots for the Wood Bats
Figures B1 through B5 are of BESR vs. drop for each of the various lengths of
wood bats investigated in this research. As the drop of the baseball bat becomes less
negative, i.e. overall bat weight increases, the performance of the baseball bat increases.
As the drop for a bat becomes more negative, the weight of the bat decreases, and the
MOI should also decrease. Theses plots show as that as the drop of the bat becomes less
negative the performance of the wood baseball bats for BESR increases.
Figure B1: BESR vs. Drop for 30-in. wood
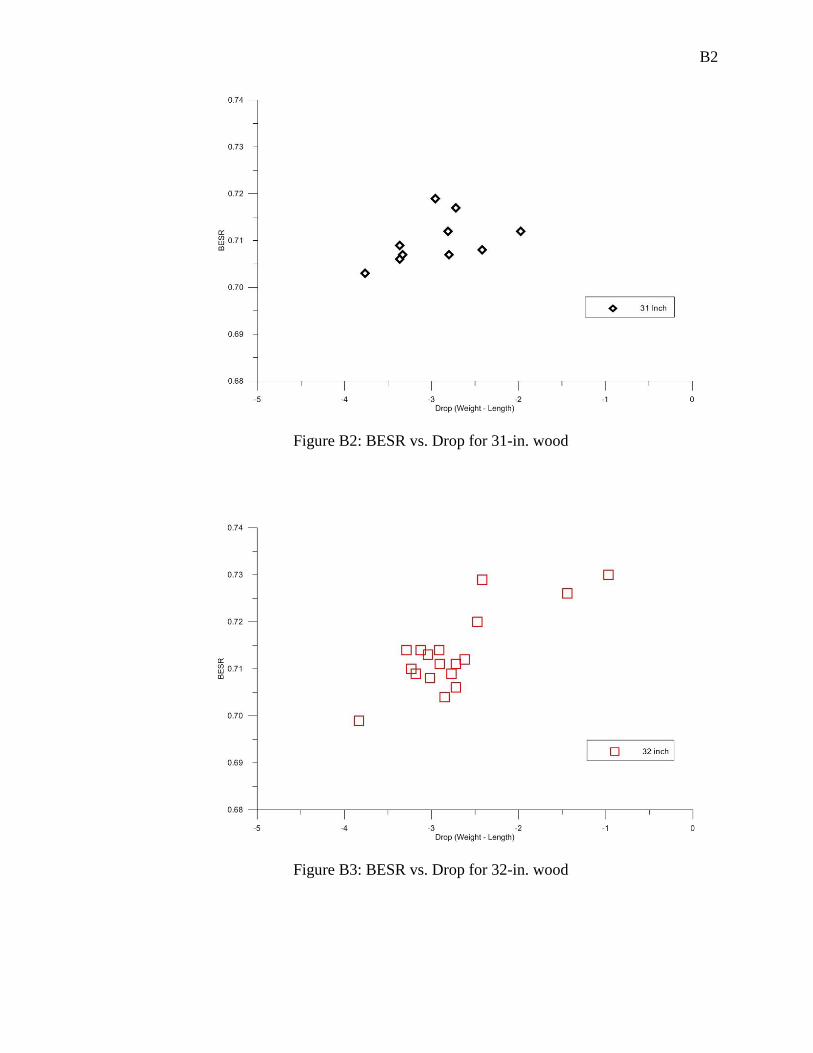
B2
Figure B2: BESR vs. Drop for 31-in. wood
Figure B3: BESR vs. Drop for 32-in. wood
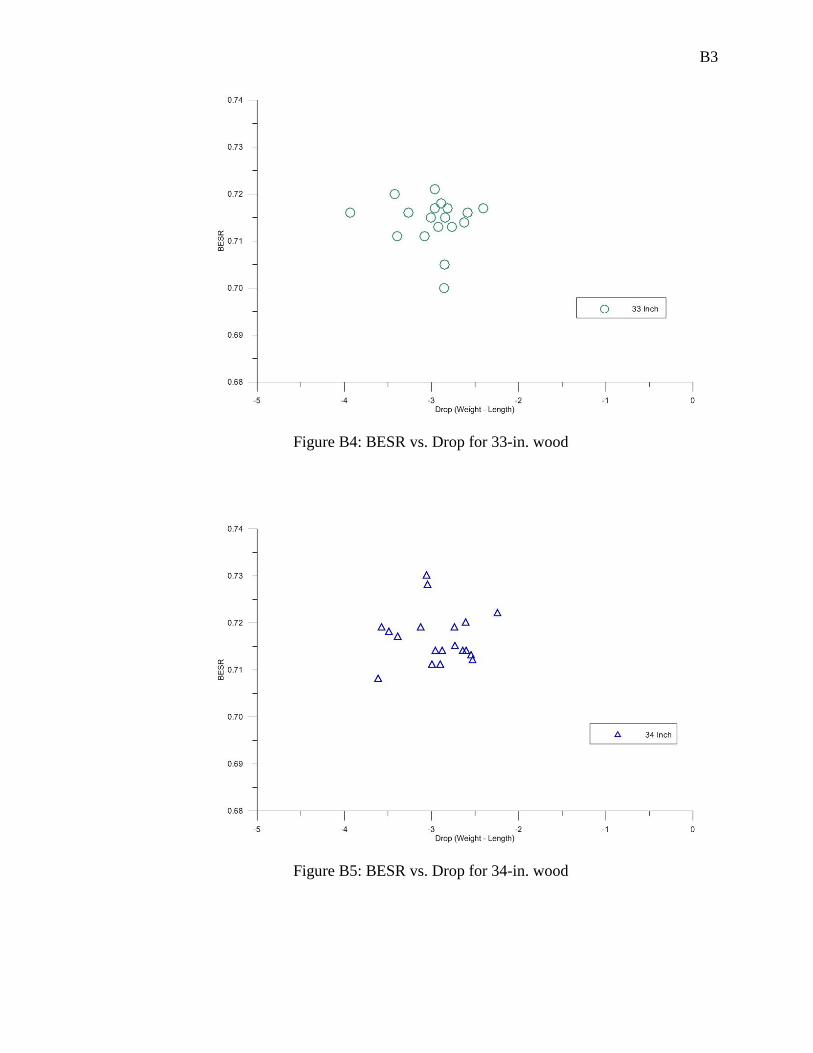
B3
Figure B4: BESR vs. Drop for 33-in. wood
Figure B5: BESR vs. Drop for 34-in. wood
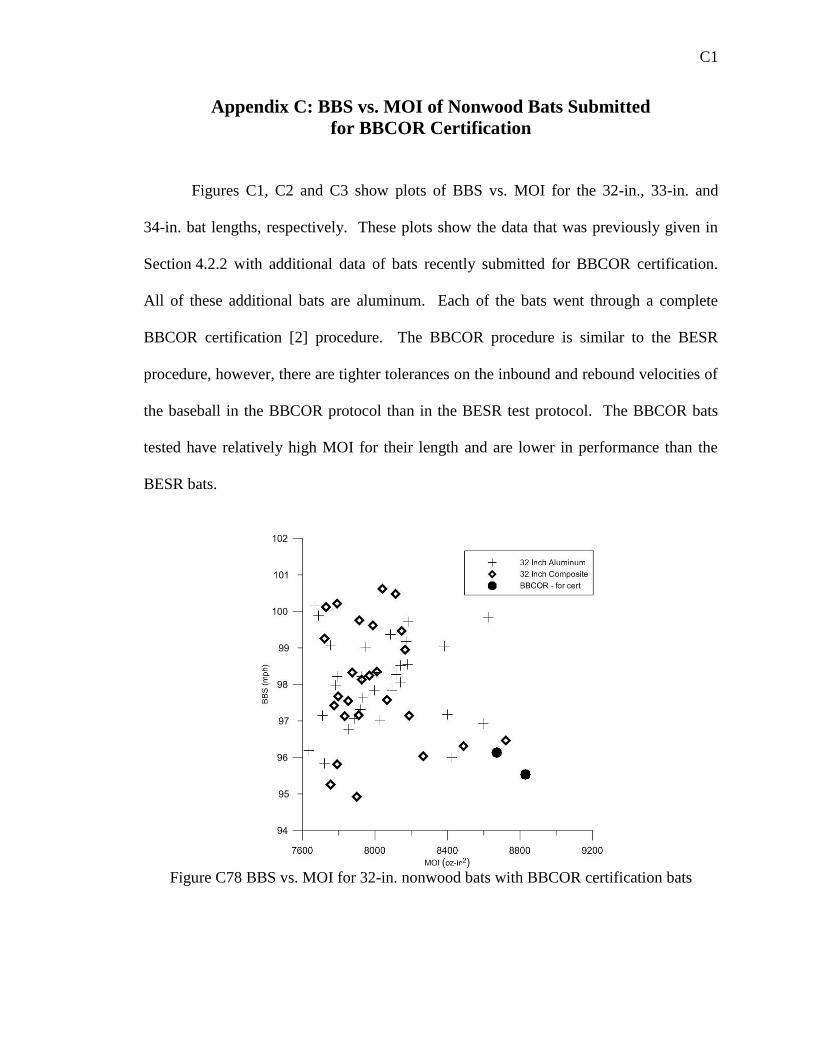
C1
Appendix C: BBS vs. MOI of Nonwood Bats Submitted
for BBCOR Certification
Figures C1, C2 and C3 show plots of BBS vs. MOI for the 32-in., 33-in. and
34-in. bat lengths, respectively. These plots show the data that was previously given in
Section 4.2.2 with additional data of bats recently submitted for BBCOR certification.
All of these additional bats are aluminum. Each of the bats went through a complete
BBCOR certification [2] procedure. The BBCOR procedure is similar to the BESR
procedure, however, there are tighter tolerances on the inbound and rebound velocities of
the baseball in the BBCOR protocol than in the BESR test protocol. The BBCOR bats
tested have relatively high MOI for their length and are lower in performance than the
BESR bats.
Figure C78 BBS vs. MOI for 32-in. nonwood bats with BBCOR certification bats
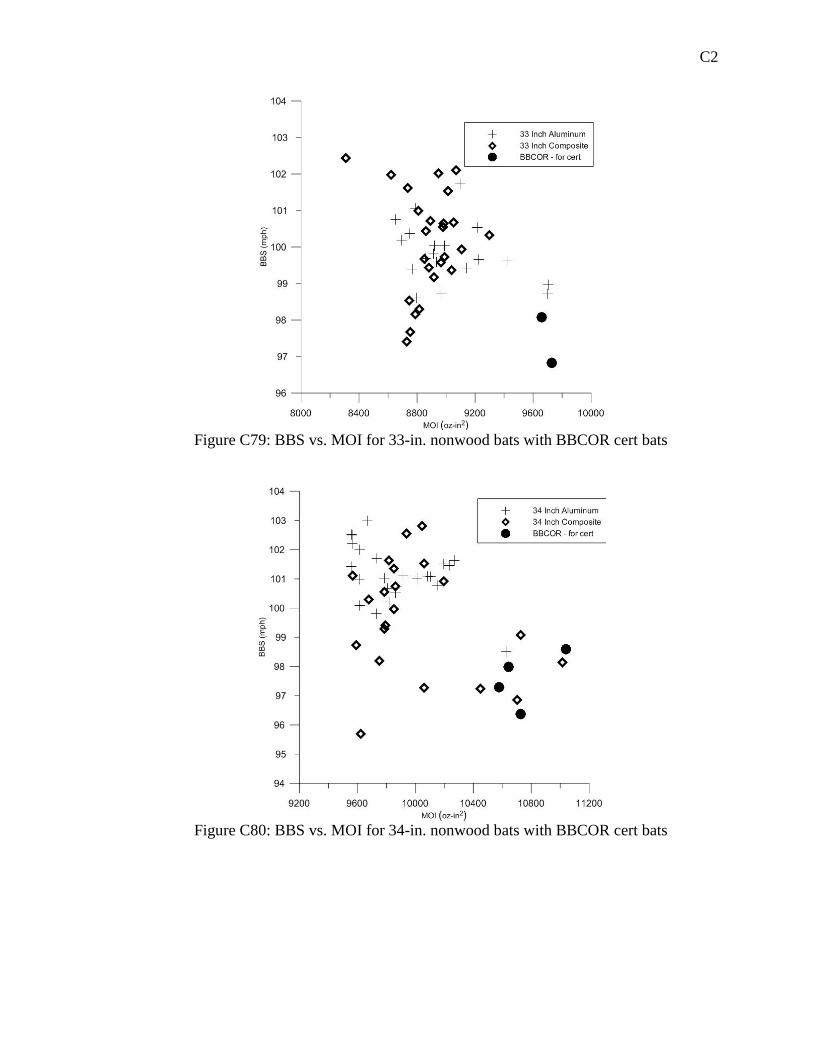
C2
Figure C79: BBS vs. MOI for 33-in. nonwood bats with BBCOR cert bats
Figure C80: BBS vs. MOI for 34-in. nonwood bats with BBCOR cert bats
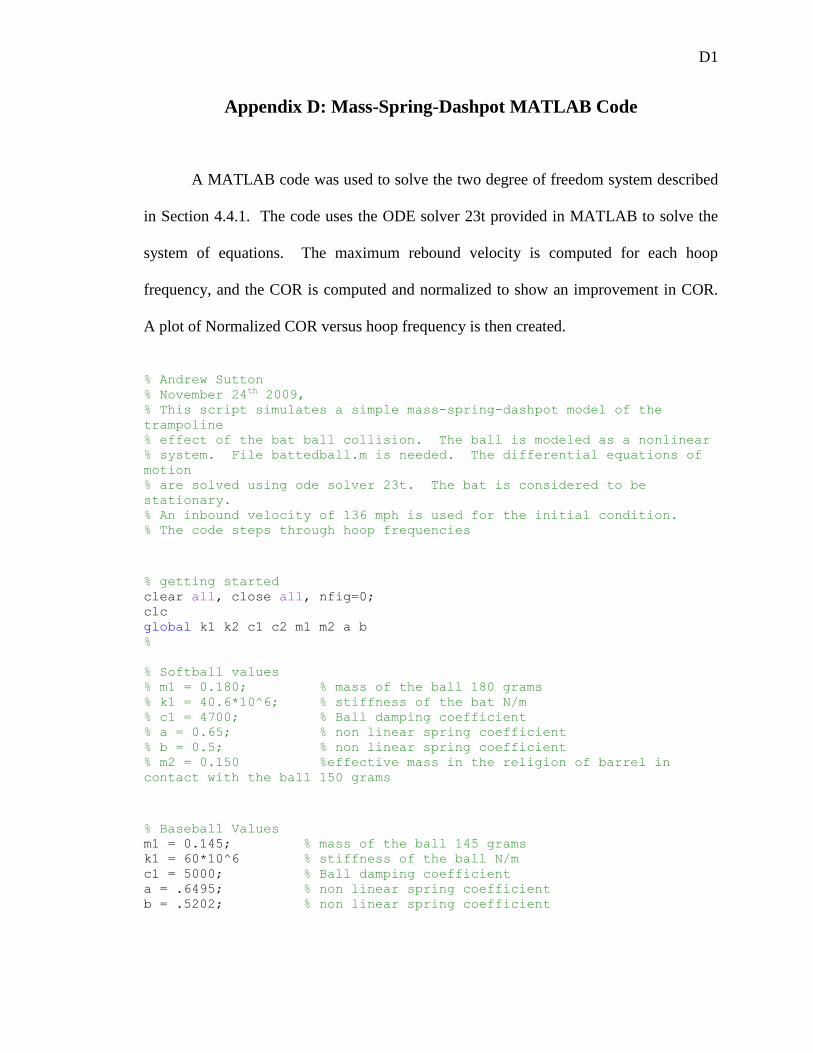
D1
Appendix D: Mass-Spring-Dashpot MATLAB Code
A MATLAB code was used to solve the two degree of freedom system described
in Section 4.4.1. The code uses the ODE solver 23t provided in MATLAB to solve the
system of equations. The maximum rebound velocity is computed for each hoop
frequency, and the COR is computed and normalized to show an improvement in COR.
A plot of Normalized COR versus hoop frequency is then created.
% Andrew Sutton
% November 24th 2009, % This script simulates a simple mass-spring-dashpot model of the
trampoline
% effect of the bat ball collision. The ball is modeled as a nonlinear
% system. File battedball.m is needed. The differential equations of
motion
% are solved using ode solver 23t. The bat is considered to be
stationary.
% An inbound velocity of 136 mph is used for the initial condition.
% The code steps through hoop frequencies
% getting started clear all, close all, nfig=0; clc global k1 k2 c1 c2 m1 m2 a b %
% Softball values
% m1 = 0.180; % mass of the ball 180 grams % k1 = 40.6*10^6; % stiffness of the bat N/m % c1 = 4700; % Ball damping coefficient % a = 0.65; % non linear spring coefficient % b = 0.5; % non linear spring coefficient
% m2 = 0.150 %effective mass in the religion of barrel in
contact with the ball 150 grams
% Baseball Values m1 = 0.145; % mass of the ball 145 grams k1 = 60*10^6 % stiffness of the ball N/m c1 = 5000; % Ball damping coefficient a = .6495; % non linear spring coefficient b = .5202; % non linear spring coefficient
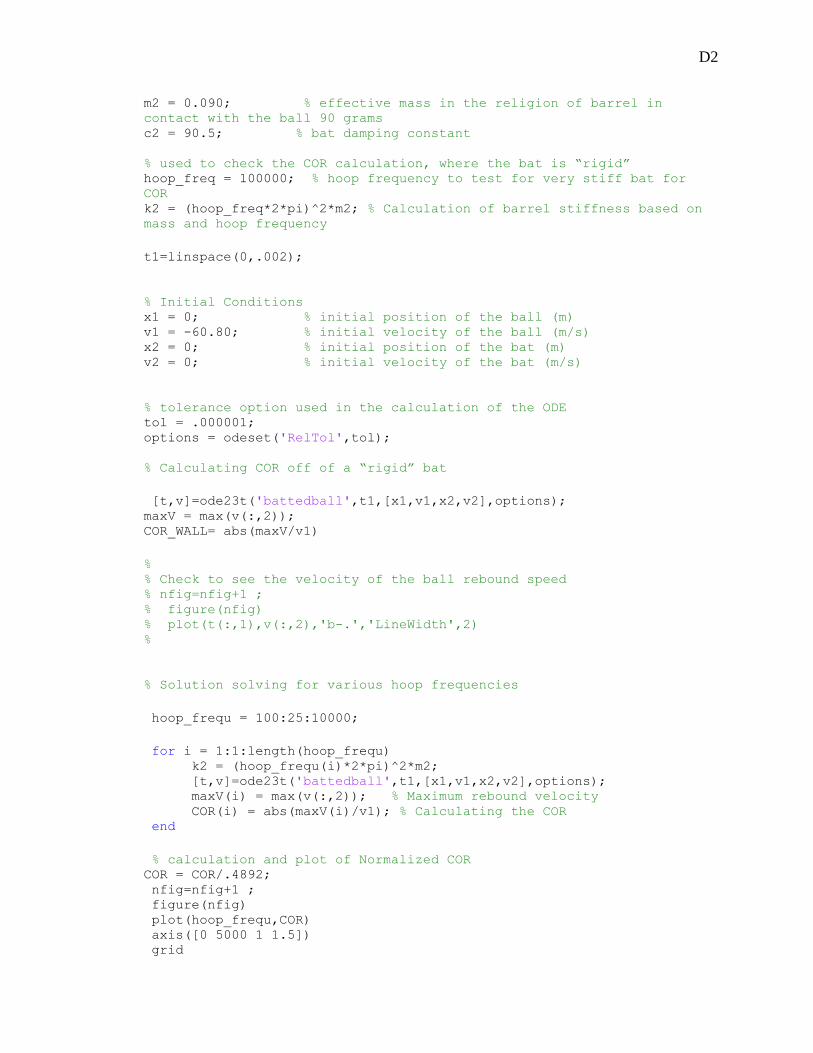
D2
m2 = 0.090; % effective mass in the religion of barrel in
contact with the ball 90 grams c2 = 90.5; % bat damping constant
% used to check the COR calculation, where the bat is “rigid” hoop_freq = 100000; % hoop frequency to test for very stiff bat for
COR k2 = (hoop_freq*2*pi)^2*m2; % Calculation of barrel stiffness based on
mass and hoop frequency
t1=linspace(0,.002);
% Initial Conditions
x1 = 0; % initial position of the ball (m) v1 = -60.80; % initial velocity of the ball (m/s) x2 = 0; % initial position of the bat (m) v2 = 0; % initial velocity of the bat (m/s)
% tolerance option used in the calculation of the ODE tol = .000001; options = odeset('RelTol',tol);
% Calculating COR off of a “rigid” bat
[t,v]=ode23t('battedball',t1,[x1,v1,x2,v2],options); maxV = max(v(:,2)); COR_WALL= abs(maxV/v1)
%
% Check to see the velocity of the ball rebound speed % nfig=nfig+1 ; % figure(nfig) % plot(t(:,1),v(:,2),'b-.','LineWidth',2) %
% Solution solving for various hoop frequencies
hoop_frequ = 100:25:10000;
for i = 1:1:length(hoop_frequ) k2 = (hoop_frequ(i)*2*pi)^2*m2; [t,v]=ode23t('battedball',t1,[x1,v1,x2,v2],options); maxV(i) = max(v(:,2)); % Maximum rebound velocity
COR(i) = abs(maxV(i)/v1); % Calculating the COR end
% calculation and plot of Normalized COR COR = COR/.4892; nfig=nfig+1 ; figure(nfig) plot(hoop_frequ,COR) axis([0 5000 1 1.5]) grid
D3
xlabel('Hoop Frequency(Hz)'); ylabel('Normalized OR');
% Andrew Sutton % October 17th, 2009 % This script is used to solve 2 non linear mass, spring, dashpot model
of the simulation of the bat ball collision. The ball is summated to
be non linear while the barrel of the bat is linear. The equations of
motion are in state space.
% k = spring stiffness % c = damping % m = mass % a and b are
function dz = battedball(t,z) dz = zeros(4,1); global k1 k2 c1 c2 m1 m2 a b
dz(1)= z(2); dz(2)=(-k1*(z(1)-z(3))*abs(z(1)-z(3))^a-c1*(z(2)-z(4))*abs(z(1)-
z(3))^b)/m1; dz(3)= z(4); dz(4)=(-k2*z(3)-c2*z(4)+k1*(z(1)-z(3))*abs(z(1)-z(3))^a+c1*(z(2)-
z(4))*abs(z(1)-z(3))^b)/m2;
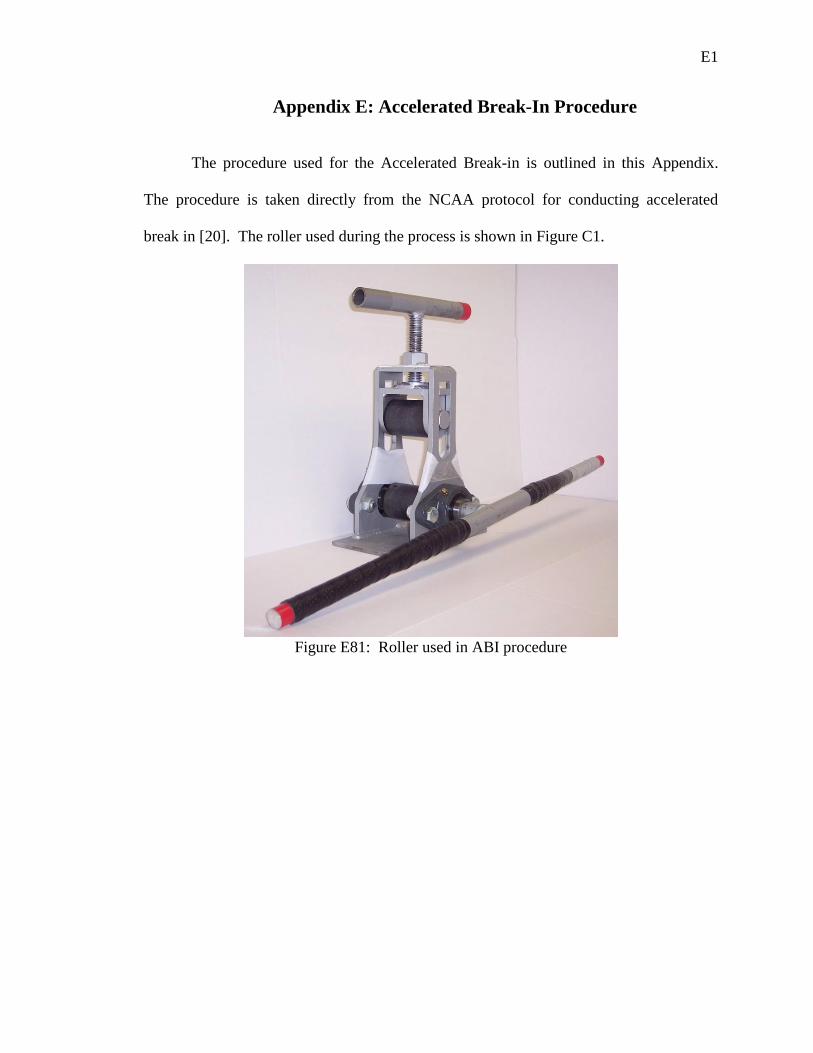
E1
Appendix E: Accelerated Break-In Procedure
The procedure used for the Accelerated Break-in is outlined in this Appendix.
The procedure is taken directly from the NCAA protocol for conducting accelerated
break in [20]. The roller used during the process is shown in Figure C1.
Figure E81: Roller used in ABI procedure
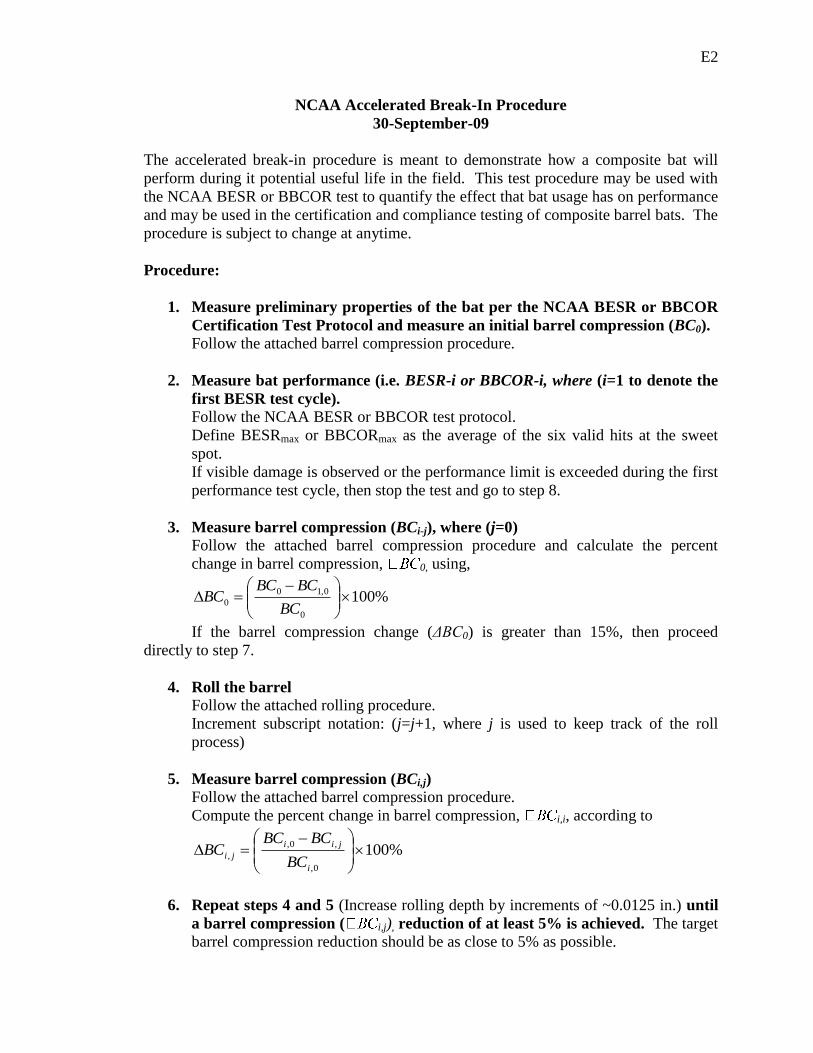
E2
NCAA Accelerated Break-In Procedure
30-September-09
The accelerated break-in procedure is meant to demonstrate how a composite bat will
perform during it potential useful life in the field. This test procedure may be used with
the NCAA BESR or BBCOR test to quantify the effect that bat usage has on performance
and may be used in the certification and compliance testing of composite barrel bats. The
procedure is subject to change at anytime.
Procedure:
1. Measure preliminary properties of the bat per the NCAA BESR or BBCOR
Certification Test Protocol and measure an initial barrel compression (BC0).
Follow the attached barrel compression procedure.
2. Measure bat performance (i.e. BESR-i or BBCOR-i, where (i=1 to denote the
first BESR test cycle).
Follow the NCAA BESR or BBCOR test protocol.
Define BESRmax or BBCORmax as the average of the six valid hits at the sweet
spot.
If visible damage is observed or the performance limit is exceeded during the first
performance test cycle, then stop the test and go to step 8.
3. Measure barrel compression (BCi-j), where (j=0)
Follow the attached barrel compression procedure and calculate the percent
change in barrel compression, 0, using,
%1000
0,10
0
BC
BCBCBC
If the barrel compression change (ΔBC0) is greater than 15%, then proceed
directly to step 7.
4. Roll the barrel
Follow the attached rolling procedure.
Increment subscript notation: (j=j+1, where j is used to keep track of the roll
process)
5. Measure barrel compression (BCi,j)
Follow the attached barrel compression procedure.
Compute the percent change in barrel compression, i,i, according to
%1000,
,0,
,
i
jii
jiBC
BCBCBC
6. Repeat steps 4 and 5 (Increase rolling depth by increments of ~0.0125 in.) until
a barrel compression ( i,j), reduction of at least 5% is achieved. The target
barrel compression reduction should be as close to 5% as possible.
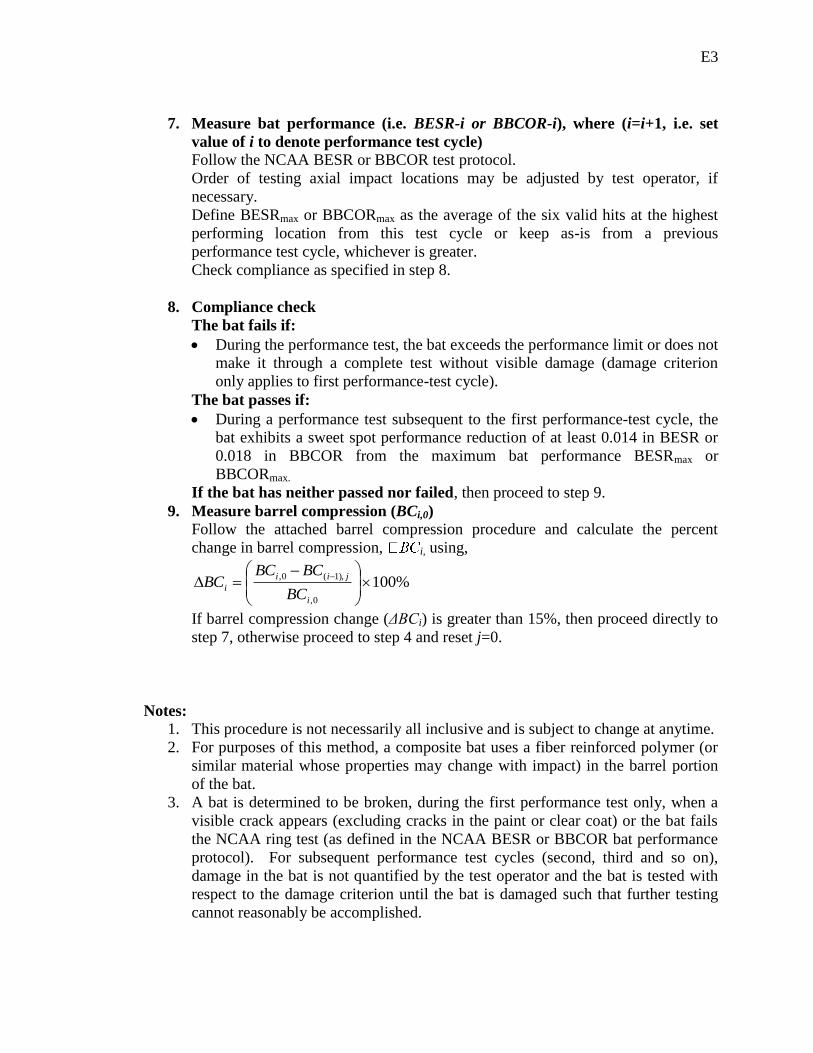
E3
7. Measure bat performance (i.e. BESR-i or BBCOR-i), where (i=i+1, i.e. set
value of i to denote performance test cycle)
Follow the NCAA BESR or BBCOR test protocol.
Order of testing axial impact locations may be adjusted by test operator, if
necessary.
Define BESRmax or BBCORmax as the average of the six valid hits at the highest
performing location from this test cycle or keep as-is from a previous
performance test cycle, whichever is greater.
Check compliance as specified in step 8.
8. Compliance check
The bat fails if:
During the performance test, the bat exceeds the performance limit or does not
make it through a complete test without visible damage (damage criterion
only applies to first performance-test cycle).
The bat passes if:
During a performance test subsequent to the first performance-test cycle, the
bat exhibits a sweet spot performance reduction of at least 0.014 in BESR or
0.018 in BBCOR from the maximum bat performance BESRmax or
BBCORmax.
If the bat has neither passed nor failed, then proceed to step 9.
9. Measure barrel compression (BCi,0)
Follow the attached barrel compression procedure and calculate the percent
change in barrel compression, i, using,
%1000,
),1(0,
i
jii
iBC
BCBCBC
If barrel compression change (ΔBCi) is greater than 15%, then proceed directly to
step 7, otherwise proceed to step 4 and reset j=0.
Notes:
1. This procedure is not necessarily all inclusive and is subject to change at anytime.
2. For purposes of this method, a composite bat uses a fiber reinforced polymer (or
similar material whose properties may change with impact) in the barrel portion
of the bat.
3. A bat is determined to be broken, during the first performance test only, when a
visible crack appears (excluding cracks in the paint or clear coat) or the bat fails
the NCAA ring test (as defined in the NCAA BESR or BBCOR bat performance
protocol). For subsequent performance test cycles (second, third and so on),
damage in the bat is not quantified by the test operator and the bat is tested with
respect to the damage criterion until the bat is damaged such that further testing
cannot reasonably be accomplished.
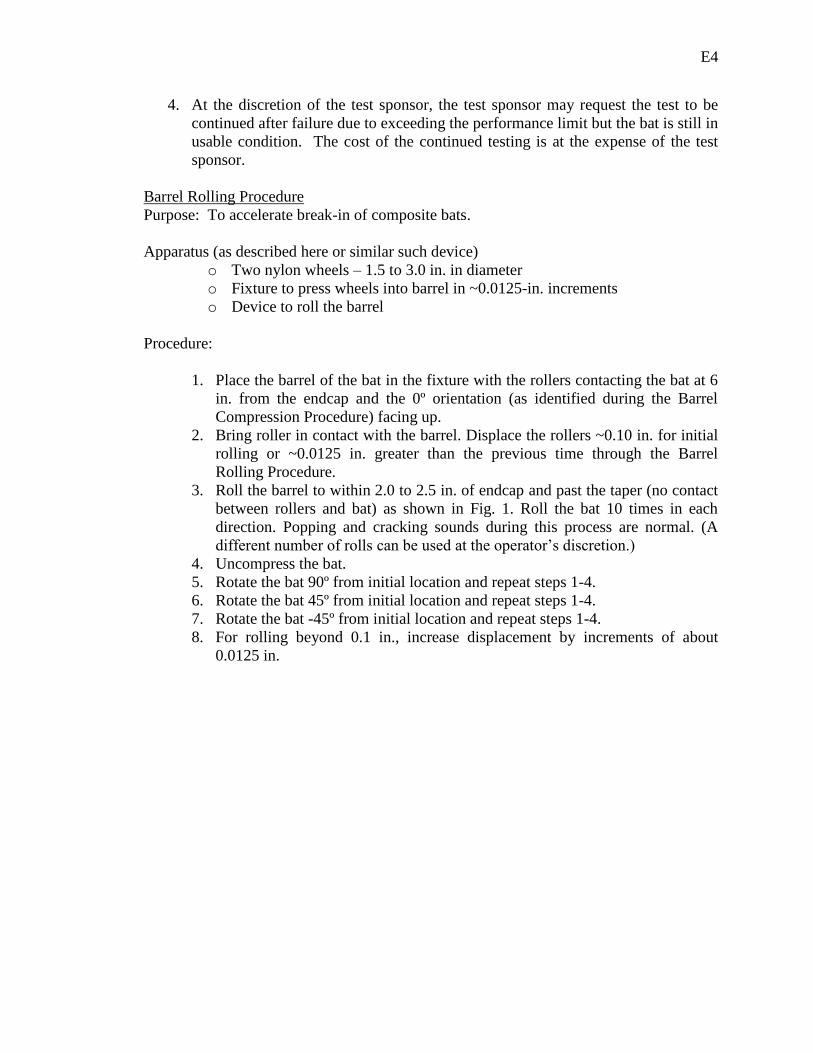
E4
4. At the discretion of the test sponsor, the test sponsor may request the test to be
continued after failure due to exceeding the performance limit but the bat is still in
usable condition. The cost of the continued testing is at the expense of the test
sponsor.
Barrel Rolling Procedure
Purpose: To accelerate break-in of composite bats.
Apparatus (as described here or similar such device)
o Two nylon wheels – 1.5 to 3.0 in. in diameter
o Fixture to press wheels into barrel in ~0.0125-in. increments
o Device to roll the barrel
Procedure:
1. Place the barrel of the bat in the fixture with the rollers contacting the bat at 6
in. from the endcap and the 0º orientation (as identified during the Barrel
Compression Procedure) facing up.
2. Bring roller in contact with the barrel. Displace the rollers ~0.10 in. for initial
rolling or ~0.0125 in. greater than the previous time through the Barrel
Rolling Procedure.
3. Roll the barrel to within 2.0 to 2.5 in. of endcap and past the taper (no contact
between rollers and bat) as shown in Fig. 1. Roll the bat 10 times in each
direction. Popping and cracking sounds during this process are normal. (A
different number of rolls can be used at the operator‘s discretion.)
4. Uncompress the bat.
5. Rotate the bat 90º from initial location and repeat steps 1-4.
6. Rotate the bat 45º from initial location and repeat steps 1-4.
7. Rotate the bat -45º from initial location and repeat steps 1-4.
8. For rolling beyond 0.1 in., increase displacement by increments of about
0.0125 in.
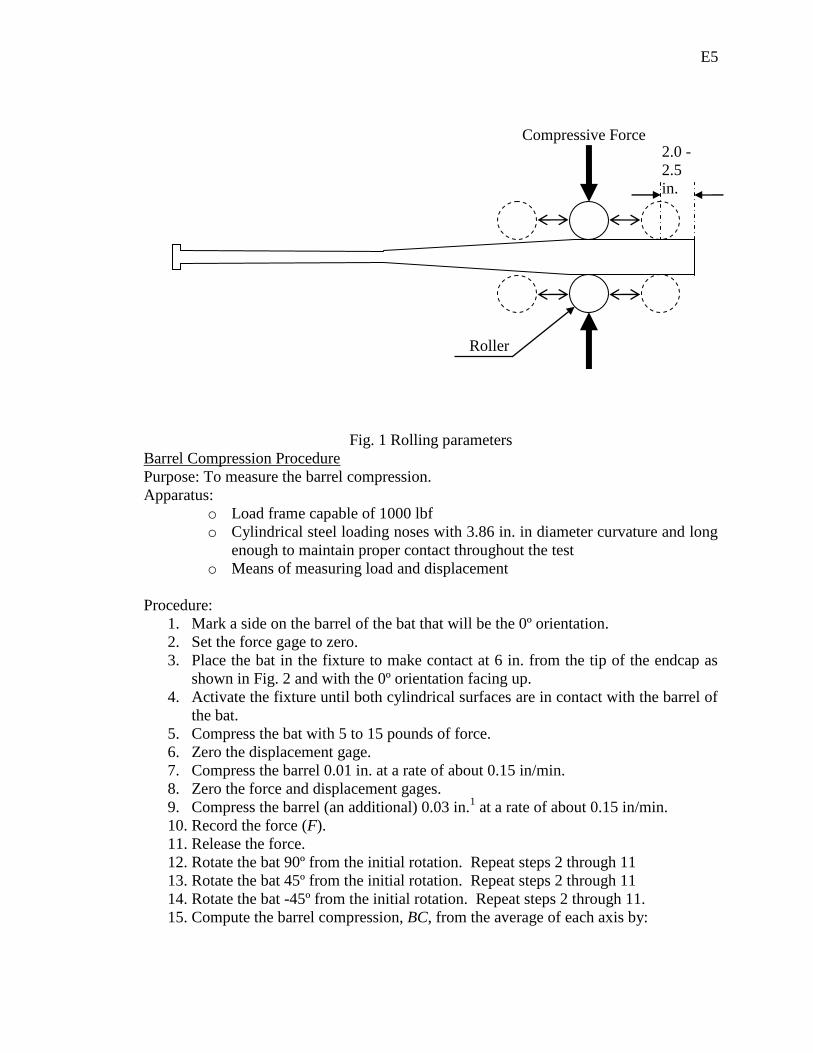
E5
Fig. 1 Rolling parameters
Barrel Compression Procedure
Purpose: To measure the barrel compression.
Apparatus:
o Load frame capable of 1000 lbf
o Cylindrical steel loading noses with 3.86 in. in diameter curvature and long
enough to maintain proper contact throughout the test
o Means of measuring load and displacement
Procedure:
1. Mark a side on the barrel of the bat that will be the 0º orientation.
2. Set the force gage to zero.
3. Place the bat in the fixture to make contact at 6 in. from the tip of the endcap as
shown in Fig. 2 and with the 0º orientation facing up.
4. Activate the fixture until both cylindrical surfaces are in contact with the barrel of
the bat.
5. Compress the bat with 5 to 15 pounds of force.
6. Zero the displacement gage.
7. Compress the barrel 0.01 in. at a rate of about 0.15 in/min.
8. Zero the force and displacement gages.
9. Compress the barrel (an additional) 0.03 in.1 at a rate of about 0.15 in/min.
10. Record the force (F).
11. Release the force.
12. Rotate the bat 90º from the initial rotation. Repeat steps 2 through 11
13. Rotate the bat 45º from the initial rotation. Repeat steps 2 through 11
14. Rotate the bat -45º from the initial rotation. Repeat steps 2 through 11.
15. Compute the barrel compression, BC, from the average of each axis by:
2.0 -
2.5
in.
Compressive Force
Roller
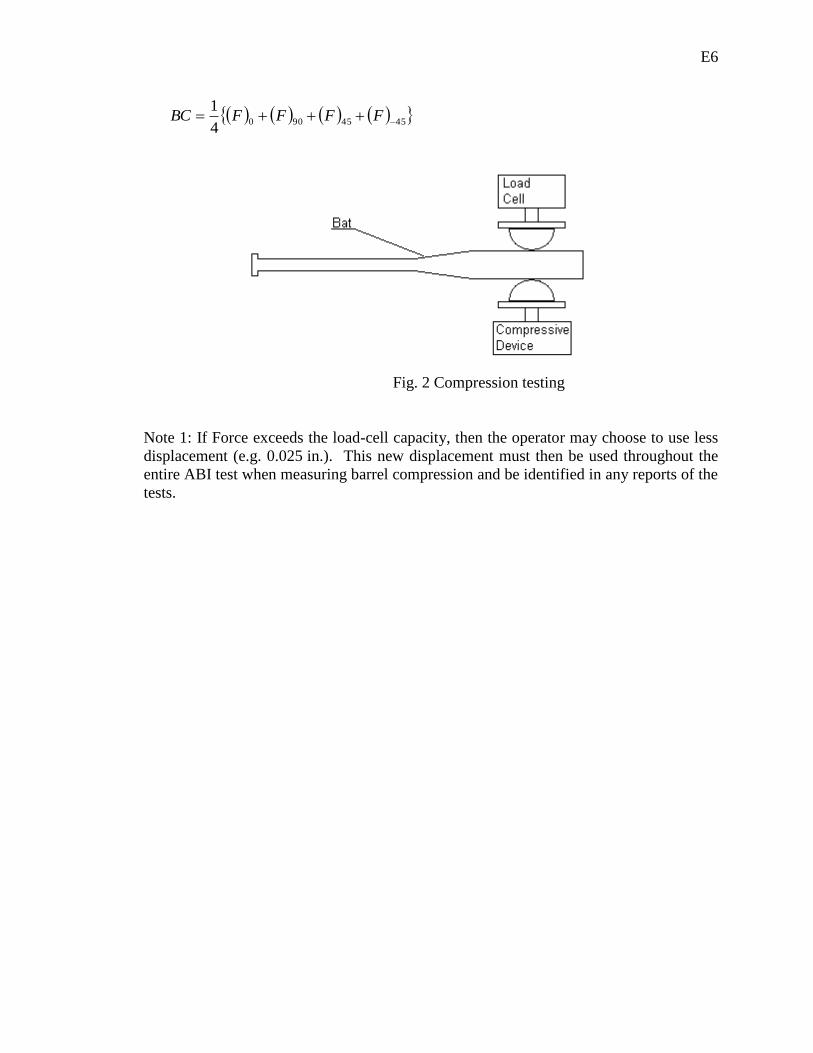
E6
45459004
1 FFFFBC
Fig. 2 Compression testing
Note 1: If Force exceeds the load-cell capacity, then the operator may choose to use less
displacement (e.g. 0.025 in.). This new displacement must then be used throughout the
entire ABI test when measuring barrel compression and be identified in any reports of the
tests.