Embed Size (px)
Citation preview
Using Stochastic Models to Describe and PredictSocial Dynamics of Web Users
Kristina Lerman Tad Hogg
July 13, 2011
Abstract
Popularity of content in social media is unequally dis-tributed, with some items receiving a disproportionateshare of attention from users. Predicting which newly-submitted items will become popular is critically impor-tant for both hosts of social media content and its con-sumers. Accurate and timely prediction would enablehosts to maximize revenue through differential pricing foraccess to content or ad placement. Prediction would alsogive consumers an important tool for filtering the content.Predicting popularity of content in social media is chal-lenging due to the complex interactions between contentquality and how the social media site highlight its content.Moreover, most social media sites selectively present con-tent that has been highly rated by similar users, whosesimilarity is indicated implicitly by their behavior or ex-plicitly by links in a social network. While these factorsmake it difficult to predict popularity a priori, stochasticmodels of user behavior on these sites can allow predict-ing popularity based on early user reactions to new con-tent. By incorporating the various mechanisms throughwhich web sites display content, such models improve onpredictions based on simply extrapolating from the earlyvotes. Specifically, for one such site, the news aggregatorDigg, we show how a stochastic model distinguishes theeffect of the increased visibility due to the network fromhow interested users are in the content. We find a widerange of interest, distinguishing stories primarily of inter-est to users in the network (“niche interests”) from thoseof more general interest to the user community. This dis-tinction is useful for predicting a story’s eventual popular-ity from users’ early reactions to the story.
1 Introduction
Success or popularity in social media is not evenly dis-tributed. Instead, a small number of users dominate theactivity on the site and receive most of the attention ofother users. The popularity of contributed items likewiseshows extreme diversity. For example, relatively few ofthe four billion images on the social photo-sharing siteFlickr are viewed thousands of times, while most of therest are rarely viewed. Of the tens of thousands of newstories submitted daily to the social news portal Digg,only a handful become wildly popular, gathering thou-sands of votes, while most of the remaining stories neverreceive more than a single vote from the submitter her-self. Among thousands of new blog posts every day,only a handful become widely read and commented upon.Given the volume of new content, it is critically importantto provide users with tools to help them sift through thevast stream of new content to identify interesting items ina timely manner, or least those items that will prove tobe successful or popular. Accurate and timely predictionwill also enable social media companies that host user-generated content to maximize revenue through differen-tial pricing for access to content or ad placement, and en-courage greater user loyalty by helping their users quicklyfind interesting new content.
Success in social media is difficult to predict. Althoughearly and late popularity, which can be measured in termsof user interest, e.g., votes or views, an item generatesfrom its inception, are somewhat correlated [18, 54], weknow little about what drives success. Does success de-rive mainly from an item’s inherent quality [2], users’ re-sponse to it [13], or some external factors, such as socialinfluence [34, 36, 35]? In a landmark study, Salganik et
1
al. [52] addressed this question experimentally by mea-suring the impact of content quality and social influenceon the eventual popularity or success of cultural artifacts.They showed that while quality contributes only weaklyto their eventual success, social influence, or knowingabout the choices of other people, is responsible for boththe inequality and unpredictability of success. In their ex-periment, Salganik et al. asked users to rate songs theylistened to. The users were assigned to different groups.In the control group (independent condition), users weresimply presented with lists of songs. In the other group(social influence condition), users were also shown howmany times each song was downloaded by other users.The social influence condition resulted in large inequal-ity in popularity, measured by the number of times thesongs were downloaded. While a song’s quality, as mea-sured by its popularity in the control group, was positivelyrelated to its eventual popularity in the social conditiongroup, the variance in popularity at a given quality wasvery high. Thus two songs of similar quality could end upwith vastly different levels of success. Moreover, whenusers were aware of the choices made by others, popu-larity was also unpredictable, meaning that on repeatingthe experiment, the same song could end up with a verydifferent level of popularity.
Although Salganik et al.’s study was limited to a smallset of songs created by unknown bands, its conclusionsabout inequality and unpredictability of popularity appearto apply to cultural artifacts in general and social mediaproduction in particular. While this would appear to pro-hibit prediction of popularity, we argue that understandinghow the collective behavior of Web users emerges fromthe decisions made by interconnected individuals allowspredicting eventual popularity of items from the users’early reaction to them. As in previous works [33, 25, 26],we use a stochastic modeling framework to mathemati-cally describe the social dynamics of Web users. With thisapproach we studied the social news aggregator Digg. Weproduced a model that helps explain — and predict [42]— the social voting patterns on Digg and related these ag-gregate behaviors to how Digg enables users to discovernew content.
This prior work included social influence, i.e., the in-creased visibility of stories to a user’s neighbors in thesocial network, but did not address the commonality ofusers’ interests indicated by links in the social network.
This phenomenon, known as homophily, is a key aspect ofsocial networks. In this paper we present a new extensionto the model that accounts for homophily by incorporatingsystematic variations of interests within and outside of thenetwork neighborhood. The new model also more closelymatches web site behavior than previous studies. First,the new model’s parameters account for the daily varia-tion in user activity [54], thereby focusing on how muchvotes received by individual stories deviate from the aver-age activity rate on the site. Second, the model allows forthe variation in number of votes a story receives before itis promoted, which the prior model ignored.
By separating the impact of story quality and social in-fluence on the popularity of stories on Digg, a stochas-tic model of social dynamics enables two novel applica-tions: (1) estimating inherent story quality from the evo-lution of its observed popularity, and (2) predicting itseventual popularity based on users’ early reactions to thestory. Specifically, to predict how popular a story will be-come, we use the early votes, even those cast before thestory is promoted, to estimate how interesting it is to theuser community. With this estimate, the model then deter-mines, on average, the story’s subsequent evolution. Westudy these claims empirically on a sample of stories fromDigg. We show adjusting for the differing interests amongvoters based upon the social network improves predic-tions of popularity from early reactions of users.
The paper is organized as follows. In Section 2 we de-scribe the social news aggregator Digg, which providesan empirical foundation and a data set for investigatingthe utility of stochastic models on the prediction task.Section 3 presents an overview of the stochastic model-ing framework. In Section 4 we apply the framework tostudy dynamics of social voting on Digg. We review aprior model of social dynamics of Digg and show that itexplains many of the empirically observed features of ag-gregate behavior of voters on that site. In Section 5 weextend this model to include variations in story interestto users based on their links in the social network, to ac-count for homophily. Then, in Section 6 we show how themodel can predict eventual popularity of newly submittedstories on Digg.
2
2 Social News Portal DiggWith over 3 million registered users, the social news ag-gregator Digg is one of the more popular news portals onthe Web. Digg allows users to submit and rate news sto-ries by voting on, or ‘digging’, them. There are many newsubmissions every minute, over 16,000 a day. Every dayDigg picks about a hundred stories that it believes will bemost interesting to the community and promotes them tothe front page. Although the exact promotion mechanismis kept secret and changes occasionally, it appears to takeinto account the number of votes the story receives andhow rapidly it receives them. Digg’s success is fueled inlarge part by the emergent front page, which is created bythe collective decision of its many users.
While the life cycle of each story may be drastically dif-ferent from others, its basic elements are the same. Theseare specified by Digg’s user interface, which defines howusers post or discover new stories and interact with otherusers. A model of social dynamics has to take these ele-ments into account when describing the evolution of storypopularity.
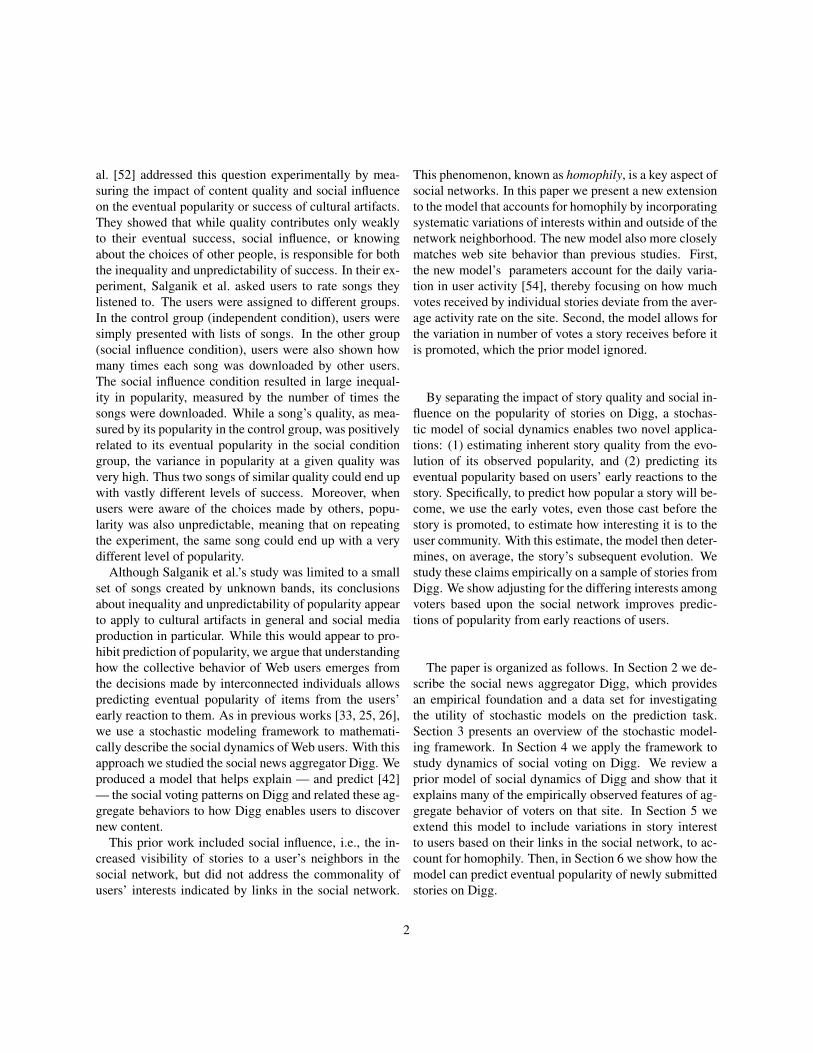
2.1 User interfaceA newly submitted story goes on the upcoming stories list,where it remains for a period of time, typically 24 hours,or until it is promoted to the front page, whichever comesfirst. The default view shows newly submitted stories asa chronologically ordered list, with the most recently sub-mitted story at the top of the list, 15 stories to a page. Tosee older stories, a user must navigate to page 2, 3, etc.of the upcoming stories list. Promoted stories (Digg callsthem ‘popular’) are also displayed as a chronologicallyordered list on the front pages, 15 stories to a page, withthe most recently promoted story at the top of the list. Tosee older promoted stories, user must navigate to page 2,3, etc. of the front page. Figure 1 shows a screenshot ofa Digg front page. Users vote for the stories they like by‘digging’ them. The yellow badge to the left of each storyshows its current popularity.
Digg allows users to designate friends and track theiractivities, i.e., see the stories friends recently submittedor voted for. The friends interface is available throughthe “Friends’ Activity” link at the top of any Digg webpage (see, for example, Fig. 1). The friend relationship
is asymmetric. When user A lists user B as a friend, Acan watch the activities of B but not vice versa. We callA the fan of B. A newly submitted story is visible inthe upcoming stories list, as well as to submitter’s fansthrough the friends interface. With each vote, a story be-comes visible to the voter’s fans through the friends inter-face, which shows the newly submitted stories that user’sfriends voted for.
Digg allows users to view the most popular stories fromthe previous day, week, month, or year. Digg also imple-ments a social filtering feature which recommends stories,including upcoming stories, that were liked by users witha similar voting history. This interface, however, was notavailable at the time the data for our study was collectedand hence is not part of the stochastic models described inthis paper. Thus we examine a period of time when Digghad a relatively simple user interface, which simplifies thestochastic models.
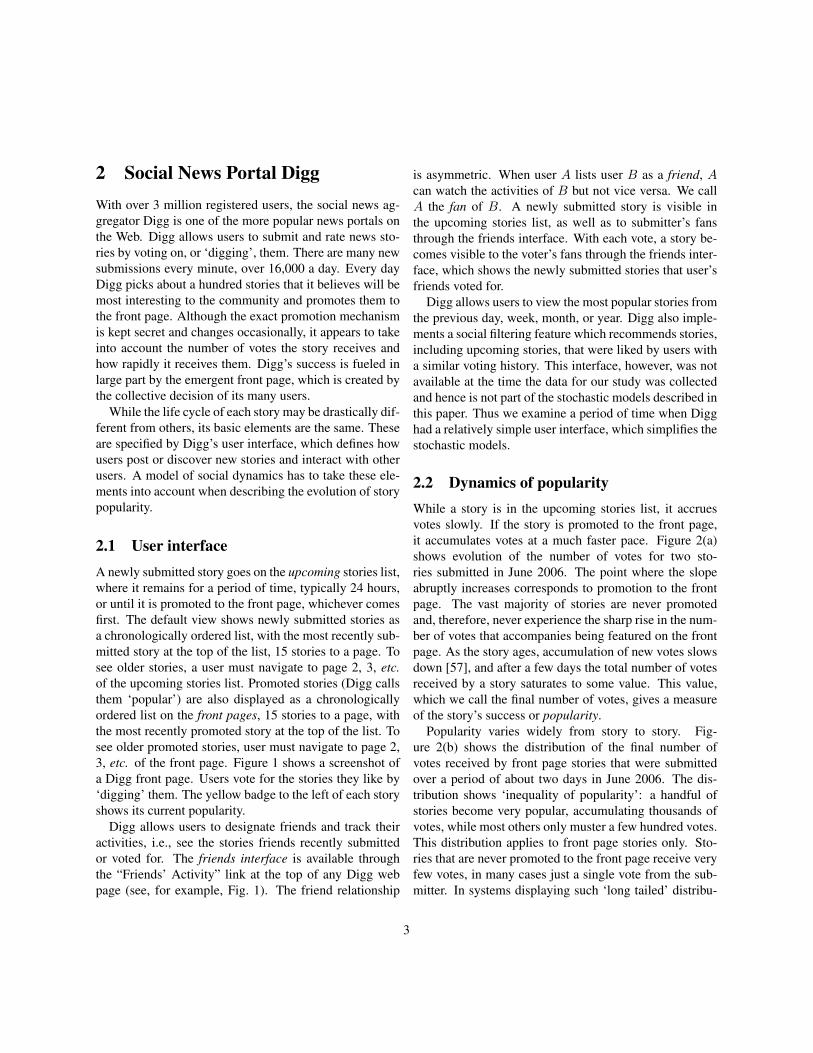
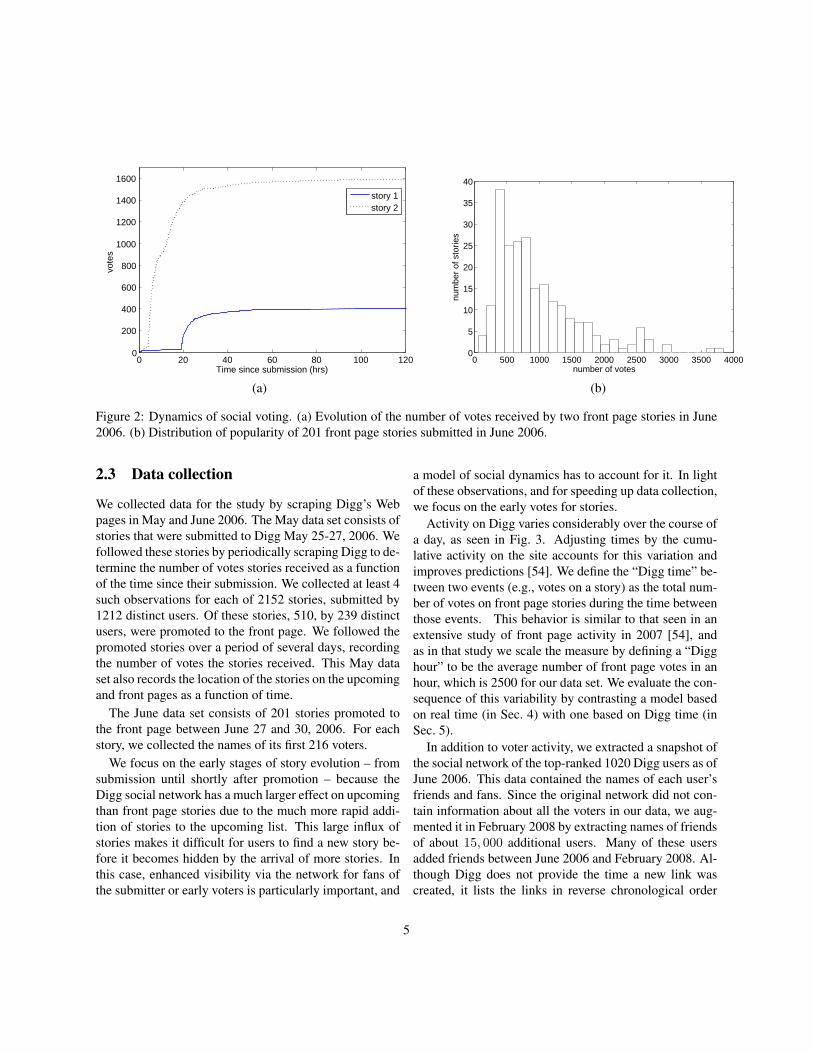
2.2 Dynamics of popularityWhile a story is in the upcoming stories list, it accruesvotes slowly. If the story is promoted to the front page,it accumulates votes at a much faster pace. Figure 2(a)shows evolution of the number of votes for two sto-ries submitted in June 2006. The point where the slopeabruptly increases corresponds to promotion to the frontpage. The vast majority of stories are never promotedand, therefore, never experience the sharp rise in the num-ber of votes that accompanies being featured on the frontpage. As the story ages, accumulation of new votes slowsdown [57], and after a few days the total number of votesreceived by a story saturates to some value. This value,which we call the final number of votes, gives a measureof the story’s success or popularity.
Popularity varies widely from story to story. Fig-ure 2(b) shows the distribution of the final number ofvotes received by front page stories that were submittedover a period of about two days in June 2006. The dis-tribution shows ‘inequality of popularity’: a handful ofstories become very popular, accumulating thousands ofvotes, while most others only muster a few hundred votes.This distribution applies to front page stories only. Sto-ries that are never promoted to the front page receive veryfew votes, in many cases just a single vote from the sub-mitter. In systems displaying such ‘long tailed’ distribu-
3
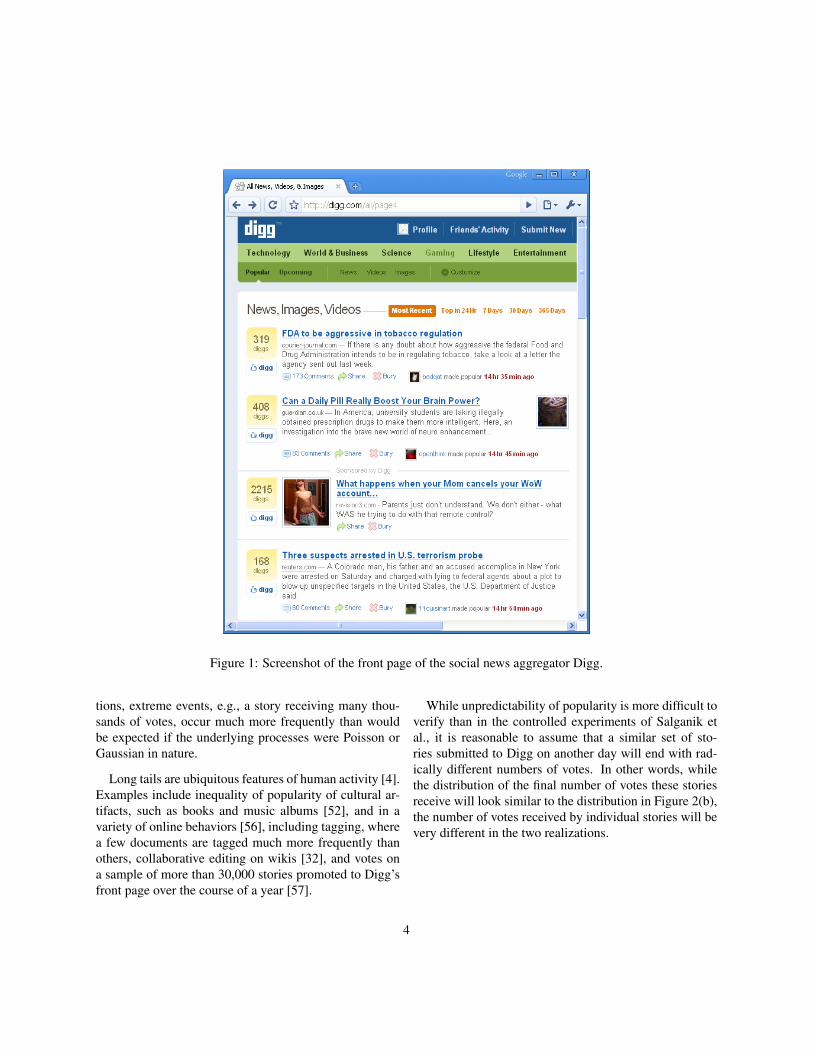
Figure 1: Screenshot of the front page of the social news aggregator Digg.
tions, extreme events, e.g., a story receiving many thou-sands of votes, occur much more frequently than wouldbe expected if the underlying processes were Poisson orGaussian in nature.
Long tails are ubiquitous features of human activity [4].Examples include inequality of popularity of cultural ar-tifacts, such as books and music albums [52], and in avariety of online behaviors [56], including tagging, wherea few documents are tagged much more frequently thanothers, collaborative editing on wikis [32], and votes ona sample of more than 30,000 stories promoted to Digg’sfront page over the course of a year [57].
While unpredictability of popularity is more difficult toverify than in the controlled experiments of Salganik etal., it is reasonable to assume that a similar set of sto-ries submitted to Digg on another day will end with rad-ically different numbers of votes. In other words, whilethe distribution of the final number of votes these storiesreceive will look similar to the distribution in Figure 2(b),the number of votes received by individual stories will bevery different in the two realizations.
4
0 20 40 60 80 100 1200
200
400
600
800
1000
1200
1400
1600
Time since submission (hrs)
vote
s
story 1story 2
0 500 1000 1500 2000 2500 3000 3500 40000
5
10
15
20
25
30
35
40
number of votes
num
ber
of s
torie
s
(a) (b)
Figure 2: Dynamics of social voting. (a) Evolution of the number of votes received by two front page stories in June2006. (b) Distribution of popularity of 201 front page stories submitted in June 2006.
2.3 Data collection
We collected data for the study by scraping Digg’s Webpages in May and June 2006. The May data set consists ofstories that were submitted to Digg May 25-27, 2006. Wefollowed these stories by periodically scraping Digg to de-termine the number of votes stories received as a functionof the time since their submission. We collected at least 4such observations for each of 2152 stories, submitted by1212 distinct users. Of these stories, 510, by 239 distinctusers, were promoted to the front page. We followed thepromoted stories over a period of several days, recordingthe number of votes the stories received. This May dataset also records the location of the stories on the upcomingand front pages as a function of time.
The June data set consists of 201 stories promoted tothe front page between June 27 and 30, 2006. For eachstory, we collected the names of its first 216 voters.
We focus on the early stages of story evolution – fromsubmission until shortly after promotion – because theDigg social network has a much larger effect on upcomingthan front page stories due to the much more rapid addi-tion of stories to the upcoming list. This large influx ofstories makes it difficult for users to find a new story be-fore it becomes hidden by the arrival of more stories. Inthis case, enhanced visibility via the network for fans ofthe submitter or early voters is particularly important, and
a model of social dynamics has to account for it. In lightof these observations, and for speeding up data collection,we focus on the early votes for stories.
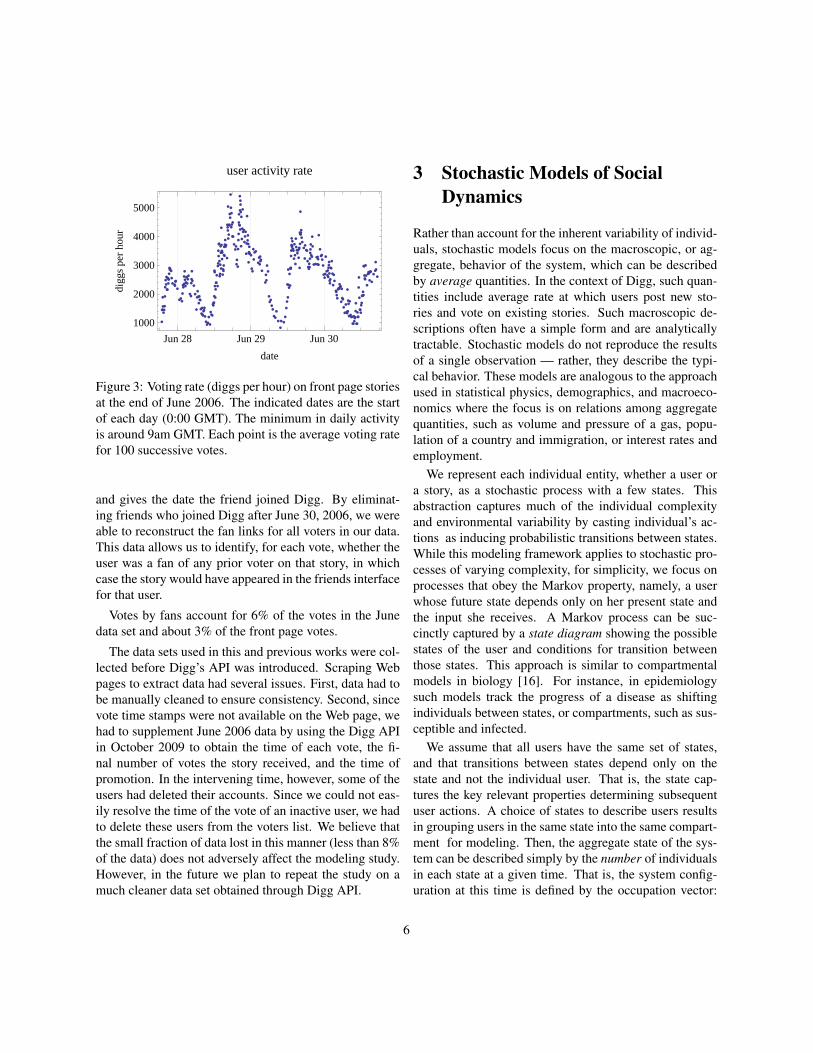
Activity on Digg varies considerably over the course ofa day, as seen in Fig. 3. Adjusting times by the cumu-lative activity on the site accounts for this variation andimproves predictions [54]. We define the “Digg time” be-tween two events (e.g., votes on a story) as the total num-ber of votes on front page stories during the time betweenthose events. This behavior is similar to that seen in anextensive study of front page activity in 2007 [54], andas in that study we scale the measure by defining a “Digghour” to be the average number of front page votes in anhour, which is 2500 for our data set. We evaluate the con-sequence of this variability by contrasting a model basedon real time (in Sec. 4) with one based on Digg time (inSec. 5).
In addition to voter activity, we extracted a snapshot ofthe social network of the top-ranked 1020 Digg users as ofJune 2006. This data contained the names of each user’sfriends and fans. Since the original network did not con-tain information about all the voters in our data, we aug-mented it in February 2008 by extracting names of friendsof about 15, 000 additional users. Many of these usersadded friends between June 2006 and February 2008. Al-though Digg does not provide the time a new link wascreated, it lists the links in reverse chronological order
5
Jun 28 Jun 29 Jun 30
1000
2000
3000
4000
5000
date
digg
spe
rho
ur
user activity rate
Figure 3: Voting rate (diggs per hour) on front page storiesat the end of June 2006. The indicated dates are the startof each day (0:00 GMT). The minimum in daily activityis around 9am GMT. Each point is the average voting ratefor 100 successive votes.
and gives the date the friend joined Digg. By eliminat-ing friends who joined Digg after June 30, 2006, we wereable to reconstruct the fan links for all voters in our data.This data allows us to identify, for each vote, whether theuser was a fan of any prior voter on that story, in whichcase the story would have appeared in the friends interfacefor that user.
Votes by fans account for 6% of the votes in the Junedata set and about 3% of the front page votes.
The data sets used in this and previous works were col-lected before Digg’s API was introduced. Scraping Webpages to extract data had several issues. First, data had tobe manually cleaned to ensure consistency. Second, sincevote time stamps were not available on the Web page, wehad to supplement June 2006 data by using the Digg APIin October 2009 to obtain the time of each vote, the fi-nal number of votes the story received, and the time ofpromotion. In the intervening time, however, some of theusers had deleted their accounts. Since we could not eas-ily resolve the time of the vote of an inactive user, we hadto delete these users from the voters list. We believe thatthe small fraction of data lost in this manner (less than 8%of the data) does not adversely affect the modeling study.However, in the future we plan to repeat the study on amuch cleaner data set obtained through Digg API.
3 Stochastic Models of SocialDynamics
Rather than account for the inherent variability of individ-uals, stochastic models focus on the macroscopic, or ag-gregate, behavior of the system, which can be describedby average quantities. In the context of Digg, such quan-tities include average rate at which users post new sto-ries and vote on existing stories. Such macroscopic de-scriptions often have a simple form and are analyticallytractable. Stochastic models do not reproduce the resultsof a single observation — rather, they describe the typi-cal behavior. These models are analogous to the approachused in statistical physics, demographics, and macroeco-nomics where the focus is on relations among aggregatequantities, such as volume and pressure of a gas, popu-lation of a country and immigration, or interest rates andemployment.
We represent each individual entity, whether a user ora story, as a stochastic process with a few states. Thisabstraction captures much of the individual complexityand environmental variability by casting individual’s ac-tions as inducing probabilistic transitions between states.While this modeling framework applies to stochastic pro-cesses of varying complexity, for simplicity, we focus onprocesses that obey the Markov property, namely, a userwhose future state depends only on her present state andthe input she receives. A Markov process can be suc-cinctly captured by a state diagram showing the possiblestates of the user and conditions for transition betweenthose states. This approach is similar to compartmentalmodels in biology [16]. For instance, in epidemiologysuch models track the progress of a disease as shiftingindividuals between states, or compartments, such as sus-ceptible and infected.
We assume that all users have the same set of states,and that transitions between states depend only on thestate and not the individual user. That is, the state cap-tures the key relevant properties determining subsequentuser actions. A choice of states to describe users resultsin grouping users in the same state into the same compart-ment for modeling. Then, the aggregate state of the sys-tem can be described simply by the number of individualsin each state at a given time. That is, the system config-uration at this time is defined by the occupation vector:
6
~n = (n1, n2, . . .) where nk is the number of individualsin state k.
We focus on modeling the behavior (i.e., votes re-ceived) of individual stories. Thus in our application ofthis approach, there is a different occupation vector foreach story. For example, the states of a user with re-spect to a given story on Digg could be “has not seen thestory,” “has seen the story but did not vote for it” and “hasvoted for the story.” The corresponding occupation vec-tor has three elements, counting the number of users ineach of these three compartments at a given time. As thestory gains votes, users transition to the “has voted for thestory” state, increasing the value of the corresponding ele-ment of the occupation vector. As described below, in ourapplication of this approach to social media, we includethe social network links of the users as part of the stateand hence the occupation vectors we use have more thanthree elements.
A key requirement for designing stochastic models is toensure the state captures enough of the large variation inindividual behavior to give a useful description of aggre-gate system properties. This is particularly challengingwhen individual activity follows a long-tail distribution,such as seen in some epidemics [45], as well as in socialmedia web sites [7, 56]. In our case, including user linkinformation as part of the state accounts for enough ofthis variation to provide reasonable accuracy, in particu-lar significantly improving predictions compared to directextrapolation of voting rates without accounting for theproperties of the web site user interface.
The next step in developing the stochastic model is tosummarize the variation within the collection of historiesof changing occupation vectors with a probabilistic de-scription. That is, we characterize the possible occupationvectors by the probability, P (~n, t), the system is in con-figuration ~n at time t. The evolution of P (~n, t), governedby the Stochastic Master Equation [29], is almost alwaystoo complex to be analytically tractable. Fortunately wecan simplify the problem by working with the average oc-cupation number, whose evolution is given by the RateEquation
d〈nk〉dt
=∑j
wjk(〈~n〉)〈nj〉 − 〈nk〉∑j
wkj(〈~n〉) (1)
where 〈nk〉 denotes the average number of users in state
k at time t, i.e.,∑~n nkP (~n, t) and wjk(〈~n〉) is the transi-
tion rate from configuration j to configuration k when theoccupation vector is 〈~n〉.
Using the average of the occupation vector in the transi-tion rates is a common simplifying technique for stochas-tic models. A sufficient condition for the accuracy ofthis approximation is that variations around the averageare relatively small. In many stochastic models of sys-tems with large numbers of components, variations areindeed small due to many independent interactions amongthe components and the short tails of the distributionsof these component behaviors. More elaborate versionsof the stochastic approach give improved approximationswhen variations are not small, particularly due to cor-related interactions [50] or large individual heterogene-ity [48]. User behavior on the web, however, often in-volves distributions with long tails, whose typical behav-iors differ significantly from the average [7, 56]. In thiscase we have no guarantee that the averaged approxima-tion is adequate, even when aggregating the behavior ofmany users [53]. Instead we must test its accuracy forparticular aggregate behaviors by comparing model pre-dictions with observations of actual behavior, as we reportbelow.
In the Rate Equation, occupation number nk increasesdue to users’ transitions from other states to state k, anddecreases due to transitions from the state k to otherstates. The equations can be easily written down from theuser state diagram. Each state corresponds to a dynamicvariable in the mathematical model — the average num-ber of users in that state — and it is coupled to other vari-ables via transitions between states. Every transition mustbe accounted for by a term in the equation, with transitionrates specified by the details of the interactions betweenusers.
In summary, the stochastic modeling framework isquite general and requires only specifying the aggregatestates of interest for describing the system and how in-dividual user behaviors create transitions among thesestates. The modeling approach is best suited to caseswhere the users’ decisions are mainly determined by a fewcharacteristics of the user and the information they haveabout the system. These system states and transitions givethe rate equations. Solutions to these equations then giveestimates of how aggregate behavior varies in time anddepends on the characteristics of the users involved.
7
upcoming1
front1
friends
voteØ
upcomingq…
frontp…
r
r
r
c
!
" s
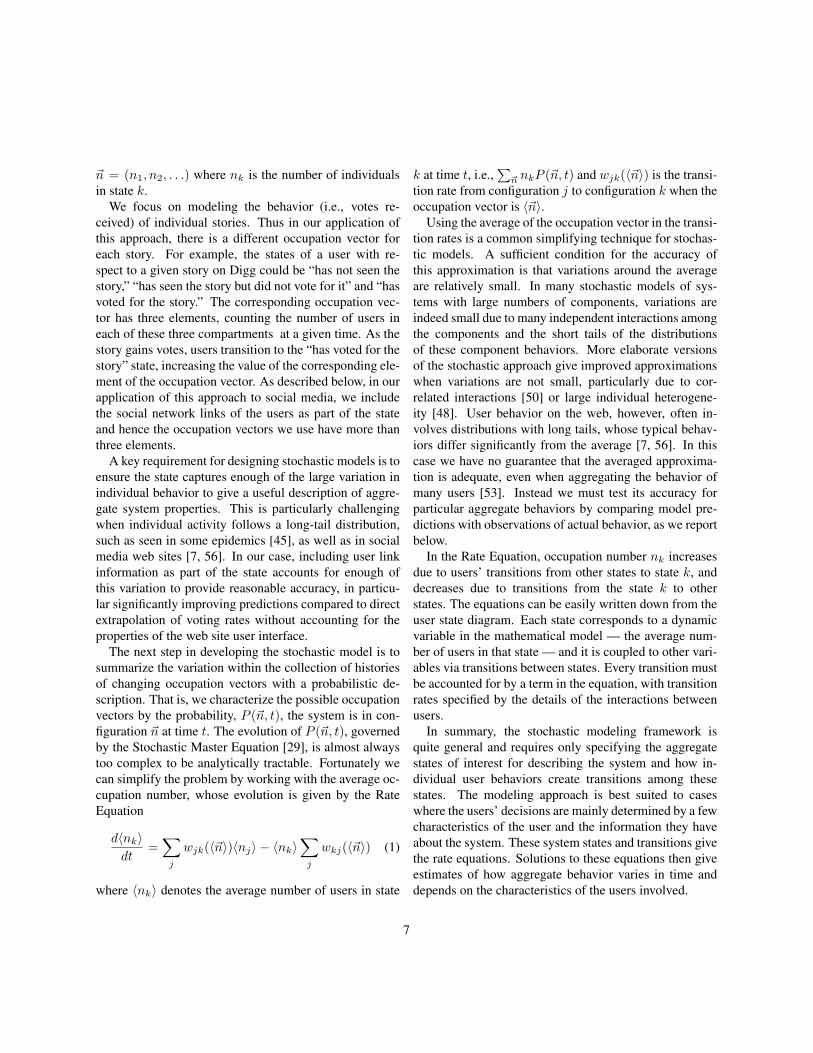
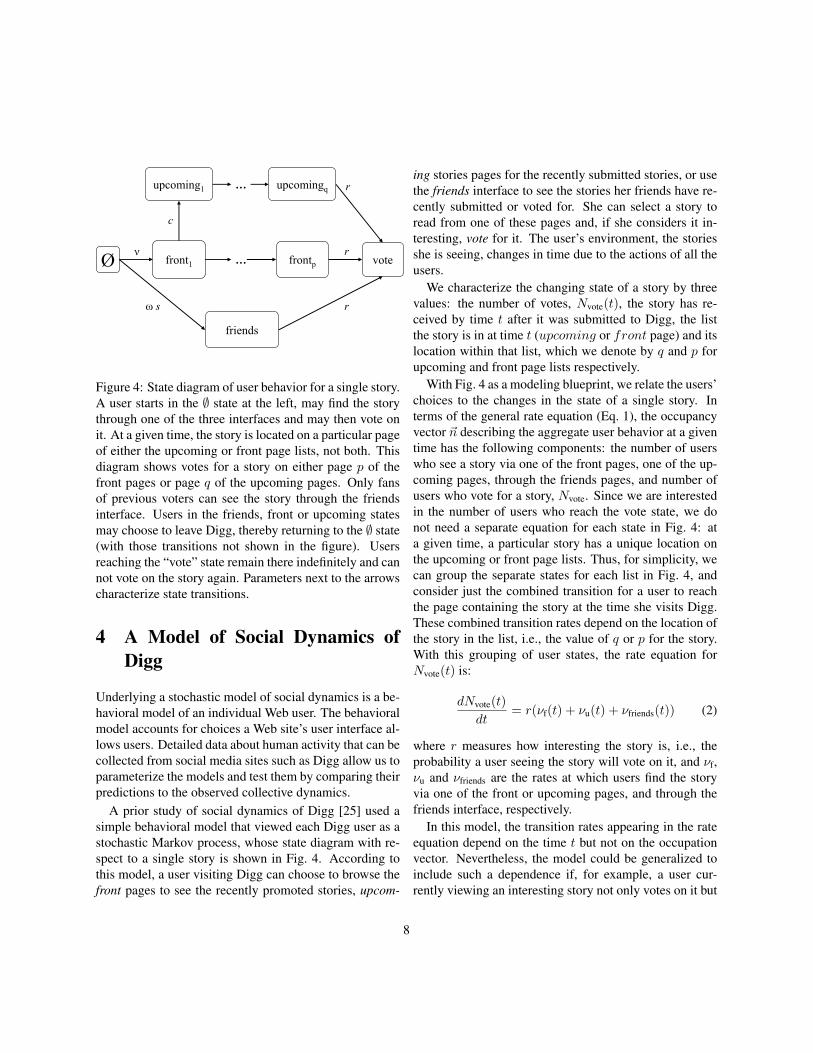
Figure 4: State diagram of user behavior for a single story.A user starts in the ∅ state at the left, may find the storythrough one of the three interfaces and may then vote onit. At a given time, the story is located on a particular pageof either the upcoming or front page lists, not both. Thisdiagram shows votes for a story on either page p of thefront pages or page q of the upcoming pages. Only fansof previous voters can see the story through the friendsinterface. Users in the friends, front or upcoming statesmay choose to leave Digg, thereby returning to the ∅ state(with those transitions not shown in the figure). Usersreaching the “vote” state remain there indefinitely and cannot vote on the story again. Parameters next to the arrowscharacterize state transitions.
4 A Model of Social Dynamics ofDigg
Underlying a stochastic model of social dynamics is a be-havioral model of an individual Web user. The behavioralmodel accounts for choices a Web site’s user interface al-lows users. Detailed data about human activity that can becollected from social media sites such as Digg allow us toparameterize the models and test them by comparing theirpredictions to the observed collective dynamics.
A prior study of social dynamics of Digg [25] used asimple behavioral model that viewed each Digg user as astochastic Markov process, whose state diagram with re-spect to a single story is shown in Fig. 4. According tothis model, a user visiting Digg can choose to browse thefront pages to see the recently promoted stories, upcom-
ing stories pages for the recently submitted stories, or usethe friends interface to see the stories her friends have re-cently submitted or voted for. She can select a story toread from one of these pages and, if she considers it in-teresting, vote for it. The user’s environment, the storiesshe is seeing, changes in time due to the actions of all theusers.
We characterize the changing state of a story by threevalues: the number of votes, Nvote(t), the story has re-ceived by time t after it was submitted to Digg, the listthe story is in at time t (upcoming or front page) and itslocation within that list, which we denote by q and p forupcoming and front page lists respectively.
With Fig. 4 as a modeling blueprint, we relate the users’choices to the changes in the state of a single story. Interms of the general rate equation (Eq. 1), the occupancyvector ~n describing the aggregate user behavior at a giventime has the following components: the number of userswho see a story via one of the front pages, one of the up-coming pages, through the friends pages, and number ofusers who vote for a story, Nvote. Since we are interestedin the number of users who reach the vote state, we donot need a separate equation for each state in Fig. 4: ata given time, a particular story has a unique location onthe upcoming or front page lists. Thus, for simplicity, wecan group the separate states for each list in Fig. 4, andconsider just the combined transition for a user to reachthe page containing the story at the time she visits Digg.These combined transition rates depend on the location ofthe story in the list, i.e., the value of q or p for the story.With this grouping of user states, the rate equation forNvote(t) is:
dNvote(t)dt
= r(νf(t) + νu(t) + νfriends(t)) (2)
where r measures how interesting the story is, i.e., theprobability a user seeing the story will vote on it, and νf,νu and νfriends are the rates at which users find the storyvia one of the front or upcoming pages, and through thefriends interface, respectively.
In this model, the transition rates appearing in the rateequation depend on the time t but not on the occupationvector. Nevertheless, the model could be generalized toinclude such a dependence if, for example, a user cur-rently viewing an interesting story not only votes on it but
8

explicitly encourages people they know to view the storyas well.
4.1 Story VisibilityBefore we can solve Eq. 2, we must model the rates atwhich users find the story through the various Digg inter-faces. These rates depend on the story’s location in thelist. The parameters of these models depend on user be-haviors that are not readily measurable. Instead, we esti-mate them using data collected from Digg, as describedbelow.
Visibility by position in list A story’s visibility on thefront page or upcoming stories lists decreases as recentlyadded stories push it further down the list. The stories areshown in groups: the first page of each list displays the 15most recent stories, page 2 the next 15 stories, and so on.
We lack data on how many Digg visitors proceed topage 2, 3 and so on in each list. However, when pre-sented with lists over multiple pages on a web site, suc-cessively smaller fractions of users visit later pages in thelist. One model of users following links through a web siteconsiders users estimating the value of continuing at thesite, and leaving when that value becomes negative [27].This model leads to an inverse Gaussian distribution ofthe number of pages m a user visits before leaving theweb site,
e−λ(m−µ)2
2mµ2
√λ
2πm3(3)
with mean µ and variance µ3/λ. This distributionmatches empirical observations in several web set-tings [27]. When the variance is small, for intermedi-ate values of m this distribution approximately follows apower law, with the fraction of users leaving after viewingm pages decreasing as m−3/2.
To model the visibility of a story on the mth front orupcoming page, the relevant distribution is the fraction ofusers who visit at leastm pages, i.e., the upper cumulativedistribution of Eq. 3. For m > 1, this fraction is
fpage(m) =12
(Fm(−µ)− e2λ/µFm(µ)
)(4)
where Fm(x) = erfc(αm(m−1+x)/µ), erfc is the com-plementary error function, and αm =
√λ/(2(m− 1)).
For m = 1, fpage(1) = 1.
The visibility of stories decreases in two distinct wayswhen a new story arrives. First, a story moves down thelist on its current page. Second, a story at the 15th po-sition moves to the top of the next page. For simplicity,we model these processes as decreasing visibility, i.e., thevalue of fpage(m), through m taking on fractional valueswithin a page, i.e., m = 1.5 denotes the position of astory half way down the list on the first page. This modelis likely to somewhat overestimate the loss of visibility forstories among the first few of the 15 items on a given pagesince the top several stories are visible without requiringthe user to scroll down the page.
List position of a story Fig. 5(a) shows how the pagenumber of a story on the two lists changes in time for threerandomly chosen stories from our data set. The behavioris close to linear when averaging over the daily activityvariation (shown in Fig. 3). For simplicity in this model,we ignore this variation and take a story’s page numberon the upcoming page q and the front page p at time t tobe [25]
p(t) = kf(t− Tpromotion) + 1 (5)q(t) = kut+ 1 (6)
where Tpromotion is the time the story is promoted to thefront page (or ∞ if the story is never promoted) and theslopes are given in Table 1. For a given story, p(t) is onlydefined for times t ≥ Tpromotion and q(t) for t < Tpromotion.Since each page holds 15 stories, these rates are 1/15th
the submission and promotion rates, respectively.
Front page and upcoming stories lists Digg promi-nently shows the stories on the front page. The upcomingstories list is less popular than the front page. We modelthis fact by assuming a fraction c < 1 of Digg visitorsproceed to the upcoming stories pages.
We use a simple threshold to model how a story is pro-moted to the front page. Initially the story is visible on theupcoming stories pages. If and when the number of votesa story receives exceeds a promotion threshold h, the storymoves to the front page. This threshold model approxi-mates Digg’s promotion algorithm as of May 2006, sincein our data set we did not see any front page stories withfewer than 44 votes, nor did we see any upcoming stories
9
02468
101214161820
0 1000 2000 3000 4000 5000time (minutes)
curre
nt p
age
num
ber
story1
story3story2
front page
upcoming
0 10 20 30 400
5
10
15
20
total votes
additionalfans
new fans per vote for the previous 5 votes
(a) (b)
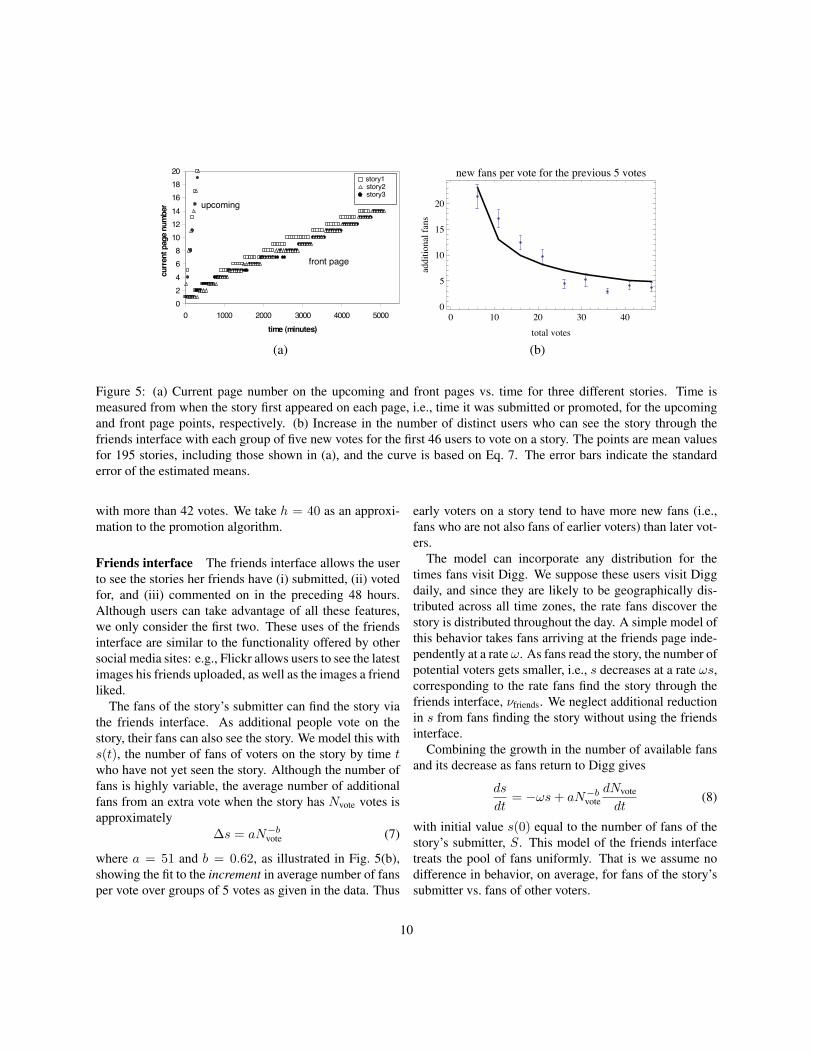
Figure 5: (a) Current page number on the upcoming and front pages vs. time for three different stories. Time ismeasured from when the story first appeared on each page, i.e., time it was submitted or promoted, for the upcomingand front page points, respectively. (b) Increase in the number of distinct users who can see the story through thefriends interface with each group of five new votes for the first 46 users to vote on a story. The points are mean valuesfor 195 stories, including those shown in (a), and the curve is based on Eq. 7. The error bars indicate the standarderror of the estimated means.
with more than 42 votes. We take h = 40 as an approxi-mation to the promotion algorithm.
Friends interface The friends interface allows the userto see the stories her friends have (i) submitted, (ii) votedfor, and (iii) commented on in the preceding 48 hours.Although users can take advantage of all these features,we only consider the first two. These uses of the friendsinterface are similar to the functionality offered by othersocial media sites: e.g., Flickr allows users to see the latestimages his friends uploaded, as well as the images a friendliked.
The fans of the story’s submitter can find the story viathe friends interface. As additional people vote on thestory, their fans can also see the story. We model this withs(t), the number of fans of voters on the story by time twho have not yet seen the story. Although the number offans is highly variable, the average number of additionalfans from an extra vote when the story has Nvote votes isapproximately
∆s = aN−bvote (7)
where a = 51 and b = 0.62, as illustrated in Fig. 5(b),showing the fit to the increment in average number of fansper vote over groups of 5 votes as given in the data. Thus
early voters on a story tend to have more new fans (i.e.,fans who are not also fans of earlier voters) than later vot-ers.
The model can incorporate any distribution for thetimes fans visit Digg. We suppose these users visit Diggdaily, and since they are likely to be geographically dis-tributed across all time zones, the rate fans discover thestory is distributed throughout the day. A simple model ofthis behavior takes fans arriving at the friends page inde-pendently at a rate ω. As fans read the story, the number ofpotential voters gets smaller, i.e., s decreases at a rate ωs,corresponding to the rate fans find the story through thefriends interface, νfriends. We neglect additional reductionin s from fans finding the story without using the friendsinterface.
Combining the growth in the number of available fansand its decrease as fans return to Digg gives
ds
dt= −ωs+ aN−bvote
dNvote
dt(8)
with initial value s(0) equal to the number of fans of thestory’s submitter, S. This model of the friends interfacetreats the pool of fans uniformly. That is we assume nodifference in behavior, on average, for fans of the story’ssubmitter vs. fans of other voters.
10
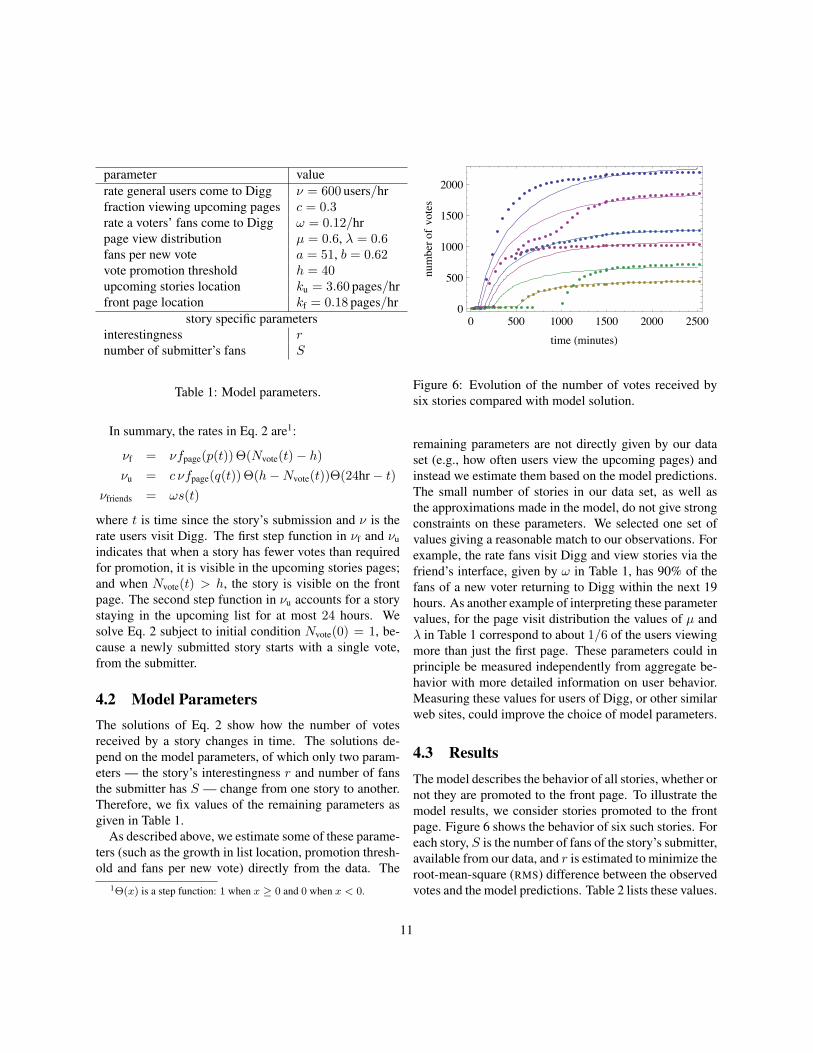
parameter valuerate general users come to Digg ν = 600 users/hrfraction viewing upcoming pages c = 0.3rate a voters’ fans come to Digg ω = 0.12/hrpage view distribution µ = 0.6, λ = 0.6fans per new vote a = 51, b = 0.62vote promotion threshold h = 40upcoming stories location ku = 3.60 pages/hrfront page location kf = 0.18 pages/hr
story specific parametersinterestingness rnumber of submitter’s fans S
Table 1: Model parameters.
In summary, the rates in Eq. 2 are1:
νf = νfpage(p(t)) Θ(Nvote(t)− h)νu = c νfpage(q(t)) Θ(h−Nvote(t))Θ(24hr− t)
νfriends = ωs(t)
where t is time since the story’s submission and ν is therate users visit Digg. The first step function in νf and νuindicates that when a story has fewer votes than requiredfor promotion, it is visible in the upcoming stories pages;and when Nvote(t) > h, the story is visible on the frontpage. The second step function in νu accounts for a storystaying in the upcoming list for at most 24 hours. Wesolve Eq. 2 subject to initial condition Nvote(0) = 1, be-cause a newly submitted story starts with a single vote,from the submitter.
4.2 Model ParametersThe solutions of Eq. 2 show how the number of votesreceived by a story changes in time. The solutions de-pend on the model parameters, of which only two param-eters — the story’s interestingness r and number of fansthe submitter has S — change from one story to another.Therefore, we fix values of the remaining parameters asgiven in Table 1.
As described above, we estimate some of these parame-ters (such as the growth in list location, promotion thresh-old and fans per new vote) directly from the data. The
1Θ(x) is a step function: 1 when x ≥ 0 and 0 when x < 0.
0 500 1000 1500 2000 25000
500
1000
1500
2000
time !minutes"
numberofvotes
Figure 6: Evolution of the number of votes received bysix stories compared with model solution.
remaining parameters are not directly given by our dataset (e.g., how often users view the upcoming pages) andinstead we estimate them based on the model predictions.The small number of stories in our data set, as well asthe approximations made in the model, do not give strongconstraints on these parameters. We selected one set ofvalues giving a reasonable match to our observations. Forexample, the rate fans visit Digg and view stories via thefriend’s interface, given by ω in Table 1, has 90% of thefans of a new voter returning to Digg within the next 19hours. As another example of interpreting these parametervalues, for the page visit distribution the values of µ andλ in Table 1 correspond to about 1/6 of the users viewingmore than just the first page. These parameters could inprinciple be measured independently from aggregate be-havior with more detailed information on user behavior.Measuring these values for users of Digg, or other similarweb sites, could improve the choice of model parameters.
4.3 ResultsThe model describes the behavior of all stories, whether ornot they are promoted to the front page. To illustrate themodel results, we consider stories promoted to the frontpage. Figure 6 shows the behavior of six such stories. Foreach story, S is the number of fans of the story’s submitter,available from our data, and r is estimated to minimize theroot-mean-square (RMS) difference between the observedvotes and the model predictions. Table 2 lists these values.
11
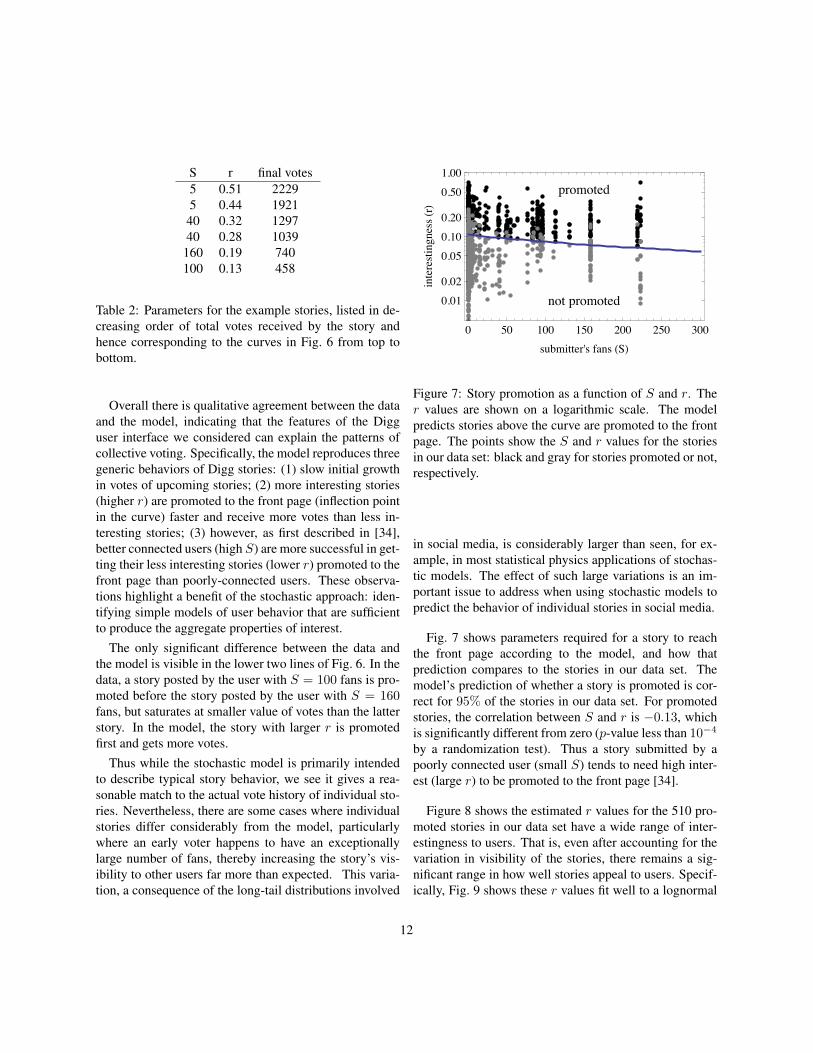
S r final votes5 0.51 22295 0.44 192140 0.32 129740 0.28 1039
160 0.19 740100 0.13 458
Table 2: Parameters for the example stories, listed in de-creasing order of total votes received by the story andhence corresponding to the curves in Fig. 6 from top tobottom.
Overall there is qualitative agreement between the dataand the model, indicating that the features of the Digguser interface we considered can explain the patterns ofcollective voting. Specifically, the model reproduces threegeneric behaviors of Digg stories: (1) slow initial growthin votes of upcoming stories; (2) more interesting stories(higher r) are promoted to the front page (inflection pointin the curve) faster and receive more votes than less in-teresting stories; (3) however, as first described in [34],better connected users (high S) are more successful in get-ting their less interesting stories (lower r) promoted to thefront page than poorly-connected users. These observa-tions highlight a benefit of the stochastic approach: iden-tifying simple models of user behavior that are sufficientto produce the aggregate properties of interest.
The only significant difference between the data andthe model is visible in the lower two lines of Fig. 6. In thedata, a story posted by the user with S = 100 fans is pro-moted before the story posted by the user with S = 160fans, but saturates at smaller value of votes than the latterstory. In the model, the story with larger r is promotedfirst and gets more votes.
Thus while the stochastic model is primarily intendedto describe typical story behavior, we see it gives a rea-sonable match to the actual vote history of individual sto-ries. Nevertheless, there are some cases where individualstories differ considerably from the model, particularlywhere an early voter happens to have an exceptionallylarge number of fans, thereby increasing the story’s vis-ibility to other users far more than expected. This varia-tion, a consequence of the long-tail distributions involved
not promoted
promoted
0 50 100 150 200 250 300
0.01
0.02
0.05
0.10
0.20
0.50
1.00
submitter's fans !S"
interestingness!r"
Figure 7: Story promotion as a function of S and r. Ther values are shown on a logarithmic scale. The modelpredicts stories above the curve are promoted to the frontpage. The points show the S and r values for the storiesin our data set: black and gray for stories promoted or not,respectively.
in social media, is considerably larger than seen, for ex-ample, in most statistical physics applications of stochas-tic models. The effect of such large variations is an im-portant issue to address when using stochastic models topredict the behavior of individual stories in social media.
Fig. 7 shows parameters required for a story to reachthe front page according to the model, and how thatprediction compares to the stories in our data set. Themodel’s prediction of whether a story is promoted is cor-rect for 95% of the stories in our data set. For promotedstories, the correlation between S and r is −0.13, whichis significantly different from zero (p-value less than 10−4
by a randomization test). Thus a story submitted by apoorly connected user (small S) tends to need high inter-est (large r) to be promoted to the front page [34].
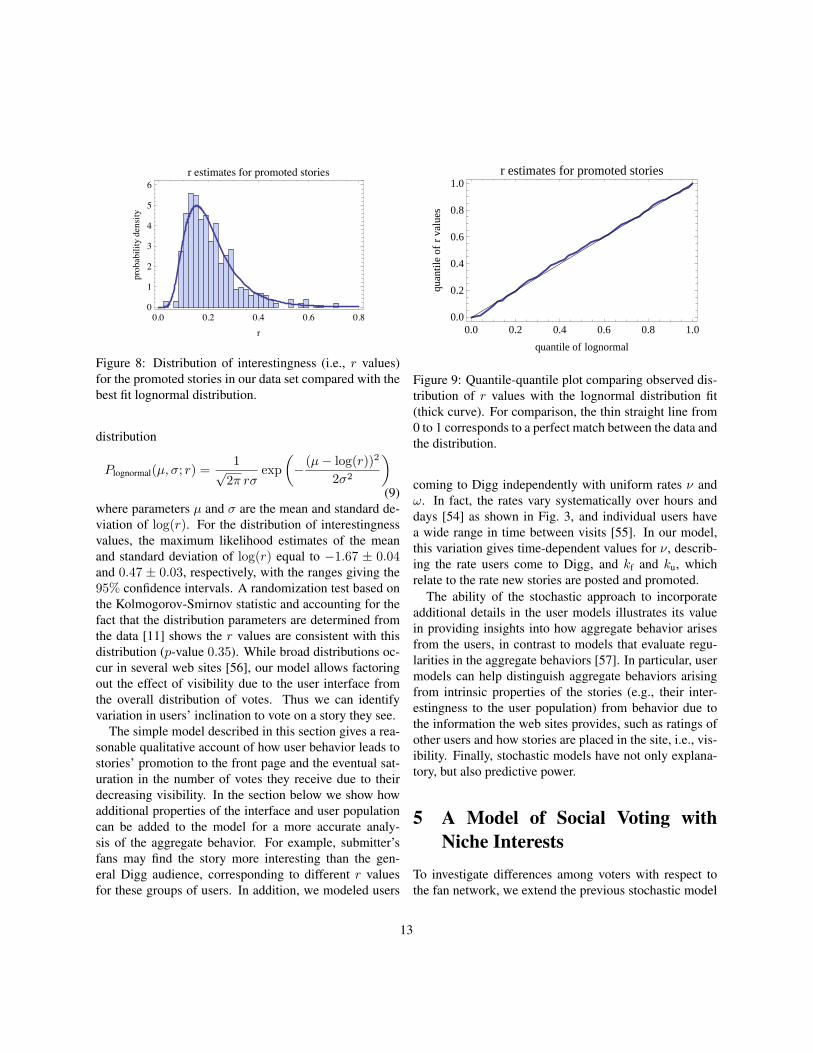
Figure 8 shows the estimated r values for the 510 pro-moted stories in our data set have a wide range of inter-estingness to users. That is, even after accounting for thevariation in visibility of the stories, there remains a sig-nificant range in how well stories appeal to users. Specif-ically, Fig. 9 shows these r values fit well to a lognormal
12
0.0 0.2 0.4 0.6 0.80
1
2
3
4
5
6
r
probabilitydensity
r estimates for promoted stories
Figure 8: Distribution of interestingness (i.e., r values)for the promoted stories in our data set compared with thebest fit lognormal distribution.
distribution
Plognormal(µ, σ; r) =1√
2π rσexp
(− (µ− log(r))2
2σ2
)(9)
where parameters µ and σ are the mean and standard de-viation of log(r). For the distribution of interestingnessvalues, the maximum likelihood estimates of the meanand standard deviation of log(r) equal to −1.67 ± 0.04and 0.47 ± 0.03, respectively, with the ranges giving the95% confidence intervals. A randomization test based onthe Kolmogorov-Smirnov statistic and accounting for thefact that the distribution parameters are determined fromthe data [11] shows the r values are consistent with thisdistribution (p-value 0.35). While broad distributions oc-cur in several web sites [56], our model allows factoringout the effect of visibility due to the user interface fromthe overall distribution of votes. Thus we can identifyvariation in users’ inclination to vote on a story they see.
The simple model described in this section gives a rea-sonable qualitative account of how user behavior leads tostories’ promotion to the front page and the eventual sat-uration in the number of votes they receive due to theirdecreasing visibility. In the section below we show howadditional properties of the interface and user populationcan be added to the model for a more accurate analy-sis of the aggregate behavior. For example, submitter’sfans may find the story more interesting than the gen-eral Digg audience, corresponding to different r valuesfor these groups of users. In addition, we modeled users
0.0 0.2 0.4 0.6 0.8 1.00.0
0.2
0.4
0.6
0.8
1.0
quantile of lognormal
quan
tile
ofr
valu
es
r estimates for promoted stories
Figure 9: Quantile-quantile plot comparing observed dis-tribution of r values with the lognormal distribution fit(thick curve). For comparison, the thin straight line from0 to 1 corresponds to a perfect match between the data andthe distribution.
coming to Digg independently with uniform rates ν andω. In fact, the rates vary systematically over hours anddays [54] as shown in Fig. 3, and individual users havea wide range in time between visits [55]. In our model,this variation gives time-dependent values for ν, describ-ing the rate users come to Digg, and kf and ku, whichrelate to the rate new stories are posted and promoted.
The ability of the stochastic approach to incorporateadditional details in the user models illustrates its valuein providing insights into how aggregate behavior arisesfrom the users, in contrast to models that evaluate regu-larities in the aggregate behaviors [57]. In particular, usermodels can help distinguish aggregate behaviors arisingfrom intrinsic properties of the stories (e.g., their inter-estingness to the user population) from behavior due tothe information the web sites provides, such as ratings ofother users and how stories are placed in the site, i.e., vis-ibility. Finally, stochastic models have not only explana-tory, but also predictive power.
5 A Model of Social Voting withNiche Interests
To investigate differences among voters with respect tothe fan network, we extend the previous stochastic model
13
non‐fans
fans
view story
view story
no vote
vote by fan
vote by non‐fan
ρ
ωPN
ωPF
rN
rF
1‐rN
1‐rF
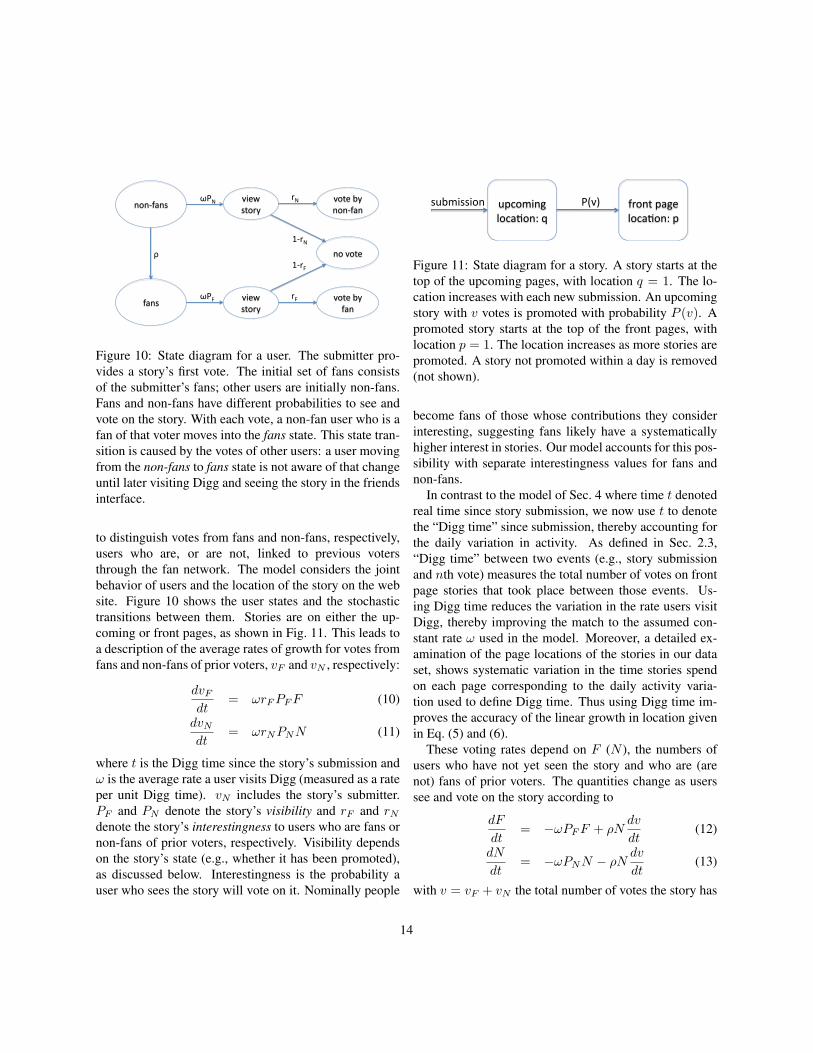
Figure 10: State diagram for a user. The submitter pro-vides a story’s first vote. The initial set of fans consistsof the submitter’s fans; other users are initially non-fans.Fans and non-fans have different probabilities to see andvote on the story. With each vote, a non-fan user who is afan of that voter moves into the fans state. This state tran-sition is caused by the votes of other users: a user movingfrom the non-fans to fans state is not aware of that changeuntil later visiting Digg and seeing the story in the friendsinterface.
to distinguish votes from fans and non-fans, respectively,users who are, or are not, linked to previous votersthrough the fan network. The model considers the jointbehavior of users and the location of the story on the website. Figure 10 shows the user states and the stochastictransitions between them. Stories are on either the up-coming or front pages, as shown in Fig. 11. This leads toa description of the average rates of growth for votes fromfans and non-fans of prior voters, vF and vN , respectively:
dvFdt
= ωrFPFF (10)
dvNdt
= ωrNPNN (11)
where t is the Digg time since the story’s submission andω is the average rate a user visits Digg (measured as a rateper unit Digg time). vN includes the story’s submitter.PF and PN denote the story’s visibility and rF and rNdenote the story’s interestingness to users who are fans ornon-fans of prior voters, respectively. Visibility dependson the story’s state (e.g., whether it has been promoted),as discussed below. Interestingness is the probability auser who sees the story will vote on it. Nominally people
upcoming loca,on: q
front page loca,on: p
P(v) submission
Figure 11: State diagram for a story. A story starts at thetop of the upcoming pages, with location q = 1. The lo-cation increases with each new submission. An upcomingstory with v votes is promoted with probability P (v). Apromoted story starts at the top of the front pages, withlocation p = 1. The location increases as more stories arepromoted. A story not promoted within a day is removed(not shown).
become fans of those whose contributions they considerinteresting, suggesting fans likely have a systematicallyhigher interest in stories. Our model accounts for this pos-sibility with separate interestingness values for fans andnon-fans.
In contrast to the model of Sec. 4 where time t denotedreal time since story submission, we now use t to denotethe “Digg time” since submission, thereby accounting forthe daily variation in activity. As defined in Sec. 2.3,“Digg time” between two events (e.g., story submissionand nth vote) measures the total number of votes on frontpage stories that took place between those events. Us-ing Digg time reduces the variation in the rate users visitDigg, thereby improving the match to the assumed con-stant rate ω used in the model. Moreover, a detailed ex-amination of the page locations of the stories in our dataset, shows systematic variation in the time stories spendon each page corresponding to the daily activity varia-tion used to define Digg time. Thus using Digg time im-proves the accuracy of the linear growth in location givenin Eq. (5) and (6).
These voting rates depend on F (N ), the numbers ofusers who have not yet seen the story and who are (arenot) fans of prior voters. The quantities change as userssee and vote on the story according to
dF
dt= −ωPFF + ρN
dv
dt(12)
dN
dt= −ωPNN − ρN
dv
dt(13)
with v = vF + vN the total number of votes the story has
14
received. The quantity ρ is the probability a user who hasnot yet seen the story and is not a fan of a prior voter is afan of the most recent voter. For simplicity, we treat thisprobability as a constant over the voters, thus averagingover the variation due to clustering in the social networkand the number of fans a user has. The first term in eachof these equations is the rate the users see the story. Thesecond terms arise from the rate the story becomes visi-ble in the friends interface of users who are not fans ofprevious voters but are fans of the most recent voter.
Initially, the story has one vote (from the submitter) andthe submitter has S fans, so vF (0) = 0, vN (0) = 1, F =S and N = U − S − 1 where U is the total number ofactive users at the time the story is submitted. Over time,a story becomes less visible to users as it moves downthe upcoming or (if promoted) front page lists, therebyattracting fewer votes and hence fewer new fans of priorvoters.
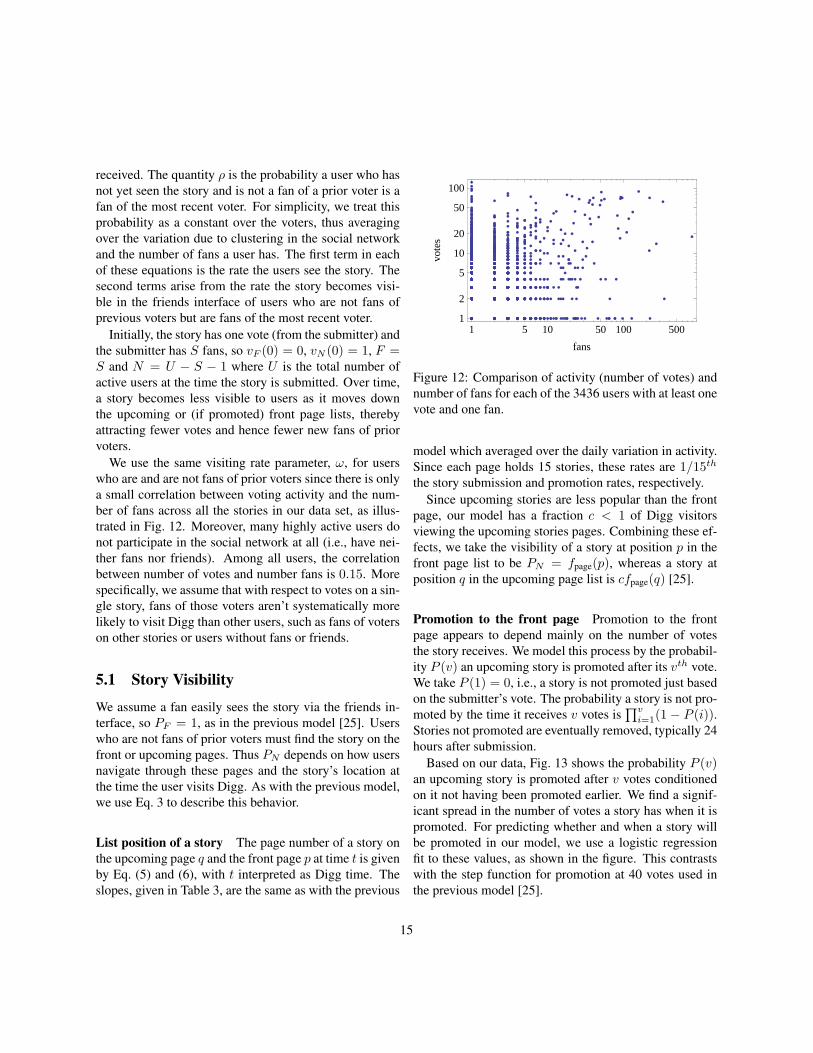
We use the same visiting rate parameter, ω, for userswho are and are not fans of prior voters since there is onlya small correlation between voting activity and the num-ber of fans across all the stories in our data set, as illus-trated in Fig. 12. Moreover, many highly active users donot participate in the social network at all (i.e., have nei-ther fans nor friends). Among all users, the correlationbetween number of votes and number fans is 0.15. Morespecifically, we assume that with respect to votes on a sin-gle story, fans of those voters aren’t systematically morelikely to visit Digg than other users, such as fans of voterson other stories or users without fans or friends.
5.1 Story Visibility
We assume a fan easily sees the story via the friends in-terface, so PF = 1, as in the previous model [25]. Userswho are not fans of prior voters must find the story on thefront or upcoming pages. Thus PN depends on how usersnavigate through these pages and the story’s location atthe time the user visits Digg. As with the previous model,we use Eq. 3 to describe this behavior.
List position of a story The page number of a story onthe upcoming page q and the front page p at time t is givenby Eq. (5) and (6), with t interpreted as Digg time. Theslopes, given in Table 3, are the same as with the previous
1 5 10 50 100 5001
2
5
10
20
50
100
fans
vote
s
Figure 12: Comparison of activity (number of votes) andnumber of fans for each of the 3436 users with at least onevote and one fan.
model which averaged over the daily variation in activity.Since each page holds 15 stories, these rates are 1/15th
the story submission and promotion rates, respectively.Since upcoming stories are less popular than the front
page, our model has a fraction c < 1 of Digg visitorsviewing the upcoming stories pages. Combining these ef-fects, we take the visibility of a story at position p in thefront page list to be PN = fpage(p), whereas a story atposition q in the upcoming page list is cfpage(q) [25].
Promotion to the front page Promotion to the frontpage appears to depend mainly on the number of votesthe story receives. We model this process by the probabil-ity P (v) an upcoming story is promoted after its vth vote.We take P (1) = 0, i.e., a story is not promoted just basedon the submitter’s vote. The probability a story is not pro-moted by the time it receives v votes is
∏vi=1(1 − P (i)).
Stories not promoted are eventually removed, typically 24hours after submission.
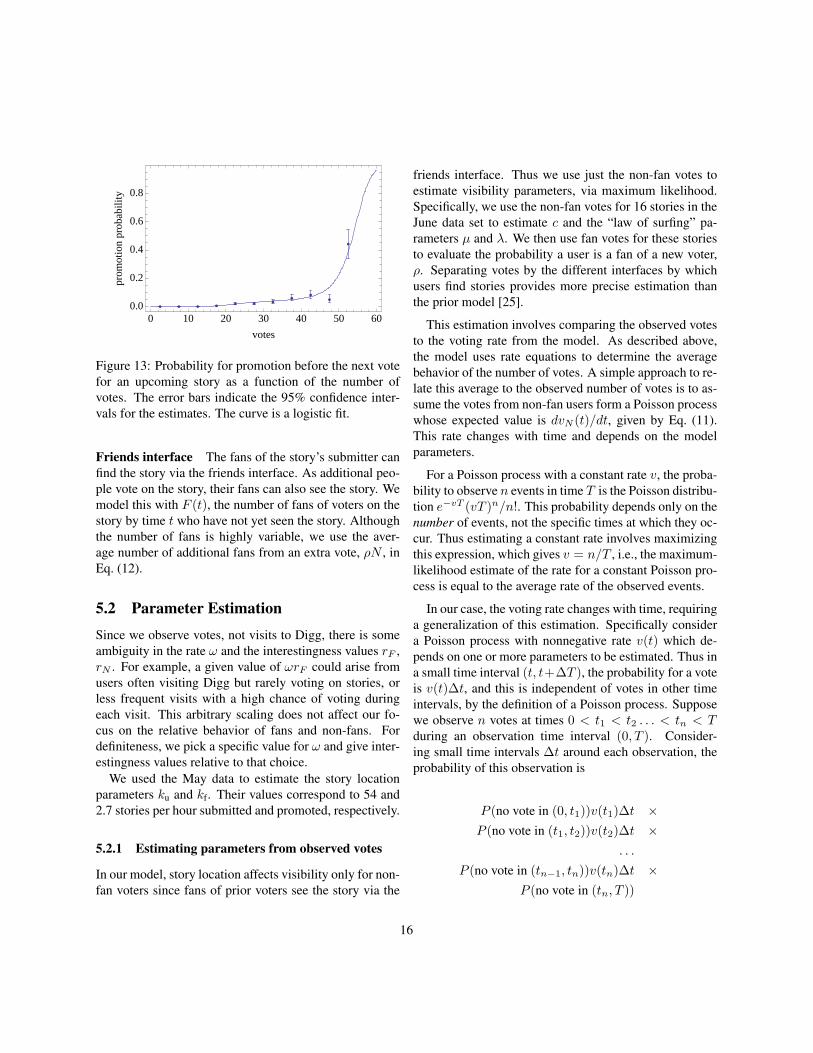
Based on our data, Fig. 13 shows the probability P (v)an upcoming story is promoted after v votes conditionedon it not having been promoted earlier. We find a signif-icant spread in the number of votes a story has when it ispromoted. For predicting whether and when a story willbe promoted in our model, we use a logistic regressionfit to these values, as shown in the figure. This contrastswith the step function for promotion at 40 votes used inthe previous model [25].
15
0 10 20 30 40 50 600.0
0.2
0.4
0.6
0.8
votes
prom
otio
npr
obab
ility
Figure 13: Probability for promotion before the next votefor an upcoming story as a function of the number ofvotes. The error bars indicate the 95% confidence inter-vals for the estimates. The curve is a logistic fit.
Friends interface The fans of the story’s submitter canfind the story via the friends interface. As additional peo-ple vote on the story, their fans can also see the story. Wemodel this with F (t), the number of fans of voters on thestory by time t who have not yet seen the story. Althoughthe number of fans is highly variable, we use the aver-age number of additional fans from an extra vote, ρN , inEq. (12).
5.2 Parameter EstimationSince we observe votes, not visits to Digg, there is someambiguity in the rate ω and the interestingness values rF ,rN . For example, a given value of ωrF could arise fromusers often visiting Digg but rarely voting on stories, orless frequent visits with a high chance of voting duringeach visit. This arbitrary scaling does not affect our fo-cus on the relative behavior of fans and non-fans. Fordefiniteness, we pick a specific value for ω and give inter-estingness values relative to that choice.
We used the May data to estimate the story locationparameters ku and kf. Their values correspond to 54 and2.7 stories per hour submitted and promoted, respectively.
5.2.1 Estimating parameters from observed votes
In our model, story location affects visibility only for non-fan voters since fans of prior voters see the story via the
friends interface. Thus we use just the non-fan votes toestimate visibility parameters, via maximum likelihood.Specifically, we use the non-fan votes for 16 stories in theJune data set to estimate c and the “law of surfing” pa-rameters µ and λ. We then use fan votes for these storiesto evaluate the probability a user is a fan of a new voter,ρ. Separating votes by the different interfaces by whichusers find stories provides more precise estimation thanthe prior model [25].
This estimation involves comparing the observed votesto the voting rate from the model. As described above,the model uses rate equations to determine the averagebehavior of the number of votes. A simple approach to re-late this average to the observed number of votes is to as-sume the votes from non-fan users form a Poisson processwhose expected value is dvN (t)/dt, given by Eq. (11).This rate changes with time and depends on the modelparameters.
For a Poisson process with a constant rate v, the proba-bility to observe n events in time T is the Poisson distribu-tion e−vT (vT )n/n!. This probability depends only on thenumber of events, not the specific times at which they oc-cur. Thus estimating a constant rate involves maximizingthis expression, which gives v = n/T , i.e., the maximum-likelihood estimate of the rate for a constant Poisson pro-cess is equal to the average rate of the observed events.
In our case, the voting rate changes with time, requiringa generalization of this estimation. Specifically considera Poisson process with nonnegative rate v(t) which de-pends on one or more parameters to be estimated. Thus ina small time interval (t, t+∆T ), the probability for a voteis v(t)∆t, and this is independent of votes in other timeintervals, by the definition of a Poisson process. Supposewe observe n votes at times 0 < t1 < t2 . . . < tn < Tduring an observation time interval (0, T ). Consider-ing small time intervals ∆t around each observation, theprobability of this observation is
P (no vote in (0, t1))v(t1)∆t ×P (no vote in (t1, t2))v(t2)∆t ×
. . .
P (no vote in (tn−1, tn))v(tn)∆t ×P (no vote in (tn, T ))
16
The probability for no vote in the interval (a, b) is
exp
(−∫ b
a
v(t)dt
)
Thus the log-likelihood for the observed sequence ofvotes is
−∫ T
0
v(t)dt+∑i
log v(ti)
The maximum-likelihood estimation for parameters de-termining the rate v(t) is a trade-off between these twoterms: attempting to minimize v(t) over the range (0, T )to increase the first term while maximizing the valuesv(ti) at the specific times of the observed votes. Ifv(t) is constant, this likelihood expression simplifies to−vT + n log v with maximum at v = n/T as discussedabove for the constant Poisson process. When v(t) varieswith time, the maximization selects parameters giving rel-atively larger v(t) values where the observed votes areclustered in time.
We combine this log-likelihood expression from thevotes on several stories, and maximize the combined ex-pression with respect to the story-independent parametersof the model, with the interestingness parameters deter-mined separately for each story.
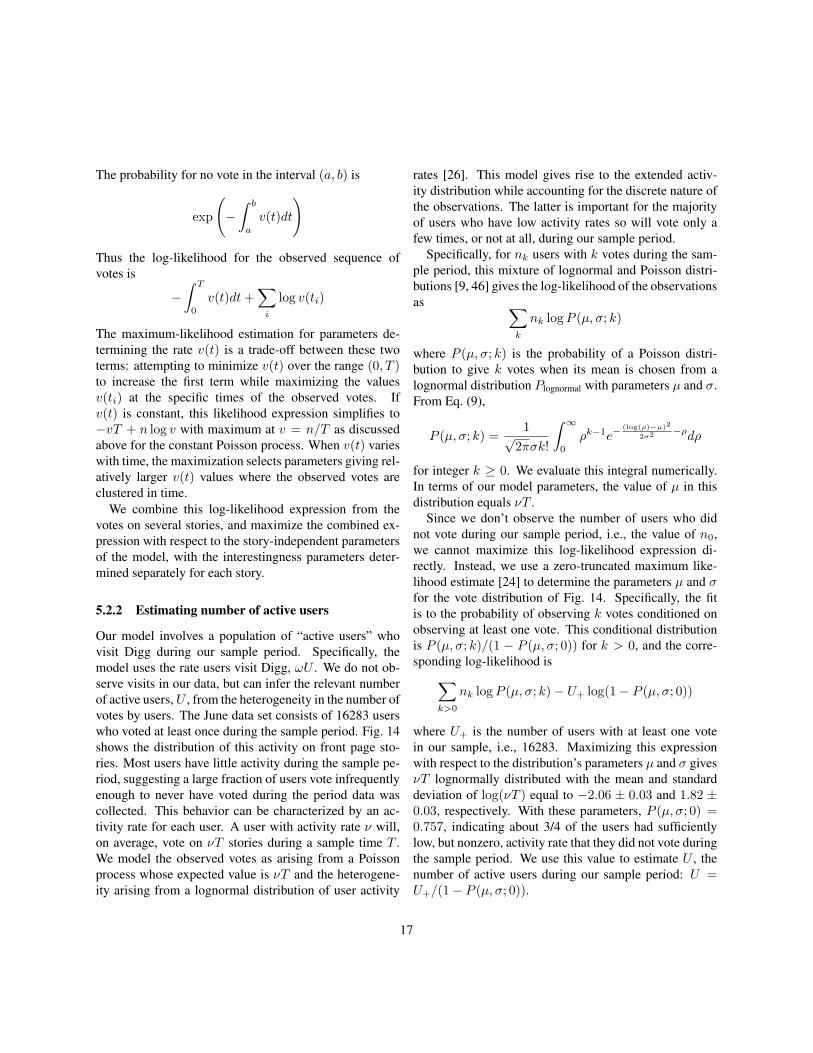
5.2.2 Estimating number of active users
Our model involves a population of “active users” whovisit Digg during our sample period. Specifically, themodel uses the rate users visit Digg, ωU . We do not ob-serve visits in our data, but can infer the relevant numberof active users,U , from the heterogeneity in the number ofvotes by users. The June data set consists of 16283 userswho voted at least once during the sample period. Fig. 14shows the distribution of this activity on front page sto-ries. Most users have little activity during the sample pe-riod, suggesting a large fraction of users vote infrequentlyenough to never have voted during the period data wascollected. This behavior can be characterized by an ac-tivity rate for each user. A user with activity rate ν will,on average, vote on νT stories during a sample time T .We model the observed votes as arising from a Poissonprocess whose expected value is νT and the heterogene-ity arising from a lognormal distribution of user activity
rates [26]. This model gives rise to the extended activ-ity distribution while accounting for the discrete nature ofthe observations. The latter is important for the majorityof users who have low activity rates so will vote only afew times, or not at all, during our sample period.
Specifically, for nk users with k votes during the sam-ple period, this mixture of lognormal and Poisson distri-butions [9, 46] gives the log-likelihood of the observationsas ∑
k
nk logP (µ, σ; k)
where P (µ, σ; k) is the probability of a Poisson distri-bution to give k votes when its mean is chosen from alognormal distribution Plognormal with parameters µ and σ.From Eq. (9),
P (µ, σ; k) =1√
2πσk!
∫ ∞0
ρk−1e−(log(ρ)−µ)2
2σ2 −ρdρ
for integer k ≥ 0. We evaluate this integral numerically.In terms of our model parameters, the value of µ in thisdistribution equals νT .
Since we don’t observe the number of users who didnot vote during our sample period, i.e., the value of n0,we cannot maximize this log-likelihood expression di-rectly. Instead, we use a zero-truncated maximum like-lihood estimate [24] to determine the parameters µ and σfor the vote distribution of Fig. 14. Specifically, the fitis to the probability of observing k votes conditioned onobserving at least one vote. This conditional distributionis P (µ, σ; k)/(1 − P (µ, σ; 0)) for k > 0, and the corre-sponding log-likelihood is∑
k>0
nk logP (µ, σ; k)− U+ log(1− P (µ, σ; 0))
where U+ is the number of users with at least one votein our sample, i.e., 16283. Maximizing this expressionwith respect to the distribution’s parameters µ and σ givesνT lognormally distributed with the mean and standarddeviation of log(νT ) equal to −2.06 ± 0.03 and 1.82 ±0.03, respectively. With these parameters, P (µ, σ; 0) =0.757, indicating about 3/4 of the users had sufficientlylow, but nonzero, activity rate that they did not vote duringthe sample period. We use this value to estimate U , thenumber of active users during our sample period: U =U+/(1− P (µ, σ; 0)).
17
1 2 5 10 20 50 1001
10
100
1000
104
front page votes
user
sw
ithth
atm
any
vote
s
Figure 14: User activity distribution on logarithmicscales. The curve shows the fit to the model describedin the text.
parameter valueaverage rate each user visits Digg ω = 0.2 /hrnumber of active users U = 70, 000fraction viewing upcoming pages c = 0.065page view distribution µ = 6.3
λ = 0.14probability a user is a voter’s fan ρ = 9.48× 10⁻⁶
upcoming stories location ku = 3.60 pages/hrfront page location kf = 0.18 pages/hr
story specific parametersinterestingness to fans rF
interestingness to non-fans rN
number of submitter’s fans S
Table 3: Model parameters, with times in “Digg hours”.
Based on this fit, the curve in Fig. 14 shows the ex-pected number of users with each number of votes, i.e.,the value of UP (µ, σ; k) for k > 0. This is a discretedistribution: the lines between the expected values serveonly to distinguish the model fit from the points show-ing the observed values. A bootstrap test [15] based onthe Kolmogorov-Smirnov (KS) statistic shows the votecounts are consistent with this distribution (p-value 0.48).This test and the others reported in this paper accountfor the fact that we fit the distribution parameters to thedata [11].
0 1 2 3 4 5 60
50
100
150
200
digg hours
vote
s
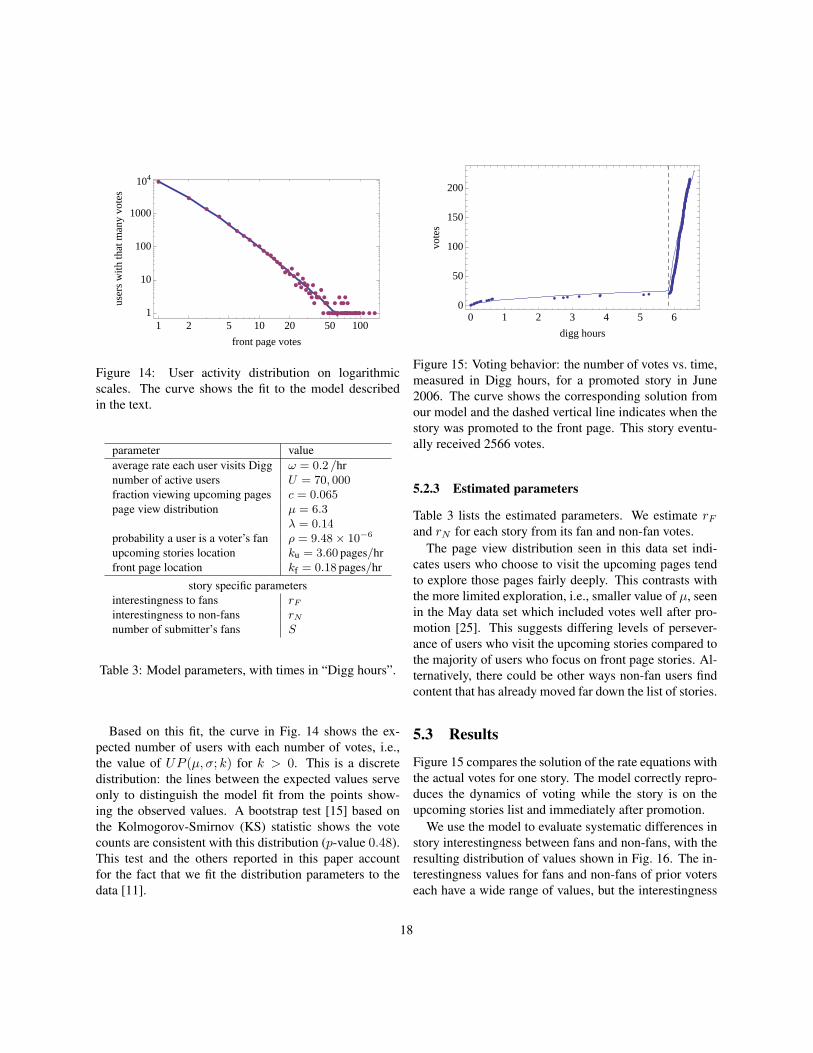
Figure 15: Voting behavior: the number of votes vs. time,measured in Digg hours, for a promoted story in June2006. The curve shows the corresponding solution fromour model and the dashed vertical line indicates when thestory was promoted to the front page. This story eventu-ally received 2566 votes.
5.2.3 Estimated parameters
Table 3 lists the estimated parameters. We estimate rFand rN for each story from its fan and non-fan votes.
The page view distribution seen in this data set indi-cates users who choose to visit the upcoming pages tendto explore those pages fairly deeply. This contrasts withthe more limited exploration, i.e., smaller value of µ, seenin the May data set which included votes well after pro-motion [25]. This suggests differing levels of persever-ance of users who visit the upcoming stories compared tothe majority of users who focus on front page stories. Al-ternatively, there could be other ways non-fan users findcontent that has already moved far down the list of stories.
5.3 Results
Figure 15 compares the solution of the rate equations withthe actual votes for one story. The model correctly repro-duces the dynamics of voting while the story is on theupcoming stories list and immediately after promotion.
We use the model to evaluate systematic differences instory interestingness between fans and non-fans, with theresulting distribution of values shown in Fig. 16. The in-terestingness values for fans and non-fans of prior voterseach have a wide range of values, but the interestingness
18
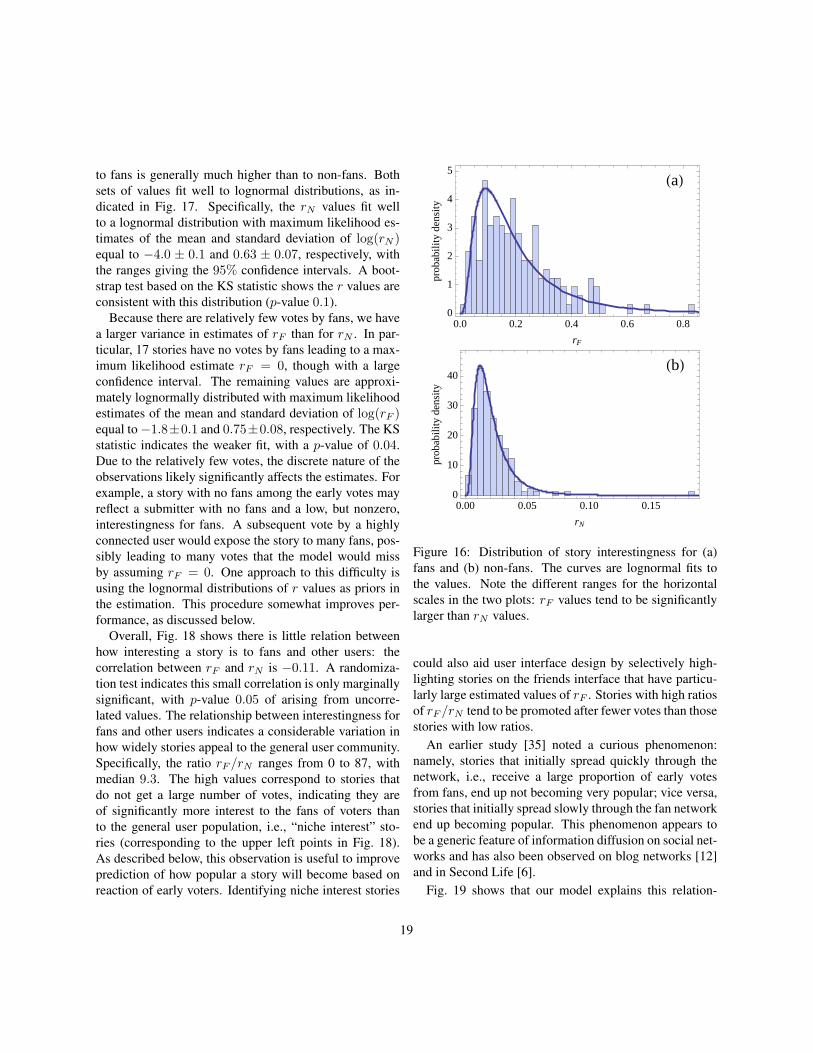
to fans is generally much higher than to non-fans. Bothsets of values fit well to lognormal distributions, as in-dicated in Fig. 17. Specifically, the rN values fit wellto a lognormal distribution with maximum likelihood es-timates of the mean and standard deviation of log(rN )equal to −4.0 ± 0.1 and 0.63 ± 0.07, respectively, withthe ranges giving the 95% confidence intervals. A boot-strap test based on the KS statistic shows the r values areconsistent with this distribution (p-value 0.1).
Because there are relatively few votes by fans, we havea larger variance in estimates of rF than for rN . In par-ticular, 17 stories have no votes by fans leading to a max-imum likelihood estimate rF = 0, though with a largeconfidence interval. The remaining values are approxi-mately lognormally distributed with maximum likelihoodestimates of the mean and standard deviation of log(rF )equal to−1.8±0.1 and 0.75±0.08, respectively. The KSstatistic indicates the weaker fit, with a p-value of 0.04.Due to the relatively few votes, the discrete nature of theobservations likely significantly affects the estimates. Forexample, a story with no fans among the early votes mayreflect a submitter with no fans and a low, but nonzero,interestingness for fans. A subsequent vote by a highlyconnected user would expose the story to many fans, pos-sibly leading to many votes that the model would missby assuming rF = 0. One approach to this difficulty isusing the lognormal distributions of r values as priors inthe estimation. This procedure somewhat improves per-formance, as discussed below.
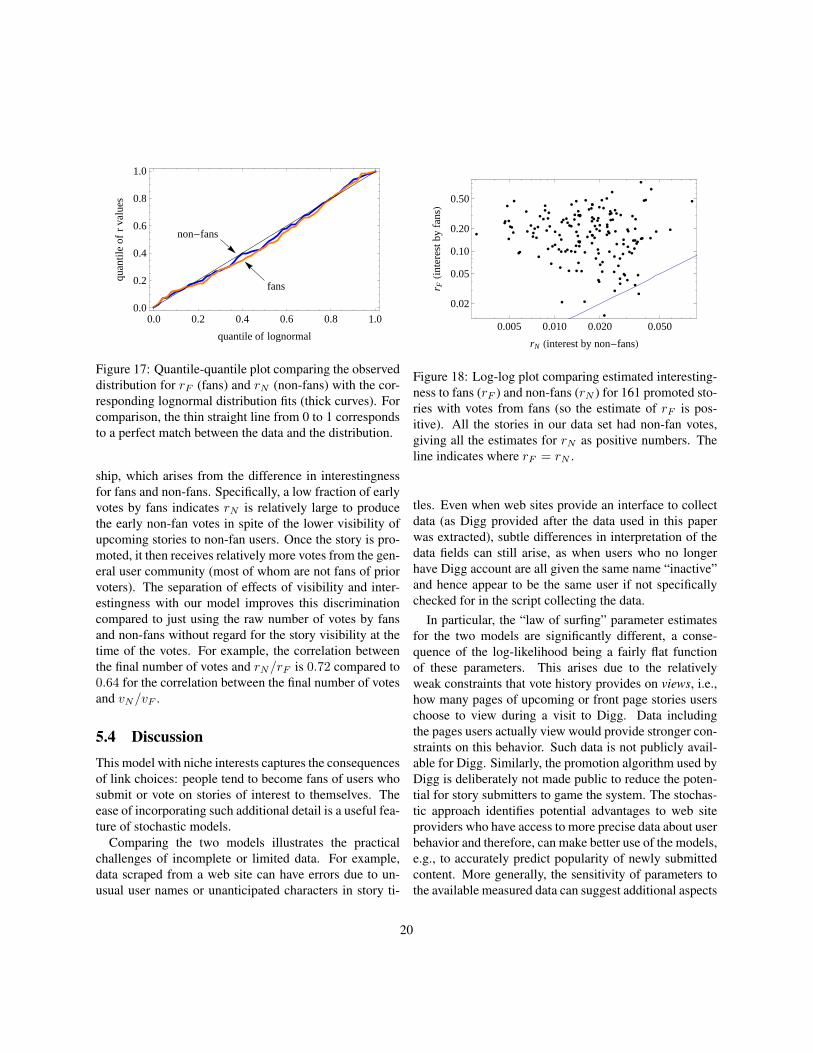
Overall, Fig. 18 shows there is little relation betweenhow interesting a story is to fans and other users: thecorrelation between rF and rN is −0.11. A randomiza-tion test indicates this small correlation is only marginallysignificant, with p-value 0.05 of arising from uncorre-lated values. The relationship between interestingness forfans and other users indicates a considerable variation inhow widely stories appeal to the general user community.Specifically, the ratio rF /rN ranges from 0 to 87, withmedian 9.3. The high values correspond to stories thatdo not get a large number of votes, indicating they areof significantly more interest to the fans of voters thanto the general user population, i.e., “niche interest” sto-ries (corresponding to the upper left points in Fig. 18).As described below, this observation is useful to improveprediction of how popular a story will become based onreaction of early voters. Identifying niche interest stories
HaL
0.0 0.2 0.4 0.6 0.80
1
2
3
4
5
rF
prob
abili
tyde
nsity
HbL
0.00 0.05 0.10 0.150
10
20
30
40
rN
prob
abili
tyde
nsity
Figure 16: Distribution of story interestingness for (a)fans and (b) non-fans. The curves are lognormal fits tothe values. Note the different ranges for the horizontalscales in the two plots: rF values tend to be significantlylarger than rN values.
could also aid user interface design by selectively high-lighting stories on the friends interface that have particu-larly large estimated values of rF . Stories with high ratiosof rF /rN tend to be promoted after fewer votes than thosestories with low ratios.
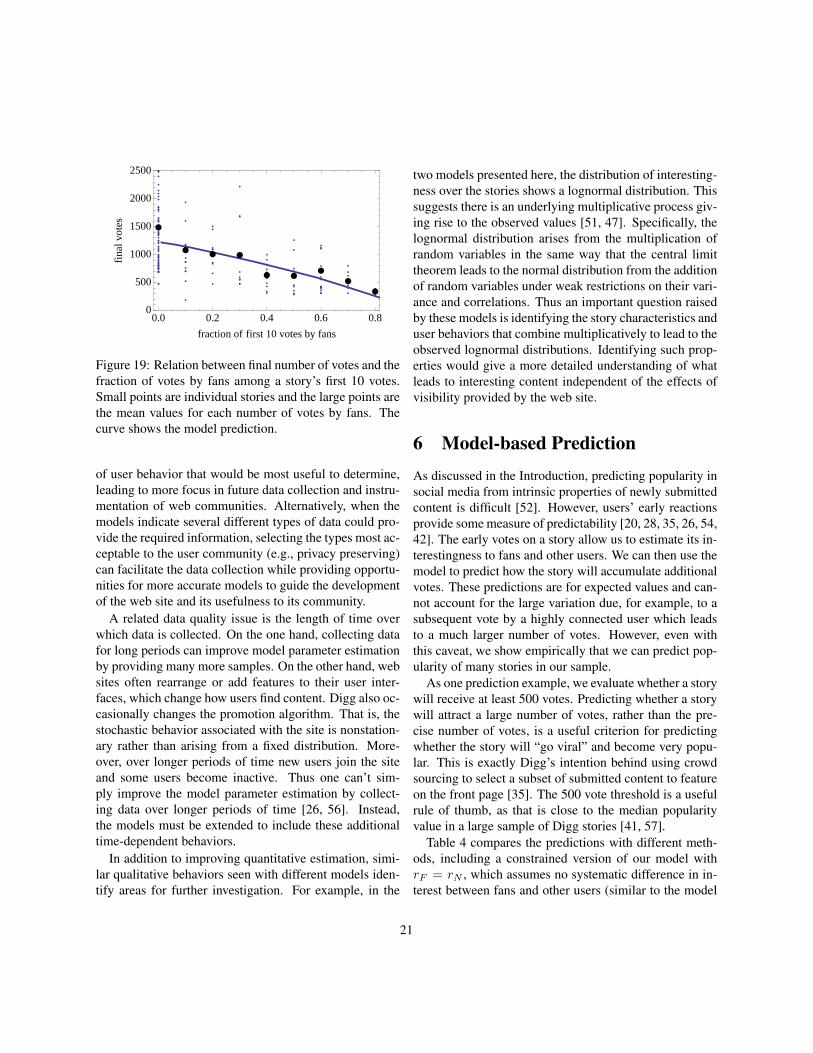
An earlier study [35] noted a curious phenomenon:namely, stories that initially spread quickly through thenetwork, i.e., receive a large proportion of early votesfrom fans, end up not becoming very popular; vice versa,stories that initially spread slowly through the fan networkend up becoming popular. This phenomenon appears tobe a generic feature of information diffusion on social net-works and has also been observed on blog networks [12]and in Second Life [6].
Fig. 19 shows that our model explains this relation-
19
0.0 0.2 0.4 0.6 0.8 1.00.0
0.2
0.4
0.6
0.8
1.0
quantile of lognormal
quan
tile
ofr
valu
es
fans
non-fans
Figure 17: Quantile-quantile plot comparing the observeddistribution for rF (fans) and rN (non-fans) with the cor-responding lognormal distribution fits (thick curves). Forcomparison, the thin straight line from 0 to 1 correspondsto a perfect match between the data and the distribution.
ship, which arises from the difference in interestingnessfor fans and non-fans. Specifically, a low fraction of earlyvotes by fans indicates rN is relatively large to producethe early non-fan votes in spite of the lower visibility ofupcoming stories to non-fan users. Once the story is pro-moted, it then receives relatively more votes from the gen-eral user community (most of whom are not fans of priorvoters). The separation of effects of visibility and inter-estingness with our model improves this discriminationcompared to just using the raw number of votes by fansand non-fans without regard for the story visibility at thetime of the votes. For example, the correlation betweenthe final number of votes and rN/rF is 0.72 compared to0.64 for the correlation between the final number of votesand vN/vF .
5.4 DiscussionThis model with niche interests captures the consequencesof link choices: people tend to become fans of users whosubmit or vote on stories of interest to themselves. Theease of incorporating such additional detail is a useful fea-ture of stochastic models.
Comparing the two models illustrates the practicalchallenges of incomplete or limited data. For example,data scraped from a web site can have errors due to un-usual user names or unanticipated characters in story ti-
0.005 0.010 0.020 0.050
0.02
0.05
0.10
0.20
0.50
rN Hinterest by non-fansL
r FHi
nter
estb
yfa
nsL
Figure 18: Log-log plot comparing estimated interesting-ness to fans (rF ) and non-fans (rN ) for 161 promoted sto-ries with votes from fans (so the estimate of rF is pos-itive). All the stories in our data set had non-fan votes,giving all the estimates for rN as positive numbers. Theline indicates where rF = rN .
tles. Even when web sites provide an interface to collectdata (as Digg provided after the data used in this paperwas extracted), subtle differences in interpretation of thedata fields can still arise, as when users who no longerhave Digg account are all given the same name “inactive”and hence appear to be the same user if not specificallychecked for in the script collecting the data.
In particular, the “law of surfing” parameter estimatesfor the two models are significantly different, a conse-quence of the log-likelihood being a fairly flat functionof these parameters. This arises due to the relativelyweak constraints that vote history provides on views, i.e.,how many pages of upcoming or front page stories userschoose to view during a visit to Digg. Data includingthe pages users actually view would provide stronger con-straints on this behavior. Such data is not publicly avail-able for Digg. Similarly, the promotion algorithm used byDigg is deliberately not made public to reduce the poten-tial for story submitters to game the system. The stochas-tic approach identifies potential advantages to web siteproviders who have access to more precise data about userbehavior and therefore, can make better use of the models,e.g., to accurately predict popularity of newly submittedcontent. More generally, the sensitivity of parameters tothe available measured data can suggest additional aspects
20
0.0 0.2 0.4 0.6 0.80
500
1000
1500
2000
2500
fraction of first 10 votes by fans
fina
lvot
es
Figure 19: Relation between final number of votes and thefraction of votes by fans among a story’s first 10 votes.Small points are individual stories and the large points arethe mean values for each number of votes by fans. Thecurve shows the model prediction.
of user behavior that would be most useful to determine,leading to more focus in future data collection and instru-mentation of web communities. Alternatively, when themodels indicate several different types of data could pro-vide the required information, selecting the types most ac-ceptable to the user community (e.g., privacy preserving)can facilitate the data collection while providing opportu-nities for more accurate models to guide the developmentof the web site and its usefulness to its community.
A related data quality issue is the length of time overwhich data is collected. On the one hand, collecting datafor long periods can improve model parameter estimationby providing many more samples. On the other hand, websites often rearrange or add features to their user inter-faces, which change how users find content. Digg also oc-casionally changes the promotion algorithm. That is, thestochastic behavior associated with the site is nonstation-ary rather than arising from a fixed distribution. More-over, over longer periods of time new users join the siteand some users become inactive. Thus one can’t sim-ply improve the model parameter estimation by collect-ing data over longer periods of time [26, 56]. Instead,the models must be extended to include these additionaltime-dependent behaviors.
In addition to improving quantitative estimation, simi-lar qualitative behaviors seen with different models iden-tify areas for further investigation. For example, in the
two models presented here, the distribution of interesting-ness over the stories shows a lognormal distribution. Thissuggests there is an underlying multiplicative process giv-ing rise to the observed values [51, 47]. Specifically, thelognormal distribution arises from the multiplication ofrandom variables in the same way that the central limittheorem leads to the normal distribution from the additionof random variables under weak restrictions on their vari-ance and correlations. Thus an important question raisedby these models is identifying the story characteristics anduser behaviors that combine multiplicatively to lead to theobserved lognormal distributions. Identifying such prop-erties would give a more detailed understanding of whatleads to interesting content independent of the effects ofvisibility provided by the web site.
6 Model-based PredictionAs discussed in the Introduction, predicting popularity insocial media from intrinsic properties of newly submittedcontent is difficult [52]. However, users’ early reactionsprovide some measure of predictability [20, 28, 35, 26, 54,42]. The early votes on a story allow us to estimate its in-terestingness to fans and other users. We can then use themodel to predict how the story will accumulate additionalvotes. These predictions are for expected values and can-not account for the large variation due, for example, to asubsequent vote by a highly connected user which leadsto a much larger number of votes. However, even withthis caveat, we show empirically that we can predict pop-ularity of many stories in our sample.
As one prediction example, we evaluate whether a storywill receive at least 500 votes. Predicting whether a storywill attract a large number of votes, rather than the pre-cise number of votes, is a useful criterion for predictingwhether the story will “go viral” and become very popu-lar. This is exactly Digg’s intention behind using crowdsourcing to select a subset of submitted content to featureon the front page [35]. The 500 vote threshold is a usefulrule of thumb, as that is close to the median popularityvalue in a large sample of Digg stories [41, 57].
Table 4 compares the predictions with different meth-ods, including a constrained version of our model withrF = rN , which assumes no systematic difference in in-terest between fans and other users (similar to the model
21
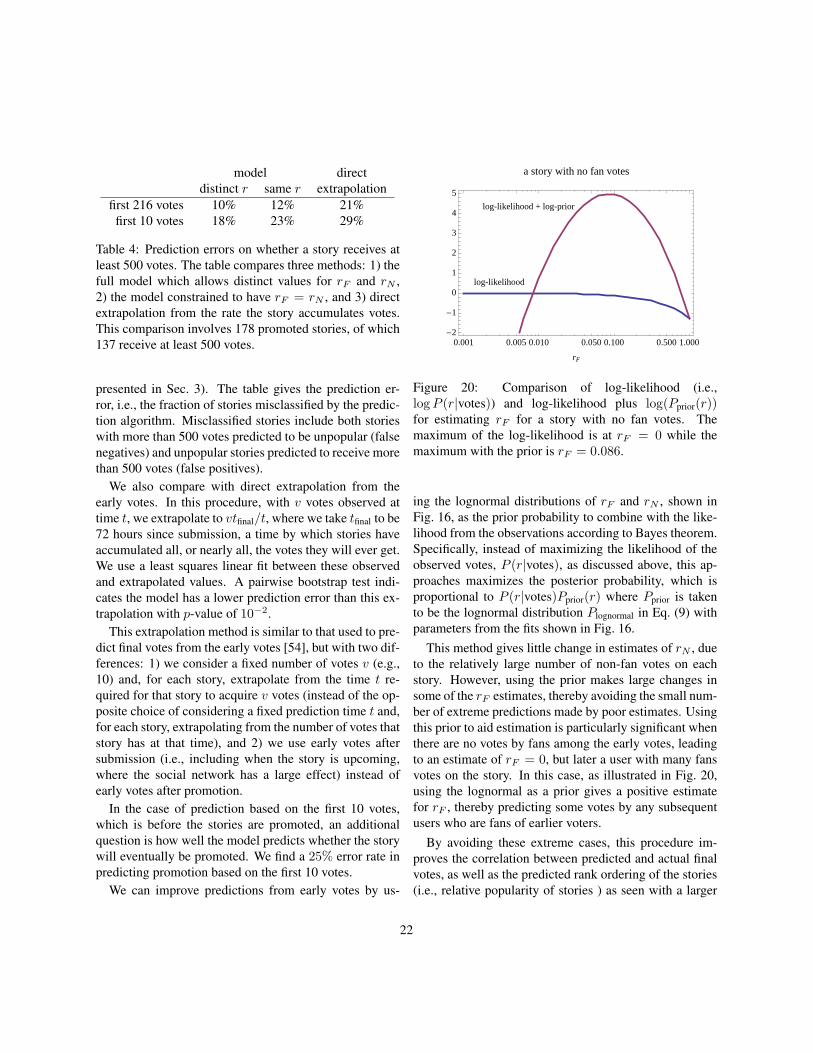
model directdistinct r same r extrapolation
first 216 votes 10% 12% 21%first 10 votes 18% 23% 29%
Table 4: Prediction errors on whether a story receives atleast 500 votes. The table compares three methods: 1) thefull model which allows distinct values for rF and rN ,2) the model constrained to have rF = rN , and 3) directextrapolation from the rate the story accumulates votes.This comparison involves 178 promoted stories, of which137 receive at least 500 votes.
presented in Sec. 3). The table gives the prediction er-ror, i.e., the fraction of stories misclassified by the predic-tion algorithm. Misclassified stories include both storieswith more than 500 votes predicted to be unpopular (falsenegatives) and unpopular stories predicted to receive morethan 500 votes (false positives).
We also compare with direct extrapolation from theearly votes. In this procedure, with v votes observed attime t, we extrapolate to vtfinal/t, where we take tfinal to be72 hours since submission, a time by which stories haveaccumulated all, or nearly all, the votes they will ever get.We use a least squares linear fit between these observedand extrapolated values. A pairwise bootstrap test indi-cates the model has a lower prediction error than this ex-trapolation with p-value of 10−2.
This extrapolation method is similar to that used to pre-dict final votes from the early votes [54], but with two dif-ferences: 1) we consider a fixed number of votes v (e.g.,10) and, for each story, extrapolate from the time t re-quired for that story to acquire v votes (instead of the op-posite choice of considering a fixed prediction time t and,for each story, extrapolating from the number of votes thatstory has at that time), and 2) we use early votes aftersubmission (i.e., including when the story is upcoming,where the social network has a large effect) instead ofearly votes after promotion.
In the case of prediction based on the first 10 votes,which is before the stories are promoted, an additionalquestion is how well the model predicts whether the storywill eventually be promoted. We find a 25% error rate inpredicting promotion based on the first 10 votes.
We can improve predictions from early votes by us-
log-likelihood
log-likelihood + log-prior
0.001 0.005 0.010 0.050 0.100 0.500 1.000-2
-1
0
1
2
3
4
5
rF
a story with no fan votes
Figure 20: Comparison of log-likelihood (i.e.,logP (r|votes)) and log-likelihood plus log(Pprior(r))for estimating rF for a story with no fan votes. Themaximum of the log-likelihood is at rF = 0 while themaximum with the prior is rF = 0.086.
ing the lognormal distributions of rF and rN , shown inFig. 16, as the prior probability to combine with the like-lihood from the observations according to Bayes theorem.Specifically, instead of maximizing the likelihood of theobserved votes, P (r|votes), as discussed above, this ap-proaches maximizes the posterior probability, which isproportional to P (r|votes)Pprior(r) where Pprior is takento be the lognormal distribution Plognormal in Eq. (9) withparameters from the fits shown in Fig. 16.
This method gives little change in estimates of rN , dueto the relatively large number of non-fan votes on eachstory. However, using the prior makes large changes insome of the rF estimates, thereby avoiding the small num-ber of extreme predictions made by poor estimates. Usingthis prior to aid estimation is particularly significant whenthere are no votes by fans among the early votes, leadingto an estimate of rF = 0, but later a user with many fansvotes on the story. In this case, as illustrated in Fig. 20,using the lognormal as a prior gives a positive estimatefor rF , thereby predicting some votes by any subsequentusers who are fans of earlier voters.
By avoiding these extreme cases, this procedure im-proves the correlation between predicted and actual finalvotes, as well as the predicted rank ordering of the stories(i.e., relative popularity of stories ) as seen with a larger
22
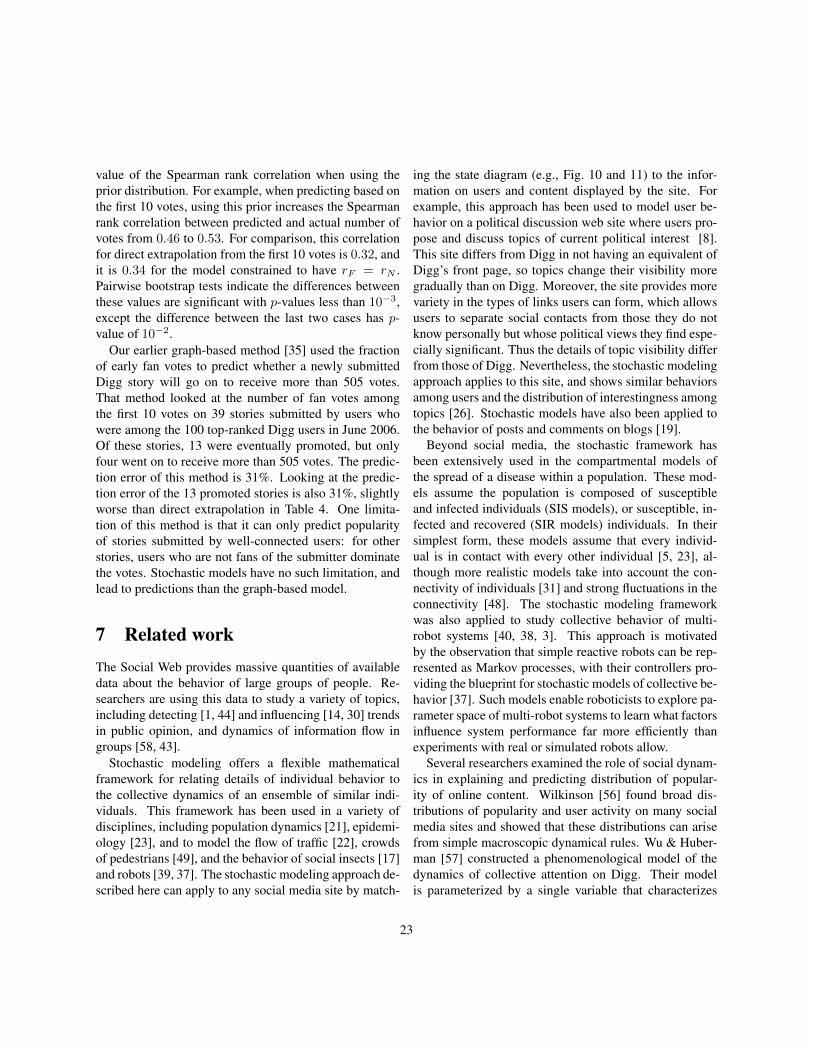
value of the Spearman rank correlation when using theprior distribution. For example, when predicting based onthe first 10 votes, using this prior increases the Spearmanrank correlation between predicted and actual number ofvotes from 0.46 to 0.53. For comparison, this correlationfor direct extrapolation from the first 10 votes is 0.32, andit is 0.34 for the model constrained to have rF = rN .Pairwise bootstrap tests indicate the differences betweenthese values are significant with p-values less than 10−3,except the difference between the last two cases has p-value of 10−2.
Our earlier graph-based method [35] used the fractionof early fan votes to predict whether a newly submittedDigg story will go on to receive more than 505 votes.That method looked at the number of fan votes amongthe first 10 votes on 39 stories submitted by users whowere among the 100 top-ranked Digg users in June 2006.Of these stories, 13 were eventually promoted, but onlyfour went on to receive more than 505 votes. The predic-tion error of this method is 31%. Looking at the predic-tion error of the 13 promoted stories is also 31%, slightlyworse than direct extrapolation in Table 4. One limita-tion of this method is that it can only predict popularityof stories submitted by well-connected users: for otherstories, users who are not fans of the submitter dominatethe votes. Stochastic models have no such limitation, andlead to predictions than the graph-based model.
7 Related workThe Social Web provides massive quantities of availabledata about the behavior of large groups of people. Re-searchers are using this data to study a variety of topics,including detecting [1, 44] and influencing [14, 30] trendsin public opinion, and dynamics of information flow ingroups [58, 43].
Stochastic modeling offers a flexible mathematicalframework for relating details of individual behavior tothe collective dynamics of an ensemble of similar indi-viduals. This framework has been used in a variety ofdisciplines, including population dynamics [21], epidemi-ology [23], and to model the flow of traffic [22], crowdsof pedestrians [49], and the behavior of social insects [17]and robots [39, 37]. The stochastic modeling approach de-scribed here can apply to any social media site by match-
ing the state diagram (e.g., Fig. 10 and 11) to the infor-mation on users and content displayed by the site. Forexample, this approach has been used to model user be-havior on a political discussion web site where users pro-pose and discuss topics of current political interest [8].This site differs from Digg in not having an equivalent ofDigg’s front page, so topics change their visibility moregradually than on Digg. Moreover, the site provides morevariety in the types of links users can form, which allowsusers to separate social contacts from those they do notknow personally but whose political views they find espe-cially significant. Thus the details of topic visibility differfrom those of Digg. Nevertheless, the stochastic modelingapproach applies to this site, and shows similar behaviorsamong users and the distribution of interestingness amongtopics [26]. Stochastic models have also been applied tothe behavior of posts and comments on blogs [19].
Beyond social media, the stochastic framework hasbeen extensively used in the compartmental models ofthe spread of a disease within a population. These mod-els assume the population is composed of susceptibleand infected individuals (SIS models), or susceptible, in-fected and recovered (SIR models) individuals. In theirsimplest form, these models assume that every individ-ual is in contact with every other individual [5, 23], al-though more realistic models take into account the con-nectivity of individuals [31] and strong fluctuations in theconnectivity [48]. The stochastic modeling frameworkwas also applied to study collective behavior of multi-robot systems [40, 38, 3]. This approach is motivatedby the observation that simple reactive robots can be rep-resented as Markov processes, with their controllers pro-viding the blueprint for stochastic models of collective be-havior [37]. Such models enable roboticists to explore pa-rameter space of multi-robot systems to learn what factorsinfluence system performance far more efficiently thanexperiments with real or simulated robots allow.
Several researchers examined the role of social dynam-ics in explaining and predicting distribution of popular-ity of online content. Wilkinson [56] found broad dis-tributions of popularity and user activity on many socialmedia sites and showed that these distributions can arisefrom simple macroscopic dynamical rules. Wu & Huber-man [57] constructed a phenomenological model of thedynamics of collective attention on Digg. Their modelis parameterized by a single variable that characterizes
23
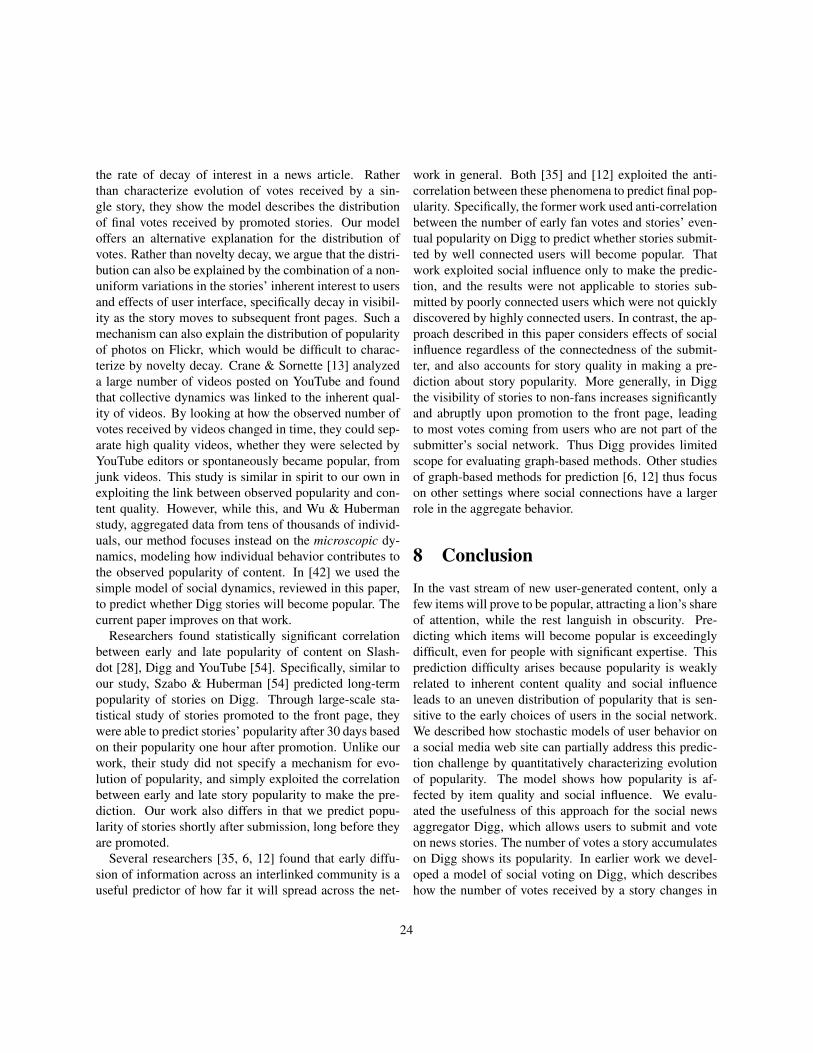
the rate of decay of interest in a news article. Ratherthan characterize evolution of votes received by a sin-gle story, they show the model describes the distributionof final votes received by promoted stories. Our modeloffers an alternative explanation for the distribution ofvotes. Rather than novelty decay, we argue that the distri-bution can also be explained by the combination of a non-uniform variations in the stories’ inherent interest to usersand effects of user interface, specifically decay in visibil-ity as the story moves to subsequent front pages. Such amechanism can also explain the distribution of popularityof photos on Flickr, which would be difficult to charac-terize by novelty decay. Crane & Sornette [13] analyzeda large number of videos posted on YouTube and foundthat collective dynamics was linked to the inherent qual-ity of videos. By looking at how the observed number ofvotes received by videos changed in time, they could sep-arate high quality videos, whether they were selected byYouTube editors or spontaneously became popular, fromjunk videos. This study is similar in spirit to our own inexploiting the link between observed popularity and con-tent quality. However, while this, and Wu & Hubermanstudy, aggregated data from tens of thousands of individ-uals, our method focuses instead on the microscopic dy-namics, modeling how individual behavior contributes tothe observed popularity of content. In [42] we used thesimple model of social dynamics, reviewed in this paper,to predict whether Digg stories will become popular. Thecurrent paper improves on that work.
Researchers found statistically significant correlationbetween early and late popularity of content on Slash-dot [28], Digg and YouTube [54]. Specifically, similar toour study, Szabo & Huberman [54] predicted long-termpopularity of stories on Digg. Through large-scale sta-tistical study of stories promoted to the front page, theywere able to predict stories’ popularity after 30 days basedon their popularity one hour after promotion. Unlike ourwork, their study did not specify a mechanism for evo-lution of popularity, and simply exploited the correlationbetween early and late story popularity to make the pre-diction. Our work also differs in that we predict popu-larity of stories shortly after submission, long before theyare promoted.
Several researchers [35, 6, 12] found that early diffu-sion of information across an interlinked community is auseful predictor of how far it will spread across the net-
work in general. Both [35] and [12] exploited the anti-correlation between these phenomena to predict final pop-ularity. Specifically, the former work used anti-correlationbetween the number of early fan votes and stories’ even-tual popularity on Digg to predict whether stories submit-ted by well connected users will become popular. Thatwork exploited social influence only to make the predic-tion, and the results were not applicable to stories sub-mitted by poorly connected users which were not quicklydiscovered by highly connected users. In contrast, the ap-proach described in this paper considers effects of socialinfluence regardless of the connectedness of the submit-ter, and also accounts for story quality in making a pre-diction about story popularity. More generally, in Diggthe visibility of stories to non-fans increases significantlyand abruptly upon promotion to the front page, leadingto most votes coming from users who are not part of thesubmitter’s social network. Thus Digg provides limitedscope for evaluating graph-based methods. Other studiesof graph-based methods for prediction [6, 12] thus focuson other settings where social connections have a largerrole in the aggregate behavior.
8 ConclusionIn the vast stream of new user-generated content, only afew items will prove to be popular, attracting a lion’s shareof attention, while the rest languish in obscurity. Pre-dicting which items will become popular is exceedinglydifficult, even for people with significant expertise. Thisprediction difficulty arises because popularity is weaklyrelated to inherent content quality and social influenceleads to an uneven distribution of popularity that is sen-sitive to the early choices of users in the social network.We described how stochastic models of user behavior ona social media web site can partially address this predic-tion challenge by quantitatively characterizing evolutionof popularity. The model shows how popularity is af-fected by item quality and social influence. We evalu-ated the usefulness of this approach for the social newsaggregator Digg, which allows users to submit and voteon news stories. The number of votes a story accumulateson Digg shows its popularity. In earlier work we devel-oped a model of social voting on Digg, which describeshow the number of votes received by a story changes in
24
time. In that model, knowing how interesting a story is tothe user community, on average, and how connected thesubmitter is fully determines the evolution of the story’svotes. This leads to an insight that a model can be usedto predict story’s popularity from the initial reaction ofusers to it. Specifically, we use observations of evolutionof the number of votes received by a story shortly aftersubmission to estimate how interesting it is, and then usethe model to predict how many votes the story will getafter a period of a few days. Model-based prediction out-performs other methods that exploit social influence only,and also correlation between early and late votes receivedby stories. We improved prediction by developing a morefine-grained model that differentiates between how inter-esting a story is to fans and to the general population.
These results demonstrate the applicability of thestochastic approach to social media, in spite of the largevariations in user participation and interestingness of thecontent. One interesting open question is the nature ofthe social influence on user behavior. In our model, theinfluence has two components: increased visibility of astory to fans due to the friends interface and the higher in-terestingness of the story to fans. This higher interesting-ness could be due to self-selection, whereby users becomefans of people whose submissions or votes are of partic-ular interest. Alternatively, users could be directly influ-enced by the activities of others [52], with the possibil-ity that this influence depends not just on whether friendsvote on a story but also how many friends do so [10].Other challenging open questions including identifyingcommon mechanisms underlying the observed regulari-ties, accounting for time-dependent changes in the website and user community, and extending the approach to awider variety of web sites.
References
[1] E. Adar, L. Zhang, L. A. Adamic, and R. M. Lukose.Implicit structure and the dynamics of blogspace. InWorkshop on the Weblogging Ecosystem, 13th Inter-national World Wide Web Conference, 2004.
[2] Nitin Agarwal, Huan Liu, Lei Tang, and Philip S.Yu. Identifying the influential bloggers in a com-munity. In WSDM ’08: Proceedings of the inter-
national conference on Web search and web datamining, pages 207–218, New York, NY, USA, 2008.ACM.
[3] W. Agassounon, A. Martinoli, and K. Easton.Macroscopic Modeling of Aggregation Experimentsusing Embodied Agents in Teams of Constant andTime-Varying Sizes. Autonomous Robots, 17(2-3):163–191, 2004.
[4] Chris Anderson. The Long Tail: Why the Future ofBusiness is Selling Less of More. Hyperion, 2006.
[5] Norman Bailey. The Mathematical Theory of Infec-tious Diseases and its Applications. Griffin, London,1975.
[6] E. Bakshy, B. Karrer, and L. A. Adamic. Social in-fluence and the diffusion of user-created content. InEC ’09: Proc. 10th ACM conference on Electroniccommerce, pages 325–334, 2009.
[7] Albert-Laszlo Barabasi. The origin of bursts andheavy tails in human dynamics. Nature, 435:207–211, May 2005.
[8] Michael J. Brzozowski, Tad Hogg, and Gabor Sz-abo. Friends and foes: Ideological social network-ing. In Proc. of the SIGCHI Conference on HumanFactors in Computing (CHI2008), pages 817–820,NY, 2008. ACM Press.
[9] M. G. Bulmer. On fitting the Poisson lognormaldistribution to species-abundance data. Biometrics,30:101–110, 1974.
[10] Damon Centola. The spread of behavior in an on-line social network experiment. Science, 329:1194–1197, 2010.
[11] Aaron Clauset, Cosma Rohilla Shalizi, and M. E. J.Newman. Power-law distributions in empirical data.SIAM Review, 51:661–703, 2009.
[12] Richard Colbaugh and Kristin Glass. Early warninganalysis for social diffusion events. In Proceedingsof IEEE International Conferences on Intelligenceand Security Informatics, 2010.
25
[13] R. Crane and D. Sornette. Viral, quality, and junkvideos on youtube: Separating content from noisein an information-rich environment. In Proc. ofAAAI symposium on Social Information Processing,Menlo Park, CA, 2008. AAAI.
[14] P. Domingos and M. Richardson. Mining the net-work value of customers. In Proc. of KDD, 2001.
[15] Bradley Efron. Bootstrap methods: Another look atthe jackknife. Annals of Statistics, 7:1–26, 1979.
[16] Stephen P. Ellner and John Guckenheimer. DynamicModels in Biology. Princeton Univ. Press, Princeton,NJ, 2006.
[17] Nigel R. Franks, Stephen C. Pratt, Eamonn B. Mal-lon, Nicholas F. Britton, and David J. T. Sumpter. In-formation flow, opinion polling and collective intel-ligence in house-hunting social insects. Philos TransR Soc Lond B Biol Sci, 357(1427):1567–1583, Nov2002.
[18] Vicente Gomez, Andreas Kaltenbrunner, and Vi-cente Lopez. Statistical analysis of the social net-work and discussion threads in Slashdot. In WWW’08: Proceeding of the 17th international confer-ence on World Wide Web, pages 645–654, NewYork, NY, USA, 2008. ACM.
[19] Michaela Gotz, Jure Leskovec, Mary McGlohon,and Christos Faloutsos. Modeling blog dynamics. InProc. of the Third International Conference on We-blogs and Social Media (ICWSM2009), pages 26–33. AAAI, 2009.
[20] Daniel Gruhl, R. Guha, Ravi Kumar, Jasmine No-vak, and Andrew Tomkins. The predictive powerof online chatter. In KDD ’05: Proceedings of theeleventh ACM SIGKDD international conference onKnowledge discovery in data mining, pages 78–87,New York, NY, USA, 2005. ACM.
[21] Richard Haberman. Mathematical Models: Me-chanical Vibrations, Population Dynamics, andTraffic Flow. Classics in Applied Mathematics. So-ciety for Industrial Mathematics, 1987.
[22] Dirk Helbing. Traffic and related self-driven many-particle systems. Reviews of Modern Physics,73(4):1067–1141, December 2001.
[23] Herbert W. Hethcote. The Mathematics of InfectiousDiseases. SIAM REVIEW, 42(4):599–653, 2000.
[24] Joseph M. Hilbe. Negative Binomial Regression.Cambridge Univ. Press, 2008.
[25] Tad Hogg and Kristina Lerman. Stochastic modelsof user-contributory web sites. In Proceedings ofthe Third International Conference on Weblogs andSocial Media (ICWSM2009), pages 50–57, 2009.
[26] Tad Hogg and Gabor Szabo. Diversity of user ac-tivity and content quality in online communities. InProc. of the Third International Conference on We-blogs and Social Media (ICWSM2009), pages 58–65. AAAI, 2009.
[27] Bernardo A. Huberman, Peter L. T. Pirolli, James E.Pitkow, and Rajan M. Lukose. Strong regularities inWorld Wide Web surfing. Science, 280:95–97, 1998.
[28] A. Kaltenbrunner, V. Gomez, and V. Lopez. De-scription and prediction of slashdot activity. In Proc.5th Latin American Web Congress (LA-WEB 2007),2007.
[29] N. G. Van Kampen. Stochastic Processes in Physicsand Chemistry. Elsevier Science, Amsterdam, re-vised and enlarged edition, 1992.
[30] David Kempe, Jon Kleinberg, and Eva Tardos. Max-imizing the spread of influence through a socialnetwork. In KDD ’03: Proceedings of the ninthACM SIGKDD international conference on Knowl-edge discovery and data mining, pages 137–146,New York, NY, USA, 2003. ACM.
[31] Jeffrey O. Kephart and Steve R. White. Directed-graph epidemiological models of computer viruses.Security and Privacy, IEEE Symposium on, 0:343,1991.
[32] A. Kittur, E. Chi, Bryan A. Pendleton, BongwonSuh, and T. Mytkowicz. Power of the few vs. wis-dom of the crowd: Wikipedia and the rise of the
26
bourgeoisie. In Proceedings of World Wide WebConference, 2006.
[33] K. Lerman. Social information processing in socialnews aggregation. IEEE Internet Computing: spe-cial issue on Social Search, 11(6):16–28, 2007.
[34] K. Lerman. Social networks and social informationfiltering on digg. In Proc. of International Con-ference on Weblogs and Social Media (ICWSM-07),2007.
[35] K. Lerman and A. Galstyan. Analysis of social vot-ing patterns on digg. In Proceedings of the 1st ACMSIGCOMM Workshop on Online Social Networks,2008.
[36] K. Lerman and L. Jones. Social browsing on flickr.In Proc. of International Conference on Weblogs andSocial Media (ICWSM-07), 2007.
[37] K. Lerman, A. Martinoli, and A. Galstyan. A re-view of probabilistic macroscopic models for swarmrobotic systems. In Sahin E. and Spears W., editors,Swarm Robotics Workshop: State-of-the-art Survey,number 3342 in LNCS, pages 143–152. Springer-Verlag, Berlin Heidelberg, 2005.
[38] Kristina Lerman and Aram Galstyan. Mathematicalmodel of foraging in a group of robots: Effect ofinterference. Autonomous Robots, 13(2):127–141,2002.
[39] Kristina Lerman, Aram Galstyan, A. Martinoli, andA. Ijspeert. A macroscopic analytical model of col-laboration in distributed robotic systems. ArtificialLife Journal, 7(4):375–393, 2001.
[40] Kristina Lerman, Aram Galstyan, A. Martinoli, andA. Ijspeert. A macroscopic analytical model of col-laboration in distributed robotic systems. ArtificialLife Journal, 7(4):375–393, 2001.
[41] Kristina Lerman and Rumi Ghosh. Information con-tagion: an empirical study of spread of news ondigg and twitter social networks. In Proceedings of4th International Conference on Weblogs and SocialMedia (ICWSM), May 2010.
[42] Kristina Lerman and Tad Hogg. Using a model ofsocial dynamics to predict popularity of news. InProceedings of 19th International World Wide WebConference (WWW), 2010.
[43] J. Leskovec, L. Adamic, and B. Huberman. The dy-namics of viral marketing. ACM Transactions on theWeb, 1(1), 2007.
[44] Jure Leskovec, Andreas Krause, Carlos Guestrin,Christos Faloutsos, Jeanne Vanbriesen, and NatalieGlance. Cost-effective outbreak detection in net-works. In KDD ’07: Proceedings of the 13th ACMSIGKDD international conference on Knowledgediscovery and data mining, pages 420–429, NewYork, NY, USA, 2007. ACM.
[45] J. O. Lloyd-Smith, S. J. Schreiber, P. E. Kopp, andW. M. Getz. Superspreading and the effect of in-dividual variation on disease emergence. Nature,438:355–359, 2005.
[46] Guthrie Miller. Statistical modelling of Poisson/log-normal data. Radiation Protection Dosimetry,124:155–163, 2007.
[47] Michael Mitzenmacher. A brief history of generativemodels for power law and lognormal distributions.Internet Mathematics, 1:226–251, 2004.
[48] Y. Moreno, R. Pastor-Satorras, and A. Vespignani.Epidemic outbreaks in complex heterogeneous net-works. The European Physical Journal B - Con-densed Matter and Complex Systems, 26(4):521–529, April 2002.
[49] Mehdi Moussaıd, Dirk Helbing, and Guy Ther-aulaz. How simple rules determine pedestrian be-havior and crowd disasters. Proceedings of theNational Academy of Sciences, 108(17):6884–6888,April 2011.
[50] Manfred Opper and David Saad, editors. AdvancedMean Field Methods: Theory and Practice. MITPress, Cambridge, MA, 2001.
[51] S. Redner. Random multiplicative processes: Anelementary tutorial. American Journal of Physics,58:267–273, 1990.
27
[52] M.J. Salganik, P.S. Dodds, and D.J. Watts. Experi-mental study of inequality and unpredictability in anartificial cultural market. Science, 311:854, 2006.
[53] Didier Sornette. Critical Phenomena in Natural Sci-ences: Chaos, Fractals, Selforganization and Dis-order: Concepts and Tools. Springer, Berlin, 2ndedition, 2004.
[54] Gabor Szabo and Bernardo A. Huberman. Predict-ing the popularity of online content. Communica-tions of the ACM, 53(8):80–88, 2010.
[55] A. Vazquez, J. G. Oliveira, Z. Dezso, K.-I. Goh,I. Kondor, and A.-L. Barabasi. Modeling burstsand heavy tails in human dynamics. Phys. Rev. E,73(3):036127+, March 2006.
[56] Dennis M. Wilkinson. Strong regularities in onlinepeer production. In EC ’08: Proceedings of the9th ACM conference on Electronic commerce, pages302–309, New York, NY, USA, 2008. ACM.
[57] Fang Wu and Bernardo A. Huberman. Noveltyand collective attention. Proceedings of the Na-tional Academy of Sciences, 104(45):17599–17601,November 2007.
[58] Fang Wu, Bernardo A. Huberman, Lada A. Adamic,and Joshua R. Tyler. Information flow in socialgroups. Physica A: Statistical and TheoreticalPhysics, 337(1-2):327–335, June 2004.
28


![The Ecology of Digg: Niches and Reciprocity in a Social ... · Digg. In this paper we will focus on Digg, the least studied of the three (although see [20], [21], [23]). In a nutshell,](https://img.pdfslide.net/doc/110x75/5f543998cfeb2b008a333dc9/the-ecology-of-digg-niches-and-reciprocity-in-a-social-digg-in-this-paper.jpg)