Embed Size (px)
Citation preview
Getting Techy
• Lowering Resistance
• Increasing Power
• Improving Efficiency
• Monitoring Performance

Wetsuits• Benefits:
– Floats body higher in water
– Insolation, lowers cold water
shock,
– 3-7 % speed increase
– Biggest help to weak swimmers
and people with low body fat
• Negatives:
– overheat in warm races
– Hard to get off in T1
– Hard to feel the water
• Types
– Full length
– Sleeveless (Farmer John)• 1% slower, cooler, easy to get in/out
– Speed suit• For non legal wetsuit swims

Drafting
• 18-25% improvement!
– Next to their hip is most
efficient behind the bow
wave
– directly behind them if
they are not kicking
– Stay on lee side if
possible
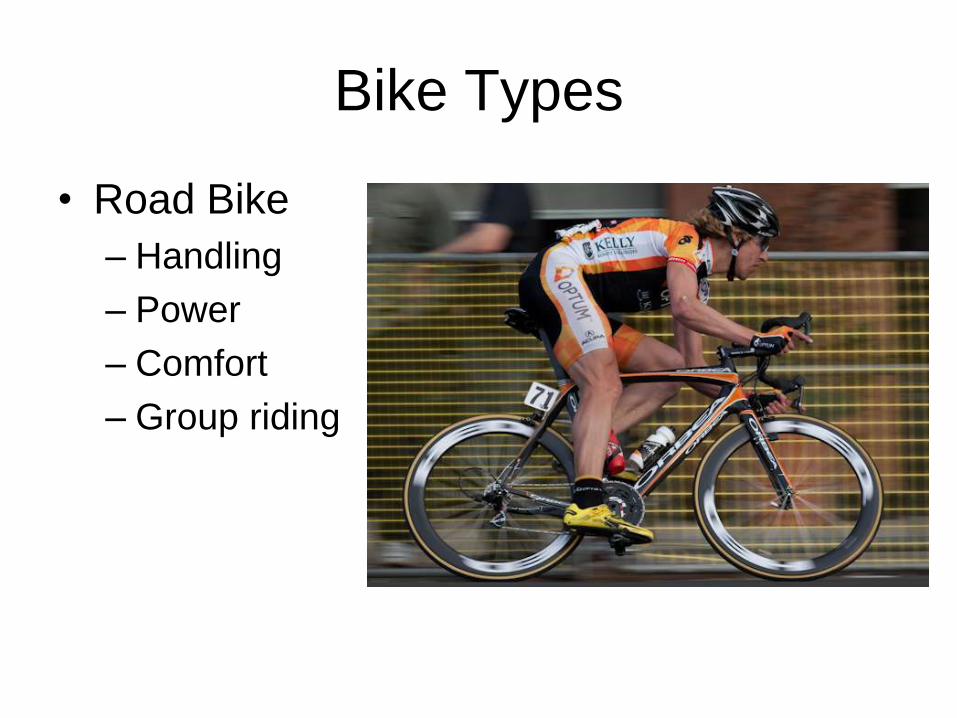
Bike Types
• Road Bike
– Handling
– Power
– Comfort
– Group riding

Bike Types
Road bike with aero bars
- Support body
- Faster
- Shifting issue
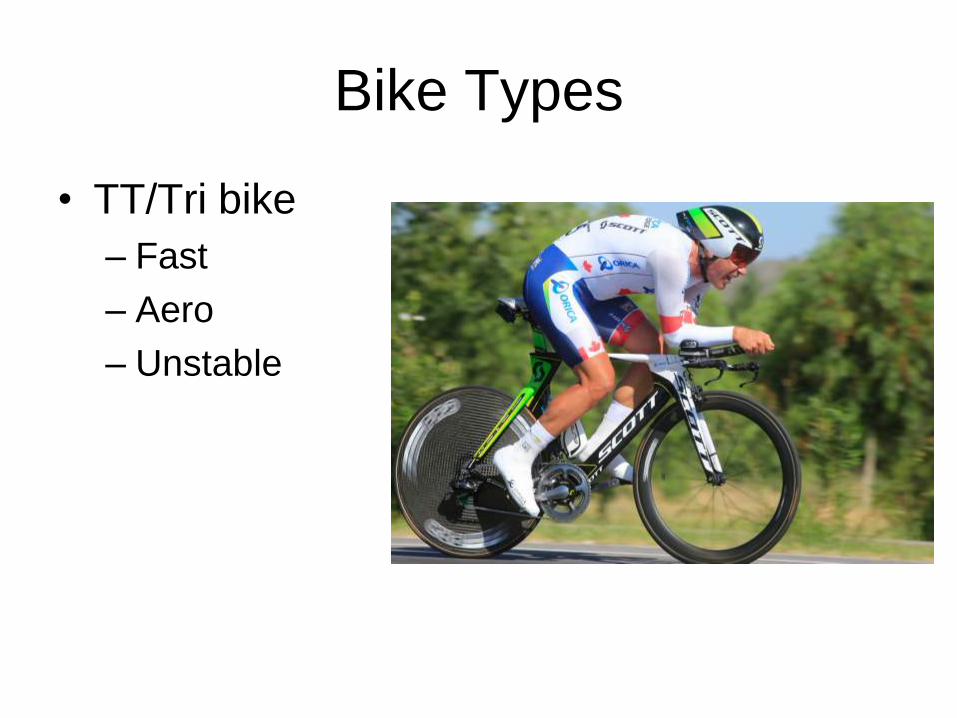
Bike Types
• TT/Tri bike
– Fast
– Aero
– Unstable

Biking Form
1. Your form is a balance of Aerodynamics vs Comfort vs Power.
2. Aerodynamic is not just important for the fast biker. Slower bikers spend more time on
the course and the benefits add up.
3. Body take time to adapt to more aggressive positions.

Air resistance
• Air drag is major resistance
above 10-12 mph
• At race speeds 70-88% of drag
is air resistance
• Body takes 65-80% of the total
drag at race speed.
• Drag is not linear but goes up
at a cubic rate with speed
• Aerodynamics goal
– Decrease frontal surface area
– Smooth the flow of air.
– Retain as much power and
comfort in the position.
0
2
4
6
8
10
12
1 2 3 4 5
TT
ROAD
Friction
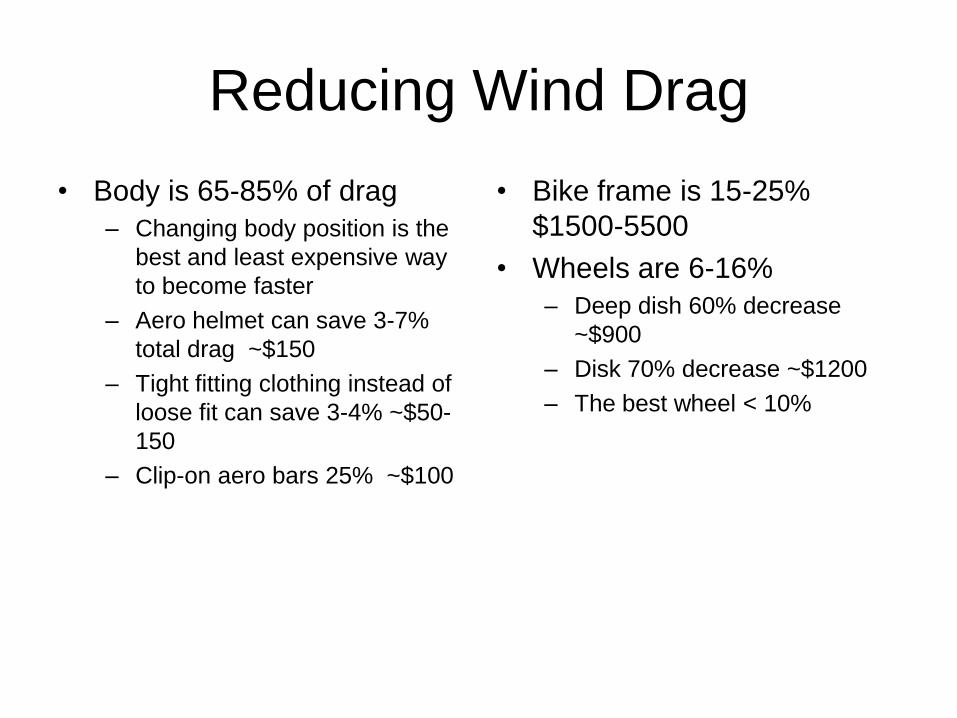
Reducing Wind Drag
• Body is 65-85% of drag
– Changing body position is the
best and least expensive way
to become faster
– Aero helmet can save 3-7%
total drag ~$150
– Tight fitting clothing instead of
loose fit can save 3-4% ~$50-
150
– Clip-on aero bars 25% ~$100
• Bike frame is 15-25%
$1500-5500
• Wheels are 6-16%
– Deep dish 60% decrease
~$900
– Disk 70% decrease ~$1200
– The best wheel < 10%

Rolling Resistance
• Each tire takes can take 10-30
watts to move depending on
tire material, inflation, and
weight load.
• Tire inflation
– Most tires work best between 90-
120 psi.
– Lower pressure for wet roads
– Over inflation does not let the tire
deform over bumps. This hurts
traction and slows you down.
– Front tire should be ~5 psi lower
then rear to help turning
– Too low of pressure and you can
pinch flat
• Training tires
– Made of thicker rubber, puncture
barrier
– Longer life 2000+ miles
– Fewer flats
• Race tires
– Light, supple, no puncture barrier
– Wear out quickly 500-1000 miles
– Can save 10-20 watts
– Easier to puncture
– Need to be watchful of road
• Risk vs. reward, you have to
decide how much of a risk you
are willing to take of puncturing
to go faster.
–

Case Study at Got Energy

Getting faster working less
• Updated tires
• Updated bike
• Updated body
position
– Lower body
– Moved arms in
– Form fitting jersey
• year 2011 2012
• norm 273 264
• avg 259 252
• mph 22.7 24.0
Net: 7-9 watts less work
to go 1.3 mph faster

Cadence
• Slower 50-80 rpm• Recruit fast twitch muscles
that burn glycogen stores
• Muscles are depleted for
the run
• Feels harder
• Higher stress on joints
• Stress muscle system vs
cardiovascular and
respiratory
• Fast 80-100 rpm• Use slow twitch muscles
that burn mostly fat
• Can have similar cadence
as run (85-90)
• Lower perceived effort
• Become more efficient at
high intensity
• Become inefficient at very
high cadence
• Stress cardiovascular and
respiratory systems more
then muscle system

Gearing
• Run out of gears
– climbing
– descending
– tailwind
• Important to have the right
gear ratio for the race terrain.
Brice Prairie vs. IM Wisconsin
• Standard Crank 53 X 39– Gives high end speed 35+
– Not great to climb without a
bigger rear cassette.
– Requires strong power to weight
ratio
• Compact Crank 50 X 34– Easier to climb with
– With new cassettes still give
good top end speed for most
races
• Rear Cassette – Old style 12-23, 25, 27
– New 11-23, 25, 27, 28, 29
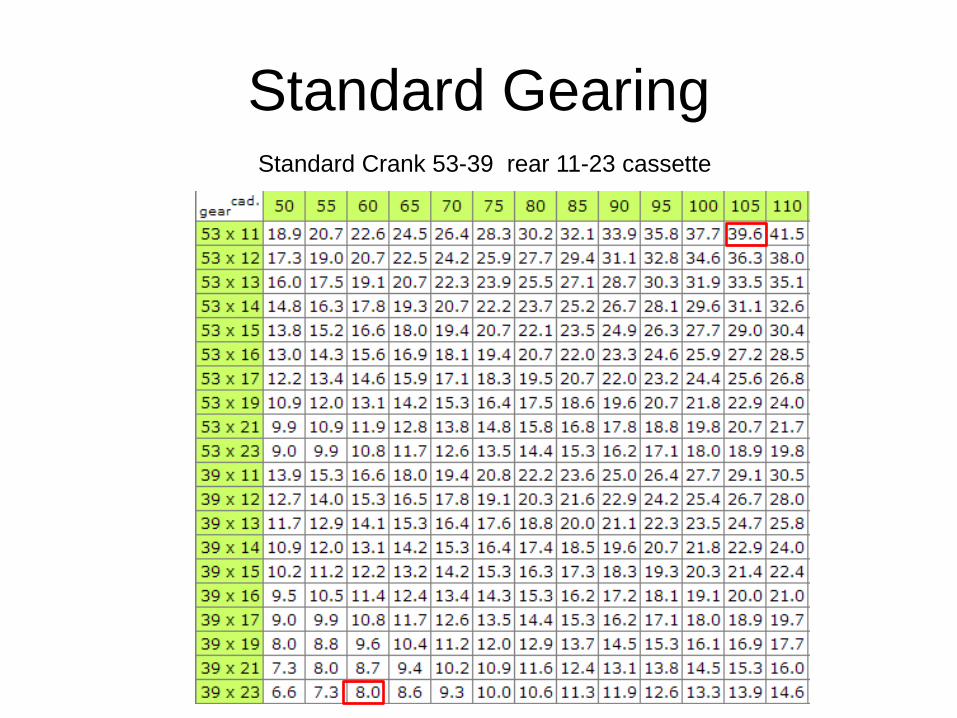
Standard GearingStandard Crank 53-39 rear 11-23 cassette

Granny GearingStandard Crank 53-39 rear 11-28 cassette

Pedaling
• Pedal Efficiency
• Zone 1 12-5 o’clock
– Power zone everyone does
this well
• Zone 2 5-8 o’clock
– Keep force by pulling through.
– think scraping mud off
• Zone 3 8-12 o’clock
– Unweight leg as it come up. This
is harder the more aero you are.
Don’t let your leg be dead weight
• Increased efficiency
– Studies showed a full stroke vs.
down only increased power 57-
87% with using more muscle
groups and added efficiency.
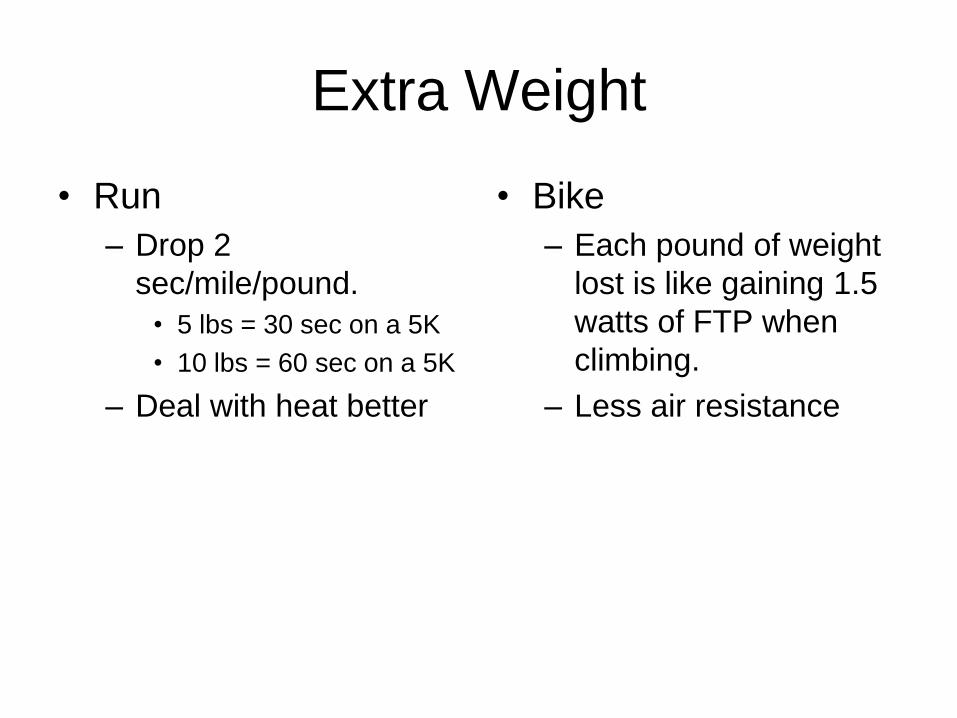
Extra Weight
• Run
– Drop 2
sec/mile/pound.
• 5 lbs = 30 sec on a 5K
• 10 lbs = 60 sec on a 5K
– Deal with heat better
• Bike
– Each pound of weight
lost is like gaining 1.5
watts of FTP when
climbing.
– Less air resistance
Tech to train and race better
• How do you
– Find your race pace
– Hold that pace over
different conditions
– Train smarter
– Learn from your
mistakes
• What to measure
– Perceived effort
– Mph/pace
– Heart rate
– Generated power

Run pacing using GPS
• Benefit
– Gives consistent pacing
with instant feedback
– Do interval training
anywhere. Don’t need a
measured track.
– Use tools like VDOT for
pace guidance
– Able to test and recalibrate
your training zones as you
get stronger
– Store races and training
runs to review
• Negates
– Pacing on hills is hard with
only MPH
– Can take time to acquire
satellites in T2
– Tools
– Garmin Forerunner series
– Garmin 310XT/910XT (tri
design to be used for
swim, bike, and run)
– Nike+ SportWatch

Minimalistic Pacing Strategy
• Perceived effort
– Must be in tune with their body
– Have to fight adrenaline rush at the start
– Physical/Mental peaks and valleys during a race
– Very few people can accurately do this
• MPH on bike
– Influenced by everything, wind, elevation
changes, tires, road….
– Both are impossible to review afterwards to see
how you did
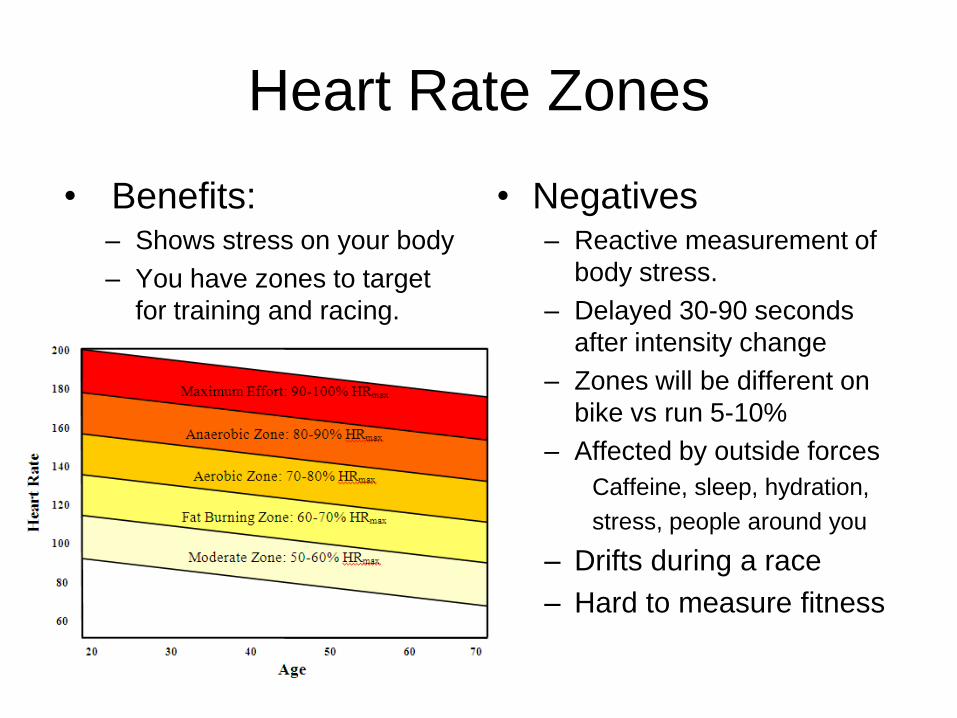
Heart Rate Zones
• Benefits:– Shows stress on your body
– You have zones to target
for training and racing.
• Negatives– Reactive measurement of
body stress.
– Delayed 30-90 seconds
after intensity change
– Zones will be different on
bike vs run 5-10%
– Affected by outside forces
Caffeine, sleep, hydration,
stress, people around you
– Drifts during a race
– Hard to measure fitness

Power (watts)
• Benefit:
– Measures how hard
your body is working
– Not affected by
outside stimulus
– Changes in fitness
levels can be
measured and
charted.
– You can use data from
others.
• Negatives
– Expensive $1000
– Information overload
at the start
– Requires learning new
ways to train and race
– Only used on the bike

Power Measurements
• Power
– Power you are exerting on your
crank or wheel. Measured in
watts
• Threshold power (FTP)
– Max power you can hold for 1
hour
• Intensity factor (IF)
– Average power of a ride divided
by FTP
• Training stress score
(TSS)
– Adding intensity factor of a ride.
– How much stress you had in a
ride based on your current FTP
• Normalized power (NP)
– Average power taking into
affect metabolic cost. More
accurate then average
power as it penalized
harder efforts.
• Variable index (VI)
– Normalized power divided by
average. Shows how steady you
rode. Below 1.05 is considered a
well paced.
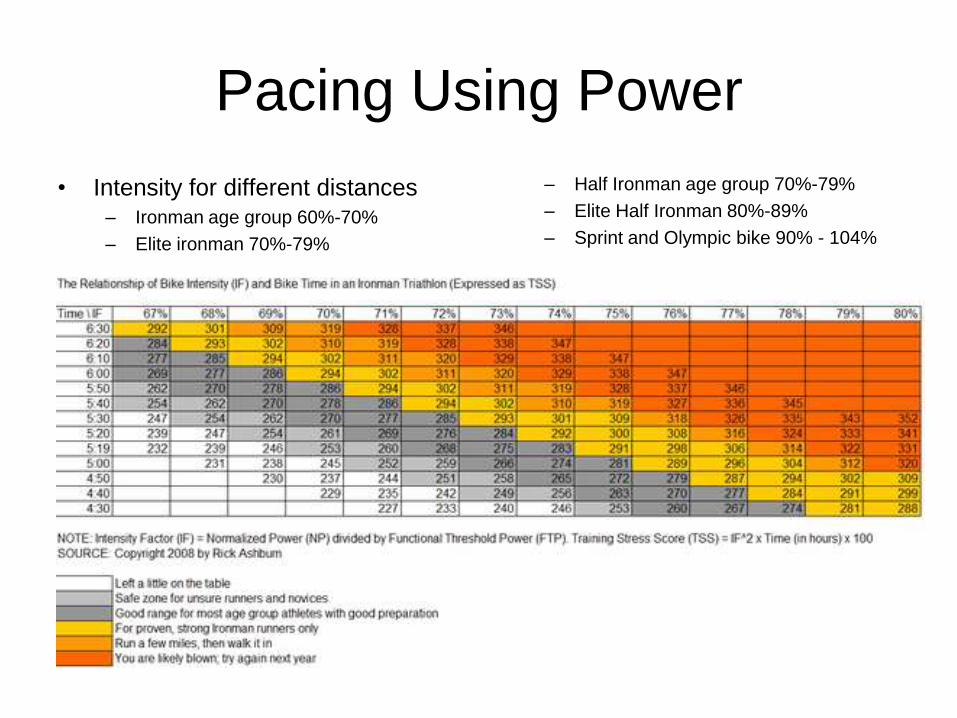
Pacing Using Power
• Intensity for different distances– Ironman age group 60%-70%
– Elite ironman 70%-79%
– Half Ironman age group 70%-79%
– Elite Half Ironman 80%-89%
– Sprint and Olympic bike 90% - 104%

Pacing on a hill

Hill Pacing Guidelines
• power to weight rules on hills.
Climbing is done at a slow
speed. Get out of the aero
position and open up you
chest and get as straight as
possible. Move back on your
seat to be in your most
powerful position.
• Below 6 mph work well above
goal pace. Big return on
output with no wind resistance
• 6-12 mph work above goal
pace. Wind resistance is
minimal.
• 12-24 mph ride at goal pace
• 24-30 ride slightly below goal
pace. Most of energy is going
towards wind resistance.
• 30+ coast Majority of energy is
going to fight wind resistance.
Stay as aero as possible
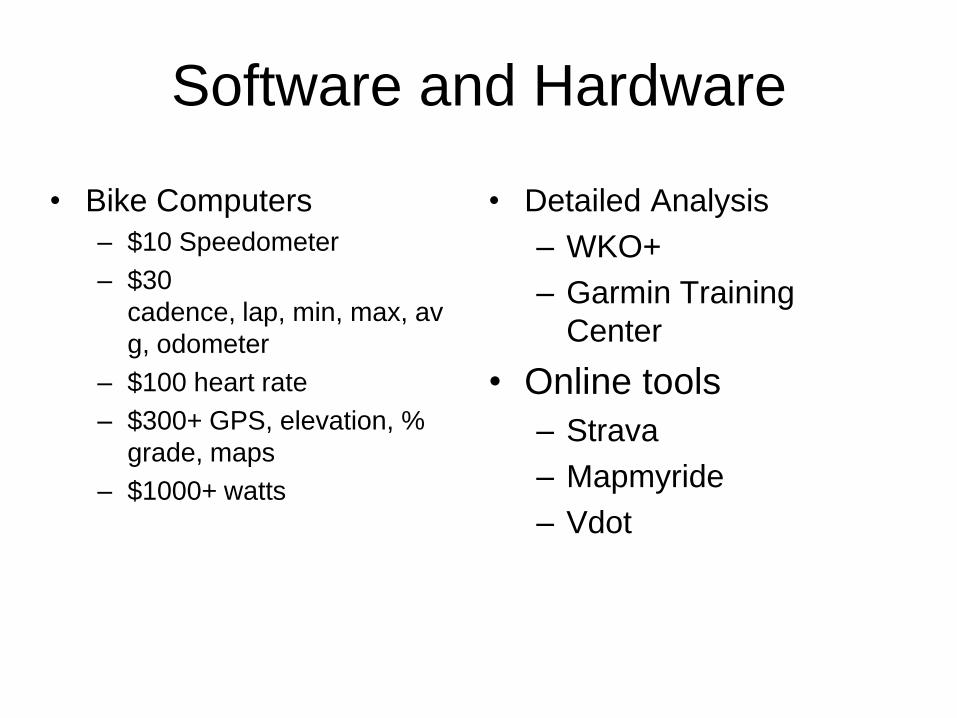
Software and Hardware
• Detailed Analysis
– WKO+
– Garmin Training
Center
• Online tools
– Strava
– Mapmyride
– Vdot
• Bike Computers
– $10 Speedometer
– $30
cadence, lap, min, max, av
g, odometer
– $100 heart rate
– $300+ GPS, elevation, %
grade, maps
– $1000+ watts

Strave

Strava Segment CTY II South

Garmin TC 5K race pacing

WKO+
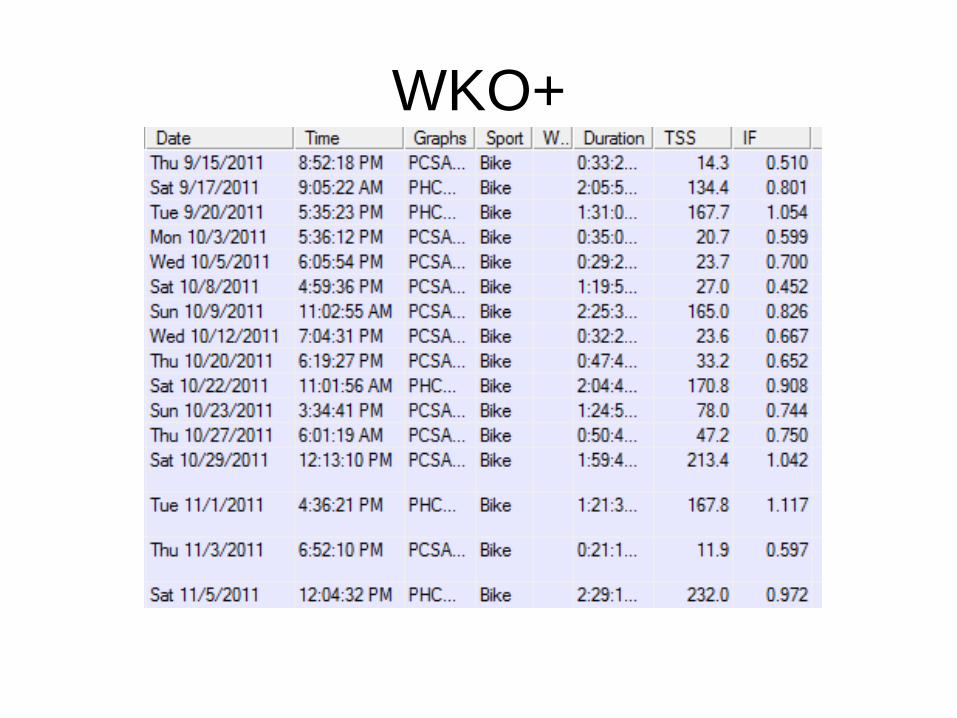
WKO+

WKO+ w/kg
5 second 30 second 5 min 20 min+

VDOT
Questions?