Embed Size (px)
Citation preview
5
Using the Web Browser Interface
Contents
Overview . . . . . . . . . . . . . . . . . . . . . . . . . . . . . . . . . . . . . . . . . . . . . . . . . . . . . . 5-2
General Features . . . . . . . . . . . . . . . . . . . . . . . . . . . . . . . . . . . . . . . . . . . . . . . 5-3
Starting a Web Browser Interface Session with the Switch . . . . . . . . . . . . 5-4
Using a Standalone Web Browser in a PC or UNIX Workstation . . . . 5-4
Using ProCurve Manager (PCM) or ProCurve Manager Plus (PCM+) . . . . . . . . . . . . . . . . . . . . . . . . . . . . . . . 5-5
Tasks for Your First Web Browser Interface Session . . . . . . . . . . . . . . . . . 5-7
Viewing the “First Time Install” Window . . . . . . . . . . . . . . . . . . . . . . . . 5-7
Creating Usernames and Passwords in the Browser Interface . . . . . . 5-8Using the Passwords . . . . . . . . . . . . . . . . . . . . . . . . . . . . . . . . . . . . 5-10Using the User Names . . . . . . . . . . . . . . . . . . . . . . . . . . . . . . . . . . . 5-10If You Lose a Password . . . . . . . . . . . . . . . . . . . . . . . . . . . . . . . . . . 5-11
Online Help for the Web Browser Interface . . . . . . . . . . . . . . . . . . . . 5-11
Support/Mgmt URLs Feature . . . . . . . . . . . . . . . . . . . . . . . . . . . . . . . . . . . . 5-12
Support URL . . . . . . . . . . . . . . . . . . . . . . . . . . . . . . . . . . . . . . . . . . . . . . 5-13
Help and the Management Server URL . . . . . . . . . . . . . . . . . . . . . . . . 5-13
Status Reporting Features . . . . . . . . . . . . . . . . . . . . . . . . . . . . . . . . . . . . . . . 5-15
The Overview Window . . . . . . . . . . . . . . . . . . . . . . . . . . . . . . . . . . . . . . 5-15
The Port Utilization and Status Displays . . . . . . . . . . . . . . . . . . . . . . . 5-16Port Utilization . . . . . . . . . . . . . . . . . . . . . . . . . . . . . . . . . . . . . . . . . 5-16Port Status . . . . . . . . . . . . . . . . . . . . . . . . . . . . . . . . . . . . . . . . . . . . . 5-18
The Alert Log . . . . . . . . . . . . . . . . . . . . . . . . . . . . . . . . . . . . . . . . . . . . . . 5-19Sorting the Alert Log Entries . . . . . . . . . . . . . . . . . . . . . . . . . . . . . 5-19Alert Types and Detailed Views . . . . . . . . . . . . . . . . . . . . . . . . . . . 5-20
The Status Bar . . . . . . . . . . . . . . . . . . . . . . . . . . . . . . . . . . . . . . . . . . . . . 5-22
Setting Fault Detection Policy . . . . . . . . . . . . . . . . . . . . . . . . . . . . . . . . 5-23
5-1
Using the Web Browser InterfaceOverview
Overview
The Web browser interface built into the switch lets you easily access the switch from a browser-based PC on your network. This lets you do the following:
■ Optimize your network uptime by using the Alert Log and other diagnostic tools
■ Make configuration changes to the switch
■ Maintain security by configuring usernames and passwords
This chapter covers the following:
■ General features (page 5-3).
■ Starting a web browser interface session (page 5-4)
■ Tasks for your first web browser interface session (page 5-7):
• Creating usernames and passwords in the web browser interface (page 5-8)
• Selecting the fault detection configuration for the Alert Log operation (page 5-23)
• Getting access to online help for the web browser interface (page 5-11)
■ Description of the web browser interface:
• Overview window and tabs (page 5-15)
• Port Utilization and Status displays (page 5-16)
• Alert Log and Alert types (page 5-19)
• Setting the Fault Detection Policy (page 5-23)
N o t e If you want security beyond that achieved with user names and passwords, you can disable access to the web browser interface. This is done by either executing no web-management at the Command Prompt or changing the Web Agent Enabled parameter setting to No (page 7-3).
5-2
Using the Web Browser InterfaceGeneral Features
General Features
The switch includes these web browser interface features:
Switch Configuration:
• Ports
• VLANs and Primary VLAN
• Fault detection
• Port monitoring (mirroring)
• System information
• Enable/Disable Multicast Filtering (IGMP) and Spanning Tree
• IP
• Stacking
• Support and management URLs
Switch Security: Usernames and passwords
Switch Diagnostics:
• Ping/Link Test
• Device reset
• Configuration report
Switch status
• Port utilization
• Port counters
• Port status
• Alert log
Switch system information listing
5-3
Using the Web Browser InterfaceStarting a Web Browser Interface Session with the Switch
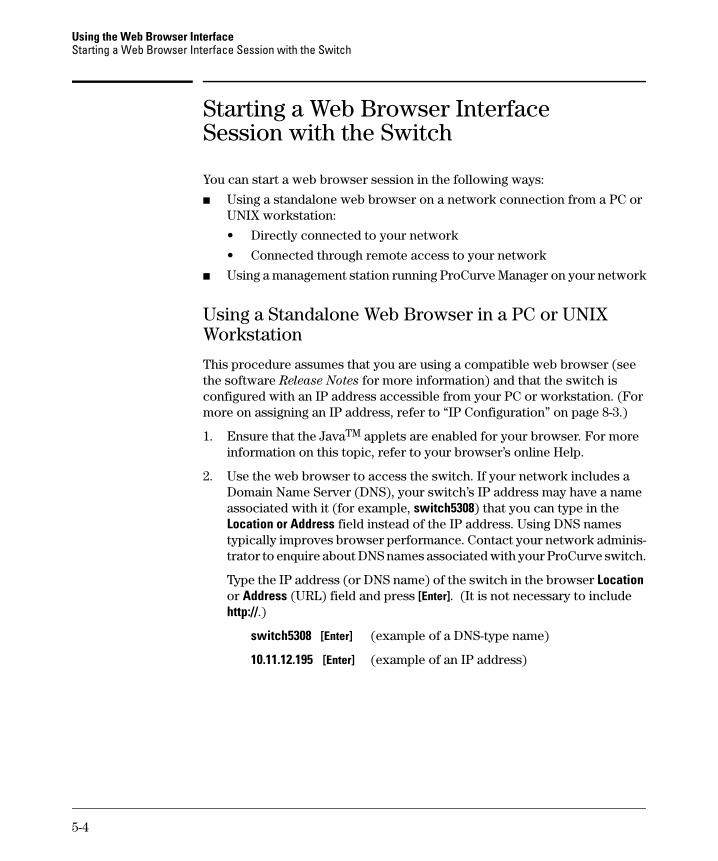
Starting a Web Browser Interface Session with the Switch
You can start a web browser session in the following ways:
■ Using a standalone web browser on a network connection from a PC or UNIX workstation:
• Directly connected to your network
• Connected through remote access to your network
■ Using a management station running ProCurve Manager on your network
Using a Standalone Web Browser in a PC or UNIX Workstation
This procedure assumes that you are using a compatible web browser (see the software Release Notes for more information) and that the switch is configured with an IP address accessible from your PC or workstation. (For more on assigning an IP address, refer to “IP Configuration” on page 8-3.)
1. Ensure that the JavaTM applets are enabled for your browser. For more information on this topic, refer to your browser’s online Help.
2. Use the web browser to access the switch. If your network includes a Domain Name Server (DNS), your switch’s IP address may have a name associated with it (for example, switch5308) that you can type in the Location or Address field instead of the IP address. Using DNS names typically improves browser performance. Contact your network adminis-trator to enquire about DNS names associated with your ProCurve switch.
Type the IP address (or DNS name) of the switch in the browser Location or Address (URL) field and press [Enter]. (It is not necessary to include http://.)
switch5308 [Enter] (example of a DNS-type name)
10.11.12.195 [Enter] (example of an IP address)
5-4
Using the Web Browser InterfaceStarting a Web Browser Interface Session with the Switch
Using ProCurve Manager (PCM) or ProCurve Manager Plus (PCM+)
ProCurve Manager and ProCurve Manager Plus are designed for installation on a network management workstation. For this reason, the system require-ments are different from the system requirements for accessing the switch’s web browser interface from a non-management PC or workstation. For ProCurve PCM and PCM+ requirements, refer to the information provided with the software.
This procedure assumes that:
■ You have installed the recommended web browser on a PC or workstation that serves as your network management station.
■ The networked device you want to access has been assigned an IP address and (optionally) a DNS name, and has been discovered by PCM or PCM+. (For more on assigning an IP address, refer to “IP Configuration” on page 8-3.)
To establish a web browser session with ProCurve PCM or PCM+ running, do the following on the network management station:
1. Make sure the JavaTM applets are enabled for your web browser. If they are not, refer to the web browser online Help for specific information on enabling the Java applets.
2. In the Interconnected Devices listing under Network Manager Home (in the PCM/PCM+ sidebar), right-click on the model number of the device you want to access.
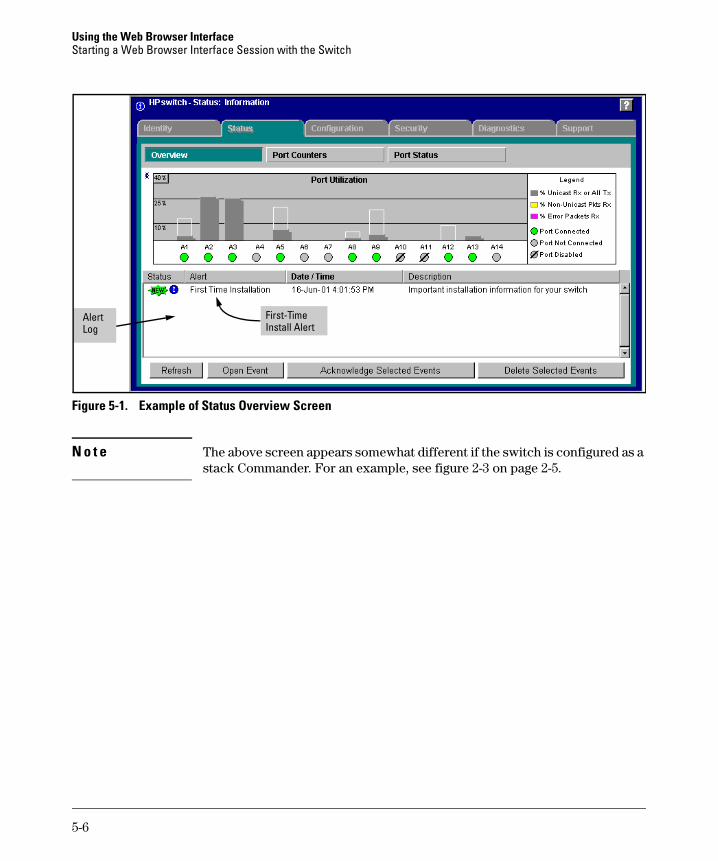
3. The web browser interface automatically starts with the Status Overview window displayed for the selected device, as shown in figure 5-1.
N o t e If the Registration window appears, click on the Status tab.
5-5
Using the Web Browser InterfaceStarting a Web Browser Interface Session with the Switch
Figure 5-1. Example of Status Overview Screen
N o t e The above screen appears somewhat different if the switch is configured as a stack Commander. For an example, see figure 2-3 on page 2-5.
Alert Log
First-TimeInstall Alert
5-6
Using the Web Browser InterfaceTasks for Your First Web Browser Interface Session
Tasks for Your First Web Browser Interface Session
The first time you access the web browser interface, there are three tasks that you should perform:
■ Review the “First Time Install” window
■ Set Manager and Operator passwords
■ Set access to the web browser interface online help
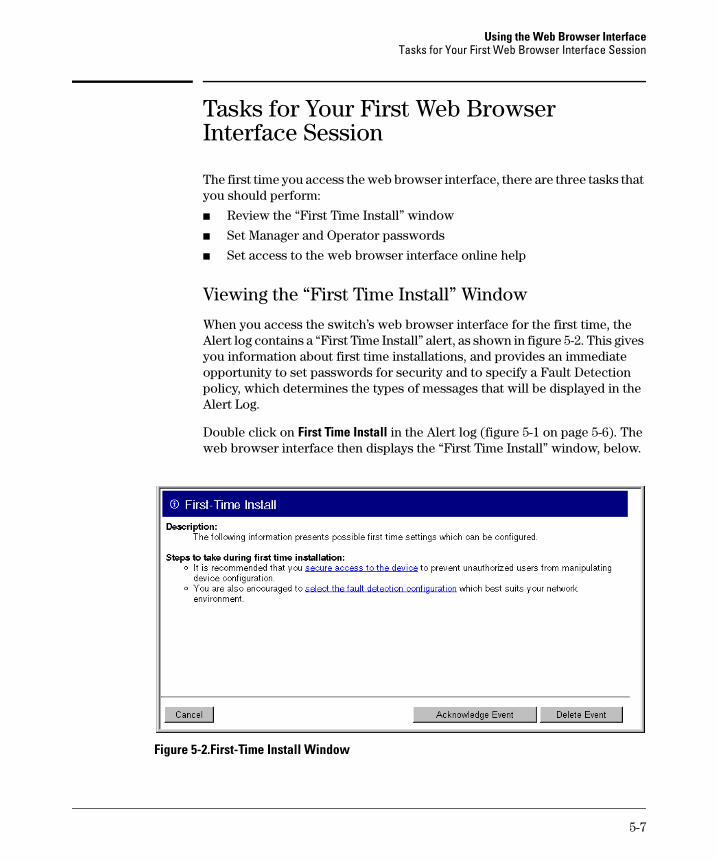
Viewing the “First Time Install” Window
When you access the switch’s web browser interface for the first time, the Alert log contains a “First Time Install” alert, as shown in figure 5-2. This gives you information about first time installations, and provides an immediate opportunity to set passwords for security and to specify a Fault Detection policy, which determines the types of messages that will be displayed in the Alert Log.
Double click on First Time Install in the Alert log (figure 5-1 on page 5-6). The web browser interface then displays the “First Time Install” window, below.
Figure 5-2.First-Time Install Window
5-7
Using the Web Browser InterfaceTasks for Your First Web Browser Interface Session
This window is the launching point for the basic configuration you need to perform to set web browser interface passwords to maintain security and Fault Detection policy, which determines the types of messages that will be displayed in the Alert Log.
To set web browser interface passwords, click on secure access to the device to display the Device Passwords screen, and then go to the next page. (You can also access the password screen by clicking on the Security tab.)
To set Fault Detection policy, click on select the fault detection configuration in the second bullet in the window and go to the section, “Setting Fault Detection Policy” on page 5-23. (You can also access the password screen by clicking on the Configuration tab, and then [Fault Detection] button.)
Creating Usernames and Passwords in the Browser Interface
You may want to create both a username and password to create access security for your switch. There are two levels of access to the interface that can be controlled by setting user names and passwords:
■ Operator. An Operator-level user name and password allows read-only access to most of the web browser interface, but prevents access to the Security window.
■ Manager. A Manager-level user name and password allows full read/write access to the web browser interface.
5-8
Using the Web Browser InterfaceTasks for Your First Web Browser Interface Session
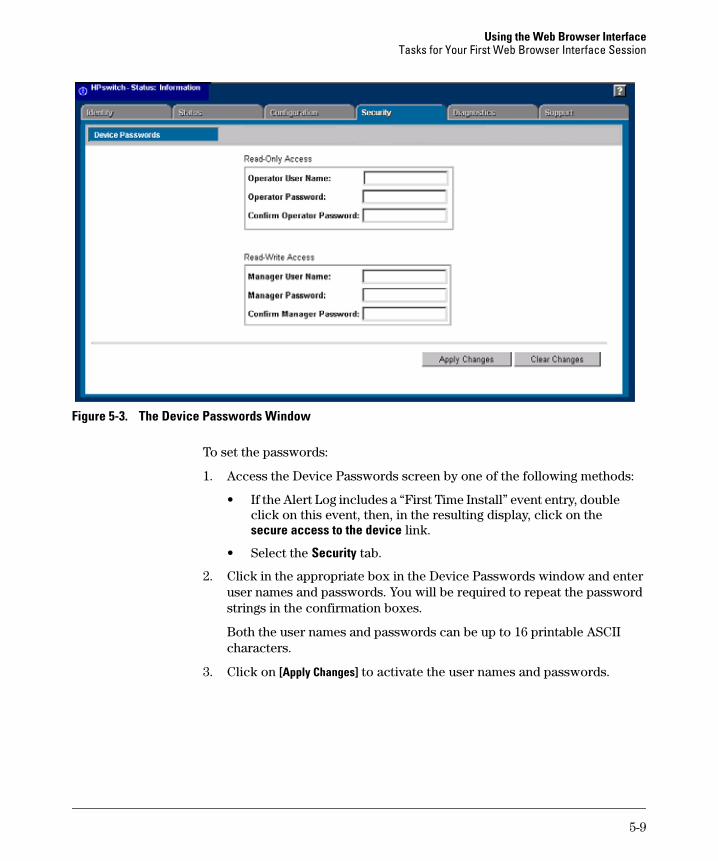
Figure 5-3. The Device Passwords Window
To set the passwords:
1. Access the Device Passwords screen by one of the following methods:
• If the Alert Log includes a “First Time Install” event entry, double click on this event, then, in the resulting display, click on the secure access to the device link.
• Select the Security tab.
2. Click in the appropriate box in the Device Passwords window and enter user names and passwords. You will be required to repeat the password strings in the confirmation boxes.
Both the user names and passwords can be up to 16 printable ASCII characters.
3. Click on [Apply Changes] to activate the user names and passwords.
5-9
Using the Web Browser InterfaceTasks for Your First Web Browser Interface Session
N o t e Passwords you assign in the web browser interface will overwrite previous passwords assigned in either the web browser interface, the Command Prompt, or the switch console. That is, the most recently assigned passwords are the switch’s passwords, regardless of which interface was used to assign the string.
Using the Passwords
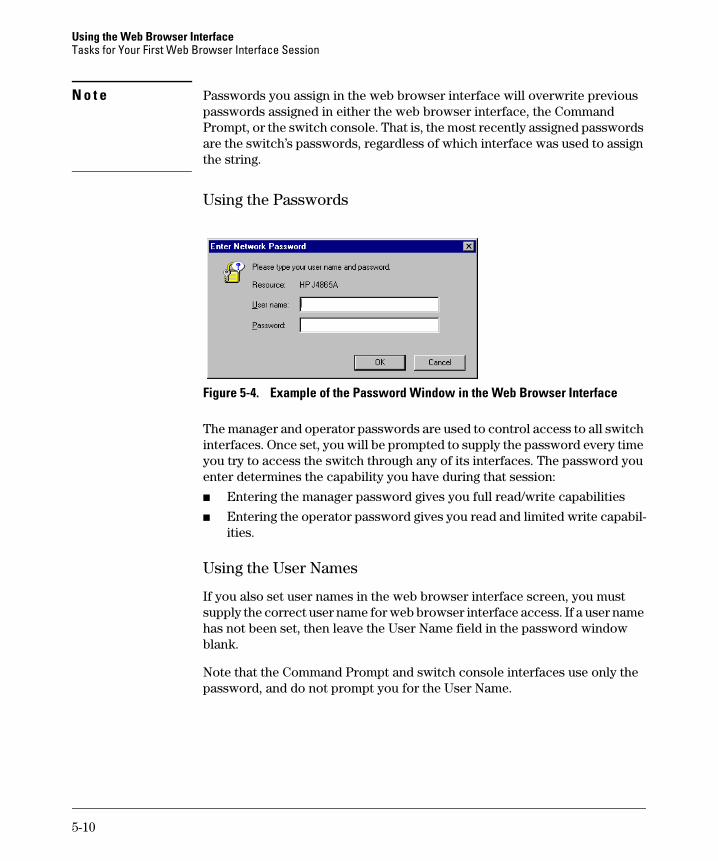
Figure 5-4. Example of the Password Window in the Web Browser Interface
The manager and operator passwords are used to control access to all switch interfaces. Once set, you will be prompted to supply the password every time you try to access the switch through any of its interfaces. The password you enter determines the capability you have during that session:
■ Entering the manager password gives you full read/write capabilities
■ Entering the operator password gives you read and limited write capabil-ities.
Using the User Names
If you also set user names in the web browser interface screen, you must supply the correct user name for web browser interface access. If a user name has not been set, then leave the User Name field in the password window blank.
Note that the Command Prompt and switch console interfaces use only the password, and do not prompt you for the User Name.
5-10
Using the Web Browser InterfaceTasks for Your First Web Browser Interface Session
If You Lose a Password
If you lose the passwords, you can clear them by pressing the Clear button on the front of the switch. This action deletes all password and user name
protection from all of the switch’s interfaces.
The Clear button is provided for your convenience, but its presence means
that if you are concerned with the security of the switch configuration and
operation, you should make sure the switch is installed in a secure location,
such as a locked wiring closet.(For more information, refer to “Front Panel
Security” in the chapter titled “Configuring Username and Password Secu-
rity” in the Access Security Guide for your switch.)
Online Help for the Web Browser Interface
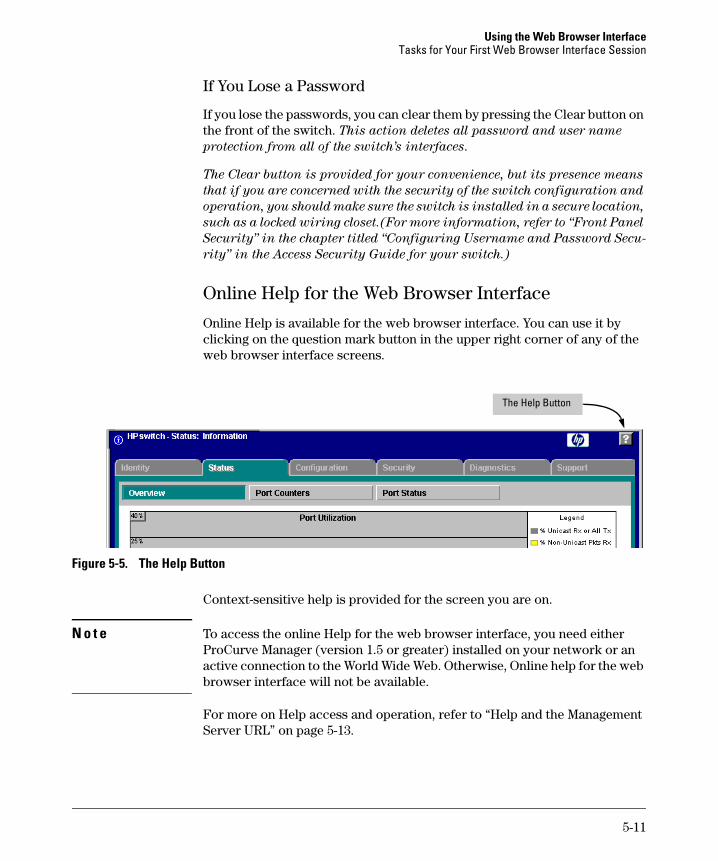
Online Help is available for the web browser interface. You can use it by clicking on the question mark button in the upper right corner of any of the web browser interface screens.
Figure 5-5. The Help Button
Context-sensitive help is provided for the screen you are on.
N o t e To access the online Help for the web browser interface, you need either ProCurve Manager (version 1.5 or greater) installed on your network or an active connection to the World Wide Web. Otherwise, Online help for the web browser interface will not be available.
For more on Help access and operation, refer to “Help and the Management Server URL” on page 5-13.
The Help Button
5-11
Using the Web Browser InterfaceSupport/Mgmt URLs Feature
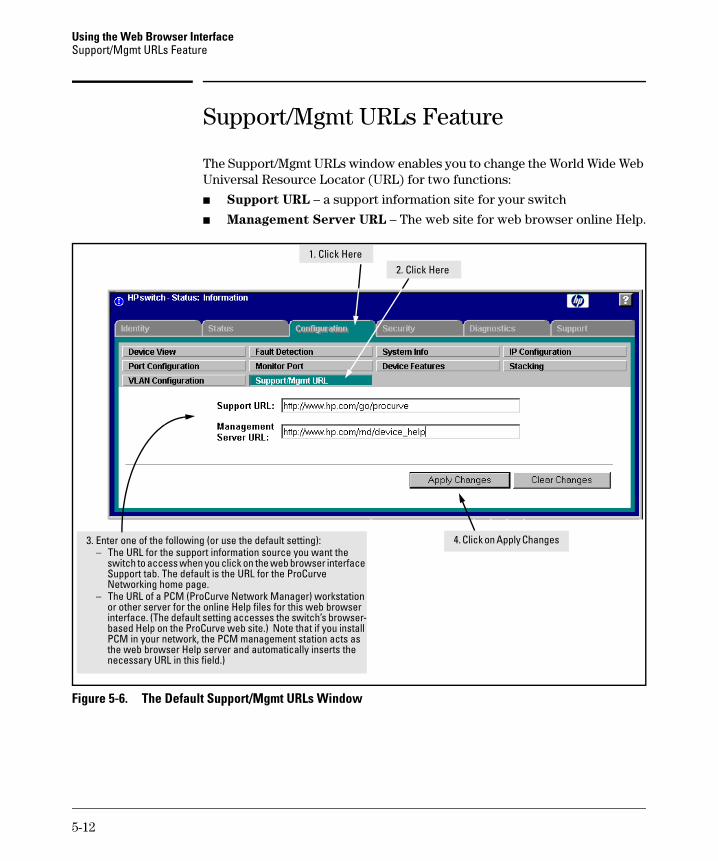
Support/Mgmt URLs Feature
The Support/Mgmt URLs window enables you to change the World Wide Web Universal Resource Locator (URL) for two functions:
■ Support URL – a support information site for your switch
■ Management Server URL – The web site for web browser online Help.
Figure 5-6. The Default Support/Mgmt URLs Window
3. Enter one of the following (or use the default setting):– The URL for the support information source you want the
switch to access when you click on the web browser interface Support tab. The default is the URL for the ProCurve Networking home page.
– The URL of a PCM (ProCurve Network Manager) workstation or other server for the online Help files for this web browser interface. (The default setting accesses the switch’s browser-based Help on the ProCurve web site.) Note that if you install PCM in your network, the PCM management station acts as the web browser Help server and automatically inserts the necessary URL in this field.)
1. Click Here2. Click Here
4. Click on Apply Changes
5-12
Using the Web Browser InterfaceSupport/Mgmt URLs Feature
Support URL
This is the site that the switch accesses when you click on the Support tab on the web browser interface. The default URL is:
http://www.procurve.com
which is the web site for ProCurve’s networking products.
Click on the [Support] button on that page and you can get to support informa-tion regarding your switch, including white papers, operating system (OS) updates, and more.
You could instead enter the URL for a local site that you use for entering reports about network performance, or whatever other function you would like to be able to easily access by clicking on the [Support] tab.
Help and the Management Server URL
The Management Server URL field specifies the URL the switch uses to find online Help for the web browser interface.
■ If you install PCM (ProCurve Manager) in your network, the PCM manage-ment station acts as the web browser Help server for the switch and automatically inserts the necessary URL in this field.)
■ In the default configuration (and if PCM is not running on your network) this field is set to the URL for accessing online Help from the ProCurve Networking Website:
http://www.procurve.comUsing this option, the Help files are automatically available if your work-station can access the World Wide Web. In this case, if Online Help fails to operate, ensure that the above URL appears in the Management Server URL field shown in figure 5-7:
5-13
Using the Web Browser InterfaceSupport/Mgmt URLs Feature
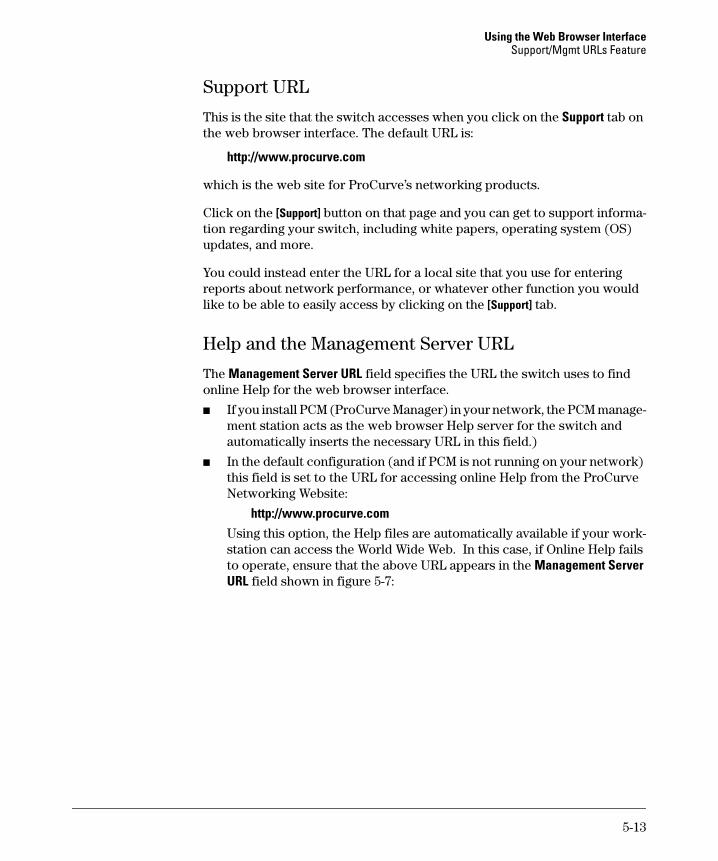
Figure 5-7. How To Access Web Browser Interface Online Help
In the default configuration, the switch uses the URL for accessing the web browser interface help files on the ProCurve web site.
5-14
Using the Web Browser InterfaceStatus Reporting Features
Status Reporting Features
Browser elements covered in this section include:
■ The Overview window (below)
■ Port utilization and status (page 5-16)
■ The Alert log (page 5-19)
■ The Status bar (page 5-22)
The Overview Window
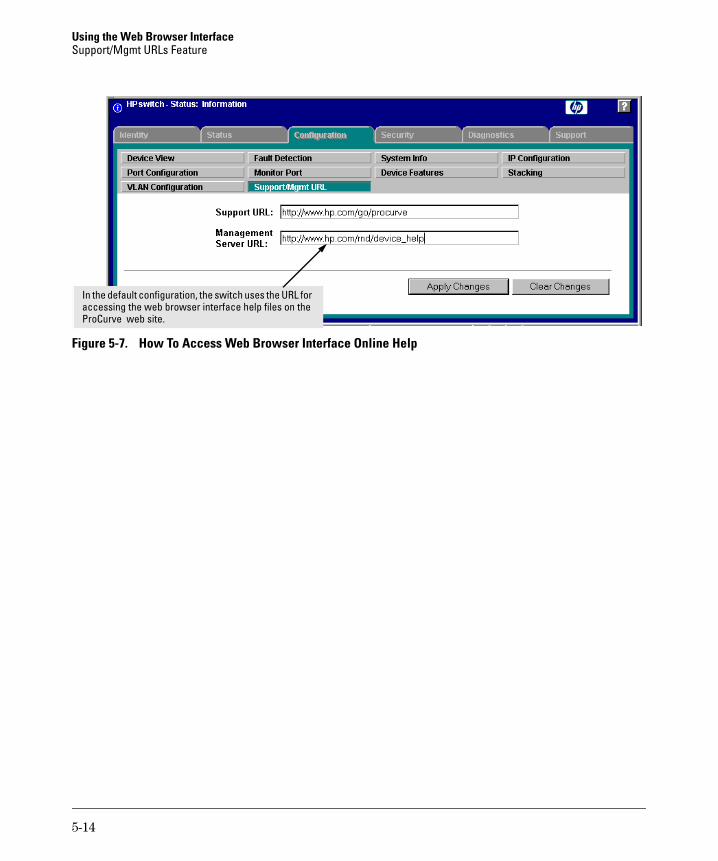
The Overview Window is the home screen for any entry into the web browser interface.The following figure identifies the various parts of the screen.
Figure 5-8. The Status Overview Window
Policy Management and Configuration. ProCurve PCM can perform network-wide policy management and configuration of your switch. The Management Server URL field (page 5-13) shows the URL for the management station performing that function. For more information, refer to the documen-tation provided with the PCM software.
Alert Log Control Bar
Port Utiliza-tion Graphs(page 5-16)
Active TabActive Button
Alert Log (page 5-19)
Port Status Indicators(page 5-18)
Button Bar
Tab Bar
Status Bar(page 5-22)
5-15
Using the Web Browser InterfaceStatus Reporting Features
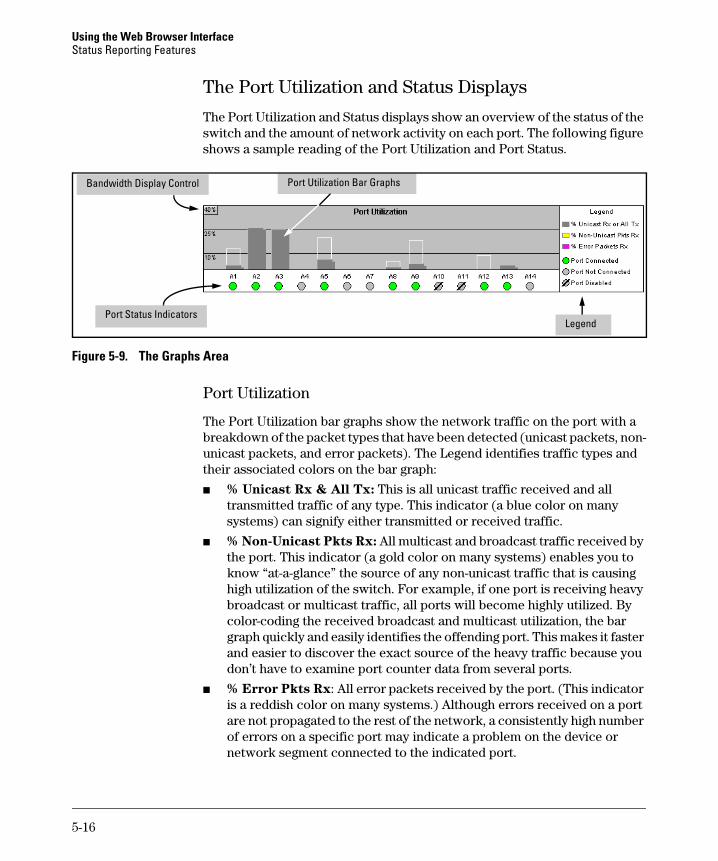
The Port Utilization and Status Displays
The Port Utilization and Status displays show an overview of the status of the switch and the amount of network activity on each port. The following figure shows a sample reading of the Port Utilization and Port Status.
Figure 5-9. The Graphs Area
Port Utilization
The Port Utilization bar graphs show the network traffic on the port with a breakdown of the packet types that have been detected (unicast packets, non-unicast packets, and error packets). The Legend identifies traffic types and their associated colors on the bar graph:
■ % Unicast Rx & All Tx: This is all unicast traffic received and all transmitted traffic of any type. This indicator (a blue color on many systems) can signify either transmitted or received traffic.
■ % Non-Unicast Pkts Rx: All multicast and broadcast traffic received by the port. This indicator (a gold color on many systems) enables you to know “at-a-glance” the source of any non-unicast traffic that is causing high utilization of the switch. For example, if one port is receiving heavy broadcast or multicast traffic, all ports will become highly utilized. By color-coding the received broadcast and multicast utilization, the bar graph quickly and easily identifies the offending port. This makes it faster and easier to discover the exact source of the heavy traffic because you don’t have to examine port counter data from several ports.
■ % Error Pkts Rx: All error packets received by the port. (This indicator is a reddish color on many systems.) Although errors received on a port are not propagated to the rest of the network, a consistently high number of errors on a specific port may indicate a problem on the device or network segment connected to the indicated port.
Port Status Indicators
Port Utilization Bar GraphsBandwidth Display Control
Legend
5-16
Using the Web Browser InterfaceStatus Reporting Features
■ Maximum Activity Indicator: As the bars in the graph area change height to reflect the level of network activity on the corresponding port, they leave an outline to identify the maximum activity level that has been observed on the port.
Utilization Guideline. A network utilization of 40% is considered the maximum that a typical Ethernet-type network can experience before encoun-tering performance difficulties. If you observe utilization that is consistently higher than 40% on any port, click on the Port Counters button to get a detailed set of counters for the port.
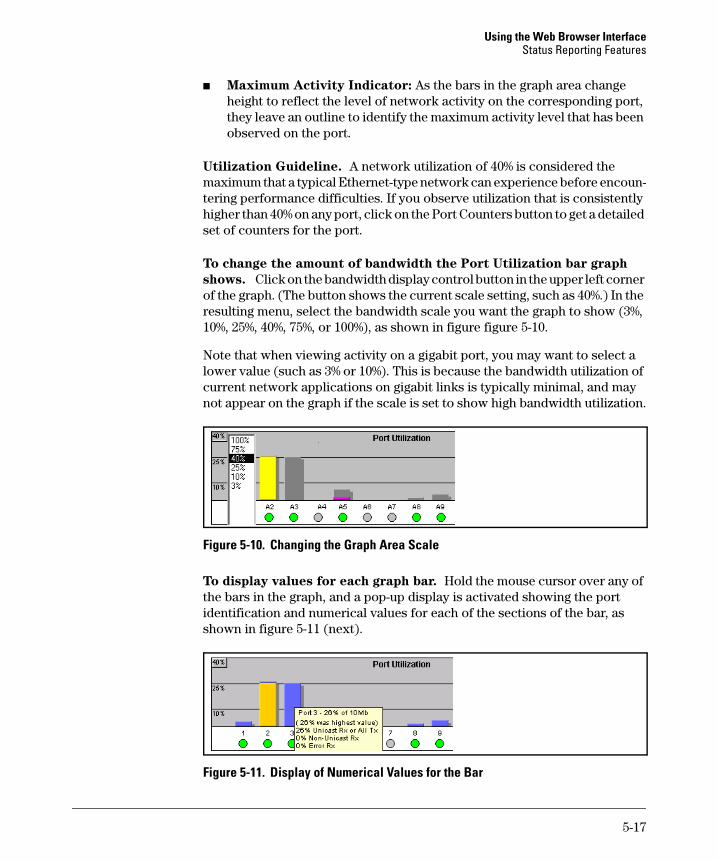
To change the amount of bandwidth the Port Utilization bar graph
shows. Click on the bandwidth display control button in the upper left corner of the graph. (The button shows the current scale setting, such as 40%.) In the resulting menu, select the bandwidth scale you want the graph to show (3%, 10%, 25%, 40%, 75%, or 100%), as shown in figure figure 5-10.
Note that when viewing activity on a gigabit port, you may want to select a lower value (such as 3% or 10%). This is because the bandwidth utilization of current network applications on gigabit links is typically minimal, and may not appear on the graph if the scale is set to show high bandwidth utilization.
Figure 5-10. Changing the Graph Area Scale
To display values for each graph bar. Hold the mouse cursor over any of the bars in the graph, and a pop-up display is activated showing the port identification and numerical values for each of the sections of the bar, as shown in figure 5-11 (next).
Figure 5-11. Display of Numerical Values for the Bar
5-17
Using the Web Browser InterfaceStatus Reporting Features
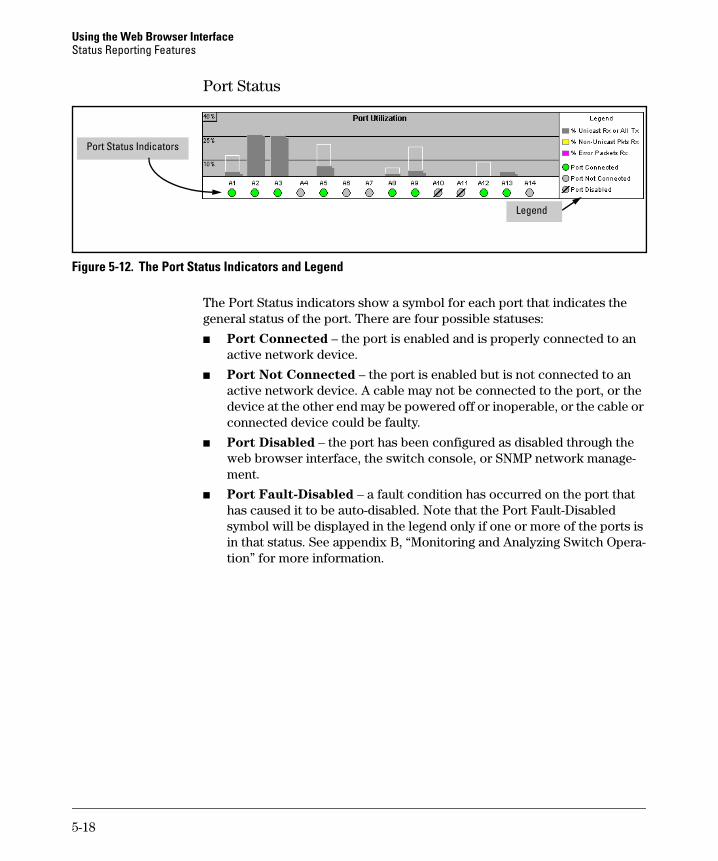
Port Status
Figure 5-12. The Port Status Indicators and Legend
The Port Status indicators show a symbol for each port that indicates the general status of the port. There are four possible statuses:
■ Port Connected – the port is enabled and is properly connected to an active network device.
■ Port Not Connected – the port is enabled but is not connected to an active network device. A cable may not be connected to the port, or the device at the other end may be powered off or inoperable, or the cable or connected device could be faulty.
■ Port Disabled – the port has been configured as disabled through the web browser interface, the switch console, or SNMP network manage-ment.
■ Port Fault-Disabled – a fault condition has occurred on the port that has caused it to be auto-disabled. Note that the Port Fault-Disabled symbol will be displayed in the legend only if one or more of the ports is in that status. See appendix B, “Monitoring and Analyzing Switch Opera-tion” for more information.
Port Status Indicators
Legend
5-18
Using the Web Browser InterfaceStatus Reporting Features
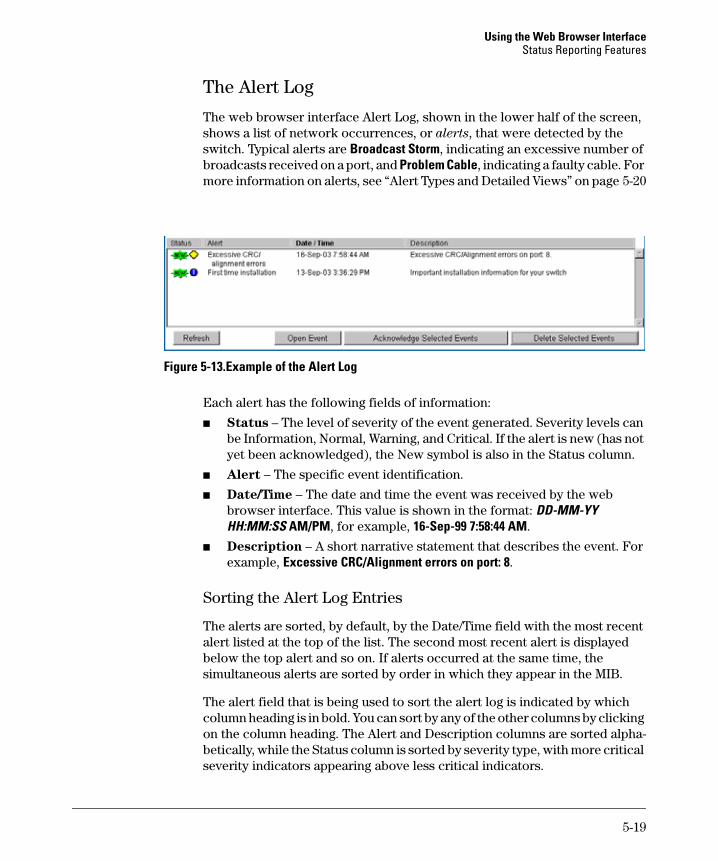
The Alert Log
The web browser interface Alert Log, shown in the lower half of the screen, shows a list of network occurrences, or alerts, that were detected by the switch. Typical alerts are Broadcast Storm, indicating an excessive number of broadcasts received on a port, and Problem Cable, indicating a faulty cable. For more information on alerts, see “Alert Types and Detailed Views” on page 5-20
Figure 5-13.Example of the Alert Log
Each alert has the following fields of information:
■ Status – The level of severity of the event generated. Severity levels can be Information, Normal, Warning, and Critical. If the alert is new (has not yet been acknowledged), the New symbol is also in the Status column.
■ Alert – The specific event identification.
■ Date/Time – The date and time the event was received by the web browser interface. This value is shown in the format: DD-MM-YY HH:MM:SS AM/PM, for example, 16-Sep-99 7:58:44 AM.
■ Description – A short narrative statement that describes the event. For example, Excessive CRC/Alignment errors on port: 8.
Sorting the Alert Log Entries
The alerts are sorted, by default, by the Date/Time field with the most recent alert listed at the top of the list. The second most recent alert is displayed below the top alert and so on. If alerts occurred at the same time, the simultaneous alerts are sorted by order in which they appear in the MIB.
The alert field that is being used to sort the alert log is indicated by which column heading is in bold. You can sort by any of the other columns by clicking on the column heading. The Alert and Description columns are sorted alpha-betically, while the Status column is sorted by severity type, with more critical severity indicators appearing above less critical indicators.
5-19
Using the Web Browser InterfaceStatus Reporting Features
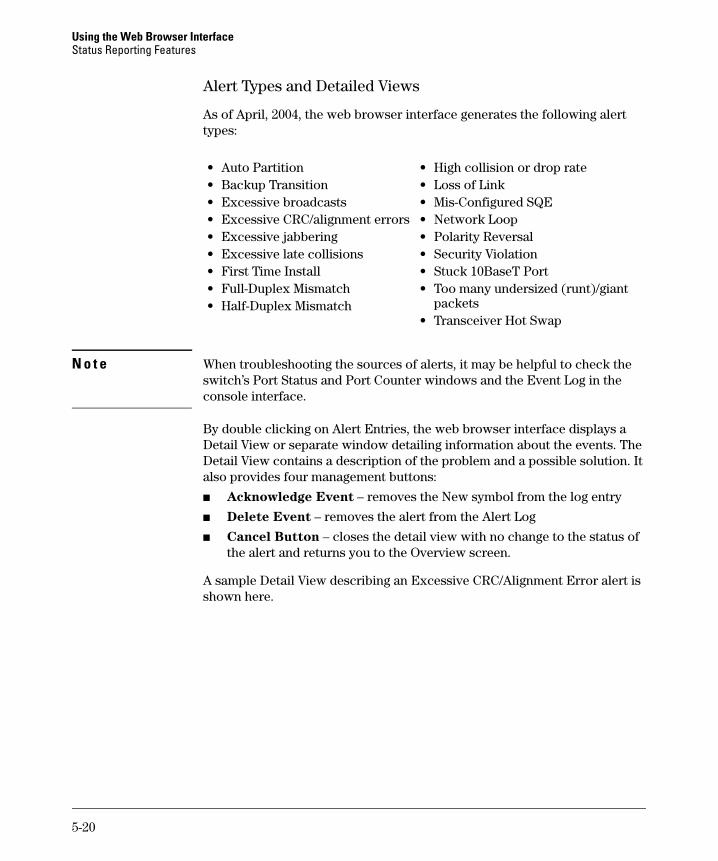
Alert Types and Detailed Views
As of April, 2004, the web browser interface generates the following alert types:
N o t e When troubleshooting the sources of alerts, it may be helpful to check the switch’s Port Status and Port Counter windows and the Event Log in the console interface.
By double clicking on Alert Entries, the web browser interface displays a Detail View or separate window detailing information about the events. The Detail View contains a description of the problem and a possible solution. It also provides four management buttons:
■ Acknowledge Event – removes the New symbol from the log entry
■ Delete Event – removes the alert from the Alert Log
■ Cancel Button – closes the detail view with no change to the status of the alert and returns you to the Overview screen.
A sample Detail View describing an Excessive CRC/Alignment Error alert is shown here.
• Auto Partition• Backup Transition• Excessive broadcasts• Excessive CRC/alignment errors• Excessive jabbering• Excessive late collisions• First Time Install• Full-Duplex Mismatch• Half-Duplex Mismatch
• High collision or drop rate• Loss of Link• Mis-Configured SQE• Network Loop• Polarity Reversal• Security Violation• Stuck 10BaseT Port• Too many undersized (runt)/giant
packets• Transceiver Hot Swap
5-20
Using the Web Browser InterfaceStatus Reporting Features
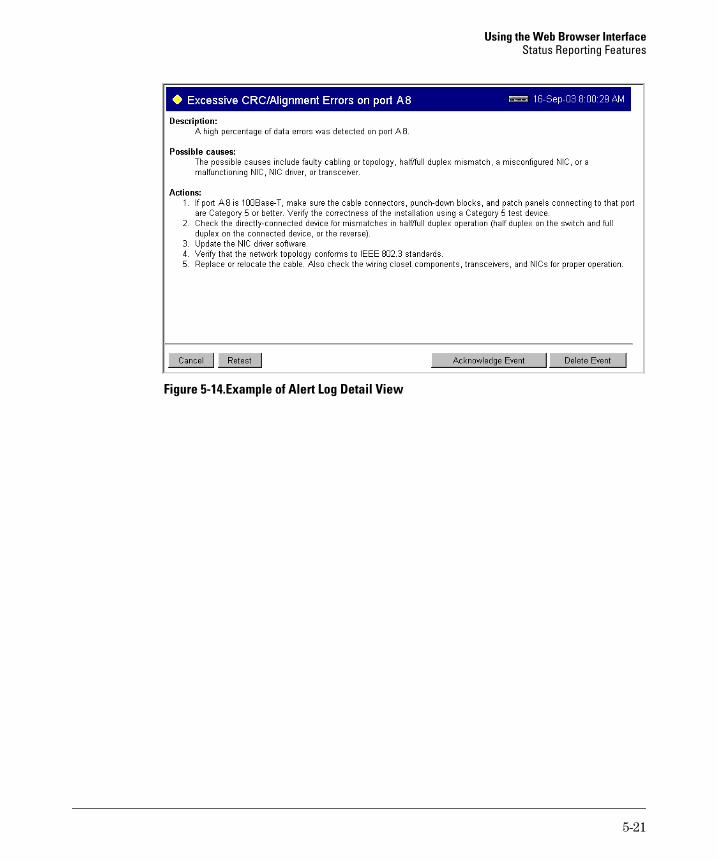
Figure 5-14.Example of Alert Log Detail View
5-21
Using the Web Browser InterfaceStatus Reporting Features
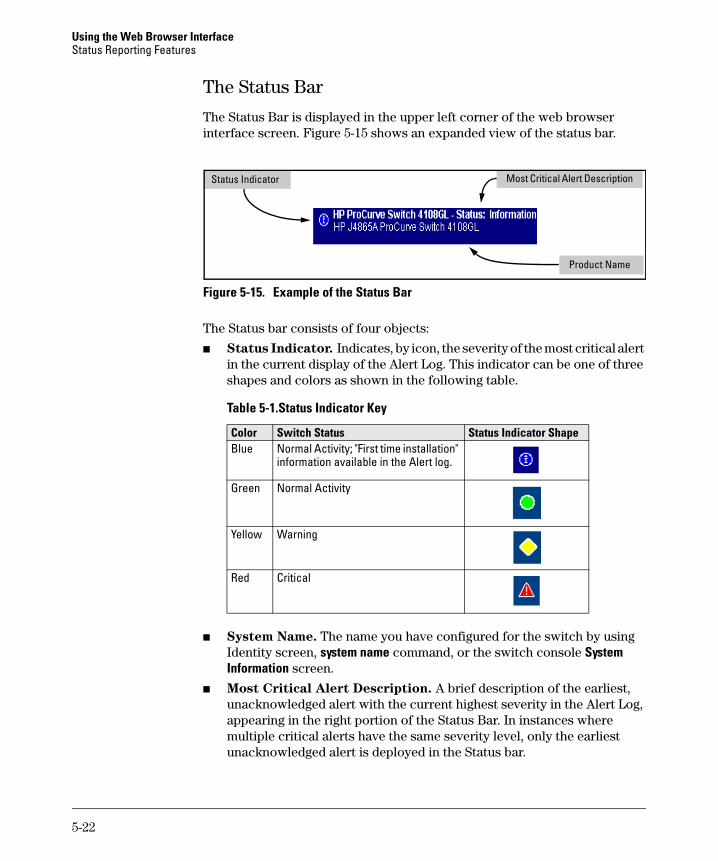
The Status Bar
The Status Bar is displayed in the upper left corner of the web browser interface screen. Figure 5-15 shows an expanded view of the status bar.
Figure 5-15. Example of the Status Bar
The Status bar consists of four objects:
■ Status Indicator. Indicates, by icon, the severity of the most critical alert in the current display of the Alert Log. This indicator can be one of three shapes and colors as shown in the following table.
Table 5-1.Status Indicator Key
■ System Name. The name you have configured for the switch by using Identity screen, system name command, or the switch console System Information screen.
■ Most Critical Alert Description. A brief description of the earliest, unacknowledged alert with the current highest severity in the Alert Log, appearing in the right portion of the Status Bar. In instances where multiple critical alerts have the same severity level, only the earliest unacknowledged alert is deployed in the Status bar.
Color Switch Status Status Indicator ShapeBlue Normal Activity; "First time installation"
information available in the Alert log.
Green Normal Activity
Yellow Warning
Red Critical
Status Indicator Most Critical Alert Description
Product Name
5-22
Using the Web Browser InterfaceStatus Reporting Features
■ Product Name. The product name of the switch to which you are connected in the current web browser interface session.
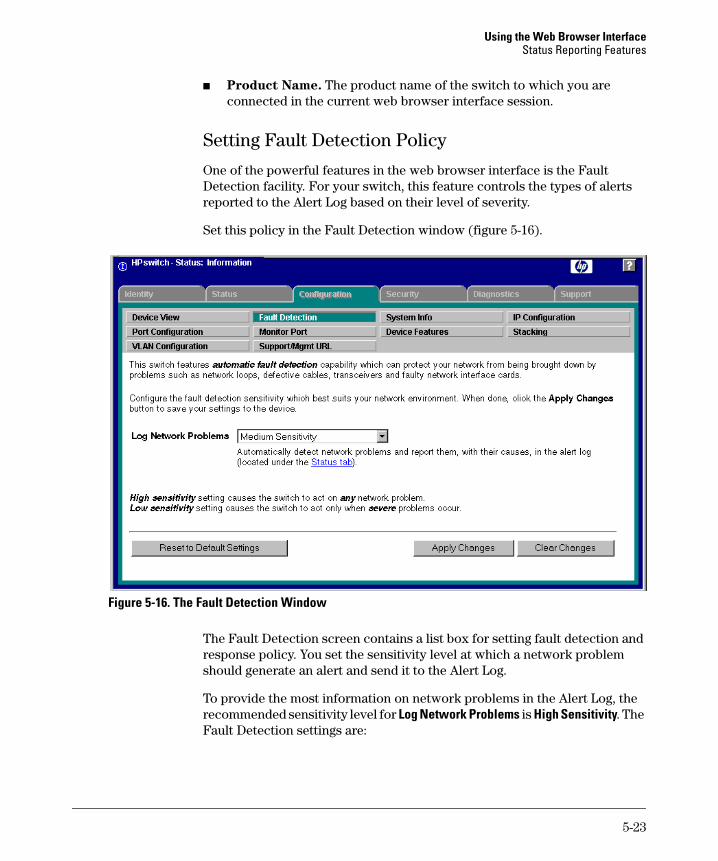
Setting Fault Detection Policy
One of the powerful features in the web browser interface is the Fault Detection facility. For your switch, this feature controls the types of alerts reported to the Alert Log based on their level of severity.
Set this policy in the Fault Detection window (figure 5-16).
Figure 5-16. The Fault Detection Window
The Fault Detection screen contains a list box for setting fault detection and response policy. You set the sensitivity level at which a network problem should generate an alert and send it to the Alert Log.
To provide the most information on network problems in the Alert Log, the recommended sensitivity level for Log Network Problems is High Sensitivity. The Fault Detection settings are:
5-23
Using the Web Browser InterfaceStatus Reporting Features
■ High Sensitivity. This policy directs the switch to send all alerts to the Alert Log. This setting is most effective on networks that have none or few problems.
■ Medium Sensitivity. This policy directs the switch to send alerts related to network problems to the Alert Log. If you want to be notified of problems which cause a noticeable slowdown on the network, use this setting.
■ Low Sensitivity. This policy directs the switch to send only the most severe alerts to the Alert Log. This policy is most effective on a network that normally has a lot of problems and you want to be informed of only the most severe ones.
■ Never. Disables the Alert Log and transmission of alerts (traps) to the management server (in cases where a network management tool such as ProCurve Manager is in use). Use this option when you don’t want to use the Alert Log.
The Fault Detection Window also contains three Change Control Buttons:
■ Apply Changes. This button stores the settings you have selected for all future sessions with the web browser interface until you decide to change them.
■ Clear Changes. This button removes your settings and returns the settings for the list box to the level it was at in the last saved detection-setting session.
■ Reset to Default Settings. This button reverts the policy setting to Medium Sensitivity for Log Network Problems.
5-24