Embed Size (px)
Citation preview
Small Ruminant Research
ELSEVIER Small Ruminant Research 27 (1998) 159-165
Using ultrasound to determine fat thickness and longissimus dorsi area on Manchego lambs of different live weight
C. Ferniindez *, A. Garcia, H. Vergara, L. Gallego Universidad de Castilla-La Mancha, Escuela T&nica Superior de Ingenieros Agr6nonws, 02071 Albacete, Spain
Accepted 6 February 1997
Abstract
Twenty lambs were separated randomly into two groups of 10 finishing weights of 25 and 35 kg, respectively. Lambs were evaluated live for fat thickness and longissimus dorsi cross sectional area between the 12th and 13th ribs and the 3rd and 4th lumbar vertebrae using real time ultrasound. Lambs were slaughtered using commercial slaughtering processes and carcasses were chilled at 6’C for 24 h. Carcass measurements of fat thickness and longissimus dorsi area were recorded over the same points as used for in vivo measurements. All ultrasound and carcass measurements were different (P < 0.01) between lamb weight groups. The highest correlation found was between ultrasound fat thickness (r = 0.90 for 25 kg and r = 0.92 for 35 kg) and its corresponding carcass measurements taken between the 12th and 13th ribs. Multiple regression equations for predicting fat thickness and longissimus dorsi area using live weight like independent variable had R2 values ranging from 0.54 to 0.69 and, R2 values from 0.60 to 0.95 when ultrasound measurements were included. The accuracy of predicting fat thickness and longissimus muscle area on live animals could be improved by the addition of ultrasound measurements to live weight. Ultrasound fat thickness at 12-13th rib was the best predictor of fat thickness (R2 = 0.92; P < 0.001). Results suggest that ultrasonic measurements at 12-13th rib taken before slaughter may be accurate predictors of cold carcass weight ( R2 = 0.70; P < 0.001) in lambs. 0 1998 Elsevier Science B.V.
Keywordx Fat thickness; Muscle area; Lamb; Ultrasound
1. Introduction
Ultrasound has been used for evaluating carcass composition in cattle (Simm, 1983), sheep (Edwards et al., 1989) and pork (Forrest et al., 1989; Gresham
l Corresponding author. Universidad de Castilla-La Mancha, Escuela Tknica Superior de Ingenieros Agr&omos, Departa- mento de Ciencia y Tecnologica Agroforestal, Campus Universi- tario, 02071-Albacete, Spain. Fax: 3467-599 238; e-mail: cfeman-
et al., 1992). Its use has increased dramatically in recent years thanks to improvements in ultrasound equipment and computer technology.
Little information has been published about ultra- sound use in live sheep (Kempster et al., 1982) compared with other species. Hiner (1958) suggested that ultrasound is of little utility in predicting fat thickness (FT) and lon,qissimus dorsi muscle area (LMA) of ewes. Nevertheless, Campbell et al. (1959) reported a significant correlation between Zongis- simus dorsi muscle depth (LMD) as estimated by
[email protected] _ ultrasound and actual sheep carcass measurements.
00921-4488/98/$19.00 0 1998 Elsevier Science B.V. All rights reserved. PII SO921-4488(97)00034-5
160 C. Femcindez et al. /Small Ruminant Research 27 (1998) 159-165
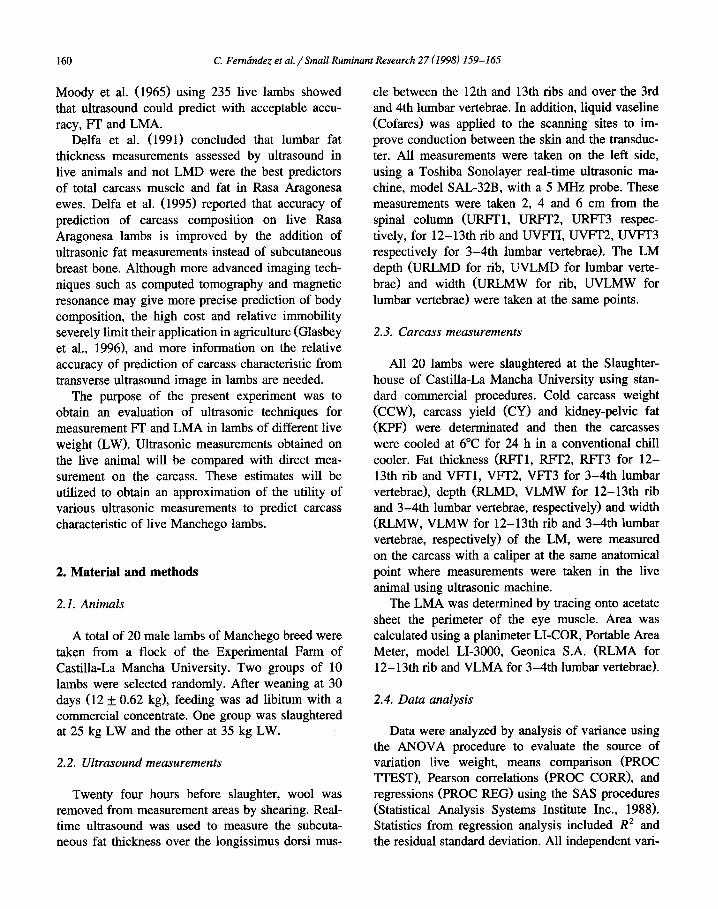
Moody et al. (1965) using 235 live lambs showed that ultrasound could predict with acceptable accu-
racy, Ff and LMA. Delfa et al. (1991) concluded that lumbar fat
thickness measurements assessed by ultrasound in live animals and not LMD were the best predictors of total carcass muscle and fat in Rasa Aragonesa
ewes. Delfa et al. (1995) reported that accuracy of prediction of carcass composition on live Rasa Aragonesa lambs is improved by the addition of
ultrasonic fat measurements instead of subcutaneous breast bone. Although more advanced imaging tech- niques such as computed tomography and magnetic resonance may give more precise prediction of body
composition, the high cost and relative immobility severely limit their application in agriculture (Glasbey et al., 19961, and more information on the relative accuracy of prediction of carcass characteristic from transverse ultrasound image in lambs are needed.
The purpose of the present experiment was to
obtain an evaluation of ultrasonic techniques for measurement FT and LMA in lambs of different live weight (LW). Ultrasonic measurements obtained on
the live animal will be compared with direct mea- surement on the carcass. These estimates will be utilized to obtain an approximation of the utility of various ultrasonic measurements to predict carcass characteristic of live Manchego lambs.
2. Material and methods
2.1. Animals
A total of 20 male lambs of Manchego breed were taken from a flock of the Experimental Farm of Castilla-La Mancha University. Two groups of 10 lambs were selected randomly. After weaning at 30 days (12 f 0.62 kg), feeding was ad libitum with a commercial concentrate. One group was slaughtered at 25 kg LW and the other at 35 kg LW.
2.2. Ultrasound measurements
Twenty four hours before slaughter, wool was removed from measurement areas by shearing. Real- time ultrasound was used to measure the subcuta- neous fat thickness over the longissimus dorsi mus-
cle between the 12th and 13th ribs and over the 3rd and 4th lumbar vertebrae. In addition, liquid Vaseline
(Cofares) was applied to the scanning sites to im- prove conduction between the skin and the transduc- ter. All measurements were taken on the left side, using a Toshiba Sonolayer real-time ultrasonic ma-
chine, model SAL-32B, with a 5 MHz probe. These measurements were taken 2, 4 and 6 cm from the
spinal column 0JRFT1, URFT2, URFf3 respec- tively, for 12-13th rib and UVFTI, UVFT2, UVFT3 respectively for 3-4th lumbar vertebrae). The LM depth (URLMD for rib, UVLMD for lumbar verte-
brae) and width (URLMW for rib, UVLMW for lumbar vertebrae) were taken at the same points.
2.3. Carcass measurements
All 20 lambs were slaughtered at the Slaughter- house of Castilla-La Mancha University using stan- dard commercial procedures. Cold carcass weight
(CCW), carcass yield (CY) and kidney-pelvic fat (KPF) were determinated and then the carcasses were cooled at 6°C for 24 h in a conventional chill
cooler. Fat thickness (RFTl, RFI2, RFT3 for 12- 13th rib and VFTl, VFT2, VFT3 for 3-4th lumbar vertebrae), depth (RLMD, VLMW for 12-13th rib and 3-4th lumbar vertebrae, respectively) and width (RLMW, VLMW for 12-13th rib and 3-4th lumbar vertebrae, respectively) of the LM, were measured on the carcass with a caliper at the same anatomical
point where measurements were taken in the live animal using ultrasonic machine.
The LMA was determined by tracing onto acetate
sheet the perimeter of the eye muscle. Area was calculated using a planimeter LI-COR, Portable Area Meter, model LI-3000, Geonica S.A. (RLMA for 12-13th rib and VLMA for 3-4th lumbar vertebrae).
2.4. Data analysis
Data were analyzed by analysis of variance using the ANOVA procedure to evaluate the source of variation live weight, means comparison (PROC TTEST), Pearson correlations (PROC CORR), and regressions (PROC REG) using the SAS procedures (Statistical Analysis Systems Institute Inc., 1988). Statistics from regression analysis included R2 and the residual standard deviation. All independent vari-
C. Femcindez et al./Small Ruminant Research 27 (1998) 159-165 161
ables were measured from the carcass ultrasonic images with the exception of slaughter LW. Carcass measurements were used as dependent variables.
3. Results and discussion
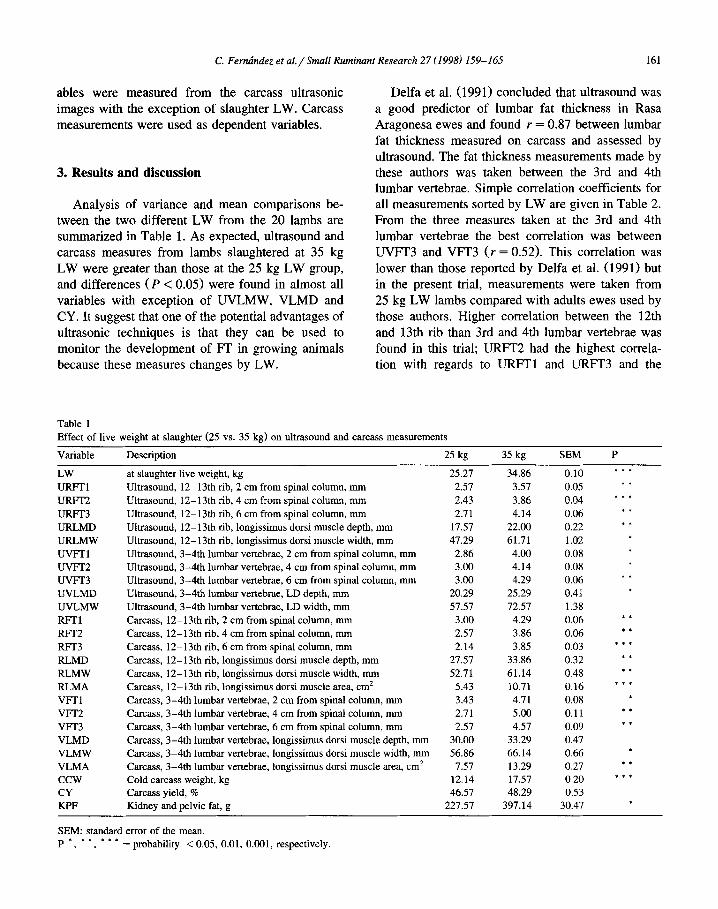
Analysis of variance and mean comparisons be- tween the two different LW from the 20 lambs are summarized in Table 1. As expected, ultrasound and carcass measures from lambs slaughtered at 35 kg
LW were greater than those at the 25 kg LW group, and differences (P < 0.05) were found in almost all
variables with exception of UVLMW, VLMD and CY. It suggest that one of the potential advantages of ultrasonic techniques is that they can be used to
monitor the development of FT in growing animals because these measures changes by LW.
Delfa et al. (1991) concluded that ultrasound was a good predrctor of lumbar fat thickness in Rasa
Aragonesa ewes and found r = 0.87 between lumbar fat thickness measured on carcass and assessed by ultrasound. The fat thickness measurements made by these authors was taken between the 3rd and 4th lumbar vertebrae. Simple correlation coefficients for all measurements sorted by LW are given in Table 2. From the three measures taken at the 3rd and 4th lumbar vertebrae the best correlation was between UVFT3 and VFT3 (r = 0.52). This correlation was
lower than those reported by Delfa et al. (1991) but in the present trial, measurements were taken from 25 kg LW lambs compared with adults ewes used by those authors. Higher correlation between the 12th
and 13th rib than 3rd and 4th lumbar vertebrae was found in this trial; URFf2 had the highest correla- tion with regards to URFTl and URFT3 and the
Table 1 Effect of live weight at slaughter (25 vs. 35 kg) on ultrasound and carcass measurements
Variable Description 25 kg 35 kg SEM P
LW at slaughter live weight, kg 25.21 34.86 0.10 * * *
URFT1 Ultrasound, 12-13th rib, 2 cm from spinal column, mm 2.51 3.57 0.05 * *
URFT2 Ultrasound, 12213th rib, 4 cm from spinal column, mm 2.43 3.86 0.04 ’ * *
URFT3 Ultrasound, 12-1301 rib, 6 cm from spinal column, mm 2.71 4.14 0.06 * *
UFUMD Ultrasound, 12-13th rib, longissimus dorsi muscle depth, mm 17.57 22.00 0.22 * *
URLMW Ultrasound, 12-13th rib, longissimus dorsi muscle width, mm 47.29 61.71 1.02 *
UVFII Ultrasound, 3-4th lumbar vertebrae, 2 cm from spinal column, nnn 2.86 4.00 0.08 *
uVFr2 Ultrasound, 3-4th lumbar vertebrae, 4 cm from spinal column, mm 3.00 4.14 0.08 *
uVFT3 Ultrasound, 3-4th lumbar vertebrae, 6 cm from spinal column, mm 3.00 4.29 0.06 * *
UVLMD Ultrasound, 3-4th lumbar vertebrae, LD depth, mm 20.29 25.29 0.41 *
UVLMW Ultrasound, 3-4th lumbar vertebrae, LD width, mm 51.51 72.57 1.38
RF-T1 Carcass, 12-13th rib, 2 cm from spinal column, mm 3.00 4.29 0.06 * *
RFT2 Carcass, 12-13th rib, 4 cm from spinal column, mm 2.57 3.86 0.06 * *
RF-l-3 Carcass, 12-13th rib, 6 cm from spinal column, mm 2.14 3.85 0.03 * * *
RLMD Carcass, 12-13th rib, longissimus dorsi muscle depth, mm 21.51 33.86 0.32 * *
RLMW Carcass, 12-13th rib, longissimus dorsi muscle width, mm 52.71 61.14 0.48 * *
RLMA Carcass, 12-13th rib, longissimus dorsi muscle area, cm’ 5.43 10.71 0.16 * * *
VFW Carcass, 3-4th lumbar vertebrae, 2 cm from spinal column, mm 3.43 4.71 0.08 *
vFT2 Carcass, 3-4th lumbar vertebrae, 4 cm from spinal column, mm 2.71 5.00 0.11 * *
vFT3 Carcass, 3-4th lumbar vertebrae, 6 cm from spinal column, mm 2.57 4.51 0.09 * *
VLMD Carcass, 3-4th lumbar vertebrae, longissimus dorsi muscle depth, mm 30.00 33.29 0.47
VLMW Carcass, 3-4th lumbar vertebrae, longissimus dorsi muscle width, mm 56.86 66.14 0.66 *
VLMA Carcass, 3-4th lumbar vertebrae, longissimus dorsi muscle area, cm* 7.57 13.29 0.27 * *
ccw Cold carcass weight, kg 12.14 17.57 0.20 * * *
CY Carcass yield, % 46.57 48.29 0.53
KPF Kidney and pelvic fat, g 221.57 397.14 30.47 *
SEM: standard error of the mean.
p*,**,“’ = probability < 0.05, 0.01, 0.001, respectively.
162 C. Fernrindez et al. /Small Ruminant Research 27 (1998) 159-165
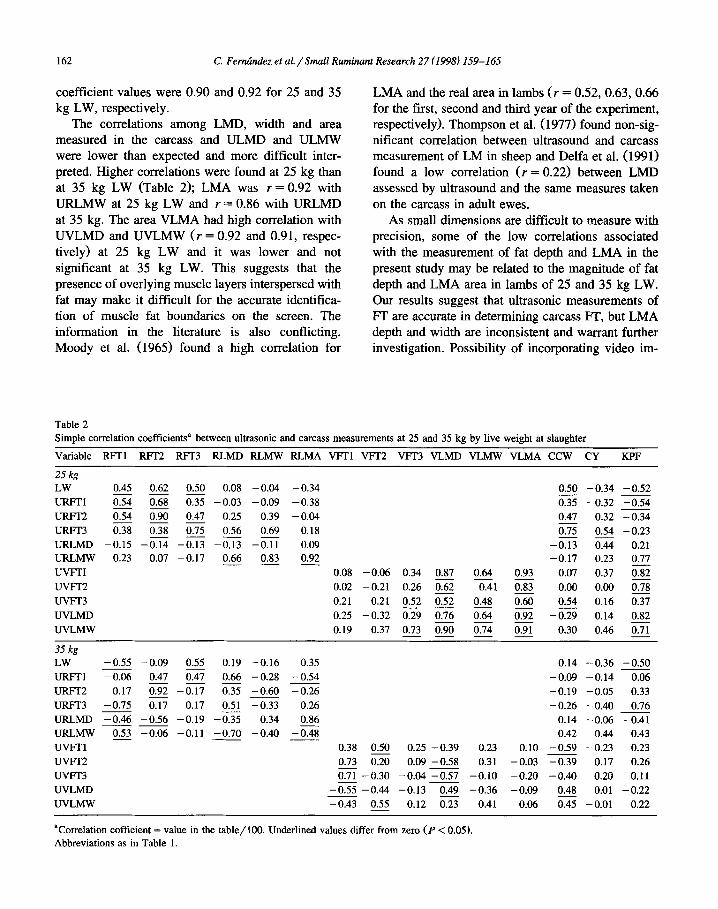
coefficient values were 0.90 and 0.92 for 25 and 35 kg LW, respectively.
The correlations among LMD, width and area measured in the carcass and ULMD and ULMW were lower than expected and more difficult inter-
preted. Higher correlations were found at 25 kg than at 35 kg LW (Table 2); LMA was r = 0.92 with UFUMW at 25 kg LW and r = 0.86 with URLMD
at 35 kg. The area VLMA had high correlation with UVLMD and UVLMW (r = 0.92 and 0.91, respec- tively) at 25 kg LW and it was lower and not significant at 35 kg LW. This suggests that the
presence of overlying muscle layers interspersed with fat may make it difficult for the accurate identifica- tion of muscle fat boundaries on the screen. The information in the literature is also conflicting. Moody et al. (1965) found a high correlation for
LMA and the real area in lambs (1. = 0.52,0.63,0.66 for the first, second and third year of the experiment, respectively). Thompson et al. (1977) found non-sig- nificant correlation between ultrasound and carcass measurement of LM in sheep and Delfa et al. (1991) found a low correlation (r = 0.22) between LMD assessed by ultrasound and the same measures taken
on the carcass in adult ewes. As small dimensions are difficult to measure with
precision, some of the low correlations associated
with the measurement of fat depth and LMA in the present study may be related to the magnitude of fat depth and LMA area in lambs of 25 and 35 kg LW. Our results suggest that ultrasonic measurements of FT are accurate in determining carcass FT, but LMA depth and width are inconsistent and warrant further investigation. Possibility of incorporating video im-
Table 2
Simple correlation coefficient? between ultrasonic and carcass measurements at 2.5 and 35 kg by live weight at slaughter
Variable RFlI RFT2 RFT3 RLMD RLMW RLMA ml VW2 VFT’3 VLMD VLMW VLMA CCW CY KPF
25 kg LW
ml
URFl-2
uRFT3
URLMD - URLMW
UVFTI
uvFT2
UVFT3
UVLMD
UVLMW
0.45 0.62 0.50 0.08 -0.04 -0.34 --- 0.54 0.68 0.35 -0.03 -0.09 -0.38 -- 0.54 0.90 0.47 0.25 0.39 -0.04 --- 0.38 0.38 0.75 0.56 0.69 0.18
-0.15 -0.14 -0.13 -0.13 -0.11 0.09 0.23 0.07 -0.17 0.66 0.83 0.92 ---
0.08 -0.06 0.34
0.02 -0.21 0.26
0.21 0.21 0.52
0.25 -0.32 0.29
0.19 0.37 0.73 -
0.50 -0.34 -0.52
0.35 -0.32 _0.54
0.47 0.32 -0.34
0.75 0.54 -0.23
-0.13 0.44 0.21 -0.17 0.23 0.77
0.87 0.64 0.93 0.07 0.37 0.82 -- 0.62 0.41 083 : 0.00 0.00 0.78
0.52 0.48 0.60 0.54 0.16 0.37
0.76 -- 0.64 0.92 -0.29 0.14 0.82
090 -- 074 0.91 L’____ 0.30 0.46 0.71 -
35 kg
LW
URFrl
URFT2
URFT3
URLMD
URLMW
UVFrl
uVFr2
uvFT3
UVLMD
UVLMW
- 0.55 - 0.09
-0.06 0.47
0.17 0.92
-0.75 0.17
- 0.46 - 0.56
0.53-0.06
0.55 0.19 -0.16 0.35 0.14 -0.36 -0.50
0.47 0.66 -0.28 -0.54 -0.09 -0.14 0.06 -_ -0.17 0.35 -0.60 -0.26 -0.19 -0.05 0.33
0.17 0.51 -0.33 0.26 -0.26 -0.40 -0.76
-0.19 -0.35 0.34 0.86 0.14 -0.06 -0.41
-0.11 -0.70 -0.40 jzij 0.42 0.44 0.43
0.38 0.50 0.25 -0.39 0.23 0.10 -0.59 -0.23 0.23
0.73 0.20 0.09 -0.58 0.31 - 0.03 - 0.39 0.17 0.26
Gz -0.30 -0.04 -0.57 -0.10 -0.20 -0.40 0.20 0.11
-0.55 -0.44 -0.13 0.49 -0.36 -0.09 0.48 0.01 -0.22
-0.43 0.55 0.12 0.23 0.41 0.06 0.45 -0.01 0.22
aCorrelation cofficient = value in the table/lOO. Underlined values differ from zero (P < 0.05). Abbreviations as in Table 1.
C. Fembndez et al. /Small Ruminant Research 27 (1998) 159-165 163
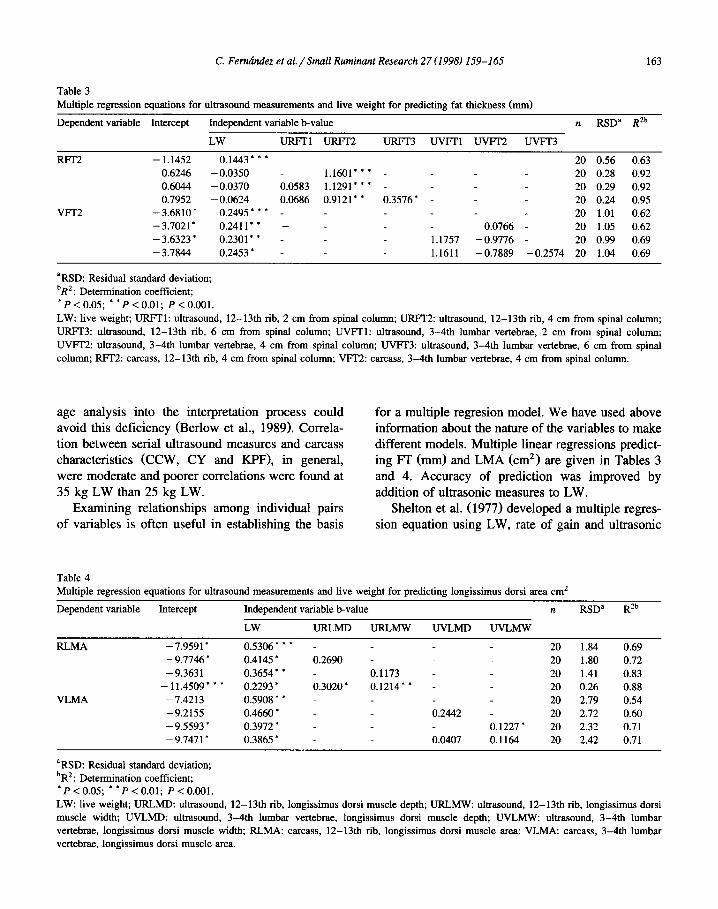
Table 3
Multiple regression equations for ultrasound measurements and live weight for predicting fat thickness (mm)
Dependent variable Intercept Independent variable b-value n RSD* Rzb
LW URFTl URFT2 URFT3 UVFTl UVFT2 UVFT3
RFr2 - 1.1452
0.6246
0.6044
0.7952
VFr2 -3.6810’
- 3.7021*
- 3.6323 *
- 3.7844
0.1443” * *
- 0.0350
- 0.0370
- 0.0624
0.2495 * * *
0.2411**
0.2301. *
0.2453 *
20 0.56 0.63
1.1601’ * * - 20 0.28 0.92
0.0583 1.1291’ * * - 20 0.29 0.92
0.0686 0.9121* * 0.3576’ - - 20 0.24 0.95
20 1.01 0.62
- 0.0766 - 20 1.05 0.62
1.1757 -0.9776 - 20 0.99 0.69
1.1611 -0.7889 -0.2574 20 1.04 0.69
aRSD: Residual standard deviation;
bRZ: Determination coefficient;
*P < 0.05; * *P < 0.01; P < 0.001.
LW: live weight; URFTl: ultrasound, 12-13th rib, 2 cm from spinal column; URFT2: ultrasound, 12-13th rib, 4 cm from spinal column;
URFT3: ultrasound, 12-13th rib, 6 cm from spinal column; UVFTl: ultrasound, 3-4th lumbar vertebrae, 2 cm from spinal column;
UVFT2: ultrasound, 3-4th lumbar vertebrae, 4 cm from spinal column; UVFT3: ultrasound, 3-4th lumbar vertebrae, 6 cm from spinal
column: RFT2: carcass, 12-1361 rib, 4 cm from spinal column; VFT2: carcass, 3-461 lumbar vertebrae, 4 cm from spinal column.
age analysis into the interpretation process could for a multiple regresion model. We have used above avoid this deficiency (Berlow et al., 1989). Correla- information about the nature of the variables to make tion between serial ultrasound measures and carcass different models. Multiple linear regressions predict- characteristics (CCW, CY and KPF), in general, ing Ff (mm) and LMA (cm*) are given in Tables 3 were moderate and poorer correlations were found at and 4. Accuracy of prediction was improved by 35 kg LW than 25 kg LW. addition of ultrasonic measures to LW.
Examining relationships among individual pairs of variables is often useful in establishing the basis
Shelton et al. (1977) developed a multiple regres- sion equation using LW, rate of gain and ultrasonic
Table 4
Multiple regression equations for ultrasound measurements and live weight for predicting longissimus dorsi area cm*
Dependent variable
RLMA
VLMA
Intercept Independent variable b-value It RSDa RZb
LW URLMD URLMW UVLMD UVLMW
- 7.9591: 0.5306*** - 20 1.84 0.69
- 9.7746 * 0.4145 * 0.2690 - 20 1.80 0.72
-9.3631 0.3654* * - 0.1173 20 1.41 0.83
- 11.4509* * * 0.2293 ’ 0.3020 * 0.1214’ * - 20 0.26 0.88
-7.4213 0.5908: * - 20 2.79 0.54
-9.2155 0.4660 * - 0.2442 - 20 2.72 0.60
- 9.5593 * 0.3972 * - 0.1227’ 20 2.32 0.71
- 9.7471 l 0.3865 * - 0.0407 0.1164 20 2.42 0.71
aRSD: Residual standard deviation;
bR2: Determination coefficient;
‘P<O.O5; * ‘P<O.Ol; P<O.OOl.
LW: live weight; URLMD: ultrasound, 12-13th rib, longissimus dorsi muscle depth; URLMW: ultrasound, 12-13th rib, longissimus dorsi
muscle width, UVLMD: ultrasound, 3-4th lumbar vertebrae, longissimus dorsi muscle depth; UVLMW: ultrasound, 3-4th lumbar
vertebrae, longissimus dorsi muscle width, RLMA: carcass, 12-1361 rib, longissimus dorsi muscle area; VLMA: carcass, 3-4th lumbar
vertebrae, longissimus dorsi muscle area.
164 C. Femhdez et al./Small Ruminant Research 27 (1998) 159-165
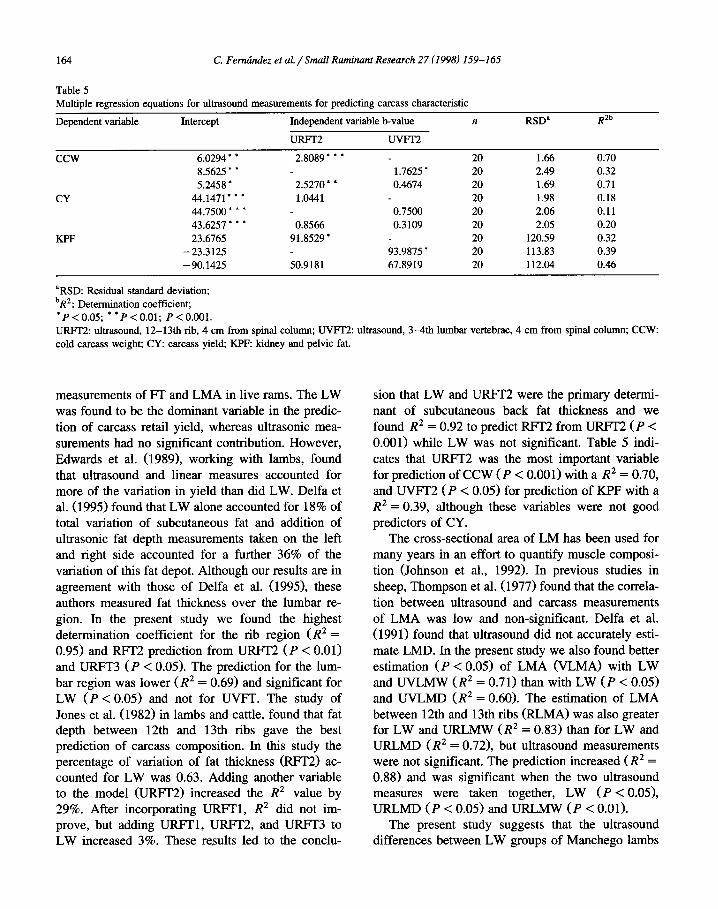
Table 5 Multiple regression equations for ultrasound measurements for predicting carcass characteristic
Dependent variable Independent variable b-value
URFT2 UVFT2
ccw 2.8089’ * * -
Intercept
6.0294 * *
8.5625 ’ *
5.2458 *
CY 44.1471* * *
44.7500 * ’ *
43.6257 = * *
KPF 23.6765
-23.3125
- 90.1425
n RSD” RZb
20 1.66 0.70
1.7625 * 20 2.49 0.32
2.5270 ’ ’ 0.4674 20 1.69 0.71
1.0441 20 1.98 0.18
0.7500 20 2.06 0.11
0.8566 0.3109 20 2.05 0.20
91.8529 * 20 120.59 0.32
93.9875 * 20 113.83 0.39
50.9181 67.8919 20 112.04 0.46
“RSD: Residual standard deviation;
bR2: Determination coefficient;
‘P < 0.05; **P<o.ol; P<O.OOl.
UNFIT: ultrasound, 12-13th rib, 4 cm from spinal column; UVFT2: ultrasound, 3-4th lumbar vertebrae, 4 cm from spinal column; CCW:
cold carcass weight; CY: carcass yield; KPFz kidney and pelvic fat.
measurements of FT and LMA in live rams. The LW was found to be the dominant variable in the predic- tion of carcass retail yield, whereas ultrasonic mea-
surements had no significant contribution. However, Edwards et al. (1989), working with lambs, found that ultrasound and linear measures accounted for more of the variation in yield than did LW. Delfa et al. (1995) found that LW alone accounted for 18% of total variation of subcutaneous fat and addition of ultrasonic fat depth measurements taken on the left and right side accounted for a further 36% of the variation of this fat depot. Although our results are in
agreement with those of Delfa et al. (1995), these authors measured fat thickness over the lumbar re-
gion. In the present study we found the highest determination coefficient for the rib region (R* = 0.95) and RFT2 prediction from URFT2 (P < 0.01) and URFT3 (P < 0.05). The prediction for the lum- bar region was lower (R* = 0.69) and significant for LW (P < 0.05) and not for UVFT. The study of Jones et al. (1982) in lambs and cattle, found that fat depth between 12th and 13th ribs gave the best prediction of carcass composition. In this study the percentage of variation of fat thickness (RFT2) ac- counted for LW was 0.63. Adding another variable to the model (URFT2) increased the R* value by 29%. After incorporating URFTI, R2 did not im- prove, but adding URFTl, URFT2, and URFT3 to LW increased 3%. These results led to the conclu-
sion that LW and URFT2 were the primary determi- nant of subcutaneous back fat thickness and we found R* = 0.92 to predict RFT2 from URFT2 (P <
0.001) while LW was not significant. Table 5 indi- cates that URFT2 was the most important variable for prediction of CCW (P < 0.001) with a R* = 0.70, and UVFI2 (P < 0.05) for prediction of KPF with a R* = 0.39, although these variables were not good predictors of CY.
The cross-sectional area of LM has been used for many years in an effort to quantify muscle composi- tion (Johnson et al., 1992). In previous studies in
sheep, Thompson et al. (1977) found that the correla- tion between ultrasound and carcass measurements of LMA was low and non-significant. Delfa et al. (199 1) found that ultrasound did not accurately esti- mate LMD. In the present study we also found better
estimation (P < 0.05) of LMA (VLMA) with LW and UVLMW (R* = 0.71) than with LW (P < 0.05) and UVLMD (R* = 0.60). The estimation of LMA between 12th and 13th ribs (RLMA) was also greater for LW and URLMW (R* = 0.83) than for LW and URLMD (R* = 0.72), but ultrasound measurements were not significant. The prediction increased (R* = 0.88) and was significant when the two ultrasound measures were taken together, LW (P < 0.05), URLMD (P < 0.05) and URLMW (P < 0.01).
The present study suggests that the ultrasound differences between LW groups of Manchego lambs
C. Fembndez et al./Small Ruminant Research 27 (1998) 159-165 165
using ultrasonic methods provide nondestructive means of measuring FT accretion and allow sequen- tial monitoring of an individual animal with minimal perturbation of growth. The combination of LW and
FT measurements generally accounted for the major- ity of the variation, with LM measures contributing a smaller, but often significant amount of variation. This is in line with the results obtained by Cisneros et al. (1996) in pigs. Results obtained in the present study indicate also that ultrasound prediction accu- racy of backfat thickness and LMA in Manchego
lambs was higher from the rib than lumbar region.
Acknowledgements
The authors would like to thank M.J. Fraga for advice during preparation of the manuscript and M. McDonagh for his assistance with the preperation of this manuscript in English.
References
Berlow, SM., Aneshansley, D.J., Throop, J.A., Stouffer, J.R.,
1989. Computer analysis of ultrasonic images for grading
beef. ASAE paper No. 89, Am. Sot. Agric. Eng., St. Joseph,
MI, 3569 pp.
Campbell, D., Stonaker, H.H., Esplin, A.L., 1959. The use of
ultrasonics to estimate the size of the longissimus dorsi muscle
in sheep. J. Anim. Sci. 24, 364-367.
Cisneros, F., Ellis, M., Miller, K.D., Novakofski, J., Wilson, E.R.,
McKeith, F.K., 1996. Comparison of transverse and longitudi-
nal real time ultrasound scans for prediction of lean cut yields
and fat free lean content in live pigs. J. Anim. Sci. 74,
2566-2576.
Delfa, R., Teixeira, A., Blasco, I., Colomer-Rocher, F., 1991.
Ultrasonic estimates of fat thickness, C measurement and
longissimus dorsi depth in Rasa Aragonesa ewes with same
bode condition score. Options Mediterianeennes, Ser. A 13,
25-30.
Delfa, R., Teixeira, A., Gonzalez, C., Blasco, I., 1995. Ultrasonic
estimates of fat thickness and longissimus muscle depth for
predicting carcass composition of live Aragon lambs. Small
Rumin. Res. 16, 159-164.
Edwards, J.W., Cannell, R.C., Garret, R.P., SaveIl, J.W., Cross,
H.R., Longnecker, M.T., 1989. Using ultrasound, linear mea-
surements and live fat thickness estimates to determine the
carcass composition on market lambs. J. Anim. Sci. 67, 3322-
3330.
Forrest, J.C., Kuei, C.H., Orcutt, M.W., Schinckel, A.P., Stouffer,
J.R., Judge, M.D., 1989. A review of potential new methods
of on-line pork carcass evaluation. J. Anim. Sci. 67, 2164
2169.
Glasbey, CA., Abdalla, I., Simm, G., 1996. Towards automatic
interpretation of sheep ultrasound scans. J. Anim. Sci. 74,
309-315.
Gresham, J.D., McPeake, S.R., Bernard, J.K., Henderson, H.H.,
1992. Commercial adaptation of ultrasonography to predict
pork carcass composition from live animal and carcass mea-
surements. J. Anim. Sci. 70, 631-639.
Hiner, R.L., 1958. Sound waves measure fat and lean. Meats,
December, 40 pp.
Johnson, E.R., Taylor, D.G., Priyanto, R., Meehan, D.P., 1992.
The value of eye muscle area in predicting carcass muscle.
Proc. Aust. Sot. Anim. Prod. 19, 68-70.
Jones, S.D.M., Walton, J.S., Wilton, J.W., Szkotnicki, J.E., 1982.
The use of urea dilution and ultrasonic backfat thickness to
predict the carcass composition of live lambs and cattle. Can.
J. Anim. Sci. 62, 371-379.
Kempster, A.J., Arnall, D., Alliston, J.C., Blarker, J.D., 1982. An
evaluation of two ultrasonic machines (Scanogram Danscaner)
for predicting the body composition of live sheep. Anim. Prod.
34, 249-255.
Moody, W.G., Zobrisky, S.E., Ross, C.V., Naumann, H.D., 1965.
Ultrasonic estimates of fat thickness and longissimus dorsi
area in lambs. J. Anim. Sci. 24, 364-367.
Statistical Analysis Systems Institute Inc., 1988. SAS/STAT
User’s Guide, Release 6.03 edn. SAS Institute Inc., Cary, NC,
1028 pp.
Shelton, M., Smith, G.C., Orts, F., 1977. Predicting carcass
cutability of Rambouillet rams using live animal traits. J.
Anim. Sci. 44, 333-337.
Simm, G., 1983. The use of ultrasound to predict the carcass
composition of live cattle-a review. Anim. Breeding Abstr.
51, 853-875.
Thompson, J.M., Pattie, W.A., Butterfield, R.M., 1977. An evalu-
ation of Scanogram as an ultrasonic aid in assessing carcase
composition of live sheep. Aust. J. Exp. Agric. Anim. Husb.
17, 251-255.