Embed Size (px)
Citation preview
NREL is a national laboratory of the U.S. Department of Energy Office of Energy Efficiency & Renewable Energy Operated by the Alliance for Sustainable Energy, LLC This report is available at no cost from the National Renewable Energy Laboratory (NREL) at www.nrel.gov/publications.
Contract No. DE-AC36-08GO28308
Validation of Multiple Tools for Flat Plate Photovoltaic Modeling Against Measured Data Janine Freeman, Jonathan Whitmore, Nate Blair, and Aron P. Dobos
Technical Report NREL/TP-6A20-61497 August 2014
NREL is a national laboratory of the U.S. Department of Energy Office of Energy Efficiency & Renewable Energy Operated by the Alliance for Sustainable Energy, LLC This report is available at no cost from the National Renewable Energy Laboratory (NREL) at www.nrel.gov/publications.
Contract No. DE-AC36-08GO28308
National Renewable Energy Laboratory 15013 Denver West Parkway Golden, CO 80401 303-275-3000 • www.nrel.gov
Validation of Multiple Tools for Flat Plate Photovoltaic Modeling Against Measured Data Janine Freeman, Jonathan Whitmore, Nate Blair, and Aron P. Dobos Prepared under Task No. SS13.5010
Technical Report NREL/TP-6A20-61497 August 2014
NOTICE
This report was prepared as an account of work sponsored by an agency of the United States government. Neither the United States government nor any agency thereof, nor any of their employees, makes any warranty, express or implied, or assumes any legal liability or responsibility for the accuracy, completeness, or usefulness of any information, apparatus, product, or process disclosed, or represents that its use would not infringe privately owned rights. Reference herein to any specific commercial product, process, or service by trade name, trademark, manufacturer, or otherwise does not necessarily constitute or imply its endorsement, recommendation, or favoring by the United States government or any agency thereof. The views and opinions of authors expressed herein do not necessarily state or reflect those of the United States government or any agency thereof.
This report is available at no cost from the National Renewable Energy Laboratory (NREL) at www.nrel.gov/publications.
Available electronically at http://www.osti.gov/scitech
Available for a processing fee to U.S. Department of Energy and its contractors, in paper, from:
U.S. Department of Energy Office of Scientific and Technical Information P.O. Box 62 Oak Ridge, TN 37831-0062 phone: 865.576.8401 fax: 865.576.5728 email: mailto:[email protected]
Available for sale to the public, in paper, from:
U.S. Department of Commerce National Technical Information Service 5285 Port Royal Road Springfield, VA 22161 phone: 800.553.6847 fax: 703.605.6900 email: [email protected] online ordering: http://www.ntis.gov/help/ordermethods.aspx
Cover Photos: (left to right) photo by Pat Corkery, NREL 16416, photo from SunEdison, NREL 17423, photo by Pat Corkery, NREL 16560, photo by Dennis Schroeder, NREL 17613, photo by Dean Armstrong, NREL 17436, photo by Pat Corkery, NREL 17721.
NREL prints on paper that contains recycled content.
3
This report is available at no cost from the National Renewable Energy Laboratory (NREL) at www.nrel.gov/publications.
Acknowledgments Portions of this report (enclosed by the symbol †) are taken verbatim from a previous work by the same authors, published in the 40th IEEE Photovoltaic Specialists Conference [1].
This work was supported by the U.S. Department of Energy under Contract No. DE-AC36-08-GO28308 with the National Renewable Energy Laboratory. The authors would like to thank the teams at PVsyst, PV*SOL, and RETScreen for their reviews of this work.
Abstract †In this validation study, comprehensive analysis is performed on nine photovoltaic systems for which NREL could obtain detailed performance data and specifications, including three utility-scale systems and six commercial scale systems. Multiple photovoltaic performance modeling tools were used to model these nine systems, and the error of each tool was analyzed compared to quality-controlled measured performance data. This study shows that, excluding identified outliers, all tools achieve annual errors within ±8% and hourly root mean squared errors less than 7% for all systems.† It is further shown using SAM that module model and irradiance input choices can change the annual error with respect to measured data by as much as 6.6% for these nine systems, although all combinations examined still fall within an annual error range of ±8.5%. Additionally, a seasonal variation in monthly error is shown for all tools. Finally, the effects of irradiance data uncertainty and the use of default loss assumptions on annual error are explored, and two approaches to reduce the error inherent in photovoltaic modeling are proposed.
4
This report is available at no cost from the National Renewable Energy Laboratory (NREL) at www.nrel.gov/publications.
1 Introduction and Significance †Building upon the work that started in a previous validation study comparing NREL's System Advisor Model (SAM) results to measured data from operating photovoltaic (PV) systems [2], NREL has performed a new study that expands the comparison to include three other photovoltaic performance modeling tools: PVWatts, PVsyst, and PV*SOL. These tools were chosen due to their popularity; additional modeling tools could be considered in future work. The purpose of validating multiple tools in addition to SAM is to give the industry greater confidence in PV modeling results, and to better characterize the abilities and limitations of PV performance modeling in general. Confidence in PV models helps projects secure competitive financing and more accurately characterize expected performance. To date, validation of these tools has been limited (e.g. [3] and [4]), and much validation work has focused on individual submodels, such as the work by Cameron et al [5]. This study seeks to characterize the error of multiple tools from end to end to see how the interaction of these submodels affects overall PV modeling tool error.†
5
This report is available at no cost from the National Renewable Energy Laboratory (NREL) at www.nrel.gov/publications.
2 About the Tools †The functionality of the tools used in this study overlap, although each tool contains some unique capabilities. A brief summary of each tool examined follows.
• SAM Version 2014.1.14 (sam.nrel.gov): a detailed performance and financial model allowing users to compare energy production and financial outlooks between multiple renewable energy technologies (not just PV).
• PVWatts Version 1 (pvwatts.nrel.gov): a relatively simple (few inputs) PV performance estimation tool designed to give users a starting point for evaluating the feasibility of a PV system.
• PVsyst Version 6.1.1 (pvsyst.com): a detailed PV performance modeling tool specializing in the "study, sizing, and data analysis of complete PV systems... geared to the needs of architects, engineers, researchers" [6].
• PV*SOL Expert Version 6.0 (solardesign.co.uk/pvsol-expert.php): a "3D software program for PV system design" [7], including detailed component selection, wiring design, and shading analysis.
We also considered including RETScreen Version 4 in the quantitative analysis, which is another relatively simple energy performance and financial modeling tool that allows users to "quickly and inexpensively determine the technical and financial viability of potential renewable energy, energy efficiency and cogeneration projects" [8]. However, this tool simulates only monthly energy production and only takes monthly weather inputs, making a quantitative comparison to the rest of the tools inconsistent because the others all use hourly data and produce hourly results. It is still included in the qualitative comparison of the tools as a reference.
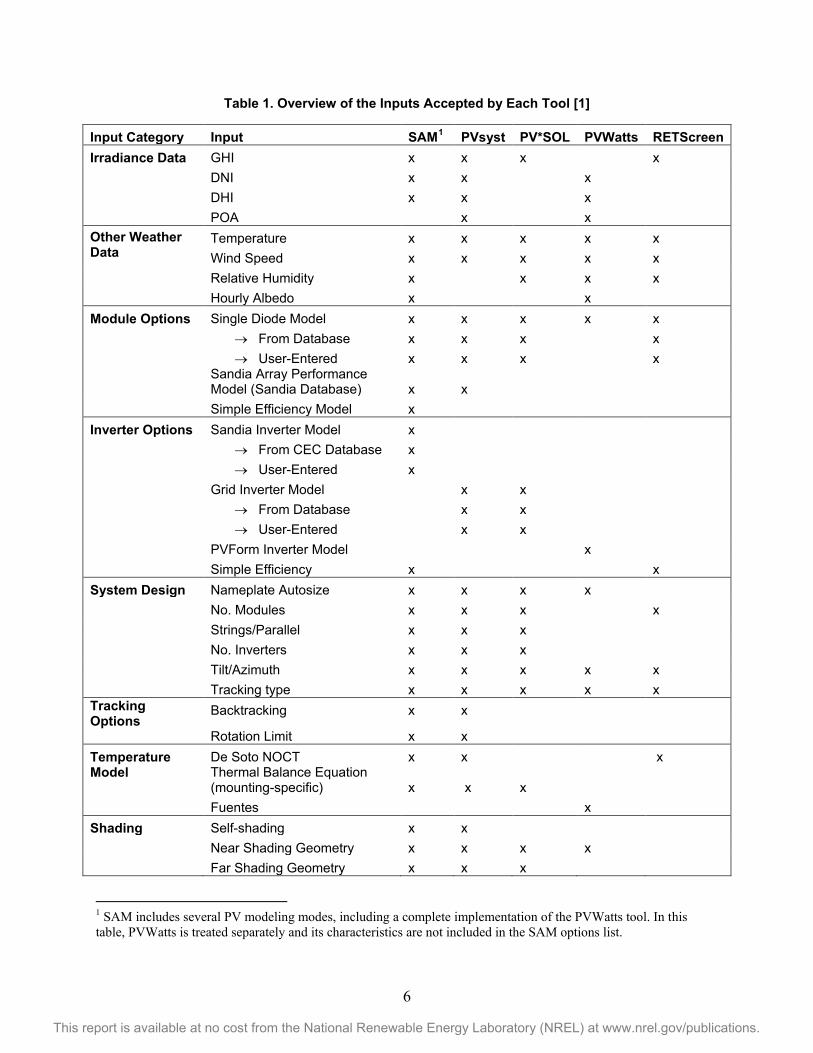
While the tools implement many of the same internal submodels, the inputs accepted and/or required for these tools differ slightly. The differences between expected inputs may give an indication of the complexity of the tools, as well as the aspects that each tool specializes in modeling. An overview of the input options available in each tool is shown in Table 1 (technical inputs only, financial models are not considered in this study).†
6
This report is available at no cost from the National Renewable Energy Laboratory (NREL) at www.nrel.gov/publications.
Table 1. Overview of the Inputs Accepted by Each Tool [1]
Input Category Input SAM1 PVsyst PV*SOL PVWatts RETScreen Irradiance Data GHI x x x x DNI x x
x
DHI x x
x POA x x Other Weather Data
Temperature x x x x x Wind Speed x x x x x Relative Humidity x
x x x
Hourly Albedo x x Module Options Single Diode Model x x x x x → From Database x x x x → User-Entered x x x x
Sandia Array Performance Model (Sandia Database) x x
Simple Efficiency Model x Inverter Options Sandia Inverter Model x
→ From CEC Database x → User-Entered x
Grid Inverter Model x x → From Database x x → User-Entered x x PVForm Inverter Model x Simple Efficiency x x System Design Nameplate Autosize x x x x No. Modules x x x x Strings/Parallel x x x No. Inverters x x x Tilt/Azimuth x x x x x Tracking type x x x x x Tracking Options
Backtracking x x
Rotation Limit x x Temperature Model
De Soto NOCT x x
x Thermal Balance Equation (mounting-specific) x x x
Fuentes x Shading Self-shading x x
Near Shading Geometry x x x x Far Shading Geometry x x x
1 SAM includes several PV modeling modes, including a complete implementation of the PVWatts tool. In this table, PVWatts is treated separately and its characteristics are not included in the SAM options list.
7
This report is available at no cost from the National Renewable Energy Laboratory (NREL) at www.nrel.gov/publications.
†As shown in Table 1, PVWatts and RETScreen accept the fewest system specifications as inputs. This is indicative of the relative simplicity of these tools, demonstrating that they are intended to perform preliminary estimations of the feasibility of a PV system with rough financial metrics, and not intended to perform in-depth performance modeling. SAM, PVsyst, and PV*SOL take far more inputs, indicating their more in-depth performance modeling capabilities. Additionally, as mentioned above, RETScreen’s temporal resolution is monthly, where the rest of the tools accept and simulate hourly data.†
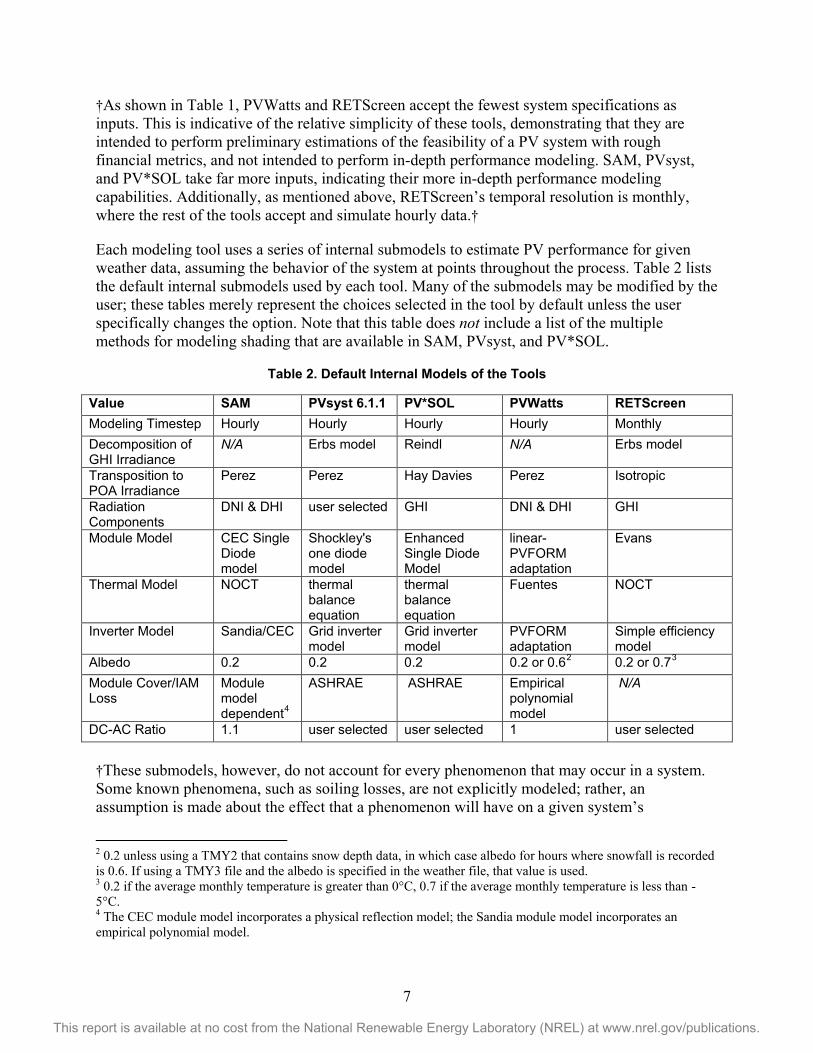
Each modeling tool uses a series of internal submodels to estimate PV performance for given weather data, assuming the behavior of the system at points throughout the process. Table 2 lists the default internal submodels used by each tool. Many of the submodels may be modified by the user; these tables merely represent the choices selected in the tool by default unless the user specifically changes the option. Note that this table does not include a list of the multiple methods for modeling shading that are available in SAM, PVsyst, and PV*SOL.
Table 2. Default Internal Models of the Tools
Value SAM PVsyst 6.1.1 PV*SOL PVWatts RETScreen Modeling Timestep Hourly Hourly Hourly Hourly Monthly Decomposition of GHI Irradiance
N/A Erbs model Reindl N/A Erbs model
Transposition to POA Irradiance
Perez Perez Hay Davies Perez Isotropic
Radiation Components
DNI & DHI user selected GHI DNI & DHI GHI
Module Model CEC Single Diode model
Shockley's one diode model
Enhanced Single Diode Model
linear- PVFORM adaptation
Evans
Thermal Model NOCT thermal balance equation
thermal balance equation
Fuentes NOCT
Inverter Model Sandia/CEC Grid inverter model
Grid inverter model
PVFORM adaptation
Simple efficiency model
Albedo 0.2 0.2 0.2 0.2 or 0.62 0.2 or 0.73 Module Cover/IAM Loss
Module model dependent4
ASHRAE ASHRAE Empirical polynomial model
N/A
DC-AC Ratio 1.1 user selected user selected 1 user selected
†These submodels, however, do not account for every phenomenon that may occur in a system. Some known phenomena, such as soiling losses, are not explicitly modeled; rather, an assumption is made about the effect that a phenomenon will have on a given system’s
2 0.2 unless using a TMY2 that contains snow depth data, in which case albedo for hours where snowfall is recorded is 0.6. If using a TMY3 file and the albedo is specified in the weather file, that value is used. 3 0.2 if the average monthly temperature is greater than 0°C, 0.7 if the average monthly temperature is less than -5°C. 4 The CEC module model incorporates a physical reflection model; the Sandia module model incorporates an empirical polynomial model.
8
This report is available at no cost from the National Renewable Energy Laboratory (NREL) at www.nrel.gov/publications.
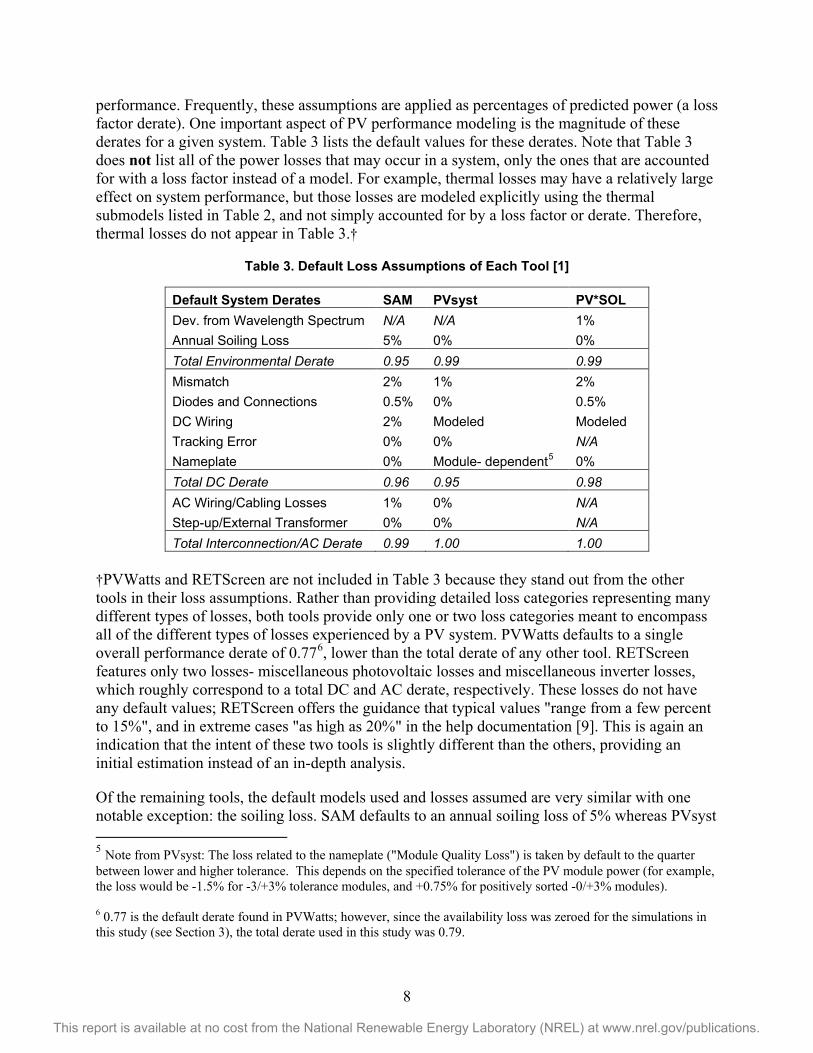
performance. Frequently, these assumptions are applied as percentages of predicted power (a loss factor derate). One important aspect of PV performance modeling is the magnitude of these derates for a given system. Table 3 lists the default values for these derates. Note that Table 3 does not list all of the power losses that may occur in a system, only the ones that are accounted for with a loss factor instead of a model. For example, thermal losses may have a relatively large effect on system performance, but those losses are modeled explicitly using the thermal submodels listed in Table 2, and not simply accounted for by a loss factor or derate. Therefore, thermal losses do not appear in Table 3.†
Table 3. Default Loss Assumptions of Each Tool [1]
Default System Derates SAM PVsyst PV*SOL Dev. from Wavelength Spectrum N/A N/A 1% Annual Soiling Loss 5% 0% 0% Total Environmental Derate 0.95 0.99 0.99 Mismatch 2% 1% 2% Diodes and Connections 0.5% 0% 0.5% DC Wiring 2% Modeled Modeled Tracking Error 0% 0% N/A Nameplate 0% Module- dependent5 0% Total DC Derate 0.96 0.95 0.98 AC Wiring/Cabling Losses 1% 0% N/A Step-up/External Transformer 0% 0% N/A Total Interconnection/AC Derate 0.99 1.00 1.00
†PVWatts and RETScreen are not included in Table 3 because they stand out from the other tools in their loss assumptions. Rather than providing detailed loss categories representing many different types of losses, both tools provide only one or two loss categories meant to encompass all of the different types of losses experienced by a PV system. PVWatts defaults to a single overall performance derate of 0.776, lower than the total derate of any other tool. RETScreen features only two losses- miscellaneous photovoltaic losses and miscellaneous inverter losses, which roughly correspond to a total DC and AC derate, respectively. These losses do not have any default values; RETScreen offers the guidance that typical values "range from a few percent to 15%", and in extreme cases "as high as 20%" in the help documentation [9]. This is again an indication that the intent of these two tools is slightly different than the others, providing an initial estimation instead of an in-depth analysis.
Of the remaining tools, the default models used and losses assumed are very similar with one notable exception: the soiling loss. SAM defaults to an annual soiling loss of 5% whereas PVsyst 5 Note from PVsyst: The loss related to the nameplate ("Module Quality Loss") is taken by default to the quarter between lower and higher tolerance. This depends on the specified tolerance of the PV module power (for example, the loss would be -1.5% for -3/+3% tolerance modules, and +0.75% for positively sorted -0/+3% modules). 6 0.77 is the default derate found in PVWatts; however, since the availability loss was zeroed for the simulations in this study (see Section 3), the total derate used in this study was 0.79.
9
This report is available at no cost from the National Renewable Energy Laboratory (NREL) at www.nrel.gov/publications.
and PV*SOL default to soiling losses of 0%. In its help documentation, PVsyst suggests that in medium-rainy climates, a 0% soiling loss may be appropriate, but reiterates that soiling is "an uncertainty which strongly depends on the environment of the system, raining conditions, etc." and points to a few sources that may offer guidance to users [6]. PV*SOL provides an input for soiling, but does not mention it in the documentation [10]. This is perhaps an indication of the setup ideology of SAM versus PVsyst and PV*SOL; SAM is designed such that it can be run without changing any inputs, whereas this is not the intent of the other two tools.
Advanced users with access to historical performance data might be able to calibrate the loss assumptions in any of the five tools (including PVWatts and RETScreen) for higher accuracy. The main difference is that the more detailed tools (SAM, PVsyst, PV*SOL) allow for more granular adjustment of these loss assumptions and more control over where they are applied in the overall modeling process.†
10
This report is available at no cost from the National Renewable Energy Laboratory (NREL) at www.nrel.gov/publications.
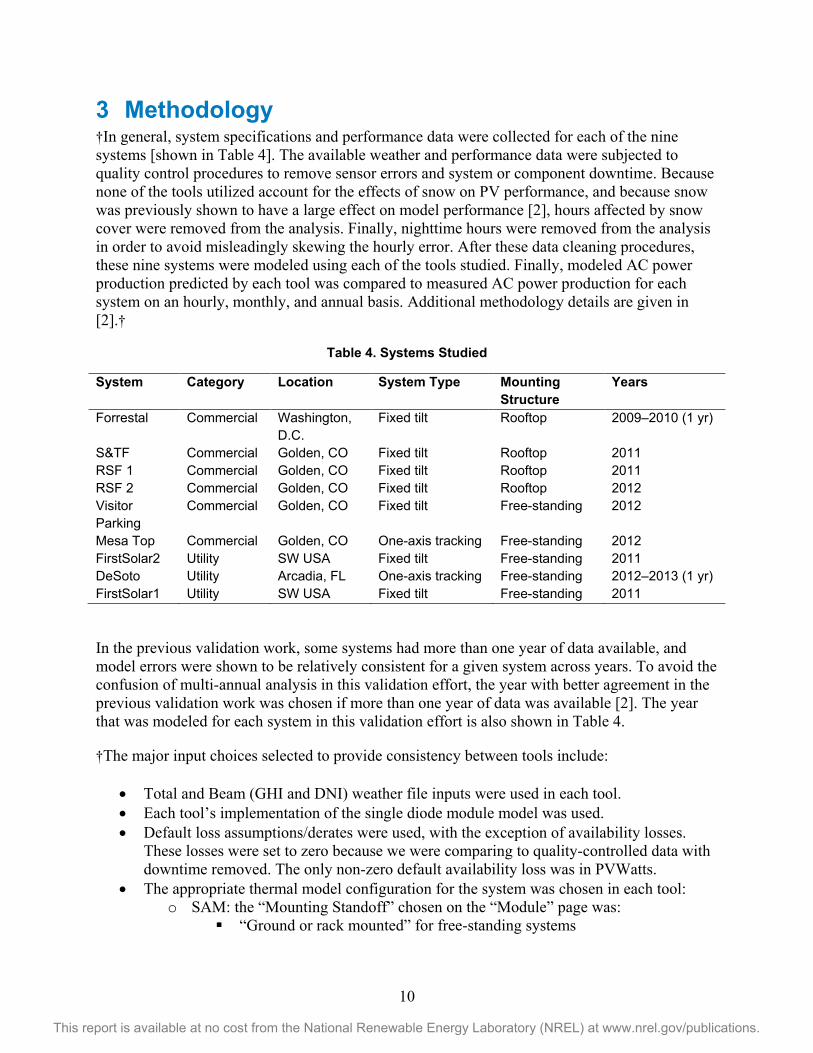
3 Methodology †In general, system specifications and performance data were collected for each of the nine systems [shown in Table 4]. The available weather and performance data were subjected to quality control procedures to remove sensor errors and system or component downtime. Because none of the tools utilized account for the effects of snow on PV performance, and because snow was previously shown to have a large effect on model performance [2], hours affected by snow cover were removed from the analysis. Finally, nighttime hours were removed from the analysis in order to avoid misleadingly skewing the hourly error. After these data cleaning procedures, these nine systems were modeled using each of the tools studied. Finally, modeled AC power production predicted by each tool was compared to measured AC power production for each system on an hourly, monthly, and annual basis. Additional methodology details are given in [2].†
Table 4. Systems Studied
System Category Location System Type Mounting Structure
Years
Forrestal Commercial Washington, D.C.
Fixed tilt Rooftop 2009–2010 (1 yr)
S&TF Commercial Golden, CO Fixed tilt Rooftop 2011 RSF 1 Commercial Golden, CO Fixed tilt Rooftop 2011 RSF 2 Commercial Golden, CO Fixed tilt Rooftop 2012 Visitor Parking
Commercial Golden, CO Fixed tilt Free-standing 2012
Mesa Top Commercial Golden, CO One-axis tracking Free-standing 2012 FirstSolar2 Utility SW USA Fixed tilt Free-standing 2011 DeSoto Utility Arcadia, FL One-axis tracking Free-standing 2012–2013 (1 yr) FirstSolar1 Utility SW USA Fixed tilt Free-standing 2011
In the previous validation work, some systems had more than one year of data available, and model errors were shown to be relatively consistent for a given system across years. To avoid the confusion of multi-annual analysis in this validation effort, the year with better agreement in the previous validation work was chosen if more than one year of data was available [2]. The year that was modeled for each system in this validation effort is also shown in Table 4.
†The major input choices selected to provide consistency between tools include:
• Total and Beam (GHI and DNI) weather file inputs were used in each tool. • Each tool’s implementation of the single diode module model was used. • Default loss assumptions/derates were used, with the exception of availability losses.
These losses were set to zero because we were comparing to quality-controlled data with downtime removed. The only non-zero default availability loss was in PVWatts.
• The appropriate thermal model configuration for the system was chosen in each tool: o SAM: the “Mounting Standoff” chosen on the “Module” page was:
“Ground or rack mounted” for free-standing systems
11
This report is available at no cost from the National Renewable Energy Laboratory (NREL) at www.nrel.gov/publications.
“Greater than 3.5 inches” for rooftop systems (information about the actual standoff distances was not available)
o PVsyst: the “Constant loss factor Uc” chosen in the “Field Thermal Loss Factor” section of the detailed loss parameters page was7: 29 W/m2K for free-standing systems 20 W/m2K for rooftop systems
o PV*SOL: the “Installation Type” chosen was: “Free-Standing” for free-standing systems “With Ventilation” for rooftop systems
o PVWatts: No mounting structure input option is available in PVWatts Version 1.† 3.1 Differences from Previous Validation Work Before presenting results, it is important to acknowledge that many of the results presented here do not match the results presented in the previous validation study [2]. There are a variety of reasons for these differences, outlined below:
• Resolved Backtracking Implementation: As mentioned in [2], the implementation of the backtracking algorithm in previous versions of SAM was discovered to be incorrect. This was resolved in the 2014.1.14 version of SAM used in this validation. This affects the DeSoto and Mesa Top systems.
• Updated User-Input Inverter Option: The DeSoto system used an inverter not found in the Sandia inverter database, the source for most inverter data. A more accurate option to model this inverter was added to the 2014.1.14 version of SAM: the "Inverter Part-Load Curve" option. This study uses that option instead of the "Single Point Efficiency" option used in the previous validation study. Using the more accurate part-load curve option affects the results of the DeSoto system only.
• Measured Data Aggregation Timeshift: Sunpower’s online tool used to download measured data for their systems featured a method of aggregating 15-minute data to hourly data that caused a 15-minute timeshift between measured data and modeled data for those systems. This shift was not identified in the previous validation study, but it became more apparent when measured data was compared to modeled results from multiple tools. This unexpected method of aggregation was confirmed with Sunpower and fixed for this validation study [11]. This affects the RSF2 and Visitor Parking systems.
• Irradiance Inputs and Module Model Choices: As shown in Table 2, the majority of the tools' default module models are based on a single-diode model, including the CEC module model that is the default in SAM. For this study, we decided to use exclusively the CEC single-diode module model option within SAM for consistent comparisons between the tools. Additionally, because PVsyst does not accept Beam and Diffuse as a possible combination of irradiation inputs (each can be input individually or with Total, but not with each other), we used the Total and Beam irradiation input option in SAM in
7 Per guidance from PVsyst.
12
This report is available at no cost from the National Renewable Energy Laboratory (NREL) at www.nrel.gov/publications.
order to be consistent with PVsyst, whereas the previous study used the default Beam and Diffuse option in SAM. These two changes affect the S&TF, Forrestal, RSF1, RSF2, Visitor Parking, DeSoto, FirstSolar1, and FirstSolar2 systems.
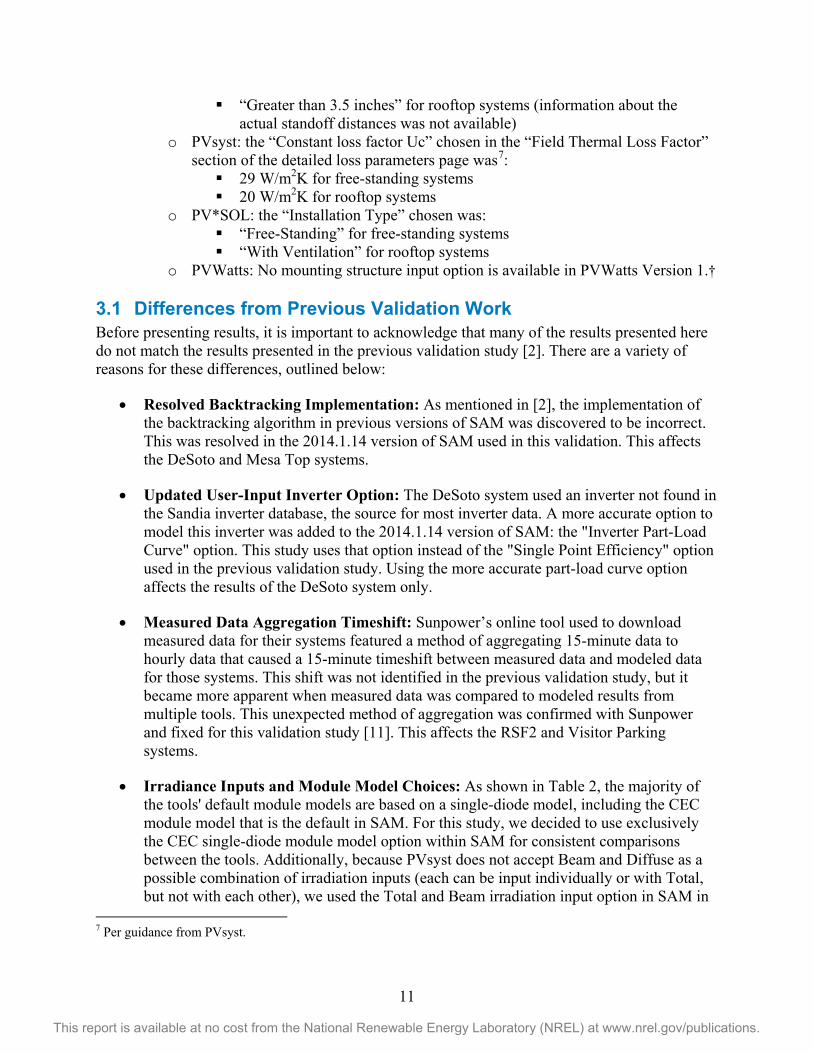
In the previous validation study, we compared the annual error between predicted and measured DC power for the various combinations of transposition and module model options in SAM for the Forrestal system, and we showed that all four model option combinations perform relatively closely to one another for that system [2]. In this validation effort, we wished to more fully quantify the differences explained in the final bullet of the above list by expanding this comparison to all 9 systems. This comparison between measured and modeled AC power production for these four model option combinations is shown in Figure 1.
Figure 1. Annual error (modeled-measured) using different module models and irradiation inputs in SAM
This figure shows that changing the module model and/or the irradiance input options used within SAM does have an effect on the annual error. Changing these two model options may change the error with respect to measured data by as little as 0.9% to as much as 6.6% in these nine systems, although all combinations examined still fall within an annual error range of ±8.5%. The magnitude and direction of these changes in annual error are not consistent between systems for a given model option change, and no one combination stands out as having the highest or lowest absolute annual error for all systems. Future work should investigate the differences between module models and irradiance inputs in an effort to try to determine which options might be the most appropriate choice to model different scenarios.
Because there was no clearly superior option, we continued with our choice to use the CEC single-diode module model and Total and Beam irradiance inputs in SAM for consistency with

13
This report is available at no cost from the National Renewable Energy Laboratory (NREL) at www.nrel.gov/publications.
the other tools. The CEC module model is both the default model and the more popular module model choice in SAM due to its large database of modules. Due to the large influence of irradiance inputs on model error, it is more consistent in a multi-tool comparison to input the same irradiance components into all tools where possible. Note that some module model and irradiance input options are available in other tools as well, but these two model choices allowed for as consistent of a comparison as possible between all the tools.
14
This report is available at no cost from the National Renewable Energy Laboratory (NREL) at www.nrel.gov/publications.
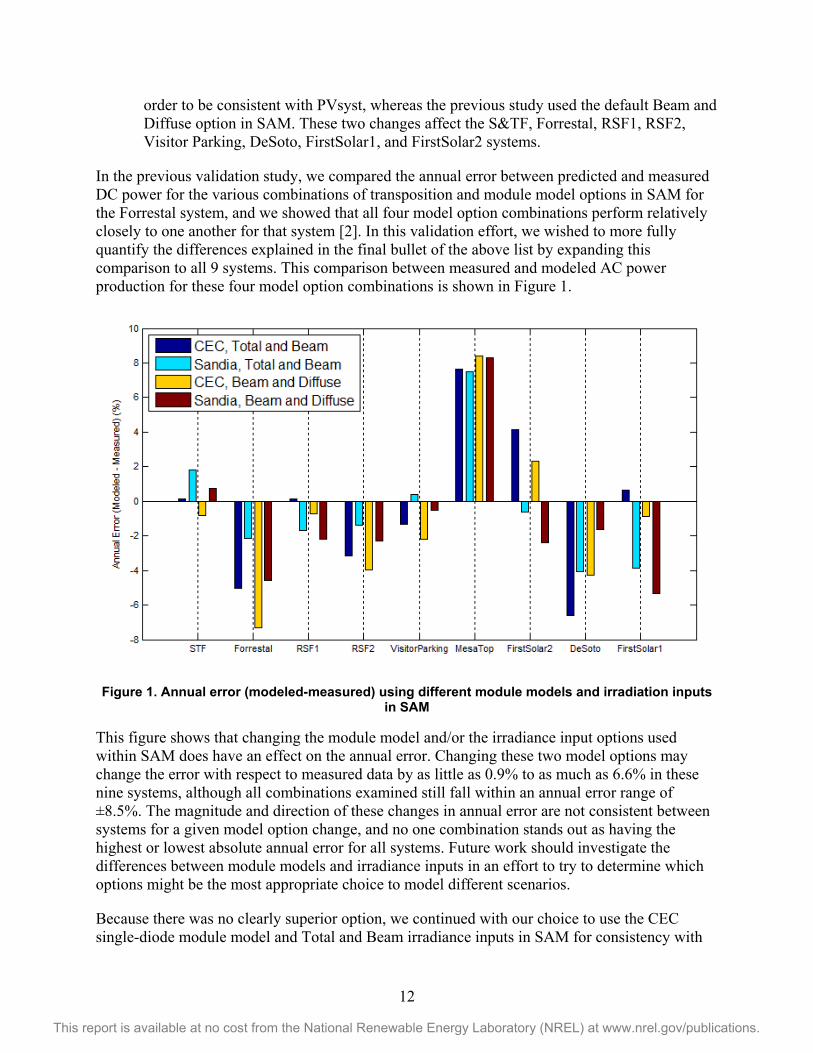
4 Quantitative Results 4.1 Annual Results †Annual error is computed as the total predicted annual AC energy production minus the total measured annual AC energy production, normalized by the total measured annual AC energy production. The annual error is presented in Figures 2a and 2b for all nine systems using the default loss assumptions of the available tools. Note that we were unable to model the two largest systems, DeSoto and FirstSolar1, with PV*SOL because the “Expert” version limits the number of modules that can be used in a simulation to six subarrays of 65535 modules each, which is not enough modules to model a larger utility-scale system.†
Figure 2a. Annual error (modeled-measured) using each tool, sorted in order of system size [1]
15
This report is available at no cost from the National Renewable Energy Laboratory (NREL) at www.nrel.gov/publications.
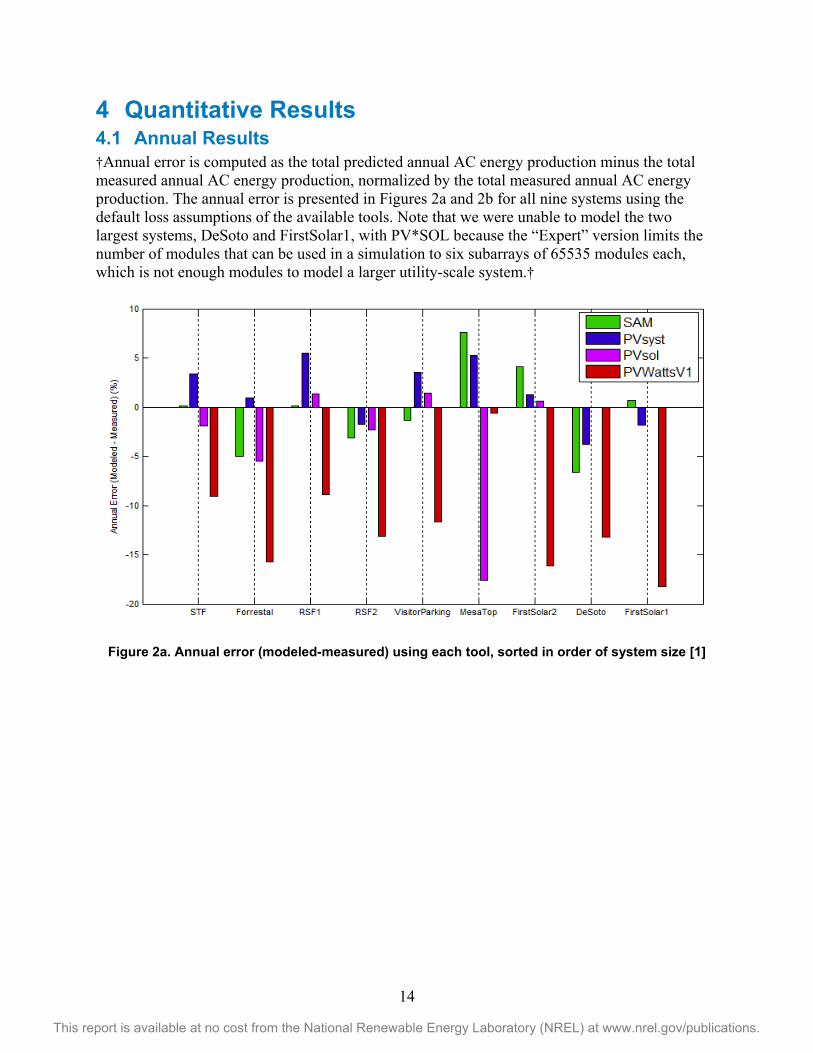
Figure 2b. Close-up of annual error with outliers excluded, sorted in order of system size [1]
†PV*SOL shows significantly higher error for the Mesa Top System than any of the other examined systems. This is expected since PV*SOL does not take row-to-row spacing or backtracking limits as inputs, meaning that it inherently cannot correctly model a one-axis tracking system. Therefore, this result is considered an outlier and removed from overall results. Note that we were unable to model the other one-axis tracking system in PV*SOL, since it is one of the two largest systems.
Among the various tools, PVWatts quickly emerges as an outlier due to its greater underprediction of every system compared to the other tools. This underprediction ranges from -0.6% to -18.3%, averaging -11.9%. The underprediction is much less apparent in the Mesa Top system than the other systems due to the fact that PVWatts assumes that one-axis tracking systems are unshaded, which is not an accurate assumption for this system. This trend of underprediction is an indication that the default derate of 0.77 is too low for many real systems compared to measured operation. NREL is working to update the PVWatts derate to a more appropriate value.
Apart from these two outliers, there were no apparent correlations between system characteristics (size, location, technology type, etc.) and the magnitude of model error for that system. Future work should further investigate correlations in order to identify possible sources of error.
Table 5 shows the range of errors seen with each tool for a subset of six systems (S&TF, Forrestal, RSF1, RSF2, Visitor Parking, and FirstSolar2). This subset was chosen because these systems can be appropriately modeled by all of the tools. All errors shown in the table were calculated using the model choices listed in Section 3.†
16
This report is available at no cost from the National Renewable Energy Laboratory (NREL) at www.nrel.gov/publications.
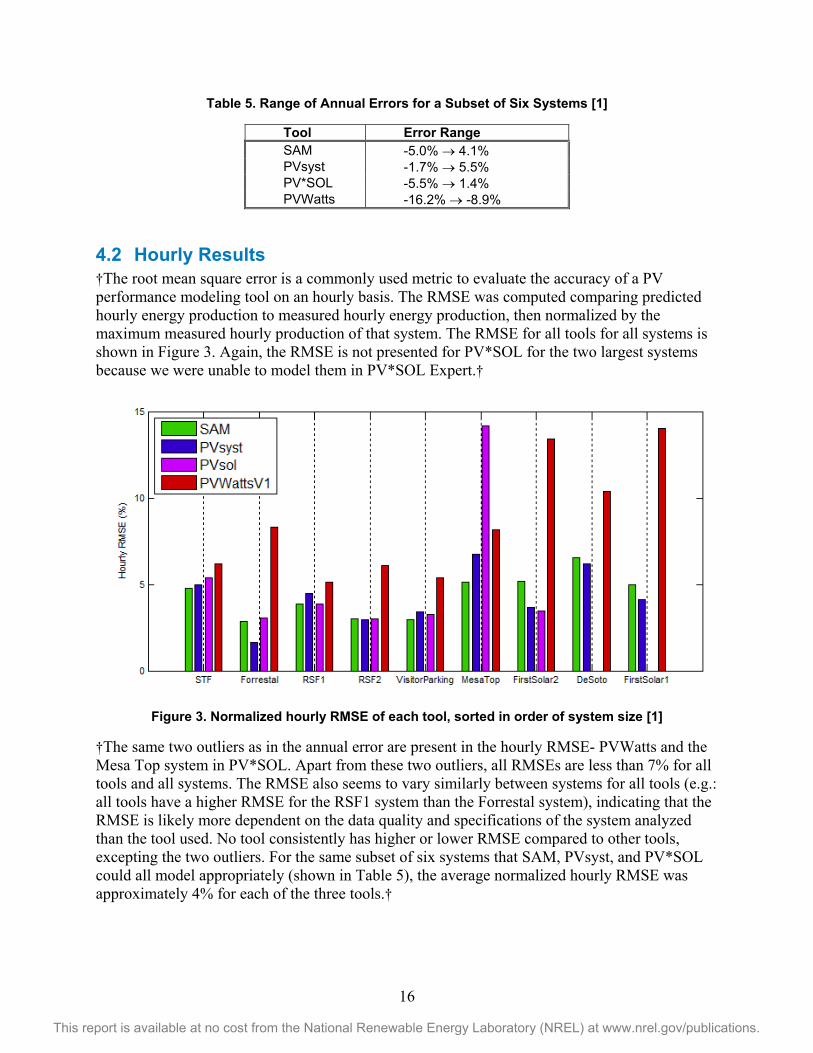
Table 5. Range of Annual Errors for a Subset of Six Systems [1]
Tool Error Range SAM -5.0% → 4.1% PVsyst -1.7% → 5.5% PV*SOL -5.5% → 1.4% PVWatts -16.2% → -8.9%
4.2 Hourly Results †The root mean square error is a commonly used metric to evaluate the accuracy of a PV performance modeling tool on an hourly basis. The RMSE was computed comparing predicted hourly energy production to measured hourly energy production, then normalized by the maximum measured hourly production of that system. The RMSE for all tools for all systems is shown in Figure 3. Again, the RMSE is not presented for PV*SOL for the two largest systems because we were unable to model them in PV*SOL Expert.†
Figure 3. Normalized hourly RMSE of each tool, sorted in order of system size [1]
†The same two outliers as in the annual error are present in the hourly RMSE- PVWatts and the Mesa Top system in PV*SOL. Apart from these two outliers, all RMSEs are less than 7% for all tools and all systems. The RMSE also seems to vary similarly between systems for all tools (e.g.: all tools have a higher RMSE for the RSF1 system than the Forrestal system), indicating that the RMSE is likely more dependent on the data quality and specifications of the system analyzed than the tool used. No tool consistently has higher or lower RMSE compared to other tools, excepting the two outliers. For the same subset of six systems that SAM, PVsyst, and PV*SOL could all model appropriately (shown in Table 5), the average normalized hourly RMSE was approximately 4% for each of the three tools.†
17
This report is available at no cost from the National Renewable Energy Laboratory (NREL) at www.nrel.gov/publications.
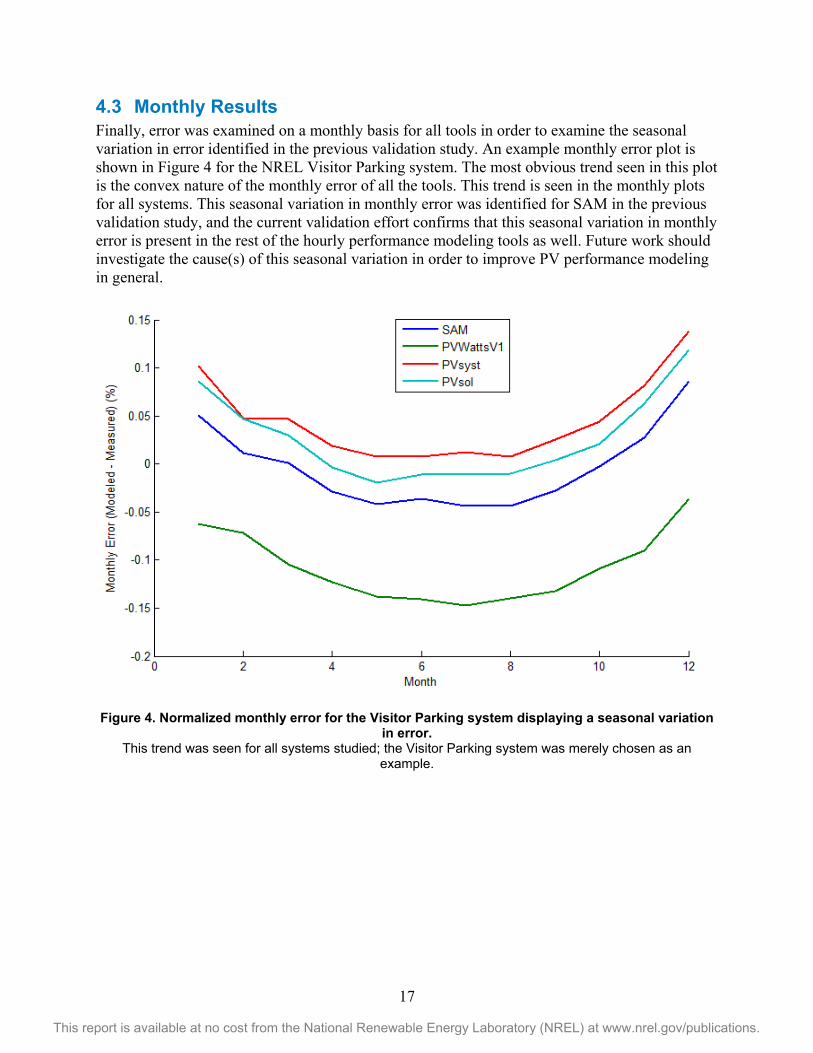
4.3 Monthly Results Finally, error was examined on a monthly basis for all tools in order to examine the seasonal variation in error identified in the previous validation study. An example monthly error plot is shown in Figure 4 for the NREL Visitor Parking system. The most obvious trend seen in this plot is the convex nature of the monthly error of all the tools. This trend is seen in the monthly plots for all systems. This seasonal variation in monthly error was identified for SAM in the previous validation study, and the current validation effort confirms that this seasonal variation in monthly error is present in the rest of the hourly performance modeling tools as well. Future work should investigate the cause(s) of this seasonal variation in order to improve PV performance modeling in general.
Figure 4. Normalized monthly error for the Visitor Parking system displaying a seasonal variation in error.
This trend was seen for all systems studied; the Visitor Parking system was merely chosen as an example.
18
This report is available at no cost from the National Renewable Energy Laboratory (NREL) at www.nrel.gov/publications.
5 Conclusions and Discussion †This work highlights the distinction between the three detailed performance modeling tools examined (SAM, PVsyst, and PV*SOL), and the simpler tool, PVWatts. PVWatts underestimates all systems due to its much higher default loss assumptions compared to the detailed tools. If adjusted, PVWatts could do a much better job predicting annual performance. This default loss value is being updated in an upcoming release of PVWatts in order to make it more representative of modern systems.
Of the three detailed performance modeling tools (excluding one-axis tracking systems in PV*SOL, which the makers of PV*SOL confirm that this tool does not accurately model), all annual errors were within ±8% and all hourly RMSEs were less than 7% for all systems.† The same seasonal variation in error seen in the previous validation study was also seen in this study for all tools, indicating a need for further research of this phenomenon. Finally, it was demonstrated using SAM that the error is affected by the module model choice (single-diode versus Sandia module model) and choice of irradiance inputs (Total and Beam versus Beam and Diffuse); choosing different options changed the annual error with respect to measured data by as much as 6.6% in these nine systems, although all combinations examined still fall within an annual error range of ±8.5%. However, the magnitude and direction of these changes in error are not consistent between systems for any given combination of these two model choices. This indicates a need for further investigation of which choices might be more appropriate in different scenarios.
†One important consideration in the evaluation of these results is that the error includes measurement uncertainty of the irradiance data being input into the models. The minimum uncertainty of high-quality measured irradiance data ranges from approximately 2-8% depending on the instrument used and how well it is maintained. Therefore, the model errors seen in this study could be within the uncertainty of the irradiance data used for these systems. However, it is difficult to disaggregate irradiance measurement error from model error. This makes running sensitivity analysis an important part of PV modeling. Running multiple weather sets through a PV modeling tool can help a user to hone in on the best possible estimate of energy production.
Another opportunity to reduce model error lies in the derate or loss assumptions used in PV modeling. In this study, the default derates were used in all tools, with the exception of the availability loss. As with any other model, all PV models (including PVWatts) can be “tuned” to get the correct annual number for a given system by adjusting the derates. Expert PV modelers may have the data and experience to make more accurate loss assumptions for a given system; however, the data to make informed PV modeling derate assumptions is lacking in the industry as a whole. Because derates can have such a large effect on the accuracy of energy predictions, improving derate assumptions is a prime opportunity for the industry to reduce PV modeling error.
Two avenues to enable all modelers to make more informed decisions about system losses include (1) developing models to replace some of the derates in PV modeling today, which would enable a better prediction of the effect of certain factors on energy production, and (2) providing better guidance on what values to use for certain derates by performing studies to determine more representative values for a given system characteristic (e.g. average soiling derates by location).†
19
This report is available at no cost from the National Renewable Energy Laboratory (NREL) at www.nrel.gov/publications.
References [1] J. Freeman, J. Whitmore, N. Blair, and A. P. Dobos, “Validation of multiple tools for flat plate photovoltaic modeling against measured data,” 40th IEEE Photovoltaic Specialists Conference, 2014.
[2] J. Freeman, J. Whitmore, L. Kaffine, N. Blair, and A. P. Dobos, “System advisor model: Flat plate photovoltaic performance modeling validation report,” NREL Technical Report, NREL/TP-6A20-60204, 2013.
[3] F. Carigiet, F. Baumgartner, J. Sutterlueti, N. Allet, M. Pezzotti, and J. Haller, “Verification of Measured PV Energy Yield Versus Forecast and Loss Analysis.” 28th European PV Solar Energy Conference, 2013.
[4] G.R. Lee, L. Frearson, and P. Rodden, “An Assessment of Photovoltaic Modelling Software Using Real World Performance Data.” 26th European PV Solar Energy Conference, 2011.
[5] C. Cameron, W. Boyson, and D. Riley, “Comparison of PV System Performance-Model Predictions with Measured PV System Performance.” 38th IEEE Photovoltaic Specialists Conference, 2008.
[6] PVsyst help documentation, http://files.pvsyst.com/ help/, Accessed 1/29/2014.
[7] Valentin Software, PV*SOL Expert, http://www.solardesign.co.uk/pvsol-expert.php, Accessed 1/29/2014.
[8] Natural Resources Canada, RETScreen, http://www.retscreen.net/ang/home.php, Accessed 1/29/2014.
[9] Natural Resources Canada, RETScreen Help Documentation, Available in the tool, 2014.
[10] Valentin Software, PV*SOL Expert help documentation, http://www.valentin-software. com/sites/default/files/downloads/handbuecher/en/manual-pvsol-en.pdf, Accessed 1/29/2014.
[11] Private correspondence, B. Bourne, Sunpower Corporation, 12/16/2013.
Model References De Soto, W.L. (2004). "Improvement and Validation of a Model for Photovoltaic Array Performance." University of Wisconsin-Madison. Accessed February 26, 2014: http://sel.me.wisc.edu/publications/theses/desoto04.zip
King, D.L.; Boyson, W.E.; and Kratochvil, J.A. (2004). "Photovoltaic Array Performance Model." 41 pp.; Albuquerque, NM: Sandia National Laboratories. Sandia Report No. 2004-3535. Accessed February 22, 2014: http://prod.sandia.gov/techlib/access-control.cgi/2004/043535.pdf
Neises T. (2011). Development and Validation of a Model to Predict the Temperature of a Photovoltaic Cell. Master of Science Thesis. University of Wisconsin-Madison. http://sel.me.wisc.edu/publications/theses/neises11.zip.
20
This report is available at no cost from the National Renewable Energy Laboratory (NREL) at www.nrel.gov/publications.
King D.; Gonzalez, S.; Galbraith, G.; Boyson, W. (2007). Performance Model for Grid-Connected Photovoltaic Inverters. Sandia National Laboratories. SAND2007-5036. http://infoserve.sandia.gov/sand_doc/2007/075036.pdf