Embed Size (px)
Citation preview
- Validation of plant functional types across two contrasting landscapes - 167
Journal of Vegetation Science 13: 167-178, 2002© IAVS; Opulus Press Uppsala. Printed in Sweden
Abstract. The validation of plant functional type modelsacross contrasting landscapes is seen as a step towards theclaim that plant functional types should recur regionally oreven globally. I sampled the vegetation of an urban landscapeon a range of sites representing gradients of resource supplyand disturbance intensity. A group of plants with similarattributes was considered a ‘functional type’, if the speciessignificantly co-occurred in a certain segment of the gradientplane of resource supply and disturbance intensity. Vegetativeand regeneration traits were considered. A similar study wasperformed in a nearby agricultural landscape (Kleyer 1999).The logistic regression models from the urban landscape wereapplied to the data set of the agricultural landscape and viceversa. Although the overall environment of the two land-scapes was very different, recurrent patterns of several func-tional types were found. At high fertility and high disturbancelevels, annual species predominated with a persistent seedbank, high seed output, and short vertical expansion. Whendisturbances changed from below-ground to above-ground,the sexual regeneration mode was replaced by the vegetativemode, while vertical expansion remained low. At mediumdisturbance intensities, the vertical expansion and vegetativeregeneration increased with fertility, while the seed bankremained mostly transient to short-term persistent and lateralexpansion and sexual regeneration was intermediate. At lowdisturbances and low resource supplies, seed bank longevity,and vertical and lateral expansion tended to be long. Diversityof groups of plants with similar attributes was highest atintermediate disturbance levels and low fertility. These resultscorrespond with Grime’s humped-back model and Connell’sintermediate disturbance hypothesis.
Keywords: Disturbance; Fertility; Logistic regression; Trait;Urban landscape.
Nomenclature: Ellenberg et al. (1991) for plants; Anon.(1988; modified) for soil types.
Validation of plant functional types across two contrasting landscapes
Kleyer, Michael
Landscape Ecology Group (FB 7), University of Oldenburg, D-26111Oldenburg, Germany;Fax +494417985659; E-mail [email protected]
Introduction
Plant functional types (PFTs) are defined as groupsof plant species with similar plant traits and similarrealized niches with respect to multiple environmentalfactors (Skarpe 1996; Lavorel et al. 1997). Traits such asplant architecture and height, seed bank longevity, at-tributes of the dispersule or seed weight and number arefundamental to relevant aspects of plant life history, e.g.storage effects (Warner & Chesson 1985), competitiveability or colonization. Niche patterns should resultfrom syndromes, i.e. suites of attributes of traits – ortrait states (Semenova & van der Maarel 2000) thatrepresent functional adaptations of plants to the envi-ronment (Stebbins 1974; McIntyre et al. 1999; Chapinet al. 1993). When comparing syndromes along envi-ronmental gradients, general principles about functionalplant-environment relations may be identified.
If a functional relation is demonstrated between setsof biological attributes and environmental factors, thepattern should recur in other landscapes or even otherbiogeographical regions. This assumption has been putforward by several authors (e.g. Gitay & Noble 1997;McIntyre et al. 1999) but has hardly been confirmed.Generally, the validation of regional statistical modelswith independent data sets from other regions is animportant step in the development of general models(Mankin et al. 1977; Schamberger & O’Neil 1986).However, most of the few ecological studies involvingthe transferability of models across different landscapesare for single species only (Capen et al. 1986; Friedel etal. 1988; Thomas & Bovee 1993; Fielding & Haworth1995; Özesmi & Mitsch 1997; Kotowski et al. 1998;Schröder & Richter 2000).
A reasonable way to confirm the recurrence of PFTsis to sample the vegetation of two landscapes at the sametime and applying the same methodology. If compara-ble patterns emerge, some kind of generality can beassumed. However, hardly any two landscapes can beexpected to be identical with respect to all environmentalfactors. Environmental differences should be reflectedin PFTs that are unique to each of these landscapes.
168 Kleyer, M.
The objective of this study is to compare the PFTdistribution of two contrasting landscapes in southwestGermany, in order to validate statistical PFT models, torelate unique PFTs to landscape specific habitat factorsand to generalize syndrome-environment relations acrosslandscapes.
For an agricultural landscape, Kleyer (1999) pro-vided statistical habitat models for plant groups withsimilar traits to predict plant functional types on gra-dients of disturbance intensity and resource supply. Inthe present study, similar investigations were done in anurban landscape. A test of transferability of statisticalmodels across both landscapes separates PFTs in thosevalid for both agricultural and urban environments andthose that are unique to either agricultural or urban envi-ronments. The trait set relates to dispersal, vertical andlateral expansion, sexual regeneration, life cycle, seedbank longevity, and vegetative regeneration. The land-scape scale enables the realized niches of different PFTsto be described and the analysis of the niche patternthen allows to discuss functional plant- environmentrelations.
Urban environments display many ecological differ-ences from agricultural landscapes. Due to the highproportion of technical elements and built-up structures,green spaces in urban landscapes are often more frag-mented and isolated than in agricultural landscapes.Also, as the rapid expansion of urban landscapes is arather recent process in Central Europe (Kleyer 1994),plant communities have assembled in a shorter timeperiod than in an agricultural landscape. Disturbanceregimes are fairly different from those in agriculturallandscapes. For instance, garden beds are more oftendisturbed than fields and lawns are more often cut thanmeadows. As most cities are built on land fills, manyurban soils are less developed than those in agriculturallandscapes and often spoiled. Regarding the ecologicaldifferences between agricultural and urban landscapes,transferability may be a rather conservative test for thegenerality of the PFT approach in relation to resourcesupply and disturbance intensity.
Material and Methods
Study region
The study areas are located in the city of Stuttgart,ca. 50 km southeast of the ‘Kraichgau’, the agriculturalstudy region, which provided the data to be compared tothose of the present study (Kleyer 1999). The centre ofStuttgart is situated in a basin-shaped valley of theSouthern German upper Triassic mountains (48∞ 46' 36''N, 9∞ 10' 48'' E). The slopes of the basin consist of
Keuper layers, notably Gypsiferous Keuper Marl, ScliffSandstone, Lower Bunter Marl, Kiesel Sandstone, UpperBunter Marl and Stuben Sandstone. The valley of theriver Neckar adjoins this basin. Due to the densely built-up areas, the climate is warmer (mean annual temperature9.7 - 11 ∞C) and drier (mean annual precipitation 675 mm)than in the ‘Kraichgau’ agricultural region.
Two study areas were chosen for sampling thatcomprise the most relevant urban landscape elements.The first borders directly upon the central city area. Itforms a transect that has already been sampled by W.Kunick with respect to flora and vegetation (1 km breadth,5 km length, 180 m difference in altitude, Kunick 1983).The transect covers both slopes of the basin and itsbottom. The bottom has been densely built up since1870. The former vineyards on the slopes were trans-formed into housing areas, beginning around 1910 withlarge residential buildings on the upper slopes. Today,green spaces cover about 15% of the bottom of the basinand 55% of the slopes (Klaedtke & Kleyer 1991). Landuses in the transect range from block buildings, rowhouses and high-rise buildings to areas with detachedfamily houses. The soils of the basin consist of deepfills, mainly with the local Gypsiferous Keuper Marl.Soils of the slopes consist of various parent substratesfrom the Keuper formation. The soils were deeply culti-vated during former periods of vine cultivation (AricAnthrosols).
The second study area is located in the valley of theriver Neckar. Around 1900, the bottom of the valley wastransformed from an agricultural to an industrial area.Railroad tracks are nowadays covering large parts of thearea. Canalization of the river Neckar prepared theground for extensive industrial plants, partly destroyedin World War II and reconstructed afterwards. Thesediments of the valley are mostly covered with landfills, which are 2 - 4 m thick.
Data collection and analysis
Presence/absence data on the vegetation in the studyareas were sampled in plots of 5 m2. Unpublished pre-liminary vegetation maps of public areas served as abasis for the selection of sampling sites. A random numberof 5 sampling sites was chosen from all the patches of agiven vegetation type recorded in these maps. If publicareas did not contain enough sites, i.e. 5 of a givenvegetation type, private areas were also included. Sam-pling plots were then randomly distributed in patcheswith visually similar environmental conditions. A file ofvegetation types in Stuttgart based on ca. 900 relevésserved as framework for the selection (Kleyer & Hamann1999). Only sites with terrestrial soils were sampled.Forests and highly trampled areas were excluded.
- Validation of plant functional types across two contrasting landscapes - 169
Each vegetation sample was followed by a soil sam-ple (1 m depth, soil description following Anon. 1994).Laboratory analysis of the soil samples included bulkdensity, total N, total C, available P, and available K.The average daily soil moisture was calculated for eachsite using a soil-water-simulation model (Pfau 1966),modified for topographic variation. The model requiresdaily climatic data which were supplied by the meteoro-logical station in Stuttgart (1987-1993). Average N-supply was estimated by balancing an assumed 2%mineralization rate of the total N at each site (see Kleyer1999) with the N input with fertilizers (data from inter-views) and the N output with harvests (following Anon.1993). As an ‘environmental scalar’ (Austin et al. 1984),a gradient ‘resource supply’ resulted from the combina-tion of the variables soil moisture, N supply, and avail-able P, using a principal components analysis (PCA,Anon. 1989). Disturbance intensity was expressed asthe combination of three indicator variables: frequency(yr), depth – above and below soil surface (m) – and area(%) affected by a discrete mechanical impact on theplant cover, e.g. cutting, ploughing, storing, tearing etc.To determine these variables for each site, land ownerswere interviewed. The City Council of Stuttgart pro-vided the management schemes for most of the publicsites. Land use conditions of 1979 could be recon-structed for most sites from Kunick (1983). Togetherwith aerial photos from archives (1945, 1953, 1964,1975, 1983, scale 1:10 000), this information helped todetermine the age of current land uses or the time sinceabandonment of land uses. All 3 indicator variableswere ranked and then combined by assigning (1) prior-ity to frequency, (2) priority to depth, and (3) priority toarea affected by a disturbance. The whole methodologyis essentially the same as in Kleyer (1999), where it isdescribed in more detail. In order to enable the transferof the PFT habitat models across the urban and theagricultural landscape, both data sets were merged toperform the PCA of the ‘resource’ variables and theranking of the ‘disturbance’ variables. In contrast to thestatistical analysis in Kleyer (1999), the results of thePCA were not ranked.
If many different habitats are sampled on a land-scape scale, the total species pool can increase to up toseveral hundreds of species. This will restrict the capac-ity to measure many traits in the field as proposed byWeiher et al. (1999). Knowledge about species traits canthen only be taken from compilations of the literature(i.e. trait data bases; Poschlod et al. 2000). Such a database (Kleyer 1995) comprises the data concerning dis-persal, germination, vegetative expansion, sexual andvegetative regeneration for the species pool of bothlandscapes (as recorded in the samples of Stuttgart andthe Kraichgau region). The plant groups with similar
attributes were derived from this species-trait matrix bya cluster analysis (Kleyer 1999). Ward’s Minimum Vari-ance with the Jaccard Index was used to aim at clusterswith approximately equivalent numbers of plant species(30 cluster solution, Anon. 1989).
The clusters were subjected to logistic regression.The response curve was assumed to be a bivariateunimodal Gaussian logit surface with disturbance inten-sity and resource supply as explanatory variables. Thedependent variable is the number of members belongingto a particular species group at a site. The regressionmodel estimates the probability that all species of agiven group do co-occur. For each sample, the logisticregression yields the estimated probability of the speciesco-occurrence. It can be compared to the observednumber of species from this group in the sample. Thisassociation is tested by the Mantel-Haenszel c2 statisticand is measured by Somers’ D, an estimator based onthe number of concordant and discordant pairs of obser-vations (see Anon. 1989 for details; Sokal & Rohlf1998). The data set with the explanatory variables andthe observed numbers of species belonging to a givengroup of plants with similar traits is called the ‘training’set, the corresponding regression model with the esti-mated probabilities is called the ‘original model’.
To test for transferability I used only those modelsthat are significant in both landscapes. The regressionequation for a given group from the training data set ofthe urban landscape is applied to the ‘test’ data set of theagricultural landscape and vice versa. The resultingprobabilities are the ‘transfer models’. Again, the asso-ciation between estimated probabilities of the ‘transfer’model and observed numbers of the ‘test’ data set istested and measured. The plant functional types areconcluded to be recurrent, if the test of association issignificant for p £ 0,05 and if the value of Somer’s Dexceeds 0.3. This may either happen unidirectionally(e.g. a model of a given PFT from the urban landscape issuccessfully transferred to the data from the agricul-tural landscape but not vice versa) or bidirectionally(i.e. a model of a given PFT is successfully transferredacross both landscapes).
The range of disturbance intensity and fertility isslightly different between both landscapes. For instance,on some sites land use was abandoned up to 60 yr ago inthe agricultural landscape against max. 20 yr ago inStuttgart. In case the training model originates from thelandscape with the shorter disturbance or fertility gradi-ent, displays a sigmoid curve instead of a bell-shapedcurve, and is applied to the test data of the landscapewith the larger gradient, then the test of association mayproduce significant results, although the true behaviourof the training model beyond the training gradient isunknown.
170 Kleyer, M.
Table 1. Means of the balanced N supply, of available P and mean daily soil moisture for classes of the gradient ‘resource supply’in Stuttgart. Legend of soil types: LPl = Lithic Leptosol; RGe = Eutric Regosol; RGc = Calcaric Regosol; RGv = Vertic Regosol;CM = Cambisol; CMe = Eutric Cambisol; CMv = Vertic Cambisol; ATf = Fimic Anthrosol; ATa = Aric Anthrosol (relic soils ofvineyards, very deeply cultivated). The following extensions indicate urban soil material: j = with autochthonous material, butfrom other parts of the city; y(p) = < 60 % of technically processed material, e.g. concrete, cinder, coal, tar; y(t) = with > 60% oftechnically processed material. In brackets: number of occurrences.
Resource supply N Avail. P Soil moisture Soil typesFirst principal kg ha–1yr kg ha–1yr mm component
– 3.15 - – 2.33 32 11 16 y(p)-RGc (3), y(t)-RGc (1), j-RGc (1), y(p)-RGe (2), j-RGe (1), RGe (1)– 2.2 - – 1.66 31 70 17 y(p)-RGc (2), y(t)-RGc (1), j-RGc (3), j-RGe (2), ATa (1), y(p)-LPl (1)– 1.66 - – 1.23 41 74 29 y(p)-RGc (2), j-RGc (4), y(p)-RGe (2), j-RGe (1)– 1.21 - – 0.98 64 46 63 y(p)-RGc (3), y(t)-RGc (2), j-RGc (2), j-RGe (1), y(p)-ATa (1), ATa (1)– 0.97 - – 0.61 75 62 80 y(p)-RGc (2), y(t)-RGc (2), j-RGc (2), ATa (3), CMe (1)– 0.60 - – 0.40 76 116 104 y(p)-RGc (2), y(t)-RGc (1), j-RGc (2), y(p)-RGe (1), ATa (3)– 0.35 - – 0.21 103 154 108 y(p)-RGc (3), j-RGc (1), y(p)-CMv (1), y(p)-CM (1), ATa (3), CM (1)– 0.20 - 0.10 122 220 108 y(p)-RGc (2), j-RGc (2), y(p)-RGe (1), y(p)-CMv (1), j-CM (1), ATa (3)0.14 - 0.31 167 249 129 y(p)-RGc (4), j-RGe (1), j-Atc (1), ATa (3), ATf (1)0.32 - 0.5 160 302 124 y(p)-RGc (4), j-RGe (1), CMe (1), ATa (3), y(p)-ATf (1)0.53 - 0.76 182 412 149 y(p)-RGc (2), j-RGc (4), ATa (3), unclassified (1)0.78 - 1.22 245 512 147 y(p)-RGc (3), j-RGc (1), j-RGv (1), j-ATc (1), ATa (3), j-ATf (1), y(p)-CMv (1)1.23 - 2.60 401 1098 147 y(t)-RGc (1), y(p)-RGc (1), j-RGc (1), ATa (1), ATf (3)
Results
Resource supply and disturbance intensity
The soil conditions in Stuttgart are considerablydifferent from those of agricultural landscapes. Removalor compaction of soil horizons, accumulation with fillsfrom urban development and addition of refuses ortechnically processed materials have profoundly modi-fied the profiles. In the merged data set of both land-scapes, correlation of soil moisture, N supply and avail-able P to the gradient ‘resource supply’ is 0.77, 0.84 and0.74, respectively. The first principal component ex-plains 62% of the variation of the three variables. Thesoils span a gradient from extremely dry Regosols tofresh fills of agricultural origin or composted townrefuse. Along this gradient, fertility increases almost 10-fold (Table 1). The disturbance gradient ranges fromimpacts below the soil surface at a rate of 5 times peryear (e.g. by digging up commercial flower beds) toabandoned areas which last were impacted 45 yr ago(Table 2).
Plant functional types in the city of Stuttgart
The list of plants belonging to each group of plantswith similar traits was published in the JVS electronicarchive (www.opuluspress/jvs/arch.htm, JVS 10:5, 1999;Kleyer 1997). In general, dispersal is difficult to assess,because many plants can be assigned to several path-ways of dispersal (Kleyer 1995). Logistic regressionwas not performed for the seedlings and saplings of
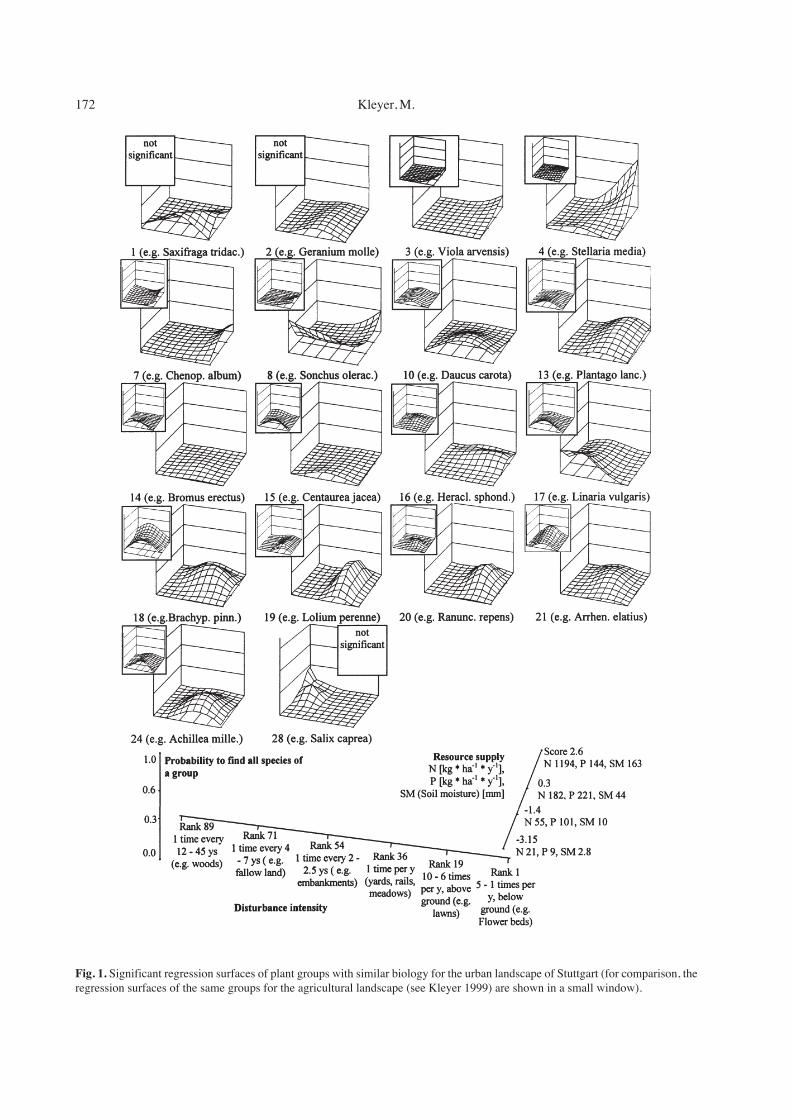
woody species. The regression models of 9 groups arenot significant with respect to resource supply and dis-turbance intensity (5, e.g. Hordeum murinum), 6 e.g.Papaver rhoeas, 9 e.g. Lapsana communis, 11 e.g.Torilis japonica, 12 e.g. Geum urbanum, 22 e.g. Urticadioica, 23 e.g. Lamium maculatum, 29 e.g. Carpinusbetulus, and 30 e.g. Prunus spinosa). The other groupsshowed significant response surfaces (Fig. 1). The gra-dients ‘disturbance intensity’ and ‘resource supply’ con-tribute almost equally to the regression models. In gen-eral, the probability that all species of a group withsimilar biological traits do co-occur is low (0.2 to 0.6).The species of the groups 3, 14, and 15 co-occur with avery low probability.
Very small annuals with low seed production andmostly short-term persistent seed bank occur at siteswith very low fertility and intermediate disturbanceintensities (e.g. railroad tracks, industrial yards and semi-ruderal grasslands on dry Eutric Regosols; groups 1, 2).On highly disturbed and productive sites, annuals areless even-sized, larger plants occur together with smallerplants. The leaves are less sclerophyllous, seed produc-tion is higher and the seed bank short-term to long-termpersistent (groups 3, 4, 7). The raw data show that thespecies of group 8 are not really co-occurring. Conyzacanadensis and Senecio viscosus are found at sites withlow resources, while Sonchus asper and S. oleraceusgrow at sites with high resources. The ambiguous groupresponse corresponds with a low cluster homogeneity.
Small perennials with a high capacity for vegetativeregeneration predominate on sites that are frequentlydisturbed above the soil surface (e.g. lawns; groups 13,
- Validation of plant functional types across two contrasting landscapes - 171
19, 20). The raw species frequencies show that theregression surface of group 13 is mostly shaped byPlantago lanceolata, P. media and Taraxacum officinale,all other species of this group being rare. By way ofcontrast, small biennials or perennials with low or ab-sent vegetative regeneration, low reproduction and lowclonal extension predominate on sites with low fertilityand intermediate disturbance intensity (e.g. dry grass-lands on Regosols or Anthrosols, groups 10, 14, 15, 24).At sites with medium disturbance intensity and higherresource supply (e.g. meadows), plants have larger leafcanopies, reproduce earlier and regenerate rapidly afterdamage (groups 16, 21). If the disturbance intensity isfurther decreasing, then lateral expansion increases tosome metres (groups 18, 17) and detachment of daugh-ter plants is slower (17, at infrequently mown embank-
ments, verges, and old railroad tracks). Group 28 (e.g.Salix caprea) is restricted to sites with low disturbanceintensities, mainly at property borders, on Anthrosolswith high contents of technically processed substrate.The group consists of juvenile tree species with exten-sive clonal spread.
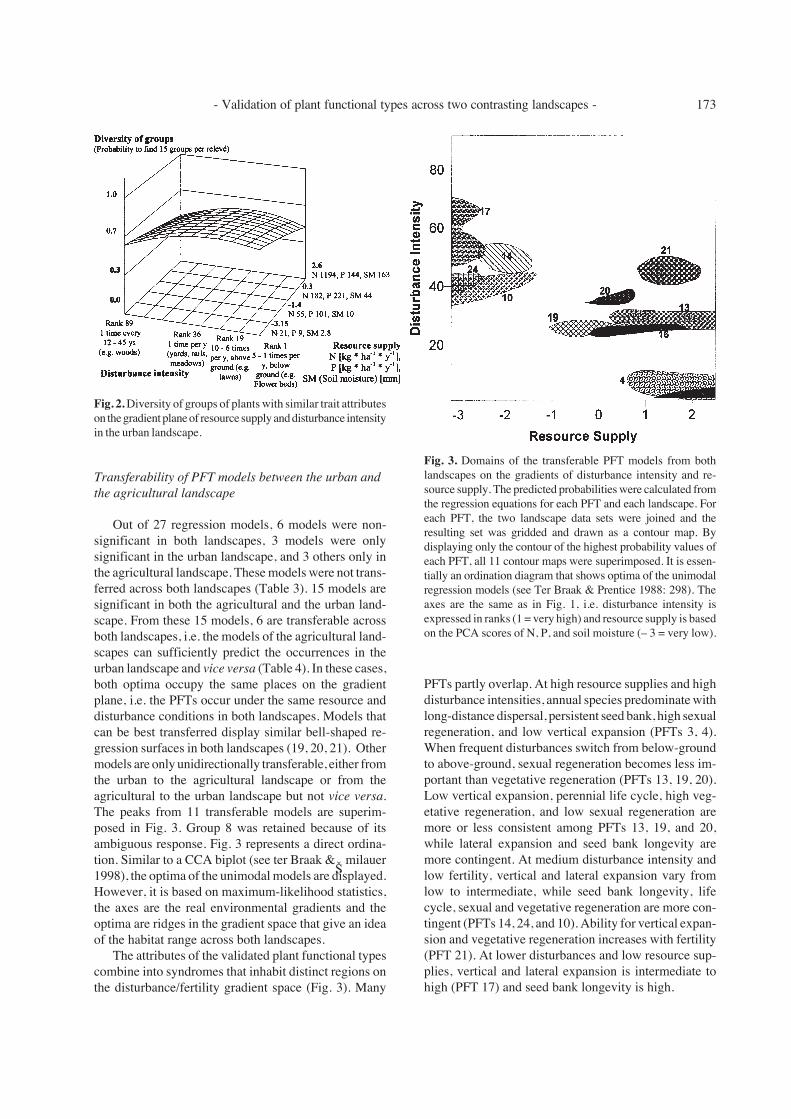
Fig. 2 displays a logistic regression of the grouprichness in all relevés on the gradients disturbance in-tensity and resource supply. The formulation of themodel is equivalent to that of the previous regressions,but the z-axis is the probability to find species from 15groups (of 30 altogether) in a relevé. It shows thatspecies from up to 12 different plant groups with similartrait attributes are found on sites with medium distur-bance intensity and low resources.
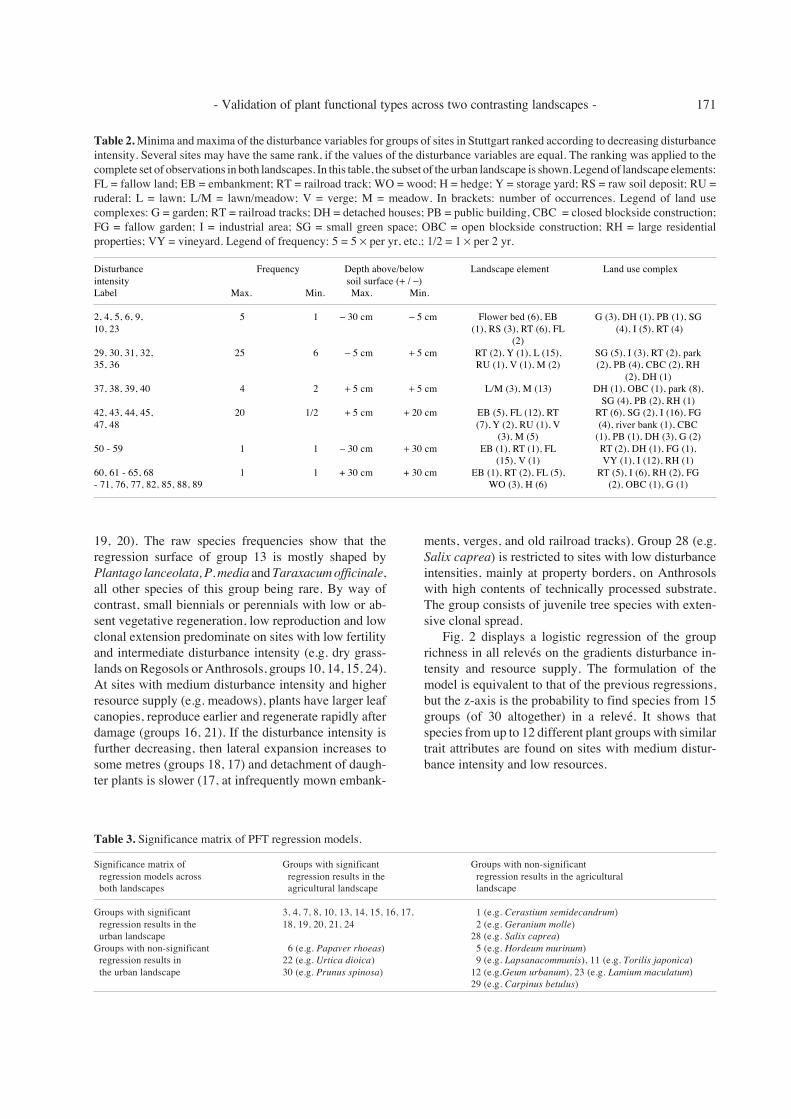
Table 2. Minima and maxima of the disturbance variables for groups of sites in Stuttgart ranked according to decreasing disturbanceintensity. Several sites may have the same rank, if the values of the disturbance variables are equal. The ranking was applied to thecomplete set of observations in both landscapes. In this table, the subset of the urban landscape is shown. Legend of landscape elements:FL = fallow land; EB = embankment; RT = railroad track; WO = wood; H = hedge; Y = storage yard; RS = raw soil deposit; RU =ruderal; L = lawn; L/M = lawn/meadow; V = verge; M = meadow. In brackets: number of occurrences. Legend of land usecomplexes: G = garden; RT = railroad tracks; DH = detached houses; PB = public building, CBC = closed blockside construction;FG = fallow garden; I = industrial area; SG = small green space; OBC = open blockside construction; RH = large residentialproperties; VY = vineyard. Legend of frequency: 5 = 5 ¥ per yr, etc.; 1/2 = 1 ¥ per 2 yr.
Disturbance Frequency Depth above/below Landscape element Land use complexintensity soil surface (+ / -)Label Max. Min. Max. Min.
2, 4, 5, 6, 9, 5 1 - 30 cm - 5 cm Flower bed (6), EB G (3), DH (1), PB (1), SG10, 23 (1), RS (3), RT (6), FL (4), I (5), RT (4)
(2)29, 30, 31, 32, 25 6 - 5 cm + 5 cm RT (2), Y (1), L (15), SG (5), I (3), RT (2), park35, 36 RU (1), V (1), M (2) (2), PB (4), CBC (2), RH
(2), DH (1)37, 38, 39, 40 4 2 + 5 cm + 5 cm L/M (3), M (13) DH (1), OBC (1), park (8),
SG (4), PB (2), RH (1)42, 43, 44, 45, 20 1/2 + 5 cm + 20 cm EB (5), FL (12), RT RT (6), SG (2), I (16), FG47, 48 (7), Y (2), RU (1), V (4), river bank (1), CBC
(3), M (5) (1), PB (1), DH (3), G (2)50 - 59 1 1 - 30 cm + 30 cm EB (1), RT (1), FL RT (2), DH (1), FG (1),
(15), V (1) VY (1), I (12), RH (1)60, 61 - 65, 68 1 1 + 30 cm + 30 cm EB (1), RT (2), FL (5), RT (5), I (6), RH (2), FG- 71, 76, 77, 82, 85, 88, 89 WO (3), H (6) (2), OBC (1), G (1)
Table 3. Significance matrix of PFT regression models.
Significance matrix of Groups with significant Groups with non-significant regression models across regression results in the regression results in the agricultural both landscapes agricultural landscape landscape
Groups with significant 3, 4, 7, 8, 10, 13, 14, 15, 16, 17, 1 (e.g. Cerastium semidecandrum) regression results in the 18, 19, 20, 21, 24 2 (e.g. Geranium molle) urban landscape 28 (e.g. Salix caprea)Groups with non-significant 6 (e.g. Papaver rhoeas) 5 (e.g. Hordeum murinum) regression results in 22 (e.g. Urtica dioica) 9 (e.g. Lapsanacommunis), 11 (e.g. Torilis japonica) the urban landscape 30 (e.g. Prunus spinosa) 12 (e.g.Geum urbanum), 23 (e.g. Lamium maculatum)
29 (e.g. Carpinus betulus)
172 Kleyer, M.
Fig. 1. Significant regression surfaces of plant groups with similar biology for the urban landscape of Stuttgart (for comparison, theregression surfaces of the same groups for the agricultural landscape (see Kleyer 1999) are shown in a small window).
- Validation of plant functional types across two contrasting landscapes - 173
Transferability of PFT models between the urban andthe agricultural landscape
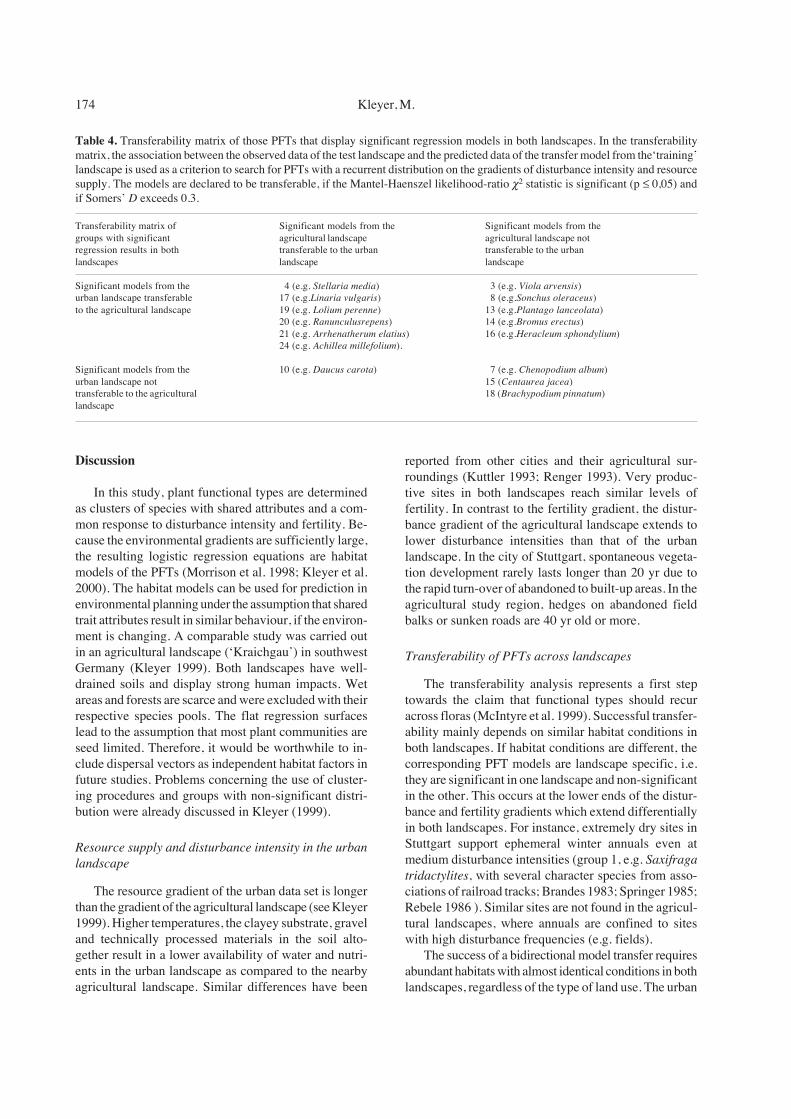
Out of 27 regression models, 6 models were non-significant in both landscapes, 3 models were onlysignificant in the urban landscape, and 3 others only inthe agricultural landscape. These models were not trans-ferred across both landscapes (Table 3). 15 models aresignificant in both the agricultural and the urban land-scape. From these 15 models, 6 are transferable acrossboth landscapes, i.e. the models of the agricultural land-scapes can sufficiently predict the occurrences in theurban landscape and vice versa (Table 4). In these cases,both optima occupy the same places on the gradientplane, i.e. the PFTs occur under the same resource anddisturbance conditions in both landscapes. Models thatcan be best transferred display similar bell-shaped re-gression surfaces in both landscapes (19, 20, 21). Othermodels are only unidirectionally transferable, either fromthe urban to the agricultural landscape or from theagricultural to the urban landscape but not vice versa.The peaks from 11 transferable models are superim-posed in Fig. 3. Group 8 was retained because of itsambiguous response. Fig. 3 represents a direct ordina-tion. Similar to a CCA biplot (see ter Braak & Šmilauer1998), the optima of the unimodal models are displayed.However, it is based on maximum-likelihood statistics,the axes are the real environmental gradients and theoptima are ridges in the gradient space that give an ideaof the habitat range across both landscapes.
The attributes of the validated plant functional typescombine into syndromes that inhabit distinct regions onthe disturbance/fertility gradient space (Fig. 3). Many
Fig. 2. Diversity of groups of plants with similar trait attributeson the gradient plane of resource supply and disturbance intensityin the urban landscape.
Fig. 3. Domains of the transferable PFT models from bothlandscapes on the gradients of disturbance intensity and re-source supply. The predicted probabilities were calculated fromthe regression equations for each PFT and each landscape. Foreach PFT, the two landscape data sets were joined and theresulting set was gridded and drawn as a contour map. Bydisplaying only the contour of the highest probability values ofeach PFT, all 11 contour maps were superimposed. It is essen-tially an ordination diagram that shows optima of the unimodalregression models (see Ter Braak & Prentice 1988: 298). Theaxes are the same as in Fig. 1, i.e. disturbance intensity isexpressed in ranks (1 = very high) and resource supply is basedon the PCA scores of N, P, and soil moisture (– 3 = very low).
PFTs partly overlap. At high resource supplies and highdisturbance intensities, annual species predominate withlong-distance dispersal, persistent seed bank, high sexualregeneration, and low vertical expansion (PFTs 3, 4).When frequent disturbances switch from below-groundto above-ground, sexual regeneration becomes less im-portant than vegetative regeneration (PFTs 13, 19, 20).Low vertical expansion, perennial life cycle, high veg-etative regeneration, and low sexual regeneration aremore or less consistent among PFTs 13, 19, and 20,while lateral expansion and seed bank longevity aremore contingent. At medium disturbance intensity andlow fertility, vertical and lateral expansion vary fromlow to intermediate, while seed bank longevity, lifecycle, sexual and vegetative regeneration are more con-tingent (PFTs 14, 24, and 10). Ability for vertical expan-sion and vegetative regeneration increases with fertility(PFT 21). At lower disturbances and low resource sup-plies, vertical and lateral expansion is intermediate tohigh (PFT 17) and seed bank longevity is high.
174 Kleyer, M.
Discussion
In this study, plant functional types are determinedas clusters of species with shared attributes and a com-mon response to disturbance intensity and fertility. Be-cause the environmental gradients are sufficiently large,the resulting logistic regression equations are habitatmodels of the PFTs (Morrison et al. 1998; Kleyer et al.2000). The habitat models can be used for prediction inenvironmental planning under the assumption that sharedtrait attributes result in similar behaviour, if the environ-ment is changing. A comparable study was carried outin an agricultural landscape (‘Kraichgau’) in southwestGermany (Kleyer 1999). Both landscapes have well-drained soils and display strong human impacts. Wetareas and forests are scarce and were excluded with theirrespective species pools. The flat regression surfaceslead to the assumption that most plant communities areseed limited. Therefore, it would be worthwhile to in-clude dispersal vectors as independent habitat factors infuture studies. Problems concerning the use of cluster-ing procedures and groups with non-significant distri-bution were already discussed in Kleyer (1999).
Resource supply and disturbance intensity in the urbanlandscape
The resource gradient of the urban data set is longerthan the gradient of the agricultural landscape (see Kleyer1999). Higher temperatures, the clayey substrate, graveland technically processed materials in the soil alto-gether result in a lower availability of water and nutri-ents in the urban landscape as compared to the nearbyagricultural landscape. Similar differences have been
reported from other cities and their agricultural sur-roundings (Kuttler 1993; Renger 1993). Very produc-tive sites in both landscapes reach similar levels offertility. In contrast to the fertility gradient, the distur-bance gradient of the agricultural landscape extends tolower disturbance intensities than that of the urbanlandscape. In the city of Stuttgart, spontaneous vegeta-tion development rarely lasts longer than 20 yr due tothe rapid turn-over of abandoned to built-up areas. In theagricultural study region, hedges on abandoned fieldbalks or sunken roads are 40 yr old or more.
Transferability of PFTs across landscapes
The transferability analysis represents a first steptowards the claim that functional types should recuracross floras (McIntyre et al. 1999). Successful transfer-ability mainly depends on similar habitat conditions inboth landscapes. If habitat conditions are different, thecorresponding PFT models are landscape specific, i.e.they are significant in one landscape and non-significantin the other. This occurs at the lower ends of the distur-bance and fertility gradients which extend differentiallyin both landscapes. For instance, extremely dry sites inStuttgart support ephemeral winter annuals even atmedium disturbance intensities (group 1, e.g. Saxifragatridactylites, with several character species from asso-ciations of railroad tracks; Brandes 1983; Springer 1985;Rebele 1986 ). Similar sites are not found in the agricul-tural landscapes, where annuals are confined to siteswith high disturbance frequencies (e.g. fields).
The success of a bidirectional model transfer requiresabundant habitats with almost identical conditions in bothlandscapes, regardless of the type of land use. The urban
Table 4. Transferability matrix of those PFTs that display significant regression models in both landscapes. In the transferabilitymatrix, the association between the observed data of the test landscape and the predicted data of the transfer model from the‘training’landscape is used as a criterion to search for PFTs with a recurrent distribution on the gradients of disturbance intensity and resourcesupply. The models are declared to be transferable, if the Mantel-Haenszel likelihood-ratio c2 statistic is significant (p £ 0,05) andif Somers’ D exceeds 0.3.
Transferability matrix of Significant models from the Significant models from thegroups with significant agricultural landscape agricultural landscape notregression results in both transferable to the urban transferable to the urbanlandscapes landscape landscape
Significant models from the 4 (e.g. Stellaria media) 3 (e.g. Viola arvensis)urban landscape transferable 17 (e.g.Linaria vulgaris) 8 (e.g.Sonchus oleraceus)to the agricultural landscape 19 (e.g. Lolium perenne) 13 (e.g.Plantago lanceolata)
20 (e.g. Ranunculusrepens) 14 (e.g.Bromus erectus)21 (e.g. Arrhenatherum elatius) 16 (e.g.Heracleum sphondylium)24 (e.g. Achillea millefolium).
Significant models from the 10 (e.g. Daucus carota) 7 (e.g. Chenopodium album)urban landscape not 15 (Centaurea jacea)transferable to the agricultural 18 (Brachypodium pinnatum)landscape
- Validation of plant functional types across two contrasting landscapes - 175
and the agricultural landscape offer nearly the same habi-tats for the PFTs 4 (e.g. Stellaria media), 17 (e.g. Linariavulgaris), 19 (e.g. Lolium perenne), 20 (e.g. Ranunculusrepens), 21 (e.g. Arrhenatherum elatius), and 24 (e.g.Achillea millefolium). For instance, agricultural fieldsprovide the same habitat for PFT 4 as flower beds in theurban landscape. Meadows (for PFT 21) can be found inthe agricultural landscape and in urban parks. This alsodemonstrates that absolute descriptors such as impactfrequency and depth allow to combine different landuses from contrasting landscapes into general distur-bance-related habitat models.
PFT model transfer did not depend on species iden-tity, i.e. models could be successfully transferred even ifmany of the species that belong to a functional type didnot occur in both landscapes (Table 5 in Kleyer 1999,available at www.opuluspress/jvs/arch.htm). This sug-gests that PFT patterns are not only repeatable acrosslandscapes (Gitay & Noble 1997) but indeed independentof species identity (McIntyre et al. 1999).
The distinction of landscape-specific PFTs and trans-ferable PFTs should vary with the type of landscapesthat are compared in the validation. More generic pat-terns should result, if the transferability of PFTs isanalysed in an iterative way from very similar to verydifferent environments.
Syndromes in relation to disturbance intensity and re-source supply
Two types of functional classifications have beenused in plant ecology. The first has been termed the‘effect’ type, i.e. groups of species with a similar effectfor ecosystem functioning, while the second has beentermed the ‘response’ type, i.e. groups of species with asimilar response to an environmental factor (Lavorel &Garnier 2001). In this study, the groups clearly are‘response groups’ of plants with shared trait attributes.The validation of the PFT habitat models across the twocontrasting landscapes adds generality to these responsegroups. A comparison of the validated response groupsmay lead to a functional understanding of plant occur-rence in patterned landscapes.
The methodology used here does not reveal func-tional traits per se, because clusters were built beforeanalysing the performance on the environmental gradi-ents (Kleyer 1999). However, non-random responses ofgroups of plants that share common trait attributes sug-gest that some of these attributes are functional for theresponse of the species. A way to find out which at-tributes are more functional than others is to look fortrait attribute consistency among groups with overlap-ping responses. Other studies also found several PFTsco-existing at a site (van der Maarel 1988; Sternberg et
al. 2000). Hence, the corresponding trait syndromesseem to be complementary in enabling plant survival ina given habitat (Grime et al. 1988; Kleyer 1999;Semenova & van der Maarel 2000). If some trait at-tributes are more consistent compared to others amongco-occurring response groups, this would indicate ahigher selective force of the environment on these traitsand thus functional trait hierarchies. None of the traitsappears to be totally contingent, indicating that all traitscontribute to the response of the species to some extent.
Among the relatively consistent traits, vertical ex-pansion rises with decreasing disturbance and with in-creasing fertility at intermediate disturbance levels. Ver-tical expansion is used here as an aggregation of severalcoupled traits: plant height, leave size, sclerophylly, andposition of leaves along the stem. It describes the posi-tion and surface area of light-acquiring organs and isthus linked to competitive effects (Goldberg & Landa1991). The results are consistent with predictions andprevious studies (Tilman 1988; Chapin 1991; Grime etal. 1997). It should be noted that growth rate was notpart of the trait programme used in this study. Growthrate is the essential character for Grime´s definition of a‘competitor’ (1979). Hence, large vertical expansioncannot be directly related to the ‘competitor’ syndrome(see Grime 1979; Hodgson et al. 1999).
When including significant response groups that didnot meet the validation criterion, vertical expansion isless consistent at high frequencies of below-grounddisturbance impacts. The PFTs 3 and 4 represent smallannuals, while PFT 7 represents larger annuals, all co-occurring on sites such as market gardens or fields. Thismay result from the interruptions of competitive interac-tions by below-ground impacts. During the intervalspre-emption of abundant resources by any individual ispossible (Goldberg 1996).
Across perennial response groups on the gradientplane, lateral expansion is largely uncorrelated to verti-cal expansion. This can also be extracted from thecorrelation patterns in Grime et al. 1997. On sites withabove-ground disturbance impacts such as mowing,lower lateral expansion is consistent among responsegroups regardless of their position on the fertility gradi-ent. Low fertility and/or mowing create light levels nearthe ground that may allow unshaded germination ofseeds and reduce the need to expand laterally to gainlight (Craine et al. 2001). On the contrary, lateral ex-pansion is large (PFT 20), if the impacts produce smallgaps in the vegetation canopy (e.g. embankments, fieldmargins, parking sites). This is predicted from simu-lations by Winkler et al. (1999) as enhanced spaceutilization through plastic search for light with largerunners. Also, vegetative regeneration following small-scale disturbance impacts tends to be faster in species
176 Kleyer, M.
with extensive clonal spread (Herben & Hara 1997).Lateral expansion also rises with decreasing disturbanceintensity. The pattern has been explained as a shift fromgenerative reproductive success towards vegetative re-productive success in habitats without major biomassloss or removal, where dense canopies and litter layersprevent an establishment from seedlings (Grime 1979;Klimeš et al. 1997; Craine et al. 2001). However, theobservations are difficult to reconcile with the simula-tions of Winkler et al. (1999), where short ‘phalanx’spacers always win in undisturbed habitats (see alsoHerben & Hara 1997).
Trait attribute correlations vary within the regene-rative traits. Concerning sexual regeneration, a com-parison of the groups shows a negative relation betweenseed number and seed mass except for groups growingunder very unfertile conditions (see Jakobsson &Eriksson 2000; Leishman 2001). Persistent seed banksare not consistently related to low seed mass. Specieswith higher seed mass and persistent seed banks areoften found on sites which are disturbed below the soilsurface (e.g. group 22 on derelict fields, field margins orurban land fills). Here, tilling or land filling buries seedsregardless of their mass or size (Thompson et al. 1998).
Across the perennial syndromes, persistence traitssuch as vegetative expansion appear to be more consist-ent than the regenerative traits. This suggests that bydetermining carbon gain through space utilization overtime species morphologies more strongly reflect thebroad range of environmental constraints on the land-scape scale and thus are good predictors for the generalvegetation composition. Regenerative traits may respondmore to the spatio-temporal heterogeneity of the envi-ronmental regimes and – through a large variety ofpathways – contribute to the diversity of functionaltypes on a site and thus to plant biodiversity. The partialdecoupling between vegetative and regeneration traitshas been reported previously (e.g. Grime et al. 1988;Shipley et al. 1990; Díaz & Cabido 1997; Grime et al.(1997). However, part of the higher contingency of theregenerative traits comes from the fact that frequency,depth and spatial extent of impacts were all combined inone disturbance gradient. If below-ground impacts fa-vouring seeders are separated from above-ground im-pacts favouring sprouters, then traits such as sexualregeneration and seed bank longevity might show moreconsistent patterns.
Potentially important caveats are that trait consi-stency across syndromes has been inferred from in-spection of the raw data, not from a statistical test.Second, only validated functional types have been con-sidered. Groups with non-significant regression modelswere omitted. Third, information on traits was based onpublished data (Kleyer 1995) and not measured in the
field (which would be impossible considering the largespecies number in both landscapes). For many plantspecies, published knowledge on traits was scarce. Onthe other hand, this knowledge is rapidly expanding,though scattered in many different sources. This empha-sizes the demand for data bases of plant traits (Poschlodet al. 2000).
Diversity of groups with similar trait attributes
In both urban and agricultural landscapes, the diver-sity of groups with similar trait attributes is highest onsites with medium disturbance intensity and, especiallyin Stuttgart, with low fertility. The regression surface ofthe Stuttgart data set corresponds to the predictions ofboth the ‘humped-back’ model of Grime (1973) (rich-ness decreases with increasing fertility) and the ‘inter-mediate disturbance hypothesis’ (Connell 1978) or the‘dynamic equilibrium’ model proposed by Huston (1979)(richness decreases through competitive exclusion atlower disturbance levels and through severe mortality athigher disturbance levels, with maximized richness atintermediate disturbance levels). While these predic-tions refer to species richness, the results presented hereshow richness of groups of plants with similar traitattributes or ‘emergent groups’. Not all of these groupswere found to be significant functional types and less ofthe functional types could be validated by model trans-fer across the two landscapes. Nevertheless, out of thelatter only species with low expansion and regenerationare confined to those sites where group richness ismaximized (PFT 14). PFTs occurring at other parts ofthe gradient plane show either higher expansion orhigher regeneration. This indicates that competition andregeneration are relevant in structuring diversity alongdisturbance and fertility gradients, as proposed by theafore-mentioned hypotheses.
It has been argued that the PFT approach is a poortest for predictions of competition-mediated processes,because competition between species should be greaterwithin functional types than across functional types(Wilson 1994; Hastwell & Huston 2001). The results ofthis study show that fertility and disturbance do influ-ence the diversity of emergent groups in a way thatcorresponds to theory, if the gradients are sufficientlylarge.
Acknowledgements. I would like to thank Karin Holland andGerd Clemens for the cooperation concerning soil analysis.Sandra Lavorel suggested improvements for an earlier versionof this manuscript. Further improvements were possible ow-ing to the comments of two anonymous referees and SandraDíaz as co-ordinating editor.
- Validation of plant functional types across two contrasting landscapes - 177
References
Anon. 1988. Soil map of the world, revised legend. World soilresources report 60. FAO, Rome, IT.
Anon. 1989. SAS/STAT User’s Guide Version 6. 4th. ed. (1, 2).SAS Institute, Cary, NC.
Anon. 1993. Faustzahlen für die Landwirtschaft. Hydro AgriDülmen, Germany). Verlagsunion Agrar, Münster, DE.
Anon. 1994 [German Working Group on Soil Science]. Boden-kundliche Kartieranleitung. Schweizerbart, Hannover, DE.
Austin, M.P., Cunningham, R.B. & Fleming, P.M. 1984. Newapproaches to direct gradient analysis using environmen-tal scalars and statistical curve-fitting procedures. Vegetatio55: 11-27.
Brandes, D. 1983. Flora und Vegetation der BahnhöfeMitteleuropas. Phytocoenologia 11: 31-115.
Capen, D.E., Fenwick, J.W., Inkley, D.B. & Boynton, A.C.1986. Multivariate models of songbird habitat in NewEngland forests. In: Verner, J., Morrison, M.L. & Ralph,C.J. (eds.) Wildlife 2000: Modelling habitat relationshipsof terrestrial vertebrates, pp. 171-177. University of Wis-consin Press, Madison, WI.
Chapin, F.S. III 1991. Integrated responses of plants to stress.Bioscience 41: 29-36.
Chapin, F.S. III, Autumn, K. & Pugnaire, F. 1993. Evolutionof suites of traits in response to environmental stress. Am.Nat. 142: 78-92.
Connell, J.H. 1978. Diversity in tropical rainforests and coralreefs. Science 199: 1302-1310.
Craine, J.M., Froehle, J., Tilman, D.G., Wedin, D.A. & ChapinIII, F.S. 2001. The relationsship among root and leaf traitsof 76 grassland species and relative abundance alongfertility and disturbance gradients. Oikos 93: 274-285.
Díaz, S. & Cabido, M. 1997. Plant functional types andecosystem function in relation to global change. J. Veg.Sci. 8: 463-474
Fielding, A.H. & Haworth, P.F. 1995. Testing the generalityof bird-habitat models. Conserv. Biol. 9: 1466-1481.
Friedel, M.H., Bastin, G.N. & Griffin, G.F. 1988. Rangeassessment and monitoring of arid lands: the derivation offunctional groups to simplify vegetation data. J. EnvironManage. 27: 85-97.
Gitay, H. & Noble, I.R. 1997. What are functional types andhow should we seek them? In: Smith, T.M., Shugart, H.H.& Woodward, F.I. (eds.) Plant functional types. Theirrelevance to ecosystem properties and global change, pp.3-19. Cambridge University Press, Cambridge, UK.
Goldberg, D.E. 1996. Competitive ability in plants: consist-ency, contingency, and correlated traits. Phil. Trans. R.Soc. Lond. B 351: 1377-1385.
Goldberg, D.E. & Landa, K. 1991. Competitive effect andresponse: Hierarchies and correlated traits in the earlystages of competition. J. Ecol. 79: 1013-1030.
Grime, J.P. 1973. Competitive exclusion in herbaceous veg-etation. Nature 242: 344-347.
Grime, J.P. 1979. Plant strategies and vegetation processes.Wiley, Chichester, UK.
Grime, J.P., Hodgson, J.G. & Hunt, R. 1988. Comparativeplant ecology. Unwin Hyman, London, UK.
Grime, J.P., Thompson, K., Hunt, R., Hodgson, J.G.,Cornelissen, J.H.C., Riorison, I.H., Hendry, G.A.F.,Ashenden, T.W., Askew, A.P., Band, S.R., Booth, R.E.,Bossard, C.C., Campbell, B.D., Cooper, J.E.L., Davison,A.W., Gupta, P.L., Hall, W., Hand, D.W., Hannah, M.A.,Hillier, S.H., Hodkinson, D.J., Jalili, A., Liu, Z., Mackey,J.M.L., Matthews, N., Mowforth, M.A., Neal, A.M.,Reader, R.J., Reiling, K., Ross-Fraser, W., Spencer, R.E.,Sutton, F., Tasker, D.E., Thorpe, P.C. & Whitehouse, J.1997. Integrated screening validates primary axes of spe-cialisation in plants. Oikos 79: 259-281.
Hastwell, G.T. & Huston, M.A. 2001. On disturbance anddiversity: a reply to Mackey and Currie. Oikos 92: 367-371.
Herben, T. & Hara, T. 1997. Competition and spatial dynam-ics of clonal plants. In: de Kroon, H. & van Groenendael,J. (eds.) The ecology and evolution of clonal plants. pp.331-357. Backhuys, Leiden, NL.
Hodgson, J.G., Wilson, P.J., Hunt, R., Grime, J.P. & Thompson,K. 1999. Allocating C-S-R plant functional types: a softapproach to a hard problem. Oikos 85: 282-296.
Huston, M. 1979. A general hypothesis of species diversity.Am. Nat. 113: 81-101.
Jakobsson, A. & Eriksson, O. 2000. A comparative study ofseed number, seed size, seedling size and recruitment ingrassland plants. Oikos 92: 494-502.
Klaedtke, H.-G. & Kleyer, M. 1991. Bodenversiegelung inStuttgart. Methodik der Bestimmung aus Satellitenbild-Daten. Nat.schutz Landsch.planung 6/91: 238-242.
Kleyer, M. 1994. Von der Agrarlandschaft zur Stadtlandschaft.Urbanisierungsprozesse in der Kulturlandschaft. DerBürger im Staat 44 (1): 65-70.
Kleyer, M. 1995. Biological traits of vascular plants. A data-base. Arbeitsber. Inst. Landsch.planung Ökol. Univ. Stutt-gart, N.F. 2. See also http://www.uni-oldenburg.de/landeco
Kleyer, M. 1997. Vergleichende Untersuchungen zur Ökologievon Pflanzengemeinschaften. Eine Grundlage zurBeurteilung der Ersetzbarkeit in der naturschutzfachlichenPlanung am Beispiel einer Agrar- und einer Stadtlandschaft.Diss. Bot. 286.
Kleyer, M. 1999. The distribution of plant functional types ongradients of disturbance intensity and resource supply inan agricultural landscape. J. Veg. Sci. 10: 697-708.
Kleyer, M. & Hamann, K. 1999. Wie gut unterscheiden sichstädtebauliche Nutzungstypen bezüglich ihrer Vegetation?Frankf. Geobot. Koll. 14: 15-22.
Kleyer, M., Kratz, R., Lutze, G. & Schröder, B. 2000.Habitatmodelle für Tierarten: Entwicklung, Methoden undPerspektiven für die Anwendung. Z. Ökol. Nat.schutz8(4): 177-194.
Klimeš, L., Klimešova, J., Hendriks, R. & van Groenendael, J.1997: Clonal plant architecture: A comparative analysis ofform and function. In: de Kroon, H. & van Groenendael, J.(eds.) The ecology and evolution of clonal plants, pp. 1-29. Backhuys, Leiden, NL.
Kotowski, W., van Diggelen, R. & Kleinke, J. 1998. Behaviourof wetland plant species along a moisture gradient in twogeographically distant areas. Acta Bot. Neerl. 47: 337-349.
Kunick, W. 1983. Pilotstudie Stadtbiotopkartierung Stuttgart.
178 Kleyer, M.
Beih. Veröff. Nat.schutz Landsch.pfl. Bad.-Württ. 36: 7-134.
Kuttler, W. 1993. Stadtklima. In: Sukopp, H. & Wittig, R.(eds.) Stadtökologie, pp. 113-153. Fischer, Stuttgart, DE.
Lavorel, S., McIntyre, S., Landsberg, J. & Forbes, T.D.A.1997. Plant functional classifications: from general groupsto to specific groups based on response to disturbance.Trends Ecol. Evol. 12: 474-478.
Lavorel, S. & Garnier, E. 2001: Aardvarck to Zyzyxia -functional across kingdoms. New Phytol. 149: 360-364.
Leishman, M.R. 2001. Does the seed size/number trade-offmodel determine plant community structure? An assess-ment of the model mechanisms and their generality. Oikos93: 294-302.
Maguire, L.A. 1991. Risk analysis for conservation biologists.Conserv. Biol. 5: 123-125
Mankin, J.B., O’Neill, R.V., Shugart, H.H. & Rust, B.W.1977. The importance of validation in ecosystem analysis.In: Innis, G.S. (ed.) New directions in the analysis ofecological systems, pp. 63-71. Simulation Councils Pro-ceedings Series. La Jolla, CA.
McIntyre, S., Lavorel, S., Landsberg, J. & Forbes, T.D.A.1999. Disturbance response in vegetation – towards aglobal perspective on functional traits. J. Veg. Sci. 10:621-630.
Morrison, M.L., Marcot, B.G. & Mannan, R.W. 1998. Wild-life-habitat relationships. Concepts and applications. TheUniversity of Wisconsin Press, Madison, WI.
Özesmi, U. & Mitsch, W.J. 1997. A spatial habitat model forthe marsh-breeding red-winged blackbird (Agelaiusphoenicus L.) in coastal Lake Erie wetlands. Ecol. Model.101: 139-152.
Pfau, R. 1966. Ein Beitrag zur Frage des Wasserhaushaltesund der Beregnungsbedürftigkeit landwirtschaftlicherBöden im Raum der EWG. Meteoreol. Rundschau 19 (2).
Poschlod, P., Kleyer, M. & Tackenberg, O. 2000. Data baseson life history traits as a tool for risk assessment in plantspecies. Z. Ökol. Nat.schutz 9 (1): 3-18.
Rebele, F. 1986. Die Ruderalvegetation der Industriegebietevon Berlin (West) und deren Immissionsbelastung. Land-schaftsentwicklung und Umweltforschung, vol. 43, pp. 1-223. Technische Universität Berlin, DE.
Renger, M. 1993. Bodenwasser- und Grundwasserhaushalt.In: Sukopp, H. & Wittig, R. (eds.) Stadtökologie, pp. 113-153. Fischer, Stuttgart, DE.
Schröder, B. & Richter, O. 1999-2000. Are habitat modelstransferable in space and time? Z. Ökol. Nat.schutz 8: 195-205.
Semenova, G.V. & van der Maarel, E. 2000. Plant functionaltypes – a strategic perspective. J. Veg. Sci. 11: 917-922.
Shipley, B., Keddy, P.A., Moore, D.R.J. & Lemky, K. 1990.Regeneration and establishment strategies of emergentmacrophytes. J. Ecol. 77: 1093-1110.
Skarpe, C. 1996. Plant functional types and climate in asouthern African savanna. J. Veg. Sci. 7: 397-404.
Sokal, R.R. & Rohlf, F.J. 1995. Biometry. 3rd. ed. Freeman,New York, NY.
Springer, S. 1985. Spontane Vegetation in München. Ber.Bayer. Bot. Ges. 56: 103-142.
Stebbins, G.L. 1974. Flowering plants: Evolution above thespecies level. Belknapp Press, Harvard, MA.
Sternberg, M., Gutman, M., Perelovotsky, A., Ungar, E.D. &Kigel, J. 2000. Vegetation response to grazing manage-ment in a Mediterranean herbaceous community: a func-tional group approach. J. Appl. Ecol. 37: 224-237.
ter Braak, C.J.F. & Prentice, I.C. 1988. A theory of gradientanalysis. Adv. Ecol. Res. 18: 271-317.
ter Braak, C.J.F. & Šmilauer, P. 1998. CANOCO referencemanual and user´s guide to Canoco for Windows: soft-ware for canonical community ordination (version 4).Microcomputer Power, Ithaca, NY.
Thomas, J.A. & Bovee, K.D. 1993. Application and testing ofa procedure to evaluate transferability of habitat suitabil-ity criteria. Regul. Riv. Res. Manage. 8: 285-294.
Thompson, K., Bakker, J.P., Bekker, R.M. & Hodgson J.G.1998. Ecological correlates of seed persistence in soil inthe north-west European flora. J. Ecol. 86: 163-169.
Tilman, D. 1988. Plant strategies and the dynamics andstructure of plant communities. Princeton University Press,Princeton, NJ.
van der Maarel, E. 1988. Floristic diversity and guild structurein the grasslands of Ölands Stora Alvar. Acta Phytogeogr.Suec. 76: 53-65.
Warner, R.R. & Chesson, P.L. 1985. Coexistence mediated byrecruitment fluctuations: a field guide to the storage effect.Am. Nat. 125: 769-787.
Weiher, E., van der Werf, A., Thompson, K., Roderick, M.,Garnier, E. & Eriksson, O. 1999. Challenging Theophrastus:A common core list of plant traits for functional ecology. J.Veg. Sci. 10: 609-620.
Wilson, J.B. 1994. Who makes the assembly rules? J. Veg. Sci.5: 275-278.
Winkler, E., Fischer, M. & Schmid, B. 1999. Modelling thecompetitiveness of clonal plants by complementary ana-lytical and simulation approaches. Oikos 85: 217-233.
Received 27 September 2000;Revision received 30 August 2001;
Accepted 26 December 2001;Final revision received 16 January 2002.
Coordinating Editor: S. Díaz.