Embed Size (px)
Citation preview

Validation of WindblownRadar Ground Clutter SpectralShape
M. GRECO, Member, IEEE
F. GINI, Senior Member, IEEEUniversity of PisaItaly
A. FARINA, Fellow, IEEEAlenia-Marconi SystemsItaly
J. B. BILLINGSLEY, Member, IEEELincoln Laboratory
We investigate the robustness of the linear matched filter(MF) operating in a Gaussian environment in the presence ofa mismatch between the design clutter-power spectral density(PSD) shape and the actual one. The Gaussian, the power-law(PL), and the double-exponential spectral models have beenconsidered with the goal of investigating which one fits bestfor windblown foliage. We analyze the MF performance interms of improvement factor, probability of false alarm, andprobability of detection by making use of the theoretical modelsand measured X-band ground clutter data. The numericalresults validate the double-exponential spectral model forwindblown foliage by showing that the differences in performanceprediction between using measured clutter data and modeledclutter data of various spectral shapes (viz., Gaussian, PL, anddouble-exponential) are minimized when the spectral modelemployed is of double-exponential shape.
Manuscript received September 21, 1999; revised March 24, 2000,July 10, 2000, October 12, 2000, and December 8, 2000; releasedfor publication December 8, 2000.
IEEE Log No. T-AES/37/2/06328.
Refereeing of this contribution was handled by L. M. Kaplan.
This work was partially sponsored by the United States Air Forceunder A/F Contract F19628-00-C-0002. Opinions, interpretations,recommendations, and conclusions are those of the authors and arenot necessarily endorsed by the United States Air Force.
Authors’ addresses: M. Greco and F. Gini, Department ofInformation Engineering, University of Pisa, Via Diotisalvi 2,56126 Pisa, Italy, E-mail: (ff.gini,[email protected]); A.Farina, System Analysis & Scientific Calculus Group-SystemArea, Alenia-Marconi Systems, Via Tiburtina Km 12.4, 00131Rome, Italy, E-mail: ([email protected]); J. B.Billingsley, Lincoln Laboratory, Massachusetts Institute ofTechnology, 244 Wood St., Lexington, MA 02420-9108, E-mail:([email protected]).
0018-9251/01/$10.00 c° 2001 IEEE
I. INTRODUCTION
A well-known radar signal-processing problemis the detection of a target signal having knownform in the presence of correlated clutter andthermal noise. When the signal to be detectedis embedded in correlated Gaussian-distributedclutter, the optimum Neyman—Pearson detectoris a coherent, linear, transversal filter called thewhitening matched filter (MF) [1, ch. 5]. Thefigure commonly used to assess the performanceof any linear filter for Gaussian-distributed clutterrejection is the improvement factor (IF) [2].Degradation in signal-to-disturbance power ratio(SDR) occurs because of poor knowledge of theclutter characteristics, i.e., its probability densityfunction (pdf) and power spectral density (PSD) [2—4,5, sect. 1.2.1]. The optimum radar processor cannotbe predesigned when the clutter environment hasan unknown and varying Doppler spectrum; someperformance degradation has been experienced when amismatch is present between the design and the actualclutter Doppler spectra [6].Wind-induced motion of trees and other vegetation
causes spreading in the Doppler spectrum of radarground clutter. The shape of this intrinsic-motionDoppler spreading is relevant to determining theperformance of target detectors [7] and to theformation of ground images by synthetic apertureradar [8]. In the literature it has been often assumedthat the clutter has a Gaussian spectrum [9] or apower-law (PL) spectrum [10]. More recently, MITLincoln Laboratory (MIT-LL) has measured andcharacterized radar ground-clutter power spectraover wide spectral dynamic ranges by using thePhase One and L-Band Clutter Experiment (LCE)coherent-instrumentation radars. The experimentalmeasurements have revealed an exponential PSDshape in contrast to the commonly used Gaussian andpower-law shapes [11—15].This work investigates the effects on the
performance of the optimum MF detector of differentassumptions on the clutter PSD shape in the detectordesign stage. To this purpose we analyze theperformance loss not only in terms of improvementfactor (IF), but also in terms of probability of falsealarm (PFA) and probability of detection (PD). Therobustness to a mismatch between the design andthe actual clutter Doppler spectra is investigated byprocessing measured X-band ground-clutter data;theoretical predictions of the losses in IF have beenpreviously reported in [7].This introduction is followed by three sections.
The ground-clutter model and some of the resultsof our statistical analyses on measured clutter dataare reported in Section II. The Gaussian, the PL, andthe double-exponential PSDs have been consideredand their parameters estimated by means of a
538 IEEE TRANSACTIONS ON AEROSPACE AND ELECTRONIC SYSTEMS VOL. 37, NO. 2 APRIL 2001
nonlinear least squares (NLLS) method working inthe frequency domain. In Section III, the influenceof the spectral models on the performance of thematched filter is investigated in terms of improvementfactor and detection performance. In Section IV ourconclusions are summarized.
II. GROUND CLUTTER MODEL
A. Multidimensional Clutter Model
We assume that the disturbance is composedof a mixture of correlated Gaussian-distributedclutter and white Gaussian thermal noise as follows:d= c+n, where c denotes the circular complexGaussian-distributed clutter and n is the thermal noise.Clutter c is characterized by a complex Gaussian pdfwith zero mean, variance varfcig= ¾2C and normalizedcovariance matrix MC ([MC]ii = 1 for i = 1,2, : : : ,N).In shorthand notation we write c» CN (0,¾2CMC). Thethermal noise n is a circular complex random vectorof uncorrelated Gaussian random variables (RVs) niwith zero mean and variance ¾2N , i.e., n» CN (0,¾2NI),where I is the N £N identity matrix. The pdf of d,and so the pdf of the observed vector z under the nullhypothesis is given by
pd(d) =1
¼N(¾2C +¾2N)N jMnj
expµ¡d
HM¡1n d
¾2C +¾2N
¶(1)
where H stands for conjugate transpose and Mn is thenormalized covariance matrix ([Mn]ii = 1), such that
EfddHg= ¾2CMC +¾2NI= (¾
2C +¾
2N)Mn = ¾
2DMn
(2)
¾2D = ¾2C +¾
2N is the total disturbance power. The
elements of MC are derived from the normalizedcorrelation coefficient ½C[¢] as [MC]ik = ½C[k¡ i], fori,k = 1,2, : : : ,N, which in turn is obtained by inverseFourier transforming the PSD function.We consider three different PSD models: the
Gaussian, the PL, and the double-exponential models.According to (1), the mean value of d is zero; thus thefirst step of the measured-clutter data processing (seeSection IIB) was the subtraction from all the I and Qdata of the empirical means. As a consequence thedelta-function which was present in the PSD modelemployed in [7, 13] is not present here.The Gaussian spectrum was introduced by
Barlow [9] to approximate his measured L-bandground clutter PSD to a level 20 dB below the peakzero-Doppler level. Although all measurements ofground clutter spectra with greater sensitivity thanBarlow’s show shapes wider than his simple Gaussianmodel in their tails, for reasons of simplicity andmathematical tractability, the Gaussian representationcontinues to be used in radar system engineering, atleast as a first approach to representing effects of the
intrinsic motion of scatterers. The Gaussian spectralshape is given by
Sg(f) =¾2Cq2¼¾2f
exp
á f2
2¾2f
!, ¡1< f <1
(3)
where ¾2C is the clutter power and ¾f is the spectrumstandard deviation, i.e., ¾2f is the mean squarebandwidth. The discrete-time autocorrelationcoefficient ½g[¢] is obtained by sampling the inverseFourier transform of the PSD at the times tk = kT,where T is the pulse repetition interval (PRI):
½g[k] = ¾2C exp(¡2¼2¾2fT2k2): (4)
The PL model is due to Fishbein, Graveline,and Rittenbach [10]. This model is characterizedby two parameters, the shape parameter m, and thebreak-point Doppler frequency fc where the shapefunction is 3 dB below its peak zero-Doppler level
Splm(f) =¾2Cm
2¼fc¢ sin(¼=m)1+ (jfj=fc)m
, ¡1< f <1:(5)
Because of its two-parametric shape, the PL has onemore degree of freedom for fitting experimentaldata than the Gaussian. However, at very low powerlevels the PL shape always becomes wider than theGaussian, whatever the values of m and fc. The mostcommon experimental value for m is 3. When m= 2,the autocorrelation coefficient ½pl2[¢] is given by
½pl2[k] = ¾2C exp(¡2¼fcTjkj): (6)
For odd values of m, ½plm[k] cannot be derived inclosed form; it can be obtained numerically as theinverse Fourier transform of Splm(f).The exponential model has been introduced
by Billingsley to approximate the Phase One [11]and LCE [14] windblown ground-clutter spectralmeasurements over spectral dynamic ranges reaching60 to 80 dB below zero-Doppler peak. We generalizehere the exponential model as follows:
Se(f) =¾2Ck
1+ k¢ ¯1¸4exp
µ¡¯1¸2jfj
+¾2C1+ k
¢ ¯2¸4exp
µ¡¯2¸2jfj¶,
¡1< f <1 (7)
where ¸ is the radar transmission wavelength,¯1 and ¯2 are the shape parameters of the twoexponentials modeling the low-frequency power andthe medium-high-frequency power in the spectrum,respectively. Parameter k represents the ratio betweenthe two components in the spectrum; for k = 0
GRECO ET AL.: VALIDATION OF WINDBLOWN RADAR GROUND CLUTTER SPECTRAL SHAPE 539
we get the exponential model of [7, 11, 14]. Theautocorrelation coefficient ½e[¢] is given by
½e[k] =k
1+ k¢ ¾2C
1+µ4¼T¯1¸
¶2k2
+1
1+ k¢ ¾2C
1+µ4¼T¯2¸
¶2k2
: (8)
The double-exponential (Exp) shape is wider thanthe Gaussian, but narrower than the PL, whateverthe value of the PL exponent m. Like the Gaussian,the double-exponential is simple and analyticallytractable. Use of (7) is motivated as follows. Thehigh spectral power levels in the low-frequencyDoppler bins are due to higher parts of tree trunksand major limbs flexing slightly at very slow rates[13]. Sometimes this part of the spectrum presents aslope different from that in the tails of the PSD, i.e.,the low-frequency and the medium-high-frequencyregions present different shapes, so that fitting thePSD shape over the entire frequency range by usingonly one exponential (as in [7]) does not guaranteesufficient accuracy. It is important to guarantee a goodfit also on the tail region of the clutter PSD. In fact,according to [5] even the simplest single-delay-linemoving-target indicator (MTI) filter can sufficientlyreject low-frequency clutter power. In contrast, itis the tail of the clutter spectrum which requiresdefinition to enable correct design of the MTI filtercharacteristic or other Doppler rejection techniquesin the medium-high-frequency spectral region. As (7)has more adjustable parameters than (3) and (5), itcan be expected to yield a closer fit. The goal of thiswork is to show that the double-exponential model(7), proposed here for the first time, fits the clutterPSD for windblown foliage better than the Gaussianand PL models previously proposed in the literature.
B. Empirical Fitting
The first step of our analysis was to check the fitof the data to the Gaussian pdf model. The analyzedfile is H067032.2, for which the data were measuredfrom range cells containing windblown trees. Thearea irradiated for the H067032.2 data file washomogeneously tree-covered, primarily with mixeddeciduous trees and with occasional pine and cedar.This data set was recorded at the Katahdin Hill siteby the Phase One radar on 17 April 1985, as partof an investigative program of clutter measurementscarried forward by MIT Lincoln Laboratory over aperiod of nearly 20 years. The file contains 30,720pulses collected with pulse-repetition frequency (PRF)500 Hz. The radar wavelength ¸ is 3.26 cm (thecarrier frequency is 9.2 GHz) and the polarization
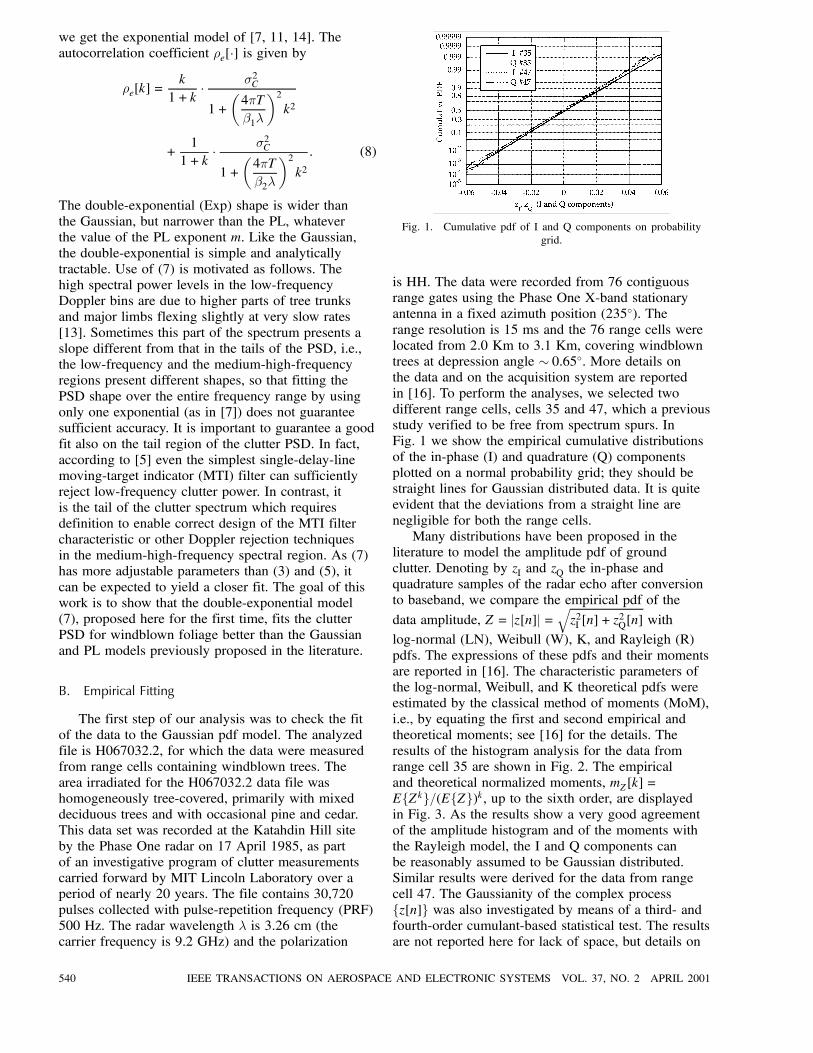
Fig. 1. Cumulative pdf of I and Q components on probabilitygrid.
is HH. The data were recorded from 76 contiguousrange gates using the Phase One X-band stationaryantenna in a fixed azimuth position (235±). Therange resolution is 15 ms and the 76 range cells werelocated from 2.0 Km to 3.1 Km, covering windblowntrees at depression angle » 0:65±. More details onthe data and on the acquisition system are reportedin [16]. To perform the analyses, we selected twodifferent range cells, cells 35 and 47, which a previousstudy verified to be free from spectrum spurs. InFig. 1 we show the empirical cumulative distributionsof the in-phase (I) and quadrature (Q) componentsplotted on a normal probability grid; they should bestraight lines for Gaussian distributed data. It is quiteevident that the deviations from a straight line arenegligible for both the range cells.Many distributions have been proposed in the
literature to model the amplitude pdf of groundclutter. Denoting by zI and zQ the in-phase andquadrature samples of the radar echo after conversionto baseband, we compare the empirical pdf of the
data amplitude, Z = jz[n]j=qz2I [n] + z
2Q[n] with
log-normal (LN), Weibull (W), K, and Rayleigh (R)pdfs. The expressions of these pdfs and their momentsare reported in [16]. The characteristic parameters ofthe log-normal, Weibull, and K theoretical pdfs wereestimated by the classical method of moments (MoM),i.e., by equating the first and second empirical andtheoretical moments; see [16] for the details. Theresults of the histogram analysis for the data fromrange cell 35 are shown in Fig. 2. The empiricaland theoretical normalized moments, mZ[k] =EfZkg=(EfZg)k, up to the sixth order, are displayedin Fig. 3. As the results show a very good agreementof the amplitude histogram and of the moments withthe Rayleigh model, the I and Q components canbe reasonably assumed to be Gaussian distributed.Similar results were derived for the data from rangecell 47. The Gaussianity of the complex processfz[n]g was also investigated by means of a third- andfourth-order cumulant-based statistical test. The resultsare not reported here for lack of space, but details on
540 IEEE TRANSACTIONS ON AEROSPACE AND ELECTRONIC SYSTEMS VOL. 37, NO. 2 APRIL 2001
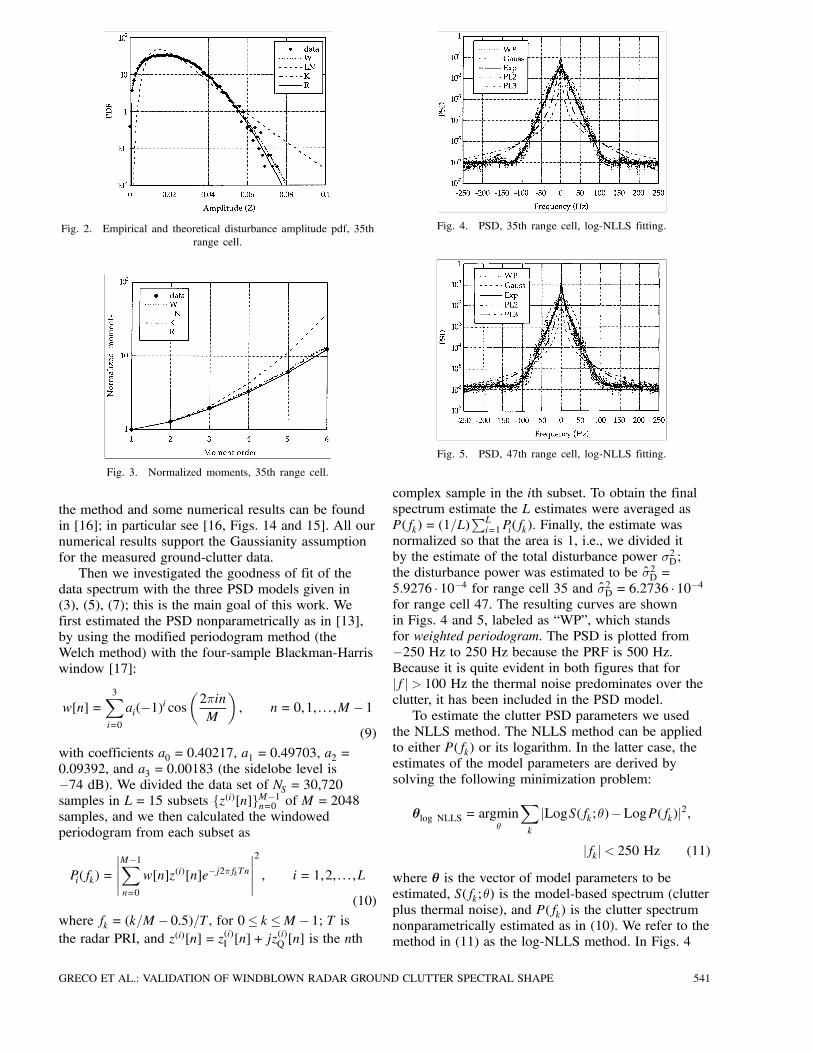
Fig. 2. Empirical and theoretical disturbance amplitude pdf, 35thrange cell.
Fig. 3. Normalized moments, 35th range cell.
the method and some numerical results can be foundin [16]; in particular see [16, Figs. 14 and 15]. All ournumerical results support the Gaussianity assumptionfor the measured ground-clutter data.Then we investigated the goodness of fit of the
data spectrum with the three PSD models given in(3), (5), (7); this is the main goal of this work. Wefirst estimated the PSD nonparametrically as in [13],by using the modified periodogram method (theWelch method) with the four-sample Blackman-Harriswindow [17]:
w[n] =3Xi=0
ai(¡1)i cosµ2¼inM
¶, n= 0,1, : : : ,M ¡ 1
(9)
with coefficients a0 = 0:40217, a1 = 0:49703, a2 =0:09392, and a3 = 0:00183 (the sidelobe level is¡74 dB). We divided the data set of NS = 30,720samples in L= 15 subsets fz(i)[n]gM¡1n=0 of M = 2048samples, and we then calculated the windowedperiodogram from each subset as
Pi(fk) =
¯̄̄̄¯M¡1Xn=0
w[n]z(i)[n]e¡j2¼fkTn¯̄̄̄¯2
, i= 1,2, : : : ,L
(10)
where fk = (k=M ¡ 0:5)=T, for 0· k ·M ¡ 1; T isthe radar PRI, and z(i)[n] = z(i)I [n]+ jz
(i)Q [n] is the nth
Fig. 4. PSD, 35th range cell, log-NLLS fitting.
Fig. 5. PSD, 47th range cell, log-NLLS fitting.
complex sample in the ith subset. To obtain the finalspectrum estimate the L estimates were averaged asP(fk) = (1=L)
PLi=1Pi(fk). Finally, the estimate was
normalized so that the area is 1, i.e., we divided itby the estimate of the total disturbance power ¾2D;the disturbance power was estimated to be ¾̂2D =5:9276 ¢ 10¡4 for range cell 35 and ¾̂2D = 6:2736 ¢ 10¡4for range cell 47. The resulting curves are shownin Figs. 4 and 5, labeled as “WP”, which standsfor weighted periodogram. The PSD is plotted from¡250 Hz to 250 Hz because the PRF is 500 Hz.Because it is quite evident in both figures that forjfj> 100 Hz the thermal noise predominates over theclutter, it has been included in the PSD model.To estimate the clutter PSD parameters we used
the NLLS method. The NLLS method can be appliedto either P(fk) or its logarithm. In the latter case, theestimates of the model parameters are derived bysolving the following minimization problem:
µlog NLLS = argminµ
Xk
jLogS(fk;µ)¡LogP(fk)j2,
jfkj< 250 Hz (11)
where µ is the vector of model parameters to beestimated, S(fk;µ) is the model-based spectrum (clutterplus thermal noise), and P(fk) is the clutter spectrumnonparametrically estimated as in (10). We refer to themethod in (11) as the log-NLLS method. In Figs. 4
GRECO ET AL.: VALIDATION OF WINDBLOWN RADAR GROUND CLUTTER SPECTRAL SHAPE 541
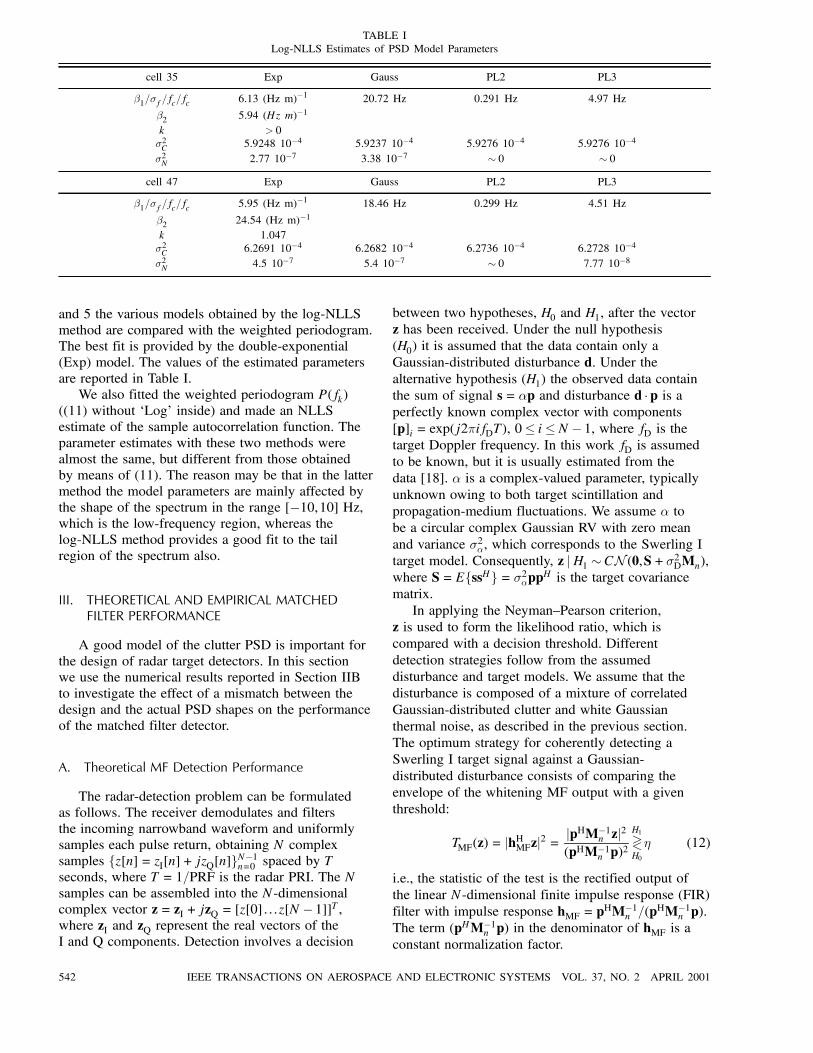
TABLE ILog-NLLS Estimates of PSD Model Parameters
cell 35 Exp Gauss PL2 PL3
¯1=¾f=fc=fc 6.13 (Hz m)¡1 20.72 Hz 0.291 Hz 4.97 Hz
¯2 5.94 (Hz m)¡1
k > 0¾2C 5:9248 10¡4 5:9237 10¡4 5:9276 10¡4 5:9276 10¡4
¾2N 2.77 10¡7 3:38 10¡7 » 0 » 0
cell 47 Exp Gauss PL2 PL3
¯1=¾f=fc=fc 5.95 (Hz m)¡1 18.46 Hz 0.299 Hz 4.51 Hz
¯2 24.54 (Hz m)¡1
k 1.047¾2C 6.2691 10¡4 6.2682 10¡4 6.2736 10¡4 6.2728 10¡4
¾2N 4.5 10¡7 5.4 10¡7 » 0 7:77 10¡8
and 5 the various models obtained by the log-NLLSmethod are compared with the weighted periodogram.The best fit is provided by the double-exponential(Exp) model. The values of the estimated parametersare reported in Table I.We also fitted the weighted periodogram P(fk)
((11) without ‘Log’ inside) and made an NLLSestimate of the sample autocorrelation function. Theparameter estimates with these two methods werealmost the same, but different from those obtainedby means of (11). The reason may be that in the lattermethod the model parameters are mainly affected bythe shape of the spectrum in the range [¡10,10] Hz,which is the low-frequency region, whereas thelog-NLLS method provides a good fit to the tailregion of the spectrum also.
III. THEORETICAL AND EMPIRICAL MATCHEDFILTER PERFORMANCE
A good model of the clutter PSD is important forthe design of radar target detectors. In this sectionwe use the numerical results reported in Section IIBto investigate the effect of a mismatch between thedesign and the actual PSD shapes on the performanceof the matched filter detector.
A. Theoretical MF Detection Performance
The radar-detection problem can be formulatedas follows. The receiver demodulates and filtersthe incoming narrowband waveform and uniformlysamples each pulse return, obtaining N complexsamples fz[n] = zI[n]+ jzQ[n]gN¡1n=0 spaced by Tseconds, where T = 1=PRF is the radar PRI. The Nsamples can be assembled into the N-dimensionalcomplex vector z= zI + jzQ = [z[0] : : : z[N ¡1]]T,where zI and zQ represent the real vectors of theI and Q components. Detection involves a decision
between two hypotheses, H0 and H1, after the vectorz has been received. Under the null hypothesis(H0) it is assumed that the data contain only aGaussian-distributed disturbance d. Under thealternative hypothesis (H1) the observed data containthe sum of signal s= ®p and disturbance d ¢p is aperfectly known complex vector with components[p]i = exp(j2¼ifDT), 0· i·N ¡ 1, where fD is thetarget Doppler frequency. In this work fD is assumedto be known, but it is usually estimated from thedata [18]. ® is a complex-valued parameter, typicallyunknown owing to both target scintillation andpropagation-medium fluctuations. We assume ® tobe a circular complex Gaussian RV with zero meanand variance ¾2®, which corresponds to the Swerling Itarget model. Consequently, z jH1 » CN (0,S+¾2DMn),where S= EfssHg= ¾2®ppH is the target covariancematrix.In applying the Neyman—Pearson criterion,
z is used to form the likelihood ratio, which iscompared with a decision threshold. Differentdetection strategies follow from the assumeddisturbance and target models. We assume that thedisturbance is composed of a mixture of correlatedGaussian-distributed clutter and white Gaussianthermal noise, as described in the previous section.The optimum strategy for coherently detecting aSwerling I target signal against a Gaussian-distributed disturbance consists of comparing theenvelope of the whitening MF output with a giventhreshold:
TMF(z) = jhHMFzj2 =jpHM¡1
n zj2(pHM¡1
n p)2H1><H0
´ (12)
i.e., the statistic of the test is the rectified output ofthe linear N-dimensional finite impulse response (FIR)filter with impulse response hMF = p
HM¡1n =(p
HM¡1n p).
The term (pHM¡1n p) in the denominator of hMF is a
constant normalization factor.
542 IEEE TRANSACTIONS ON AEROSPACE AND ELECTRONIC SYSTEMS VOL. 37, NO. 2 APRIL 2001
Performance loss arises from mismatch betweenthe design covariance matrix (M) and the actualclutter covariance matrix (Mn). We now investigatethe performance of the mismatched (MM)detector
TMM(z) =jpHM¡1zj2(pHM¡1p)2
H1><H0
´ (13)
where M 6=Mn when the clutter PSD shape ismismatched. The statistic of the test is the rectifiedoutput of the linear N-dimensional FIR filterwith impulse response h= pHM¡1=(pHM¡1p). Anovel contribution of this work is that theoreticalperformance predictions of the MM detector are testedon measured X-band ground clutter data; in additionto that, we analyze both the loss in IF, as in [6, 7],and the changes of the actual PFA and PD from designvalues because of PSD shape mismatching.The performance of detector (13) against a
complex Gaussian disturbance can be easily foundin closed form. Under the assumptions of Section IIA,Y = YI + jYQ = h
Hz= pHM¡1z=(pHM¡1p) is a complexGaussian distributed RV under both hypotheses. Themean value and the variance of Y are given by
EfY jHig= pHM¡1Efz jHig=(pHM¡1p) = 0,
i= 0,1 (14)
varfY jHig= EfjYj2 jHig=pHM¡1EfzzH jHigM¡1p
(pHM¡1p)2
=
8>>>>>>>>><>>>>>>>>>:
¾2DpHM¡1MnM
¡1p(pHM¡1p)2
= ¾20
(Hypothesis H0)
pHM¡1[¾2®ppH +¾2DMn]M
¡1p(pHM¡1p)2
= ¾20 +¾2® = ¾
21
(Hypothesis H1):
(15)Here ¾20 = ¾
2D=IF and
¾21 = ¾20
µ1+
¾2®¾2D¢ (pHM¡1p)2
pHM¡1MnM¡1p
¶= ¾20(1+SDRi ¢ IF) (16)
where SDRi = EfsHsg=EfdHdg= ¾2®=¾2D is the SDR(clutter plus thermal noise) at the input of the filterh. The quantity IF in (16) is the improvement factor,defined as the ratio between SDR at the output of thefilter h and the same quantity at the input of the filter[5, sect. 1.2.1]:
IF =SDR0SDRi
=(pHM¡1p)2
pHM¡1MnM¡1p: (17)
In fact,
SDR0 =Efj®pHM¡1pj2=(pHM¡1p)2gEfjpHM¡1dj2=(pHM¡1p)2g
=varfY jH1g¡ varfY jH0g
varfY jH0g=¾2®¾20
=¾2®(p
HM¡1p)2
¾2D(pHM¡1MnM¡1p)=SDRi(p
HM¡1p)2
pHM¡1MnM¡1p(18)
from which (17) immediately follows. The maximumIF is obtained with a large number N of integratedpulses and fDT = 0:5. The product fDT represents the“distance” between the target signal frequency andthe disturbance spectrum, which is centered at zerofrequency. The maximum value of the IF is equalto IFmax =N(CNR+1), where CNR= ¾
2C=¾
2N is the
clutter-to-noise power ratio; IFmax corresponds to theclutter reduction at the noise level enhanced by thecoherent integration of the useful signal with respectto the noise [2, 3]. Because of the presence of thenormalization factor (pHM¡1p)2 in (13), the gain ofthe filter over the signal component equals 1, i.e., thepowers of the target-signal component at the inputand at the output of h are equal and they are given byEfj®j2g= ¾2®, whatever M is.Under the assumption that both Mn and M are
real symmetric matrices, it can also be shown thatvarfYI jHig= varfYQ jHig= ¾2i =2 and that EfYIYQ jHig= 0 for i = 0,1. Thus, YI and YQ are two independentand identically distributed zero-mean Gaussian RVs,and X = TMM(z) = Y
2I +Y
2Q is an exponential RV with
pdf:
pX(x jHi) =1¾2iexp
µ¡ x
¾2i
¶u(x), i= 0,1: (19)
The probabilities of false alarm and detection aregiven by
PFA = expµ¡ ´
¾20
¶= exp
µ¡´IF¾2D
¶(20)
and
PD = expµ¡ ´
¾21
¶= exp
µ¡ ´IF¾2D(1+SDRiIF)
¶(21)
where ´ is the detection threshold. When the actualcovariance matrix Mn coincides with the design matrixM, which is the one assumed for building the filter in(12), h= pHM¡1=(pHM¡1p), the IF becomes
IFMF = pHM¡1p: (22)
Equations (20) and (21) remain valid not only whenthe input clutter PSD is perfectly matched to filterresponse h, i.e., Mn =M, but also in the presenceof mismatching (Mn 6=M), provided that the correctvalue of IF is utilized.
GRECO ET AL.: VALIDATION OF WINDBLOWN RADAR GROUND CLUTTER SPECTRAL SHAPE 543
B. Empirical MF Detection Performance
We now investigate the effects on detectionperformance (in terms of IF, PFA, and PD) of thedifferent clutter PSD models assumed. The goal isto assess which PSD model best fits our measuredground-clutter data. The general expression for IF isgiven by (17), where
[M]ik =CNR
1+CNR½C[k¡ i] +
11+CNR
±[k¡ i]
(23)
±[¢] is the Kronecker delta function and ½C[¢] is givenby (4), (6), or (8) depending on which PSD model isunder test. An estimate of the clutter-to-noise ratio isobtained from Table I as CNR= ¾̂2C=¾̂
2N .
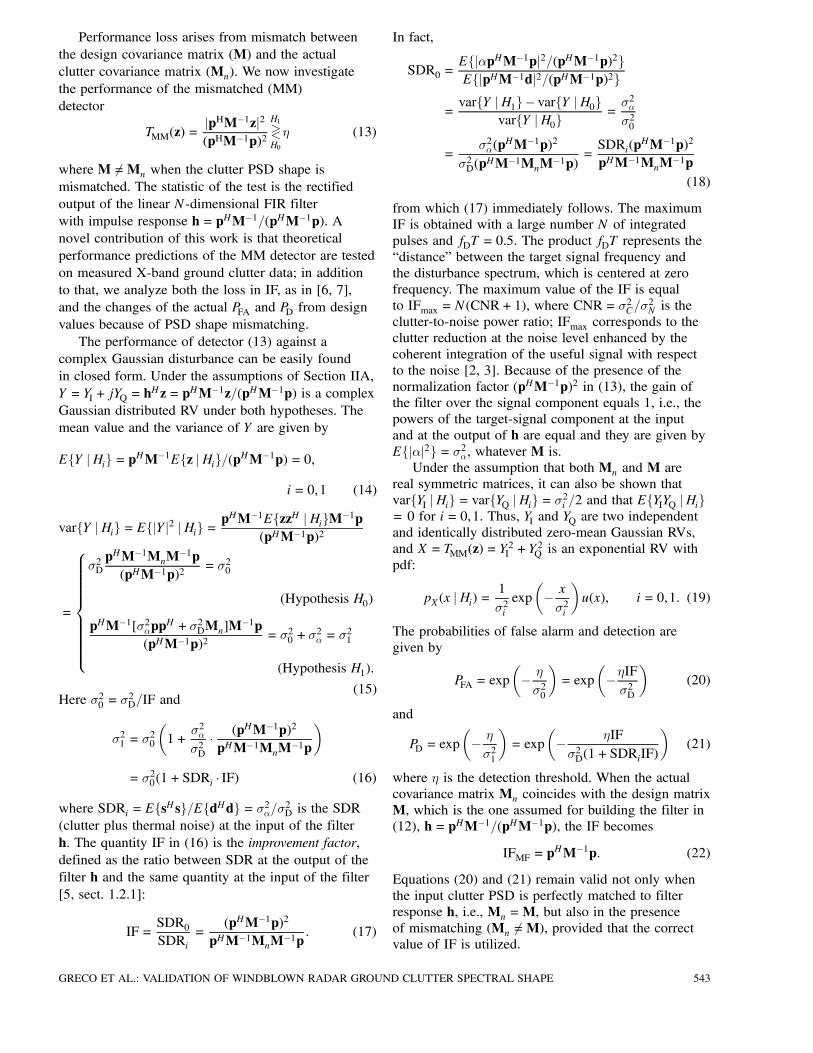
Unfortunately we cannot directly use (17) tocalculate IF, as in [5, Sect. 1.2.1, 6], because theactual covariance matrix Mn of the measured clutterdata is unknown. We therefore followed an alternativeroute described in Fig. 6. In Fig. 6 we refer to thedouble-exponential model, but the block diagram isvalid whichever model is under test. Because we wantto investigate the goodness of fit of the different PSDmodels, we do not plot IF directly, but its ratio withthe value obtained for perfect matching. The idea isthat the closer the actual clutter covariance matrix Mn
to the design matrix M, the better the fit. Thus, foreach PSD model we compare two situations describedin Fig. 6, where the inputs are different, but the filteris the same: in the one case the input data are themeasured data, d= z jH0 » CN(0,¾2DMn). Thus, thefilter, which is built on the model-based estimate,is mismatched with the input. In the other case, weassume that the filter is perfectly matched, i.e., theinput data are exactly d= z jH0 » CN(0,¾2DM). TheIF expressions for the two situations are reportedin Fig. 6. The closer their ratio ¢IF = IF/IFMF to 1,the better the fit. Thus, ¢IF measures the mismatchbetween the model and the actual PSD shape. Thesteps we carried out to calculate ¢IF are as follows.
1) Select one PSD model and estimate itsparameters from the measured data by means of(11); for example, for the double-exponential modelof (7) we estimate the vector parameter µexp =[¾2C ¾
2N ¯1 ¯2 k]. ¾
2D = ¾
2C +¾
2N is the total disturbance
(clutter plus thermal noise) power. The estimates ofthe disturbance power are ¾2D = 5:9276 ¢ 10¡4 for rangecell 35 and ¾2D = 6:2736 ¢ 10¡4 for range cell 47.2) Use the estimate of µexp to build the design
matrix M=M(µ̂exp) and the FIR filter of (13) withimpulse response h= pHM¡1=(pHM¡1p), i.e., thedesign matrix M is determined from (23) aftersubstituting the estimates of the µ found in 1 above.3) Filter the measured ground-clutter data and
estimate the power ¾20 of the clutter at the filter output.
Fig. 6. Steps for derivation of ¢IF.
Fig. 7. Plots of ¢IF against target Doppler frequency, N = 12,35th range cell.
4) Estimate IF by the definition as the ratiobetween the SDR at the output of the filter h and thesame quantity at the input of the filter; these quantitiesare given by SDR0 = ¾
2®=¾
20 and SDRi = ¾
2®=¾
2D,
respectively. ¾2® is the target signal power and it isknown a priori. We finally obtain IF = SDR0=SDRi =¾2D=¾
20.5) When the filter is perfectly matched (e.g.,
in the lower branch of Fig. 6, the input data areexactly Gaussian distributed with double-exponentialspectrum) IF is given by (22). Finally the loss in IF isobtained as ¢IF = IF=(pHM¡1p).6) Repeat steps 1—5 for all the other PSD models.
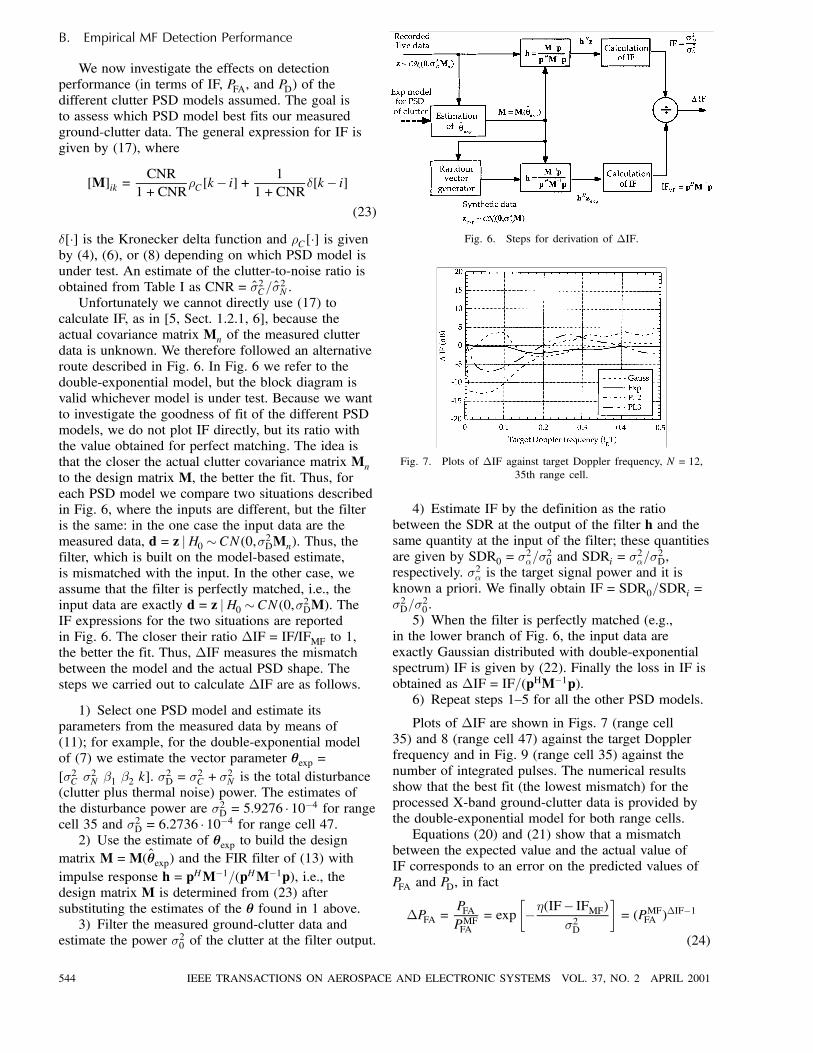
Plots of ¢IF are shown in Figs. 7 (range cell35) and 8 (range cell 47) against the target Dopplerfrequency and in Fig. 9 (range cell 35) against thenumber of integrated pulses. The numerical resultsshow that the best fit (the lowest mismatch) for theprocessed X-band ground-clutter data is provided bythe double-exponential model for both range cells.Equations (20) and (21) show that a mismatch
between the expected value and the actual value ofIF corresponds to an error on the predicted values ofPFA and PD, in fact
¢PFA =PFAPMFFA
= exp·¡´(IF¡ IFMF)
¾2D
¸= (PMFFA )
¢IF¡1
(24)
544 IEEE TRANSACTIONS ON AEROSPACE AND ELECTRONIC SYSTEMS VOL. 37, NO. 2 APRIL 2001
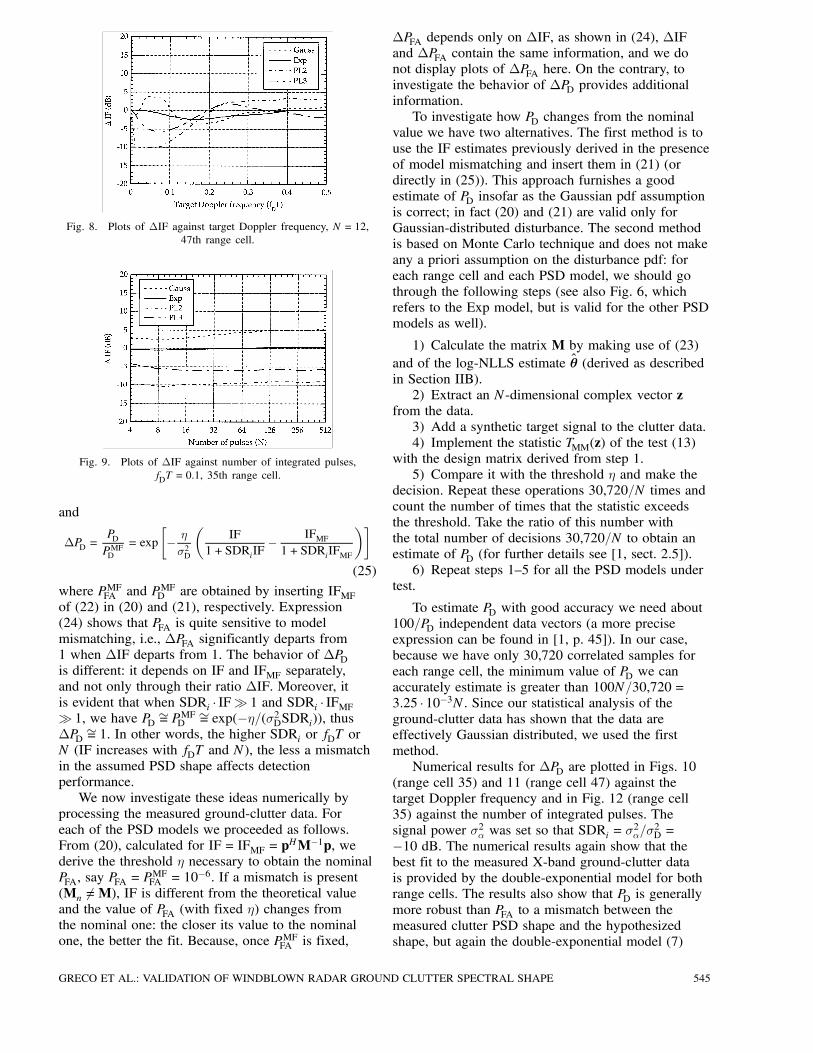
Fig. 8. Plots of ¢IF against target Doppler frequency, N = 12,47th range cell.
Fig. 9. Plots of ¢IF against number of integrated pulses,fDT = 0:1, 35th range cell.
and
¢PD =PDPMFD
= exp
·¡ ´
¾2D
µIF
1+SDRiIF¡ IFMF1+SDRiIFMF
¶¸(25)
where PMFFA and PMFD are obtained by inserting IFMFof (22) in (20) and (21), respectively. Expression(24) shows that PFA is quite sensitive to modelmismatching, i.e., ¢PFA significantly departs from1 when ¢IF departs from 1. The behavior of ¢PDis different: it depends on IF and IFMF separately,and not only through their ratio ¢IF. Moreover, itis evident that when SDRi ¢ IFÀ 1 and SDRi ¢ IFMFÀ 1, we have PD
»= PMFD»= exp(¡´=(¾2DSDRi)), thus
¢PD»= 1. In other words, the higher SDRi or fDT or
N (IF increases with fDT and N), the less a mismatchin the assumed PSD shape affects detectionperformance.We now investigate these ideas numerically by
processing the measured ground-clutter data. Foreach of the PSD models we proceeded as follows.From (20), calculated for IF = IFMF = p
HM¡1p, wederive the threshold ´ necessary to obtain the nominalPFA, say PFA = P
MFFA = 10¡6. If a mismatch is present
(Mn 6=M), IF is different from the theoretical valueand the value of PFA (with fixed ´) changes fromthe nominal one: the closer its value to the nominalone, the better the fit. Because, once PMFFA is fixed,
¢PFA depends only on ¢IF, as shown in (24), ¢IFand ¢PFA contain the same information, and we donot display plots of ¢PFA here. On the contrary, toinvestigate the behavior of ¢PD provides additionalinformation.To investigate how PD changes from the nominal
value we have two alternatives. The first method is touse the IF estimates previously derived in the presenceof model mismatching and insert them in (21) (ordirectly in (25)). This approach furnishes a goodestimate of PD insofar as the Gaussian pdf assumptionis correct; in fact (20) and (21) are valid only forGaussian-distributed disturbance. The second methodis based on Monte Carlo technique and does not makeany a priori assumption on the disturbance pdf: foreach range cell and each PSD model, we should gothrough the following steps (see also Fig. 6, whichrefers to the Exp model, but is valid for the other PSDmodels as well).
1) Calculate the matrix M by making use of (23)and of the log-NLLS estimate µ̂ (derived as describedin Section IIB).2) Extract an N-dimensional complex vector z
from the data.3) Add a synthetic target signal to the clutter data.4) Implement the statistic TMM(z) of the test (13)
with the design matrix derived from step 1.5) Compare it with the threshold ´ and make the
decision. Repeat these operations 30,720=N times andcount the number of times that the statistic exceedsthe threshold. Take the ratio of this number withthe total number of decisions 30,720=N to obtain anestimate of PD (for further details see [1, sect. 2.5]).6) Repeat steps 1—5 for all the PSD models under
test.
To estimate PD with good accuracy we need about100=PD independent data vectors (a more preciseexpression can be found in [1, p. 45]). In our case,because we have only 30,720 correlated samples foreach range cell, the minimum value of PD we canaccurately estimate is greater than 100N=30,720 =3:25 ¢ 10¡3N. Since our statistical analysis of theground-clutter data has shown that the data areeffectively Gaussian distributed, we used the firstmethod.Numerical results for ¢PD are plotted in Figs. 10
(range cell 35) and 11 (range cell 47) against thetarget Doppler frequency and in Fig. 12 (range cell35) against the number of integrated pulses. Thesignal power ¾2® was set so that SDRi = ¾
2®=¾
2D =
¡10 dB. The numerical results again show that thebest fit to the measured X-band ground-clutter datais provided by the double-exponential model for bothrange cells. The results also show that PD is generallymore robust than PFA to a mismatch between themeasured clutter PSD shape and the hypothesizedshape, but again the double-exponential model (7)
GRECO ET AL.: VALIDATION OF WINDBLOWN RADAR GROUND CLUTTER SPECTRAL SHAPE 545
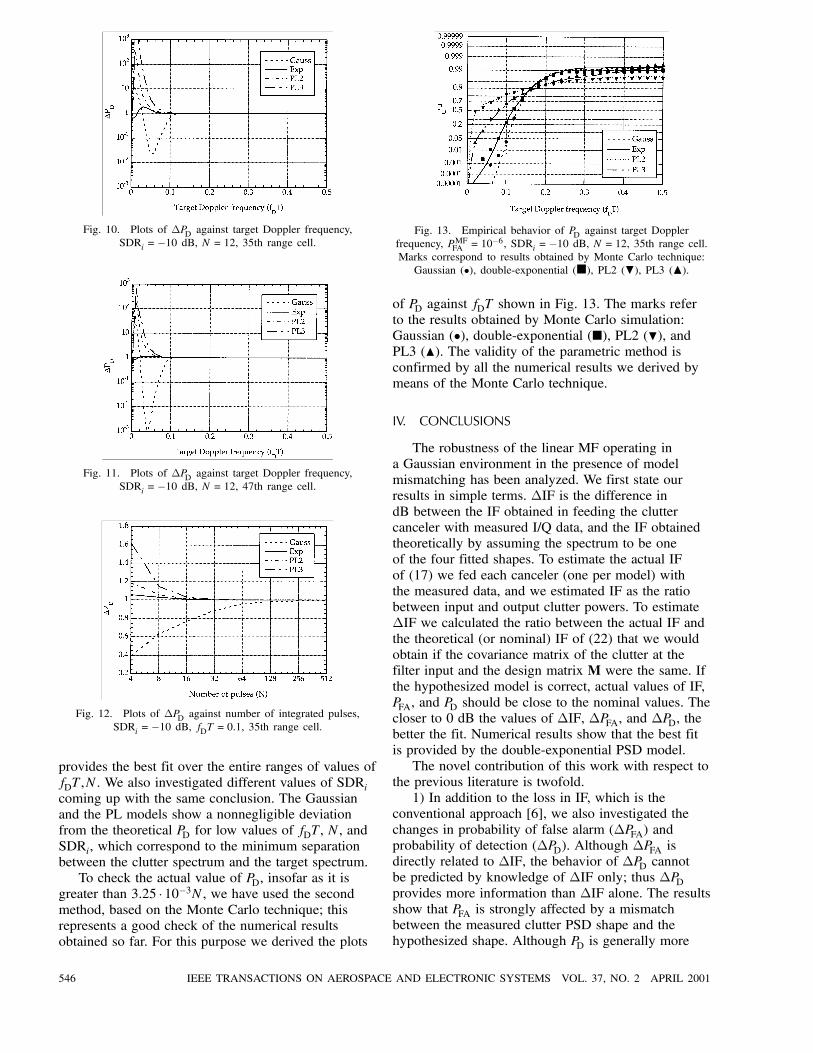
Fig. 10. Plots of ¢PD against target Doppler frequency,SDRi =¡10 dB, N = 12, 35th range cell.
Fig. 11. Plots of ¢PD against target Doppler frequency,SDRi =¡10 dB, N = 12, 47th range cell.
Fig. 12. Plots of ¢PD against number of integrated pulses,SDRi =¡10 dB, fDT = 0:1, 35th range cell.
provides the best fit over the entire ranges of values offDT,N. We also investigated different values of SDRicoming up with the same conclusion. The Gaussianand the PL models show a nonnegligible deviationfrom the theoretical PD for low values of fDT, N, andSDRi, which correspond to the minimum separationbetween the clutter spectrum and the target spectrum.To check the actual value of PD, insofar as it is
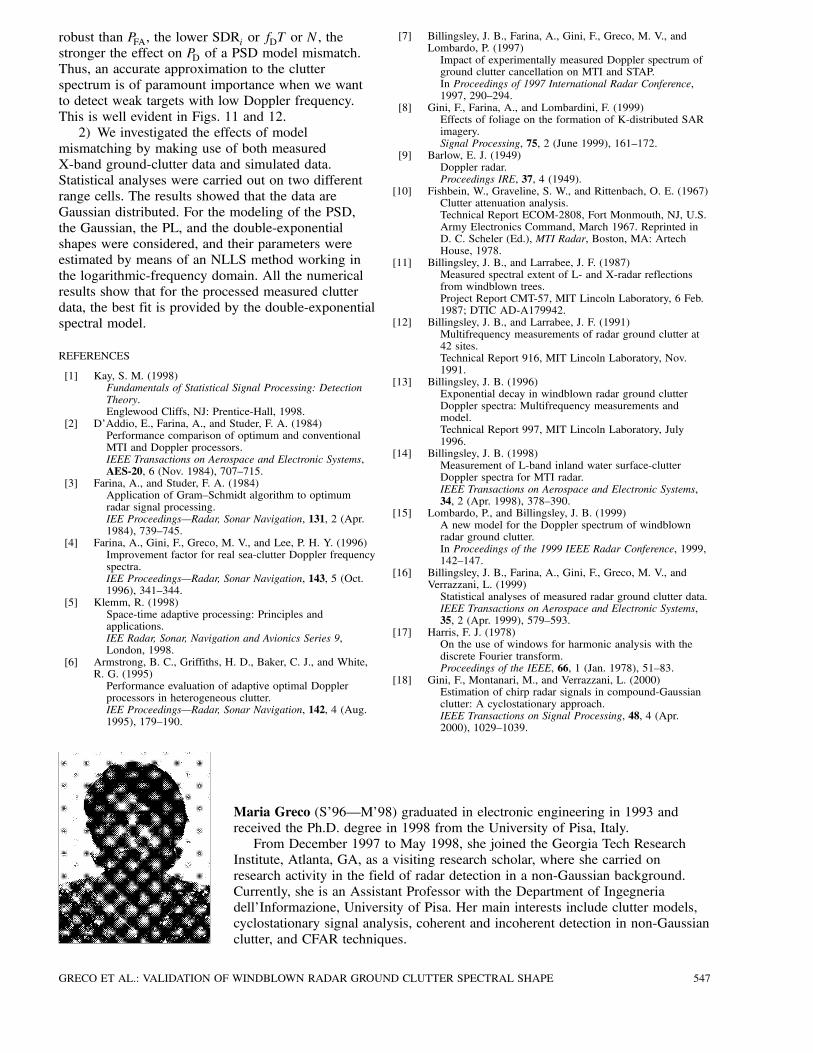
greater than 3:25 ¢10¡3N, we have used the secondmethod, based on the Monte Carlo technique; thisrepresents a good check of the numerical resultsobtained so far. For this purpose we derived the plots
Fig. 13. Empirical behavior of PD against target Dopplerfrequency, PMFFA = 10¡6, SDRi =¡10 dB, N = 12, 35th range cell.Marks correspond to results obtained by Monte Carlo technique:Gaussian (²), double-exponential (¥), PL2 (H), PL3 (N).
of PD against fDT shown in Fig. 13. The marks referto the results obtained by Monte Carlo simulation:Gaussian (²), double-exponential (¥), PL2 (H), andPL3 (N). The validity of the parametric method isconfirmed by all the numerical results we derived bymeans of the Monte Carlo technique.
IV. CONCLUSIONS
The robustness of the linear MF operating ina Gaussian environment in the presence of modelmismatching has been analyzed. We first state ourresults in simple terms. ¢IF is the difference indB between the IF obtained in feeding the cluttercanceler with measured I/Q data, and the IF obtainedtheoretically by assuming the spectrum to be oneof the four fitted shapes. To estimate the actual IFof (17) we fed each canceler (one per model) withthe measured data, and we estimated IF as the ratiobetween input and output clutter powers. To estimate¢IF we calculated the ratio between the actual IF andthe theoretical (or nominal) IF of (22) that we wouldobtain if the covariance matrix of the clutter at thefilter input and the design matrix M were the same. Ifthe hypothesized model is correct, actual values of IF,PFA, and PD should be close to the nominal values. Thecloser to 0 dB the values of ¢IF, ¢PFA, and ¢PD, thebetter the fit. Numerical results show that the best fitis provided by the double-exponential PSD model.The novel contribution of this work with respect to
the previous literature is twofold.1) In addition to the loss in IF, which is the
conventional approach [6], we also investigated thechanges in probability of false alarm (¢PFA) andprobability of detection (¢PD). Although ¢PFA isdirectly related to ¢IF, the behavior of ¢PD cannotbe predicted by knowledge of ¢IF only; thus ¢PDprovides more information than ¢IF alone. The resultsshow that PFA is strongly affected by a mismatchbetween the measured clutter PSD shape and thehypothesized shape. Although PD is generally more
546 IEEE TRANSACTIONS ON AEROSPACE AND ELECTRONIC SYSTEMS VOL. 37, NO. 2 APRIL 2001
robust than PFA, the lower SDRi or fDT or N, thestronger the effect on PD of a PSD model mismatch.Thus, an accurate approximation to the clutterspectrum is of paramount importance when we wantto detect weak targets with low Doppler frequency.This is well evident in Figs. 11 and 12.2) We investigated the effects of model
mismatching by making use of both measuredX-band ground-clutter data and simulated data.Statistical analyses were carried out on two differentrange cells. The results showed that the data areGaussian distributed. For the modeling of the PSD,the Gaussian, the PL, and the double-exponentialshapes were considered, and their parameters wereestimated by means of an NLLS method working inthe logarithmic-frequency domain. All the numericalresults show that for the processed measured clutterdata, the best fit is provided by the double-exponentialspectral model.
REFERENCES
[1] Kay, S. M. (1998)Fundamentals of Statistical Signal Processing: DetectionTheory.Englewood Cliffs, NJ: Prentice-Hall, 1998.
[2] D’Addio, E., Farina, A., and Studer, F. A. (1984)Performance comparison of optimum and conventionalMTI and Doppler processors.IEEE Transactions on Aerospace and Electronic Systems,AES-20, 6 (Nov. 1984), 707—715.
[3] Farina, A., and Studer, F. A. (1984)Application of Gram—Schmidt algorithm to optimumradar signal processing.IEE Proceedings–Radar, Sonar Navigation, 131, 2 (Apr.1984), 739—745.
[4] Farina, A., Gini, F., Greco, M. V., and Lee, P. H. Y. (1996)Improvement factor for real sea-clutter Doppler frequencyspectra.IEE Proceedings–Radar, Sonar Navigation, 143, 5 (Oct.1996), 341—344.
[5] Klemm, R. (1998)Space-time adaptive processing: Principles andapplications.IEE Radar, Sonar, Navigation and Avionics Series 9,London, 1998.
[6] Armstrong, B. C., Griffiths, H. D., Baker, C. J., and White,R. G. (1995)Performance evaluation of adaptive optimal Dopplerprocessors in heterogeneous clutter.IEE Proceedings–Radar, Sonar Navigation, 142, 4 (Aug.1995), 179—190.
Maria Greco (S’96–M’98) graduated in electronic engineering in 1993 andreceived the Ph.D. degree in 1998 from the University of Pisa, Italy.From December 1997 to May 1998, she joined the Georgia Tech Research
Institute, Atlanta, GA, as a visiting research scholar, where she carried onresearch activity in the field of radar detection in a non-Gaussian background.Currently, she is an Assistant Professor with the Department of Ingegneriadell’Informazione, University of Pisa. Her main interests include clutter models,cyclostationary signal analysis, coherent and incoherent detection in non-Gaussianclutter, and CFAR techniques.
[7] Billingsley, J. B., Farina, A., Gini, F., Greco, M. V., andLombardo, P. (1997)Impact of experimentally measured Doppler spectrum ofground clutter cancellation on MTI and STAP.In Proceedings of 1997 International Radar Conference,1997, 290—294.
[8] Gini, F., Farina, A., and Lombardini, F. (1999)Effects of foliage on the formation of K-distributed SARimagery.Signal Processing, 75, 2 (June 1999), 161—172.
[9] Barlow, E. J. (1949)Doppler radar.Proceedings IRE, 37, 4 (1949).
[10] Fishbein, W., Graveline, S. W., and Rittenbach, O. E. (1967)Clutter attenuation analysis.Technical Report ECOM-2808, Fort Monmouth, NJ, U.S.Army Electronics Command, March 1967. Reprinted inD. C. Scheler (Ed.), MTI Radar, Boston, MA: ArtechHouse, 1978.
[11] Billingsley, J. B., and Larrabee, J. F. (1987)Measured spectral extent of L- and X-radar reflectionsfrom windblown trees.Project Report CMT-57, MIT Lincoln Laboratory, 6 Feb.1987; DTIC AD-A179942.
[12] Billingsley, J. B., and Larrabee, J. F. (1991)Multifrequency measurements of radar ground clutter at42 sites.Technical Report 916, MIT Lincoln Laboratory, Nov.1991.
[13] Billingsley, J. B. (1996)Exponential decay in windblown radar ground clutterDoppler spectra: Multifrequency measurements andmodel.Technical Report 997, MIT Lincoln Laboratory, July1996.
[14] Billingsley, J. B. (1998)Measurement of L-band inland water surface-clutterDoppler spectra for MTI radar.IEEE Transactions on Aerospace and Electronic Systems,34, 2 (Apr. 1998), 378—390.
[15] Lombardo, P., and Billingsley, J. B. (1999)A new model for the Doppler spectrum of windblownradar ground clutter.In Proceedings of the 1999 IEEE Radar Conference, 1999,142—147.
[16] Billingsley, J. B., Farina, A., Gini, F., Greco, M. V., andVerrazzani, L. (1999)Statistical analyses of measured radar ground clutter data.IEEE Transactions on Aerospace and Electronic Systems,35, 2 (Apr. 1999), 579—593.
[17] Harris, F. J. (1978)On the use of windows for harmonic analysis with thediscrete Fourier transform.Proceedings of the IEEE, 66, 1 (Jan. 1978), 51—83.
[18] Gini, F., Montanari, M., and Verrazzani, L. (2000)Estimation of chirp radar signals in compound-Gaussianclutter: A cyclostationary approach.IEEE Transactions on Signal Processing, 48, 4 (Apr.2000), 1029—1039.
GRECO ET AL.: VALIDATION OF WINDBLOWN RADAR GROUND CLUTTER SPECTRAL SHAPE 547
Fulvio Gini (M’92–SM’00) received the Doctor Engineer (cum laude) and theResearch Doctor degrees in electronic engineering from the University of Pisa,Italy, in 1990 and 1995, respectively.In 1993 he joined as the Department of “Ingegneria dell’Informazione” of
the University of Pisa, where he is Associate Professor since October 2000.From July 1996 through January 1997, he was a visiting researcher at theDepartment of Electrical Engineering, University of Virginia, Charlottesville.He has been Session Chairman at international conferences. He has givenlectures at universities in Italy and abroad, and has given a tutorial entitled“Coherent Detection and Fusion in High Resolution Radar Systems” at theInternational Conference on Radar (May 1999, Brest) and the tutorial “AdvancedRadar Detection and Fusion” at the International Radar Conference (May 2000,Washington, DC). His general interests are in the areas of statistical signalprocessing, estimation and detection theory. In particular, his research interestsinclude non-Gaussian signal detection and estimation using higher order statistics,parameter estimation and data extraction from multichannel interferometric SARdata, cyclostationary signal analysis, and estimation of nonstationary signals, withapplications to communication and radar processing.Dr. Gini is the author of more than 80 peer reviewed publications. He is an
Associate Editor for the IEEE Transactions on Signal Processing.
Alfonso Farina (M’85–SM’97–F’00) received his doctorate in electronicengineering from the University of Rome, Italy, in 1973.In 1974 he joined Selenia S.p.A. (now part of Alenia Marconi Systems) where
he is now a Manager in the Radar and C2 Division and Head Deputy of theSystem Analysis Group. He was “Professore Incaricato” of Radar Techniquesat the University of Naples since 1979, and in 1985 he was appointed AssociateProfessor at the same university. His main work interests are in signal, radar dataprocessing techniques for ground-based and AEW radars, ECCM and syntheticaperture radars.Dr. Farina is the author of more than 170 published papers, the co-author
with Dr. F. A. Studer of a two-volume book, Radar Data Processing, the editorof Optimised Radar Processors, and the author of the recent book by ArtechHouse, Antenna Based Signal Processing Techniques for Radar Systems. He isa Fellow of IEE (UK). He has been Session Chairman at several InternationalRadar Conferences. He received the 1987 Radar System Panel Award of IEEEfor development of radar data processing techniques. Also, he is a member of theInternational Radar System Panel of AES, IEEE.
J. Barrie Billingsley (S’63–M’67) received B.A.Sc. and M.A.Sc. degrees inelectrical engineering from the University of Toronto.From 1967 to 1978 he was employed by Calspan Corporation, Buffalo, NY,
where much of his work involved analysis of scattering from radar targets. Since1978 he has been a member of the Technical Staff at M.I.T. Lincoln Laboratorywhere he is the principal investigator for a large-scale program of radar groundclutter measurements.Mr. Billingsley received the 1987 Best Paper Award from the Journal of
Defense Research for his paper entitled “Ground Clutter Measurements for AirDefense Radars.” From 1992 to 1997 he served as U.S. National Leader ofTTCP’s (The Technical Cooperation Program’s) Technical Panel on Radar ClutterResearch, and was awarded the 1993 TTCP Achievement Award for work incharacterizing the low-angle clutter phenomenon.
548 IEEE TRANSACTIONS ON AEROSPACE AND ELECTRONIC SYSTEMS VOL. 37, NO. 2 APRIL 2001