Embed Size (px)
Citation preview
Advances in Accounting, incorporating Advances in International Accounting 26 (2010) 134–141
Contents lists available at ScienceDirect
Advances in Accounting, incorporating Advances inInternational Accounting
j ourna l homepage: www.e lsev ie r.com/ locate /ad iac
Value relevance of disclosed related party transactions
Wenxia Ge a,⁎, Donald H. Drury b,1, Steve Fortin b,2, Feng Liu c,3, Desmond Tsang b,4
a Asper School of Business, University of Manitoba, 181 Freedman Crescent, Winnipeg, MB, Canada R3T 5V4b Desautels Faculty of Management, McGill University, 1001 Sherbrooke Street West, Montreal, QC, Canada H3A 1G5c Financial Planning Standards Board of China Ltd., Cham Time International Finance Building, 1589 Century Avenue, Pudong, Shanghai 200122, China
⁎ Corresponding author. Tel.: +1 204 474 9331.E-mail addresses: [email protected] (W. Ge), dona
(D.H. Drury), [email protected] (S. Fortin), [email protected]@mcgill.ca (D. Tsang).
1 Tel.: +1 514 398 8219.2 Tel.: +1 514 398 4021.3 Tel.: +86 21 6093 0819.4 Tel.: +1 514 398 5417.
0882-6110/$ – see front matter © 2010 Elsevier Ltd. Aldoi:10.1016/j.adiac.2010.02.004
a b s t r a c t
a r t i c l e i n f oKeywords:
Value relevanceRelated party transactionEarnings managementChina’s stock marketSeveral recent North American corporate scandals have brought attention to the potential for accountingmanipulations associated with related party transactions (RPTs), which have lead to a decline in perceivedearnings quality. We examine the value relevance of disclosed RPTs in Chinese corporations. We focus ontwo types of RPTs: sales of goods and sales of assets. From 1997 to 2000, we find that the reported earningsof firms selling goods or assets to related parties exhibit a lower valuation coefficient than those of firms inChina without such transactions. This result is not observed during 2001–2003 after a new fair valuemeasurement rule for RPTs came into effect. Our evidence suggests that the new RPT regulation in China isperceived to be effective at reducing the potential misuse of RPTs for earnings management purposes. SinceRPTs have been the subject of numerous scandals in North America, our evidence from the Chinese stockmarkets suggests that new RPT accounting standards could prove an efficient solution to this issue.
[email protected] (F. Liu),
l rights reserved.
© 2010 Elsevier Ltd. All rights reserved.
1. Introduction
This paper investigates whether disclosures about related partytransactions made by listed firms are value relevant. Recent scandalsin the United States, such as Adelphia and the Riga family's corporategroup, and Hollinger and Conrad Black's corporate group, havebrought related party transactions under the spotlight. Related partytransactions have also received attention in China, as China hasadopted two related party transaction standards over the last tenyears, making the examination of pre-post standard effects possible.
Many Chinese listed companies are spin-offs of state-ownedcompanies. Some companies are members of business consortia.Other related parties exist as a result of mergers and acquisitions orother capital investment activities. One view of the world is thatrelated party transactions can be used within these corporate groupsas a way to optimize internal resource allocation, reduce transactioncosts, and improve return-on-assets. On the other hand, thesetransactions, if used opportunistically by management or otherstakeholders, can produce misleading operating results and adverselyaffect minority shareholders' wealth. Many articles in the Chinesefinancial press express concerns about the widespread use of related
party transactions (e.g., Huang, 2003; Cao, 2003). For example, theyare worried about controlling shareholders using listed firms asfinancing vehicles and then reallocating listed firms' capitals to otherventures. Another worry is that management may be inflatingearnings to gain rights issue approval through wash sales with relatedparties. Management may also be seeking benefits through buyingand selling at unreasonable prices, or through the exchange of assetswith different qualities, etc.
Responding to public concerns about the reporting of related partytransactions, the Ministry of Finance of China (MOF), which is China'saccounting standard setter, has first required listed firms to discloserelated party relations and related party transactions to protectindividual investors' rights in 1997. However, though Chinese listedcompanies were required to disclose their related party transactions,the MOF believed that some firms still engaged in these inter-company transactions to manipulate earnings and to misleadinvestors. By the end of 2001, the MOF promulgated anotherregulation that put restrictions on the accounting for related partytransactions: Provisional Regulation on the Accounting for Sales of Assetsand Other Transactions between Related Parties (labeled as “2001 RPTMeasurement Regulation”). The new regulation states that if the priceof a related party transaction is above its fair value, the pricedifferential cannot be recognized as current earnings.
In this study, we investigate whether disclosed related partytransactions under the new regulation in 2001 provide value relevantinformation to investors. We posit that if the new regulation iseffective and related party transactions cannot be used opportunis-tically to manage earnings, there is little reason for investors todiscount firms involved in related party transactions. Between 1997
5 The “1997 RPT Disclosure Standard” does not apply to the following potentiallyrelated parties:
a. Fund providers, public utilities, government departments and institutions whichhave normal operational transactions with a company but do not have other relatedparty relationships, although they might be involved in a company's financing andoperating decisions, or confine the firms' activities to some extent;
b. Individual buyers, providers or agents who have business dependencies with thecompany just due to a large amount of transactions;
c. State-owned companies are not related parties just because they are all controlledby the state, but they are related parties if they have the above mentioned relatedparty relationships defined in the standard.
135W. Ge et al. / Advances in Accounting, incorporating Advances in International Accounting 26 (2010) 134–141
and 2000, the MOF argued that related party transactions continuedto be used to manipulate earnings. Hence, if investors are aware of theexistence of the potential for earnings manipulation through theserelated party transactions, they would have reacted by lowering theirvaluation of firms that engage in related party transactions in the 1997to 2000 period. First, we empirically examine whether disclosures ofrelated party transactions provide value relevant information toinvestors in a regime where a fair value measurement standard doesnot exist. Second, we examine whether a fair value measurementrequirement for related party transaction, following the adoption ofthe new regulation by MOF, changes investors’ perceptions on thereliability of related party transactions information. Our test is basedon a comparison of investor’s valuation parameters for accountingfundamentals in valuing the firm, by comparing value relevance ofrelated party transactions in China under both regulation regimes. Wepredict that the earnings parameter of firms that have related partysales transactions (including sales of goods and sales of assets) issignificantly lower than that of firms without such transactions beforethe adoption of the “2001 RPT Measurement Regulation”. Providedthat the “2001 RPT Measurement Regulation” reduces the potentialfor earnings management, we predict that the valuation parameter offirms with related party transactions after this regulation is notsignificantly different from the valuation parameters of firms withoutrelated party transactions. If the regulation has successfully curtailedthe use of related party transactions to manage earnings, theninvestors no longer need to discount the earnings of firms engaging inthese transactions.
We collect data for 52 manufacturing firms that are part of the“Top 100 Chinese listed firms”, as compiled in the “2002 Rankings” ofNew Youth Fortune, a Chinese financial magazine, and for whichfinancial statements and stock market information are available. Theaccounting data cover the period 1997 to 2003. We divide our 297firm-year observations into two test periods: 1997 to 2000 and 2001to 2003. The partition point is the year 2001 when the “2001 RPTMeasurement Regulation” has been issued. We perform regressionanalyses on sub-samples from these two test periods. Our resultsshow that earnings of firms that have related party sales transactions(sales of goods and other assets) are less value relevant compared tothe earnings of firms that do not engage in such transactions duringthe period of 1997-2000. However, there is no significant difference inthe earnings valuation for the two groups in the second test period.These results suggest that the “2001 RPT Measurement Regulation” isperceived effective by investors at controlling opportunistic earningsmanagement behavior by managers. In general, our results are robustto several sensitivity analyses.
This study contributes to the accounting literature in twoways. First,it expands value relevance tests from traditional financial statementnumbers to related party transactions, which include informationdisclosed in the financial statement notes. We provide evidence thatrelated party transactions information is used by investors to assess thereliability of reported accounting numbers for valuation purposes.Second, the research also contributes to the earnings managementliterature.We provide evidence that is consistent with the scenario thatearnings management through related party sales is perceived as anopportunistic behavior in the Chinese stock markets.
Our empirical evidence also provides implications for Chineseaccounting standard setter and other standard setters worldwide,who are concerned with related party transaction reporting, and theirimpact on firm value. For example, the events of Enron, Hollinger, andAdelphia suggest that we should also pay more attention to relatedparty transactions in the North American stock markets. Our evidencesuggests that increased disclosure requirements as well as a fair valuemeasurement standard for related party transactions, as adopted inChina, could prove useful.
The remainder of this paper is organized as follows. Section 2introduces the related party transaction accounting standards
adopted in China. The hypotheses are developed in Section 3. Section4 describes the sampling process and the research model. Section 5presents the results. Additional tests are summarized in Section 6. Weconclude this study in Section 7 with closing remarks for futureresearch.
2. Institutional background
Chinese mainland securities markets consist of the Shanghai StockExchange (SSE) and the Shenzhen Stock Exchange (SZSE), whichcommenced operations in December 1990. The Chinese SecuritiesRegulatory Committee (CSRC), an institution equivalent to theSecurities and Exchange Commission (SEC) in the U.S., was set up inthe following year to monitor and regulate Chinese stock markets.With the development of stock markets and the transformation of itseconomy, the Chinese government also initiated an accountingstandard reform in the early 1990s. The Ministry of Finance (MOF)is empowered to set Chinese accounting standards.
In 1997, the MOF promulgated its first detailed accountingstandard on related party transactions: Disclosure of Related PartyRelationships and Transactions (labeled as “1997 RPT DisclosureStandard” hereafter). As CSRC requires listed firms to preparefinancial reports in accordance with existing accounting standards,this standard applies to all publicly traded firms.
The “1997 RPT Disclosure Standard” defines the following agentsas related parties (Ministry of Finance People’s Republic of China,1997):
1. Two (ormore) companieswhere one directly or indirectly controls,or is controlled by the other, and two (or more) companies that areunder common control with a company;
2. Joint ventures;3. Associated companies;4. Major investment individuals, key managers or their close family
members;5. Other companies that are directly controlled by major investment
individuals, key managers or their close family members.5
A related party transaction is defined by the MOF as an eventwhere a resource or an obligation of an entity is transferred betweenrelated parties, whether or not a monetary consideration has beenreceived. This standard provides the following examples of relatedparty transactions: (1) purchase or sales of goods; (2) purchase orsales of assets other than goods; (3) provision or acceptation ofservice; (4) agency; (5) leasing; (6) provision of capitals (includingloans or equity capitals in forms of cash or physical assets); (7)guarantee and mortgage; (8) management contract; (9) transfer ofresearch and development projects; (10) license agreement; and (11)compensation of key managers.
The regulator did not perceive that the “1997 RPT DisclosureStandard”was a sufficient tool to eliminate the earnings managementbehavior of listed companies. At the end of 2001, the MOF issued aregulation about the accounting measurement of related partytransactions: Provisional Regulation on the Accounting for Sales of
136 W. Ge et al. / Advances in Accounting, incorporating Advances in International Accounting 26 (2010) 134–141
Assets and Other Transactions between Related Parties (“2001 RPTMeasurement Regulation”). The motivation for this regulation isexplicitly stated within the regulation:
In recent years, some listed firms utilize obviously unfairtransactions with related parties to manipulate earnings. Thisviolates fundamental accounting principles and is seriouslyagainst the “Three-Gong” principles of capital markets (MOF, CaiKuai [2001] No. 64).6
The “2001 RPT Measurement Regulation” imposes accountingrules for the following transactions: sales of assets (goods and otherassets), transfer of liabilities and costs, the act of entrusting or beingentrusted with operations of a related entity, and charges on inter-company financing through corporate credit, loans or equity. Accord-ing to this regulation, if there is no authentic evidence to show thatthe transaction value is fair, the difference in price above the fair valuecannot be recognized as current earnings. Instead, it should becredited to a “Capital Surplus-Price Differential of Related Transac-tions” account, which cannot be used to increase capital or offsetfuture losses. The determination of what constitutes a fair price is afunction of the type of transaction examined.7 In summary, theessence of this regulation is to reduce the probability of inflatedearnings by way of related party transactions.
In this paper, we concentrate our tests on the related partytransactions with a direct impact on earnings, such as the sales ofgoods and the sales of assets, as the MOF regulation was mainlyjustified on earnings management potential associated with relatedparty transactions.8 Related sales is also reported as one of the mostfrequently occurring related party transaction (Jian & Wong, 2006).
3. Hypothesis development
Prior research documents that financial statements in the Chinesemarkets contain value relevant information. For example, Bao andChow (1999) show that reported earnings and book values aresignificantly associated with share prices for sample firms issuingshares to foreigners. They also show that the combined explanatorypower of earnings and book values has increased over time. Haw, Qi,and Wu (1999) document a significant association between stockreturns and changes in earnings in both long-window and short-window studies. By using both return specifications and pricespecifications, Chen, Chen, and Su (2001) provide evidence thataccounting information, including earnings and book value, is valuerelevant in the Chinese markets. Overall, the empirical evidence fromprior research suggests that earnings and book values are valuerelevant to investors in the Chinese markets.9 However, the reliabilityof financial reporting and audit quality in this young market havebeen questioned (Aharony, Lee, & Wong, 2000; DeFond, Wong, & Li,
6 “San Gong” in Chinese Mandarin. It refers to “Gong Kai”, “Gong Ping” and “GongZheng”. The corresponding translations in the English version of Securities Lawsprovided by CSRC are: “openness”, “fairness” and “equitability”.
7 For example, when the sales of goods to non-related parties in the current periodis more than 20% of total sales, the weighted average price with non-related partieswill be determined as the fair price of related party sales; when the sales of goods tonon-related parties in the current period is less than 20% of total sales, if thetransaction price with related parties is above 120% of the book value of the soldgoods, the difference should be credited to “Capital Surplus” account.
8 Other transactions covered in the “2001 RPT Measurement Regulation” also giverise to income effects, but they are used by very few sample firms.
9 All these value relevance studies rely on the central assumption that the Chinesestock markets are efficient. Prior research shows that the Chinese stock markets werenot strongly efficient in the early 1990's. Still, they have become much more efficientover time (e.g., Li, 2003a,b; Ma & Barnes, 2001). Based on this research evidence, weassume that Chinese stock markets were fairly and consistently efficient over ourstudy sample period (1997 to 2003).
2000; Xiao, Zhang, & Xie, 2000), and investors are worried that thesenumbers may be subject to manipulation by managers.
In certain situations, earnings management may be a way ofconveying private information, held by managers, to investors.Consistent with this explanation, Subramanyam (1996) documentsthat discretionary accruals are priced by the North American markets,suggesting that managerial discretion improves the ability of earningsto reflect fundamental values. However, earnings management mayalso provide evidence of opportunistic behavior. For example, in theChinesemarkets, Aharony et al. (2000) examine the pre- and post-IPOearnings patterns of 83 Chinese state-owned enterprises that issuedshares to foreign investors during the 1992–1995 period. They findthat post-IPO earnings significantly decline for firms from unprotect-ed industries.10 Chen and Yuan (2004) document that Chinese firmsthat gained rights issue approval through excess non-operatingincome subsequently underperform other firms that did not use thesame practice to gain the same rights.
As evidenced by the “2001 RPTMeasurement Regulation”, theMOFwas concerned that some listed companies may have used relatedparty sales tomanage earnings. The financial press was also suspiciousthat listed firms used related party sales to inflate earnings in order toget rights issue approval (e.g., Huang, 2003; Zheng & Yao, 2004).Examining a sample of Chinese listed firms, Jian and Wong (2006)report that firms use related sales to meet securities regulators'earnings targets for share issuance and maintaining listing status, andthat the propping is significantly associated with opportunisticincentives. Chang (2002), examining group-affiliated companies inKorea, finds that these firms use related party sales to inflate earnings.Prior research that examines related party transactions in the U.S.setting also suggest that related party transactions are associated withearnings management (Gordon & Henry, 2005), though the existenceof related party transactions does not indicate there is fraudulentfinancial reporting (Henry, Gordon, Reed, & Louwers, 2007).
In addition to the sales of goods, the sales of assets could also beused to manage earnings. Herrmann, Inoue, and Thomas (2003)provide evidence that Japanese companies manage earnings throughasset sales. Similarly, Chen and Yuan (2004) document that Chineselisted firms are likely to use non-operating income to inflate totalearnings. As the MOF specifically mentions that related party assetsales is also one of the concerns that prompt the imposition of “2001RPT Measurement Regulation”, investors have likely cast doubts onwhether this type of asset sales transactions are employed by Chinesecompanies to manipulate earnings.
The signal jamming theory of myopia (Stein, 1989) assumes thatthe stock market efficiently uses current earnings to forecast futureearnings and the manager has incentives to boost current earnings atthe expense of future earnings. When the investors anticipate somemanipulation, in equilibrium, the manager boosts current earningswhich distort the firm value, but the market accounts for thedistortion and discounts the inflated current earnings. The inflatedcontemporary earnings of firms engaging in related party transactionsare biased signals of their current performances and are biasedproxies of their future earnings, if related party sales are opportunisticearnings management vehicles. Following Stein's argument, andassuming that market participants are aware of the potential forearnings management through related party transactions, we predictthat, on average, the earnings parameter of firms having related partysales should be lower than that of firms not involving related partysales transactions. This reflects the rational discounting of theseearnings by the market.
To the extent that the “2001 RPT Measurement Regulation” is aneffective tool to curtail earnings manipulation through the sales of
10 In Aharony et al. (2000)'s study, the protected industries include petrochemicals,energy, and raw materials, while all other industries are considered unprotectedindustries.
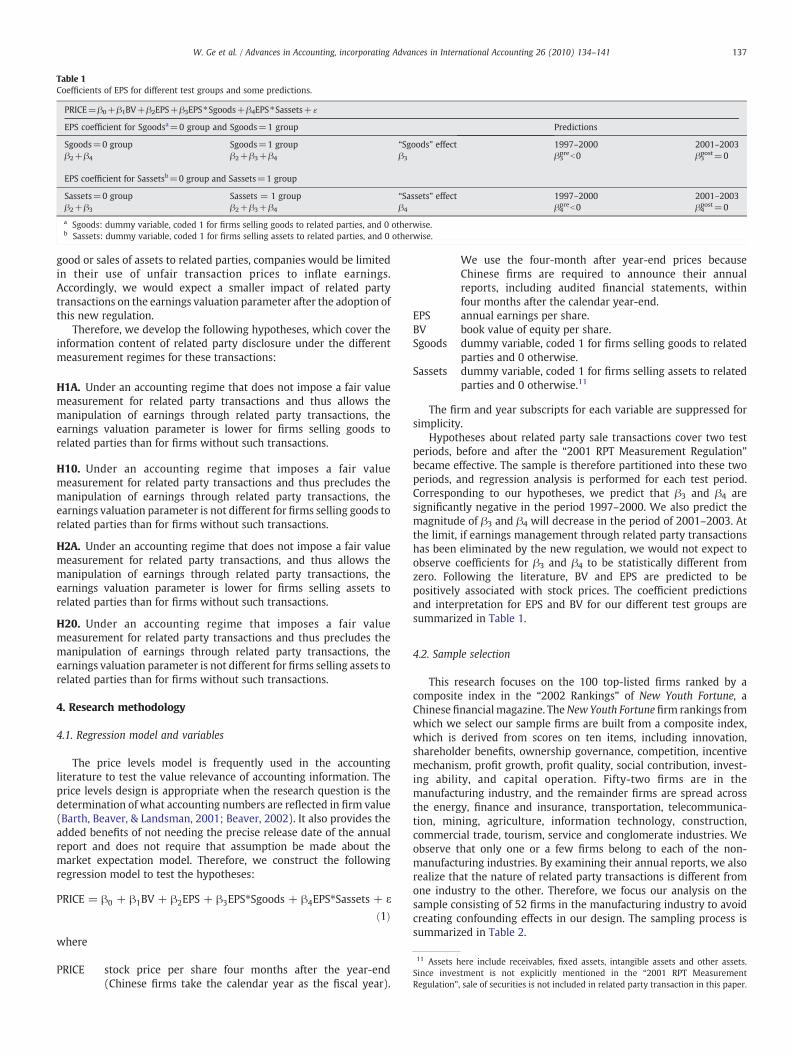
Table 1Coefficients of EPS for different test groups and some predictions.
PRICE=β0+β1BV+β2EPS+β3EPS⁎Sgoods+β4EPS⁎Sassets+ɛ
EPS coefficient for Sgoodsa=0 group and Sgoods=1 group Predictions
Sgoods=0 group Sgoods=1 group “Sgoods” effect 1997–2000 2001–2003β2+β4 β2+β3+β4 β3 β3
preb0 β3post=0
EPS coefficient for Sassetsb=0 group and Sassets=1 group
Sassets=0 group Sassets = 1 group “Sassets” effect 1997–2000 2001–2003β2+β3 β2+β3+β4 β4 β4
preb0 β4post=0
a Sgoods: dummy variable, coded 1 for firms selling goods to related parties, and 0 otherwise.b Sassets: dummy variable, coded 1 for firms selling assets to related parties, and 0 otherwise.
11 Assets here include receivables, fixed assets, intangible assets and other assets.Since investment is not explicitly mentioned in the “2001 RPT MeasurementRegulation”, sale of securities is not included in related party transaction in this paper.
137W. Ge et al. / Advances in Accounting, incorporating Advances in International Accounting 26 (2010) 134–141
good or sales of assets to related parties, companies would be limitedin their use of unfair transaction prices to inflate earnings.Accordingly, we would expect a smaller impact of related partytransactions on the earnings valuation parameter after the adoption ofthis new regulation.
Therefore, we develop the following hypotheses, which cover theinformation content of related party disclosure under the differentmeasurement regimes for these transactions:
H1A. Under an accounting regime that does not impose a fair valuemeasurement for related party transactions and thus allows themanipulation of earnings through related party transactions, theearnings valuation parameter is lower for firms selling goods torelated parties than for firms without such transactions.
H10. Under an accounting regime that imposes a fair valuemeasurement for related party transactions and thus precludes themanipulation of earnings through related party transactions, theearnings valuation parameter is not different for firms selling goods torelated parties than for firms without such transactions.
H2A. Under an accounting regime that does not impose a fair valuemeasurement for related party transactions, and thus allows themanipulation of earnings through related party transactions, theearnings valuation parameter is lower for firms selling assets torelated parties than for firms without such transactions.
H20. Under an accounting regime that imposes a fair valuemeasurement for related party transactions and thus precludes themanipulation of earnings through related party transactions, theearnings valuation parameter is not different for firms selling assets torelated parties than for firms without such transactions.
4. Research methodology
4.1. Regression model and variables
The price levels model is frequently used in the accountingliterature to test the value relevance of accounting information. Theprice levels design is appropriate when the research question is thedetermination of what accounting numbers are reflected in firm value(Barth, Beaver, & Landsman, 2001; Beaver, 2002). It also provides theadded benefits of not needing the precise release date of the annualreport and does not require that assumption be made about themarket expectation model. Therefore, we construct the followingregression model to test the hypotheses:
PRICE = β0 + β1BV + β2EPS + β3EPS⁎Sgoods + β4EPS⁎Sassets + ε
ð1Þ
where
PRICE stock price per share four months after the year-end(Chinese firms take the calendar year as the fiscal year).
We use the four-month after year-end prices becauseChinese firms are required to announce their annualreports, including audited financial statements, withinfour months after the calendar year-end.
EPS annual earnings per share.BV book value of equity per share.Sgoods dummy variable, coded 1 for firms selling goods to related
parties and 0 otherwise.Sassets dummy variable, coded 1 for firms selling assets to related
parties and 0 otherwise.11
The firm and year subscripts for each variable are suppressed forsimplicity.
Hypotheses about related party sale transactions cover two testperiods, before and after the “2001 RPT Measurement Regulation”became effective. The sample is therefore partitioned into these twoperiods, and regression analysis is performed for each test period.Corresponding to our hypotheses, we predict that β3 and β4 aresignificantly negative in the period 1997–2000. We also predict themagnitude of β3 and β4 will decrease in the period of 2001–2003. Atthe limit, if earnings management through related party transactionshas been eliminated by the new regulation, we would not expect toobserve coefficients for β3 and β4 to be statistically different fromzero. Following the literature, BV and EPS are predicted to bepositively associated with stock prices. The coefficient predictionsand interpretation for EPS and BV for our different test groups aresummarized in Table 1.
4.2. Sample selection
This research focuses on the 100 top-listed firms ranked by acomposite index in the “2002 Rankings” of New Youth Fortune, aChinese financialmagazine. TheNew Youth Fortune firm rankings fromwhich we select our sample firms are built from a composite index,which is derived from scores on ten items, including innovation,shareholder benefits, ownership governance, competition, incentivemechanism, profit growth, profit quality, social contribution, invest-ing ability, and capital operation. Fifty-two firms are in themanufacturing industry, and the remainder firms are spread acrossthe energy, finance and insurance, transportation, telecommunica-tion, mining, agriculture, information technology, construction,commercial trade, tourism, service and conglomerate industries. Weobserve that only one or a few firms belong to each of the non-manufacturing industries. By examining their annual reports, we alsorealize that the nature of related party transactions is different fromone industry to the other. Therefore, we focus our analysis on thesample consisting of 52 firms in the manufacturing industry to avoidcreating confounding effects in our design. The sampling process issummarized in Table 2.
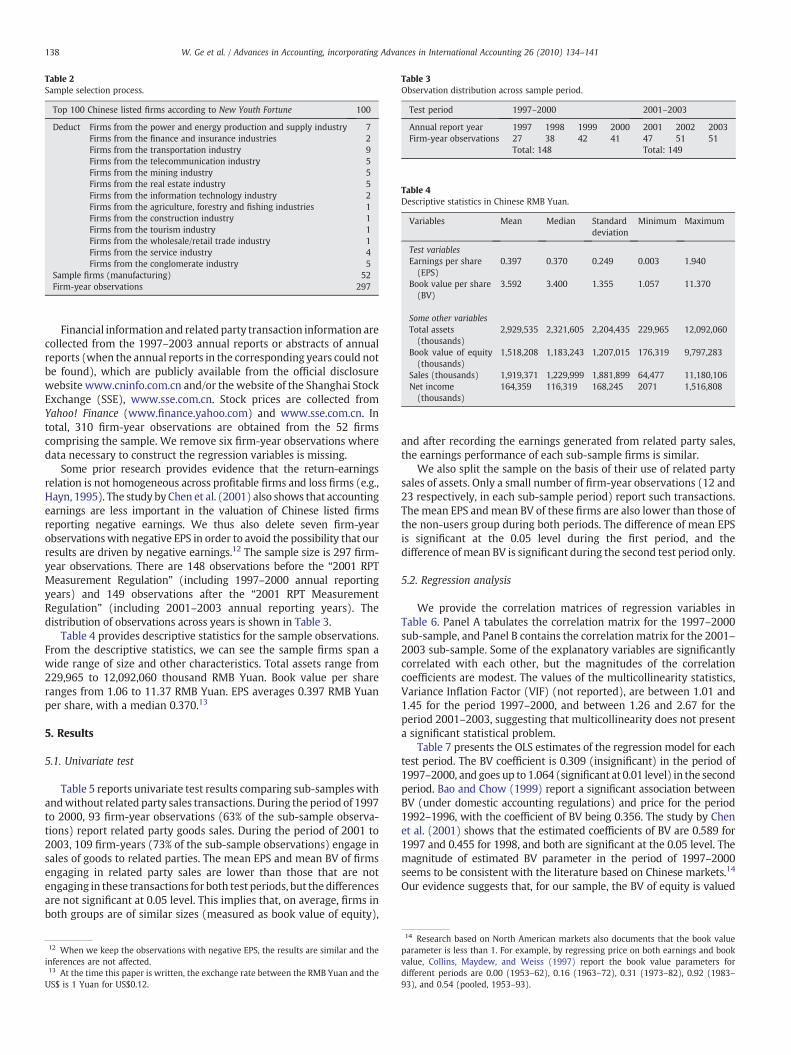
Table 2Sample selection process.
Top 100 Chinese listed firms according to New Youth Fortune 100
Deduct Firms from the power and energy production and supply industry 7Firms from the finance and insurance industries 2Firms from the transportation industry 9Firms from the telecommunication industry 5Firms from the mining industry 5Firms from the real estate industry 5Firms from the information technology industry 2Firms from the agriculture, forestry and fishing industries 1Firms from the construction industry 1Firms from the tourism industry 1Firms from the wholesale/retail trade industry 1Firms from the service industry 4Firms from the conglomerate industry 5
Sample firms (manufacturing) 52Firm-year observations 297
Table 3Observation distribution across sample period.
Test period 1997–2000 2001–2003
Annual report year 1997 1998 1999 2000 2001 2002 2003Firm-year observations 27 38 42 41 47 51 51
Total: 148 Total: 149
Table 4Descriptive statistics in Chinese RMB Yuan.
Variables Mean Median Standarddeviation
Minimum Maximum
Test variablesEarnings per share(EPS)
0.397 0.370 0.249 0.003 1.940
Book value per share(BV)
3.592 3.400 1.355 1.057 11.370
Some other variablesTotal assets(thousands)
2,929,535 2,321,605 2,204,435 229,965 12,092,060
Book value of equity(thousands)
1,518,208 1,183,243 1,207,015 176,319 9,797,283
Sales (thousands) 1,919,371 1,229,999 1,881,899 64,477 11,180,106Net income(thousands)
164,359 116,319 168,245 2071 1,516,808
138 W. Ge et al. / Advances in Accounting, incorporating Advances in International Accounting 26 (2010) 134–141
Financial information and related party transaction information arecollected from the 1997–2003 annual reports or abstracts of annualreports (when the annual reports in the corresponding years could notbe found), which are publicly available from the official disclosurewebsite www.cninfo.com.cn and/or the website of the Shanghai StockExchange (SSE), www.sse.com.cn. Stock prices are collected fromYahoo! Finance (www.finance.yahoo.com) and www.sse.com.cn. Intotal, 310 firm-year observations are obtained from the 52 firmscomprising the sample. We remove six firm-year observations wheredata necessary to construct the regression variables is missing.
Some prior research provides evidence that the return-earningsrelation is not homogeneous across profitable firms and loss firms (e.g.,Hayn, 1995). The study by Chen et al. (2001) also shows that accountingearnings are less important in the valuation of Chinese listed firmsreporting negative earnings. We thus also delete seven firm-yearobservationswith negative EPS in order to avoid the possibility that ourresults are driven by negative earnings.12 The sample size is 297 firm-year observations. There are 148 observations before the “2001 RPTMeasurement Regulation” (including 1997–2000 annual reportingyears) and 149 observations after the “2001 RPT MeasurementRegulation” (including 2001–2003 annual reporting years). Thedistribution of observations across years is shown in Table 3.
Table 4 provides descriptive statistics for the sample observations.From the descriptive statistics, we can see the sample firms span awide range of size and other characteristics. Total assets range from229,965 to 12,092,060 thousand RMB Yuan. Book value per shareranges from 1.06 to 11.37 RMB Yuan. EPS averages 0.397 RMB Yuanper share, with a median 0.370.13
5. Results
5.1. Univariate test
Table 5 reports univariate test results comparing sub-samples withandwithout related party sales transactions. During the period of 1997to 2000, 93 firm-year observations (63% of the sub-sample observa-tions) report related party goods sales. During the period of 2001 to2003, 109 firm-years (73% of the sub-sample observations) engage insales of goods to related parties. The mean EPS and mean BV of firmsengaging in related party sales are lower than those that are notengaging in these transactions for both test periods, but the differencesare not significant at 0.05 level. This implies that, on average, firms inboth groups are of similar sizes (measured as book value of equity),
12 When we keep the observations with negative EPS, the results are similar and theinferences are not affected.13 At the time this paper is written, the exchange rate between the RMB Yuan and theUS$ is 1 Yuan for US$0.12.
and after recording the earnings generated from related party sales,the earnings performance of each sub-sample firms is similar.
We also split the sample on the basis of their use of related partysales of assets. Only a small number of firm-year observations (12 and23 respectively, in each sub-sample period) report such transactions.The mean EPS and mean BV of these firms are also lower than those ofthe non-users group during both periods. The difference of mean EPSis significant at the 0.05 level during the first period, and thedifference of mean BV is significant during the second test period only.
5.2. Regression analysis
We provide the correlation matrices of regression variables inTable 6. Panel A tabulates the correlation matrix for the 1997–2000sub-sample, and Panel B contains the correlationmatrix for the 2001–2003 sub-sample. Some of the explanatory variables are significantlycorrelated with each other, but the magnitudes of the correlationcoefficients are modest. The values of the multicollinearity statistics,Variance Inflation Factor (VIF) (not reported), are between 1.01 and1.45 for the period 1997–2000, and between 1.26 and 2.67 for theperiod 2001–2003, suggesting that multicollinearity does not presenta significant statistical problem.
Table 7 presents the OLS estimates of the regression model for eachtest period. The BV coefficient is 0.309 (insignificant) in the period of1997–2000, and goes up to 1.064 (significant at 0.01 level) in the secondperiod. Bao and Chow (1999) report a significant association betweenBV (under domestic accounting regulations) and price for the period1992–1996, with the coefficient of BV being 0.356. The study by Chenet al. (2001) shows that the estimated coefficients of BV are 0.589 for1997 and 0.455 for 1998, and both are significant at the 0.05 level. Themagnitude of estimated BV parameter in the period of 1997–2000seems to be consistent with the literature based on Chinese markets.14
Our evidence suggests that, for our sample, the BV of equity is valued
14 Research based on North American markets also documents that the book valueparameter is less than 1. For example, by regressing price on both earnings and bookvalue, Collins, Maydew, and Weiss (1997) report the book value parameters fordifferent periods are 0.00 (1953–62), 0.16 (1963–72), 0.31 (1973–82), 0.92 (1983–93), and 0.54 (pooled, 1953–93).
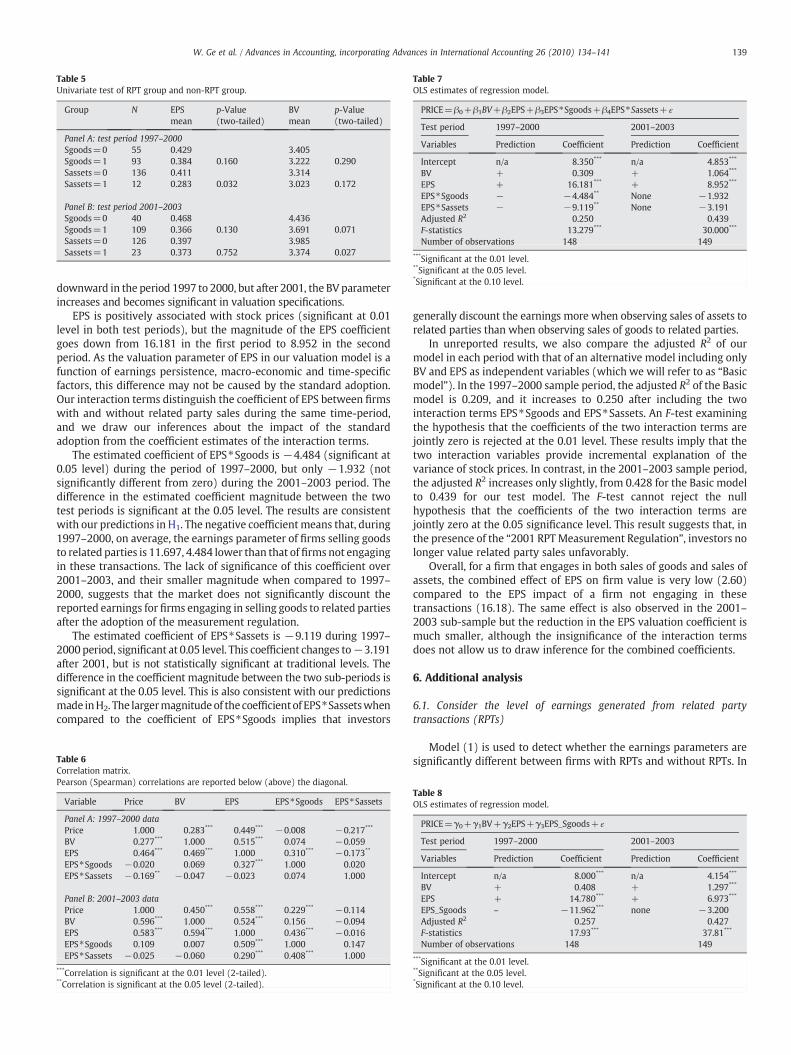
Table 7OLS estimates of regression model.
PRICE=β0+β1BV+β2EPS+β3EPS⁎Sgoods+β4EPS⁎Sassets+ɛ
Test period 1997–2000 2001–2003
Variables Prediction Coefficient Prediction Coefficient
Intercept n/a 8.350*** n/a 4.853***
BV + 0.309 + 1.064***
EPS + 16.181*** + 8.952***
EPS⁎Sgoods − −4.484** None −1.932EPS⁎Sassets − −9.119** None −3.191Adjusted R2 0.250 0.439F-statistics 13.279*** 30.000***
Number of observations 148 149
***Significant at the 0.01 level.**Significant at the 0.05 level.*Significant at the 0.10 level.
Table 5Univariate test of RPT group and non-RPT group.
Group N EPSmean
p-Value(two-tailed)
BVmean
p-Value(two-tailed)
Panel A: test period 1997–2000Sgoods=0 55 0.429 3.405Sgoods=1 93 0.384 0.160 3.222 0.290Sassets=0 136 0.411 3.314Sassets=1 12 0.283 0.032 3.023 0.172
Panel B: test period 2001–2003Sgoods=0 40 0.468 4.436Sgoods=1 109 0.366 0.130 3.691 0.071Sassets=0 126 0.397 3.985Sassets=1 23 0.373 0.752 3.374 0.027
139W. Ge et al. / Advances in Accounting, incorporating Advances in International Accounting 26 (2010) 134–141
downward in the period 1997 to 2000, but after 2001, the BV parameterincreases and becomes significant in valuation specifications.
EPS is positively associated with stock prices (significant at 0.01level in both test periods), but the magnitude of the EPS coefficientgoes down from 16.181 in the first period to 8.952 in the secondperiod. As the valuation parameter of EPS in our valuation model is afunction of earnings persistence, macro-economic and time-specificfactors, this difference may not be caused by the standard adoption.Our interaction terms distinguish the coefficient of EPS between firmswith and without related party sales during the same time-period,and we draw our inferences about the impact of the standardadoption from the coefficient estimates of the interaction terms.
The estimated coefficient of EPS⁎Sgoods is −4.484 (significant at0.05 level) during the period of 1997–2000, but only −1.932 (notsignificantly different from zero) during the 2001–2003 period. Thedifference in the estimated coefficient magnitude between the twotest periods is significant at the 0.05 level. The results are consistentwith our predictions in H1. The negative coefficientmeans that, during1997–2000, on average, the earnings parameter of firms selling goodsto related parties is 11.697, 4.484 lower than that of firms not engagingin these transactions. The lack of significance of this coefficient over2001–2003, and their smaller magnitude when compared to 1997–2000, suggests that the market does not significantly discount thereported earnings for firms engaging in selling goods to related partiesafter the adoption of the measurement regulation.
The estimated coefficient of EPS⁎Sassets is −9.119 during 1997–2000 period, significant at 0.05 level. This coefficient changes to−3.191after 2001, but is not statistically significant at traditional levels. Thedifference in the coefficient magnitude between the two sub-periods issignificant at the 0.05 level. This is also consistent with our predictionsmade inH2. The largermagnitudeof the coefficientof EPS⁎Sassetswhencompared to the coefficient of EPS⁎Sgoods implies that investors
Table 6Correlation matrix.Pearson (Spearman) correlations are reported below (above) the diagonal.
Variable Price BV EPS EPS⁎Sgoods EPS⁎Sassets
Panel A: 1997–2000 dataPrice 1.000 0.283*** 0.449*** −0.008 −0.217***
BV 0.277*** 1.000 0.515*** 0.074 −0.059EPS 0.464*** 0.469*** 1.000 0.310*** −0.173**
EPS⁎Sgoods −0.020 0.069 0.327*** 1.000 0.020EPS⁎Sassets −0.169** −0.047 −0.023 0.074 1.000
Panel B: 2001–2003 dataPrice 1.000 0.450*** 0.558*** 0.229*** −0.114BV 0.596*** 1.000 0.524*** 0.156 −0.094EPS 0.583*** 0.594*** 1.000 0.436*** −0.016EPS⁎Sgoods 0.109 0.007 0.509*** 1.000 0.147EPS⁎Sassets −0.025 −0.060 0.290*** 0.408*** 1.000
***Correlation is significant at the 0.01 level (2-tailed).**Correlation is significant at the 0.05 level (2-tailed).
generally discount the earnings more when observing sales of assets torelated parties than when observing sales of goods to related parties.
In unreported results, we also compare the adjusted R2 of ourmodel in each period with that of an alternative model including onlyBV and EPS as independent variables (which we will refer to as “Basicmodel”). In the 1997–2000 sample period, the adjusted R2 of the Basicmodel is 0.209, and it increases to 0.250 after including the twointeraction terms EPS⁎Sgoods and EPS⁎Sassets. An F-test examiningthe hypothesis that the coefficients of the two interaction terms arejointly zero is rejected at the 0.01 level. These results imply that thetwo interaction variables provide incremental explanation of thevariance of stock prices. In contrast, in the 2001–2003 sample period,the adjusted R2 increases only slightly, from 0.428 for the Basic modelto 0.439 for our test model. The F-test cannot reject the nullhypothesis that the coefficients of the two interaction terms arejointly zero at the 0.05 significance level. This result suggests that, inthe presence of the “2001 RPTMeasurement Regulation”, investors nolonger value related party sales unfavorably.
Overall, for a firm that engages in both sales of goods and sales ofassets, the combined effect of EPS on firm value is very low (2.60)compared to the EPS impact of a firm not engaging in thesetransactions (16.18). The same effect is also observed in the 2001–2003 sub-sample but the reduction in the EPS valuation coefficient ismuch smaller, although the insignificance of the interaction termsdoes not allow us to draw inference for the combined coefficients.
6. Additional analysis
6.1. Consider the level of earnings generated from related partytransactions (RPTs)
Model (1) is used to detect whether the earnings parameters aresignificantly different between firms with RPTs and without RPTs. In
Table 8OLS estimates of regression model.
PRICE=γ0+γ1BV+γ2EPS+γ3EPS_Sgoods+ɛ
Test period 1997–2000 2001–2003
Variables Prediction Coefficient Prediction Coefficient
Intercept n/a 8.000*** n/a 4.154***
BV + 0.408 + 1.297***
EPS + 14.780*** + 6.973***
EPS_Sgoods – −11.962*** none −3.200Adjusted R2 0.257 0.427F-statistics 17.93*** 37.81***
Number of observations 148 149
***Significant at the 0.01 level.**Significant at the 0.05 level.*Significant at the 0.10 level.
15 When using regression model (2) for the panel data, the results are similar, but atdifferent significance level. To be specific, γ2̂ is 14.70 (with p-value of 0.0001) and γ3̂ is−8.94 (with p-value of 0.029) for the period 1997–2000. For the period of 2001–2003,γ2̂ is 5.11 (with p-value of 0.025) and γ3̂ is −2.60 (with p-value of 0.630).
140 W. Ge et al. / Advances in Accounting, incorporating Advances in International Accounting 26 (2010) 134–141
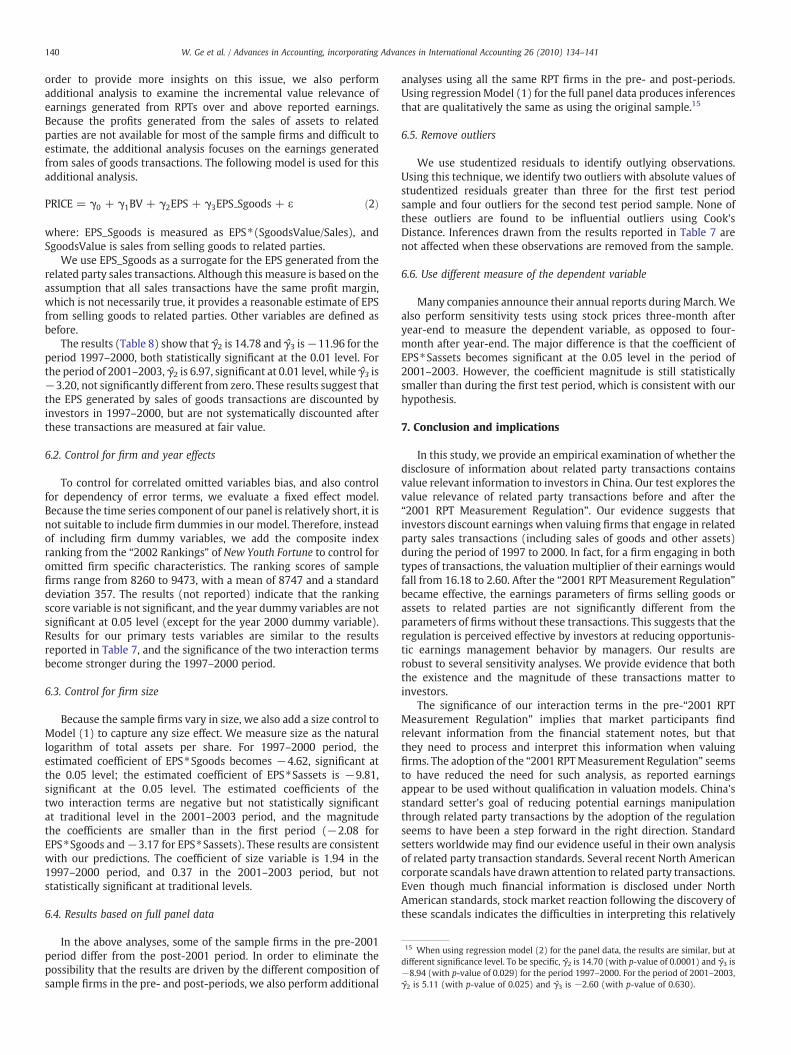
order to provide more insights on this issue, we also performadditional analysis to examine the incremental value relevance ofearnings generated from RPTs over and above reported earnings.Because the profits generated from the sales of assets to relatedparties are not available for most of the sample firms and difficult toestimate, the additional analysis focuses on the earnings generatedfrom sales of goods transactions. The following model is used for thisadditional analysis.
PRICE = γ0 + γ1BV + γ2EPS + γ3EPS Sgoods + ε ð2Þ
where: EPS_Sgoods is measured as EPS⁎(SgoodsValue/Sales), andSgoodsValue is sales from selling goods to related parties.
We use EPS_Sgoods as a surrogate for the EPS generated from therelated party sales transactions. Although this measure is based on theassumption that all sales transactions have the same profit margin,which is not necessarily true, it provides a reasonable estimate of EPSfrom selling goods to related parties. Other variables are defined asbefore.
The results (Table 8) show that γ2̂ is 14.78 and γ3̂ is−11.96 for theperiod 1997–2000, both statistically significant at the 0.01 level. Forthe period of 2001–2003, γ2̂ is 6.97, significant at 0.01 level, while γ3̂ is−3.20, not significantly different from zero. These results suggest thatthe EPS generated by sales of goods transactions are discounted byinvestors in 1997–2000, but are not systematically discounted afterthese transactions are measured at fair value.
6.2. Control for firm and year effects
To control for correlated omitted variables bias, and also controlfor dependency of error terms, we evaluate a fixed effect model.Because the time series component of our panel is relatively short, it isnot suitable to include firm dummies in our model. Therefore, insteadof including firm dummy variables, we add the composite indexranking from the “2002 Rankings” of New Youth Fortune to control foromitted firm specific characteristics. The ranking scores of samplefirms range from 8260 to 9473, with a mean of 8747 and a standarddeviation 357. The results (not reported) indicate that the rankingscore variable is not significant, and the year dummy variables are notsignificant at 0.05 level (except for the year 2000 dummy variable).Results for our primary tests variables are similar to the resultsreported in Table 7, and the significance of the two interaction termsbecome stronger during the 1997–2000 period.
6.3. Control for firm size
Because the sample firms vary in size, we also add a size control toModel (1) to capture any size effect. We measure size as the naturallogarithm of total assets per share. For 1997–2000 period, theestimated coefficient of EPS⁎Sgoods becomes −4.62, significant atthe 0.05 level; the estimated coefficient of EPS⁎Sassets is −9.81,significant at the 0.05 level. The estimated coefficients of thetwo interaction terms are negative but not statistically significantat traditional level in the 2001–2003 period, and the magnitudethe coefficients are smaller than in the first period (−2.08 forEPS⁎Sgoods and−3.17 for EPS⁎Sassets). These results are consistentwith our predictions. The coefficient of size variable is 1.94 in the1997–2000 period, and 0.37 in the 2001–2003 period, but notstatistically significant at traditional levels.
6.4. Results based on full panel data
In the above analyses, some of the sample firms in the pre-2001period differ from the post-2001 period. In order to eliminate thepossibility that the results are driven by the different composition ofsample firms in the pre- and post-periods, we also perform additional
analyses using all the same RPT firms in the pre- and post-periods.Using regressionModel (1) for the full panel data produces inferencesthat are qualitatively the same as using the original sample.15
6.5. Remove outliers
We use studentized residuals to identify outlying observations.Using this technique, we identify two outliers with absolute values ofstudentized residuals greater than three for the first test periodsample and four outliers for the second test period sample. None ofthese outliers are found to be influential outliers using Cook'sDistance. Inferences drawn from the results reported in Table 7 arenot affected when these observations are removed from the sample.
6.6. Use different measure of the dependent variable
Many companies announce their annual reports during March. Wealso perform sensitivity tests using stock prices three-month afteryear-end to measure the dependent variable, as opposed to four-month after year-end. The major difference is that the coefficient ofEPS⁎Sassets becomes significant at the 0.05 level in the period of2001–2003. However, the coefficient magnitude is still statisticallysmaller than during the first test period, which is consistent with ourhypothesis.
7. Conclusion and implications
In this study, we provide an empirical examination of whether thedisclosure of information about related party transactions containsvalue relevant information to investors in China. Our test explores thevalue relevance of related party transactions before and after the“2001 RPT Measurement Regulation”. Our evidence suggests thatinvestors discount earnings when valuing firms that engage in relatedparty sales transactions (including sales of goods and other assets)during the period of 1997 to 2000. In fact, for a firm engaging in bothtypes of transactions, the valuation multiplier of their earnings wouldfall from 16.18 to 2.60. After the “2001 RPT Measurement Regulation”became effective, the earnings parameters of firms selling goods orassets to related parties are not significantly different from theparameters of firms without these transactions. This suggests that theregulation is perceived effective by investors at reducing opportunis-tic earnings management behavior by managers. Our results arerobust to several sensitivity analyses. We provide evidence that boththe existence and the magnitude of these transactions matter toinvestors.
The significance of our interaction terms in the pre-“2001 RPTMeasurement Regulation” implies that market participants findrelevant information from the financial statement notes, but thatthey need to process and interpret this information when valuingfirms. The adoption of the “2001 RPTMeasurement Regulation” seemsto have reduced the need for such analysis, as reported earningsappear to be used without qualification in valuation models. China'sstandard setter's goal of reducing potential earnings manipulationthrough related party transactions by the adoption of the regulationseems to have been a step forward in the right direction. Standardsetters worldwide may find our evidence useful in their own analysisof related party transaction standards. Several recent North Americancorporate scandals have drawn attention to related party transactions.Even though much financial information is disclosed under NorthAmerican standards, stock market reaction following the discovery ofthese scandals indicates the difficulties in interpreting this relatively
141W. Ge et al. / Advances in Accounting, incorporating Advances in International Accounting 26 (2010) 134–141
obscure information. The emphasis of the existing North Americanstandards has been to let investors know about the existence ofrelated party transactions, a regulation similar to the regulation ineffect in China between 1997 and 2000. Yet, it remains doubtful thatinvestors have access to all relevant information to properly analyzethe impact of these transactions on reported earnings. Given therecent globalization movements and complexities attached tointernational transfer prices, the task may become even moredaunting. A direct fair value measurement standard as applied inChina may restore investors' confidence and reduce general concerns.Society may be better served if reported earnings can be directly used,without further analysis.
It should be noted that we do not cover all types of related partytransactions in our study. We only focus on the sales of goods and onthe sales of other assets. In practice, many Chinese listed firms alsohave other types of related party transactions, including the purchaseof goods or assets, the lease of tangible assets, related party loanguarantees, agency, managerial contracts, etc. As a supplementalanalysis, we also perform some tests on loan guarantees, which iswithout immediate direct income effects. The “2001 RPT Measure-ment Regulation” does not bring any modification to the accountingstandards pertaining to loan guarantees. We explore their impact byadding the existence of guarantee risk as an independent variable, oras an interaction term with either of BV and EPS, to our original testmodel. The coefficients of these variables are not statisticallysignificant at the 0.05 level in either test period. One possible reasonis that investors do not have access to information about theprobability that the loan guarantee will be exercised, and that theyrely on the auditor's opinion that this is unlikely when valuing firms.Still the effects of many related party transactions (some arerecognized and disclosed, some are not recognized but disclosed bylisted companies) remain to be explored. Future research couldextend this study by examining the usefulness of information aboutthese other related party transactions.
Subramanyam (1996) documents that the North Americanmarkets attach value to discretionary accruals. In further tests, theauthor suggests that this result is consistent with the explanation thatmanagerial discretion improves the ability of earnings to reflect firm'sfundamental value. In this paper, we do not attempt to distinguishopportunistic and efficient related party transactions. Further re-search in creating models to sort through these transactions would bebeneficial to our understanding of large, unconsolidated but relatedcorporate groups.
We recognize our sample size is relatively small. While this smallsample allows us to focus specifically on manufacturing firms toincrease the power of our tests, one limitation is that it confines thegeneralizability of the results. The external validity of our results needsto be validated by future research that performs empirical tests acrossindustries, and in mature stock markets. Altogether, the empiricalevidence from these investigations would provide useful informationfor regulation by accounting standard setters. Since related partytransactions exist worldwide, we also hope this paper can inspireresearch on related party transactions in mature stock markets.
Acknowledgements
We would like to thank Dan S. Dhaliwal, two anonymousreviewers, Sandy Hilton, Chunlin Mao, Tony Kang, Michel Magnan,
Lei Zhou, and seminar participants at the 2005 CAAA conference, 2005AAA annual meeting, 2006 IAS Midyear Meeting and McGillUniversity for their constructive comments on earlier drafts of thispaper. We thank Tian Yu for her able research assistance. Wenxia Geacknowledges funding support by the institute of Charted Accoun-tants of Manitoba.
References
Aharony, J., Lee, C. W. J., & Wong, T. J. (2000, Spring). Financial packaging of IPO firms inChina. Journal of Accounting Research, 38, 103−126.
Bao, B. H., & Chow, L. (1999). The usefulness of earnings and book value for equityvaluation in emerging capital markets: Evidence from listed companies in thePeople's Republic of China. Journal of International Financial Management andAccounting, 10(2), 85−104.
Barth, M. E., Beaver, W. H., & Landsman, W. R. (2001). The relevance of the valuerelevance literature for financial accounting standard setting: Another view. Journalof Accounting and Economics, 31, 77−104.
Beaver, W. H. (2002). Perspectives on recent capital market research. The AccountingReview, 77(2), 453−475.
Cao, Z. (2003). Definition, examination and the way to deal with related party transactionsbetween listed companies. (in Chinese). http://fzj.sz.gov.cn/tqfz/tq2003.2i.asp
Chang, S.J. 2002. Ownership structure, expropriation, and performance of group-affiliated companies in Korea. Working Paper: Korea University.
Chen, C. J. P., Chen, S., & Su, X. (2001). Is accounting information value-relevant in theemerging Chinese stock market? Journal of International Accounting, Auditing &Taxation, 10, 1−22.
Chen, K. C. W., & Yuan, H. (2004). Earnings management and capital resourceallocation: Evidence from China's accounting-based regulation of rights issues.Accounting Review, 79, 645−665.
Collins, D. W., Maydew, E. L., & Weiss, I. S. (1997). Changes in the value-relevance ofearnings and book values over the past forty years. Journal of Accounting Economics,24, 39−67.
DeFond, M. L., Wong, T. J., & Li, S. (2000). The impact of improved auditor independenceon audit market concentration in China. Journal of Accounting and Economics, 28,269−305.
Gordon, E. A. & Henry, E. 2005. Related party transactions and earnings management.Working Paper: Rutgers University and University of Miami.
Haw, I. M., Qi, D., & Wu, W. (1999). Value relevance of earnings in an emerging capitalmarket: The case of A-shares in China. Pacific Economic Review, 4, 337−347.
Hayn, C. (1995). The information content of losses. Journal of Accounting and Economics,20, 125−153.
Henry, E., Gordon, E. A., Reed, B., & Louwers, T. 2007. The role of related partytransactions in fraudulent financial reporting. Working Paper: University of Miami,Rutgers University, Southern Illinois University and James Madison University.
Herrmann, D., Inoue, T., & Thomas, W. B. (2003). The sale of assets to manage earningsin Japan. Journal of Accounting Research, 41(1), 89−108.
Huang, Z. (2003). From left hand to right hand,where is the benefit? Related party transactions:Good fortune? Misfortune? (in Chinese). http://finance.tom.com/1008/1089/2003820-18951.html
Jian, M., & Wong, T. J. (2006). Propping and tunneling through related partytransactions. Global Issues in Accounting Conference paper.
Li, X. M. (2003). China: further evidence on the evolution of stock markets in transitioneconomies. Scottish Journal of Political Economy, 50(3), 341−358.
Li, X. M. (2003). Time-varying informational efficiency in China's A-share and B-sharemarkets. Journal of Chinese Economic and Business Studies, 1(1), 33−56.
Ma, S., & Barnes, M. L. (2001). Are China's stock markets really weak-form efficient?Center for International Economics Studies Discussion paper 0119. University ofAdelaide.
Ministry of Finance People's Republic of China. 1997. Accounting standards for businessenterprises: disclosure of related party relationships and transactions. (in Chinese).
Ministry of Finance People's Republic of China. Cai Kuai [2001] No. 64. Provisionalregulation on the accounting for sales of assets and other transactions betweenrelated parties. (in Chinese).
Stein, J. C. (1989). Efficient capital markets, inefficient firms: A model of myopicbehavior. Quarterly Journal of Economics, 104(4), 655−669.
Subramanyam, K. R. (1996). The pricing of discretionary accruals. Journal of Accountingand Economics, 22, 249−281.
Xiao, J. Z., Zhang, Y., & Xie, Z. (2000). The making of independent auditing standards inChina. Accounting Horizons, 14(1), 68−89.
Zheng, W., & Yao, S. (2004). Regulating the management of related party transactionsbetween Chinese listed companies. (in Chinese). http://www.ectime.com.cn/cgi-bin/db2www.cgi/info.d2w/report?nbr=1119


![IEEE TRANSACTIONS ON NEURAL NETWORKS 1 Multiclass ...€¦ · original Relevance Vector Machine to the multi-class multi-kernel setting [6]. These algorithms achieve sparsity without](https://img.pdfslide.net/doc/110x75/5f0755f87e708231d41c7a37/ieee-transactions-on-neural-networks-1-multiclass-original-relevance-vector.jpg)