Embed Size (px)
Citation preview
Value Stream MappingA Laboratory Tool
Laurie Peterson-WrightColorado Department of Public
Health and EnvironmentLaboratory Services Division
What is VSM?
Follow a product’s production path from beginning to end.
A visual representation of every process in the material and information flow.
What VSM is not
• Time Management• Prioritization• Workspace Organization
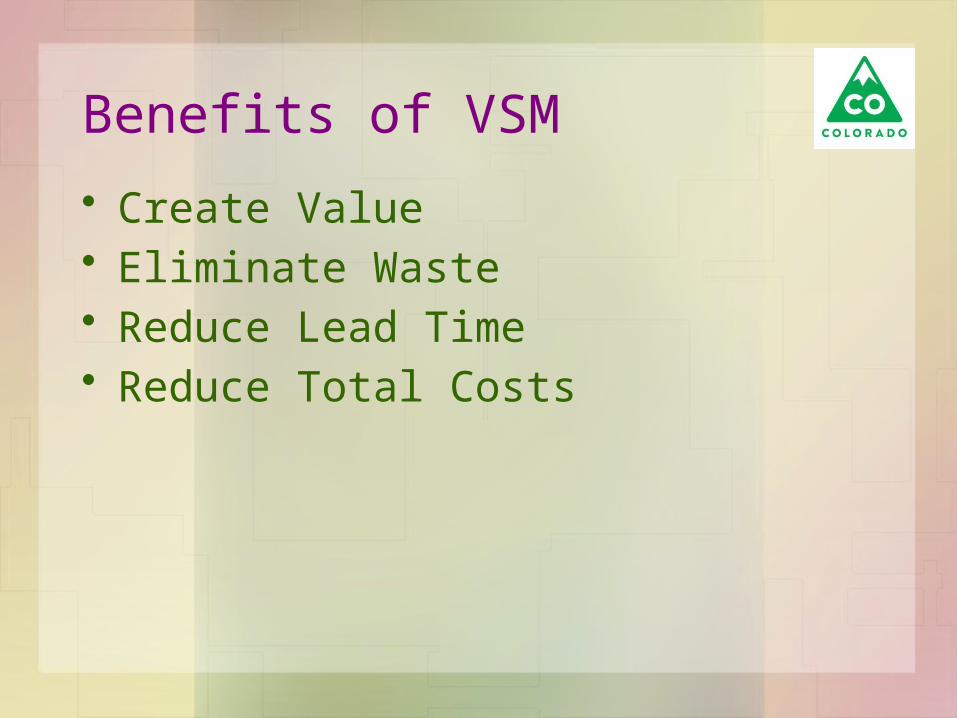
Benefits of VSM
• Create Value• Eliminate Waste• Reduce Lead Time• Reduce Total Costs
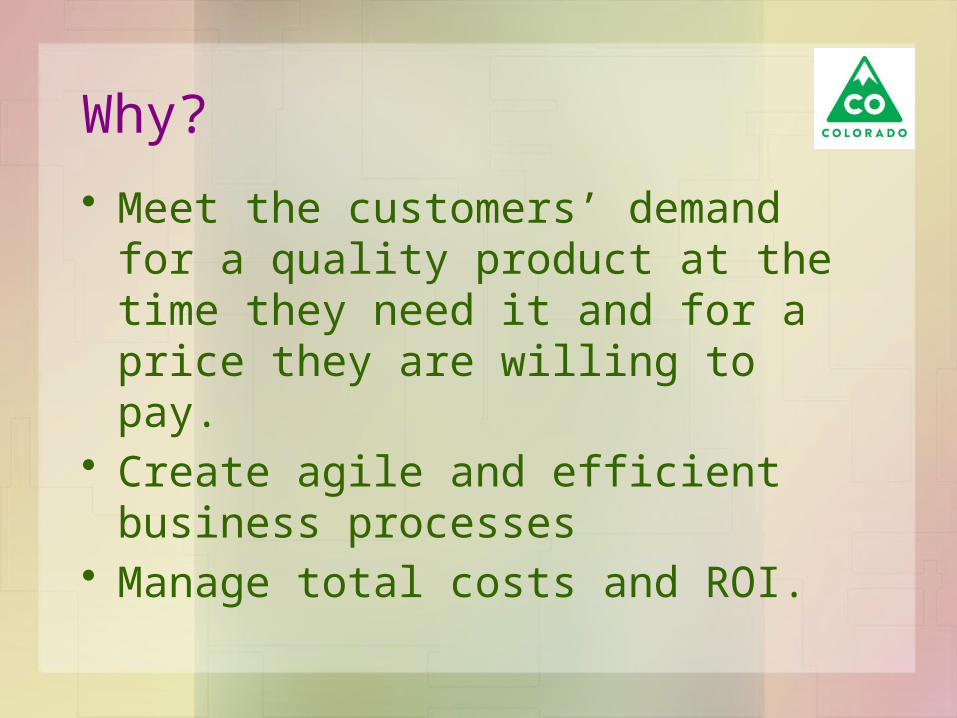
Why?
• Meet the customers’ demand for a quality product at the time they need it and for a price they are willing to pay.
• Create agile and efficient business processes
• Manage total costs and ROI.
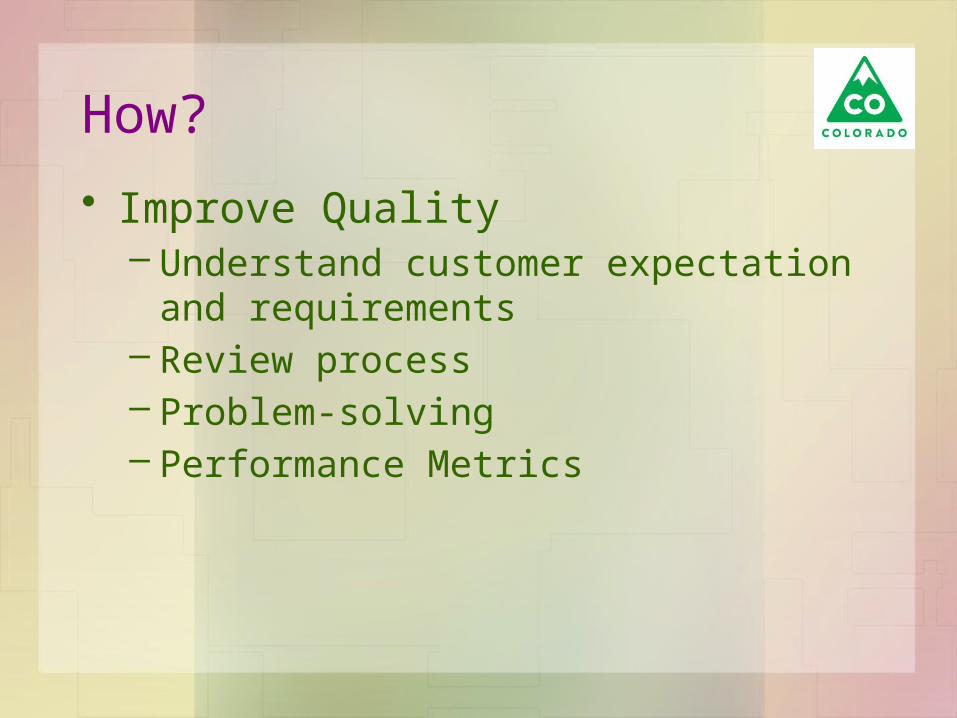
How?
• Improve Quality– Understand customer expectation and
requirements– Review process– Problem-solving– Performance Metrics
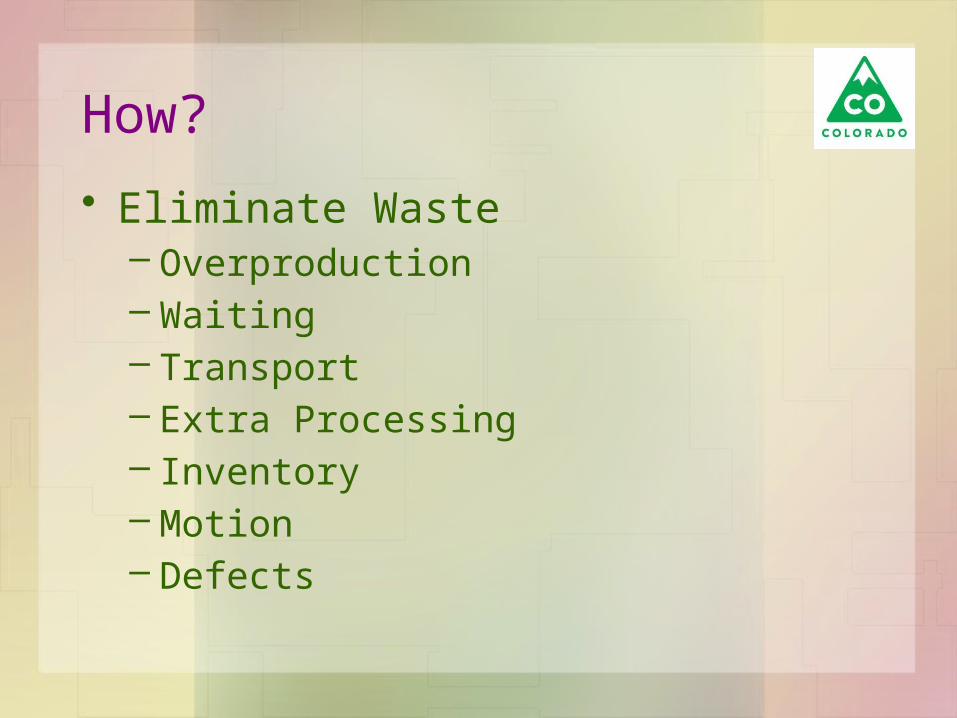
How?
• Eliminate Waste– Overproduction– Waiting– Transport– Extra Processing– Inventory– Motion– Defects
How?
• Reduce Lead Time– Cycle Time– Batch Delay– Process Delay
Current State
• Highlights the connections among activities and information
• Employees understand entire value stream not just a single function
• Improve the decision-making process• Easily identify areas of waste
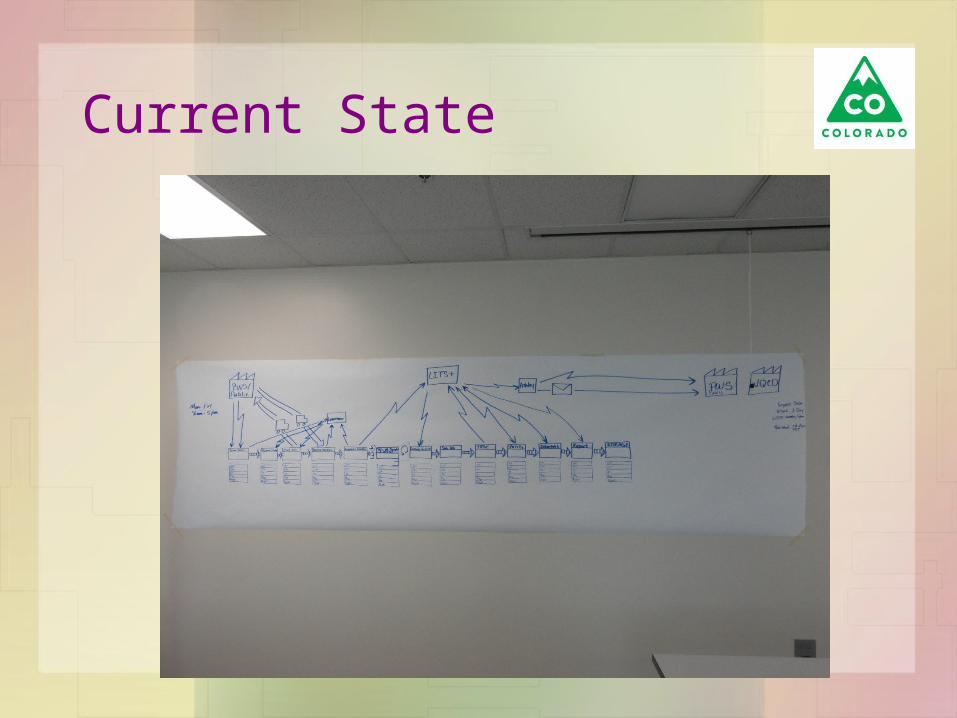
Current State
12 steps
• Order initiation• Order receipt• Sample kit preparation• Sample receipt• Accessioning• Temporary sample storage• Worklist generation
12 steps continued
• Sample preparation• Sample analysis• Data validation• Data interpretation• Reporting
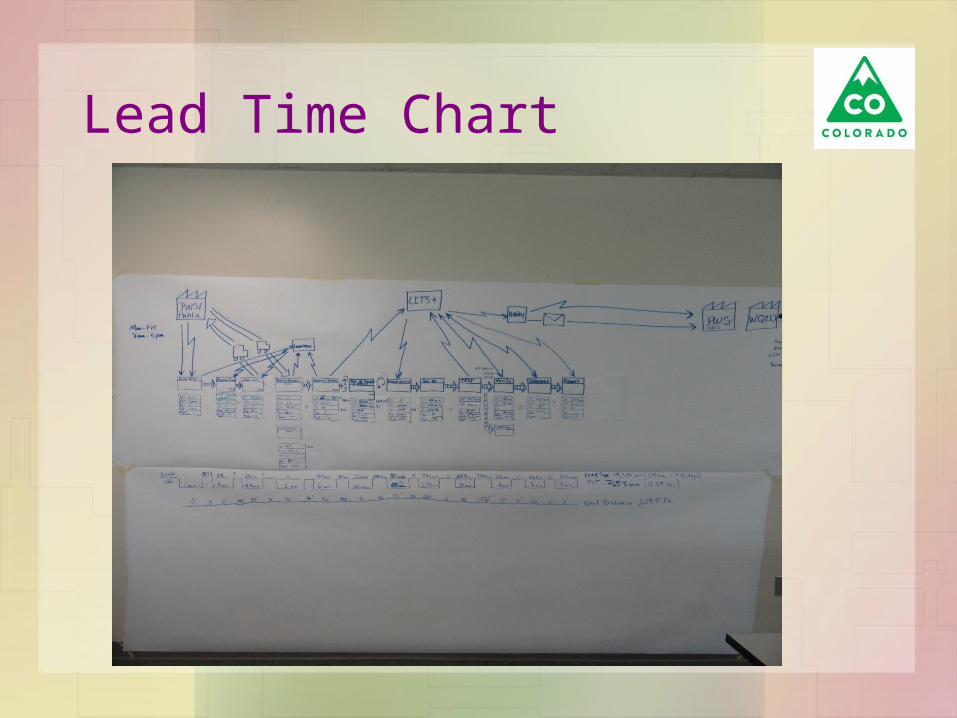
Lead Time Chart
Value
• Value added activities– Anything the customer is willing to pay for– Anything that changes the form fit or
function of the sample• Non-value added activities
– Defects– Excess processing
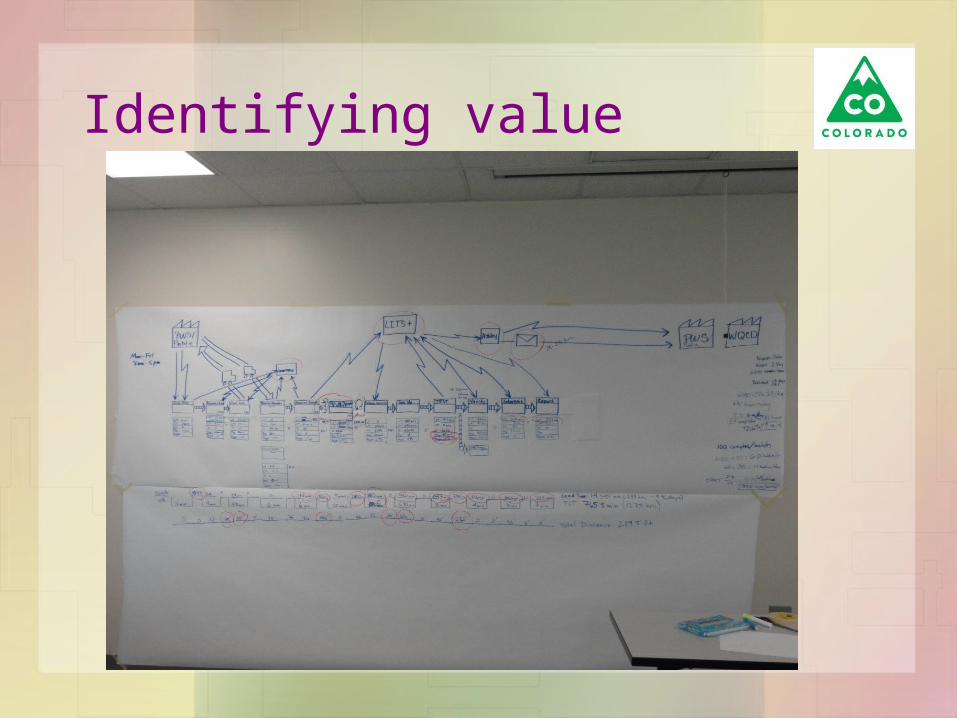
Identifying value
Analysis
• 239 hours spent on non-value added activities!
• Only 13 hours were value added!
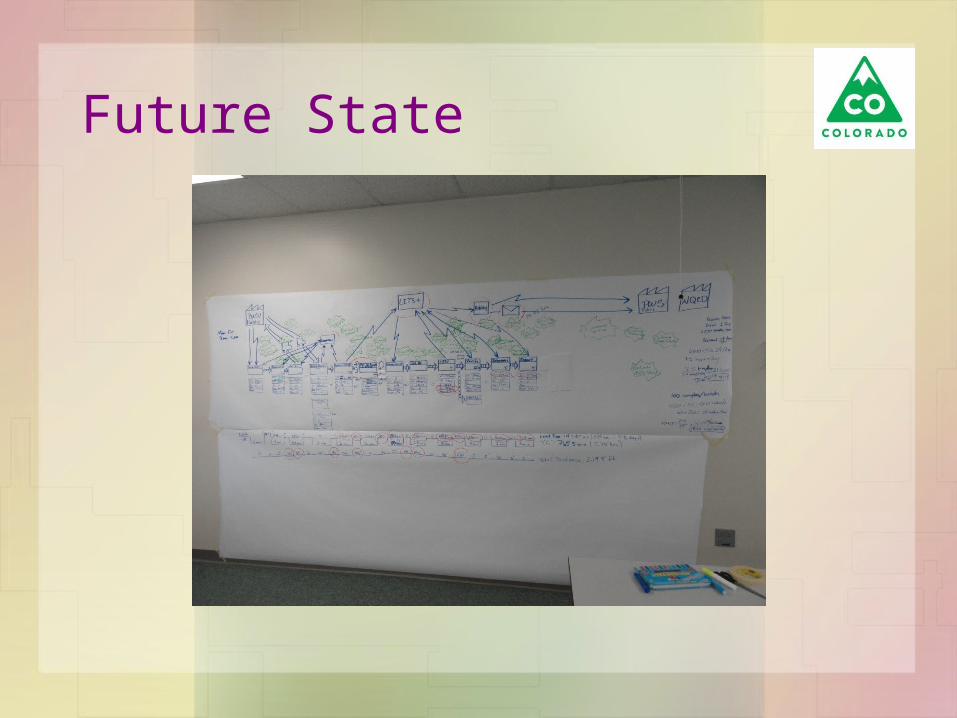
Future State
Analysis
• 36 opportunities for improvement• Prioritized based on implementation
time, customer centeredness, improved turnaround time, error reduction, efficiency, safety, work balance and cost.
Improvements
• Reducing analytical batch sizes and increasing the frequency of analyses
• Middleware to interface instrumentation with the LIMS
• Staggering shifts• Cross training analysts for reporting• Automation of manual analyses
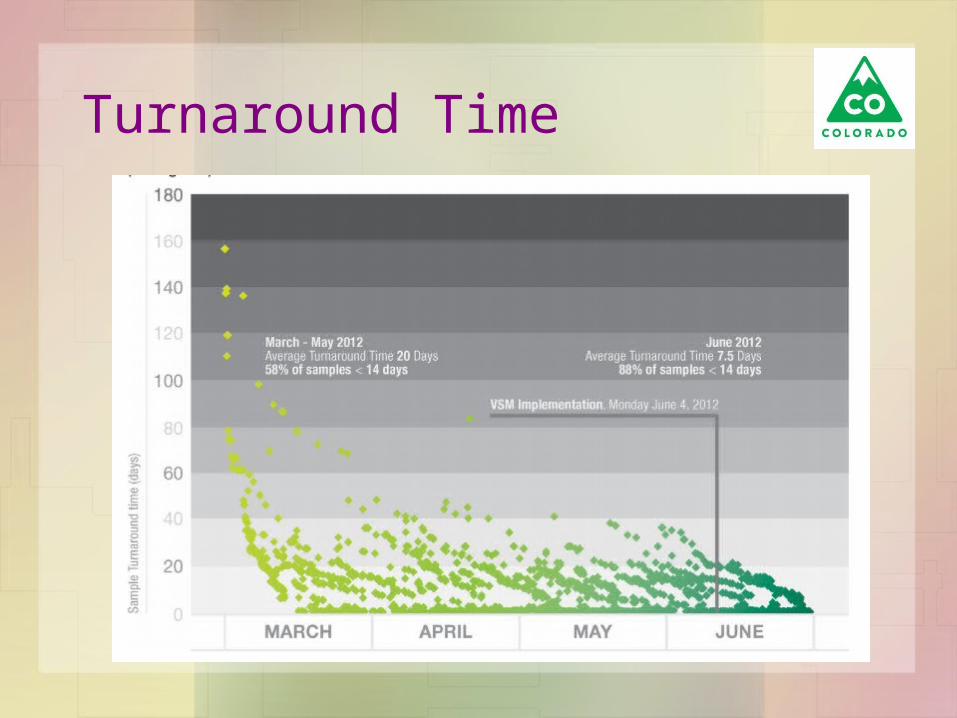
Turnaround Time
Conclusion
• Hard work (who wants to be non-value added?)
• Diminishing returns sometimes “better beats best”
• Strong management support• Willingness to change