Embed Size (px)
Citation preview
Value Stream Mapping in New Product Introduction – A
Case Study at Ericsson
VIKTOR HEDBERG
JENS LINDSTRÖM
Master of Science Thesis
Stockholm, Sweden 2011
Value Stream Mapping in New Product
Introduction – A Case Study at Ericsson MIC
Viktor Hedberg
Jens Lindström
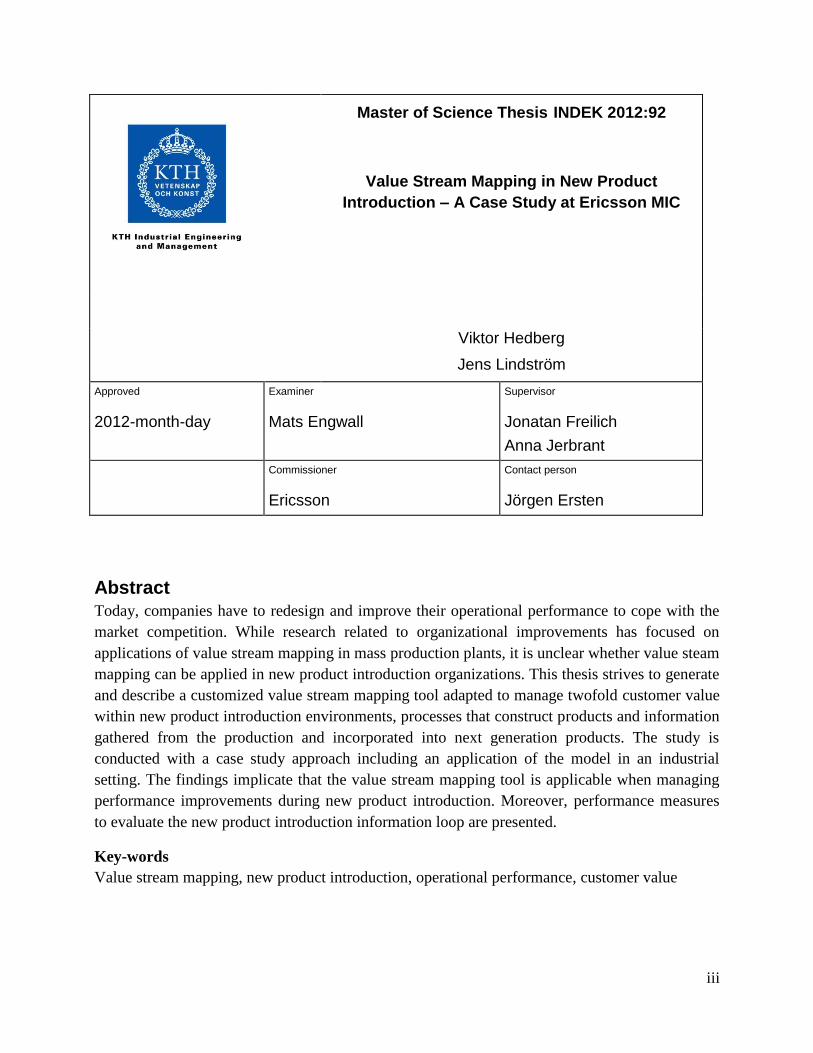
Master of Science Thesis INDEK 2012:92
KTH Industrial Engineering and Management
Industrial Management
SE-100 44 STOCKHOLM
iii
Master of Science Thesis INDEK 2012:92
Value Stream Mapping in New Product
Introduction – A Case Study at Ericsson MIC
Viktor Hedberg
Jens Lindström
Approved
2012-month-day
Examiner
Mats Engwall
Supervisor
Jonatan Freilich
Anna Jerbrant
Commissioner
Ericsson
Contact person
Jörgen Ersten
Abstract
Today, companies have to redesign and improve their operational performance to cope with the
market competition. While research related to organizational improvements has focused on
applications of value stream mapping in mass production plants, it is unclear whether value steam
mapping can be applied in new product introduction organizations. This thesis strives to generate
and describe a customized value stream mapping tool adapted to manage twofold customer value
within new product introduction environments, processes that construct products and information
gathered from the production and incorporated into next generation products. The study is
conducted with a case study approach including an application of the model in an industrial
setting. The findings implicate that the value stream mapping tool is applicable when managing
performance improvements during new product introduction. Moreover, performance measures
to evaluate the new product introduction information loop are presented.
Key-words
Value stream mapping, new product introduction, operational performance, customer value
iv
Prologue
This master thesis was conducted in the spring of 2012 as the last stage in the master program
Industrial management at the Royal Institute of Technology. In order to complete the thesis, we
have been supported both by the school and the case company, Ericsson MIC. We want to thank
all the employees at Ericsson that have supported us during the research. In particular the steering
board that showed great insight and helped us along the way, especially Jörgen Ersten as our
supervisor and coach. We are hoping that the research findings will return their favors when
implemented. We also want to thank our supervisors at the Royal Institute of Technology Jonatan
Freilich and Anna Jerbrant for their constructive feedback and guiding during the master thesis.
Stockholm, June 2012.
Jens Lindström and Viktor Hedberg
v
Table of Contents
Abstract .......................................................................................................................................... iii
Prologue .......................................................................................................................................... iv
1 Introduction ................................................................................................................................... 9
1.1Objective ................................................................................................................................ 10
1.2 Research questions ............................................................................................................... 10
1.3 Delimitations ........................................................................................................................ 10
2. Theoretical framework ............................................................................................................... 12
2.1 Lean production .................................................................................................................... 12
2.2 Value stream mapping .......................................................................................................... 12
2.2 New product development and new product introduction .................................................... 16
2.3 Limitations of VSM related to the NPI environment ........................................................... 17
2.4 Efficiency measures in NPI contexts .................................................................................... 19
2.5 Summary ............................................................................................................................... 21
3. Method ....................................................................................................................................... 22
3.1 Case study research .............................................................................................................. 22
3.2 Mapping the current state ..................................................................................................... 24
3.3 Mapping future state ............................................................................................................. 25
3.4 Validity and reliability .......................................................................................................... 26
4. Empirical setting ........................................................................................................................ 28
5. The value stream at Ericsson MIC ............................................................................................. 31
5.1 The current state ................................................................................................................... 31
5.2 Analysis of current state ....................................................................................................... 38
5.3 Future state map.................................................................................................................... 40
5.4 Analysis of future state ......................................................................................................... 46
6. Discussion ............................................................................................................................... 47
7. Conclusions ................................................................................................................................ 53
7.1 Future research ..................................................................................................................... 53
References ...................................................................................................................................... 55
Appendix 1 - Benchmarking .......................................................................................................... 61
Ericsson Supply Site Katrineholm .............................................................................................. 61

vi
Scania Engine Production Assembly .......................................................................................... 62
Appendix 2 – Benchmarking questionnaire (Swedish) .................................................................. 64
vii
List of Figures
Figure 1 The NPD process and case company context .................................................................. 16
Figure 2 Filter in production mapped against volume and weighted price .................................... 25
Figure 3 Product platform S-cruce and MIC operations circled .................................................... 29
Figure 4 Ericsson product life cycle and Ericsson MIC context .................................................... 30
Figure 5 Docks process description ............................................................................................... 32
Figure 6 Picking process description ............................................................................................. 32
Figure 7 Water spider process description ..................................................................................... 33
Figure 8 Production process description ........................................................................................ 34
Figure 9 Shipping process description ........................................................................................... 35
Figure 10 NPI process description ................................................................................................. 36
Figure 11 Current state map of Ericsson MIC ............................................................................... 37
Figure 12 Future state map of Ericsson MIC ................................................................................. 45

viii
List of Tables
Table 1 Compilation of spaghetti diagram ..................................................................................... 39
Table 2 Compilation of future state spaghetti diagram .................................................................. 42
Table 3 Improvements from current state to future state ............................................................... 46
9
1 Introduction
This chapter introduces the background and problem setting thesis. Furthermore, objective,
research question and delimitations are presented.
High-tech industries are characterized by decreasing product lifecycles and businesses, such as
disk-drive industry and telecommunication industry, experience a shrinking market window for
selling products (Terwiesch & Xu, 2004). Hence, companies strive to cut their development times
(time-to-market) and time to reach full production volume (time- to-volume) in order to meet
their financial goals for the product (time-to-payback) (Terwiesch & Bohn, 2001). High-tech
businesses are known as high margin industries, but also with prizes that tend to fall rapidly after
product launch. Furthermore, high volume early on the market tends to increase market
acceptance of new products. This forces high-tech companies to start the production as early as
possible in the product lifecycle in order to keep prices high and avoid competitiveness
(Terwiesch, Bohn & Chea, 2001). Products have to reach the market before the manufacturing
process is fully understood to deliver as much value as possible. Therefore, low yield is a
common problem in the initial production state. During the processes to reach higher volumes,
both production rate (starts per hour) and product yields are low (Pisano, 1997). Thus, the aim of
product development should be to increase production rate and product yield as rapidly as
possible. However, there is a constant trade-off between process speed and the likelihood of
defect products (Terwiesch & Bohn, 2001).
Within the new product development (NPD) theory, the production ramp up phase is identified as
the latter state in new product development (Ulrich & Eppinger, 2004). The production ramp-up
is the referring to the period between the end of product development and full capacity
production (Terwiesch, & Bohn, 2001). The case company in this thesis operates in the new
product introduction (NPI) area. In this thesis, NPI is defined as the later parts of the NPD
process equivalent to production ramp-up. In new product introduction, many processes are
carried out concurrently and integrated with each other, making the processes more complex than
volume oriented manufacturing (Ulrich and Eppinger, 2004). Great demand due to
innovativeness and low capacity due to poor production process and lack of understanding of the
product are two conflicting issues during the ramp-up (Terwiesch, & Bohn, 2001). The mapping
tools commonly used in manufacturing processes are useful and applicable in NPI environments
but also limited in their analyses, failing to grasp the entire complexity. In order to get a full
analysis of NPI processes other mapping tools are required (Haque & James-Moore, 2004).
In this study we try to decrease time to market and time to volume by solving the intrinsic
problems of new product development and production ramp-up with modification of the
production efficiency tool called value stream mapping (VSM). The VSM method stems from
lean production and measures value-adding and non-value-adding activities (Rother & Shook,
1998). Within the production ramp-up, iterations of product prototypes occur due to learning

10
(Terwiesch & Bohn, 2001). This iterative loop of information, in this thesis referred to as the
NPI-loop, should be considered waste and non-value-adding in a traditional VSM context were
the definition of customer value do not consider information to other products (Rother & Shook,
1998). This way of measure value-adding processes will not take the experiences from earlier
production sequences into account and it would neglect the main purpose of the NPI site.
Furthermore, the VSM method is being regarded as a preferable mapping tool according to
several scholars (Pavanaskar et al. 2003; Serrano Lasa, Ochoa & De Castro, 2008), at the same
time as the tool possesses limitations, many of them relates to the NPI environment (Braglia,
Frosolini & Zammori, 2009). Scholars deal with issues regarding the special characteristics of the
new product introduction environment in relation to the VSM tool, such as low volume/high
variety and uncertainties in the production process (Braglia, Frosolini & Zammori, 2009). The
research is often done in relation to one characteristic. Moreover, VSM has been used in the NPI
environment by McManus (2005) and McManus and Millard (2002), although only focusing on
the information flow.
When considering the body of knowledge in the VSM literature dealing with new product
introduction circumstances, it is at best scarce. The contributing customer value in NPI
environments must be twofold, on one hand the iterations of information contributing to a better
product, on the other hand the activities actually producing the product. This thesis will
customize and use the VSM method in a NPI environment, also striving to add a way of
measuring the performance of the NPI-loop by using the VSM method. With this information, an
evaluation of the effectiveness in the NPI-loop will be possible.
Ericsson Supply Site Kista Master & Industrialization Center (MIC) is used as a case study
company in this thesis. Within the scope of this thesis, Ericsson MIC’s main responsibility is to
delouse and ramp-up production, taking process times and yields to required levels.
1.1Objective
The objective is to use and evaluate the VSM method in the NPI environment. A measure to
capture the efficiency of the information loop in the NPI environment will be discussed and
analyzed. Finally, this thesis will try to shorten the lead-time and increase material handling
efficiency at the case company.
1.2 Research questions
How can the VSM method be used in the NPI context?
Which measures should be used in order to deal with NPI context and value of the NPI-
loop?
How can the value stream at Ericsson MIC be improved using the new VSM method?
1.3 Delimitations
With respect to this thesis scope, a number of delimitations were made. When applying the VSM
method the focus area was from the receiving of gods to shipping, in short a dock-to-dock plant
11
specific flow. The focus areas were the material handling and the NPI loop due case company
request and identified potential. Furthermore, the production assembly specification alterations
are outside authority of the case company and therefore not considered in this thesis. Parts of the
supply chain outside the plant context will not be included in the VSM although the customer and
supplier perspective will be discussed. As Rother and Shook (1998) suggests, one product was
chosen in the mapping process. In order to calculate inventory days, product unique components
were chosen due to sharing of components among products. Within the plant, another production
flow produced a component in the product. This flow is excluded in the VSM analysis, hence the
flow was deemed not critical accordingly with Braglia, Carmignani and Zammori (2006).
12
2. Theoretical framework
This chapter presents the theoretical framework for defining the theoretical purpose with this
thesis and presents the identified knowledge gap.
In order to illustrate a weakness in the literature, a framework of new product development and
value stream mapping literature is presented in this chapter. A presentation of the lean production
philosophies is given as value stream mapping (VSM) originates from these thoughts. It is
followed by a review of VSM literature and criticism of the lean philosophies. The framework
has been constructed to show the intrinsic issues within new product development (NPD) and
why the traditional VSM method is not applicable in NPD contexts because of its heritage from
lean production. Furthermore, the inadequacies of performance measures in the NPD
environment are stated and it is explained, including arguments for why it would be beneficial to
use in the VSM method in NPD contexts.
2.1 Lean production
Before the linkage between NPD and VSM can be explored it is important to know that VSM
originates from the lean production philosophy (Rother & Shook, 1998). The core of lean is to
eliminate waste and to minimize resources used for the company activities (Liker, 2004).
Specifically, lean production reviews every process from a customer value perspective,
eliminating everything that customers do not want to pay for (Liker, 2004; Rother & Shook,
1998; Womack & Jones, 1990; Womack, 1996).
Lean production principles originate from the Japanese automotive company Toyota Motor
Corporation (Ohno, 1988). The principles are an outcome from combination of intense
competition within the domestic market together with a shortage of resources (Womack et al.,
1990). Some of these concepts are just-in-time, pull production, specifying customer value,
respect for employees and high levels of employee empowerment (Liker, 2004). Lean operations
management focused on the elimination of waste and excess from the product flows and
represented an alternative model to that of a capital-intense mass production (Liker, 2004;
Womack et al., 1990; Womack & Jones, 1994, 1996).
The combined usage of lean methods will increase flexibility and support process improvement
for any industry (Álvarez, Calvo, Peña, & Domingo, 2009). Although lean focuses on
productivity rather than quality and management, the systematic reduction of waste is a
philosophy that will improve underlying factors as poor quality and management issues
(Monden, 1993).
2.2 Value stream mapping
VSM is a method used to capture and analyze material and information flow from a customer
value perspective (Liker, 2004). The VSM mapping process can be described in three steps
explained by Rother and Shook (1998). First, identify the value stream and select a specific
13
product to follow through the value stream. Second, map the current state with observations and
interviews. Third, form a future state map with the background of the current state map and lean
theories.
A value stream contains activities and processes, value adding, non-value adding and supporting
activities (Rother & Shook, 1998). The processes exist in order to transform raw material into a
product or service to the customer and the value is characterized from a customer point of view
(Monden, 1993). In order to understand the value stream, including different sponsors, a holistic
view of the flow over the value adding processes can be made using value stream mapping
(Hines, Rich, Bicheno & Brunt, 1998). The current state map is a high-level description of the
current business process state and sets the direction for the future state (Rother & Shook, 1998).
In order to gain a holistic view of the organization, the value stream mapping method is a simple,
nevertheless effective tool for achieving this (McDonald, Van Aken & Rentes, 2002). If same
overall added value can be achieved in a shorter period of time, productivity increases
(McDonald, Van Aken & Rentes, 2002).
2.2.1 Choosing the product
The product quantity analysis is the typical method for product mix segmentation, displaying
products in order of decreasing production quantity. The idea of performing the analysis is that
majority of non-value-added activities, such as material handling, work in progress, and other
operational costs, are the result of high volume products. In order to strengthen the analysis, sell
revenue can be used as an additional parameter. In essence, two analysis are performed; first the
PQ-analysis while the second should sort the products in order of decreasing selling revenue
instead of volume. The combination of these two analyses is plotted in a matrix, determining the
optimal product. (Braglia, Carmignani & Zammori, 2006)
2.2.2 Mapping the current state
When mapping the current state, processes are categorized in non-value added, necessary non-
value added and value added processes. First, non-value adding procedures relates to processes
that are pure waste and do not deliver any value for the end customer (Rother & Shook, 1998).
Ohno (1988) identified seven wastes within production: transportation, inventory, motion,
waiting, over-processing, over-production and defects. Later, an eight waste has been added:
underutilized people (Liker, 2004). The focus of lean and VSM is to eliminate all these wastes
completely. During production ramp-up, production can be stopped deliberately in order to
analyze and learn from the process (Terwiesch & Bohn, 2001). When taking the “lean”
perspective, learning activities from ramp-ups are considered waste and thus must be removed.
Hence, what is more valuable for the customer, processes and product improvement or
productivity?
The second category is related to necessary operations although not delivering any customer
value. Examples would be unpacking of delivered goods or other material handling operations.
14
Value adding operations deliver direct value for the end customer and could include activities
such as: assembly of parts, painting and forging raw materials (Monden, 1993).
2.2.3 Mapping the future state
The future state was made to eliminate wastes in the production and material handling processes.
The objective is to build an efficient production unit, either through a continuous or a pulling
flow (Rother & Shook, 1998). Pull flow refers to that processes later in the value stream generate
a need for an earlier process to initiate processing (Hopp & Spearman, 2000). Every process
should only fulfill the needs of what is requested by the next process (Womack & Jones, 1996).
Examples of tools addressing waste removal are 5S, single minute exchange of dies (SMED) or
the theory of constraints (TOC) (Hines, Holweg & Rich, 2004). Depending on the specific case,
methods and tools are more or less appropriate and there is no best strategy for companies, every
case is unique and tools must be evaluated to fit the context (Hines, Holweg & Rich, 2004)
Apart from implementing new IT systems, several problems can be solved by rearranging the
current resources (Womack & Jones, 1996).
When formulating the future state, scholars argue to achieve the goal of VSM. First, tact time is
to be established breaking down product demand into sequences creating a production rhythm
(Liker, 2004; Rother & Shook, 1998). Second, level-scheduling and mixed model leveling is
applied to even production rhythm and deal with variances (Liker, 2004). One process, called the
pacemaker process, should be directing the production rhythm and set the production pace.
Continuous flow is used where it is possible (Rother & Shook, 1998). If it’s not possible, pull
systems should be used instead (Serrano Lasa, Ochoa, & de Castro, 2008). Last, the performance
in the whole value stream is improved. Initiated by the VSM team, lead time reducing actions and
changeover time reduction is addressed (Serrano Lasa, Ochoa, & de Castro, 2008).
2.2.4 Material handling
In order to improve the complete value stream, material handling processes have to be
considered. The concept of lean production, not only addresses production specific processes but
material handling processes as well (Liker, 2004). The material handling improvements is a
major part of the findings, applying the customized VSM method in an empirical setting. It is
therefore addressed and explained in this chapter.
There is no general strategy within material handling, strategy and execution must be conformed
to business contexts (Coyle et al., 1996). Material handling includes all handling of material,
from commodity to end product, and composes a critical factor when deciding the level of service
and cost-efficiency of a firm (White, 1990).
Bloomberg et al. (2002) states that material handling can contribute to 30-70% of the
manufacturing cost in a firm depending on the business. Since the material handling processes are
non-value adding, from a customer point of view, it is considered waste. Bicheno (2007) suggests
that the material handling processes contributing to waste should be gathered in a single unit in
15
the business. Material handling should be concentrated on a single employee instead of diffusing
the tasks on several employees. Continuously improving the material handling function is key in
every business and to eliminate material handling from businesses, can be impractical and costly
(Bloomberg et al., 2002).
Spaghetti diagrams are used to identify waste connected to transports and movements (Bicheno,
2007). By using the spaghetti diagrams, unnecessary movements and inadequate layouts are
detected. Bicheno (2007) states that spaghetti diagrams is the most efficient tool when identifying
the best routes for transports.
2.1.2 Criticism to lean
In spite of the success companies have experienced implementing lean principles there are some
scholars pointing out weaknesses in lean production. Hayes et al. (2005) argues that implemented
lean principles do not guarantee strategic advantages over time. Several other authors have shown
in their research that industries that show similarities with the automobile business are more
likely to gain advantages by implementing lean principles. This includes factors like stable
demand and low- or medium-complexity products (Duguay et al., 1997; White & Prybutok,
2001). However, numerous of authors supports lean principles and argues that the lean
production paradigm has been the fundamental reason for recent improvements in productivity
over a wide spectrum of industries (Chen et al., 2005; Hopp & Spearman, 2000). The main
criticism of lean consists of inability to cope with contingency, poor working conditions and the
narrow operational focus on the shop-floor (Hines, Holweg & Rich, 2004).
One of the main issues pointed out with lean production system is the ability to cope with
variability. Bear this in mind when reading about intrinsic issues of variability in NPD
environments. Some lean principles, such as level scheduling and mixed model scheduling are
meant to deal with product fluctuations (Liker, 2004). Nevertheless, when considering demand
variability, the purpose is to smooth out and control demand, stemming from high-volume and
repetitive demand characteristics appropriate for kanban pull-scheduling (Hines, Holweg & Rich,
2004). Cusumano (1994) criticizes kanban style set-ups as being inflexible. Although, Hines,
Holweg and Rich (2004) argues that many authors misinterpret pull- and kanban systems with the
assumption that kanban systems are the only way of accomplishing customer driven scheduling.
Regarding continuous flow and reducing work-in-progress (WIP) in the NPD environment, there
are obvious benefits in lead-time and throughput if reducing WIP. However, WIP after each
process that not reaches 100% yield will compensate for capacity losses if products not fulfill
quality testing (Hopp and Spearman, 2000). WIP between processes will reduce uncertainty,
although more WIP increases inventory costs and lead time. A consequence of allowing more
WIP will generate more cassations due to bad WIP once problems are detected (Terwiesch, &
Bohn, 2001). There has to be a trade-off between WIP buffer levels and the desired lead time.
There is often a trade-off between yield and production speed (throughput) (Spear & Bowen,
1999).
16
The concept of lean has been developed over time and will continue to do so in the future. A
consequence of this development has led to confusion about what is lean. The focus on of how to
apply a series of different tools and techniques in contrast to the lack of discussion of poor
strategic alignment in lean programs has led to failure of sustaining competitive advantage from
lean transformation programs. The end result is often a scattered initiative, with many tasks
acting in conflict. (Hines, Holweg & Rich, 2004)
2.2 New product development and new product introduction
The identified focus area in this report has been to relate VSM to NPI context. In this chapter the
NPD area is defined showing the relationship with NPI.
One of the most critical factors in business is product development, thus new products are the
foundation of competitiveness (Clark & Fujimoto, 1991). Thus, product development is a source
to competitive advantages. Product development is a part of how the employee diversifies, adapt
and reinvent their employers to the current market conditions (Eisenhardt & Brown, 1995).
Moreover, product development is crucial for success and organizational renewal, especially in
competitive and short life cycle industries (Eisenhardt & Brown, 1995). Ulrich & Eppinger
(2004) implies that product development is a set of activities, beginning with the tools and
processes used to perceive a market opportunity and ending in the production, sale, and delivery
of a product, fulfilling that market opportunity.
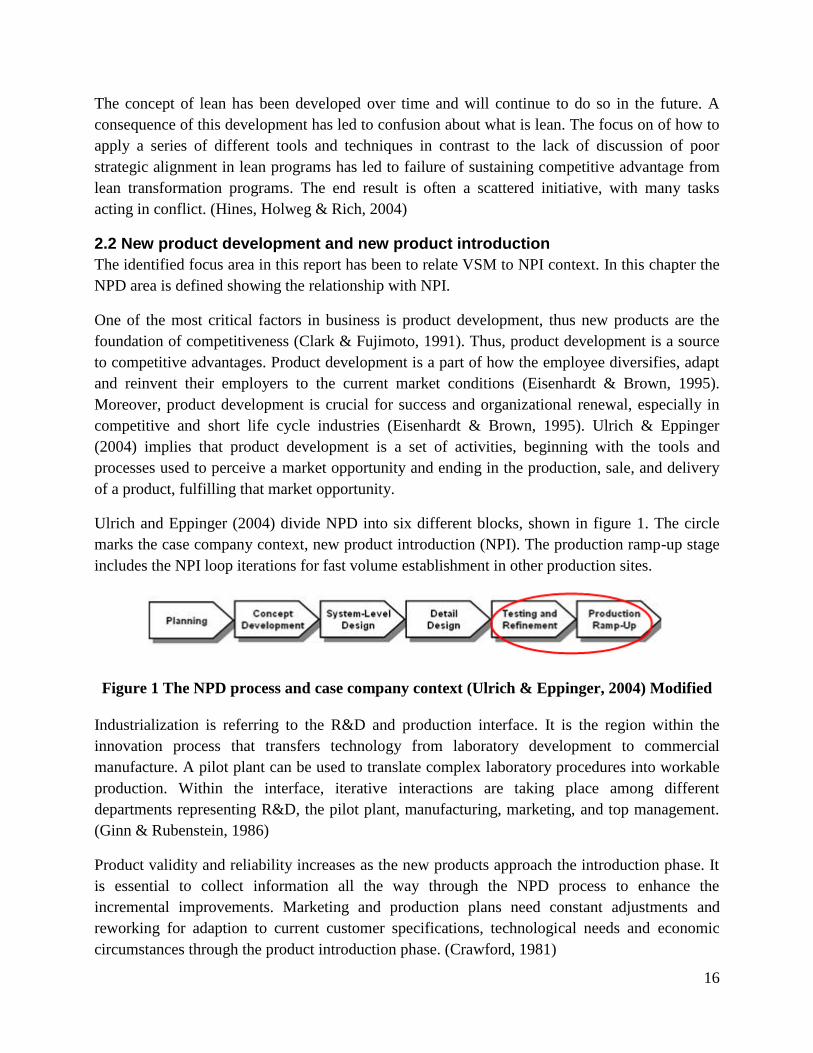
Ulrich and Eppinger (2004) divide NPD into six different blocks, shown in figure 1. The circle
marks the case company context, new product introduction (NPI). The production ramp-up stage
includes the NPI loop iterations for fast volume establishment in other production sites.
Figure 1 The NPD process and case company context (Ulrich & Eppinger, 2004) Modified
Industrialization is referring to the R&D and production interface. It is the region within the
innovation process that transfers technology from laboratory development to commercial
manufacture. A pilot plant can be used to translate complex laboratory procedures into workable
production. Within the interface, iterative interactions are taking place among different
departments representing R&D, the pilot plant, manufacturing, marketing, and top management.
(Ginn & Rubenstein, 1986)
Product validity and reliability increases as the new products approach the introduction phase. It
is essential to collect information all the way through the NPD process to enhance the
incremental improvements. Marketing and production plans need constant adjustments and
reworking for adaption to current customer specifications, technological needs and economic
circumstances through the product introduction phase. (Crawford, 1981)
17
Product development is characterized by the process uncertainty. The output may be unknown in
the beginning of the project and is strongly related to rely on information more than physical
material. However, the output may not be known but the process should be repeatable and the
output is a product specification, not the product itself. (McManus, 2005)
2.2.1 Customer value
As said before, VSM originates from the lean production philosophy. This poses an interesting
dilemma if the VSM method is intended to be used in a NPD environment. What is customer
value in the NPD environment?
One definition of value adding information is given by Haque and James-Moore (2004):
“tasks that transform information and allow for convergence of
segmented information to the final design.” (Haque & James-Moore,
2004, p. 15)
Companies believe that improvements in quality, cost and delivery will lead to higher customer
value, however in many industries customer value is wider and consisting of a variety of tangible
and intangible features. Thus, they must be careful not to have limited scope and focus and
identify what the customer value is. (Hines, Holweg & Rich, 2004)
McManus (2005) states that the definition of value in product development is a never ending task
and must be defined by the specific context of the investigated company. As stated in the
introduction of this thesis, the customer value in a NPI environments must be twofold, on one
hand the iterations can be seen as the information looping contributing to a better product, on the
other hand it relates to the activities actually making the customer to buy the product.
2.3 Limitations of VSM related to the NPI environment
The limitations of the VSM are stated to explain why the VSM method has been customized to fit
NPI contexts. VSM was developed in the repetitive automotive industry to map the flow in
factories with a small family of products (Serrano Lasa, Ochoa & De Castro 2008). VSM is
adequate in these contexts, due to fact that the value stream is unidirectional without alternative
product routings and/or flows merging together. However, in high-variety low-volume factories,
the VSM method falls short (Serrano Lasa, Ochoa & De Castro 2008). Ginn and Rubenstein
(1986) states that when products become more advanced, the product development projects tend
to generate higher levels of uncertainties and sophistication. The production objective is to
maximize output and productivity during introduction (Terwiesch & Bohn, 2001). The R&D
objective is to develop new product designs for adaption to the current market conditions (Ulrich
& Eppinger, 2004). During new product introductions in high-tech industries productivity tend to
be less prioritized in the short run (Ginn & Rubenstein, 1986), and there is a constant trade-off
between defect products and production speed (Terwiesch & Bohn, 2001).
18
The VSM method presents some intrinsic issues, many of them related to the NPI context, and a
number of them have been reviewed by scholars in the VSM literature. The limits of VSM
method was identified by Braglia, Frosolini and Zammori (2009).
1. The accuracy level and number of variations is limited
2. Fails to link structure of facility layout to material handling delays
3. Cannot show inefficient material flows on work in progress inventories
4. Unable to cope with high-variety low-volume contexts
5. Difficult to handle multiple flows merging together
6. Unable to show several scenarios and what-if analyses
7. Gap between manufacturing and engineering methods
8. Unable to deal with variability problems
This first limitation has been solved by various support programs such as Microsoft Excel,
Microsoft Visio, e-VSM and IGRAFX. Though the accuracy problem has not yet been solved
due to fact that the data collection still presents a validity problem. Abbas et al. (2001) presented
the value network mapping approach addressing problems 2–4. This approach deals with material
handling technologies and incorporates them into VSM. Problem 4–5 was addressed by Braglia
et al. (2006). A step-by-step procedure, called improved value stream mapping, enabling VSM to
cope with complex bill of material and several value streams was suggested. Regarding the VSM
capability of handling complex and high variety flows, Rother and Shook (1998) suggests that by
identifying and mapping the key elements of the flow and drawing multiple crossing flows, you
could still use the method. Problem 6 has been solved with discrete-event simulation, formulated
by McDonald et al. (2002), which can assess the effects on the performance of the future state.
Pavnaskar and Gershenson (2004) addressed problem 7 and suggested a way for incorporating
engineering processes in VSM. Braglia, Frosolini and Zammori (2009) dealt with problem 8 with
stochastic analysis and on the use of the central limited theorem with fuzzy algebra and the use of
fuzzy triangular numbers.
To identify and improve the main value stream, it is frequently necessary to support the mapping
procedure with other tools such as group technology and part families formation analysis.
Furthermore, when collecting data about times, inventories and other operating variables, it is
sometimes difficult to get a deterministic value. One common approach is to estimate the
minimum/maximum values for such uncertain data and use these for bounding lead time
calculation, thus obtaining an optimistic and a pessimistic value for the total expected lead time.
(Serrano Lasa, Ochoa & De Castro 2008)
Even though the VSM method not is designed for the NPI context, scholars emphasize the
applicability of VSM in a NPI environment (Rother & Shook, 1998; Haque & James-Moore,
2004).
19
Rother & Shook (1998) states several ways of designing the production flow for a customer
driven organization with low volumes and high product variety characteristic for NPI sites
Define a maximum number of products staffed between two processes. Shorter First-in-first-
out (FIFO) line generates shorter lead times.
The work flow should not fluctuate with the amount of customer orders, instead it should
vary with standardized batch size and distance from process. Hence, one has to specify the
maximum amount products/h that the bottle neck process can cope with.
A customer order may have a pre-determined delivery date. This makes it possible to run
processes on forehand when there are gaps in the batches with standardized size. It is possible
to identify customer’s products in the flow and prioritize products if necessary. It is
important for the total process that sub-processes has a constant amount of products to
process every hour.
The process mapping methods used for manufacturing processes are beneficial and applicable in
a NPI environment, although they provide limited and inadequate form of analysis required for
implementing efficient product flow. However, in order to fully analyze NPI processes, usage of
additional mapping/modeling analysis tools are necessary to capture the entire complexity in the
value stream analysis (Haque & James-Moore, 2004). Hence, the complexity of NPI has been
addressed and discussed in this research in order to widen the knowledge.
There are a number of tools at hand that can map/model product development processes, such as
four fields mapping and role activity diagrams (Haque and James-Moore, 2004). These tools are
mainly used for information flow overview and are not evaluating the efficiency of the
information in the NPI loop including the iterations of information from processing production
outcomes. The customized VSM method will relate to these iterations incorporating it in the
process mapping.
2.4 Efficiency measures in NPI contexts
Efficiency measure evaluation is added to the research for an analysis of which measures that are
suitable for evaluating the NPI performance. Information gathering throughout the NPD process
is critical and information typically becomes more valid and reliable as the project moves through
the process toward commercialization (Crawford, 1997). Krishnan & Ulrich (2001) emphasizes the
importance of measurement of process performance in process management. Continuous update and
modification of both marketing and production plans are necessary throughout the product launch
phase in response to customer and competitive reactions, and technological or economic
environmental settings (Crawford, 1981). Fine-tuning or “steering control” of product,
production process, and/or marketing strategy may be required after the launch is executed
(Crawford, 1997). It is often unclear whether a metric is suitable for a type of product
development project or if multiple metrics are useful in a specific case (Mallick & Schroeder,
2005).
20
If a measurement system should be used, it should contain a set of mandatory key records. It
should support the comparison of projects and still keep project specific bearing. It should be
easy to collect and access the data. Moreover, NPD requires that hard and soft measures are
combined to measure performance. Hard measures relates to measures that are easy to measure as
operation times, while soft measures relates to measures a little bit more unclear as employee
health as an example. These measures should support with the holistic strategic goals set by the
company. (Pawar & Driva, 1999)
The measures needed to evaluate the performance of a project are stated in problem-solving
theory. They mention measures related to design productivity or labor cost of project, quality,
product cost reduction, reduction of product complexity, manufacturing cost and project lead-
time reduction related to the ramp-up process. (Clark & Fujimoto, 1991)
Commonly, performance measurements are thought of as time, cost and quality but neglecting to
emphasize the value created. From the customer perspective, additional quality improvements
may be unnecessary. Performance is calculated by time, cost and quality in the latter part of the
NPD process. Effective performance measurement systems should be founded in criteria for
performance estimation, and be derived thereafter. The perception of performance must change
before the performance measurement system can be improved. (Cedergren, Wall, & Norstrom,
2010)
One of the most important performance measures during new product introduction and
production ramp-up is yield due to the economic impact (McIvor, 1997). Terwiesch & Xu (2004)
argues that low yields visualize a difference between descriptions how processes should be
operated and how they really are done practically. Pisano (1997) underlines that yield
improvements should be prioritized during the product ramp-up phase, implementing the process
recipe at a large scale. Terwiesch, Bohn, and Chea (2001) argue that first-pass yields as the best
single measure of line performance. First-pass yield will be one of the measures included in the
VSM map.
According to Terwiesch and Bohn (2001) and Terwiesch, Bohn, and Chea (2001), is process
times, apart from yield improvement, a good indicator of how the production process performs.
Furthermore, process times are recognized as a learning indicator in production ramp-up
(Terwiesch & Bohn, 2001). Process time improvement will also be included in the VSM map.
The third and final measure that is suggested to be incorporated in the mapping of the NPI loop is
its own lead time. Even though the measure can depend of the complexity of information it could
be beneficial to evaluate differences amongst products. A separate ramp-up product project lead
time can partly be described by several NPI loops and production procedures. Therefore, the NPI
loop lead time is a central production ramp-up efficiency measure.
When evaluating the applicability of efficiency measure tools in NPI environments the VSM
showed highest potential according to the researchers. It is stated that VSM is a suitable method
21
in order to measure the organizational performance (Serrano Lasa et al., 2009). Braglia,
Carmignani & Zammori (2006) states that the VSM method presents several advantages in
respect to other mapping methods:
Forms the foundation for lean production implementation
Compiles internal and external processes in the complete supply chain.
Reveals both product- and information flow
Links product planning, demand forecast, production scheduling, and shop floor control.
Includes both production time and inventory levels.
VSM has been a practical way for companies to acclimatize for more flexible and efficient
demand from the top management. The main focus on VSM should be to fulfill the needs of a
developing manufacturing organization (Rother & Shook, 1998). Pavanaskar et al. (2003) argues
that VSM has a great potential and structures some arguments presented as follows:
Simplicity and objectivity.
A systematic view of the product flow will visualizes the inefficiencies.
Unification in company language and a general knowledge in lean culture will contribute
to the project result.
The VSM could be a starting point for a general improvement project.
Hines & Rich (1997) argues that the waste reduction initiatives is fundamentally oriented to
productivity and not focused on quality. The reason is that the reduced waste and “leaner” flow
will expose processes that lead to product quality problems (Liker. 2004). Hence, the waste
reduction will lead to a systematic pursuit of higher quality and improved management processes.
2.5 Summary
As stated above, several authors highlight the problems and limitations with applying VSM to
organizations in the product introduction phase (Braglia, Frosolini & Zammori, 2009; Haque &
James-Moore, 2004; Rother & Shook, 1998). In addition, VSM have been applied in NPD
although only focusing on the information flow (McManus, 2005; McManus & Millard, 2002).
Other mapping methods such as four fields mapping or role activity diagrams are mainly used for
information flow overview. This thesis strives to evaluate the applicability of the VSM method to
NPI environments and state the customizations needed in order to grasp the essential parts of the
method in relation to the contextual circumstances. This has been done to highlight the lack of
information regarding the applicability of VSM in abnormal contexts in recent research.
Moreover, it suggests measures for evaluation of the NPI-loop performance.
22
3. Method
This chapter introduces the method for this project and in particular the methods used when
conducting the literature review and the empirical study. First, an overall explanation of the
method used in this thesis is stated. Second, the data collection methods are described ending
with discussions of the limitations of this approach.
The data used in this thesis was gathered from three main sources; a literature review, participant
observations and interviews. The literature review was conducted to understand the framework of
VSM and new product development theory. During the work process, the research areas were
narrowed down to the case specific context. The majority of the time spent on this study
consisted of mapping material and information flow. This was done with participant observations
and interviews at the case company and two benchmarking companies.
3.1 Case study research
This thesis, a case study research, was conducted with a bottom up approach. It is characterized
by data collection during the research and generalized into theoretical conclusions (Eisenhardt,
1989). The VSM method was adapted to the case-specific setup and then generalized in order to
be applicable in other NPI environments. As stated in the introduction, this case research is
conducted in a NPI site at Ericsson. This methodology was chosen due to the high number of
involved parameters and the complexity in the adaption to a specific setting (Eisenhardt, 1989).
The initial phase at Ericsson MIC was spent in the material handling and production process in
order to build a general understanding of the context. The continuous working process, called
abduction (Alvesson & Sköldberg, 1994), was used by the researchers. This technique enables
factors from empirics and theoretical framework to develop simultaneously and depending on
each other. Abduction results in a progress of the empirical foundation based on theory that is
being specified and adjusted over time (Alvesson & Sköldberg, 1994). The researchers compared
the existing context with the literature review in order to find gaps in the literature. The
comparison of concepts with extant literature is important when conducting a theoretical
foundation (Eisenhardt,1989). In order to successfully do so, a broad spectrum of literature must
be analyzed for similarities or contradictions and why they exist.
Case studies are a common way of research that focuses in deep investigations of one separate
case (Eisenhardt, 1989). Eisenhardt (1989) suggests that theoretical findings from the literature
review can be compared with empirical research in order to draw conclusions. Regularly, a case
study describes a defined part of a larger system, a specific area of interest. Yin (1994) defines a
case study as an empirical investigation of a contemporary phenomenon in its real environment
through focusing in one specific part. Meredith (1998) argues that case studies are suitable to
develop new ideas and theory and used for improvement analysis. Voss et al. (2002) underline
the impact of a case study and ability to explain operational questions. This implicates that it was
suitable as the general method for testing and evaluating the customized VSM-method.
23
The data collection consisted of participant observations and interviews with people in key
positions. It includes both collection primary and secondary sources. Primary sources are the
ones that came into existence during the study while secondary sources involve another
interpretation of events based on primary sources (Bell, 2005). The primary sources in this study
were collected with participant observations and interviews, whilst secondary sources were
reviewed during the literature study.
3.1.1 Participant observations
A majority of the data collection in the VSM was done by participant observation. The method
refers to a research in which the observer participates in the daily life of the studied objects, in
this case material handling personnel and production line (Kawulich, 2005). The role involves
observing things that happen in a specific context, questioning people, listen to what is said over
a specific period of time (Kawulich, 2005). It provides a structure in which words can be put into
practices and set into the direct context. The researcher can experience actions which may not be
reported in an interview, concerning the same subject (Becker & Blanche Geer, 1957). In order to
customize the VSM method to Ericsson MIC, the participant observation method was suitable
due to large proportion case specific elements that had to be incorporated. The participant
observation was conducted during the introduction phase and the current state mapping.
According to Shah & Ward (2003) the mapping should be done by a team that is involved in the
day to day material and information flows. There are two reasons for this, they have the best and
most correct knowledge of the flows and furthermore you ensure the bottom-up commitment
when they participate in building the future plan.
3.1.2 Interviews
Qualitative interviews are a method for collecting data with a selected participant. The interview
object answer questions concerning the daily activities such as understanding of processes,
feelings, attitudes, opinions and actions. (Arksey and Knight, 1999)
To get a wider perspective, the participant observations are triangulated with interviews and
surveys in order to gain as much knowledge as possible. Unstructured interviews are practical to
create an understanding of the context and help with problem formulation (Alvesson &
Sköldberg, 1994). The disadvantage of these methods is that the analysis of the data is time-
consuming and complicated (Collis & Hussey, 2009).
The ongoing data collection for the current state map has been strengthened through several
interviews with people in key positions related to the value stream and the interview objects has
been chosen during the continuous working process. The people who were interviewed included
the material handling manager, new product introduction project manager, two quality engineers,
and two production technicians. The information these managers possesses will be useful for the
complete industry structure even if they not have identified any wastes in their area of
responsibility (Hines & Rich, 1997).

24
Interviews, literature review and a benchmarking study, shown in Appendix 1, were done to
accomplish the future state map. Two interviews were done in benchmarking companies, Scania
Engine Assembly NPI department and Ericsson Supply Site Katrineholm. Two interviews were
made at the internal customer, at Ericsson Supply Site Kumla, relating to the customer
perspective. Note that the delimitations were set at the shipping process at Ericsson MIC and no
analysis of the value flow in Kumla was done. However, if this part is excluded one might take
actions improving a product attribute that not is requested (Womack & Jones, 1996). These
interview objects were chosen during the continuous current mapping process and were selected
depending on the type of information that was needed.
3.1.3 Benchmarking
Benchmarking is one method of searching for the best industry practices, which can lead to
performance enhancements through the implementation of these best practices (Camp, 1989). In
this case the goal was to find work practices from other companies that could improve Ericsson
MIC’s performance. The inputs generated ideas for the future state map at Ericsson MIC. Taking
the suitable approaches into account, several of the work practices have generated improvement
proposals. These proposed improvements are referred to in the empirical findings. Carpinetti and
Melo (2002) states that there are three main areas within benchmarking and these are classified
as:
Process benchmarking – compares work practices, business practices and operations
Product benchmarking – compares products or services
Strategic benchmarking – compares management practices, business strategies and
organizational structures
A questionnaire was sent with the intention of discussing the answers during the visit at the
companies. The questionnaire can be accessed in appendix 2. The interviews were semi-
structured and they are valuable since own questions could be formulated and follow-up
questions could be asked. This approach is supported by Beamon (1999).
3.2 Mapping the current state
The current state map was created through participant observations and interviews with people in
key positions. The first step was to start with a specification of the customer needs. If this part is
excluded, one might take actions improving a product attribute that not is requested (Womack &
Jones, 1996).
The literature was found inadequate when Ericsson MIC context is applied. The VSM literature
is focused on high-volume/low-variety contexts with stable supply and demand. In order to
customize the VSM method for Ericsson MIC some adjustments were made when choosing the
product investigated.
25
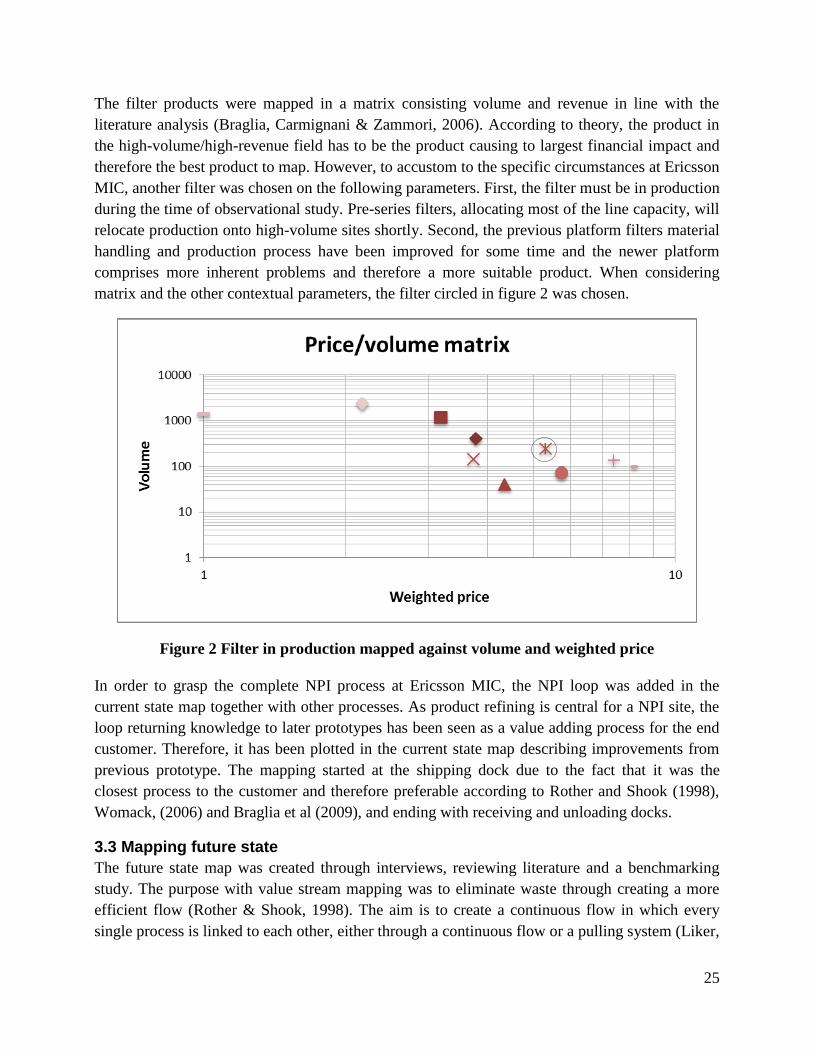
The filter products were mapped in a matrix consisting volume and revenue in line with the
literature analysis (Braglia, Carmignani & Zammori, 2006). According to theory, the product in
the high-volume/high-revenue field has to be the product causing to largest financial impact and
therefore the best product to map. However, to accustom to the specific circumstances at Ericsson
MIC, another filter was chosen on the following parameters. First, the filter must be in production
during the time of observational study. Pre-series filters, allocating most of the line capacity, will
relocate production onto high-volume sites shortly. Second, the previous platform filters material
handling and production process have been improved for some time and the newer platform
comprises more inherent problems and therefore a more suitable product. When considering
matrix and the other contextual parameters, the filter circled in figure 2 was chosen.
Figure 2 Filter in production mapped against volume and weighted price
In order to grasp the complete NPI process at Ericsson MIC, the NPI loop was added in the
current state map together with other processes. As product refining is central for a NPI site, the
loop returning knowledge to later prototypes has been seen as a value adding process for the end
customer. Therefore, it has been plotted in the current state map describing improvements from
previous prototype. The mapping started at the shipping dock due to the fact that it was the
closest process to the customer and therefore preferable according to Rother and Shook (1998),
Womack, (2006) and Braglia et al (2009), and ending with receiving and unloading docks.
3.3 Mapping future state
The future state map was created through interviews, reviewing literature and a benchmarking
study. The purpose with value stream mapping was to eliminate waste through creating a more
efficient flow (Rother & Shook, 1998). The aim is to create a continuous flow in which every
single process is linked to each other, either through a continuous flow or a pulling system (Liker,
26
2004). Every process will do exactly what is requested by the next process, not more, not less.
Apart from implementing new IT systems, several problems can be solved just using the current
resources (Womack & Jones, 1998).
A few of these guidelines have been excluded in the future state analysis. Local limitations
including high supplier uncertainties and component quality failures make it problematic to
implement tact time (Serrano Lasa et al., 2009). Hence, it has been excluded generating the future
state mapping in the customized VSM model. As a consequence of that, the pacemaker process
and level-scheduling were excluded as well. Furthermore, the high number of differentiated
product resulting in different operating times makes it difficult deciding tact time. As a
consequence of that, the pacemaker process is excluded as well. The NPI-loop process was not
reformulated but suitable measures to evaluate process performance have been formulated.
3.4 Validity and reliability
During the method decision making process, aspects of reliability and validity in the delivered
scientific results were taken into account. Reliability is characterized by the ability to repeat the
study leading to similar results and validity is related to how the result conforms to the studied
object (Collis & Hussey, 2009). Moreover, validity refers to the extent and accuracy of how the
findings reflect the actual studied object (Collis & Hussey, 2009). A cross-functional team was
gathered during the current state mapping ensuring validity of the mapping process. The cross-
functional team was chosen accordingly with Rother and Shook (1998) and Tapping et al. (2002)
consisting of one person from each process function ensuring that every process has been
perceived correctly. Furthermore, the manager for the material handling processes was
participating, as he was the manager for every process involved except for the production
process. Moreover, a value stream manager was chosen for his expertise in the value flow.
According to Rother and Shook (1998) this person is the one who is reporting the evolution for
the VSM process to the manager. Instead, this role was managed by the one of the master thesis
students due to the understanding this person has managed to build up in the participant
observation phase. The other researcher acted partly as a secretary who documented the collected
data, and partly as a lean specialist providing expertise knowledge of the tool.
The combination of primary and secondary sources can be seen as positive as they can
complement each other in both perspective and bias. Primary sources should have better insight
into the business, but might be reluctant to be honest about negative company aspects. Secondary
sources that are published can be seen as validated but the information is not tailored to the
particular case as the primary sources are. (Bell, 2005)
In order to strengthen validity, the thesis project had a steering committee, consisting of cross-
section of managers at Ericsson MIC including; head of manufacturing as the responsible project
owner, head of material handling as process owner, two line managers from production, manager
from manufacturing logistics and support, operational excellence manager responsible for the
improvement processes at the manufacturing unit and finally a process technician. While the
27
cross-functional team meetings were introduced to ensure the validity of the current state map,
these meetings were introduced to ensure the project planning process was followed and provide
guidance in essential decision making processes. Other project tools such as task description
Gantt-chart and risk-analysis with risk-mitigation was used in order to analyze risks and structure
the project during the process of the thesis (Tonnquist, 2010).
This case study has a qualitative approach and involves an interpretivistic methodology. In this
research, the case company was a fundament for general conclusions. The interpretivistic
paradigm entails social reality and is consequently subjective and may affect the outcomes of the
study (Collis & Hussey, 2009). To minimize the bias of one subjective source a form of
triangulation method was used including interviewing several stakeholders about a specific
observation or process. Furthermore, multiple theoretical sources were used during the
continuous working process to reduce poor quality information pools (Yin, 1994; Voss et al.,
2002).
3.4.1 Limitations
Even though participant observations carry some advantages negative factors, such as biased
information, must be addressed by the researchers. An employee that is under the impression that
he or she is being observed often improve their current performance, be less risk adhesive and
become less decisive than usual. These factors are known as demand characteristics because of
that the employee feels that the researcher is making a performance demand. This fact has
influenced the continuous observation process and has been minimized trough stating that the
observations not is made to investigate employee performance. (Collis & Hussey, 2009)
As this research has a qualitative approach, normally associated with the interpretivistic
methodology, the collected data is more likely to be biased, due to the small number of studied
objects, and the answers must be critically reviewed. Moreover, a case has study has more of an
interpretive approach, the result may be affected by the fact that the company is under
investigation. One can argue that the reliability of the case study is lower due to the subjective
method. (Collis & Hussey, 2009)
28
4. Empirical setting
This chapter describes contextual circumstances at the case company Ericsson MIC.
Ericsson is a provider of telecommunications equipment and services to mobile and fixed
network operators, built up by different kind of network nodes such as radio base stations (RBS).
Their equipment operates in approximately 180 countries and over 40 percent of the mobile
traffic in the world passes through Ericsson networks. Ericsson has more than 100 000 employees
and over 200 billion SEK in revenue. They are one of the few companies that can provide end-to-
end solutions for all major mobile communications standards (Ericsson, 2012).
A radio base station is a device that transmits and receives wireless signals from e.g. mobile
phone voice traffic or other internet connected devices. An important component in the RBS is
the filter device. The device collects multiple signals and ensures that only correct frequencies are
transmitted. The purpose of filtering is to obtain the correct and clear signal without interference.
Ericsson Supply Site Kista is a part of the business unit Networks. Master & Industrialization
Center (MIC) in Kista is responsible for industrialization and supply of filter and surface mount
technologies, also known as printed circuit boards. Moreover, they practice global master
responsibility in maintenance and supporting the new product technology on production sites
abroad.
The telecommunication business areas include communication by radio, television, mobile and
broadband services. The telecom industry has made major contributions to the global economic
growth during the last decades. The field is characterized by technological development,
innovative products and high rate of product diffusion (Lindmark, et al., 2004). Gupta, Pawar and
Smart (2007) argue that telecom industry provide customized product offerings, driving product
variations, in order to satisfy the psychological aspect of customer needs. This drives companies
to produce innovative high-tech products and sell them in large volumes during a short period of
time (Lindmark, et al., 2004). This industry is also characterized by intense competition and
consolidation contributes to make the companies more global (Noam, 2006).
The filter units, which are industrialized at Ericsson MIC, are components in the radio unit and
jointly delivered mostly to telecom operators. The filter products consist of several components,
ranging, from complex and completely new, to standard components. The suppliers stretch from
prototype manufacturers with highly specified materials and tolerances to wholesalers. When
finished, the filters are transported to an internal customer.
The main mission for Ericsson MIC is to industrialize filter products; hence the life-cycle of
products in production at MIC is short when comparing to other manufacturers. When the
product has satisfactory quality and processing time, production is transferred to a low-cost-
country. Though it can be hard to predict the product ramp-up setup, normally it follows a pattern

29
prototype series, Prototype 0-3 followed by a pre-series with full-tact-testing. The trend is that the
prototype series are getting increasingly bigger, previously around 20 products and now towards
100 products. This is an effort to shortening the new product introduction lead-time, but also
causes some issues. Prototype components are expensive and suppliers often struggle with their
own ramp-up.
Specifically Ericsson MIC performs these activities:
Initial production and verification of printed circuit boards, filter mechanics and
components in both new product introduction projects and maintenance.
Design reviews on drawing level and prototyping.
Advanced failure analysis and root cause analysis.
Supplier and technology qualifications.
Early deliveries to important customers.
The S-curve tracks the progress of the commercialization and demand for as a function. The new
technology is slow in the beginning of the process but after a while, when engineers and other
important stakeholders are aware of the new technology and are requesting it, it accelerates. As
the technology matures, the curve’s progress slows down again. (Asthana, 1995)
When matching MIC against the S-Curve, they are operating within the initial part in the life-
cycle, although not within the design phase. Filter products follows the S-Curve analogy in
technology shifts, shown in figure 3. Currently, a new platform of filter is being initiated. When
moving from a previous product platform to a new one, none or few of the components and
experiences are used in the newer version.
Figure 3 Product platform S-curve and MIC operations circled
Ericsson is a niche innovator and according to Hultink et al. (1997), niche innovators have the
highest success rates when launching new products.
The context is changing for Ericsson MIC. The product range will increase, from a present 40
products, to 120 in a few years. Increasing pressure of being first to market has derived in an
objective to decrease time-to-market for NPI projects with 50%. This results in several
30
implications for this site. Even though to total throughput volume will be relatively constant, the
handling of materials will increase threefold.
When considering the value stream at Ericsson MIC, a number of issues were identified. There
was no or unclear strategy in the internal logistic process. Lack of knowledge and understanding
of the information- and material flow creates an uncertainty and the need for frequent
stocktaking. Incorrect material and components are delivered to the production, material and
components are misplaced in the inventory. Furthermore, unnecessary movements and unclear
responsibilities also cause confusion.
The R&D process for taking an idea of a new filter to a volume ready product can in a simplified
way be explained as follows. The design department, not in-house, has been given a task of
presenting a new filter with certain performance demands. They design and manufacture the first
prototype (prototype 0). Then, a NPI project is created with the mission to industrialize this filter,
using MIC’s production capacity. Revisions are made to prototype 0 and prototype 1 is
manufactured at MIC. The quality engineers and production technicians gather information from
the production and create a quality report. This report is handed to the design department for
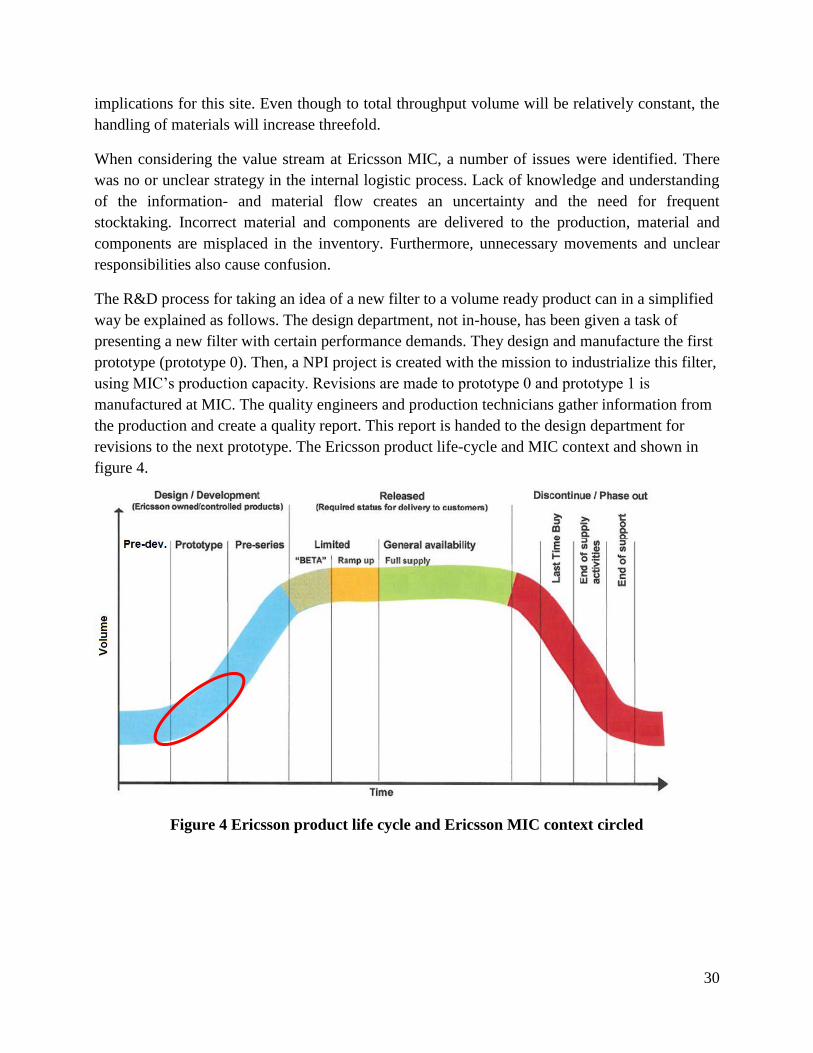
revisions to the next prototype. The Ericsson product life-cycle and MIC context and shown in
figure 4.
Figure 4 Ericsson product life cycle and Ericsson MIC context circled
31
5. The value stream at Ericsson MIC
This chapter describes the outcome of the VSM application containing the current and future
state mapping procedures. The current state mapping findings is presented followed by the future
state proposal in the latter part.
The processes presented in the current state mapping are results from the usage of the customized
VSM tool at Ericsson MIC. The value stream for the filter unit was examined and every sub-
process along the value stream was mapped. In order to show the NPI context, of high
variety/low volume, high uncertainty and information iteration, both the material handling
processes and production process including the NPI loop are described. The mapping is presented
starting with the docks, handling the incoming components, ending with the finished goods
shipping process. Each process is visualized with describing pictures for enhanced understanding.
The key VSM measures are presented in every process. These measures include process times
(PT), defined as the total lead time for the component to go through the process, changeover
(CO) time, as the time for resetting the process in order to initiate another product batch run,
availability (AV) which is process availability time adjusted for down time, both planned and
unintentional (Rother & Shook, 1998). Furthermore, VSM was used to develop the future state
map proposition discussed later in this chapter, explained in the same manner as the current state
processes.
5.1 The current state
This application of the VSM was done to evaluate the performance of the customized VSM
model and to increase the operational performance at Ericsson MIC. The processes are described
in order to get a detailed insight of a VSM application example and to show how explicit
performance improvements can be introduced by using the method. The findings and areas of
improvement are then analyzed.
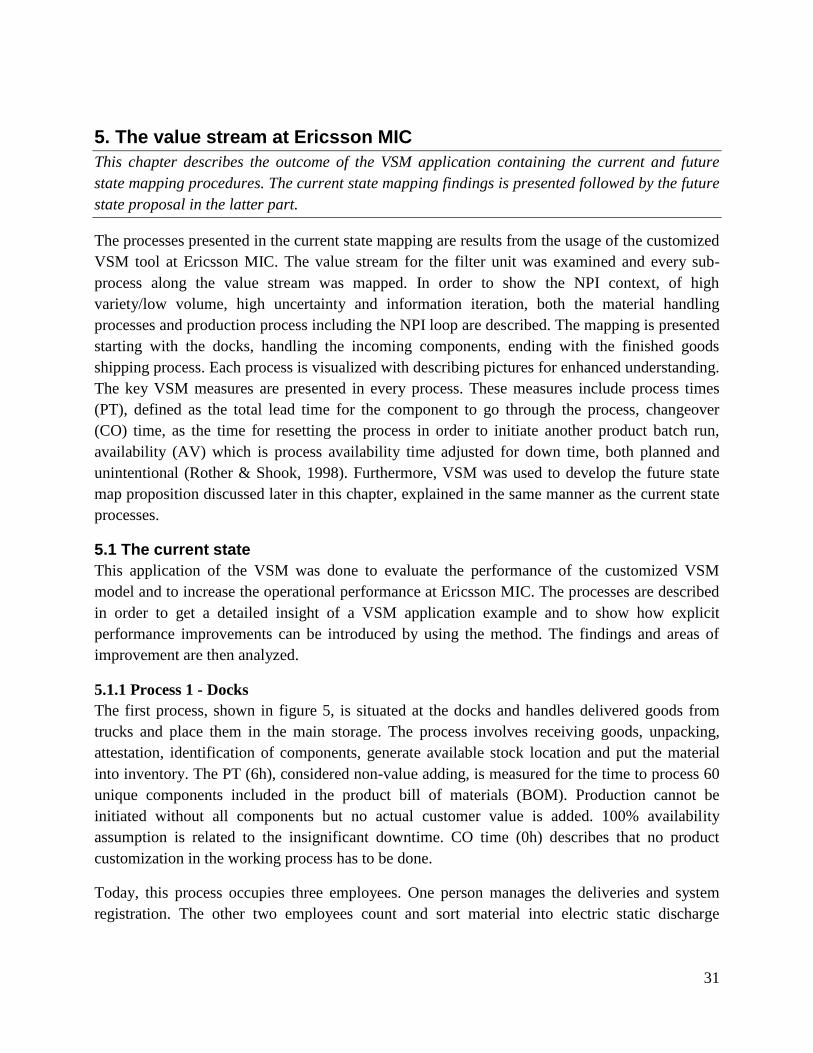
5.1.1 Process 1 - Docks
The first process, shown in figure 5, is situated at the docks and handles delivered goods from
trucks and place them in the main storage. The process involves receiving goods, unpacking,
attestation, identification of components, generate available stock location and put the material
into inventory. The PT (6h), considered non-value adding, is measured for the time to process 60
unique components included in the product bill of materials (BOM). Production cannot be
initiated without all components but no actual customer value is added. 100% availability
assumption is related to the insignificant downtime. CO time (0h) describes that no product
customization in the working process has to be done.
Today, this process occupies three employees. One person manages the deliveries and system
registration. The other two employees count and sort material into electric static discharge
32
approved packages and then moves the material from the docks into inventory. They manage the
unpacking together depending on the current occupation situation between them.
Truck arrives at
docks
Put material into
inventory
Mark-up and insert
in IT-system
Control and attest
material
Docks
Figure 5 Docks process description
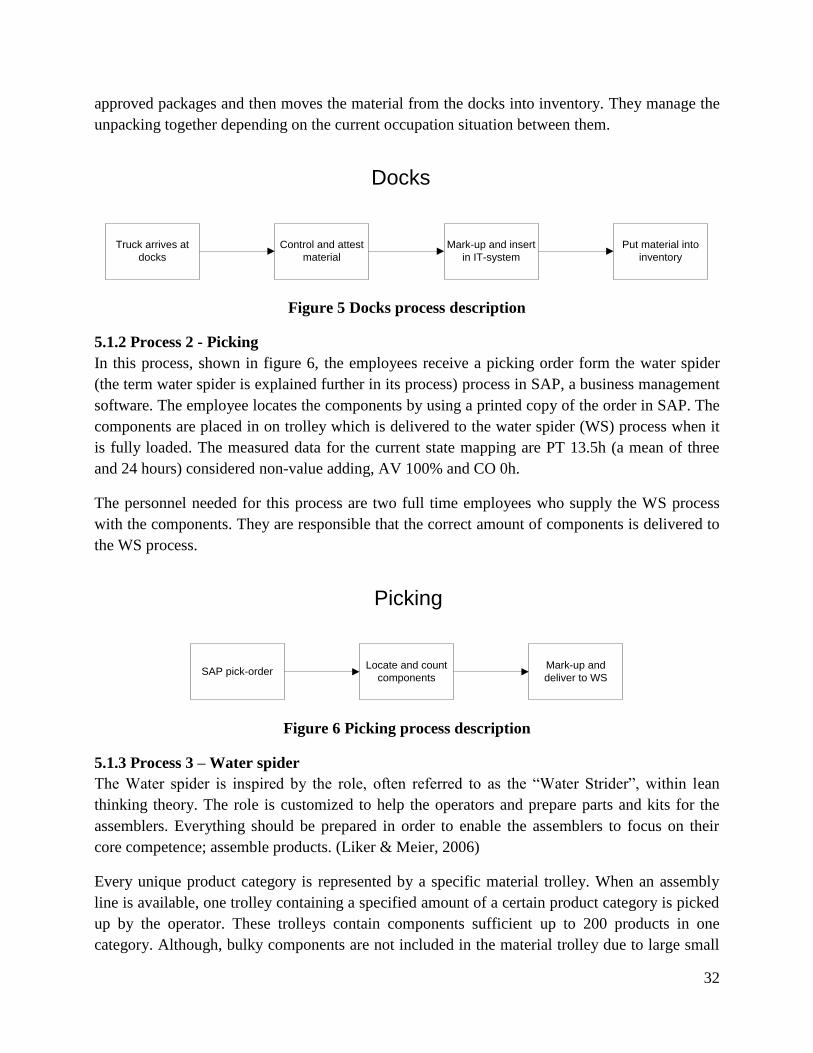
5.1.2 Process 2 - Picking
In this process, shown in figure 6, the employees receive a picking order form the water spider
(the term water spider is explained further in its process) process in SAP, a business management
software. The employee locates the components by using a printed copy of the order in SAP. The
components are placed in on trolley which is delivered to the water spider (WS) process when it
is fully loaded. The measured data for the current state mapping are PT 13.5h (a mean of three
and 24 hours) considered non-value adding, AV 100% and CO 0h.
The personnel needed for this process are two full time employees who supply the WS process
with the components. They are responsible that the correct amount of components is delivered to
the WS process.
SAP pick-orderMark-up and
deliver to WS
Locate and count
components
Picking
Figure 6 Picking process description
5.1.3 Process 3 – Water spider
The Water spider is inspired by the role, often referred to as the “Water Strider”, within lean
thinking theory. The role is customized to help the operators and prepare parts and kits for the
assemblers. Everything should be prepared in order to enable the assemblers to focus on their
core competence; assemble products. (Liker & Meier, 2006)
Every unique product category is represented by a specific material trolley. When an assembly
line is available, one trolley containing a specified amount of a certain product category is picked
up by the operator. These trolleys contain components sufficient up to 200 products in one
category. Although, bulky components are not included in the material trolley due to large small
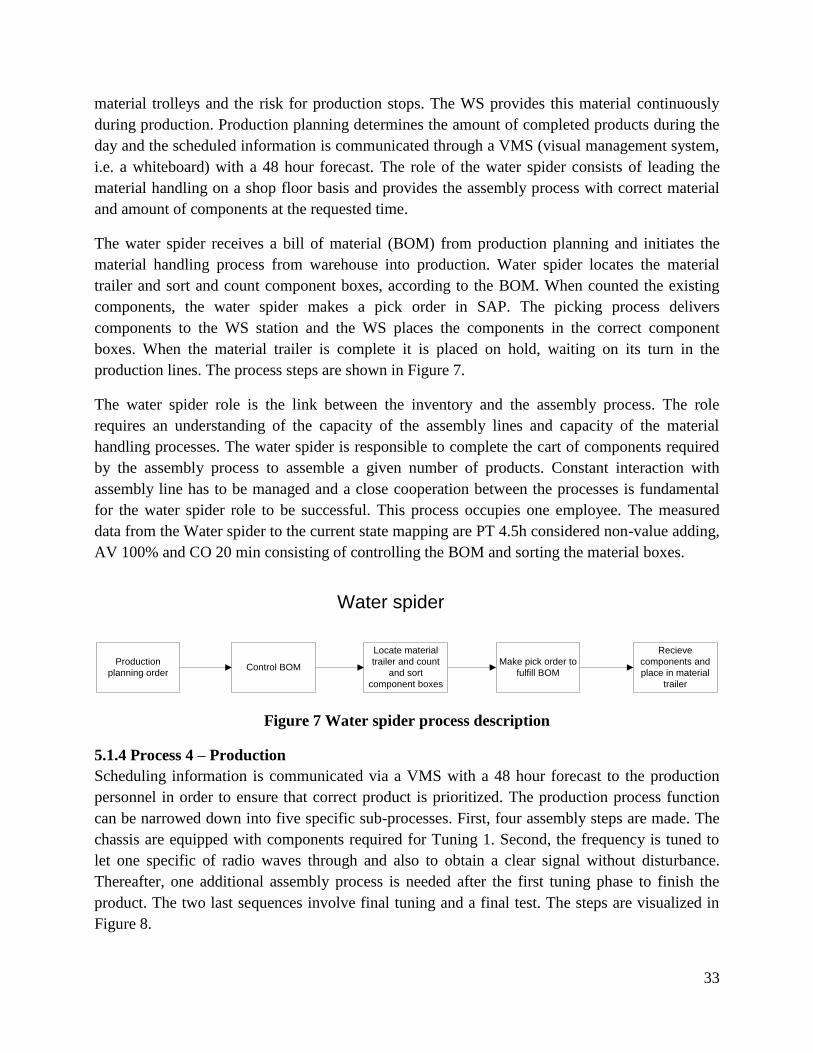
33
material trolleys and the risk for production stops. The WS provides this material continuously
during production. Production planning determines the amount of completed products during the
day and the scheduled information is communicated through a VMS (visual management system,
i.e. a whiteboard) with a 48 hour forecast. The role of the water spider consists of leading the
material handling on a shop floor basis and provides the assembly process with correct material
and amount of components at the requested time.
The water spider receives a bill of material (BOM) from production planning and initiates the
material handling process from warehouse into production. Water spider locates the material
trailer and sort and count component boxes, according to the BOM. When counted the existing
components, the water spider makes a pick order in SAP. The picking process delivers
components to the WS station and the WS places the components in the correct component
boxes. When the material trailer is complete it is placed on hold, waiting on its turn in the
production lines. The process steps are shown in Figure 7.
The water spider role is the link between the inventory and the assembly process. The role
requires an understanding of the capacity of the assembly lines and capacity of the material
handling processes. The water spider is responsible to complete the cart of components required
by the assembly process to assemble a given number of products. Constant interaction with
assembly line has to be managed and a close cooperation between the processes is fundamental
for the water spider role to be successful. This process occupies one employee. The measured
data from the Water spider to the current state mapping are PT 4.5h considered non-value adding,
AV 100% and CO 20 min consisting of controlling the BOM and sorting the material boxes.
Production
planning order
Recieve
components and
place in material
trailer
Control BOM
Water spider
Make pick order to
fulfill BOM
Locate material
trailer and count
and sort
component boxes
Figure 7 Water spider process description
5.1.4 Process 4 – Production
Scheduling information is communicated via a VMS with a 48 hour forecast to the production
personnel in order to ensure that correct product is prioritized. The production process function
can be narrowed down into five specific sub-processes. First, four assembly steps are made. The
chassis are equipped with components required for Tuning 1. Second, the frequency is tuned to
let one specific of radio waves through and also to obtain a clear signal without disturbance.
Thereafter, one additional assembly process is needed after the first tuning phase to finish the
product. The two last sequences involve final tuning and a final test. The steps are visualized in
Figure 8.
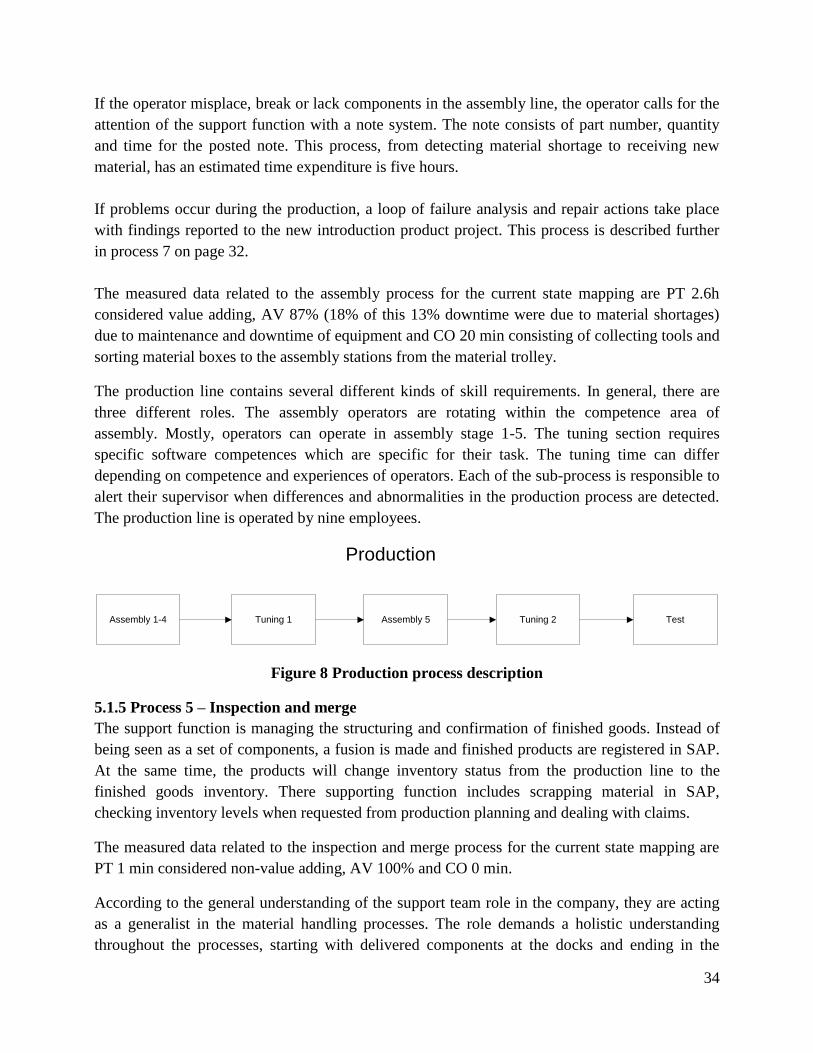
34
If the operator misplace, break or lack components in the assembly line, the operator calls for the
attention of the support function with a note system. The note consists of part number, quantity
and time for the posted note. This process, from detecting material shortage to receiving new
material, has an estimated time expenditure is five hours.
If problems occur during the production, a loop of failure analysis and repair actions take place
with findings reported to the new introduction product project. This process is described further
in process 7 on page 32.
The measured data related to the assembly process for the current state mapping are PT 2.6h
considered value adding, AV 87% (18% of this 13% downtime were due to material shortages)
due to maintenance and downtime of equipment and CO 20 min consisting of collecting tools and
sorting material boxes to the assembly stations from the material trolley.
The production line contains several different kinds of skill requirements. In general, there are
three different roles. The assembly operators are rotating within the competence area of
assembly. Mostly, operators can operate in assembly stage 1-5. The tuning section requires
specific software competences which are specific for their task. The tuning time can differ
depending on competence and experiences of operators. Each of the sub-process is responsible to
alert their supervisor when differences and abnormalities in the production process are detected.
The production line is operated by nine employees.
Assembly 1-4 TestTuning 1
Production
Tuning 2Assembly 5
Figure 8 Production process description
5.1.5 Process 5 – Inspection and merge
The support function is managing the structuring and confirmation of finished goods. Instead of
being seen as a set of components, a fusion is made and finished products are registered in SAP.
At the same time, the products will change inventory status from the production line to the
finished goods inventory. There supporting function includes scrapping material in SAP,
checking inventory levels when requested from production planning and dealing with claims.
The measured data related to the inspection and merge process for the current state mapping are
PT 1 min considered non-value adding, AV 100% and CO 0 min.
According to the general understanding of the support team role in the company, they are acting
as a generalist in the material handling processes. The role demands a holistic understanding
throughout the processes, starting with delivered components at the docks and ending in the
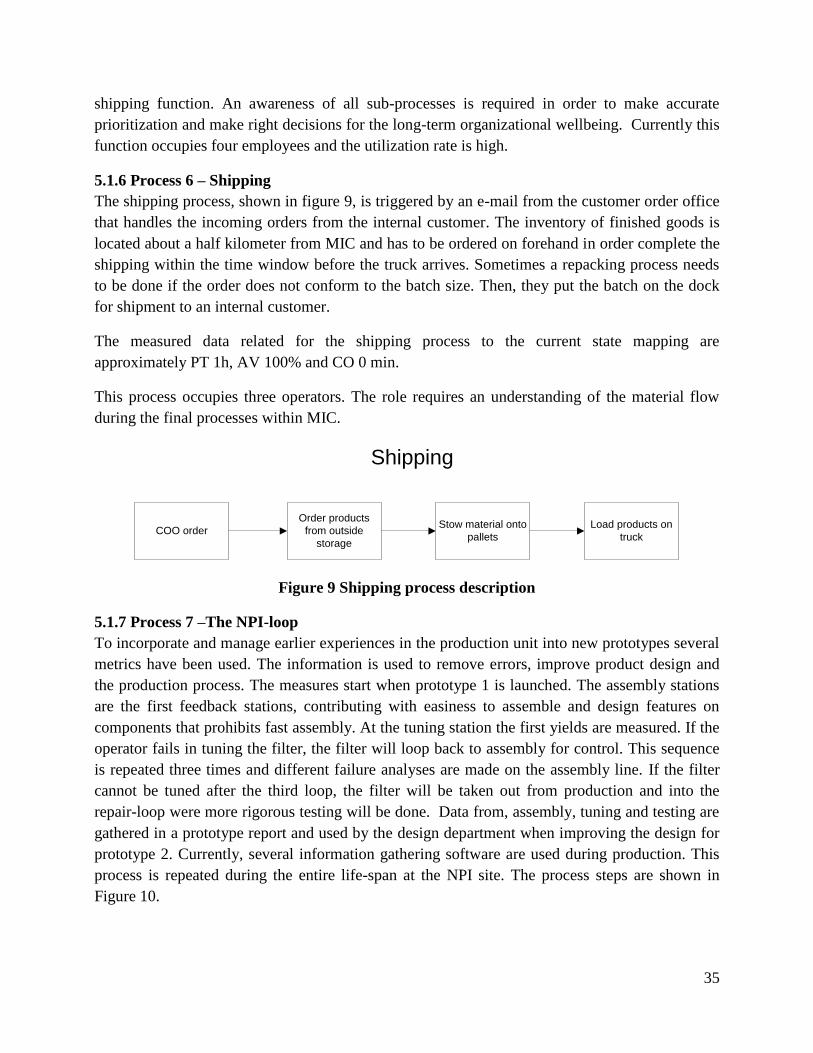
35
shipping function. An awareness of all sub-processes is required in order to make accurate
prioritization and make right decisions for the long-term organizational wellbeing. Currently this
function occupies four employees and the utilization rate is high.
5.1.6 Process 6 – Shipping
The shipping process, shown in figure 9, is triggered by an e-mail from the customer order office
that handles the incoming orders from the internal customer. The inventory of finished goods is
located about a half kilometer from MIC and has to be ordered on forehand in order complete the
shipping within the time window before the truck arrives. Sometimes a repacking process needs
to be done if the order does not conform to the batch size. Then, they put the batch on the dock
for shipment to an internal customer.
The measured data related for the shipping process to the current state mapping are
approximately PT 1h, AV 100% and CO 0 min.
This process occupies three operators. The role requires an understanding of the material flow
during the final processes within MIC.
COO order
Order products
from outside
storage
Shipping
Load products on
truck
Stow material onto
pallets
Figure 9 Shipping process description
5.1.7 Process 7 –The NPI-loop
To incorporate and manage earlier experiences in the production unit into new prototypes several
metrics have been used. The information is used to remove errors, improve product design and
the production process. The measures start when prototype 1 is launched. The assembly stations
are the first feedback stations, contributing with easiness to assemble and design features on
components that prohibits fast assembly. At the tuning station the first yields are measured. If the
operator fails in tuning the filter, the filter will loop back to assembly for control. This sequence
is repeated three times and different failure analyses are made on the assembly line. If the filter
cannot be tuned after the third loop, the filter will be taken out from production and into the
repair-loop were more rigorous testing will be done. Data from, assembly, tuning and testing are
gathered in a prototype report and used by the design department when improving the design for
prototype 2. Currently, several information gathering software are used during production. This
process is repeated during the entire life-span at the NPI site. The process steps are shown in
Figure 10.
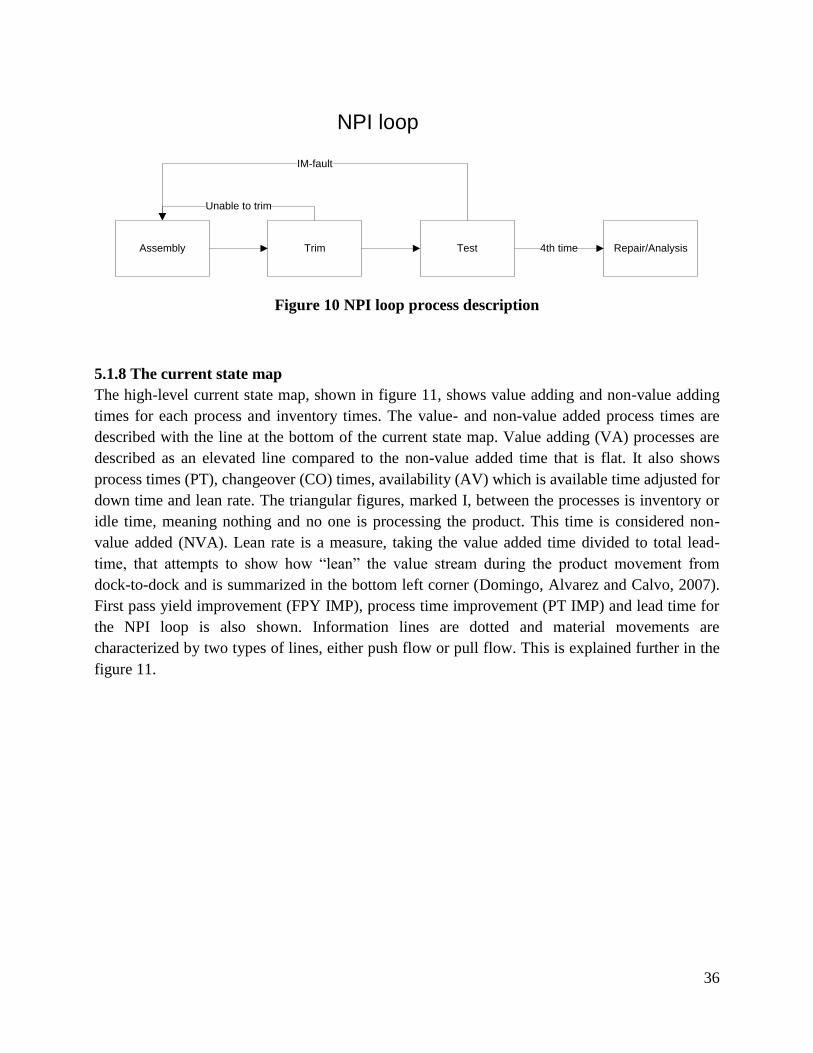
36
Assembly Trim
NPI loop
Repair/Analysis4th time
Unable to trim
Test
IM-fault
Figure 10 NPI loop process description
5.1.8 The current state map
The high-level current state map, shown in figure 11, shows value adding and non-value adding
times for each process and inventory times. The value- and non-value added process times are
described with the line at the bottom of the current state map. Value adding (VA) processes are
described as an elevated line compared to the non-value added time that is flat. It also shows
process times (PT), changeover (CO) times, availability (AV) which is available time adjusted for
down time and lean rate. The triangular figures, marked I, between the processes is inventory or
idle time, meaning nothing and no one is processing the product. This time is considered non-
value added (NVA). Lean rate is a measure, taking the value added time divided to total lead-
time, that attempts to show how “lean” the value stream during the product movement from
dock-to-dock and is summarized in the bottom left corner (Domingo, Alvarez and Calvo, 2007).
First pass yield improvement (FPY IMP), process time improvement (PT IMP) and lead time for
the NPI loop is also shown. Information lines are dotted and material movements are
characterized by two types of lines, either push flow or pull flow. This is explained further in the
figure 11.
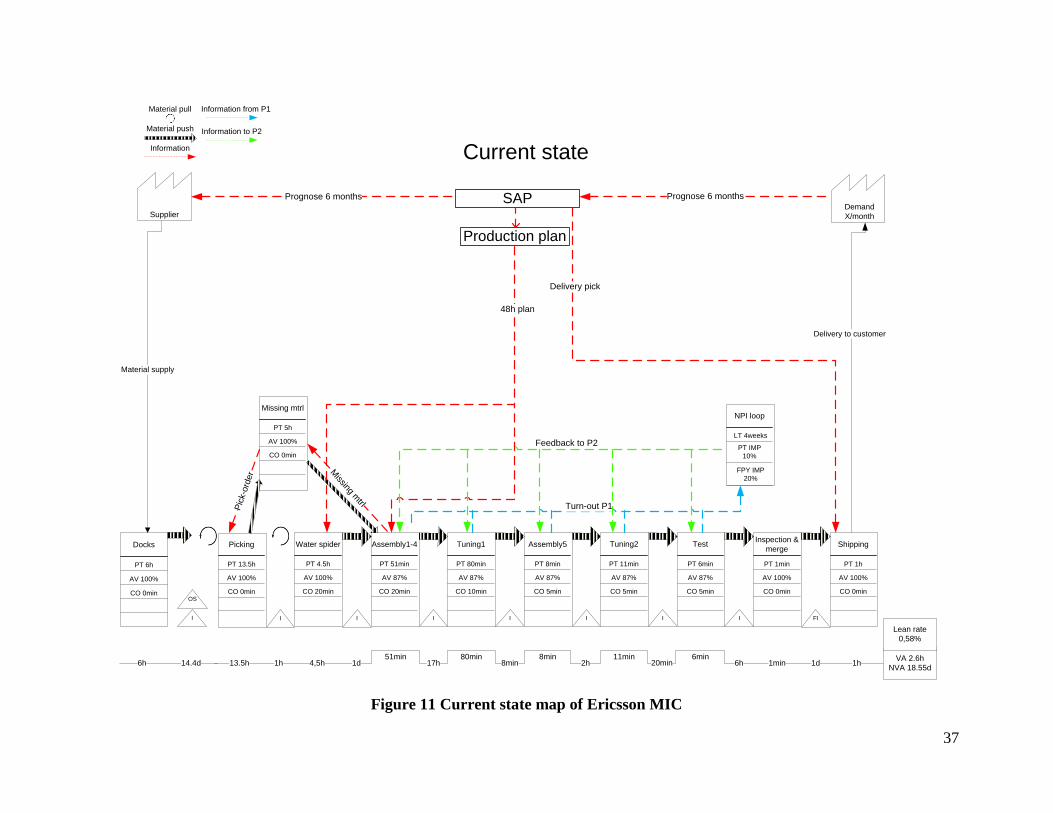
37
Production plan
Docks
PT 6h
AV 100%
CO 0min
I
OS
Water spider
PT 4.5h
AV 100%
CO 20min
I
Assembly1-4
PT 51min
AV 87%
CO 20min
I
Tuning1
PT 80min
AV 87%
CO 10min
I
Assembly5
PT 8min
AV 87%
CO 5min
I
Tuning2
PT 11min
AV 87%
CO 5min
I
Test
PT 6min
AV 87%
CO 5min
I
Inspection &
merge
PT 1min
AV 100%
CO 0min
FI
Shipping
PT 1h
AV 100%
CO 0min
Picking
PT 13.5h
AV 100%
CO 0min
I
Missing mtrl
PT 5h
AV 100%
CO 0min
Information
Material push
Material pull
6h 14.4d 13.5h 1h 4,5h
Current state
SAPSupplier
Prognose 6 monthsPrognose 6 monthsDemand
X/month
48h plan
1d 17h80min
8min8min
2h11min
20min6min
6h 1min 1d 1h51min
Material supply
Delivery to customer
Missing m
trl
Pic
k-ord
er
VA 2.6h
NVA 18.55d
NPI loop
LT 4weeks
PT IMP
10%
Feedback to P2
FPY IMP
20%
Turn-out P1
Information from P1
Information to P2
Lean rate
0,58%
Delivery pick
Figure 11 Current state map of Ericsson MIC
38
5.2 Analysis of current state
The current state confirms inconsistency in the internal logistic process. Several hand-over steps
before the material reaches production results in long lead times in the material handling process.
Suppliers struggle with their own ramp-up, leading to insufficient volumes and low quality on
components. The production process presents large amounts of work in progress due to the
uncertainty in the production process and the dynamic tact-time caused by the different products.
5.2.1 Process 1 - Docks
The suppliers lack the knowledge and equipment of dealing with electro static discharge
approved packaging, leading to unnecessary workload for the dock personnel. There are also
quality issues when components are arriving in unprotected packaging, the components could be
damaged and unfit for use in the production. The material supply circumstances produce a high
level of uncertainty due to different low volume supplier delivery delays and component
cassations.
5.2.2 Process 2 - Picking
The usual issues in the daily work include stock differences between SAP and the actual number
of components in stock. Components that are to be assembled within 24h may not exist in stock
even though they are available in SAP. This creates the need for frequent stocktaking and an
uncertainty in the system. To cope with the tight scheduling every assembly line has to run even
though these kinds of errors occurs. Therefore, an alternative product are arranged sometimes to
ensure the utilization rate of the assembly lines.
Another issue is that components are sorted by inventory location in SAP. This is ideal for fast
picking of material, which is good, but also creates long lead times for completing a material
trolley. Consider if the water spider creates a pick order in SAP for three products when the 48
hour plan is updated. The lead time to the first completed material trolley is the same as the lead
time for completing three material trolleys.
When placing several pick orders in SAP they are mixed together, making prioritizing between
different products difficult. This is an issue in NPI environments were uncertainties creates the
need to re-prioritize production. When the need to adjust the production plan, which is a frequent
event at Ericsson MIC, there is no way of distinguish the production order in SAP. Furthermore,
it is not possible to see the destination of products in the system, contributing to unnecessary
movements.
A spaghetti diagram, table 1, shows the length in meters material handling personnel has to travel
in order to complete an order. The picking personnel must control the pick order in SAP and then
locate the material in the inventory shuttles, i.e. S1. The distance between the computer showing
the pick order in SAP and the inventory is measured. The distance between the computer and S1
was five meters, back-and-forth ten meters. The last inventory is the water spider station when
the pick personnel deliver the components to the water spider. As stated in the theoretical
39
framework this is an efficiency measure to evaluate the layout and identify waste in the material
handling. The growth in product variety will increase the amount of picks made every day. Even
though the volume remains constant, i.e. total throughput from production unit remains constant,
there will be additional changeovers to handle to high variety. The time to complete a material
trolley for 30 products is similar to complete a 60 product material trolley because the majority of
the time spent on picking is on locating the material, not picking 30 or 60 components.
Table 1 Compilation of spaghetti diagram
Inventory Distance (m) Pick/month Pick/day Distance/day
S1 10 608 29 290
S2 6 608 29 174
S3 10 608 29 290
S4 20 608 29 579
S5 44 608 29 1274
S6 8 608 29 232
Water spider station 40 608 4,8 193
Sum 3030m
5.2.3 Process 3 – Water spider
The current state analysis indicates that there are several problems within the water spider
function. First, vague responsibility areas makes it unclear whether an operation is included in the
water spider function responsibility or should be done by other process areas as the assembly line
or other supporting functions. Second, an increase in product customization will drive the product
variety further. Hence, this role will be even more occupied in the future. Third, the assembly
personnel do not put the boxes back on the material trolley in the initial position creating
unnecessary an unnecessary task for the water spider. The constant rearrange of the boxes in the
trolley when it returns from the assembly line, either after a successful completion of a product
series or an identification of an error, results in a waste of time. Fourth, all of the issues stated in
the picking process are viable in the water spider process also.
5.2.4 Process 4 – Production
The production process presents several issues that need to be addressed. First, the changeover
time is high when considering the complexity of the changeover. When product variety increases
the demand for fast changeovers will become evident. Second, stops in the production process
can be generated by operators that identify errors during the production line. Today this takes too
long when considering that if the problem occurs in the last phase it will affect all work in
progress (WIP) that have been initiated and have to be disassembled. This fact creates major
wastes in the production unit. On the other hand one has to return to the main purpose of the
factory as developer of new products for production. This causes a trade-off, also stated in theory
Hopp & Spearman (2000) and Spear & Bowen (1999), between production throughput and yield.
The production process has to involve delousing of product constructions in order to achieve a
qualitative high volume production. Third, the diversified products differ in processing time and
40
different tact-times will be optimal for different products, also contributing to high buffer levels
in between processes.
5.2.5 Process 5 – Inspection and merge
As mentioned above, the yield uncertainty generates trolley stocking between the WS and
assembly processes. The vague responsibility roles make it unclear which function that is
responsible for the increased amount of material trolleys when problems in the production
processes occur. In theory, the support function is the owner of this process but has not
completed the task due to the high utilization rate and shortage of labor. The lack of clear
responsibilities and roles prosper handovers and re-work.
5.2.6 Process 6 – Shipping
There is currently a small sidestep from the standard way of working in this process. If an order
is scheduled to be shipped during the day, the personnel are storing the finished products at the
docks even though it is registered in the storage for finished goods about a half kilometer away.
5.2.7 Process 7 – The NPI-loop
The purpose of the NPI loop is to use earlier experiences in the assembly process to improve later
product assemblies. At the time for the current state map, there were several issues related to this
loop of knowledge. First, there are multiple software tools for the error reporting procedure,
making it unnecessary complex to report deviations. Second, several problems are not fixed after
one loop iteration and returns in the next one. The third identified weakness is related to the
efficiency measurement of the information handling processes between the prototype assemblies.
There is a lack of measures related to the information and knowledge of which measures that suit
the unique situation. It is important to measure process performance in process management
(Krishnan & Ulrich, 2001).
5.3 Future state map
With the foundation of a theoretical analysis, combined with an empirical research, a future
direction for the material handling and production unit has been decided. The theory has been
used for definition, examination and evaluation of the VSM tool. Together with the contextual
circumstances including internal observations and benchmarking analysis, the strategy has been
designed to fit Ericsson MIC in the pursuit of operational excellence.
The material handling sub-processes have been analyzed and several changes have been made
compared to the former state. These changes are showed in Figure 6, the future state map, and are
explained more detailed in this chapter.
5.3.1 Process 1 - Docks
The dock function has the same areas of responsibility as in the current state. Although, the
potential of improvement activities has been lower than other functions in this material handling
process with a VSM approach, some improvements are suggested. The material transports from
the outside storage has fixed delivery schedule, making the lead-time unnecessary long. If the
41
schedule was to be removed and the transport would run continuously, shortening the lead-time
with two hours would be possible. This is not possible today due the contract with the warehouse
and will therefore not be adjusted in the future state map. An extra employee is proposed
ensuring incoming quality. This is an additional cost but the reduction in uncertainty and
furthermore issues with material can be detected at an early stage. When considering the
downtime in production caused by material issues (18%*13%=2.34%) not all of these will be
solved by this measure. After a successful implementation of the following proposed
improvement actions may possible improvements in this function become more visualized and
obvious. The expected data related to the docks process for the future state mapping are
approximately PT 6h, AV 100% and CO 0 min. The figures have not changed from the current
state map.
5.3.2 Process 2 – Water spider
The most significant process change has been done in relation to the water spider and picking
process. A fusion of the Water spider and picking processes has been made. Furthermore, some
of the responsibility areas have been moved from the support function to the water spider. In
essence, there has been both a backwards and forward integration of responsibility areas. The
responsibility area will stretch from the received bill of material (BOM) to complete delivery to
the production process. As in the initial state, the water spider operator receives a BOM, prints
out a copy of it and connects it to a specific material trolley. The operator collects all of the
components in the BOM, sorted by storage place for optimal collecting time, from the main
storage and puts them on the trolley. Using 5S, suggested by Liker (2004), components will be
sorted in production process order. The first assembly station components are put on the first
shelf etc. This enables the production operators to reduce changeover time, spending as short
time as possible finding the right component box. Parallels can be drawn to the internal
benchmarking in Katrineholm, reported in Appendix 1, where they picked the components using
a BOM for a specific product.
Implications of the proposed operational improvements will include a drastic increase of
workload in the process, from one water spider in the former state, to three water spiders. This
increase in workload is defendable due to the redundant employees in support function and
picking processes when operational responsibilities are moved to the water spider process.
Further implications incorporate less material hand-overs and possibilities of communication
failures. This is supported by Bicheno (2007) that states that hand-overs are root to waste.
The picking process absence results in a more visible prioritizing scheme. Instead of a picking
function that picks components to different product trolleys in the same order as it is sorted in
SAP, the WS picks every item connected to one product production procedure. The responsibility
area is moved to be product batch specific instead of parts of different product trolleys. If one
product is prioritized, it is clear what components that is to be picked first. This is related to
level-scheduling (Rother & Shook, 1998), instead of having three material trolleys completed at
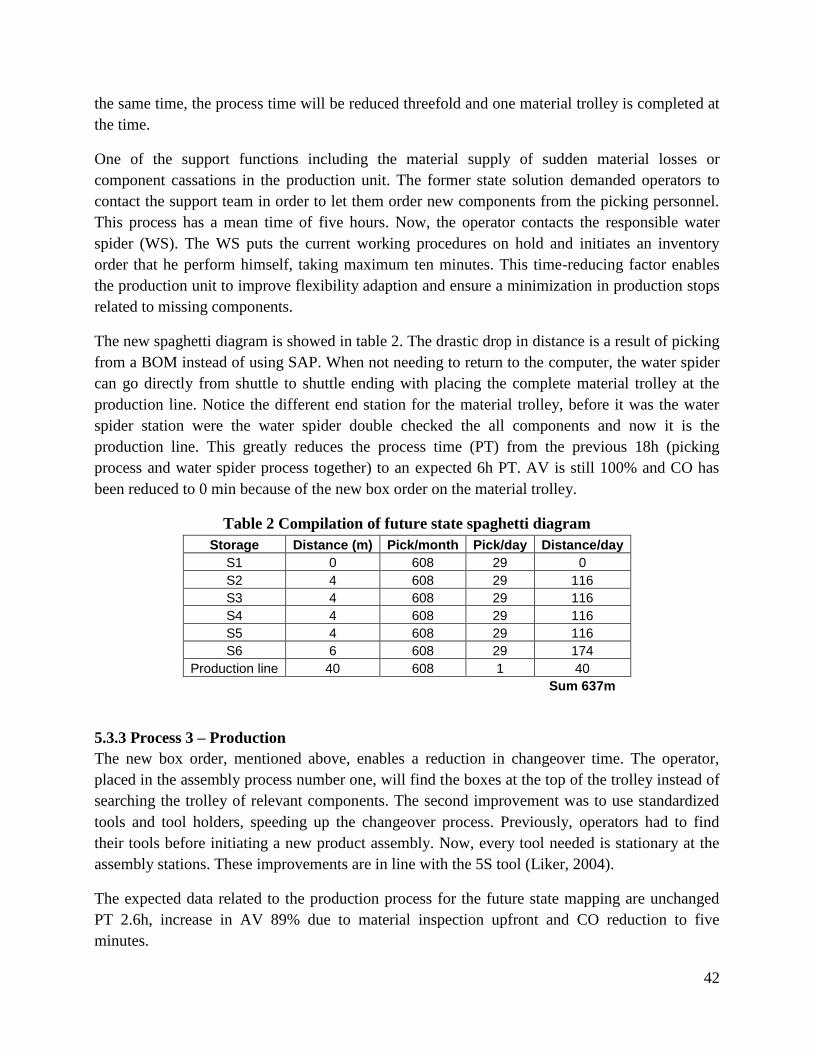
42
the same time, the process time will be reduced threefold and one material trolley is completed at
the time.
One of the support functions including the material supply of sudden material losses or
component cassations in the production unit. The former state solution demanded operators to
contact the support team in order to let them order new components from the picking personnel.
This process has a mean time of five hours. Now, the operator contacts the responsible water
spider (WS). The WS puts the current working procedures on hold and initiates an inventory
order that he perform himself, taking maximum ten minutes. This time-reducing factor enables
the production unit to improve flexibility adaption and ensure a minimization in production stops
related to missing components.
The new spaghetti diagram is showed in table 2. The drastic drop in distance is a result of picking
from a BOM instead of using SAP. When not needing to return to the computer, the water spider
can go directly from shuttle to shuttle ending with placing the complete material trolley at the
production line. Notice the different end station for the material trolley, before it was the water
spider station were the water spider double checked the all components and now it is the
production line. This greatly reduces the process time (PT) from the previous 18h (picking
process and water spider process together) to an expected 6h PT. AV is still 100% and CO has
been reduced to 0 min because of the new box order on the material trolley.
Table 2 Compilation of future state spaghetti diagram
Storage Distance (m) Pick/month Pick/day Distance/day
S1 0 608 29 0
S2 4 608 29 116
S3 4 608 29 116
S4 4 608 29 116
S5 4 608 29 116
S6 6 608 29 174
Production line 40 608 1 40
Sum 637m
5.3.3 Process 3 – Production
The new box order, mentioned above, enables a reduction in changeover time. The operator,
placed in the assembly process number one, will find the boxes at the top of the trolley instead of
searching the trolley of relevant components. The second improvement was to use standardized
tools and tool holders, speeding up the changeover process. Previously, operators had to find
their tools before initiating a new product assembly. Now, every tool needed is stationary at the
assembly stations. These improvements are in line with the 5S tool (Liker, 2004).
The expected data related to the production process for the future state mapping are unchanged
PT 2.6h, increase in AV 89% due to material inspection upfront and CO reduction to five
minutes.
43
5.3.4 Process 4 – Shipping
Aiming for as smooth value stream flow as possible, the shipping process has been extended to
include the process one step earlier in the value stream, inspection and merge. The process
ensures the amount of finished goods and moving them virtually, in SAP, to the finished goods
inventory. Instead of having to communicate with the support function, currently moving the
physical products, they will realize by themselves when products are ready for shipping.
The expected data related to the shipping process for the future state mapping are approximately
PT 1h, AV 100% and CO 0 min, the same figures as in the current state map.
5.3.5 Process 7 – The NPI-loop
Efficiency measurements have to be introduced in order to evaluate the NPI loop performance.
First pass yield increase in relation to previous prototype, process time reduction in relation to
previous prototype and lead time of the iteration the next prototype have been added. The
proposed measure for the NPI loop is related to the NPI loop lead time which is crucial for the
lead time in the NPI projects involving several of these feedback loops. Therefore, lead time
reductions will have a direct impact on NPI project lead time, which in turn, have an impact of
the product ramp-up process. This measure has been introduced as an efficiency performance
measure in order to evaluate the temporary performance and for comparison with earlier NPI
loops. First pass yield was identified, by Terwiesch, Bohn and Chea (2001), is the single best
measure of line performance and has therefore been added. Process lead time is a good indicator
of product and process understanding according to Terwiesch and Bohn (2001) and Terwiesch
and Xu (2004). This is of course not entirely new measures to Ericsson MIC, although the way of
using them is new. With this information in the high-level description of a product in production,
generated by the VSM tool, it is possible to:
Compare outcomes from different prototypes
Why is one prototype showing greater improvement than others?
Evaluate information parameters
What is the effect on improvement of this hard to collect information is excluded?
Assess tools and equipment
Prototypes industrialized on line 1 are performing better than line 2. Is it because of new
tools or untested equipment?
Assess workforce and way of working
Shift 1 prototypes shows faster process time improvement? Is there a knowledge gap or
another way of working?
5.3.6 Future state map
Again the explanation of the high-level current state map, shown in figure 12. It shows value
adding and non-value adding times for each process and inventory times. The value- and non-
44
value added process times are described with the line at the bottom of the current state map.
Value adding (VA) processes are described as an elevated line compared to the non-value added
time that is flat. It also shows process times (PT), changeover (CO) times, availability (AV)
which is available time adjusted for down time and lean rate. The triangular figures, marked I,
between the processes is inventory or idle time, meaning nothing and no one is processing the
product. This time is considered non-value added (NVA). Lean rate is a measure, taking the value
added time divided to total lead-time, that attempts to show how “lean” the value stream during
the product movement from dock-to-dock and is summarized in the bottom left corner (Domingo,
Alvarez and Calvo, 2007). First pass yield improvement (FPY IMP), process time improvement
(PT IMP) and lead time for the NPI loop is also shown. Information lines are dotted and material
movements are characterized by two types of lines, either push flow or pull flow. New in this
map is the improvements are highlighted with kaizen bubbles accordingly with Rother and
Shook, (1998) methodology.
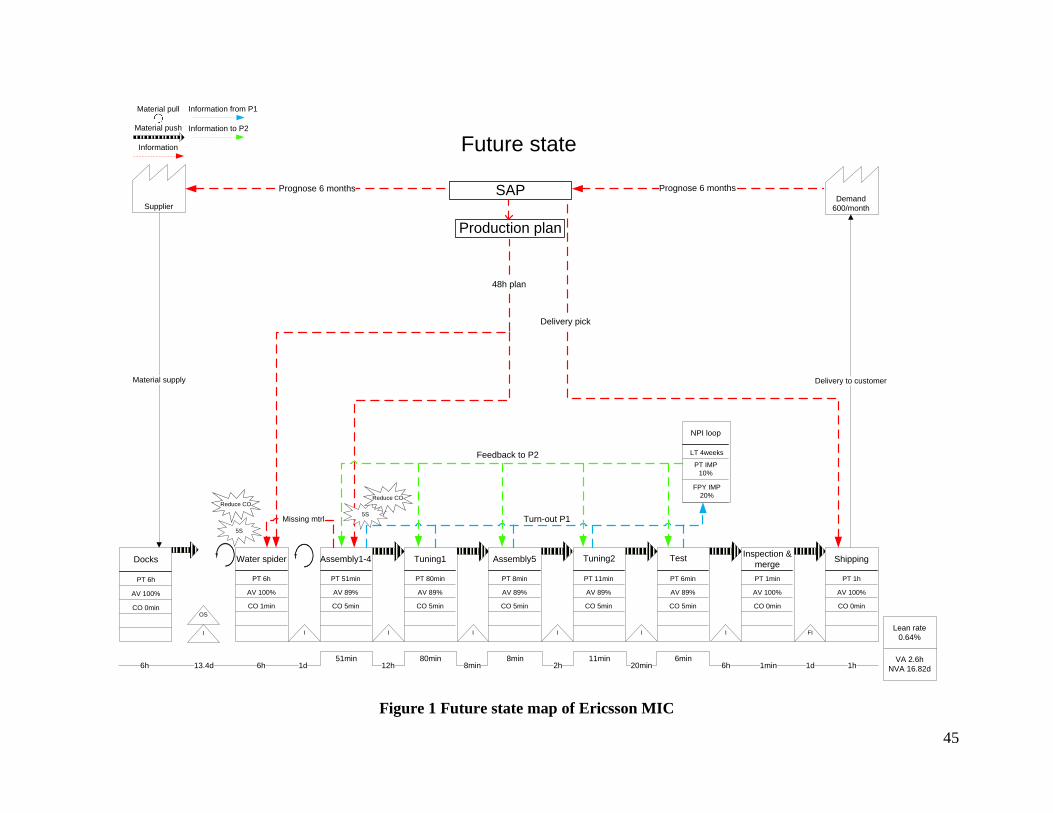
45
Docks
PT 6h
AV 100%
CO 0min
I
OS
Water spider
PT 6h
AV 100%
CO 1min
I
Assembly1-4
PT 51min
AV 89%
CO 5min
I
Tuning1
PT 80min
AV 89%
CO 5min
I
Assembly5
PT 8min
AV 89%
CO 5min
I
Tuning2
PT 11min
AV 89%
CO 5min
I
Test
PT 6min
AV 89%
CO 5min
I
Inspection &
merge
PT 1min
AV 100%
CO 0min
FI
Shipping
PT 1h
AV 100%
CO 0min
Production plan
Future state
48h plan
SAP
Missing mtrl
Information
Material push
Material pull
Supplier
Prognose 6 monthsPrognose 6 monthsDemand
600/month
6h 13.4d 6h 1d51min
12h80min
8min8min 11min
20min6min
6h 1d1min 1hVA 2.6h
NVA 16.82d
5S
Reduce CO
Feedback to P2
Turn-out P1
Information from P1
Information to P2
2h
Lean rate
0.64%
5S
Reduce CO
Delivery to customerMaterial supply
NPI loop
LT 4weeks
PT IMP
10%
FPY IMP
20%
Delivery pick
Figure 1 Future state map of Ericsson MIC
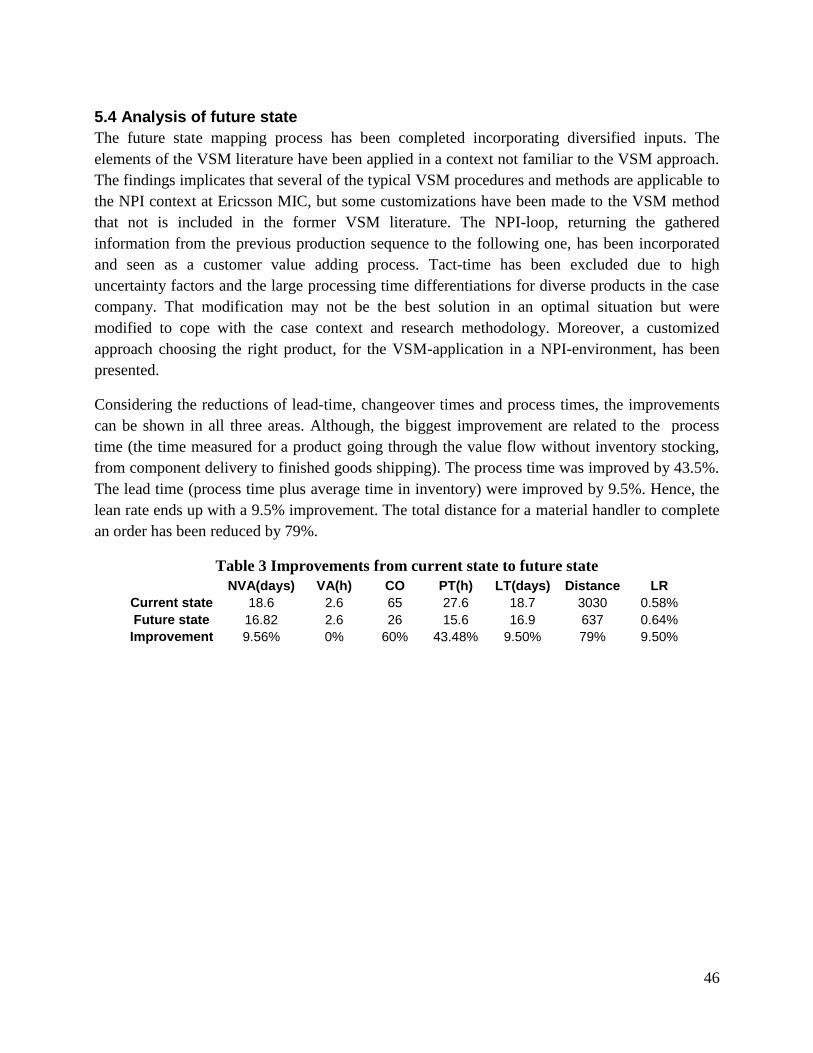
46
5.4 Analysis of future state
The future state mapping process has been completed incorporating diversified inputs. The
elements of the VSM literature have been applied in a context not familiar to the VSM approach.
The findings implicates that several of the typical VSM procedures and methods are applicable to
the NPI context at Ericsson MIC, but some customizations have been made to the VSM method
that not is included in the former VSM literature. The NPI-loop, returning the gathered
information from the previous production sequence to the following one, has been incorporated
and seen as a customer value adding process. Tact-time has been excluded due to high
uncertainty factors and the large processing time differentiations for diverse products in the case
company. That modification may not be the best solution in an optimal situation but were
modified to cope with the case context and research methodology. Moreover, a customized
approach choosing the right product, for the VSM-application in a NPI-environment, has been
presented.
Considering the reductions of lead-time, changeover times and process times, the improvements
can be shown in all three areas. Although, the biggest improvement are related to the process
time (the time measured for a product going through the value flow without inventory stocking,
from component delivery to finished goods shipping). The process time was improved by 43.5%.
The lead time (process time plus average time in inventory) were improved by 9.5%. Hence, the
lean rate ends up with a 9.5% improvement. The total distance for a material handler to complete
an order has been reduced by 79%.
Table 3 Improvements from current state to future state
NVA(days) VA(h) CO PT(h) LT(days) Distance LR
Current state 18.6 2.6 65 27.6 18.7 3030 0.58%
Future state 16.82 2.6 26 15.6 16.9 637 0.64%
Improvement 9.56% 0% 60% 43.48% 9.50% 79% 9.50%
47
6. Discussion
In this section, theory and empirical research are connected and analyzed to draw general
conclusions.
The research has been focused of the usage of VSM in NPI environment. In order to successfully
analyze the area, a new way of choosing products has been provided, also key elements of value
stream mapping method has been excluded. This thesis has also incorporated the information
loop, the core of new product development, and evaluated the performance of it.
How can the VSM method be used in the NPI context?
This research deals with two dominating features within the NPI and VSM. First, the intrinsic
context of the NPI environment, with high variety, low volume and high uncertainties, undermine
the validity when using the VSM method. Second, the information in the iterative NPI process is
considered non-value adding with the definition of customer value in the VSM method. During
the ongoing research an evaluation of how the VSM method can be used in the NPI environment,
considering both context specific material flow and information flow features. This thesis work
differs from previous works of Braglia et al. (2009) and McManus (2005) since the two features
have been addressed independently.
A new way of choosing the product for the mapping procedure has been suggested and an
evaluation tool of the performance of the NPI process has been incorporated in the VSM
approach. With this information it is possible to compare outcomes from different prototypes,
evaluate information parameters, assess tools, equipment and workforce. The measure will not
explicitly tell how the NPI loop is performing. A 10 percent yield improvement is good on some
environments and poor in others. Moreover, the lead time depends on the complexity and amount
of information that needs to processed. Ericsson MIC has been used as a case study company in
this thesis. The information, collected by participant observations and interviews, from the case
company reflects the general conclusions drawn in this thesis.
The NPI loop have been incorporated to evaluate how earlier experiences in the production units
are taken care of when producing new prototypes of the same product. With these additional
measures, errors can be removed systematically, product design iterations can be faster and more
efficient and the production process deloused. This thesis has not evaluated the information in
non-value adding or value adding terms (look at e.g. McManus, 2005 or Haque & James-Moore,
2004). The contribution from this thesis strives to be a complement to their works and a widening
of their research. Instead of dealing with if the information possesses customer value, this new
approach will evaluate the effectiveness of the gathered information in the production process.
One of the central elements of VSM is related to shape a value flow that is adapted to a specific
tact time and break down customer demand into sequences. In that way, one can customize a
value flow into process blocks with standardized process time (Rother & Shook, 1998). If a
process presents higher lead times than the pacemaker processes identified, it must be eliminated
48
by different actions, i.e. 5S or adding extra employees to the processes. This is done to ensure a
smooth flow in the value stream. These thoughts may be applicable in some cases but not in the
Ericsson MIC plant. The material supply circumstances produce a high level of uncertainty due to
different low volume supplier delivery delays and component cassations. Moreover, the
diversified products differ in processing time and different tact-times will be optimal for different
products. Hence, tact time referencing has been excluded in the future state. Serrano Lasa et al.
(2009) underline the limited applicability of standardized production rhythm in complex
manufacturing systems. According to Hopp and Spearman (2000), variability is the main factor
that interferes with planning, which limits the VSM when formulating the future state. The
researchers recognize the benefits of using simulation software to validating the future state.
Braglia et al. (2009) declare that the VSM-method is unable to grasp all the variability problems
and give a detailed realistic vision of a production process. It is a necessity to frequently ad
supporting tools to the VSM method to cope with the high-variety and low-volume environment.
Moreover, the collection of different process lead times, inventory levels and operating variables
is more complex, thus the numerical values tend to be hard to verify and even harder to improve.
With the case company in mind, it would be imperious to believe that nothing can be improved in
a company situated in a high variety/low volume/uncertainty context and even though some
elements have been excluded in the future state, the improvement presented in the case company
is evidence of the benefits. This could of course be a statement of the case company condition,
more than showing the value of this approach. Although, when also considering the benchmarked
companies one could tell from Scania, who has worked with this approach for some years now,
that it is efficient. Tact-time, level-scheduling and pull systems have been excluded in the future
state due to the high number of different product types, processing times and uncertainties.
Hines, Holweg and Rich (2004) argue that whichever tool or technique that brings customer
value are in alignment with lean strategy. Moreover, the meaning that agile, responsive and other
quality approaches, even though fundamentally different from lean production, can be used as
wider strategy. One the other hand, core lean concepts such as level scheduling, kanban or tact
time must not be used when not contributing to overall performance (Hines, Holweg & Rich,
2004).
Several parts of the literature state that lead-time reductions and reduced inventory levels will
lead to improvement of, not only cost reduction practices, but handling uncertainty issues
(Hendry, 1998). When looking at the lead-time reduction resulting from this study, it is evident
that the material handling has become more efficient by being flexible. Furthermore, fewer hand-
over and clear responsibilities will lead to higher accuracy in delivery and better inventory
precision.
Application of VSM in NPI environments can generate a wider holistic view and create better
understanding of the important parts of the business (McDonald et al., 2002), meaning that sub-
optimizations in processes may occur in the daily activities but will not be generated when using
in the VSM tool. The supply unit can use the information to gain a better understanding of the
49
value created between the prototype production sequences. The Design and R&D unit will
understand the supply unit to a wider extent if the different value creation methods, both direct in
the assembly and indirect through the VSM-loop, are combined and visualized together. Instead
of seeing themselves as two separate parts, they can strive for the same goals and head in the
same direction seeing themselves as one supply unit.
The VSM method, presented by Rother and Shook (1998), is the most commonly used mapping
method within manufacturing environment and presents several advantages with respect to other
mapping techniques (Braglia et al., 2006). Haque and James-Moore (2004), argues that other
mapping techniques than VSM should be used in the NPI environment in order to capture the
entire complexity. Braglia et al. (2006) state that the accuracy of the VSM-method is limited in
high variety and low volume settings and the improving performance is low. In contrast, Rother
& Shook (1998) argues that the VSM-method still is applicable, despite the complexities and
high variety flows, if key elements are mapped and crossing flows are incorporated. This thesis
shows that improving performance could be high even if not using other methods.
Regarding continuous flow and reducing work-in-progress (WIP) in the NPI environment, there
are obvious benefits in lead-time and throughput. However, WIP after each process that not
reaches 100% yield will compensate for capacity losses if products not fulfill quality testing
(Hopp & Spearman, 2000). WIP between processes will reduce uncertainty, although more WIP
increases inventory costs and lead time. A consequence of allowing more WIP will generate more
cassations due to bad WIP once problems are detected (Terwiesch, & Bohn, 2001). There has to
be a trade-off between WIP buffer levels and the desired lead time. When considering case
company, WIP would not be addressed initially because of poor understanding of products.
Although when the product is more mature it would be beneficial to reduce the buffer levels
between processes. The general applicability of reducing of WIP in NPI sites must consider the
yields and uncertainty of the process. It is hard to draw general conclusions about WIP related to
NPI environments.
Buffering is considered as waste in material handling but it is necessary for coping with
variability and this fact may lead to variability problems when cutting inventory Adding features
to the current product mix should not be considered waste in spite of increased buffers and
reduced efficiency. (Spear & Bowen, 1999)
Which measures should be used in order to deal with NPI context and value of the NPI-
loop?
First pass yield, process time and lead time of the information loop were the suggested measures.
Even though the case company gathered two of the three measures, lead time for NPI loop was
not measured, the suggested way of using them was new.
Traditional customer value factors as quality and delivery accuracy can be related to the NPI
loop. The NPI-loop process can be seen as value adding in the VSM method because of e.g. a
50
possible yield and NPI-loop lead time improvement will raise the probability for the customer to
receive a qualitative product in time. Hence, the NPI-loop performance measurement factors
become central for customer value adding activities.
It is important to avoid low yields due to the economic effects during product ramp-up (McIvor,
1997). Moreover, low yields reveal gaps in the learning and understanding the processes (Bohn,
1994). This implicate, not only, that the economic success of a new product introduction are
highly dependent of early yield performance, but the yield is an indicator of low learning
capabilities or methods. Earlier knowledge can be reflected in higher yield if managed right.
Bohn & Terwiesch (1999) imply that the losses in possible revenue generated by low yield have a
bigger impact than costs during the ramp-up process. During this phase, first pass yields are the
single most important measurement factor (Terwiesch, Bohn, & Chea, 2001). Hence, this data
should be used in a NPI-context. Furthermore, this data can be used, not only to measure the
performance between a product’s Prototype 1 to Prototype 2 production sequences, but to
measure the specific yield performance compared to other products. Conclusions can be drawn,
linked to the yield performance, and be evaluated in the next prototype preface.
Yet, another argument to underline that the production unit could benefit from former knowledge,
when improving performance, is that learning is a cyclic procedure (Terwiesch & Bohn, 2001).
First pass yield was identified as the best production line performance indicator by Terwiesch,
Bohn and Chea (2001). Zangwill and Kantor (1998) state that learning can be seen as a cyclical
procedure, developing new skills and knowledge from one cycle and will be the starting point of
the next. They argue that every cycle can be interpreted as waste removing in the production and
material handling processes. These defects can generate low yield, unnecessary time waste or
production interruptions.
Another one of the most important measures is related to the project ramp-up time (Clark &
Fujimoto, 1991). If this time is derived into sub-processes, it is a measurement of the
accumulated cycle times in a few NPI loops. The NPI loop measurement is, therefore, an
essential part of the NPI-context performance measurement.
The last identified important measure is production speed. There is often a trade-off between
yield and production speed (throughput) (Spear & Bowen, 1999).
These performance measures are central for the NPI organization in order to compare product
ramp-up performance and to measure the performance of the VSM method in NPI environments.
These measures have to be incorporated in order to grasp the improved organizational
performance. With these measures it will be possible to:
Assess workforce and way of working
Assess tools and equipment
Evaluate information parameters
Compare outcomes from different prototypes
51
How can the value stream at Ericsson MIC be improved?
Ericsson MIC is a prototype and ramp-up production unit with a context related to the diffuse
region between R&D and volume production. They function as delousing and root cause analysis
department at the same time as being early supplier to important customers. The environment is
characterized by delivery uncertainties, low volumes, high variety and uncertainties in the
production process. Identification of the time consumed in value- and non-value added processes,
central to the VSM method, could be done and even though the environment puts the VSM
method in a number of difficult positions. Even so, the foundation of VSM is deemed applicable.
The relation between value and non-value added time (lean rate) is still relevant information
discovering unnecessary actions, providing proactive solutions in the value stream and meeting
customer expectations is still important to NPI sites. Although predicting a good lean rate and
benchmarking against other manufacturers will not be useful. Instead, it is a measure showing the
improvements from the current state to the future state. The creation of an understanding of how
the material supply, production process and information processing interact will help to pinpoint
focus areas for improvement in every company.
When looking at the lead-time reduction resulting from this study, it is evident that the material
handling has become more efficient and adaptable. Furthermore, fewer hand-over and clear
responsibilities will lead to higher accuracy in delivery and better inventory precision.
One of the central elements of VSM is related to shape a value flow that is adapted to a specific
tact time and break down customer demand into sequences (Hines & Rich, 1997). In that way,
one can customize value flow into process blocks with standardized process time (Rother &
Shook, 1998). These thoughts may be applicable in some cases but not in the Ericsson MIC plant.
The material supply situation founds a high level of uncertainty due to different low volume
supplier delivery delays and component cassations. Moreover, the different products differ in
processing time and the tact-time is dynamic, special for every product. Hence, tact time
referencing has been excluded in the future state. Serrano Lasa et al. (2009) underline the limited
applicability of standardized production rhythm in complex manufacturing systems. According to
Hopp and Spearman (2000), variability is the main factor that interfere with planning, limits the
VSM and has to considered during the mapping processes. Braglia et al. (2009) declare that the
VSM method is unable to grasp all the variability problems and give a detailed realistic vision of
a production process. It is a necessity to add supporting tools to the VSM method to cope with
the high-variety and low-volume environment. The collection of different process lead times,
inventory levels and operating variables is more complex, thus the numerical values tend to be
hard to verify and even harder to improve.
The lead time for material handling processes has been reduced using the VSM method. The
fusion of two processes, water spider and pick process, is the largest contributor the reducing lead
time. Now, water spiders pick components for one product batch at the time, in comparison to
before, picking components for multiple products simultaneously. This enables the Water spider
to collect the components closer to the production start, leading to reduction of total lead time and
52
enhances flexibility. Furthermore, prioritizing products is now possible when picking from the
BOM instead of following the pick list in SAP. You could argue that this approach for picking
material is more hazardous, relying on a piece of paper, than the previous method. The collected
data implies that the benefits of the approach will exceed impact of the increased risk.
The changeover time in production has been reduced placing the boxes in production assembly
order and using 5S. The box order has likewise made the Water spider faster when initiating a
product picking sequence. This changeover time reduction is crucial due to the high number of
production stops with product changes as a consequence. The accumulated time reduced in the
long run will be significant when adding these changeover times together. Considering the future
with increasing number of product variants, fast changeovers will become even more important.
Rother & Shook (1998) research implicate that the VSM will improve the flexibility performance
in a NPI-context. The improved system will enable the internal customer to change requested
product demand in a later stage, forcing Ericsson MIC to increase flexibility and still be satisfied
with the delivered goods. The combined improvements at Ericsson MIC enable the organization
to, not eliminate, but cope with the high variety and low volume context to a wider extent.
These kinds of improvements implicate that the customized VSM tool is a useful for performance
improvements in a NPI environment. Even though the VSM tool not is optimized for NPI
circumstances, it has been customized and used to improve the operational performance at
Ericsson MIC.
Limitations
Large corporations, like the studied company, may differ from other companies in other case-
based studies. A discussion of the validness in earlier case studies is useful in this specific case.
A valid approach for one type of company may not fit all. Additional case studies in the area are
needed to triangulate results and contribute to a general understanding of the application of VSM-
method in NPI contexts.
Another limitation of this study is that has not incorporated other mapping tools suggested by
other scholars as shown previously. They would be a good complement and strengthen validity
and reliability of the current and future state maps. Even so, this study shows that the use of VSM
in NPI environments is beneficial without using them.
53
7. Conclusions
This chapter presents the implications of this thesis and areas for future research.
This research deals with the twofold value contributors in a case company, on one hand the
processes that handling the production, on the other hand the iterations of information
contributing to a better product. The research has evaluated the value stream mapping method in
a new product introduction environment. In order to successfully do so, a new way of choosing
products related to the context has been provided, also key elements of value stream mapping
method has been excluded. This thesis has also incorporated the information loop, the core of
new product development, and evaluated the performance of it. In short, three significant
modifications have been made:
Due to the context of the NPI environment in high-tech industries, the product for mapping
must be chosen by different parameters. First it has to be in production during the mapping
phase. Second immature products, although often allocating less resources, are better to map
because of their coming future as lead products.
Tact-time has been excluded due to the high number of different product types, processing
times and uncertainties. The tact-time is dynamic and cannot decide the pace of the flow. For
same reasons has level-scheduling, continues flow and pull systems also been excluded.
The NPI-loop has been included because of the experiences of the earlier production
prototype sequences should be seen as value adding time. Moreover, the most important
measures related to the NPI loop has been identified as process lead time, first pass yield and
lead time for the information processing.
The case study has shown that VSM methods can be used beneficially in NPI environments. A
possible knowledge gap in the literature was found along the literature study related to
improvement of complex production systems in NPI environments and using the VSM method.
This gap became more explicit trying to find relevant literature that was supposed to be a
foundation to the improvement plan at Ericsson MIC. This thesis has not filled this gap of
knowledge completely. Nor has it emphasized to grasp all the complexities and elements
affecting VSM in a NPI site. Instead, it can be seen as a framework, and initial starting point, for
the management when improving the operational performance linked to the NPI-organizations
value adding processes.
7.1 Future research
Even though this thesis strive to form a framework for usage in NPI sites, theory still lacks
information of material handling and production processes in relation to the NPI context. This
research area has to be investigated further using more empirical studies to build valid and
reliable theory.
54
The weakness in this thesis is that no actual mapping of the value of information has been done.
This is of course necessary and to further evaluate the contribution of the VSM methodology for
mapping value at NPI sites. It would also be beneficial to investigate production against a
dynamic tact-time, meaning all processes including material handling is controlled by a
pacemaker process. In order to do so, information considering product, prototype stage, quantity,
supplier maturity and test equipment must be collected. A regression analysis of the result should
be done to determine which parameters have the biggest influence on process times. When the
tact-time has been decided a pull system and level-scheduling would also be possible to
implement.
55
References
Álvarez, R., Calvo, R., Peña, M., & Domingo, R., (2009). Redesigning an assembly line through
lean manufacturing tools, The International Journal of Advanced Manufacturing Technology,
vol. 43, No. 9, pp. 949-958
Alvesson, M. & Sköldberg, K. (1994) Tolkning och reflektion – Vetenskapsfilosofi och kvalitativ
metod. Lund: Studentlitteratur.
Arksey, H. & Knight, P. (1999) Interviewing social scientists. London: Sage.
Asthana, P. (1995). Jumping the Technology S-Curve. IEEE Spectrum, Vol. 32, No. 6, pp. 49-55.
Beamon, B.M. (1999). Measuring supply chain performance. International Journal of Operations
& Production Management, Vol. 19 No. 3, pp. 275-292.
Becker, H.S., & Blanche Geer (1957) "Participant observation and interviewing: A comparison."
Human Organization, Vol. 16, No. 3, pp. 28-32.
Bell, J. (2005). Doing Your Research Project: A Guide for First-Time Researchers in Education,
Health and Social Science, 4th Edition, Berkshire: Open University Press.
Bicheno, J. (2007). Ny verktygslåda för Lean för snabbt och flexibelt flöde. Revere AB.
Bloomberg, D. J., LeMay, S. A., & Hanna, J. B. (2002). Logistics. Upper Saddle River: Prentice
Hall
Bohn, R.E. (1994). Measuring and managing technological knowledge, Sloan Management
Review, Vol. 36, No. 1, pp. 61-73.
Bohn, R.E., & Terwiesch, C. (1999). The economics of yield-driven processes, Journal of
Operations Management, Vol. 18, pp. 41-59.
Braglia, M., Carmignani, G., & Zammori F. (2006). A new value stream mapping approach for
complex production systems, International Journal of Production Research, Vol. 44, pp. 3929-
3952.
Braglia, M., Frosolini, M., & Zammori, F. (2009). Uncertainty in value stream mapping analysis,
International Journal of Logistics Research and Applications, Vol. 12, No. 6, pp. 435-453.
Brown, S. L., & Eisenhardt, K. M., (1995) Product development: Past research, present
findings, and future directions, Academy of Management Review, Vol. 20, pp. 343-378.
Camp, R.C. (1989). Benchmarking: The Search for Industry Best Practices that Lead to Superior
Performance. Milwaukee, WI: Quality Press.
56
Carpinetti, L.C.R. & Melo, A.M. (2002). What to benchmark? A systematic approach and cases.
Department of Mechanical Engineering, School of Engineering of Sao Paolo – USP, Sao Paolo,
Brazil. Benchmarking: An International Journal, Vol. 9 No. 3, 2002, pp.244-255.
Cedergren, S. Wall, A., & Norstrom, C. (2010). Evaluation of performance in a product
development context. Business Horizons, Vol. 53, pp. 359-369.
Chen, H., Frank, M.Z., & Wu, O.Q. (2005). What actually happened to inventories of American
companies between 1981-2000? Management Science, Vol. 51, No. 7, pp. 1015-1031.
Clark, K. B. and T. Fujimoto (1991), Product Development Performance, Harvard Business
School Press, Boston.
Collis, J. & Hussey, R., (2003), Business Research, 3rd
ed, Palgrave-Macmillian, Basingstoke. pp.
56-57. 74. 82-83.
Coyle, J., Bardi, E., & Langley, C. (1996). The Management of Business Logistic. West
Publishing Company.
Crawford, C.M. (1997). New Products Management, 5th
edition. Chicago: Irwin.
Crawford, C.M. (1981). An evolutionary approach to product growth theory. Journal of
marketing, Vol. 45, pp. 125-132.
Cusumano, M. A., (1994). The Limits of “Lean”, Sloan Management Review, Vol. 36, 27-32.
Domingo, R., Alvarez, R. Pena, M.M., & Calvo, R. (2007). Materials flow improvement in a lean
assembly line: a case study, Assembly Automation, Vol. 27, No. 2, pp.141–147.
Duguay, C., Landry, S., & Pasin, F. (1997). From mass production to flexible-agile production.
International Journal of Production and Operations Management, contradictory, Vol. 17, No. 12,
pp. 1183-1195.
Eisenhardt, K. M. (1989). Building theories from case study research. The Academy of
Management Review, Vol. 14, pp. 532-550.
Eisenhardt K. M., & Brown, (1995) Product Development: Past Research, Present Findings, and
Future Directions, Academy of Management Review, Vol. 20, No. 3, pp. 343-378.
Ericsson (2012). Company website [WWW Document] URL:
http://www.ericsson.com/thecompany/company_facts Accessed 2012-04-11.
Ginn, M. E., Rubenstein, A. H., (1986). The R&D/Production Interface: A Case Study of New
Product Commercialization, Journal of Product Innovation Management, Vol. 3, No. 3, pp. 158-
170.
57
Gupta, A., Pawar, K. S., Smart, P. (2007). New product development in the pharmaceutical and
telecommunication industries: A comparative study. International Journal of Production
Economics, Vol. 106, pp. 41-60.
Haque, B., & James-Moore, M. (2004). Applying lean thinking to new product introduction.
Journal of Engineering Design, Vol. 24, pp. 1–31.
Hayes, R.H., Pisano, G., Upton, D., & Wheelwright, S.C. (2005). Pursuing the competitive edge.
New Jersey: Wiley.
Hendry, L.C., (1998) Applying world class manufacturing to make-to-order companies: problems
and solutions, International Journal of Operations & Production Management, Vol. 18, No. 11,
pp. 1086-1100.
Hines, P., Holweg, M., & Rich, N. (2004). Learning to evolve. A review of contemporary lean
thinking. International Journal of Operations and Production. Management, Vol. 24. No. 10, pp.
994-1011.
Hines, P., Rich, N., (1997) The seven value stream mapping tools, International Journal of
Operations & Production Management, Vol. 17, No. 1, pp. 46-64.
Hines, P., Rich, N., Bicheno, J., Brunt, D., Taylor, D., Butterworth, C., & Sullivan, J. (1998).
Value stream management, The International Journal of Logistics Management, Vol. 9, No. 1,
pp. 25–42.
Hopp, W.J., & Spearman, M.L., (2000). Factory physics: foundations of manufacturing
management, New York: McGraw Hill.
Hultink, E.J., Griffin, A., Hart, S. & Robben, H. S.J. (1997). Industrial New Product Launch
Strategies and Product Development Performance. Journal of Product Innovation Management,
Vol.14, pp. 243–257.
Kawulich, B., (2005) Participant Observation as a Data Collection Method. Forum: Qualitative
Social Research, Vol. 6, No. 2, Art. 43.
Krishnan, V., & Ulrich, K.T. (2001). Product development decisions. Management Science, Vol.
47, No. 1, pp. 1-21.
Liker, J. K. (2004). The Toyota Way: 14 Management Principles from the World’s greatest
Manufacturer. New York: McGraw-Hill.
Liker, J.K., & Meier, D. (2006). The Toyota Way Fieldbook. New York: McGraw-Hill.
Lindmark, S., Andersson, E., Johansson M., Bohin, E. (2004). Telecom Dynamics. History and
State of the Swedish Telecom Sector and its Innovation system 1970-2003.
58
Mallick, D.N., & Schroeder, R.G. (2005). An Integrated Framework for Measuring Product
Development Performance in High Technology Industries. PRODUCTION AND OPERATIONS
MANAGEMENT, Vol. 14, No. 2, pp. 142–158.
McDonald, T., Van Aken E.M., & Rentes A.F. (2002). Utilizing simulation to enhance value
stream mapping: A manufacturing case example. International Journal of Logistics Research and
Applications, Vol. 5, No. 2, pp. 213-232.
McIvor, R., Martin J. D., Matsuo, H., & Ng, J., (1997) Profiting from process improvement in the
new semiconductor manufacturing environment, Technology Operations Review, Vol. 1, No. 2,
pp. 1–16.
McManus, H.L., (2005) Product Development Value Stream Mapping, The Lean Aerospace
Initiative, Massachusetts institute of technology, Cambridge.
McManus, H.L., (2002) Value stream analysis and mapping for product development,
International Council of the Aeronautical Sciences, Massachusetts institute of technology,
Cambridge.
Meredith, J., (1998), Building operations management theory through case and field research.
Journal of Operations Management, Vol.16, pp. 441–454.
Monden, Y., (1993). Toyota Production System: An integrated approach to Just-in-time,
Industrial Engineering and Management Press, Vol. 2 , Norcross, GA.
Noam, E.M. (2006). Fundamental instability: Why telecom is becoming a cyclical and
oligopolistic industry, Information Economics and Policy, Vol. 18, pp. 272-284,
Ohno, T. (1988). The Toyota Production System: Beyond Large-Scale Production, Productivity
Press: Portland, OR.
Pavnaskar, S.J., Gershenson, J.K., & Jambekar, A.B., (2003), Classification scheme for Lean
manufacturing tools. International Journal of Production Research, Vol. 41, No. 13, pp. 3075–
3090.
Pawar, K.S., & Driva, H. (1999). Performance measurement or product development in a
manufacturing environment. International Journal of Production Economics, Vol. 60-61, pp.61-
68.
Pisano, G., (1997). The Development Factory. Cambridge, MA: Harvard Business School Press.
Rother, M., & Shook, J., (1998), Learning to See: Value Stream Mapping to Add Value and
Eliminate Muda, Lean Enterprise Institute, Cambridge, MA.
59
Shah, R., & Ward, P. T. (2007). Defining and developing measures of lean production, Journal of
Operations Management, Vol. 25, No. 4, pp. 785-805.
Serrano Lasa, I., Ochoa, C., & de Castro, R., C.O (2008). Evaluation of value stream mapping in
manufacturing system redesign, International Journal of Production Research, Vol. 46, No. 16,
pp. 4409-4430.
Serrano Lasa, I., de Castro, R., & Laburu, C.O. (2009). Extent of the use of Lean concepts
proposed for a value stream mapping application, Production Planning & Control, Vol. 20, No.
1, pp. 82-98.
Spear, S., & Bowen, H.K. (1999). Decoding the DNA of the Toyota Production System. Harvard
Business Review, September-October, pp. 96–106.
Terwiesch, C., & Bohn, R.E. (2001). Learning and process improvement during production
ramp-up. International Journal of Production Economics, Vol. 70, pp- 1-19.
Terwiesch, C., Bohn, R.E., & Chea, K.S. (2001) International product transfer and production
ramp-up: a case study from the data storage industry. R&D Management, Vol. 31, No. 4, pp. 435-
451.
Terwiesch, C., Xu, Y. (2004) The Copy-Exactly Ramp-up Strategy: Trading-off Learning with
Process Change, IEEE Transactions on Engineering Management, Vol. 51, No. 1, pp. 70-84.
Tonnquist, B. (2010). Projektledning. Stockholm: Bonnier Utbildning AB.
Ulrich, K., & Eppinger, S. (2004). Product Design and Development, McGraw-Hill, New York,
3rd Edition.
White, R.E., & Prybutok, V., (2001). The relationship between JIT practices and type of
production system. The international Journal of Management Science, Vol. 29. pp. 113-124.
White, J. (1990). World-class warehousing. Bedford: IFS Publications
Womack, J.P. (2006). Value Stream Mapping. Manufacturing Engineering, Vol. 136, No.5, pp.
145-155.
Womack, J., & Jones, D.T. (1994), “From lean production to the lean enterprise”, Harvard
Business Review, Vol. 72 No. 2, pp. 93-104.
Womack, J., & Jones, D.T. (1996). Lean Thinking: Banish Waste and Create Wealth for Your
Corporation, New York: Simon and Schuster.
Womack, J., Jones, D.T., & Roos, D. (1990). The Machine That Changed the World, New York:
Rawson Associates.

60
Voss, C., Tsikriktsis, N., & Frohlich, M., (2002), Case research in operations management.
International Journal of Operations and Production Management, Vol. 22, pp. 195–219.
Yin, R. K., (1994). Case study research: Design and methods. Newbury Park, CA: Sage.
Zangwill, W.I., & Kantor, P.B. (1998). Toward a theory of continuous improvement,
Management Science, Vol. 44, No. 7, pp. 910-920.
61
Appendix 1 - Benchmarking
Ericsson Supply Site Katrineholm
Information was collected during a visit at the site with a tour in the production and material
handling areas. An interview was also conducted with a project manager in operational
excellence.
Context
Ericsson Supply Site Katrineholm manufactures and industrializes nodes and printed circuit
boards. A node is a unit in the radio network system, enabling the communication in the ether.
Examples of nodes are radio base stations, radio network controller or media gateways. These
nodes have different hierarchic roles controlling the radio network and distribution of bandwidth
to specific areas. The main purpose of the production is to supply design projects or foremost
internal customers with end-products for verification of software and hardware.
This benchmarking has focused on the node production, especially on the new product
introduction process since it shows great similarities with the filter production in Ericsson MIC in
Kista. The node products consist of 50-150 unique components and are made to order (MTO).
There are hundreds of product varieties and the life-expectancy of product in production is 3-15
years. The production process for prototypes is a static workstation where all assembly is made in
one place, whilst the NPI production process is continuous with specified tact flow.
Description of material flow
The production planner triggers the process with the ordering of components, not available in
supermarket, from main storage. The supermarket is a material handling technique generating a
pull-flow and stores components close to the production line. That process has a lead-time of four
hours. The main storage also supplies a supermarket via a milk-run process. The planner prints a
bill of materials and place it in a pigeon-hole shelf were the material operator collects the Bill of
material (BOM) if the material trolley space is empty at the workstation. The material handling
staff has 20 minutes (the tact time) to complete the order and collect all the material from the
supermarket. There is a push-flow from main storage and pull-flow from supermarket and re-
stocking of supermarket. When the product is assembled final testing takes place which currently
is the bottleneck in the production process with a lead-time between 2-120 hours. When final
testing is completed the product is packed and shipped within 24 hours.
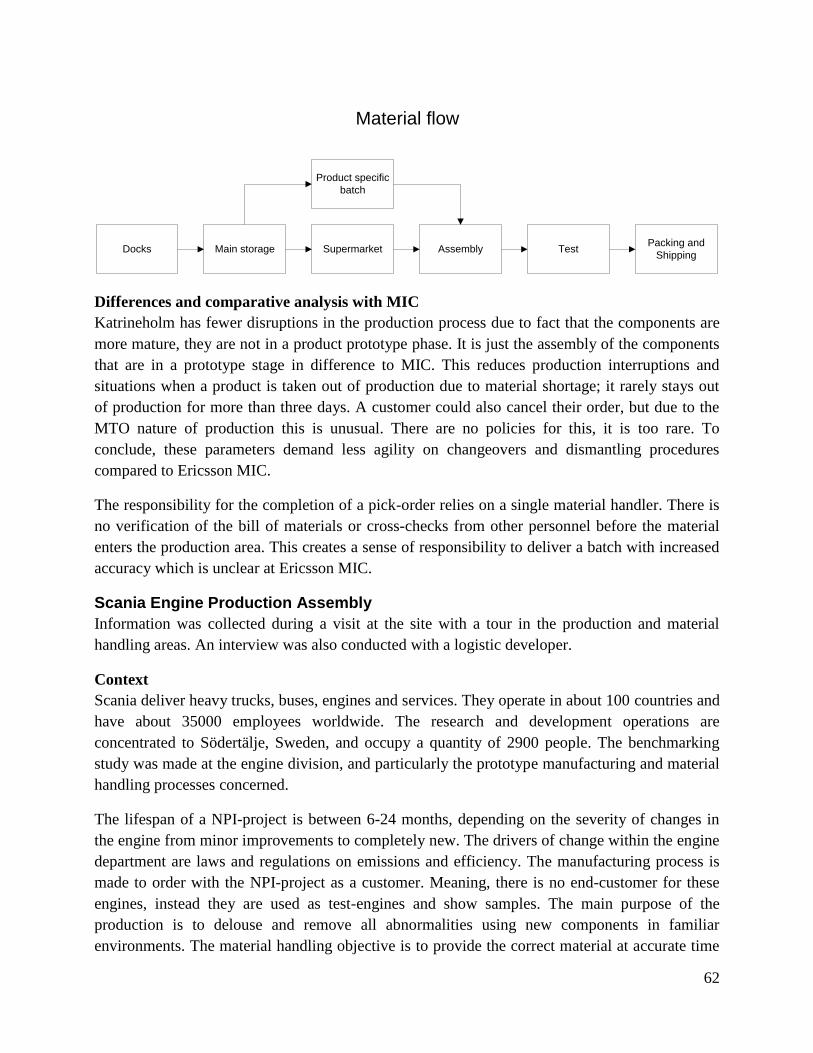
62
Main storagePacking and
ShippingSupermarket
Material flow
TestAssemblyDocks
Product specific
batch
Differences and comparative analysis with MIC
Katrineholm has fewer disruptions in the production process due to fact that the components are
more mature, they are not in a product prototype phase. It is just the assembly of the components
that are in a prototype stage in difference to MIC. This reduces production interruptions and
situations when a product is taken out of production due to material shortage; it rarely stays out
of production for more than three days. A customer could also cancel their order, but due to the
MTO nature of production this is unusual. There are no policies for this, it is too rare. To
conclude, these parameters demand less agility on changeovers and dismantling procedures
compared to Ericsson MIC.
The responsibility for the completion of a pick-order relies on a single material handler. There is
no verification of the bill of materials or cross-checks from other personnel before the material
enters the production area. This creates a sense of responsibility to deliver a batch with increased
accuracy which is unclear at Ericsson MIC.
Scania Engine Production Assembly
Information was collected during a visit at the site with a tour in the production and material
handling areas. An interview was also conducted with a logistic developer.
Context
Scania deliver heavy trucks, buses, engines and services. They operate in about 100 countries and
have about 35000 employees worldwide. The research and development operations are
concentrated to Södertälje, Sweden, and occupy a quantity of 2900 people. The benchmarking
study was made at the engine division, and particularly the prototype manufacturing and material
handling processes concerned.
The lifespan of a NPI-project is between 6-24 months, depending on the severity of changes in
the engine from minor improvements to completely new. The drivers of change within the engine
department are laws and regulations on emissions and efficiency. The manufacturing process is
made to order with the NPI-project as a customer. Meaning, there is no end-customer for these
engines, instead they are used as test-engines and show samples. The main purpose of the
production is to delouse and remove all abnormalities using new components in familiar
environments. The material handling objective is to provide the correct material at accurate time
63
to the production. The material handling process runs without identified interfering issues today.
Scania has a well-developed collaboration with their suppliers and distribute on-site help from
Scania if problems are identified. Similar to the internal benchmarking, made at Ericsson
Katrineholm, the prototype assembly positioning is static throughout the assembly.
Description of material flow
The components are delivered in pallets to the outside storage by trucks arriving from the
suppliers. The docks function stores the components in different areas in the main storage
depending on the wrapping and size specifications. Either in the pallet location containing big
components and large batch sizes or standardized small size boxes. The material handling process
between the storage is managed in two separate flows. One manages the component feed through
a supermarket function that is being refilled whenever the components are staring to run out. The
other material flow, involving low volume products, are manually operated and ordered by
production planners. The components are placed close to the assembly stations in order to
maintain constant component availability for the operators. The lead-time for the assembly is one
week and when the engine is ready, it passes through several test-stations.
Main storage
Material flow
TestAssemblyOutside storage
Comparative analysis with MIC
Similar to the Ericsson Katrineholm site, there are few production interruptions due to late arrival
or component errors. Furthermore, the assembly processes are operating independently from each
other and missing components will not interrupt the parallel prototype production flows. This fact
indicates that less sense of urgency, related to the assembly and material handling cooperation,
are created compared to MIC. Furthermore, the yield uncertainty in the production process
generates constant rescheduling at MIC. The volume output at Scania is significantly lower,
making the rescheduling processes a non-issue. Every component is controlled and measured by
the quality department before being used in the prototype, this to ensure that the suppliers are
within the specification.
64
Appendix 2 – Benchmarking questionnaire (Swedish)
Benchmarkingformulär
Prioritera följande meningar eller egenskaper från 1-12. Där 12 är viktigast och siffrorna får
användas en gång vardera. Vi vill få en bild av hur NPI-organisationen ser på dessa
egenskaper/meningar. Vi inser att många av dem har med varandra att göra men försök att
prioritera.
Reducera ledtiden för NPI projekt __
Kostnadseffektivitet __
Producera stora volymer__
Omställningsflexibilitet__
Skära kostnader__
Volymflexibilitet__
Reducera lagernivåer __
”Problemfri” produkt efter avslutat projekt__
Minimera saldofel__
Göra det dagliga arbetet enklare för personalen__
Leverera på utsatt tid__
Ändra tankesätt hos personal och ledning__
Frågor
Alla frågor är i relation till NPI-organisationen inom företaget
Har tillverkning mot prognos eller order?
Vad är syftet med produktionen?
65
Vad är syftet med materialhanteringen?
Finns inneboende svårigheter med materialhanteringen och NPI-produktion?
Hur styrs processerna och vad triggar aktiviteterna?
Har ni problem/flaskhalsar i produktionen som direkt försvårar erat arbete?
Har ni problem/flaskhalsar i materialhanteringen som direkt försvårar erat arbete?
Hur flyttas materialet push/pull/FIFO?
66
Hur hanterar ni volymfluktuationer?
Hur bra anser ni att ni hanterar volymfluktuationer på en skala från 1 (dåligt) 5 (Utmärkt).
Where is inventory held and how much is there?
What sort of scheduling information is used?
What sort of work instructions are produced?
What happens when there are problems in the physical flow?
What sort of forecast and call-off information is supplied by the customer?
What sort of forecast and call-off information do you give your suppliers?
NPI-organisationen
Vad har ni för styrkor och svagheter i organisationen.
Vilket arbetsätt och filosofier arbetar ni efter, Lean/Agila eller andra metoder?
Hur jobbar ni med förbättringar?
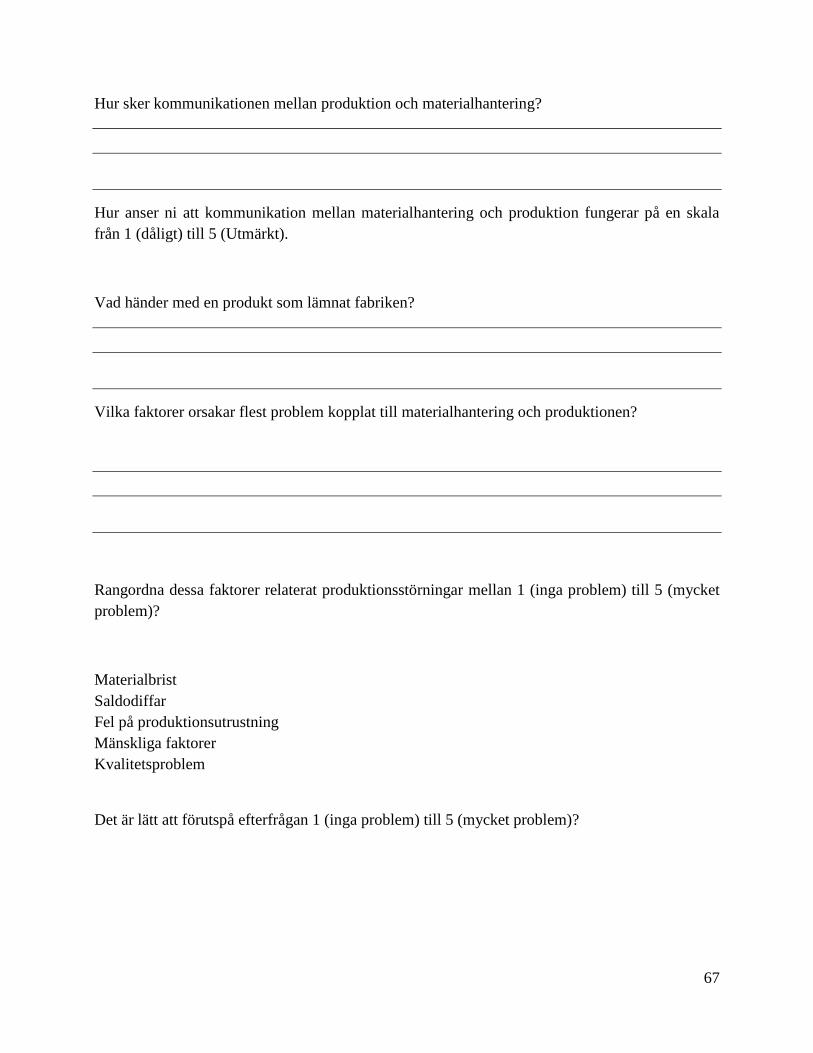
67
Hur sker kommunikationen mellan produktion och materialhantering?
Hur anser ni att kommunikation mellan materialhantering och produktion fungerar på en skala
från 1 (dåligt) till 5 (Utmärkt).
Vad händer med en produkt som lämnat fabriken?
Vilka faktorer orsakar flest problem kopplat till materialhantering och produktionen?
Rangordna dessa faktorer relaterat produktionsstörningar mellan 1 (inga problem) till 5 (mycket
problem)?
Materialbrist
Saldodiffar
Fel på produktionsutrustning
Mänskliga faktorer
Kvalitetsproblem
Det är lätt att förutspå efterfrågan 1 (inga problem) till 5 (mycket problem)?
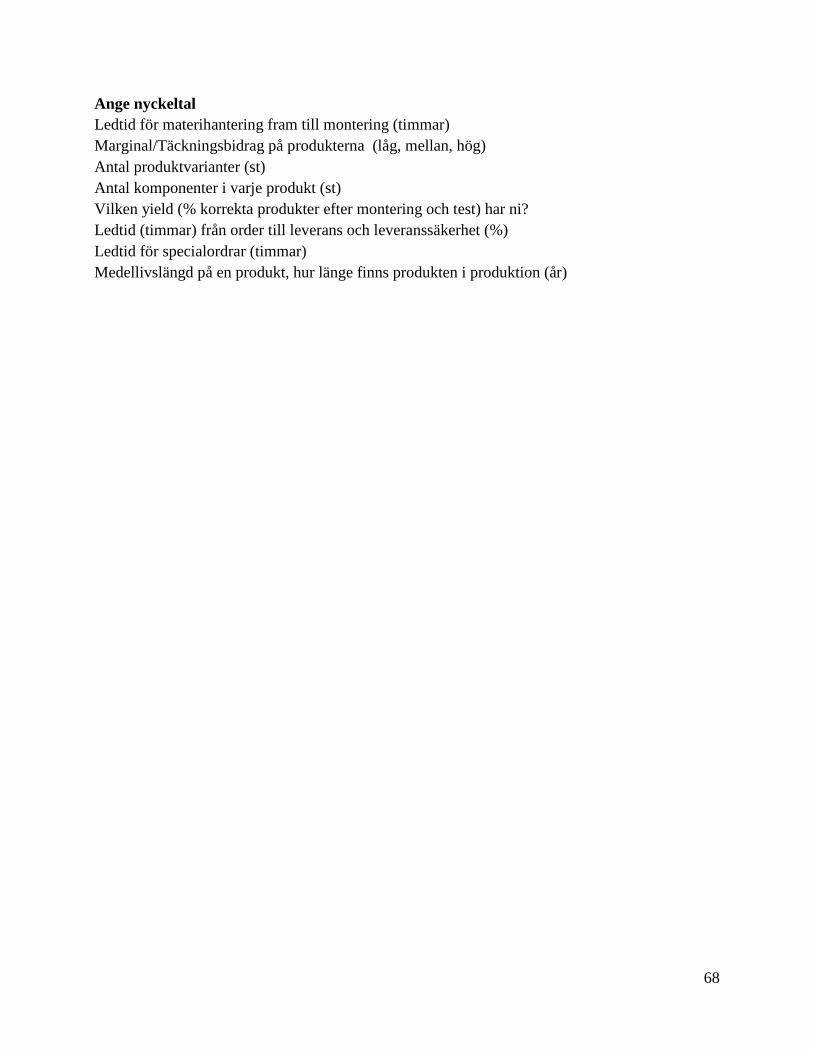
68
Ange nyckeltal
Ledtid för materihantering fram till montering (timmar)
Marginal/Täckningsbidrag på produkterna (låg, mellan, hög)
Antal produktvarianter (st)
Antal komponenter i varje produkt (st)
Vilken yield (% korrekta produkter efter montering och test) har ni?
Ledtid (timmar) från order till leverans och leveranssäkerhet (%)
Ledtid för specialordrar (timmar)
Medellivslängd på en produkt, hur länge finns produkten i produktion (år)