Embed Size (px)
Citation preview
VCS Project Description – Campo Verde
1
Voluntary Carbon Standard Using: Project Description Template, 19 November 2007 Campo Verde VCS PD: 15 June 2009 Revision 2 Table of Contents:
1 DESCRIPTION OF PROJECT: ............................................................................................................ 3
1.1 PROJECT TITLE ................................................................................................................................ 3 1.2 TYPE/CATEGORY OF THE PROJECT ....................................................................................................... 3 1.3 ESTIMATED AMOUNT OF EMISSION REDUCTIONS OVER THE CREDITING PERIOD INCLUDING PROJECT SIZE: .......... 3 1.4 A BRIEF DESCRIPTION OF THE PROJECT: ................................................................................................ 3 1.5 PROJECT LOCATION INCLUDING GEOGRAPHIC AND PHYSICAL INFORMATION ALLOWING THE UNIQUE
IDENTIFICATION AND DELINEATION OF THE SPECIFIC EXTENT OF THE PROJECT: ........................................................ 4 1.6 DURATION OF THE PROJECT ACTIVITY/CREDITING PERIOD: ....................................................................... 5 1.7 CONDITIONS PRIOR TO PROJECT INITIATION: ......................................................................................... 5 1.8 A DESCRIPTION OF HOW THE PROJECT WILL ACHIEVE GHG EMISSION REDUCTIONS AND/OR REMOVAL
ENHANCEMENTS: ...................................................................................................................................... 9 1.9 PROJECT TECHNOLOGIES, PRODUCTS, SERVICES AND THE EXPECTED LEVEL OF ACTIVITY: ................................. 9 1.10 COMPLIANCE WITH RELEVANT LOCAL LAWS AND REGULATIONS RELATED TO THE PROJECT: ....................... 19 1.11 IDENTIFICATION OF RISKS THAT MAY SUBSTANTIALLY AFFECT THE PROJECT’S GHG EMISSION REDUCTIONS OR
REMOVAL ENHANCEMENTS: ...................................................................................................................... 20 1.12 DEMONSTRATION TO CONFIRM THAT THE PROJECT WAS NOT IMPLEMENTED TO CREATE GHG EMISSIONS
PRIMARILY FOR THE PURPOSE OF ITS SUBSEQUENT REMOVAL OR DESTRUCTION. ................................................... 30 1.13 DEMONSTRATION THAT THE PROJECT HAS NOT CREATED ANOTHER FORM OF ENVIRONMENTAL CREDIT (FOR
EXAMPLE RENEWABLE ENERGY CERTIFICATES). .............................................................................................. 30 1.14 PROJECT REJECTED UNDER OTHER GHG PROGRAMS (IF APPLICABLE): ................................................. 30 1.15 PROJECT PROPONENTS’ ROLES AND RESPONSIBILITIES, INCLUDING CONTACT INFORMATION OF THE PROJECT
PROPONENT, OTHER PROJECT PARTICIPANTS: ................................................................................................ 30 1.16 ANY INFORMATION RELEVANT FOR THE ELIGIBILITY OF THE PROJECT AND QUANTIFICATION OF EMISSION
REDUCTIONS OR REMOVAL ENHANCEMENTS, INCLUDING LEGISLATIVE, TECHNICAL, ECONOMIC, SECTORAL, SOCIAL, ENVIRONMENTAL, GEOGRAPHIC, SITE-SPECIFIC AND TEMPORAL INFORMATION.): ................................................. 31 1.17 LIST OF COMMERCIALLY SENSITIVE INFORMATION (IF APPLICABLE): ..................................................... 33
2 VCS METHODOLOGY: ................................................................................................................... 33
2.1 TITLE AND REFERENCE OF THE VCS METHODOLOGY APPLIED TO THE PROJECT ACTIVITY AND EXPLANATION OF
METHODOLOGY CHOICES: ......................................................................................................................... 33 2.2 JUSTIFICATION OF THE CHOICE OF THE METHODOLOGY AND WHY IT IS APPLICABLE TO THE PROJECT ACTIVITY:... 33 2.3 IDENTIFYING GHG SOURCES, SINKS AND RESERVOIRS FOR THE BASELINE SCENARIO AND FOR THE PROJECT: ..... 34 2.4 DESCRIPTION OF HOW THE BASELINE SCENARIO IS IDENTIFIED AND DESCRIPTION OF THE IDENTIFIED BASELINE
SCENARIO: ............................................................................................................................................. 36
VCS Project Description – Campo Verde
2
2.5 DESCRIPTION OF HOW THE EMISSIONS OF GHG BY SOURCE IN BASELINE SCENARIO ARE REDUCED BELOW THOSE
THAT WOULD HAVE OCCURRED IN THE ABSENCE OF THE PROJECT ACTIVITY (ASSESSMENT AND DEMONSTRATION OF
ADDITIONALITY): ..................................................................................................................................... 44
3 MONITORING: .............................................................................................................................. 52
3.1 TITLE AND REFERENCE OF THE VCS METHODOLOGY (WHICH INCLUDES THE MONITORING REQUIREMENTS)
APPLIED TO THE PROJECT ACTIVITY AND EXPLANATION OF METHODOLOGY CHOICES: ............................................. 52 3.2 MONITORING, INCLUDING ESTIMATION, MODELLING, MEASUREMENT OR CALCULATION APPROACHES: ........... 52 3.3 DATA AND PARAMETERS ARCHIVED AND MONITORED / SELECTING RELEVANT GHG SOURCES, SINKS AND
RESERVOIRS FOR MONITORING OR ESTIMATING GHG EMISSIONS AND REMOVALS: ............................................... 53 3.4 DESCRIPTION OF THE MONITORING PLAN ........................................................................................... 65
4 GHG EMISSION REDUCTIONS: ...................................................................................................... 69
4.1 EXPLANATION OF METHODOLOGICAL CHOICE: ..................................................................................... 69 4.2 QUANTIFYING GHG EMISSIONS AND/OR REMOVALS FOR THE BASELINE SCENARIO: .................................... 69 4.3 QUANTIFYING GHG EMISSIONS AND/OR REMOVALS FOR THE PROJECT: ................................................... 72 4.4 QUANTIFYING GHG EMISSION REDUCTIONS AND REMOVAL ENHANCEMENTS FOR THE GHG PROJECT: ........... 81
5 ENVIRONMENTAL IMPACT: .......................................................................................................... 82
6 STAKEHOLDERS’ COMMENTS: ..................................................................................................... 82
7 SCHEDULE: .................................................................................................................................... 84
8 OWNERSHIP: ................................................................................................................................. 85
8.1 PROOF OF TITLE: ........................................................................................................................... 85 8.2 PROJECTS THAT REDUCE GHG EMISSIONS FROM ACTIVITIES THAT PARTICIPATE IN AN EMISSIONS TRADING
PROGRAM (IF APPLICABLE): ....................................................................................................................... 85
9 BASELINE REPORT ........................................................................................................................ 85
9.1 BASELINE METHODS: ..................................................................................................................... 85 9.2 RESULTS: ..................................................................................................................................... 87
10 MONITORING PLAN ...................................................................................................................... 91
10.1 MONITORING OF THE BASELINE NET GHG REMOVALS ...................................................................... 91 10.2 MONITORING THE OVERALL PERFORMANCE OF THE PROPOSED ARR VCS PROJECT ACTIVITY .................... 91 10.3 MONITORING THE ACTUAL NET GHG REMOVALS ............................................................................ 93 10.4 MONITORING LEAKAGE ........................................................................................................... 100 10.5 QUALITY ASSURANCE AND QUALITY CONTROL (QA/QC) ............................................................... 105 10.6 UNCERTAINTY ASSESSMENT ...................................................................................................... 106
VCS Project Description – Campo Verde
3
1 Description of Project:
1.1 Project title
Reforestation of pastures in Campo Verde with native species, Pucallpa, Peru 1.2 Type/Category of the project
The project can be classified as an Afforestation, Reforestation, and Revegetation (ARR) project, according to VCS Standards. The project proponents intend to replicate this project throughout the region as a grouped project; however, specific lands have yet to be identified.
1.3 Estimated amount of emission reductions over the crediting period including project size:
The project plans to sequester a long-term average of 169,971 tons of CO2e in 30 years through the reforestation of 740 hectares and the assisted natural regeneration of 179.7 hectares. 1.4 A brief description of the project:
Deforestation and unsustainable farming practices emanating from cities, towns, roads and rivers have resulted in a pattern of degradation in the Peruvian Amazon. Valuable timber species are initially extracted, before the rest of the forest is cleared, burnt and put into agriculture. As a result of the biophysical conditions and the traditional slash-and-burn agriculture system, deforested lands can only support arable agriculture for a few years following clearing of the native forest cover because of rapid depletion of nutrients from the soil. After this, land is normally turned over to ranching or abandoned for several years whilst it regenerates, before the process is repeated. Ranching and arable lands alike become increasingly degraded over time. Invasive grasses commonly establish on pasture lands, after which it becomes difficult for tree species to regenerate, even on abandoned pasture lands. This is compounded by the frequency of fires, mainly started by burning for agriculture. The result is vast swaths of abandoned, unproductive pastures that sequester little carbon. The Campo Verde project proposes to restore pasture lands which have been deforested since the 1960s and have subsequently degraded in the ensuing years. Pastures will be restored with native commercial timber species with the intention of further replication of the project activities in the region over time. The proposed afforestation and reforestation project is located in the department of Ucayali in the Peruvian Amazon. The annual deforestation rate in the department of Ucayali was 7931ha from 1990-2000 and accumulated deforestation in the region to the year 2000 totalled 627,064hectares
1. The project developers envision that this project will serve as a model that can be
replicated and expanded elsewhere in the region. This project will reforest 740 ha of VCS compliant pastures with commercial native timber species through direct planting of seedlings. These species are Caoba (Swietenia macrophylla) Tahuarí (Tabebuia serratifolia), Marupa (Simarouba amara) and Shihuahuaco (Dipterix odorata). Restoration of degraded soils will be facilitated initially through the planting of Guaba trees (Inga edulis) to incorporate organic matter, enhance soil nutrients and provide wind protection and shade for the timber species. On an additional 179.7 ha of VCS compliant pastures, natural regeneration of forest will be facilitated through integrated weed management, control of grazing and prevention of fires. The Campo Verde project approach incorporates capacity building with local people on sustainable forestry management, low impact logging techniques as well as nursery and plantation management. The project’s hiring practices give priority to workers from local communities and surrounding areas, with both permanent (39 workers) and temporary (284 workers) contracts in place. The hiring
1 Jorge Elgegren, La Deforestacion en el Peru, Paracas, October 2005; based on official statistics of INRENA and
PROCLIM
VCS Project Description – Campo Verde
4
practices ensure balanced gender participation. Also, the project provides technical and financial support for out grower nurseries thereby providing an opportunity for local communities to establish business enterprises. Over time it is anticipated that stakeholders will be able to build on the expertise they have developed from this project and expand it for use on their own land and in the forestry sector in the region more broadly. The “Asociación para la Investigación y el Desarrollo Integral’ (AIDER
2) a
Peruvian non-governmental organization will provide technical advice for the project and assist with project management and implementation.
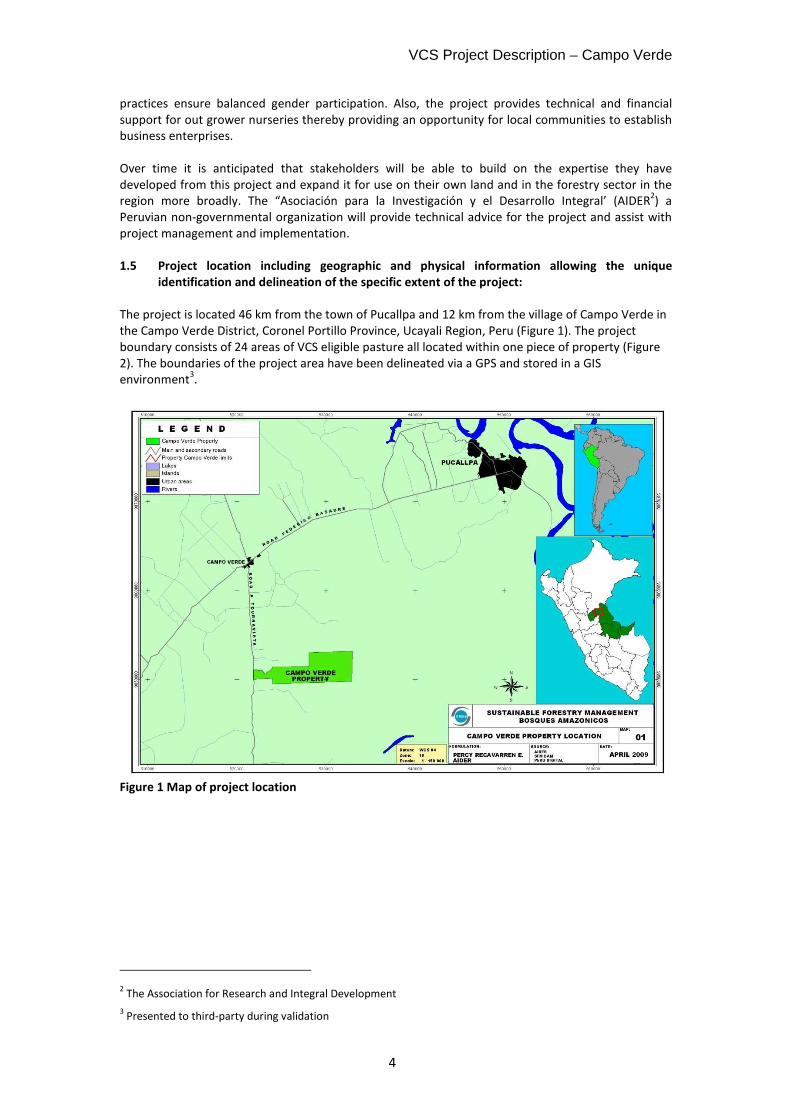
1.5 Project location including geographic and physical information allowing the unique
identification and delineation of the specific extent of the project:
The project is located 46 km from the town of Pucallpa and 12 km from the village of Campo Verde in the Campo Verde District, Coronel Portillo Province, Ucayali Region, Peru (Figure 1). The project boundary consists of 24 areas of VCS eligible pasture all located within one piece of property (Figure 2). The boundaries of the project area have been delineated via a GPS and stored in a GIS environment
3.
Figure 1 Map of project location
2 The Association for Research and Integral Development
3 Presented to third-party during validation
VCS Project Description – Campo Verde
5
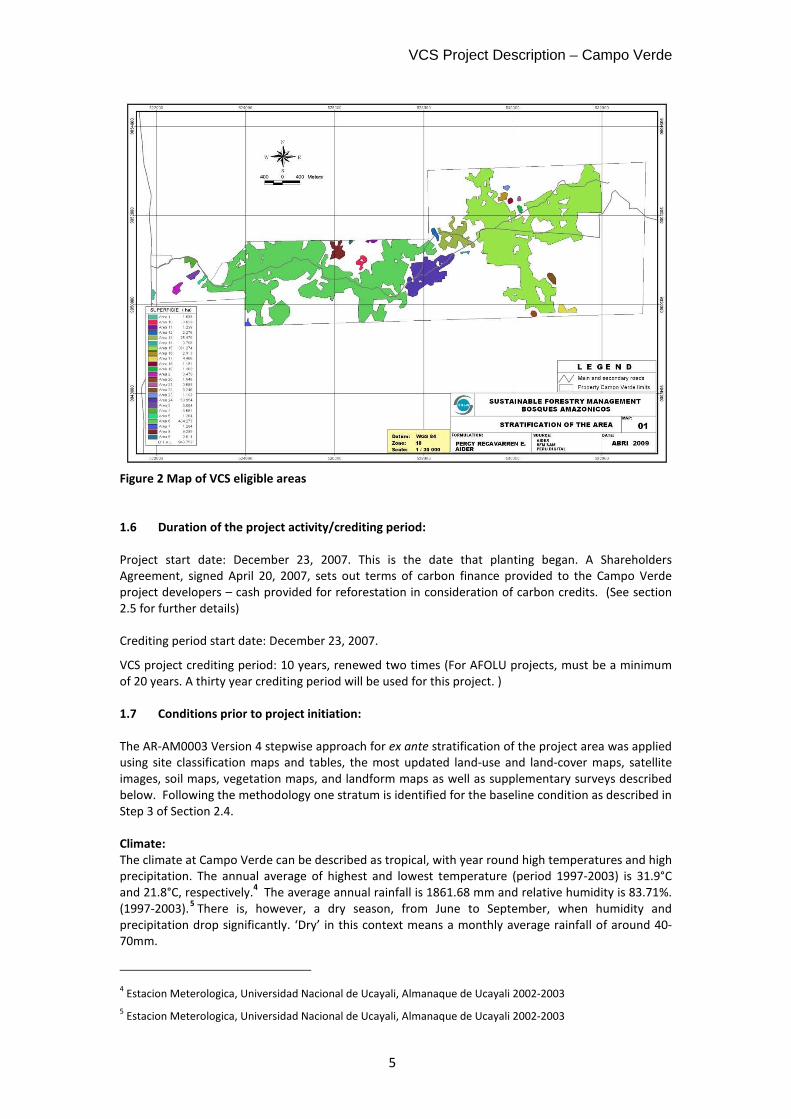
Figure 2 Map of VCS eligible areas
1.6 Duration of the project activity/crediting period:
Project start date: December 23, 2007. This is the date that planting began. A Shareholders Agreement, signed April 20, 2007, sets out terms of carbon finance provided to the Campo Verde project developers – cash provided for reforestation in consideration of carbon credits. (See section 2.5 for further details) Crediting period start date: December 23, 2007.
VCS project crediting period: 10 years, renewed two times (For AFOLU projects, must be a minimum of 20 years. A thirty year crediting period will be used for this project. )
1.7 Conditions prior to project initiation:
The AR-AM0003 Version 4 stepwise approach for ex ante stratification of the project area was applied using site classification maps and tables, the most updated land-use and land-cover maps, satellite images, soil maps, vegetation maps, and landform maps as well as supplementary surveys described below. Following the methodology one stratum is identified for the baseline condition as described in Step 3 of Section 2.4. Climate:
The climate at Campo Verde can be described as tropical, with year round high temperatures and high precipitation. The annual average of highest and lowest temperature (period 1997-2003) is 31.9°C and 21.8°C, respectively.
4 The average annual rainfall is 1861.68 mm and relative humidity is 83.71%.
(1997-2003).5
There is, however, a dry season, from June to September, when humidity and precipitation drop significantly. ‘Dry’ in this context means a monthly average rainfall of around 40-70mm.
4 Estacion Meterologica, Universidad Nacional de Ucayali, Almanaque de Ucayali 2002-2003
5 Estacion Meterologica, Universidad Nacional de Ucayali, Almanaque de Ucayali 2002-2003
VCS Project Description – Campo Verde
6
Relief and Soils:
The project area is characterized by gently undulating terraces, with low gradients of between 0- 4%. The height ranges from 155 to 220m above sea level. The project area contains relic small hills created by historic fluvial action. The relief of the lands means they are not affected by flooding during the rainy season. There is good to moderate drainage across the project area. The soils in the project area classified using the pH scale range from extremely to strongly acidic (pH around 3.5). The soils display an average bulk density of 1.13 g/cm
3 and a low organic content, averaging 0.86% carbon
in the top ten centimetres. Biodiversity:
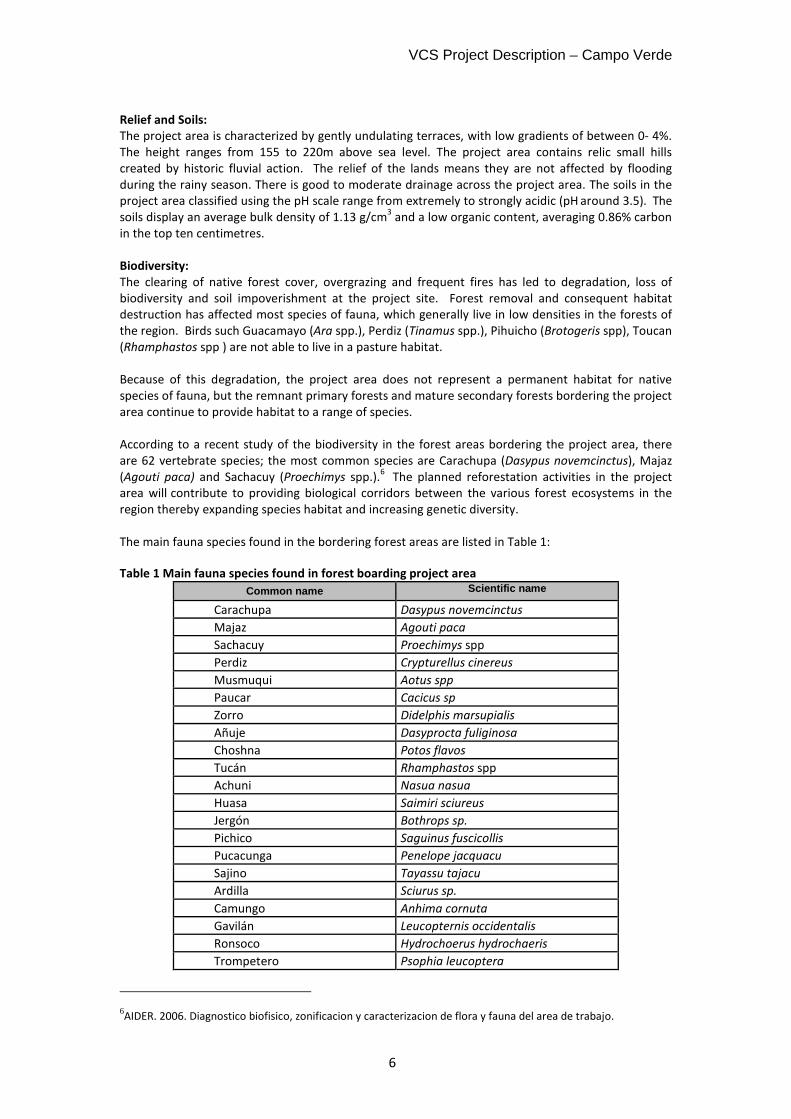
The clearing of native forest cover, overgrazing and frequent fires has led to degradation, loss of biodiversity and soil impoverishment at the project site. Forest removal and consequent habitat destruction has affected most species of fauna, which generally live in low densities in the forests of the region. Birds such Guacamayo (Ara spp.), Perdiz (Tinamus spp.), Pihuicho (Brotogeris spp), Toucan (Rhamphastos spp ) are not able to live in a pasture habitat. Because of this degradation, the project area does not represent a permanent habitat for native species of fauna, but the remnant primary forests and mature secondary forests bordering the project area continue to provide habitat to a range of species. According to a recent study of the biodiversity in the forest areas bordering the project area, there are 62 vertebrate species; the most common species are Carachupa (Dasypus novemcinctus), Majaz (Agouti paca) and Sachacuy (Proechimys spp.).
6 The planned reforestation activities in the project
area will contribute to providing biological corridors between the various forest ecosystems in the region thereby expanding species habitat and increasing genetic diversity. The main fauna species found in the bordering forest areas are listed in Table 1: Table 1 Main fauna species found in forest boarding project area
Common name Scientific name
Carachupa Dasypus novemcinctus
Majaz Agouti paca
Sachacuy Proechimys spp
Perdiz Crypturellus cinereus
Musmuqui Aotus spp
Paucar Cacicus sp
Zorro Didelphis marsupialis
Añuje Dasyprocta fuliginosa
Choshna Potos flavos
Tucán Rhamphastos spp
Achuni Nasua nasua
Huasa Saimiri sciureus
Jergón Bothrops sp.
Pichico Saguinus fuscicollis
Pucacunga Penelope jacquacu
Sajino Tayassu tajacu
Ardilla Sciurus sp.
Camungo Anhima cornuta
Gavilán Leucopternis occidentalis
Ronsoco Hydrochoerus hydrochaeris
Trompetero Psophia leucoptera
6AIDER. 2006. Diagnostico biofisico, zonificacion y caracterizacion de flora y fauna del area de trabajo.
VCS Project Description – Campo Verde
7
Common name Scientific name
Panguana Crypturellus undulatus
Of the species listed above, five are considered as endangered according to the National Institute of Natural Resources
7. Leucopternis occidentalis is considered in the category Endangered, Bothrops sp.
And Crypturellus cinereus are considered in the category Vulnerable, Cacicus sp and Rhamphastos spp are considered in the category Almost Threatened. The habitat is outside the border of the project area.
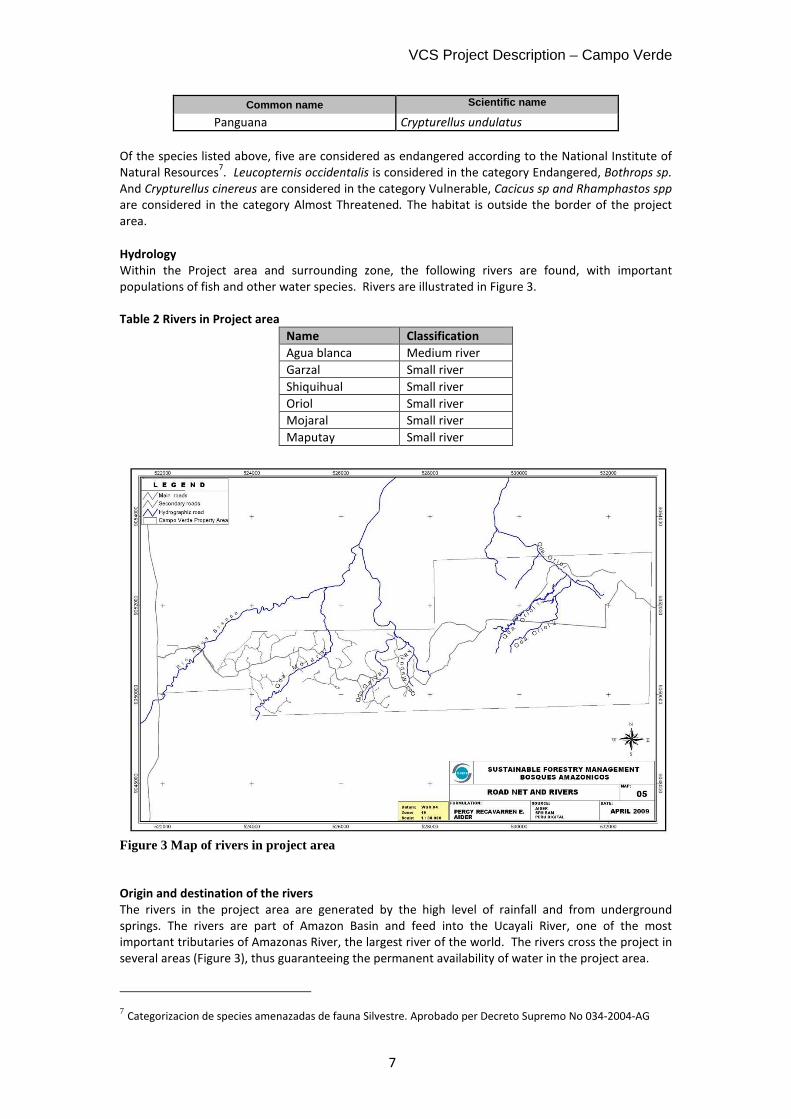
Hydrology
Within the Project area and surrounding zone, the following rivers are found, with important populations of fish and other water species. Rivers are illustrated in Figure 3. Table 2 Rivers in Project area
Name Classification
Agua blanca Medium river
Garzal Small river
Shiquihual Small river
Oriol Small river
Mojaral Small river
Maputay Small river
Figure 3 Map of rivers in project area
Origin and destination of the rivers
The rivers in the project area are generated by the high level of rainfall and from underground springs. The rivers are part of Amazon Basin and feed into the Ucayali River, one of the most important tributaries of Amazonas River, the largest river of the world. The rivers cross the project in several areas (Figure 3), thus guaranteeing the permanent availability of water in the project area.
7 Categorizacion de species amenazadas de fauna Silvestre. Aprobado per Decreto Supremo No 034-2004-AG
VCS Project Description – Campo Verde
8
Ecosystem
The entire project area is located in the Subtropical Amazon bio-geographic province and the native forest cover is classified as pre-mountain tropical humid forest in transition to tropical humid forest.
8
Vegetation:
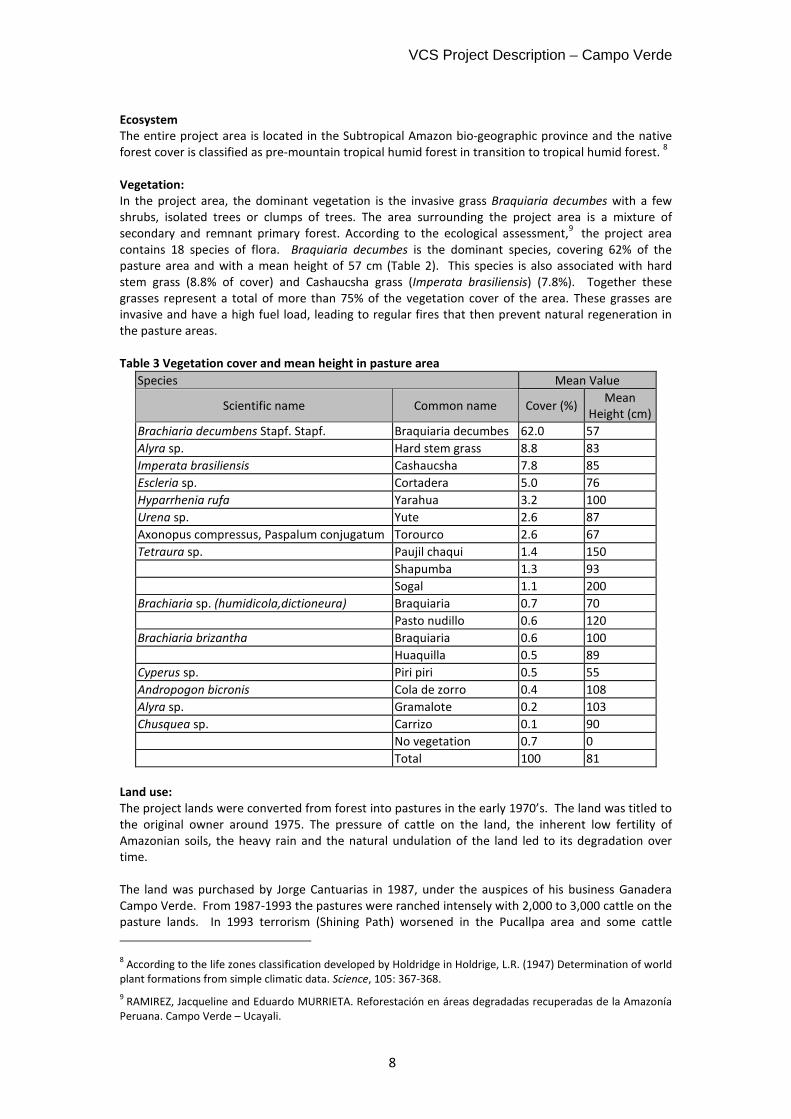
In the project area, the dominant vegetation is the invasive grass Braquiaria decumbes with a few shrubs, isolated trees or clumps of trees. The area surrounding the project area is a mixture of secondary and remnant primary forest. According to the ecological assessment,
9 the project area
contains 18 species of flora. Braquiaria decumbes is the dominant species, covering 62% of the pasture area and with a mean height of 57 cm (Table 2). This species is also associated with hard stem grass (8.8% of cover) and Cashaucsha grass (Imperata brasiliensis) (7.8%). Together these grasses represent a total of more than 75% of the vegetation cover of the area. These grasses are invasive and have a high fuel load, leading to regular fires that then prevent natural regeneration in the pasture areas. Table 3 Vegetation cover and mean height in pasture area
Species Mean Value
Scientific name Common name Cover (%) Mean
Height (cm)
Brachiaria decumbens Stapf. Stapf. Braquiaria decumbes 62.0 57
Alyra sp. Hard stem grass 8.8 83
Imperata brasiliensis Cashaucsha 7.8 85
Escleria sp. Cortadera 5.0 76
Hyparrhenia rufa Yarahua 3.2 100
Urena sp. Yute 2.6 87
Axonopus compressus, Paspalum conjugatum Torourco 2.6 67
Tetraura sp. Paujil chaqui 1.4 150
Shapumba 1.3 93
Sogal 1.1 200
Brachiaria sp. (humidicola,dictioneura) Braquiaria 0.7 70
Pasto nudillo 0.6 120
Brachiaria brizantha Braquiaria 0.6 100
Huaquilla 0.5 89
Cyperus sp. Piri piri 0.5 55
Andropogon bicronis Cola de zorro 0.4 108
Alyra sp. Gramalote 0.2 103
Chusquea sp. Carrizo 0.1 90
No vegetation 0.7 0
Total 100 81
Land use:
The project lands were converted from forest into pastures in the early 1970’s. The land was titled to the original owner around 1975. The pressure of cattle on the land, the inherent low fertility of Amazonian soils, the heavy rain and the natural undulation of the land led to its degradation over time. The land was purchased by Jorge Cantuarias in 1987, under the auspices of his business Ganadera Campo Verde. From 1987-1993 the pastures were ranched intensely with 2,000 to 3,000 cattle on the pasture lands. In 1993 terrorism (Shining Path) worsened in the Pucallpa area and some cattle
8 According to the life zones classification developed by Holdridge in Holdrige, L.R. (1947) Determination of world
plant formations from simple climatic data. Science, 105: 367-368. 9 RAMIREZ, Jacqueline and Eduardo MURRIETA. Reforestación en áreas degradadas recuperadas de la Amazonía
Peruana. Campo Verde – Ucayali.
VCS Project Description – Campo Verde
9
belonging to the Ganadera Campo Verde were killed. Following the terrorism incident of 1993, Ganadera Campo Verde abandoned cattle grazing in Campo Verde because of fear of further attack. However, in the same year (1993) a consortium was formed between Ganadera Campo Verde and a Russian Company AMUR, leading to the creation of COPERSA (Consorcio Peruano Ruso). This consortium was formed to develop an aquaculture business, and most notably the construction of fish-ponds on the lands adjacent to the pastures. For over ten years the owner of the property, Jorge Cantuarias, has not actively produced products or income from the land within the project boundary. However, surrounding neighbours have allowed a low number of cattle to graze on project lands.
1.8 A description of how the project will achieve GHG emission reductions and/or removal
enhancements:
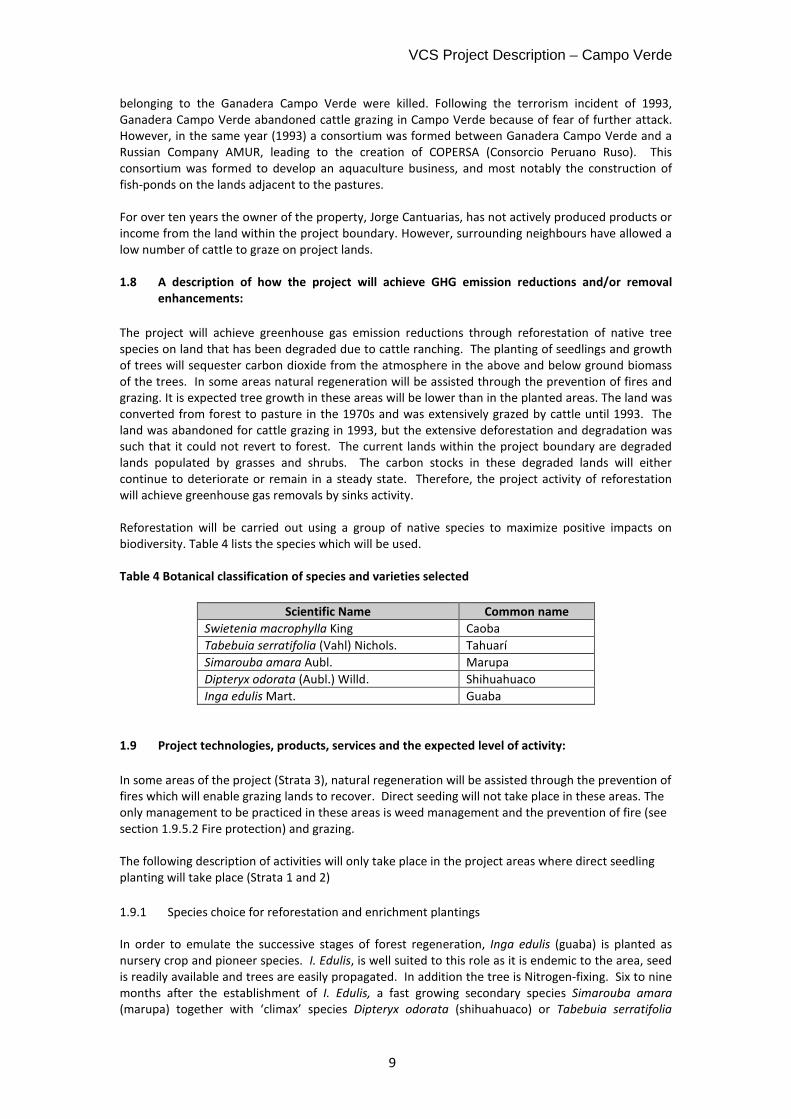
The project will achieve greenhouse gas emission reductions through reforestation of native tree species on land that has been degraded due to cattle ranching. The planting of seedlings and growth of trees will sequester carbon dioxide from the atmosphere in the above and below ground biomass of the trees. In some areas natural regeneration will be assisted through the prevention of fires and grazing. It is expected tree growth in these areas will be lower than in the planted areas. The land was converted from forest to pasture in the 1970s and was extensively grazed by cattle until 1993. The land was abandoned for cattle grazing in 1993, but the extensive deforestation and degradation was such that it could not revert to forest. The current lands within the project boundary are degraded lands populated by grasses and shrubs. The carbon stocks in these degraded lands will either continue to deteriorate or remain in a steady state. Therefore, the project activity of reforestation will achieve greenhouse gas removals by sinks activity. Reforestation will be carried out using a group of native species to maximize positive impacts on biodiversity. Table 4 lists the species which will be used. Table 4 Botanical classification of species and varieties selected
Scientific Name Common name
Swietenia macrophylla King Caoba
Tabebuia serratifolia (Vahl) Nichols. Tahuarí
Simarouba amara Aubl. Marupa
Dipteryx odorata (Aubl.) Willd. Shihuahuaco
Inga edulis Mart. Guaba
1.9 Project technologies, products, services and the expected level of activity:
In some areas of the project (Strata 3), natural regeneration will be assisted through the prevention of fires which will enable grazing lands to recover. Direct seeding will not take place in these areas. The only management to be practiced in these areas is weed management and the prevention of fire (see section 1.9.5.2 Fire protection) and grazing. The following description of activities will only take place in the project areas where direct seedling planting will take place (Strata 1 and 2)
1.9.1 Species choice for reforestation and enrichment plantings
In order to emulate the successive stages of forest regeneration, Inga edulis (guaba) is planted as nursery crop and pioneer species. I. Edulis, is well suited to this role as it is endemic to the area, seed is readily available and trees are easily propagated. In addition the tree is Nitrogen-fixing. Six to nine months after the establishment of I. Edulis, a fast growing secondary species Simarouba amara (marupa) together with ‘climax’ species Dipteryx odorata (shihuahuaco) or Tabebuia serratifolia
VCS Project Description – Campo Verde
10
(tahuarí) will be planted. A small percentage of Swietenia macrophylla (caoba) will also be planted at this time. The seeds will all be sourced from the remnant native forests and forest reserves in Ucayali. I. edulis and T. serratifolia seeds are sourced from the forests proximate to Campo Verde. The D. Odorata seeds are derived from Sinchi Roca, a native community about 40 km west of the project area. S.
amara are collected from Curimana, located about 50 km north-west from the project area. The S.
macrophylla seeds are collected from the Purus Forests, located in the south-east of the Ucayali region, near the border with Madre de Dios. Each tree from which seeds are collected is being documented, and geo-referenced using GPS. Additionally, arrangements have been made with local communities living in the vicinity of these seed trees so as to ensure these trees are protected for subsequent seed harvest. 1.9.2 Nursery practice
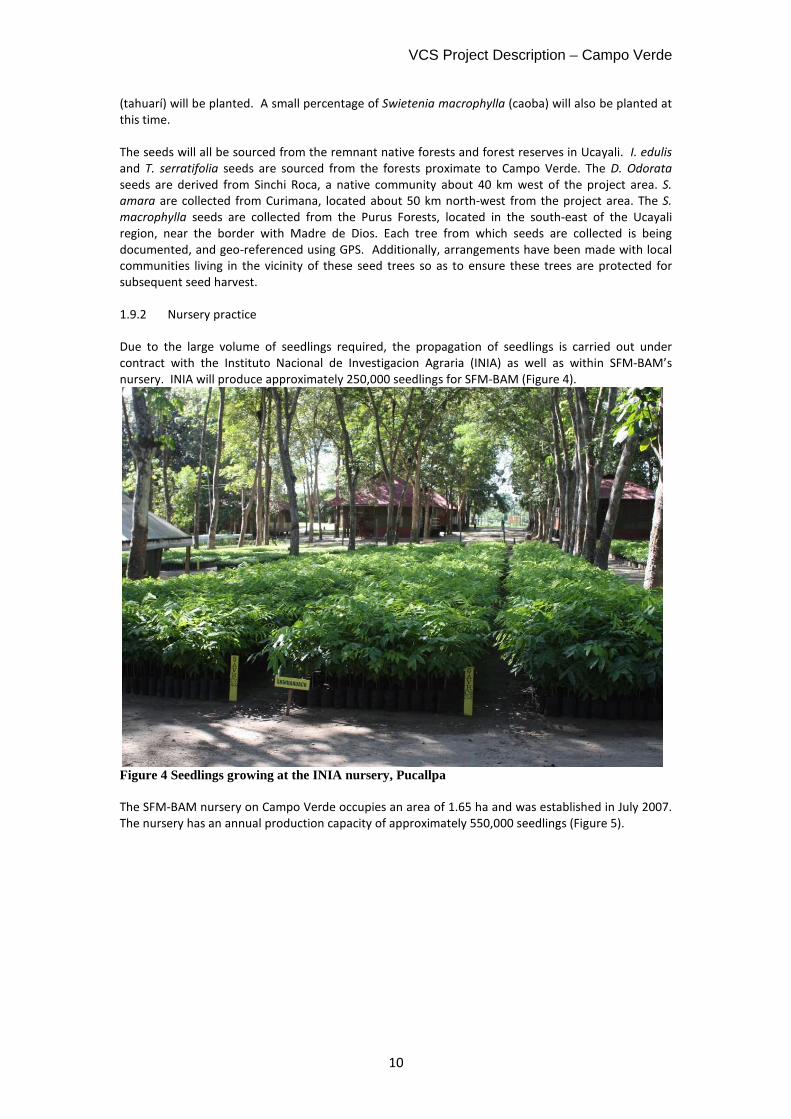
Due to the large volume of seedlings required, the propagation of seedlings is carried out under contract with the Instituto Nacional de Investigacion Agraria (INIA) as well as within SFM-BAM’s nursery. INIA will produce approximately 250,000 seedlings for SFM-BAM (Figure 4).
Figure 4 Seedlings growing at the INIA nursery, Pucallpa
The SFM-BAM nursery on Campo Verde occupies an area of 1.65 ha and was established in July 2007. The nursery has an annual production capacity of approximately 550,000 seedlings (Figure 5).
VCS Project Description – Campo Verde
11
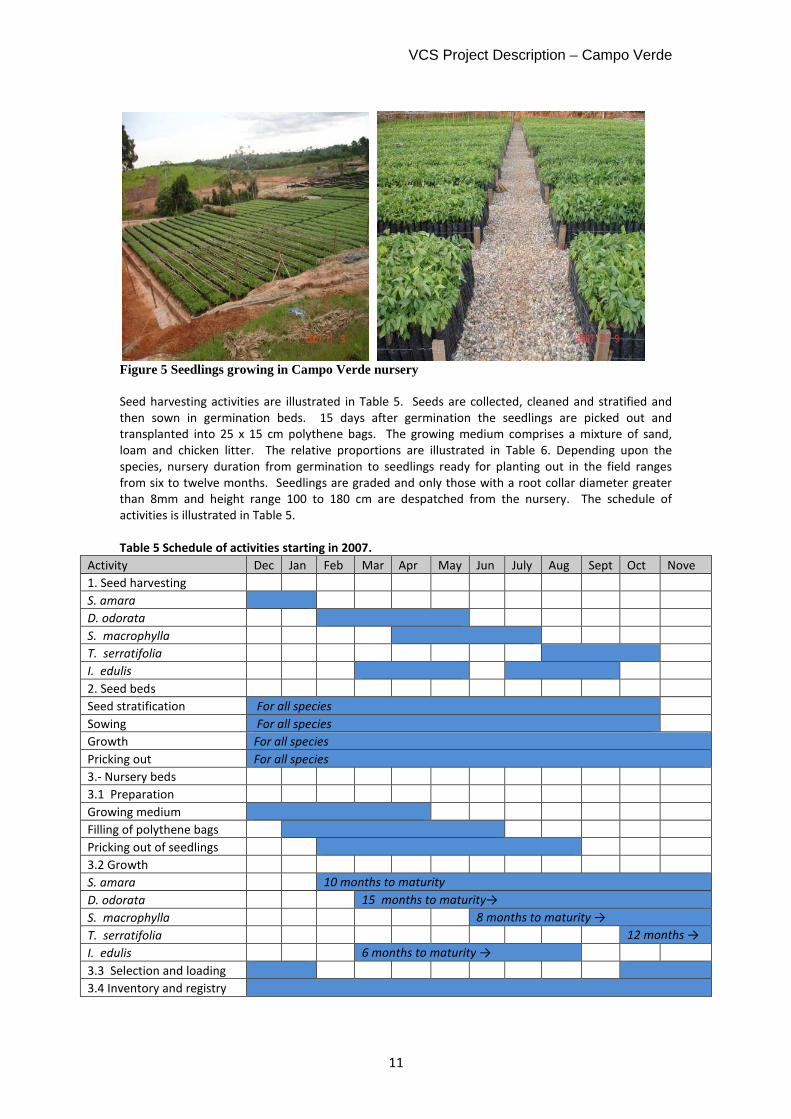
Figure 5 Seedlings growing in Campo Verde nursery
Seed harvesting activities are illustrated in Table 5. Seeds are collected, cleaned and stratified and then sown in germination beds. 15 days after germination the seedlings are picked out and transplanted into 25 x 15 cm polythene bags. The growing medium comprises a mixture of sand, loam and chicken litter. The relative proportions are illustrated in Table 6. Depending upon the species, nursery duration from germination to seedlings ready for planting out in the field ranges from six to twelve months. Seedlings are graded and only those with a root collar diameter greater than 8mm and height range 100 to 180 cm are despatched from the nursery. The schedule of activities is illustrated in Table 5. Table 5 Schedule of activities starting in 2007.
Activity Dec Jan Feb Mar Apr May Jun July Aug Sept Oct Nove
1. Seed harvesting
S. amara
D. odorata
S. macrophylla
T. serratifolia
I. edulis
2. Seed beds
Seed stratification For all species
Sowing For all species
Growth For all species
Pricking out For all species
3.- Nursery beds
3.1 Preparation
Growing medium
Filling of polythene bags
Pricking out of seedlings
3.2 Growth
S. amara 10 months to maturity
D. odorata 15 months to maturity→
S. macrophylla 8 months to maturity →
T. serratifolia 12 months →
I. edulis 6 months to maturity →
3.3 Selection and loading
3.4 Inventory and registry
VCS Project Description – Campo Verde
12
Table 6 Growing media for tree species
Species
Nursery growing media Polyethylene bags
Loam Sand Chicken manure
Mass (kg) Volume (m3)
Dimensions (cm)
I. edulis 58 28 14 2.400 0.0015 13 x 30
D. odorata 62 30 8 2.530 0.0017 18 x 23
S. amara 44 44 12 2.530 0.0017 18 x 23
S. macrophylla 62 30 8 2.530 0.0017 18 x 23
T. serratifolia 62 30 8 2.530 0.0017 18 x 23
1.9.3 Planting configurations and regimes
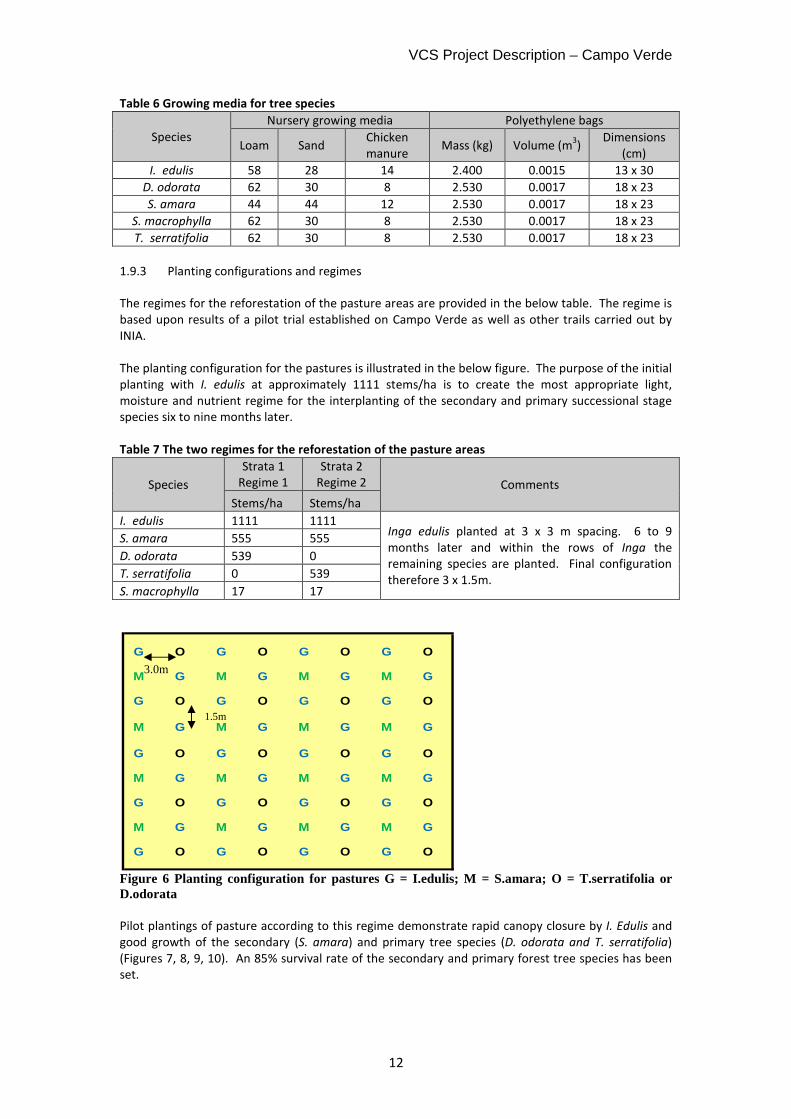
The regimes for the reforestation of the pasture areas are provided in the below table. The regime is based upon results of a pilot trial established on Campo Verde as well as other trails carried out by INIA. The planting configuration for the pastures is illustrated in the below figure. The purpose of the initial planting with I. edulis at approximately 1111 stems/ha is to create the most appropriate light, moisture and nutrient regime for the interplanting of the secondary and primary successional stage species six to nine months later. Table 7 The two regimes for the reforestation of the pasture areas
Species
Strata 1 Regime 1
Strata 2 Regime 2 Comments
Stems/ha Stems/ha
I. edulis 1111 1111 Inga edulis planted at 3 x 3 m spacing. 6 to 9 months later and within the rows of Inga the remaining species are planted. Final configuration therefore 3 x 1.5m.
S. amara 555 555
D. odorata 539 0
T. serratifolia 0 539
S. macrophylla 17 17
Figure 6 Planting configuration for pastures G = I.edulis; M = S.amara; O = T.serratifolia or D.odorata
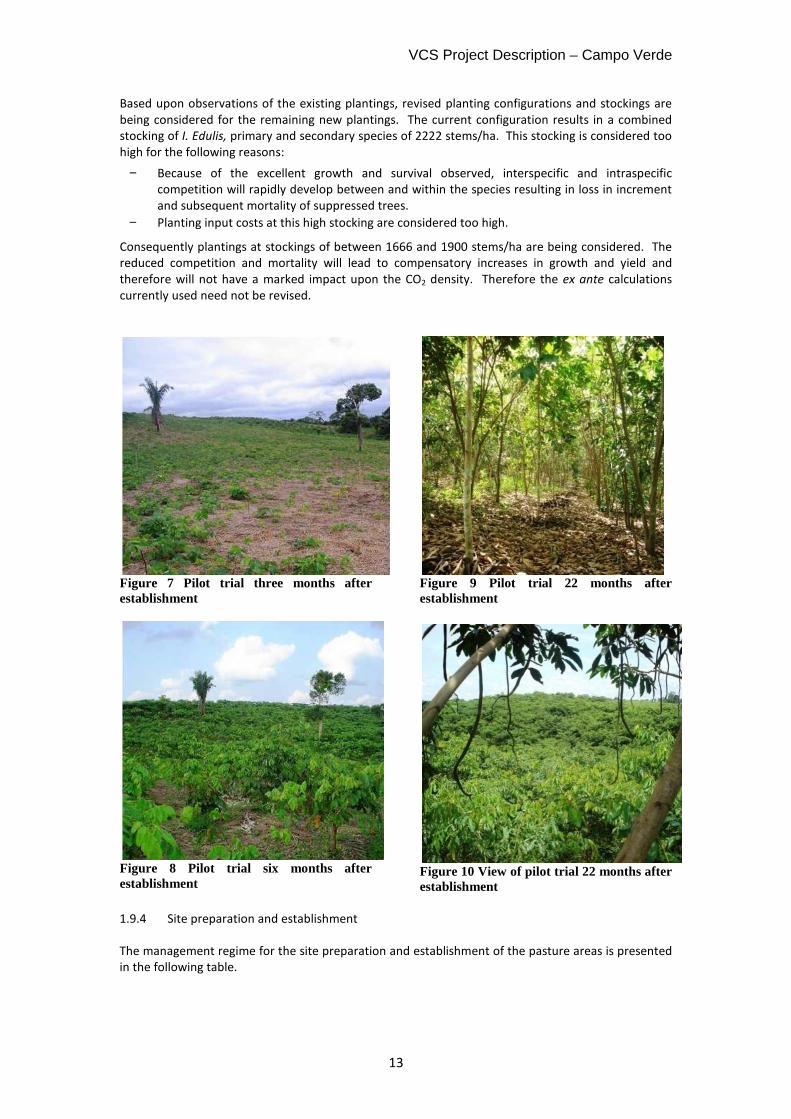
Pilot plantings of pasture according to this regime demonstrate rapid canopy closure by I. Edulis and good growth of the secondary (S. amara) and primary tree species (D. odorata and T. serratifolia) (Figures 7, 8, 9, 10). An 85% survival rate of the secondary and primary forest tree species has been set.
G O G O G O G O
M G M G M G M G
G O G O G O G O
M G M G M G M G
G O G O G O G O
M G M G M G M G
G O G O G O G O
M G M G M G M G
G O G O G O G O
3.0m
1.5m
VCS Project Description – Campo Verde
13
Based upon observations of the existing plantings, revised planting configurations and stockings are being considered for the remaining new plantings. The current configuration results in a combined stocking of I. Edulis, primary and secondary species of 2222 stems/ha. This stocking is considered too high for the following reasons:
− Because of the excellent growth and survival observed, interspecific and intraspecific competition will rapidly develop between and within the species resulting in loss in increment and subsequent mortality of suppressed trees.
− Planting input costs at this high stocking are considered too high.
Consequently plantings at stockings of between 1666 and 1900 stems/ha are being considered. The reduced competition and mortality will lead to compensatory increases in growth and yield and therefore will not have a marked impact upon the CO2 density. Therefore the ex ante calculations currently used need not be revised.
Figure 7 Pilot trial three months after establishment
Figure 8 Pilot trial six months after establishment
Figure 9 Pilot trial 22 months after establishment
Figure 10 View of pilot trial 22 months after establishment
1.9.4 Site preparation and establishment
The management regime for the site preparation and establishment of the pasture areas is presented in the following table.
VCS Project Description – Campo Verde
14
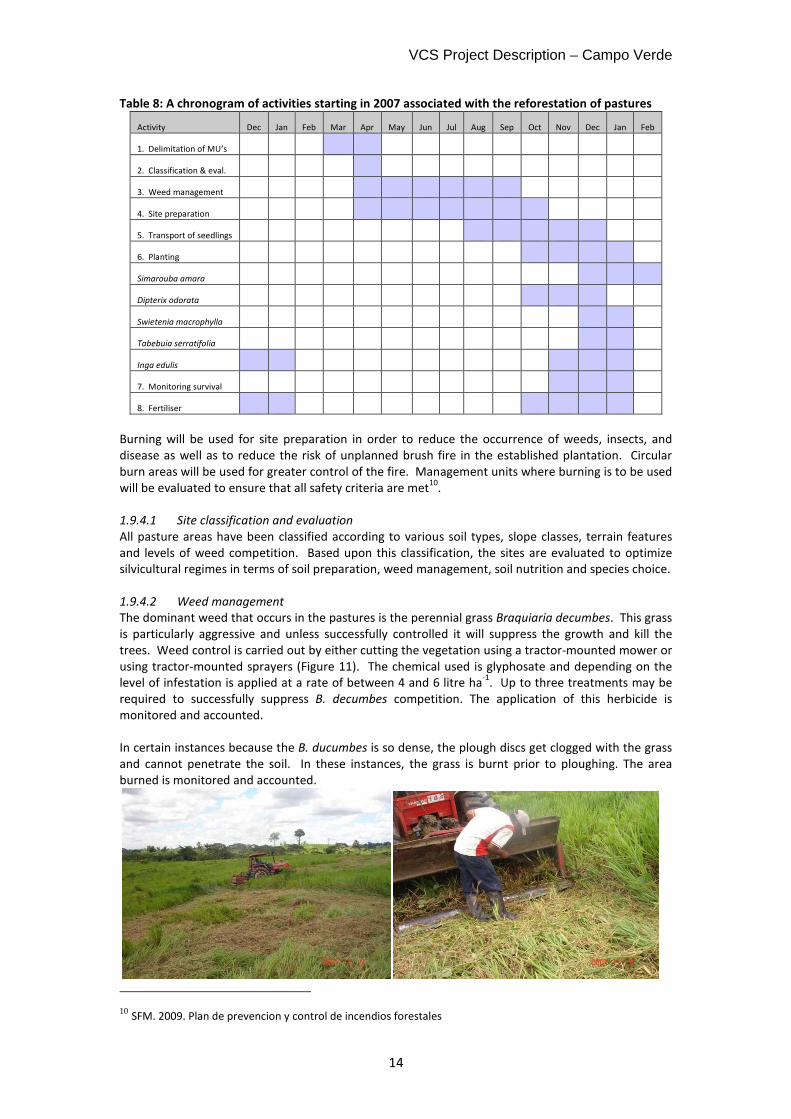
Table 8: A chronogram of activities starting in 2007 associated with the reforestation of pastures
Activity Dec Jan Feb Mar Apr May Jun Jul Aug Sep Oct Nov Dec Jan Feb
1. Delimitation of MU’s
2. Classification & eval.
3. Weed management
4. Site preparation
5. Transport of seedlings
6. Planting
Simarouba amara
Dipterix odorata
Swietenia macrophylla
Tabebuia serratifolia
Inga edulis
7. Monitoring survival
8. Fertiliser
Burning will be used for site preparation in order to reduce the occurrence of weeds, insects, and disease as well as to reduce the risk of unplanned brush fire in the established plantation. Circular burn areas will be used for greater control of the fire. Management units where burning is to be used will be evaluated to ensure that all safety criteria are met
10.
1.9.4.1 Site classification and evaluation
All pasture areas have been classified according to various soil types, slope classes, terrain features and levels of weed competition. Based upon this classification, the sites are evaluated to optimize silvicultural regimes in terms of soil preparation, weed management, soil nutrition and species choice. 1.9.4.2 Weed management
The dominant weed that occurs in the pastures is the perennial grass Braquiaria decumbes. This grass is particularly aggressive and unless successfully controlled it will suppress the growth and kill the trees. Weed control is carried out by either cutting the vegetation using a tractor-mounted mower or using tractor-mounted sprayers (Figure 11). The chemical used is glyphosate and depending on the level of infestation is applied at a rate of between 4 and 6 litre ha
-1. Up to three treatments may be
required to successfully suppress B. decumbes competition. The application of this herbicide is monitored and accounted. In certain instances because the B. ducumbes is so dense, the plough discs get clogged with the grass and cannot penetrate the soil. In these instances, the grass is burnt prior to ploughing. The area burned is monitored and accounted.
10 SFM. 2009. Plan de prevencion y control de incendios forestales
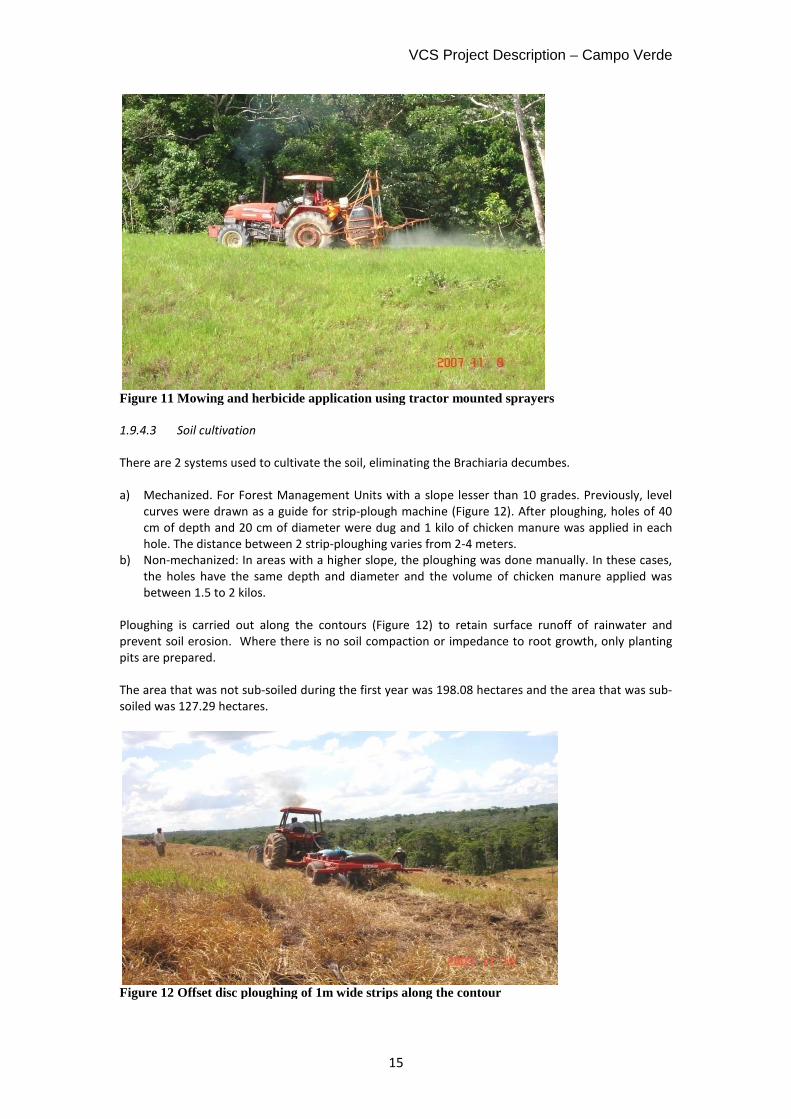
Figure 11 Mowing and herbicide application using tract 1.9.4.3 Soil cultivation
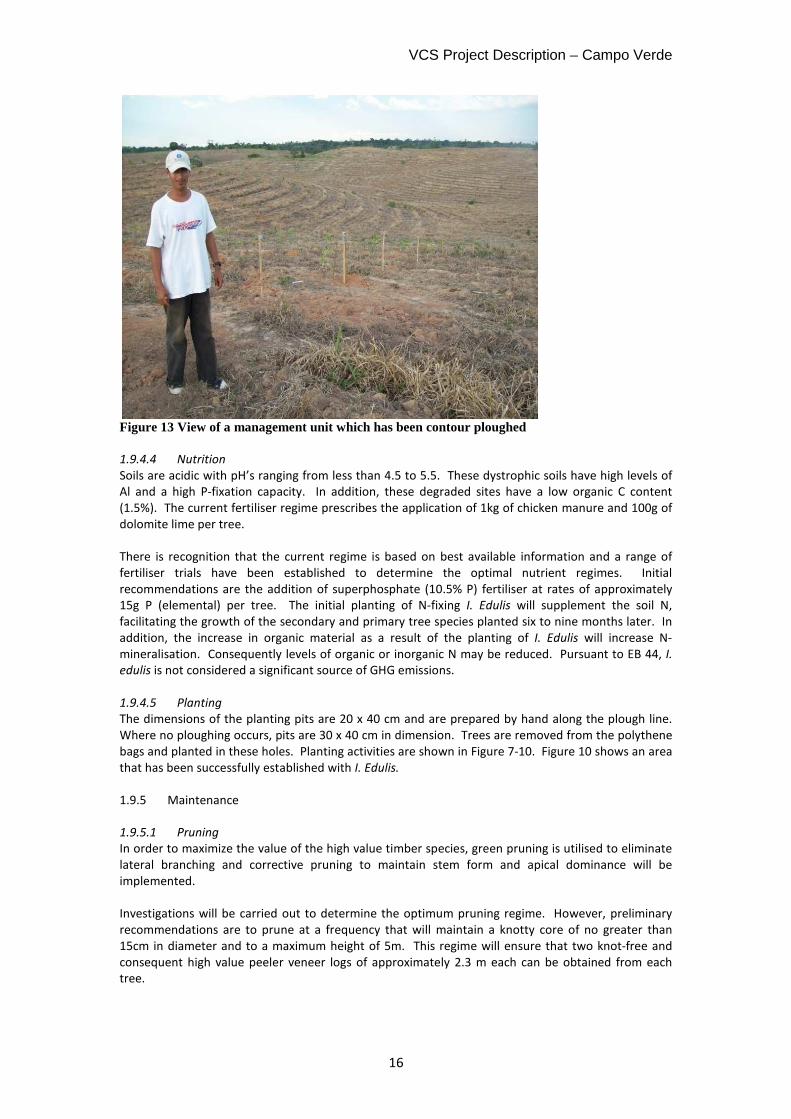
There are 2 systems used to cultivate the soil, eliminating the Brachiaria decumbes. a) Mechanized. For Forest Management Units with a slope lesser than 10 grades. Previously, level
curves were drawn as a guide for cm of depth and 20 cm of diameter were dug and 1 kilo of chicken manure was applied in each hole. The distance between 2
b) Non-mechanized: In areas with a the holes have the same depth and diameter and the volume of chicken manure applied was between 1.5 to 2 kilos.
Ploughing is carried out along the contours (Figure 1prevent soil erosion. Where there is no soil compaction or impedance to root growth, only planting pits are prepared. The area that was not sub-soiled during the first year was 198.08 hectares and the area that was subsoiled was 127.29 hectares.
Figure 12 Offset disc ploughing of 1m wide strips along the contour
VCS Project Description –
15
Mowing and herbicide application using tractor mounted sprayers
There are 2 systems used to cultivate the soil, eliminating the Brachiaria decumbes.
Mechanized. For Forest Management Units with a slope lesser than 10 grades. Previously, level curves were drawn as a guide for strip-plough machine (Figure 12). After ploughingcm of depth and 20 cm of diameter were dug and 1 kilo of chicken manure was applied in each hole. The distance between 2 strip-ploughing varies from 2-4 meters.
mechanized: In areas with a higher slope, the ploughing was done manually. In these cases, the holes have the same depth and diameter and the volume of chicken manure applied was
Ploughing is carried out along the contours (Figure 12) to retain surface runoff prevent soil erosion. Where there is no soil compaction or impedance to root growth, only planting
soiled during the first year was 198.08 hectares and the area that was sub
Offset disc ploughing of 1m wide strips along the contour
– Campo Verde
Mechanized. For Forest Management Units with a slope lesser than 10 grades. Previously, level ploughing, holes of 40
cm of depth and 20 cm of diameter were dug and 1 kilo of chicken manure was applied in each
was done manually. In these cases, the holes have the same depth and diameter and the volume of chicken manure applied was
of rainwater and prevent soil erosion. Where there is no soil compaction or impedance to root growth, only planting
soiled during the first year was 198.08 hectares and the area that was sub-
VCS Project Description – Campo Verde
16
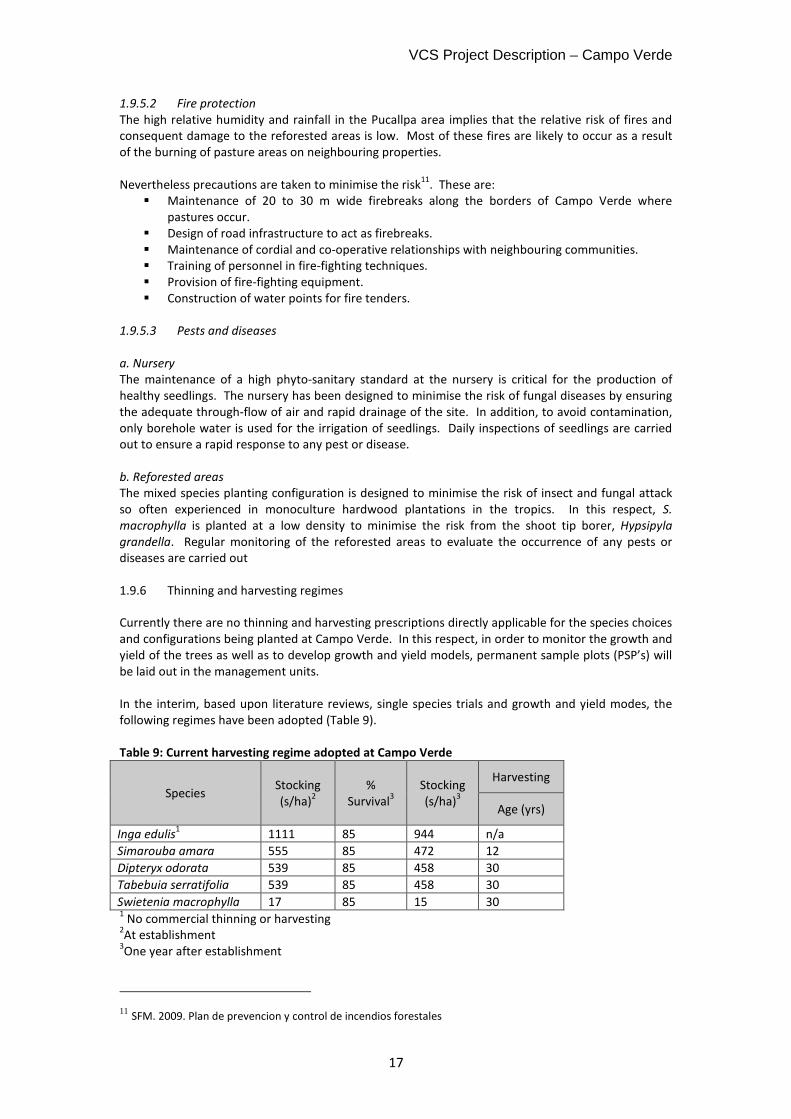
Figure 13 View of a management unit which has been contour ploughed
1.9.4.4 Nutrition
Soils are acidic with pH’s ranging from less than 4.5 to 5.5. These dystrophic soils have high levels of Al and a high P-fixation capacity. In addition, these degraded sites have a low organic C content (1.5%). The current fertiliser regime prescribes the application of 1kg of chicken manure and 100g of dolomite lime per tree. There is recognition that the current regime is based on best available information and a range of fertiliser trials have been established to determine the optimal nutrient regimes. Initial recommendations are the addition of superphosphate (10.5% P) fertiliser at rates of approximately 15g P (elemental) per tree. The initial planting of N-fixing I. Edulis will supplement the soil N, facilitating the growth of the secondary and primary tree species planted six to nine months later. In addition, the increase in organic material as a result of the planting of I. Edulis will increase N-mineralisation. Consequently levels of organic or inorganic N may be reduced. Pursuant to EB 44, I. edulis is not considered a significant source of GHG emissions. 1.9.4.5 Planting
The dimensions of the planting pits are 20 x 40 cm and are prepared by hand along the plough line. Where no ploughing occurs, pits are 30 x 40 cm in dimension. Trees are removed from the polythene bags and planted in these holes. Planting activities are shown in Figure 7-10. Figure 10 shows an area that has been successfully established with I. Edulis.
1.9.5 Maintenance
1.9.5.1 Pruning
In order to maximize the value of the high value timber species, green pruning is utilised to eliminate lateral branching and corrective pruning to maintain stem form and apical dominance will be implemented. Investigations will be carried out to determine the optimum pruning regime. However, preliminary recommendations are to prune at a frequency that will maintain a knotty core of no greater than 15cm in diameter and to a maximum height of 5m. This regime will ensure that two knot-free and consequent high value peeler veneer logs of approximately 2.3 m each can be obtained from each tree.
VCS Project Description – Campo Verde
17
1.9.5.2 Fire protection
The high relative humidity and rainfall in the Pucallpa area implies that the relative risk of fires and consequent damage to the reforested areas is low. Most of these fires are likely to occur as a result of the burning of pasture areas on neighbouring properties. Nevertheless precautions are taken to minimise the risk
11. These are:
� Maintenance of 20 to 30 m wide firebreaks along the borders of Campo Verde where pastures occur.
� Design of road infrastructure to act as firebreaks. � Maintenance of cordial and co-operative relationships with neighbouring communities. � Training of personnel in fire-fighting techniques. � Provision of fire-fighting equipment. � Construction of water points for fire tenders.
1.9.5.3 Pests and diseases
a. Nursery
The maintenance of a high phyto-sanitary standard at the nursery is critical for the production of healthy seedlings. The nursery has been designed to minimise the risk of fungal diseases by ensuring the adequate through-flow of air and rapid drainage of the site. In addition, to avoid contamination, only borehole water is used for the irrigation of seedlings. Daily inspections of seedlings are carried out to ensure a rapid response to any pest or disease. b. Reforested areas
The mixed species planting configuration is designed to minimise the risk of insect and fungal attack so often experienced in monoculture hardwood plantations in the tropics. In this respect, S.
macrophylla is planted at a low density to minimise the risk from the shoot tip borer, Hypsipyla
grandella. Regular monitoring of the reforested areas to evaluate the occurrence of any pests or diseases are carried out 1.9.6 Thinning and harvesting regimes
Currently there are no thinning and harvesting prescriptions directly applicable for the species choices and configurations being planted at Campo Verde. In this respect, in order to monitor the growth and yield of the trees as well as to develop growth and yield models, permanent sample plots (PSP’s) will be laid out in the management units. In the interim, based upon literature reviews, single species trials and growth and yield modes, the following regimes have been adopted (Table 9). Table 9: Current harvesting regime adopted at Campo Verde
Species Stocking (s/ha)
2 %
Survival3
Stocking (s/ha)
3
Harvesting
Age (yrs)
Inga edulis1
1111 85 944 n/a
Simarouba amara 555 85 472 12
Dipteryx odorata 539 85 458 30
Tabebuia serratifolia 539 85 458 30
Swietenia macrophylla 17 85 15 30 1 No commercial thinning or harvesting
2At establishment
3One year after establishment
11 SFM. 2009. Plan de prevencion y control de incendios forestales
VCS Project Description – Campo Verde
18
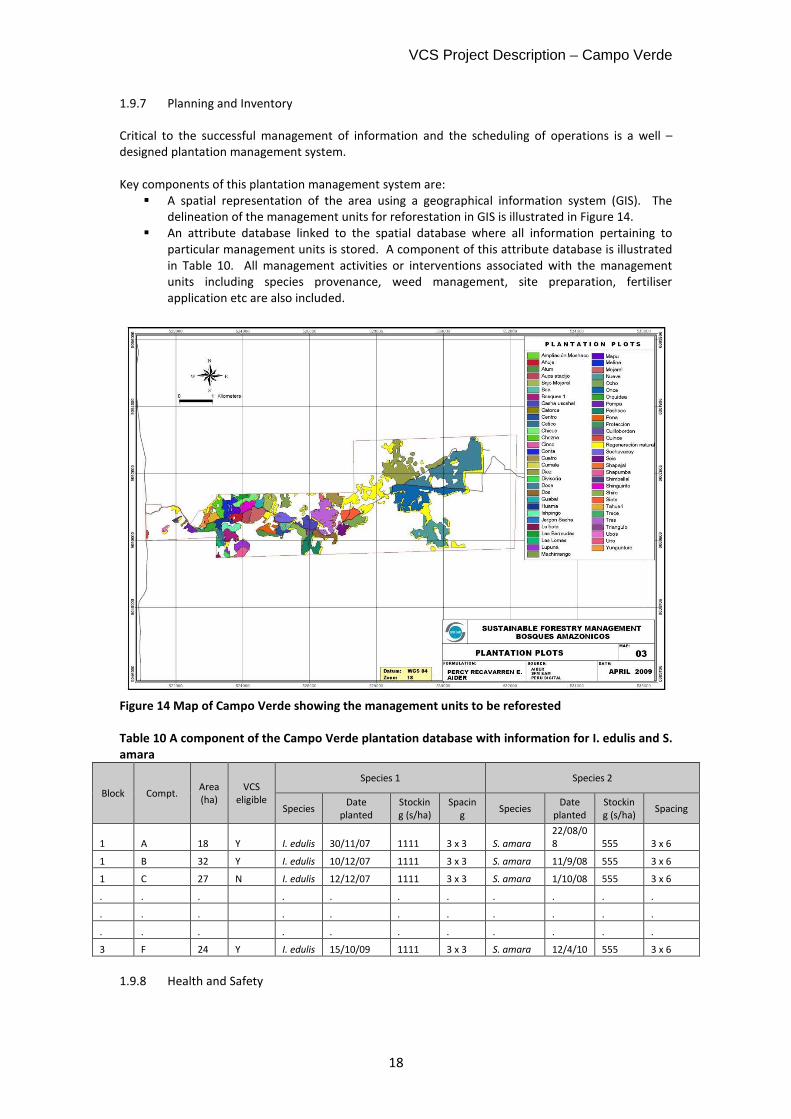
1.9.7 Planning and Inventory
Critical to the successful management of information and the scheduling of operations is a well –designed plantation management system. Key components of this plantation management system are:
� A spatial representation of the area using a geographical information system (GIS). The delineation of the management units for reforestation in GIS is illustrated in Figure 14.
� An attribute database linked to the spatial database where all information pertaining to particular management units is stored. A component of this attribute database is illustrated in Table 10. All management activities or interventions associated with the management units including species provenance, weed management, site preparation, fertiliser application etc are also included.
Figure 14 Map of Campo Verde showing the management units to be reforested
Table 10 A component of the Campo Verde plantation database with information for I. edulis and S.
amara
Block Compt. Area (ha)
VCS eligible
Species 1 Species 2
Species Date
planted Stocking (s/ha)
Spacing
Species Date
planted Stocking (s/ha)
Spacing
1 A 18 Y I. edulis 30/11/07 1111 3 x 3 S. amara
22/08/08 555 3 x 6
1 B 32 Y I. edulis 10/12/07 1111 3 x 3 S. amara 11/9/08 555 3 x 6
1 C 27 N I. edulis 12/12/07 1111 3 x 3 S. amara 1/10/08 555 3 x 6
. . . . . . . . . . .
. . . . . . . . . . .
. . . . . . . . . . .
3 F 24 Y I. edulis 15/10/09 1111 3 x 3 S. amara 12/4/10 555 3 x 6
1.9.8 Health and Safety
VCS Project Description – Campo Verde
19
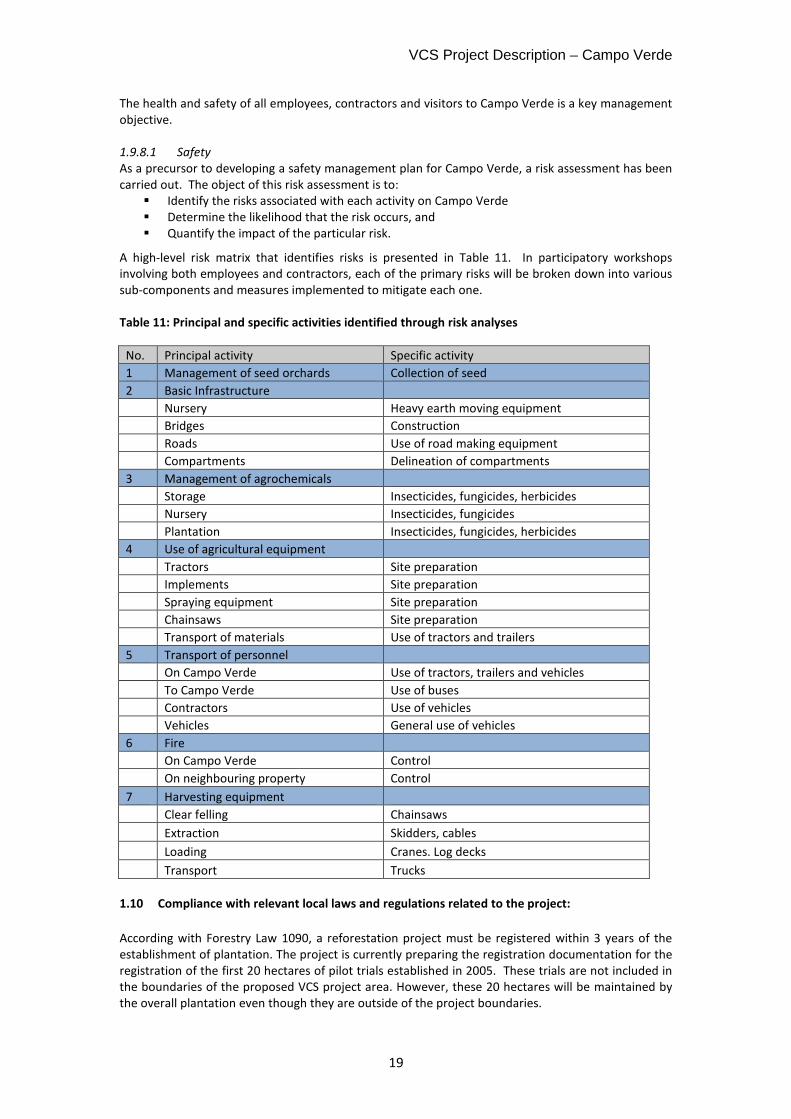
The health and safety of all employees, contractors and visitors to Campo Verde is a key management objective. 1.9.8.1 Safety
As a precursor to developing a safety management plan for Campo Verde, a risk assessment has been carried out. The object of this risk assessment is to:
� Identify the risks associated with each activity on Campo Verde � Determine the likelihood that the risk occurs, and � Quantify the impact of the particular risk.
A high-level risk matrix that identifies risks is presented in Table 11. In participatory workshops involving both employees and contractors, each of the primary risks will be broken down into various sub-components and measures implemented to mitigate each one. Table 11: Principal and specific activities identified through risk analyses
No. Principal activity Specific activity
1 Management of seed orchards Collection of seed
2 Basic Infrastructure
Nursery Heavy earth moving equipment
Bridges Construction
Roads Use of road making equipment
Compartments Delineation of compartments
3 Management of agrochemicals
Storage Insecticides, fungicides, herbicides
Nursery Insecticides, fungicides
Plantation Insecticides, fungicides, herbicides
4 Use of agricultural equipment
Tractors Site preparation
Implements Site preparation
Spraying equipment Site preparation
Chainsaws Site preparation
Transport of materials Use of tractors and trailers
5 Transport of personnel
On Campo Verde Use of tractors, trailers and vehicles
To Campo Verde Use of buses
Contractors Use of vehicles
Vehicles General use of vehicles
6 Fire
On Campo Verde Control
On neighbouring property Control
7 Harvesting equipment
Clear felling Chainsaws
Extraction Skidders, cables
Loading Cranes. Log decks
Transport Trucks
1.10 Compliance with relevant local laws and regulations related to the project:
According with Forestry Law 1090, a reforestation project must be registered within 3 years of the establishment of plantation. The project is currently preparing the registration documentation for the registration of the first 20 hectares of pilot trials established in 2005. These trials are not included in the boundaries of the proposed VCS project area. However, these 20 hectares will be maintained by the overall plantation even though they are outside of the project boundaries.
VCS Project Description – Campo Verde
20
Regarding the use of fire as part of forest management practices, pursuant to point G of Article 410 of the Forestry and Wild Life Law, DS 002-2009-AG, DL N
o 1090
12 and Law 29317, there is no legal
restriction regarding the use of fire as a management technique in site preparation. Therefore it is not necessary to seek authorization for the use of fire as a management technique. According to national laws, a plantation that applies for registration must be registered in INRENA, the national office for natural resources. Also, a management plan should be developed and sent to INRENA for approval. Forest plantations must be registered with the Forestry and Wildlife Regional Office within three years of establishment according to Article 154 of the Forestry and Wild Life Law, DS 002-2009-AG and TUPA INRENA 2008
13. Campo Verde is in the process of obtaining the required
documents for registration. At this time, the management plan14
is being developed by an AIDER-SFM-BAM team and will be concluded soon and submitted to INRENA. 1.11 Identification of risks that may substantially affect the project’s GHG emission reductions or
removal enhancements:
Project Management to reduce loss of permanence:
The project will establish a permanent plantation with regular rotation periods on lands owned by the project developers and managed by a team of experienced foresters. The project developer, SFM, is a company with sound financial practices and is financially invested in the successful continuation of the project area as a highly productive plantation. As documented in the management plan
15 and section 1.9, the plantation has been carefully designed
to minimize the risk of loss of permanence. Firebreaks have been created, a fire-fighting strategy has been developed and outreach and fire reduction strategies are being carried out with land owners from surrounding properties to reduce the use and threat of fire
16. Attack of trees by pests and
disease will be carefully managed and monitored using a best practice and adaptive management approach. The planting design and schedule has been developed to minimize commonly known pest and disease problems. Non-permanence risk Analysis
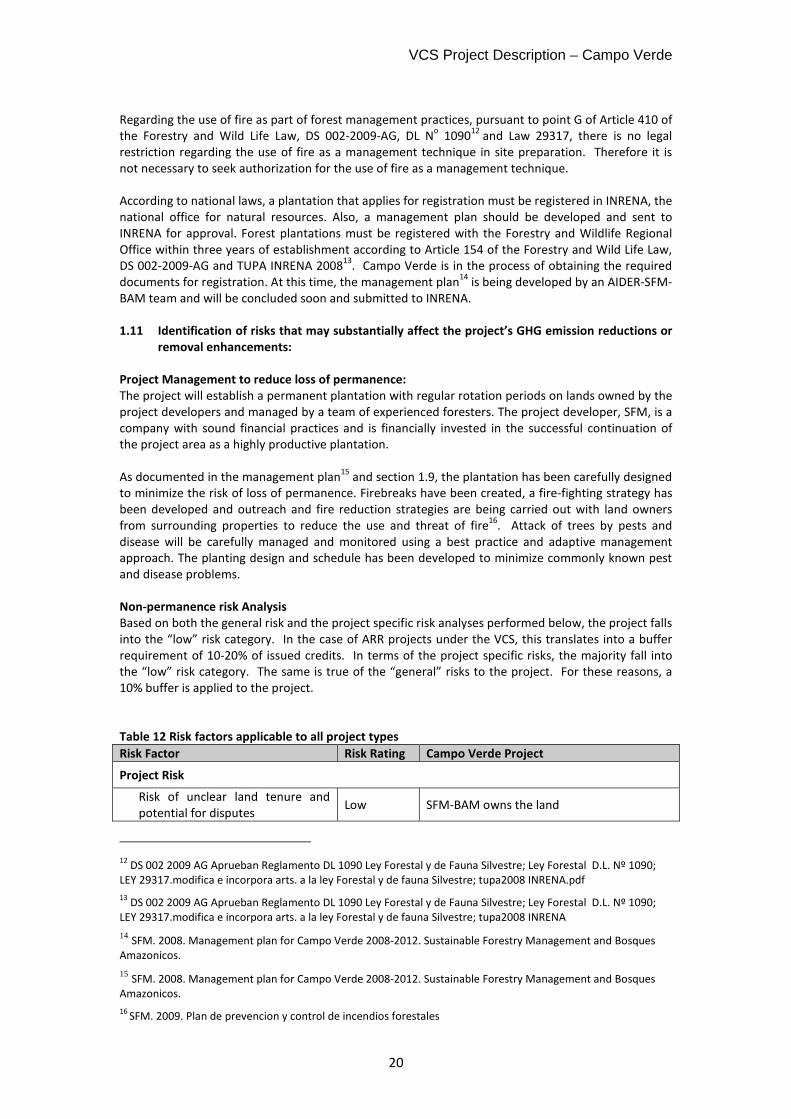
Based on both the general risk and the project specific risk analyses performed below, the project falls into the “low” risk category. In the case of ARR projects under the VCS, this translates into a buffer requirement of 10-20% of issued credits. In terms of the project specific risks, the majority fall into the “low” risk category. The same is true of the “general” risks to the project. For these reasons, a 10% buffer is applied to the project. Table 12 Risk factors applicable to all project types
Risk Factor Risk Rating Campo Verde Project
Project Risk
Risk of unclear land tenure and potential for disputes
Low SFM-BAM owns the land
12
DS 002 2009 AG Aprueban Reglamento DL 1090 Ley Forestal y de Fauna Silvestre; Ley Forestal D.L. Nº 1090; LEY 29317.modifica e incorpora arts. a la ley Forestal y de fauna Silvestre; tupa2008 INRENA.pdf
13 DS 002 2009 AG Aprueban Reglamento DL 1090 Ley Forestal y de Fauna Silvestre; Ley Forestal D.L. Nº 1090;
LEY 29317.modifica e incorpora arts. a la ley Forestal y de fauna Silvestre; tupa2008 INRENA
14 SFM. 2008. Management plan for Campo Verde 2008-2012. Sustainable Forestry Management and Bosques Amazonicos. 15 SFM. 2008. Management plan for Campo Verde 2008-2012. Sustainable Forestry Management and Bosques Amazonicos.
16 SFM. 2009. Plan de prevencion y control de incendios forestales
VCS Project Description – Campo Verde
21
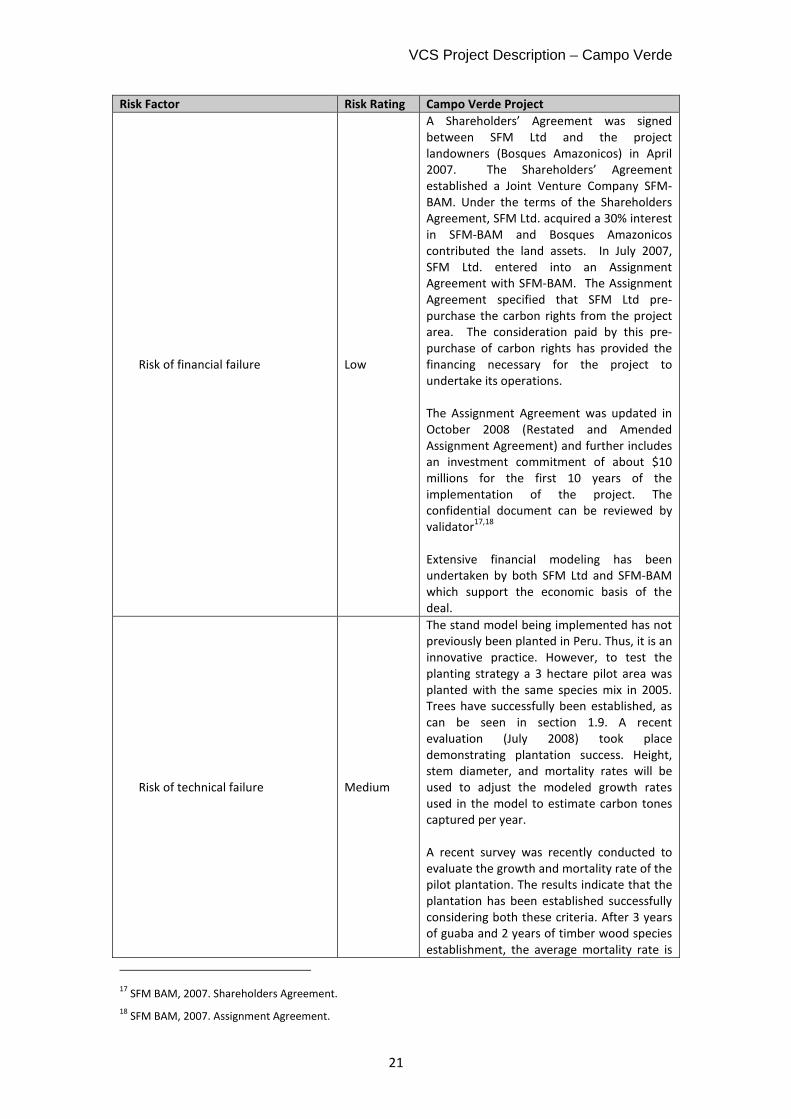
Risk Factor Risk Rating Campo Verde Project
Risk of financial failure Low
A Shareholders’ Agreement was signed between SFM Ltd and the project landowners (Bosques Amazonicos) in April 2007. The Shareholders’ Agreement established a Joint Venture Company SFM-BAM. Under the terms of the Shareholders Agreement, SFM Ltd. acquired a 30% interest in SFM-BAM and Bosques Amazonicos contributed the land assets. In July 2007, SFM Ltd. entered into an Assignment Agreement with SFM-BAM. The Assignment Agreement specified that SFM Ltd pre-purchase the carbon rights from the project area. The consideration paid by this pre-purchase of carbon rights has provided the financing necessary for the project to undertake its operations. The Assignment Agreement was updated in October 2008 (Restated and Amended Assignment Agreement) and further includes an investment commitment of about $10 millions for the first 10 years of the implementation of the project. The confidential document can be reviewed by validator
17,18
Extensive financial modeling has been undertaken by both SFM Ltd and SFM-BAM which support the economic basis of the deal.
Risk of technical failure Medium
The stand model being implemented has not previously been planted in Peru. Thus, it is an innovative practice. However, to test the planting strategy a 3 hectare pilot area was planted with the same species mix in 2005. Trees have successfully been established, as can be seen in section 1.9. A recent evaluation (July 2008) took place demonstrating plantation success. Height, stem diameter, and mortality rates will be used to adjust the modeled growth rates used in the model to estimate carbon tones captured per year. A recent survey was recently conducted to evaluate the growth and mortality rate of the pilot plantation. The results indicate that the plantation has been established successfully considering both these criteria. After 3 years of guaba and 2 years of timber wood species establishment, the average mortality rate is
17
SFM BAM, 2007. Shareholders Agreement.
18 SFM BAM, 2007. Assignment Agreement.
VCS Project Description – Campo Verde
22
Risk Factor Risk Rating Campo Verde Project
4% for the guaba and 1% for the timber wood species. SFM-BAM has a highly skilled group of Peruvian Foresters working at the reforestation site. Expert forestry consultants have been consulted on the forestry planting regime and management, as well as relevant literature sources consulted.
Risk of management failure Medium
The project has an experienced management team, covering a range of relevant expertise. The CV’s of key personnel have been submitted to the third party validator including: - General manager - Administrator - Field Manager - Nursery Manager - Forest Specialist - GIS Specialist - Carbon Specialist - Monitoring Responsible
Economic Risk
Risk of rising land opportunity costs that cause reversal of sequestration and/or protection
Low
There is always a risk that alternative economic activities will raise land opportunity costs and threaten reversal of sequestration in a project area. This risk, however, is mitigated in several ways in the Campo Verde project.
1. The project is on freehold land owned by the project developer, SFM- BAM. This enables the project management to take a long-term perspective on the underlying business opportunity.
2. The project’s management has specifically targeted this land for reforestation. The lands in the surrounding area currently support little economic activity, apart from low-density cattle grazing and subsistence agriculture. Degradation trends across the project area show that the current state of the lands is likely to persist in its current condition as it has done since the 1980’s. Large scale, commercial cattle ranching was abandoned many years ago due to the economic downturn and terrorist activity, and was not re-established due to the degraded state of the lands and hence the prospect of low returns in the future.
VCS Project Description – Campo Verde
23
Risk Factor Risk Rating Campo Verde Project
Reforestation is a long-term activity and is unique in that the value of “inventory” accrues the longer the trees are in the ground. Many of the trees in the Campo Verde project have been planted on a 30 year rotation and revenues are to be generated both by timber and carbon. Land opportunity costs may rise in the surrounding areas (though unlikely, see point 2 above), but this will be offset by the rising economic value of trees (in terms of timber value) and carbon on the project land over time.
Regulator and social risk
Risk of political instability Low
Political stability has been maintained on almost invariable low ratings according to indicators provided by the Multilateral Investment Guarantee Agency (MIGA) of the World Bank. For example, it has an overall risk rating of 6.7 on a scale of 1 to 10 (0 maximum risk; 10 no risk). This compares very favorably with other countries in the region such as Ecuador (4.0), Argentina (4.1) Brazil (5.3), and even Chile (6.0), all with lower ratings and thus higher perceived political risk. This low political risk has translated into the attainment of investment grade by the country that has been provided in the last two years by Fitch (currently BBB-), Moody’s (Ba1), and Standard and Poor’s (BBB-). All these ratings are showing sustained increases over time due to the consolidation of economic reforms and very robust macro-economic performance of the country. According to the “Evaluación de Riesgos Sociales del Proyecto de Manejo Forestal en Areas Degradadas con Fines de Certificación para la Venta a Futuro del Vuelo Forestal”, elaborated by the Social Capital Group, there is a risk (medium likelihood and high significance) of project failure due to political reasons. These ratings were provided taking into account the overall risk perception of the country based on the paragraphs above. It is noteworthy that such risks in the Social Assessment were estimated in 2006; since
VCS Project Description – Campo Verde
24
Risk Factor Risk Rating Campo Verde Project
then, country risk in Peru has decreased even further.
19
Risk of social instability
There has been no wide-spread social unrest in Peru in the recent past. This area is relatively rural and has not experienced any unrest since the Shining Path period. SFM-BAM has made a commitment toward working directly with the surrounding local communities and local government and has a strong positive relationship with the major stakeholders. There were no people living within the boundaries of the project prior to the start of project activities and all the project land is privately owned. There were four families living outside the project area, but within the SFM-BAM property at the start of the project. These families were aware they were living on SFM-BAM land and were moved to existing lands covered by pasture and cropland.
20
While recent national political issues concerning the rights of indigenous people have affected the communities of the Ucayali region, to this date violent protests and confrontations between groups have not occurred nor has the region observed any national strike. In the Ucayali region political dissent is expressed in the form of peaceful marches and meetings.
21
Natural disturbance risk
Risk of devastating fire Low
The risk of devastating fire was calculated using: VCS “Tool for AFOLU Non-Permanence Risk Analysis and Buffer Determination, Appendix A”
22. Using this tool, the risk was
classified as “Low” 23
.
19
World Bank Group, 2007. Political Risk Insurance Center – Country Analysis – Peru. http://www.pri-center.com/country/country_specific.cfm?countrynum=156
20 La Torre, L., 2009. Ubicacion de Familias. Informe No. 009-2009-SFM BAM SAC-LLATC. SFM BAM. 21 AIDER, SFM BAM., 2009. Informe: Aspecto Social. 22
VCS. Tool for AFOLU Non-Permanence Risk Analysis and Buffer Determination. http://www.v-c-s.org/docs/Tool%20for%20AFOLU%20Non-Permanence%20Risk%20Analysis%20and%20Buffer%20Determination.pdf
23 SFM, 2009. Calculation of Risk Class for Devastative Fire.
VCS Project Description – Campo Verde
25
Risk Factor Risk Rating Campo Verde Project
Although wildfires do occur in Peru,
24 the risk
of fire compared to other South American countries is extremely low - records going back to 1973 show that overall the occurrence of fires was low though the frequency of fires increased in early 2000’s.
25
Therefore it is assumed that a devastative fire event is likely to occur less than once during the life of the project. SFM has a strong commitment to preventing any fires from taking place. A Fire Prevention Plan has been developed and is currently being implemented.
26 The Plan identifies
factors that cause fires and includes a map of potential fire risk areas. It outlines countermeasures using best practices specifically adapted to the conditions found in the project area and describes protocols, training and procedures for review and internal auditing with periodical meetings and workshops with neighboring land owners. A fire prevention team has been created and trained to act when necessary.
Risk of pest and disease attacks Low
SFM will address the complex problem of pest and disease attacks with an integrated pest management program. A contract has been created with the Servicio Nacional de Sanidad Agraria (SENASA) to initiate studies of ecological pest and disease control. Until now the only pest problem of economic significance has been the attack of an insect of the genus Tropidacris. The attack was immediately controlled by ecological means as mentioned in the document “Control Langosta by Campo Verde”
27.
On the other hand, attacks of Umbonia sp., a parasite that causes defoliation, have been observed in gauba. Personnel of SFM discovered that this insect can be controlled naturally with Bauveria sp. This natural control will be propogated by SFM and will
24
Fire Information for Resource Management System, University of Maryland, 2009. Web Fire Mapper: South
America. http://maps.geog.umd.edu/firms/ 25 Manta, M., 2006. Global Forest Resources Assessment 2005 – Report on fires in the South American Region. Food and Agriculture Organization of the United Nations. 26
SFM. 2009. Plan de prevencion y control de incendios forestales
27 Chavez, J. Estado actual de la poblacion de “Langosta” – Tropidacris sp.
VCS Project Description – Campo Verde
26
Risk Factor Risk Rating Campo Verde Project
be applied to avoid damage to guaba by Umbonia sp.
Risk of extreme weather events Low
The only common extreme climatic events in the region are strong winds and floods
28 .
Both events occur with greater frequency during the rainy season from December through April. The study shows strong winds affect crops but extensive damage to natural forest or forest plantations has not been reported. Strong winds only affect isolated trees and trees on the edges of forests. Floods primarily affect low-lying regions and risk of floods in the project area is minimal due to its topography. When rivers in the region overflow their banks waters usually recede within a matter of hours. With regards to the risk of drought from ENSO, ENSO events typically occur every 2 to 7 years and drought can occur anywhere in the world during an ENSO event, however there is not a strong connection between ENSO events and drought in Peru.
29 Although
droughts associated with ENSO have occurred in the Amazon region, prolonged droughts in the Ucuyali region have not been registered and there is no reason to believe that a drought associated with ENSO is likely to occur in the region nor that this would be severe enough to damage plantation species.
Geological risk Low
Geologic risks are not probable. The National Centre for Geophysical Data (an office in the Peruvian Geophysical Institute) considers this area as a low geological risk area as it is not located in the active seismic area of Peru.
30 The latest earthquake
occurred in 1981 and was not severe.
Table 13 Risk factors applicable to ARR projects
Risk Factor Risk Rating Campo Verde Project
Project longevity/Commitment Period
Long-term commitment with harvesting
Medium A permanent plantation is planned. Based on the management plan, the tree species
28
SINADECI, 2005. Compendio Estadístico del SINADECI 2003 y 2004; SINADECI, 2008. Compendio Estadístico de Prevención y Atención de Desastres 2005, 2006 y 2007
29 National Drought Mitigation Center, University of Nebraska – Lincoln, 2009. Understanding ENSO and
Forecasting Drought. http://drought.unl.edu/whatis/elnino.htm 30
Peruvian Geophysical Institute, 2009. Marco Geologico y Geodinamico; Peruvian Geophysical Institute, 1998. Areas de peligrosidad por caidas de tefras volcan ubinas; Centro Nacional de Datos Geofisicos de Peru, 2009. Datos de sismologia.
VCS Project Description – Campo Verde
27
Risk Factor Risk Rating Campo Verde Project
Marupa will be harvested at year 12 and the remaining trees harvested at year 30. The area will then be replanted to begin a subsequent rotation period.
Ownership type
Established NGO or conservation agency; owner-operated private land
Low SFM-BAM owns the land ( see section 8.1)
Technical capability
Technologies proven to be effective in other regions under similar soil and climate conditions but lacking local experimental results and having limited access to relevant expertise
Medium
A native species plantation of this size has not previously been planted in Peru. Thus, it is an innovative practice. However, to test the planting strategy a 3 hectare pilot area was planted with the same species mix in 2005. Trees have successfully been established, as can be seen in section 1.9. A recent evaluation (July 2008) took place demonstrating plantation success. Height, stem diameter, and mortality rates will be used to adjust the modeled growth rates used in the model to estimate carbon sequesteredeach year. A survey was recently conducted to evaluate the growth and mortality rate of pilot plantation. The results indicate that the plantation has been established successfully considering both these criteria. After 3 years of guaba and 2 years of timber wood species establishment, the average mortality rate is 4% for the guaba and 1% for the timber wood species. SFM-BAM has a highly skilled group of Peruvian foresters working at the reforestation site. Expert forestry consultants have been consulting on the forestry planting regime and management, as well as relevant literature sources consulted. This pilot area is not included within the carbon project boundaries
Financial capacity
Demonstrable backing from established financial institutions, NGOs and governments
Low
A Shareholders’ Agreement was signed between SFM Ltd and the project landowners (Bosques Amazonicos) in April 2007. The Shareholders’ Agreement established a Joint Venture Company SFM-BAM. Under the terms of the Shareholders Agreement, SFM Ltd. acquired a 30% interest in SFM-BAM and Bosques Amazonicos contributed the land assets. In July 2007, SFM Ltd. entered into an Assignment Agreement with SFM-BAM. The Assignment Agreement specifies that SFM Ltd pre-purchase the carbon rights from the project
VCS Project Description – Campo Verde
28
Risk Factor Risk Rating Campo Verde Project
area. The consideration paid by this pre-purchase of carbon rights has provided the financing necessary for the project to undertake its operations. The Assignment Agreement was updated in October 2008 and further includes an investment commitment of about $20 millions for the first 10 years of the implementation of the project. The confidential document can be reviewed by validator
31,32
Extensive financial modeling has been undertaken by both SFM Ltd and SFM-BAM which support the economic basis of the deal.
Management capacity
Limited project experience (<5 years) with on-site management team
Medium
The project has an experienced management team, covering a range of relevant expertise. The CV’s of key personnel have been submitted to the third party validator including: - General manager - Administrator - Field Manager - Nursery Manager - Forest Specialist - GIS Specialist - Carbon Specialist - Monitoring Responsible
Future income
Appropriate management plan and financial analysis include future income to finance future management activities (e.g. carbon finance to be used for project management, tending operations etc.)
Low
SFM-BAM will generate revenues from two sources: 1. the sale of carbon emissions offsets under the guidelines of the Voluntary Carbon Credits Standard, and, 2. the sale of certified high-value timber (tropical hardwoods) Extensive and detailed cash flow projections have been made by SFM-BAM
33. The carbon
finance and revenues from carbon emission offsets will provide enough finance to the project to undertake the planned operations. The project’s costs and revenues were projected until the end of the project in year 30. The results of the analysis forecast an
31
SFM BAM, 2007. Shareholders Agreement
32 SFM BAM, 2007. Assignment Agreement
33 SFM BAM, 2007. Financial Planning Projections
VCS Project Description – Campo Verde
29
Risk Factor Risk Rating Campo Verde Project
internal rate of return of around 19% and a NPV of US$3 million.
Future/current opportunity cost
Future income – Alternative land uses are unlikely to occur in the future
Low
The risk that alternative land uses will occur in the future is mitigated in several ways:
1. The project is on freehold land owned by the project developer, SFM- BAM. This has enabled the project management to take a long-term perspective on the underlying business opportunity.
2. The pre-project land use and the surrounding area land use support little economic activity, apart from low-density cattle grazing and subsistence agriculture. Without the project activities providing capital investment, the degraded state of the land has prevented alternative land uses such as large-scale agriculture. The degraded land will continue to prevent such alternatives from being implemented in the future.
3. Reforestation is a long-term activity in which the ‘inventory’ accrues value overtime as the trees grow. Although it is possible that land opportunity costs will rise in the surrounding areas (though unlikely, see point 2 above), this will be offset by the rising economic value of trees (in terms of timber value) and carbon on the project land over time.
Endorsement of project or land-use activity by local or national political establishment
Endorsement given and not likely to change in the future
Low
The project has the necessary support from regional and national government, including the recently created Ministry of Environment. SFM-BAM executives have had interviews with President of Peru Mr. Alan García about the benefits of the project for the Amazon Region and forest sector. The Minister of Environment, Antonio Brack, has visited the project site several times. He is a long-term advocate of reforestation in the rainforest. The Minister has used the project as an example of how the private sector could help the environment by reforesting degraded land. Before taking his government position, Mr. Brack conducted a television show that focused on ways to improving the environment. In one episode, Mr. Brack made a documentary of the project in
VCS Project Description – Campo Verde
30
Risk Factor Risk Rating Campo Verde Project
Campo Verde. Meetings with political figures were featured in the Peruvian press.
34,35
1.12 Demonstration to confirm that the project was not implemented to create GHG emissions
primarily for the purpose of its subsequent removal or destruction.
The project activity is establishing a permanent plantation with a 30-year rotation period. As stated in the Management Plan
36, at the end of each rotation period, trees will be replanted after harvesting.
1.13 Demonstration that the project has not created another form of environmental credit (for
example renewable energy certificates).
The project is not seeking to generate any other environmental credits other than carbon credits associated with the VCS.
1.14 Project rejected under other GHG programs (if applicable):
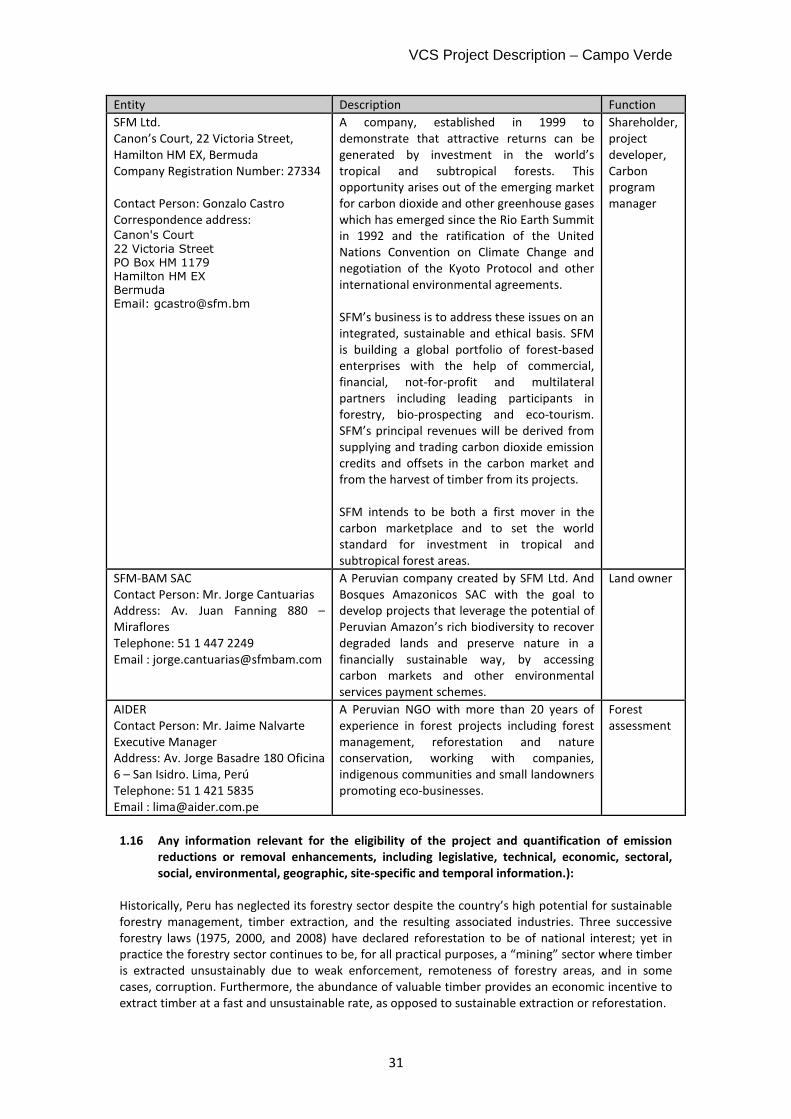
N/A 1.15 Project proponents’ roles and responsibilities, including contact information of the project
proponent, other project participants:
Table 14 Project Proponents
Entity Description Function
34
2006. President Garcia preside nueva session del Consejo de Ministros. Diario La República. http://www.larepublica.com.pe/index.php?option=com_content&task=view&id=129679&Itemid=0
35 2006. Anuncian inversion de US$ 25 millones para reforestar 16 mil hectareas en Ucayali. 24 Horas Libre Peru.
http://www.24horaslibre.com/nacionales/1162480906.php
36 SFM. 2008. Management plan for Campo Verde 2008-2012. Sustainable Forestry Management and Bosques Amazonicos.
VCS Project Description – Campo Verde
31
Entity Description Function
SFM Ltd. Canon’s Court, 22 Victoria Street, Hamilton HM EX, Bermuda Company Registration Number: 27334 Contact Person: Gonzalo Castro Correspondence address: Canon's Court
22 Victoria Street PO Box HM 1179 Hamilton HM EX Bermuda Email: [email protected]
A company, established in 1999 to demonstrate that attractive returns can be generated by investment in the world’s tropical and subtropical forests. This opportunity arises out of the emerging market for carbon dioxide and other greenhouse gases which has emerged since the Rio Earth Summit in 1992 and the ratification of the United Nations Convention on Climate Change and negotiation of the Kyoto Protocol and other international environmental agreements. SFM’s business is to address these issues on an integrated, sustainable and ethical basis. SFM is building a global portfolio of forest-based enterprises with the help of commercial, financial, not-for-profit and multilateral partners including leading participants in forestry, bio-prospecting and eco-tourism. SFM’s principal revenues will be derived from supplying and trading carbon dioxide emission credits and offsets in the carbon market and from the harvest of timber from its projects. SFM intends to be both a first mover in the carbon marketplace and to set the world standard for investment in tropical and subtropical forest areas.
Shareholder, project developer, Carbon program manager
SFM-BAM SAC Contact Person: Mr. Jorge Cantuarias Address: Av. Juan Fanning 880 – Miraflores Telephone: 51 1 447 2249 Email : [email protected]
A Peruvian company created by SFM Ltd. And Bosques Amazonicos SAC with the goal to develop projects that leverage the potential of Peruvian Amazon’s rich biodiversity to recover degraded lands and preserve nature in a financially sustainable way, by accessing carbon markets and other environmental services payment schemes.
Land owner
AIDER Contact Person: Mr. Jaime Nalvarte Executive Manager Address: Av. Jorge Basadre 180 Oficina 6 – San Isidro. Lima, Perú Telephone: 51 1 421 5835 Email : [email protected]
A Peruvian NGO with more than 20 years of experience in forest projects including forest management, reforestation and nature conservation, working with companies, indigenous communities and small landowners promoting eco-businesses.
Forest assessment
1.16 Any information relevant for the eligibility of the project and quantification of emission
reductions or removal enhancements, including legislative, technical, economic, sectoral,
social, environmental, geographic, site-specific and temporal information.):
Historically, Peru has neglected its forestry sector despite the country’s high potential for sustainable forestry management, timber extraction, and the resulting associated industries. Three successive forestry laws (1975, 2000, and 2008) have declared reforestation to be of national interest; yet in practice the forestry sector continues to be, for all practical purposes, a “mining” sector where timber is extracted unsustainably due to weak enforcement, remoteness of forestry areas, and in some cases, corruption. Furthermore, the abundance of valuable timber provides an economic incentive to extract timber at a fast and unsustainable rate, as opposed to sustainable extraction or reforestation.
VCS Project Description – Campo Verde
32
Peruvian Law 28852 promotes private investment in reforestation activities by granting reforestation concessions of state-owned deforested lands. At the present time, a modification of this law is under discussion to award these lands to private investors as private property. Unfortunately, passage of these modifications is proceeding slowly due to political disagreements and opposition from some indigenous groups. In summary and for all practical purposes, today there are no specific state incentives for reforestation in private lands. Establishment and maintenance costs required for reforestation and the long payback period required to recover upfront investment costs make commercial reforestation all but impossible financially. Peru has chosen the following parameters for its CDM forest definition:
� A minimum tree crown cover of 30 per cent; � A minimum land area of 0.5 hectare; and � A minimum tree height value of 5 meters
This project applies the ‘Procedures to demonstrate the eligibility of lands for afforestation and reforestation CDM project activities’ (EB 35 Report, Annex 18) except that instead of the requirement that all areas have been non-forested on 31 December 1989, all areas have not been forested for at least ten years prior to the proposed VCS project start date. 1 a) All land within the project boundary at the start of the project does not contain forest:
i) All vegetation on the projects land is below the forest thresholds for tree crown cover, minimum land area and minimum tree height as defined by Peru under decisions 16/CMP.1 and 5/CMP.1 and communicated by MINAM the Peruvian DNA. This was verified by first delineating all lands meeting the definition of forest and all lands meeting the definition of non-forest using both IKONOS imagery from November 2005 and Quickbird 2004.
37 The high
resolution of this imagery type allows for the exclusion of forested areas lying along the small streams throughout the project area. The classification of the forest and non-forest was then verified in the field. 941.58 hectares were classified as eligible areas (non-forest since 1996) but, from that number, only 740 hectares are workable (the difference includes flood areas, pilot area, roads, etc.) and that will be planted during the first 2 years of the project with 2 standing models as will be described later. Additionally, there are 113 hectares of pasture areas that are not eligible as they were deforested after 1996.
ii) During the baseline field measurements 110 plots were sampled for saplings, shrubs, and herbaceous biomass. No saplings (trees greater than 1.3 m height, diameter at 1.3 less than 5 cm) were found in any of the plots measured. Although a small number of seedlings did exist, these seedlings are not able to mature into saplings due to the pervasive baseline activities: grazing, fires, and an aggressive grass. This area is currently grazed by animals owned by neighboring farmers. Additionally, fires frequently pass through the grazing lands. The herbaceous grass layer is dominated by Braquiaria decumbes which is very aggressive and prohibits the natural regeneration of trees. The combination of these three activities prevents trees from leaving the seedling state.
iii) The land has been in a constantly degraded state of pasture since the early 1970’s as described in Section 1.7.
1 b) The project is a reforestation project
37 Huerta, P., 2008. Procesamiento digital de imagenes de satellite y elaboracion de mapas de cobertura vegetal para SFM BAM.
VCS Project Description – Campo Verde
33
All areas within the boundaries of the project have been in a deforested state since at least October of 1996, at least ten years prior to the project start date of October 1, 2007. This was determined through the classification of Landsat imagery and an interview with Jorge Cantuarias, the owner of the land since 1987 and other local witnesses. Landsat images of the project area (dates: 16.Oct.1996 and 25.Aug.2006) were classified into forest and non-forest areas. The classification methodology used and the forest classification were verified through field measurements.
38
103 data points were taken in the field to assess the accuracy of the satellite imagery of the land cover. 48 data points were taken in forests and 55 in pastures. Accuracy in the pasture areas was 100%, while in forest areas accuracy was 85.4% with differences found between young secondary forest, adult secondary forest, and primary forest.
2. In order to demonstrate 1 a) and 1 b), a combination of remote sensing imagery: Landsat, Ikonos, Quickbird, field surveys, and interviews with local witnesses were used.
1.17 List of commercially sensitive information (if applicable):
The commercially sensitive documents were provided to the audit team during the onsite visit.
2 VCS Methodology:
2.1 Title and reference of the VCS methodology applied to the project activity and explanation of
methodology choices:
AR-AM 0003 Version 04 ‘Afforestation and reforestation of degraded land through tree planting, assisted regeneration and control of animal grazing’ The project area contains degraded lands that are currently being grazed at a low level. No other pre-project activities are taking place in the project area. Project activities will lead to the displacement of grazing animals outside the project area. This project is fully applicable to methodology AR-AM0003 V04 2.2 Justification of the choice of the methodology and why it is applicable to the project activity:
The project activity of reforestation is taking place on degraded pasture lands. Without the project, the lands would continue to remain at a low carbon steady state or continue to degrade due to continued grazing and wildfires. Grazing animals will be displaced to other existing grazing lands outside the project boundary.
� The appropriate baseline methodology to develop the project baseline pursuant to paragraph 22 CDM A/R modalities and procedures is (a) Existing or historical, as applicable, changes in carbon stocks in the carbon pools within the project boundary
� Lands will be reforested by direct planting in the proposed ARR project activity. Due to the degraded nature of the land a nursery crop of Inga edulis will be planted initially to restore the lands before native hardwoods which have been cultivated in a nursery are planted out
� The project activities will lead to a shift of pre-project activity of grazing to outside the project boundary on existing grazing lands.
38 Huerta, P., 2008. Procesamiento digital de imagenes de satellite y elaboracion de mapas de cobertura vegetal para SFM BAM.
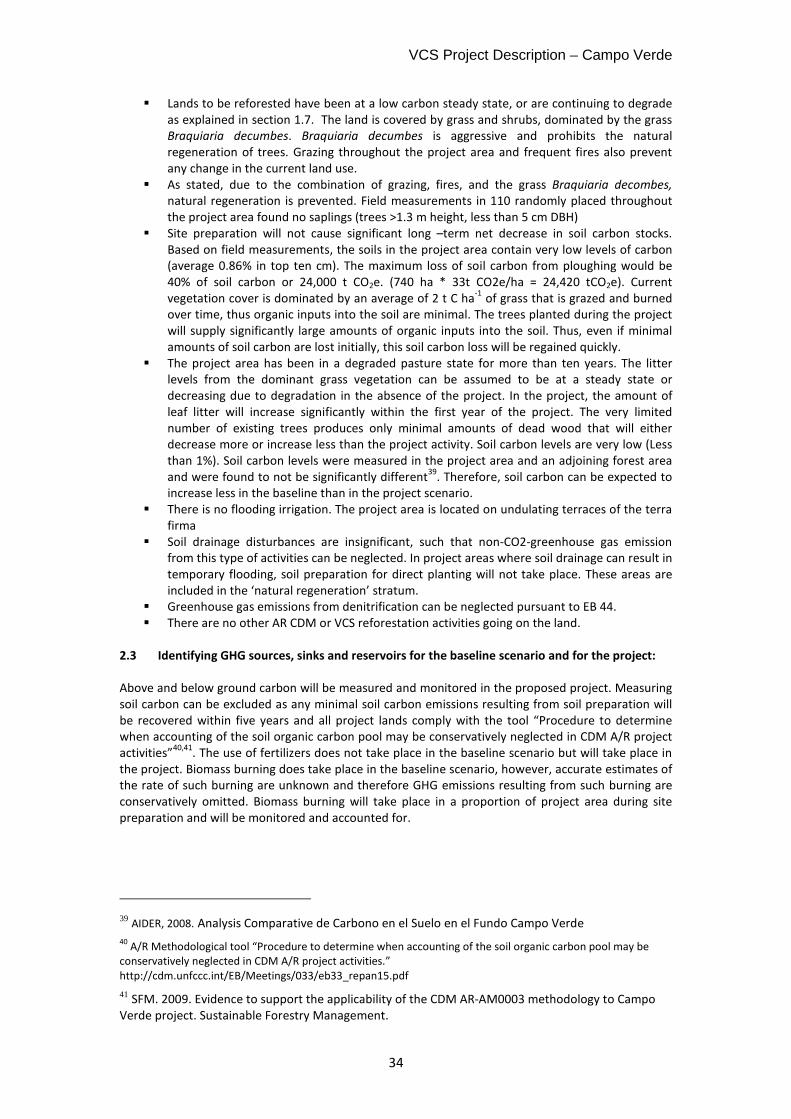
VCS Project Description – Campo Verde
34
� Lands to be reforested have been at a low carbon steady state, or are continuing to degrade as explained in section 1.7. The land is covered by grass and shrubs, dominated by the grass Braquiaria decumbes. Braquiaria decumbes is aggressive and prohibits the natural regeneration of trees. Grazing throughout the project area and frequent fires also prevent any change in the current land use.
� As stated, due to the combination of grazing, fires, and the grass Braquiaria decombes, natural regeneration is prevented. Field measurements in 110 randomly placed throughout the project area found no saplings (trees >1.3 m height, less than 5 cm DBH)
� Site preparation will not cause significant long –term net decrease in soil carbon stocks. Based on field measurements, the soils in the project area contain very low levels of carbon (average 0.86% in top ten cm). The maximum loss of soil carbon from ploughing would be 40% of soil carbon or 24,000 t CO2e. (740 ha * 33t CO2e/ha = 24,420 tCO2e). Current vegetation cover is dominated by an average of 2 t C ha
-1 of grass that is grazed and burned
over time, thus organic inputs into the soil are minimal. The trees planted during the project will supply significantly large amounts of organic inputs into the soil. Thus, even if minimal amounts of soil carbon are lost initially, this soil carbon loss will be regained quickly.
� The project area has been in a degraded pasture state for more than ten years. The litter levels from the dominant grass vegetation can be assumed to be at a steady state or decreasing due to degradation in the absence of the project. In the project, the amount of leaf litter will increase significantly within the first year of the project. The very limited number of existing trees produces only minimal amounts of dead wood that will either decrease more or increase less than the project activity. Soil carbon levels are very low (Less than 1%). Soil carbon levels were measured in the project area and an adjoining forest area and were found to not be significantly different
39. Therefore, soil carbon can be expected to
increase less in the baseline than in the project scenario. � There is no flooding irrigation. The project area is located on undulating terraces of the terra
firma � Soil drainage disturbances are insignificant, such that non-CO2-greenhouse gas emission
from this type of activities can be neglected. In project areas where soil drainage can result in temporary flooding, soil preparation for direct planting will not take place. These areas are included in the ‘natural regeneration’ stratum.
� Greenhouse gas emissions from denitrification can be neglected pursuant to EB 44. � There are no other AR CDM or VCS reforestation activities going on the land.
2.3 Identifying GHG sources, sinks and reservoirs for the baseline scenario and for the project:
Above and below ground carbon will be measured and monitored in the proposed project. Measuring soil carbon can be excluded as any minimal soil carbon emissions resulting from soil preparation will be recovered within five years and all project lands comply with the tool “Procedure to determine when accounting of the soil organic carbon pool may be conservatively neglected in CDM A/R project activities”
40,41. The use of fertilizers does not take place in the baseline scenario but will take place in
the project. Biomass burning does take place in the baseline scenario, however, accurate estimates of the rate of such burning are unknown and therefore GHG emissions resulting from such burning are conservatively omitted. Biomass burning will take place in a proportion of project area during site preparation and will be monitored and accounted for.
39 AIDER, 2008. Analysis Comparative de Carbono en el Suelo en el Fundo Campo Verde 40
A/R Methodological tool “Procedure to determine when accounting of the soil organic carbon pool may be conservatively neglected in CDM A/R project activities.” http://cdm.unfccc.int/EB/Meetings/033/eb33_repan15.pdf 41 SFM. 2009. Evidence to support the applicability of the CDM AR-AM0003 methodology to Campo Verde project. Sustainable Forestry Management.
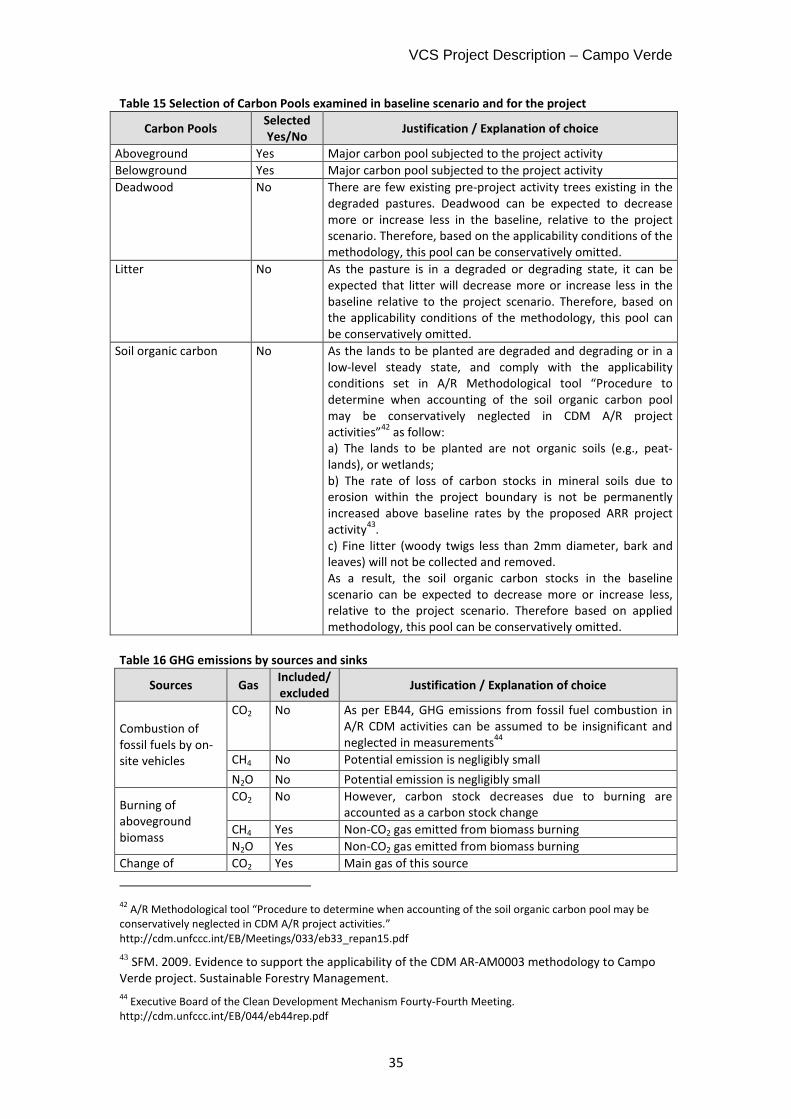
VCS Project Description – Campo Verde
35
Table 15 Selection of Carbon Pools examined in baseline scenario and for the project
Carbon Pools Selected
Yes/No Justification / Explanation of choice
Aboveground Yes Major carbon pool subjected to the project activity
Belowground Yes Major carbon pool subjected to the project activity
Deadwood No There are few existing pre-project activity trees existing in the degraded pastures. Deadwood can be expected to decrease more or increase less in the baseline, relative to the project scenario. Therefore, based on the applicability conditions of the methodology, this pool can be conservatively omitted.
Litter No As the pasture is in a degraded or degrading state, it can be expected that litter will decrease more or increase less in the baseline relative to the project scenario. Therefore, based on the applicability conditions of the methodology, this pool can be conservatively omitted.
Soil organic carbon No
As the lands to be planted are degraded and degrading or in a low-level steady state, and comply with the applicability conditions set in A/R Methodological tool “Procedure to determine when accounting of the soil organic carbon pool may be conservatively neglected in CDM A/R project activities”
42 as follow:
a) The lands to be planted are not organic soils (e.g., peat-lands), or wetlands; b) The rate of loss of carbon stocks in mineral soils due to erosion within the project boundary is not be permanently increased above baseline rates by the proposed ARR project activity
43.
c) Fine litter (woody twigs less than 2mm diameter, bark and leaves) will not be collected and removed. As a result, the soil organic carbon stocks in the baseline scenario can be expected to decrease more or increase less, relative to the project scenario. Therefore based on applied methodology, this pool can be conservatively omitted.
Table 16 GHG emissions by sources and sinks
Sources Gas Included/
excluded Justification / Explanation of choice
Combustion of fossil fuels by on-site vehicles
CO2 No As per EB44, GHG emissions from fossil fuel combustion in A/R CDM activities can be assumed to be insignificant and neglected in measurements
44
CH4 No Potential emission is negligibly small
N2O No Potential emission is negligibly small
Burning of aboveground biomass
CO2 No However, carbon stock decreases due to burning are accounted as a carbon stock change
CH4 Yes Non-CO2 gas emitted from biomass burning
N2O Yes Non-CO2 gas emitted from biomass burning
Change of CO2 Yes Main gas of this source
42
A/R Methodological tool “Procedure to determine when accounting of the soil organic carbon pool may be conservatively neglected in CDM A/R project activities.” http://cdm.unfccc.int/EB/Meetings/033/eb33_repan15.pdf
43 SFM. 2009. Evidence to support the applicability of the CDM AR-AM0003 methodology to Campo Verde project. Sustainable Forestry Management. 44
Executive Board of the Clean Development Mechanism Fourty-Fourth Meeting. http://cdm.unfccc.int/EB/044/eb44rep.pdf
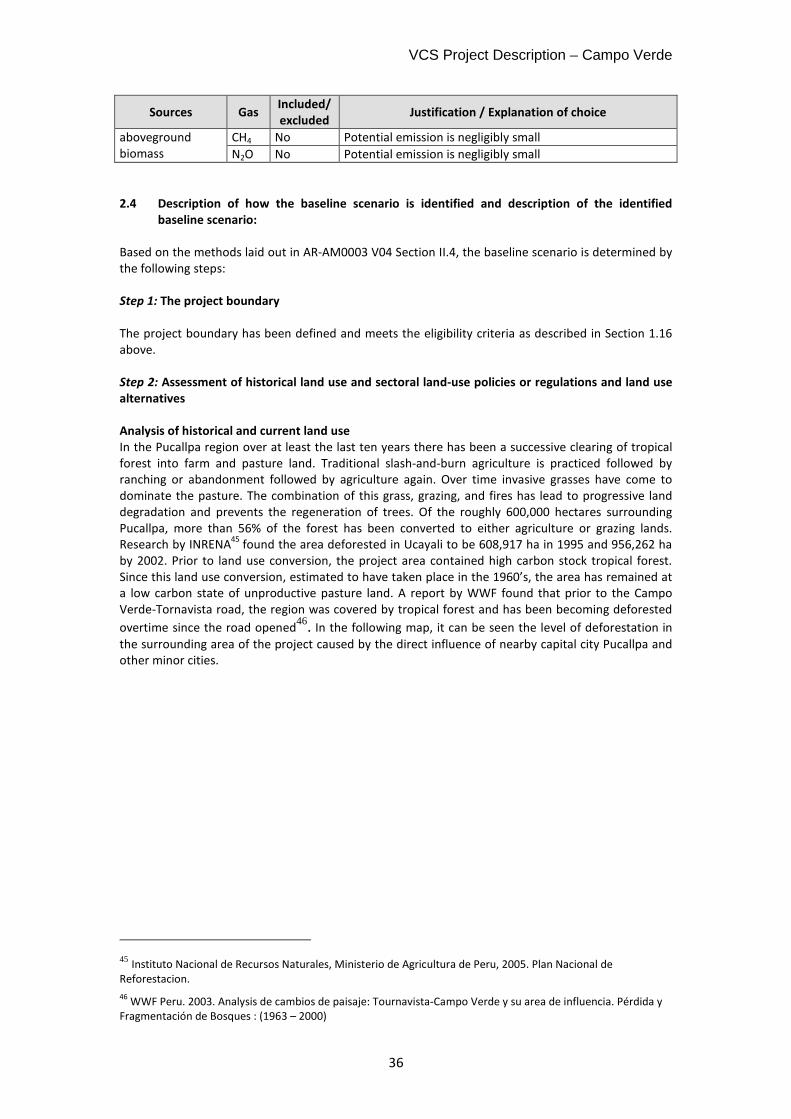
VCS Project Description – Campo Verde
36
Sources Gas Included/
excluded Justification / Explanation of choice
aboveground biomass
CH4 No Potential emission is negligibly small
N2O No Potential emission is negligibly small
2.4 Description of how the baseline scenario is identified and description of the identified
baseline scenario:
Based on the methods laid out in AR-AM0003 V04 Section II.4, the baseline scenario is determined by the following steps: Step 1: The project boundary
The project boundary has been defined and meets the eligibility criteria as described in Section 1.16 above. Step 2: Assessment of historical land use and sectoral land-use policies or regulations and land use
alternatives
Analysis of historical and current land use
In the Pucallpa region over at least the last ten years there has been a successive clearing of tropical forest into farm and pasture land. Traditional slash-and-burn agriculture is practiced followed by ranching or abandonment followed by agriculture again. Over time invasive grasses have come to dominate the pasture. The combination of this grass, grazing, and fires has lead to progressive land degradation and prevents the regeneration of trees. Of the roughly 600,000 hectares surrounding Pucallpa, more than 56% of the forest has been converted to either agriculture or grazing lands. Research by INRENA
45 found the area deforested in Ucayali to be 608,917 ha in 1995 and 956,262 ha
by 2002. Prior to land use conversion, the project area contained high carbon stock tropical forest. Since this land use conversion, estimated to have taken place in the 1960’s, the area has remained at a low carbon state of unproductive pasture land. A report by WWF found that prior to the Campo Verde-Tornavista road, the region was covered by tropical forest and has been becoming deforested
overtime since the road opened46. In the following map, it can be seen the level of deforestation in
the surrounding area of the project caused by the direct influence of nearby capital city Pucallpa and other minor cities.
45 Instituto Nacional de Recursos Naturales, Ministerio de Agricultura de Peru, 2005. Plan Nacional de Reforestacion. 46
WWF Peru. 2003. Analysis de cambios de paisaje: Tournavista-Campo Verde y su area de influencia. Pérdida y Fragmentación de Bosques : (1963 – 2000)
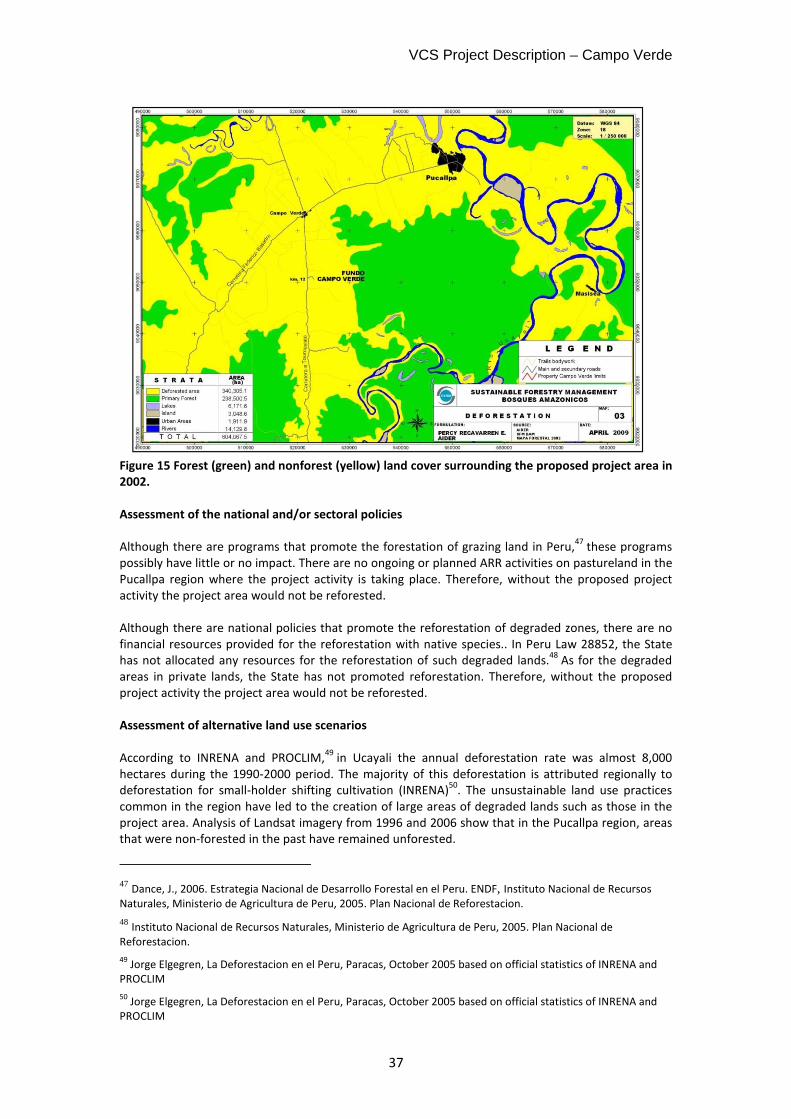
VCS Project Description – Campo Verde
37
Figure 15 Forest (green) and nonforest (yellow) land cover surrounding the proposed project area in
2002.
Assessment of the national and/or sectoral policies
Although there are programs that promote the forestation of grazing land in Peru,
47 these programs
possibly have little or no impact. There are no ongoing or planned ARR activities on pastureland in the Pucallpa region where the project activity is taking place. Therefore, without the proposed project activity the project area would not be reforested. Although there are national policies that promote the reforestation of degraded zones, there are no financial resources provided for the reforestation with native species.. In Peru Law 28852, the State has not allocated any resources for the reforestation of such degraded lands.
48 As for the degraded
areas in private lands, the State has not promoted reforestation. Therefore, without the proposed project activity the project area would not be reforested. Assessment of alternative land use scenarios
According to INRENA and PROCLIM,
49 in Ucayali the annual deforestation rate was almost 8,000
hectares during the 1990-2000 period. The majority of this deforestation is attributed regionally to deforestation for small-holder shifting cultivation (INRENA)
50. The unsustainable land use practices
common in the region have led to the creation of large areas of degraded lands such as those in the project area. Analysis of Landsat imagery from 1996 and 2006 show that in the Pucallpa region, areas that were non-forested in the past have remained unforested.
47 Dance, J., 2006. Estrategia Nacional de Desarrollo Forestal en el Peru. ENDF, Instituto Nacional de Recursos Naturales, Ministerio de Agricultura de Peru, 2005. Plan Nacional de Reforestacion. 48 Instituto Nacional de Recursos Naturales, Ministerio de Agricultura de Peru, 2005. Plan Nacional de Reforestacion. 49
Jorge Elgegren, La Deforestacion en el Peru, Paracas, October 2005 based on official statistics of INRENA and PROCLIM 50
Jorge Elgegren, La Deforestacion en el Peru, Paracas, October 2005 based on official statistics of INRENA and PROCLIM
VCS Project Description – Campo Verde
38
Land use scenario a: Continuation of pre-project land use: unproductive pasture land As detailed in Section 1.4, the lands to be reforested are abandoned degraded pastures with some herbaceous vegetation and few trees. These lands currently support little activity apart from low-density cattle grazing. This area has remained in a state of degraded pasture since the 1980’s. There have been no ecological changes that would result in a change in the current land use except the possible further degradation due to continued grazing and fires. Interviews with local officials and project stakeholders indicate that there is no common practice of converting unproductive pasture into another land use. There are no barriers preventing this land use from continuing. The continuation of this land use scenario requires no investment or technology. It is the common land use scenario and many of the land surrounding the project lands are also under the same land use. Land use scenario b: Commercial cattle ranching Large scale, commercial cattle ranching was abandoned many years ago due to the economic downturn and terrorist activity and was not re-established due to its degraded state and prospect of low returns. Intensive management of the pastureland via suppression of the invasive grass, planting of additional forage plants, and rotational grazing could be instituted in this area. However, improved grazing management is not a common practice in the region. Land use scenario c: Crop production Although this area may have supported crop production in the past, the area has been under pasture for over ten years. Due to the degraded nature of the pasture area, agricultural production could not be supported. The common land use trajectory in this region following conversion from forest is shifting cultivation followed after a few years by grazing land. It is not common for grazing land covered with invasive grass species to be converted into cropland as it is seen as too infertile to produce sufficient yield. Land use scenario d: Afforestation/reforestation of the project area through direct planting without being registered as a VCS project activity Because of the large area of existing tropical forest surrounding the Pucallpa region, afforestation of existing pastureland is not a common practice. A number of barriers prevent afforestation through direct planting from being the most likely land use scenario. More detailed information can be found below in Section 2.5. Debt funding is not available for reforestation projects in Peru. Reforestation through direct seeding require considerable investment in the initial years to implement the project but returns are generated only in the long-term and as such require considerable up-front financing. As afforestation through direct planting has not been practiced in the Ucayali region, there is lack of information on success, growth rates, and yield. Investors therefore perceive such projects to have too high investment risk. Land use scenario e: Afforestation/reforestation of the project area through human-assisted natural regeneration without being registered as a VCS project activity A number of barriers prevent reforestation through human-assisted natural regeneration from being the most likely land use scenario. More detailed information can be found below in Section 2.5. To allow for natural regeneration, baseline activities of fire and grazing would need to be prevented through the financial investment of active management and fire fighting activities. As reforestation through human-assisted natural regeneration has not been practiced in the Ucayali region, there is lack of information on success, growth rates, and potential timber yield. The long term returns are unknown and therefore investors perceive such projects to have too high investment risk. Land use scenario a: unproductive pastureland is the only land use scenario that does not face any barriers to implementation. Step 3: Stratification of the project area as explained in AR-AM0003 Section II.3.
Pre-existing conditions and baseline strata:
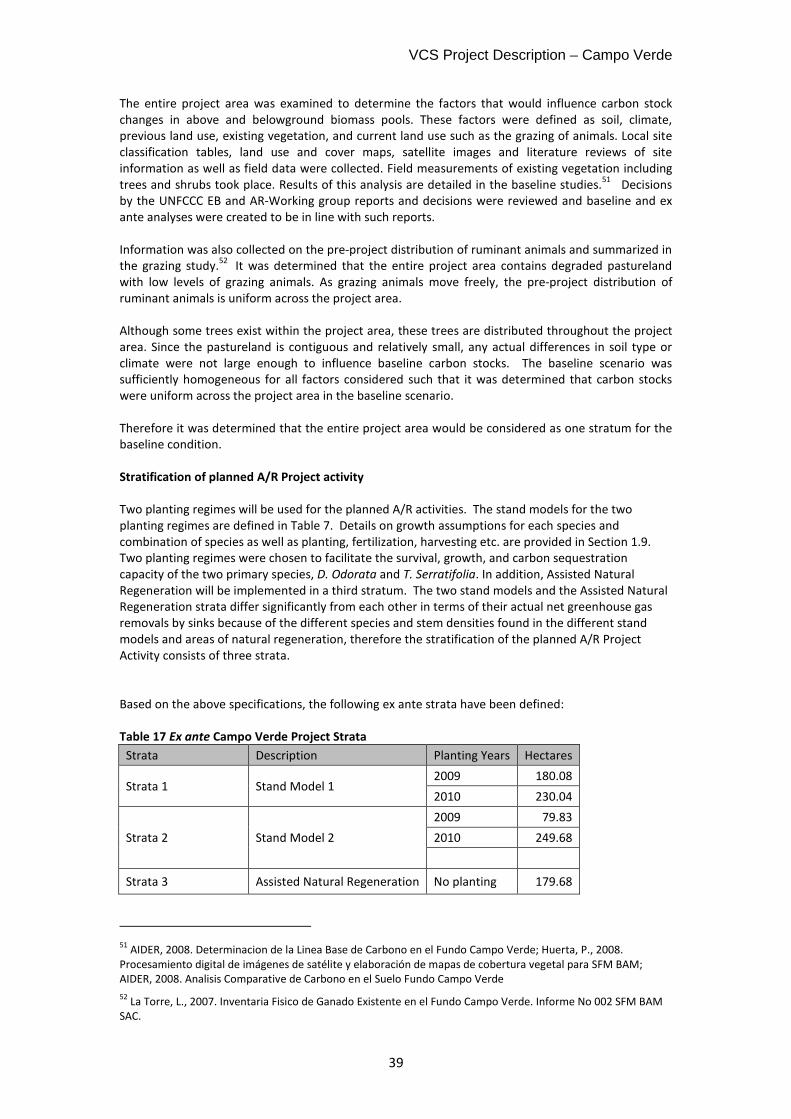
VCS Project Description – Campo Verde
39
The entire project area was examined to determine the factors that would influence carbon stock changes in above and belowground biomass pools. These factors were defined as soil, climate, previous land use, existing vegetation, and current land use such as the grazing of animals. Local site classification tables, land use and cover maps, satellite images and literature reviews of site information as well as field data were collected. Field measurements of existing vegetation including trees and shrubs took place. Results of this analysis are detailed in the baseline studies.
51 Decisions
by the UNFCCC EB and AR-Working group reports and decisions were reviewed and baseline and ex ante analyses were created to be in line with such reports. Information was also collected on the pre-project distribution of ruminant animals and summarized in the grazing study.
52 It was determined that the entire project area contains degraded pastureland
with low levels of grazing animals. As grazing animals move freely, the pre-project distribution of ruminant animals is uniform across the project area. Although some trees exist within the project area, these trees are distributed throughout the project area. Since the pastureland is contiguous and relatively small, any actual differences in soil type or climate were not large enough to influence baseline carbon stocks. The baseline scenario was sufficiently homogeneous for all factors considered such that it was determined that carbon stocks were uniform across the project area in the baseline scenario. Therefore it was determined that the entire project area would be considered as one stratum for the baseline condition. Stratification of planned A/R Project activity
Two planting regimes will be used for the planned A/R activities. The stand models for the two planting regimes are defined in Table 7. Details on growth assumptions for each species and combination of species as well as planting, fertilization, harvesting etc. are provided in Section 1.9. Two planting regimes were chosen to facilitate the survival, growth, and carbon sequestration capacity of the two primary species, D. Odorata and T. Serratifolia. In addition, Assisted Natural Regeneration will be implemented in a third stratum. The two stand models and the Assisted Natural Regeneration strata differ significantly from each other in terms of their actual net greenhouse gas removals by sinks because of the different species and stem densities found in the different stand models and areas of natural regeneration, therefore the stratification of the planned A/R Project Activity consists of three strata. Based on the above specifications, the following ex ante strata have been defined: Table 17 Ex ante Campo Verde Project Strata
Strata Description Planting Years Hectares
Strata 1 Stand Model 1 2009 180.08
2010 230.04
Strata 2 Stand Model 2
2009 79.83
2010 249.68
Strata 3 Assisted Natural Regeneration No planting 179.68
51
AIDER, 2008. Determinacion de la Linea Base de Carbono en el Fundo Campo Verde; Huerta, P., 2008. Procesamiento digital de imágenes de satélite y elaboración de mapas de cobertura vegetal para SFM BAM; AIDER, 2008. Analisis Comparative de Carbono en el Suelo Fundo Campo Verde
52 La Torre, L., 2007. Inventaria Fisico de Ganado Existente en el Fundo Campo Verde. Informe No 002 SFM BAM
SAC.
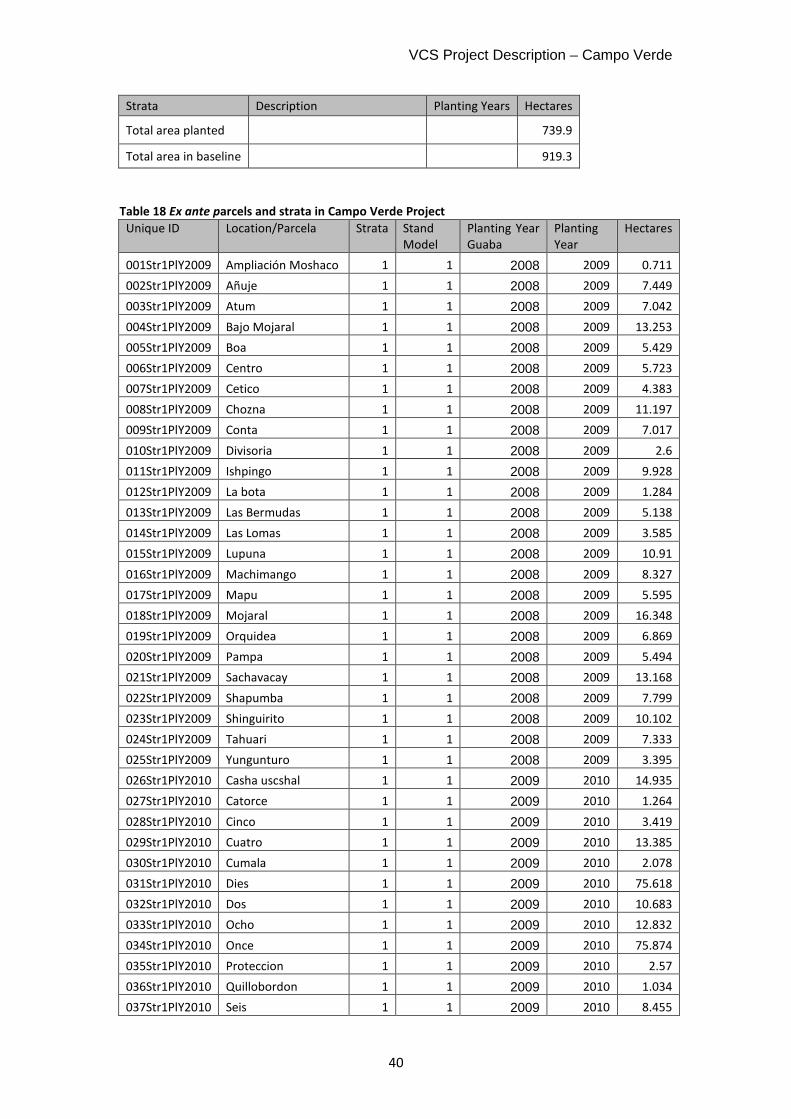
VCS Project Description – Campo Verde
40
Strata Description Planting Years Hectares
Total area planted 739.9
Total area in baseline 919.3
Table 18 Ex ante parcels and strata in Campo Verde Project
Unique ID Location/Parcela Strata Stand Model
Planting Year Guaba
Planting Year
Hectares
001Str1PlY2009 Ampliación Moshaco 1 1 2008 2009 0.711
002Str1PlY2009 Añuje 1 1 2008 2009 7.449
003Str1PlY2009 Atum 1 1 2008 2009 7.042
004Str1PlY2009 Bajo Mojaral 1 1 2008 2009 13.253
005Str1PlY2009 Boa 1 1 2008 2009 5.429
006Str1PlY2009 Centro 1 1 2008 2009 5.723
007Str1PlY2009 Cetico 1 1 2008 2009 4.383
008Str1PlY2009 Chozna 1 1 2008 2009 11.197
009Str1PlY2009 Conta 1 1 2008 2009 7.017
010Str1PlY2009 Divisoria 1 1 2008 2009 2.6
011Str1PlY2009 Ishpingo 1 1 2008 2009 9.928
012Str1PlY2009 La bota 1 1 2008 2009 1.284
013Str1PlY2009 Las Bermudas 1 1 2008 2009 5.138
014Str1PlY2009 Las Lomas 1 1 2008 2009 3.585
015Str1PlY2009 Lupuna 1 1 2008 2009 10.91
016Str1PlY2009 Machimango 1 1 2008 2009 8.327
017Str1PlY2009 Mapu 1 1 2008 2009 5.595
018Str1PlY2009 Mojaral 1 1 2008 2009 16.348
019Str1PlY2009 Orquidea 1 1 2008 2009 6.869
020Str1PlY2009 Pampa 1 1 2008 2009 5.494
021Str1PlY2009 Sachavacay 1 1 2008 2009 13.168
022Str1PlY2009 Shapumba 1 1 2008 2009 7.799
023Str1PlY2009 Shinguirito 1 1 2008 2009 10.102
024Str1PlY2009 Tahuari 1 1 2008 2009 7.333
025Str1PlY2009 Yungunturo 1 1 2008 2009 3.395
026Str1PlY2010 Casha uscshal 1 1 2009 2010 14.935
027Str1PlY2010 Catorce 1 1 2009 2010 1.264
028Str1PlY2010 Cinco 1 1 2009 2010 3.419
029Str1PlY2010 Cuatro 1 1 2009 2010 13.385
030Str1PlY2010 Cumala 1 1 2009 2010 2.078
031Str1PlY2010 Dies 1 1 2009 2010 75.618
032Str1PlY2010 Dos 1 1 2009 2010 10.683
033Str1PlY2010 Ocho 1 1 2009 2010 12.832
034Str1PlY2010 Once 1 1 2009 2010 75.874
035Str1PlY2010 Proteccion 1 1 2009 2010 2.57
036Str1PlY2010 Quillobordon 1 1 2009 2010 1.034
037Str1PlY2010 Seis 1 1 2009 2010 8.455
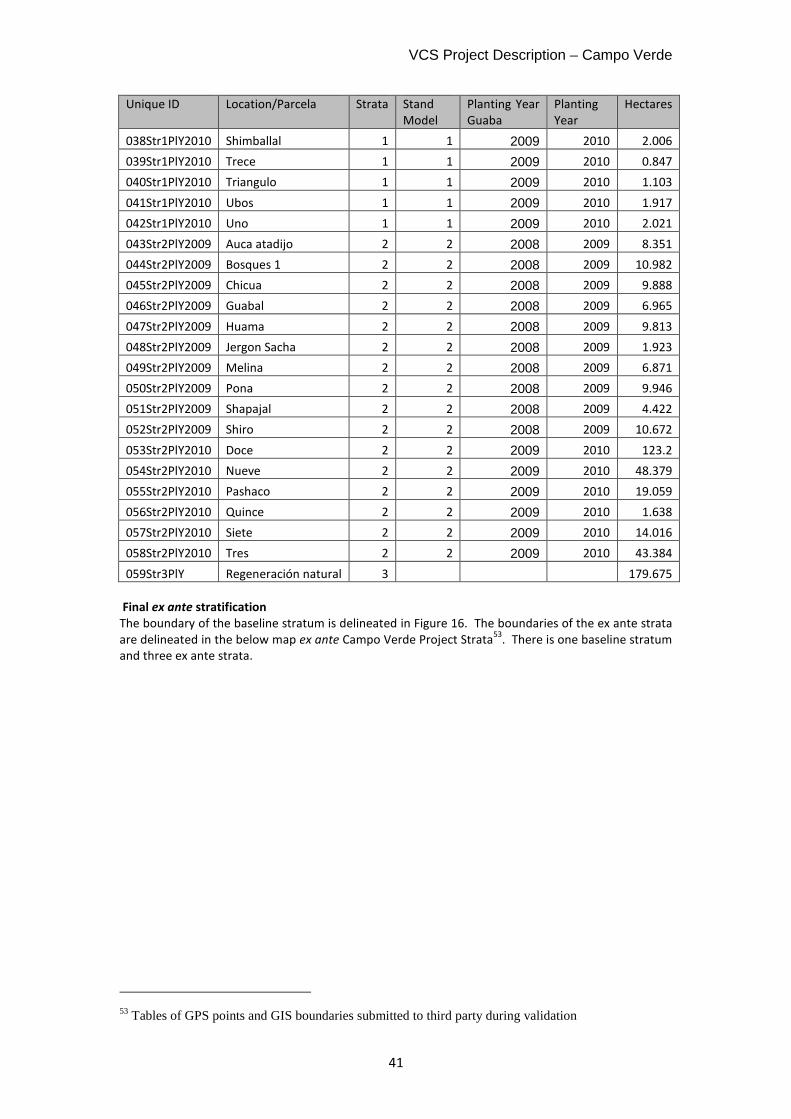
VCS Project Description – Campo Verde
41
Unique ID Location/Parcela Strata Stand Model
Planting Year Guaba
Planting Year
Hectares
038Str1PlY2010 Shimballal 1 1 2009 2010 2.006
039Str1PlY2010 Trece 1 1 2009 2010 0.847
040Str1PlY2010 Triangulo 1 1 2009 2010 1.103
041Str1PlY2010 Ubos 1 1 2009 2010 1.917
042Str1PlY2010 Uno 1 1 2009 2010 2.021
043Str2PlY2009 Auca atadijo 2 2 2008 2009 8.351
044Str2PlY2009 Bosques 1 2 2 2008 2009 10.982
045Str2PlY2009 Chicua 2 2 2008 2009 9.888
046Str2PlY2009 Guabal 2 2 2008 2009 6.965
047Str2PlY2009 Huama 2 2 2008 2009 9.813
048Str2PlY2009 Jergon Sacha 2 2 2008 2009 1.923
049Str2PlY2009 Melina 2 2 2008 2009 6.871
050Str2PlY2009 Pona 2 2 2008 2009 9.946
051Str2PlY2009 Shapajal 2 2 2008 2009 4.422
052Str2PlY2009 Shiro 2 2 2008 2009 10.672
053Str2PlY2010 Doce 2 2 2009 2010 123.2
054Str2PlY2010 Nueve 2 2 2009 2010 48.379
055Str2PlY2010 Pashaco 2 2 2009 2010 19.059
056Str2PlY2010 Quince 2 2 2009 2010 1.638
057Str2PlY2010 Siete 2 2 2009 2010 14.016
058Str2PlY2010 Tres 2 2 2009 2010 43.384
059Str3PlY Regeneración natural 3 179.675
Final ex ante stratification
The boundary of the baseline stratum is delineated in Figure 16. The boundaries of the ex ante strata are delineated in the below map ex ante Campo Verde Project Strata
53. There is one baseline stratum
and three ex ante strata.
53 Tables of GPS points and GIS boundaries submitted to third party during validation
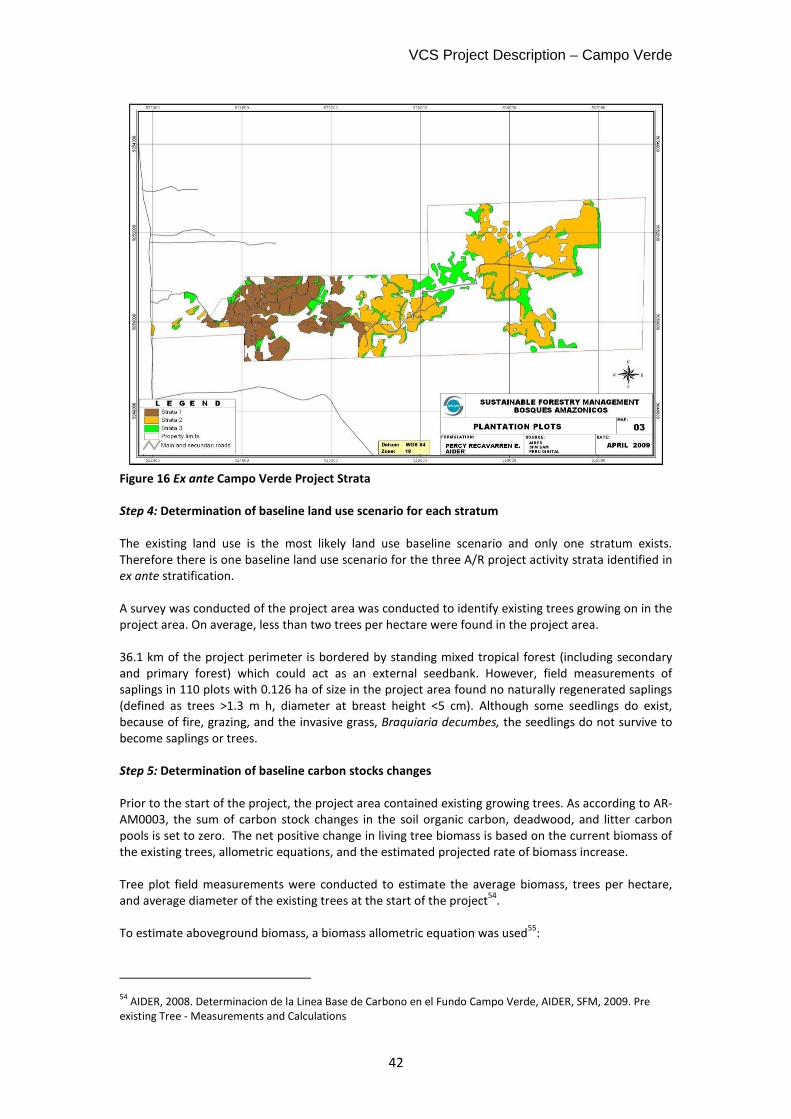
VCS Project Description – Campo Verde
42
Figure 16 Ex ante Campo Verde Project Strata
Step 4: Determination of baseline land use scenario for each stratum
The existing land use is the most likely land use baseline scenario and only one stratum exists. Therefore there is one baseline land use scenario for the three A/R project activity strata identified in ex ante stratification. A survey was conducted of the project area was conducted to identify existing trees growing on in the project area. On average, less than two trees per hectare were found in the project area. 36.1 km of the project perimeter is bordered by standing mixed tropical forest (including secondary and primary forest) which could act as an external seedbank. However, field measurements of saplings in 110 plots with 0.126 ha of size in the project area found no naturally regenerated saplings (defined as trees >1.3 m h, diameter at breast height <5 cm). Although some seedlings do exist, because of fire, grazing, and the invasive grass, Braquiaria decumbes, the seedlings do not survive to become saplings or trees. Step 5: Determination of baseline carbon stocks changes
Prior to the start of the project, the project area contained existing growing trees. As according to AR-AM0003, the sum of carbon stock changes in the soil organic carbon, deadwood, and litter carbon pools is set to zero. The net positive change in living tree biomass is based on the current biomass of the existing trees, allometric equations, and the estimated projected rate of biomass increase. Tree plot field measurements were conducted to estimate the average biomass, trees per hectare, and average diameter of the existing trees at the start of the project
54.
To estimate aboveground biomass, a biomass allometric equation was used
55:
54
AIDER, 2008. Determinacion de la Linea Base de Carbono en el Fundo Campo Verde, AIDER, SFM, 2009. Pre existing Tree - Measurements and Calculations
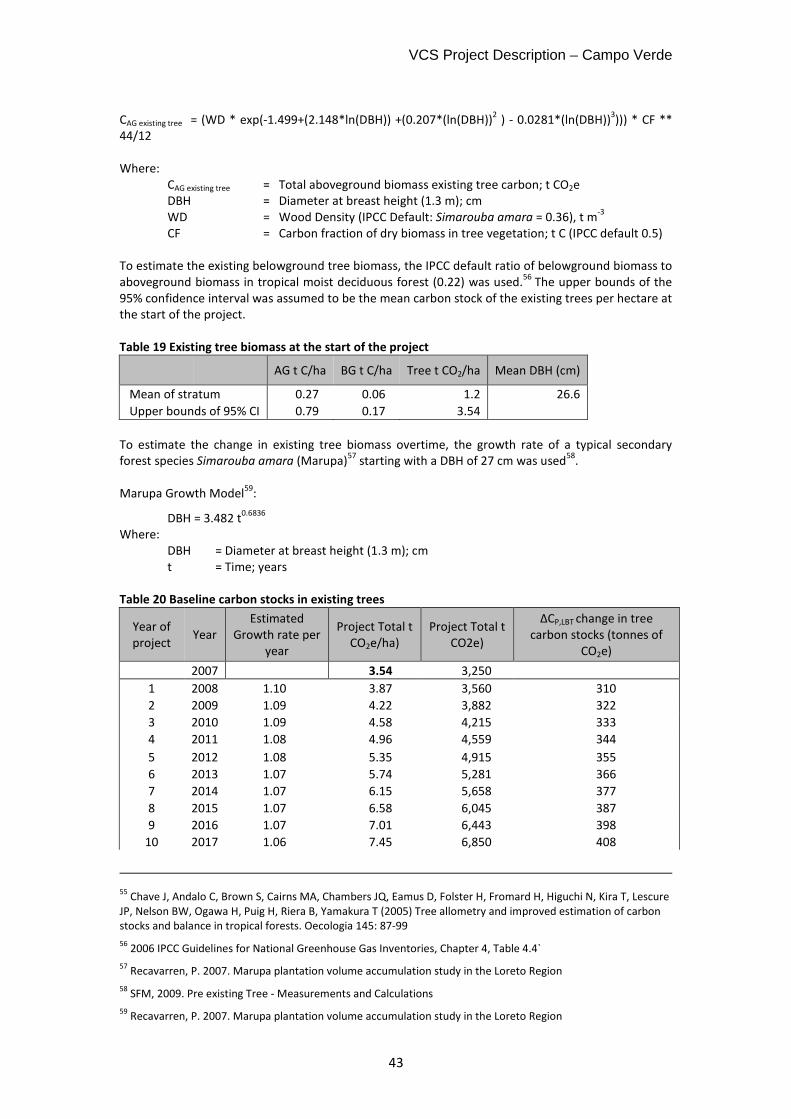
VCS Project Description – Campo Verde
43
CAG existing tree = (WD * exp(-1.499+(2.148*ln(DBH)) +(0.207*(ln(DBH))
2 ) - 0.0281*(ln(DBH))
3))) * CF **
44/12 Where:
CAG existing tree = Total aboveground biomass existing tree carbon; t CO2e DBH = Diameter at breast height (1.3 m); cm
WD = Wood Density (IPCC Default: Simarouba amara = 0.36), t m-3
CF = Carbon fraction of dry biomass in tree vegetation; t C (IPCC default 0.5) To estimate the existing belowground tree biomass, the IPCC default ratio of belowground biomass to aboveground biomass in tropical moist deciduous forest (0.22) was used.
56 The upper bounds of the
95% confidence interval was assumed to be the mean carbon stock of the existing trees per hectare at the start of the project. Table 19 Existing tree biomass at the start of the project
AG t C/ha BG t C/ha Tree t CO2/ha Mean DBH (cm)
Mean of stratum 0.27 0.06 1.2 26.6
Upper bounds of 95% CI 0.79 0.17 3.54
To estimate the change in existing tree biomass overtime, the growth rate of a typical secondary forest species Simarouba amara (Marupa)
57 starting with a DBH of 27 cm was used
58.
Marupa Growth Model
59:
DBH = 3.482 t0.6836
Where: DBH = Diameter at breast height (1.3 m); cm t = Time; years
Table 20 Baseline carbon stocks in existing trees
Year of project
Year Estimated
Growth rate per year
Project Total t CO2e/ha)
Project Total t CO2e)
ΔCP,LBT change in tree carbon stocks (tonnes of
CO2e)
2007 3.54 3,250
1 2008 1.10 3.87 3,560 310
2 2009 1.09 4.22 3,882 322
3 2010 1.09 4.58 4,215 333
4 2011 1.08 4.96 4,559 344
5 2012 1.08 5.35 4,915 355
6 2013 1.07 5.74 5,281 366
7 2014 1.07 6.15 5,658 377
8 2015 1.07 6.58 6,045 387
9 2016 1.07 7.01 6,443 398
10 2017 1.06 7.45 6,850 408
55
Chave J, Andalo C, Brown S, Cairns MA, Chambers JQ, Eamus D, Folster H, Fromard H, Higuchi N, Kira T, Lescure JP, Nelson BW, Ogawa H, Puig H, Riera B, Yamakura T (2005) Tree allometry and improved estimation of carbon stocks and balance in tropical forests. Oecologia 145: 87-99
56 2006 IPCC Guidelines for National Greenhouse Gas Inventories, Chapter 4, Table 4.4`
57 Recavarren, P. 2007. Marupa plantation volume accumulation study in the Loreto Region
58 SFM, 2009. Pre existing Tree - Measurements and Calculations
59 Recavarren, P. 2007. Marupa plantation volume accumulation study in the Loreto Region
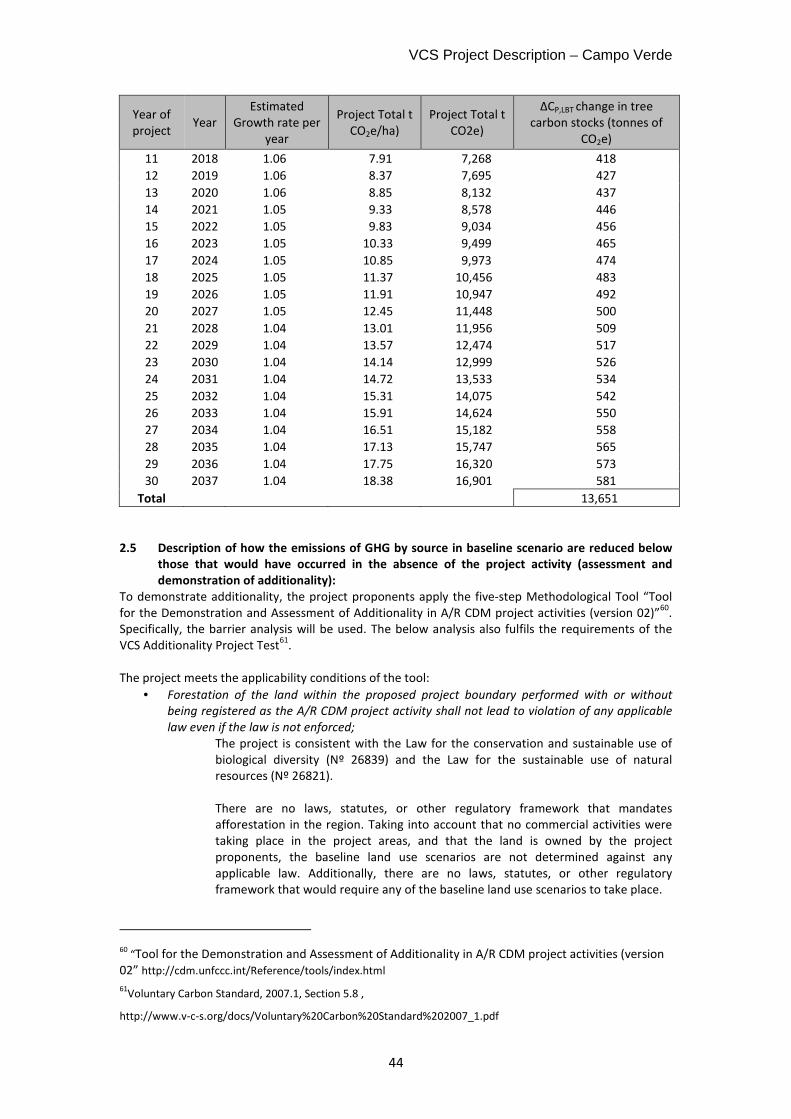
VCS Project Description – Campo Verde
44
Year of project
Year Estimated
Growth rate per year
Project Total t CO2e/ha)
Project Total t CO2e)
ΔCP,LBT change in tree carbon stocks (tonnes of
CO2e)
11 2018 1.06 7.91 7,268 418
12 2019 1.06 8.37 7,695 427
13 2020 1.06 8.85 8,132 437
14 2021 1.05 9.33 8,578 446
15 2022 1.05 9.83 9,034 456
16 2023 1.05 10.33 9,499 465
17 2024 1.05 10.85 9,973 474
18 2025 1.05 11.37 10,456 483
19 2026 1.05 11.91 10,947 492
20 2027 1.05 12.45 11,448 500
21 2028 1.04 13.01 11,956 509
22 2029 1.04 13.57 12,474 517
23 2030 1.04 14.14 12,999 526
24 2031 1.04 14.72 13,533 534
25 2032 1.04 15.31 14,075 542
26 2033 1.04 15.91 14,624 550
27 2034 1.04 16.51 15,182 558
28 2035 1.04 17.13 15,747 565
29 2036 1.04 17.75 16,320 573
30 2037 1.04 18.38 16,901 581
Total 13,651
2.5 Description of how the emissions of GHG by source in baseline scenario are reduced below
those that would have occurred in the absence of the project activity (assessment and
demonstration of additionality):
To demonstrate additionality, the project proponents apply the five-step Methodological Tool “Tool for the Demonstration and Assessment of Additionality in A/R CDM project activities (version 02)”
60.
Specifically, the barrier analysis will be used. The below analysis also fulfils the requirements of the VCS Additionality Project Test
61.
The project meets the applicability conditions of the tool:
• Forestation of the land within the proposed project boundary performed with or without
being registered as the A/R CDM project activity shall not lead to violation of any applicable
law even if the law is not enforced;
The project is consistent with the Law for the conservation and sustainable use of biological diversity (Nº 26839) and the Law for the sustainable use of natural resources (Nº 26821). There are no laws, statutes, or other regulatory framework that mandates afforestation in the region. Taking into account that no commercial activities were taking place in the project areas, and that the land is owned by the project proponents, the baseline land use scenarios are not determined against any applicable law. Additionally, there are no laws, statutes, or other regulatory framework that would require any of the baseline land use scenarios to take place.
60
“Tool for the Demonstration and Assessment of Additionality in A/R CDM project activities (version 02” http://cdm.unfccc.int/Reference/tools/index.html
61Voluntary Carbon Standard, 2007.1, Section 5.8 ,
http://www.v-c-s.org/docs/Voluntary%20Carbon%20Standard%202007_1.pdf
VCS Project Description – Campo Verde
45
Nationally, Peru does have a reforestation plan, launched by INRENA and Agriculture Ministry in 2005 with the goal of promoting plantations with commercial purposes and basin conservation purposes (more than 100,000 hectares for year 2024). Unfortunately, the plan lacks resources, organisation and funding to support implementation, and no activities have been witnessed in Ucayali to date
• The use of this tool to determine additionality requires the baseline methodology to provide
for a stepwise approach justifying the determination of the most plausible baseline scenario.
This project uses CDM Methodology AR-AM0003 V04. This methodology contains a stepwise approach for determining the most plausible baseline scenario. The identification of the baseline scenario is presented in the above “Section 2.4 Description of how the baseline scenario is identified and description of the identified baseline scenario”.
• This tool is not applicable to small-scale afforestation and reforestation project activities.
The proposed project is not a small-scale project.
Step 0. Preliminary screening based on the starting date of the A/R project activity
Provide evidence that the starting date of the A/R project activity was after 31 December 1999
The Project was conceived in 2003 and planting activities initiated in 2007. This is confirmed through the classification of LandSat imagery of the project area (dated: 16 October 1996 and 25 August 2006) and an interview with Jorge Cantuarias, the owner of the land since 1987 as well as other local witnesses. The first activity of the project was the application to financial support from the Regional Government of Ucayali and Fondo de las Américas (US government funds) in 2003 to implement a pilot project with the goal to validate the model of recovering degraded lands over 100 hectares
62.
Provide evidence that the incentive from the planned sale of Emissions Reductions was seriously
considered in the decision to proceed with the project activity. This evidence shall be based on
(preferably official, legal and/or other corporate) documentation that was available to third parties at,
or prior to, the start of the project activity.
The Project initiated its planting activities in 2007, however the Campo Verde CDM was conceived in 2003. This can be proven unequivocally through the project forming part of the Peruvian carbon portfolio sponsored by the National Environmental Fund – FONAM (Fondo Nacional del Ambiente) and promoted at the Carbon Expo in 2004 and 2005. Presentations and marketing documentation used by FONAM provide evidence of this.
63
Reforestation projects require considerable investment in the initial years to implement the project; namely the funding of nursery development, road construction, planting costs and maintenance. In contrast, returns are generated only in the long-term. As such reforestation projects require considerable up-front financing, with only long-term returns for investors. The initial project proposal did not include revenues from carbon credits and was unsuccessful in finding investors. Below is a description of the investments that Bosques Amazonicos pursued between 2003 and 2006 without the inclusion of carbon credits, and which was unsuccessful: � Debt funding is not available for reforestation projects in Peru. Efforts were made by BAM to
access debt funding, but this proved unfruitful over a period of 3 years. � In year 2003, the project received financial support from Regional Government of Ucayali and
Fondo de las Américas (US government funds) to implement a pilot project with the goal to validate the model of recovering degraded lands over 100 hectares. With that support and
62 FONDAM-GOREU, Contrato confinanciamiento entre Fondo de Las Americas, Gobierno Regional de Ucayali, Bosques Amazonicas y AIDER 63 Carbon FAIR - Ficha Proyecto AIDER-BAM
VCS Project Description – Campo Verde
46
through its own resources, Bosques Amazonicos undertook the following actions in order to find an investor to provide the necessary investment to implement the developed model in the project area and to develop other forest businesses:
o In September 2004, Bosques Amazonicos hired Control Union, a Netherlands-based
company and a member of Control Union World Group, founded in 1956 and operating in 80 countries worldwide, supplying certification, evaluation, monitoring and control services to forest projects and financial management services. Control Union organised business meetings in Europe and the US with investors groups to introduce the business model and project
64.
o In the first quarter of 2005, Bosques Amazonicos developed marketing and promotional tools such as videos and brochures (in English and Spanish) with technical and financial information about the project. This material is also available for review.
o In 2005 and 2006, Bosques Amazonicos promoted meetings with potential investors such as retirement funds (AFP Horizonte) and insurance companies (Rimac Insurance Company). Meetings were also held with other companies, among them Pennyinvest and SEAF SAFI (private investors managing multilateral funds).
o In 2005 and 2006, Bosques Amazonicos held meetings with multilateral bank IADB and the National Office in Peru in charge of developing productive programs in Amazon Region for the substitution of coca crops. Copies of the presentations and economic analysis are also available.
o Bosques Amazonicos was invited by the National Fund of Environment to design a PIN and participate in May 2005 at the Carbon Expo Fair in Cologne, Germany on Peruvian Stand. In that event, Bosques Amazonicos met GFA Terra System GmbH, a German company specialising in forest certification processes and carbon marketing. Communications were exchanged between companies and formal proposals were exchanged. GFA decided not to pursue the opportunity.
In conclusion, Bosques Amazonicos spent three years unsuccessfully trying to raise investment for the project. Risks of investing in reforestation projects in Peru were perceived as too high by investors, both foreign and domestic. Until the possibility of the additional revenue from the sale of carbon credits was factored into the business planning, Bosques Amazonicos was unable to secure investors for the project activity. The first contact between Bosques Amazonicos and company Sustainable Forestry Management (SFM Ltd). took place at the Carbon Expo in Cologne, Germany in May 2005 at which representatives of Bosques Amazonicos were present as part of the Peruvian delegation. SFM Ltd showed interest in obtaining carbon credits produced by the proposed VCS carbon project activity and visited the project site for the first time in August 2006. Between October and December 2006, SFM Ltd and Bosques Amazonicos entered detailed negotiations regarding the formation of a Joint Venture to execute this forestry project
65. The generation of carbon credits was a condition precedent as part of the
negotiation as SFM does not invest in forestry projects without the anticipation of securing carbon rights from the project. SFM Ltd agreed to finance the project activity in April 2007 through the Joint Venture Company, SFM-BAM. Under the terms of the Shareholders Agreement, SFM Ltd. acquired a 30% interest in SFM-BAM. Bosques Amazonicos contributed the land assets to the Joint Venture Company. At the same time, SFM Ltd. entered into an Assignment Agreement with SFM-BAM. The Assignment Agreement specifies that SFM Ltd pre-purchase the carbon rights from the project area. The consideration paid by this pre-purchase of carbon rights provides the financing necessary for the project to undertake its operations. Thus, carbon finance has provided the funding mechanism for the “Campo Verde” project and thus has removed the institutional barriers preventing project implementation.
64 BAM. 2004. Investment Agreement BA-C Union and Project Document BA-C Union. 65 SFM, BAM. 2006. Memorandum of Understanding between BAM and SFM.
VCS Project Description – Campo Verde
47
Step 1. Identification of alternative land use scenarios to the proposed A/R C project activity
Sub-step 1a. Identify credible alternative land use scenarios to the proposed VCS project activity
As detailed in Section 1.7, the lands to be reforested are abandoned degraded pastures with some herbaceous vegetation and few trees. These lands currently support little activity, apart from low-density cattle grazing. Degradation trends across the project area show that the current state of the lands is likely to persist in its current condition as it has done since the 1980’s. Large-scale, commercial cattle ranching was abandoned many years ago due to the economic downturn and terrorist activity, and was not re-established due to its degraded state and prospect of low returns. It is estimated that in Peru the deforestation rate is 250,000 ha per year of which 81.1% attributable to the expansion of the agricultural frontier according to official sources (INRENA). These unsustainable land use practices have led to the creation of barren degraded lands such as those of the project area. Given the high degree of degradation, the project land can no longer support agricultural activities or intense commercial cattle ranching. In this context, the continuation of the current situation and historical land use (no project activity or other alternatives undertaken) represents the only alternative to the project activity. According to INRENA and PROCLIM, in Ucayali the annual deforestation rate was almost 8,000 hectares during the 1990-2000 period.
66 The majority of this deforestation is attributed regionally to
deforestation for small holder shifting cultivation (INRENA). The unsustainable land use practices common in the region have led to the creation of large areas of degraded lands, such as those in the project area. Analysis of Landsat imagery from 1996 and 2006 show that in the Pucallpa area, areas that were non-forested in the past have remained unforested.
Land use scenario a: Continuation of pre-project land use: unproductive pastureland As detailed in Section 1.4, the lands to be reforested are abandoned degraded pastures with some herbaceous vegetation and few trees. These lands currently support little activity, apart from low-density cattle grazing. This area has remained in a state of degraded pastureland since the 1980’s. There have been no ecological changes that would result in a change in the current land use except the possible further degradation due to continued grazing and fires. Interviews with local officials and project stakeholders indicate that there is no common practice of converting unproductive pastureland into another land use. This activity is widespread along the Federico Basadre and Tornavista highways. The neighboring lands are also under low level grazing lands. Land use scenario b: Commercial cattle ranching The last commercial activity in the project area was commercial cattle grazing. However, this commercial cattle ranching was abandoned many years ago due to the economic downturn and terrorist activity, and was not re-established due to its degraded state and prospect of low returns. At the regional level, the Ucayali Government promotes the development of cattle grazing projects by giving concessional financing to the developers. Intensive management of the pastureland via suppression of the invasive grass, planting of additional forage plants, and rotational grazing could be instituted in this area. However, improved grazing management is not a common practice in the region. Land use scenario c: Crop production Although this area may have supported crop production in the past, the area has been under pasture for over ten years. Due to the degraded nature of the pasture area, agricultural production would result in low yields. This degraded land cover is very common in the region. The Peruvian National
66
Jorge Elgegren, La Deforestacion en el Peru, Paracas, October 2005 based on official statistics of INRENA and PROCLIM
VCS Project Description – Campo Verde
48
Plan for Reforestation67
found that 966,191 hectares were deforested in 2005 and only 57% was being worked. The other 43% were abandoned. Land use scenario d: Afforestation/reforestation of the project area through direct planting without being registered as a VCS project activity Because of the large area of existing tropical forest surrounding the Pucallpa region, afforestation or reforestation of existing pastureland is not a common practice. There is no legal requirement to reforest in the Ucayali region of Peru. There has been virtually no reforestation or afforestation via large scale commercial forestry in the Pucallpa region. According to INRENA from 2001-2006 only 196 hectares of land have been reforested in the Ucayali Region. Land use scenario e: Afforestation/reforestation of the project area through human-assisted natural regeneration without being registered as a VCS project activity There is no legal requirement to reforest in the Ucayali region of Peru. There has been virtually no reforestation or afforestation in the Pucallpa region. According to INRENA from 2001-2006 only 196 hectares of land have been reforested in the Ucayali Region. Reforestation through human-assisted natural regeneration requires capital investment in land management and fire fighting activities. The potential for timber returns from such an activity are unknown.
Outcome of Sub-step 1a: List of credible alternative land use scenarios that would have occurred on
the land within the project boundary of the A/R project activity.
Land Use Scenario a: Unproductive pastureland Land Use Scenario b: Commercial cattle grazing Land Use Scenario c: Crop production Land Use Scenario d: Reforestation through direct planting without registration as a VCS Project Land Use Scenario e: Reforestation through human-assisted natural regeneration without registration as a VCS Project
Sub-step 1b. Consistency of credible land use scenarios with enforced mandatory applicable laws
and regulations
Land Use Scenario a: Unproductive pastureland The current land use is in compliance with all legal and regulatory requirements.
Land Use Scenario b: Commercial cattle grazing At the regional level, the Ucayali Government promotes the development of cattle grazing projects by giving concessional financing to the developers. However, there is no legal regulation requiring cattle grazing take place in the project area.
Land Use Scenario c: Agricultural production There are no legal or regulatory requirements blocking or requiring the proposed project area used for crop production.
Land Use Scenario d: Afforestation without registration as a VCS Project At the national level, Peru has a reforestation plan aimed at promoting plantations with commercial purposes and basin conservation purposes. However this plan lacks resources, organisation and funding to support implementation, and no activities have been witnessed in Ucayali to date. Afforestation is not mandated by any enforced law, statute, or other regulatory framework
68
Land Use Scenario e: Reforestation through assisted-natural regeneration without registration as a VCS Project
Afforestation is not mandated by any enforced law, statute, or other regulatory framework69
67 Instituto Nacional de Recursos Naturales, Ministerio de Agricultura de Peru, 2005. Plan Nacional de Reforestacion. 68
VCS Additionality Project Test: Step 2: Regulatory Surplus (Section 5.8 of VCS 2007.1)
VCS Project Description – Campo Verde
49
Outcome of Substep 1b: : List of plausible alternative land use scenarios to the A/R project activity
that are in compliance with mandatory legislation and regulations taking into account the their
enforcement in the region or country and EB decisions on national and/or sectoral policies and
regulations
Land Use Scenario a: Unproductive pastureland Land Use Scenario b: Commercial cattle grazing Land Use Scenario c: Agricultural production Land Use Scenario d: Reforestation through direct planting without registration as a VCS Project Land Use Scenario e: Reforestation through human-assisted natural regeneration without registration as a VCS Project
Sub-step 1c. Selection of the baseline scenario:
Section 2.4 “Description of how the baseline scenario is identified and description of the identified baseline scenario”of the VCS PD was used to identify the most likely baseline scenario. Using this stepwise approach the most plausible baseline scenario is the continuation of the existing land use: unproductive pastureland.
Step 2. Investment analysis
N/A. For the Campo Verde project, barrier analysis is performed as a stand-alone additionality analysis.
Step 3. Barrier analysis70
The proposed project activities face barriers that prevent the implementation of the proposed project activity. The barriers for both project activities: A/R through direct planting and A/R through assisted natural regeneration face the same barriers and therefore the analysis is presented together. However, the most likely baseline scenario, unproductive pastureland, does not face any barriers to implementation.
The Campo Verde project had been looking for a financial partner for approximately 3 years before SFM became involved. As documented below, the project undertook several efforts to raise finance from a variety of sources, all of them unsuccessful until SFM agreed to finance the reforestation activities. SFM’s financing has been provided on an all equity basis as conventional bank finance was not available.
Sub-step 3a. Identify barriers that would prevent the implementation of type of the proposed project
activity:
Investment Barriers:
Debt funding is not available for long-term reforestation projects in Peru. Reforestation through direct planting or assisted natural regeneration requires considerable investment in the initial years to implement the project; namely negotiations with stakeholders to expel grazing animals, the funding of nursery development, planting costs, maintenance, fire prevention and fire fighting. Returns are generated only in the long-term. Consequently reforestation projects require considerable up-front financing, with only long-term returns for investors. The project’s risk-adjusted return to investors is not appealing to local or international investors. One of the main risks is that there is a lack of commercial demonstration of the growth and yield of native species plantations or of assisted natural regeneration. Therefore, making the risk-adjusted return to investors unattractive.
69
VCS Additionality Project Test: Step 2: Regulatory Surplus (Section 5.8 of VCS 2007.1)
70 VCS Additionality – Project Test – Step 2 Implementation Barriers (Section 5.8 VCS 2007.1)
VCS Project Description – Campo Verde
50
Public funding for reforestation activities in the Ucayali region is almost nonexistent. In the 2008 Ucayali’s budget, funding for reforestation projects of native species was not considered while funding for reforestation of fast-growth species and for the recovery of degraded areas sums S/. 780,000 (seven hundred and eighty thousand Nuevos Soles) less than 1% of Ucayali’s budget.
71
Funding from commercial banks is very limited as well. According to the USAID report Rural and
Agricultural Finance: Emerging Practices from Peruvian Financial Institutions, “the formal financial system in Peru, all entities regulated by the Superintendency of Banks and Insurance, provides very limited rural and agricultural finance services and most financial institutions focus uniquely on serving urban clients”.
72
The banks that do provide rural and agricultural finance require a repayment period not longer than 3 years
73. Moreover, COFIDE, the government sponsored Peruvian development bank, offers funding
for projects for up to 10 years only74
. As an example, efforts were made by BAM to access debt funding for a period of three years unsuccessfully. Details of the efforts to secure funding by project proponents are provided in Step 5 below. Technological Barrier:
Since afforestation is not a common practice, access to planting materials such as seedlings for projects on a commercial scale is limited in the region. This substantially increases the costs required to produce seedlings. Although plantation development in Peru had been advocated by the Reforestation Committee – INRENA, after the Committee was closed existing plantations were abandoned. Prevailing Practice Barrier Reforestation through direct planting or assisted natural regeneration is not commonly practiced in the Pucallpa region. According to INRENA,
75 for the period 2001-2006, only 196 hectares have been
reforested in Ucayali Region. In the 1980’s the Reforestation Committee of IRENA worked to promote plantations in local communities. However, the growth of the planted trees was not monitored and most plantations were not successfully established. Plantation development has always been advocated by the Comite de Reforestation, a program under the authority of INRENA. The Comite was concerned about the establishment of the plantations mainly, but not about the maintenance of them. After the program was closed, plantations were abandoned by almost all of the communities and farmers that were associated with the project. For instance according to ITTO, in Peru “between 1997 and 2000 Prosopis was sown over more than 400,000 hectares to thicken sparse woody formations and to establish new woody cover where there was none before. However, it is estimated that only 10% survived.”
76
Currently, a combination of fires, grazing, and an invasive grass species prevents reforestation through natural regeneration. The fires are anthropogenic and are initiated outside the proposed
71 Congreso de la Republica de Peru, 2008. Presupuesto Publico 2008. http://www.congreso.gob.pe/comisiones/2007/presupuesto/libro/TOMO1/25_Ucayali.pdf 72
USAID, microNOTE #27, Rural and Agricultural Finance: Emerging Practices from Peruvian Financial Institutions, April, 2007. http://pdf.usaid.gov/pdf_docs/PNADI834.pdf 73
Food and Agriculture Organization of the United Nations, 2008. Peru: la industria de la nuez de Brasil en Madre de dios. ftp://ftp.fao.org/docrep/fao/010/a0226s/a0226s08.pdf 74
COFIDE, 2009. Productos y servicios financieros http://www.cofide.com.pe/productos2.html
75 Jorge Elgegren, La Deforestacion en el Peru, Paracas, October 2005 based on official statistics of INRENA and PROCLIM 76
Status of Tropical Forests 2005, International Tropical Timber Organization, p.270.
VCS Project Description – Campo Verde
51
project boundary. MODIS HotSpot fire maps show the occurrence of fire in the region77
. Grazing also takes place by animals moving from outside the boundary to inside the project boundary. Therefore, human intervention would be required to prevent such activities from taking place. As the human populations do not benefit from the prevention of such activities, actively stopping these activities is not a prevailing practice. Social Condition Barrier:
As commercial scale afforestation and reforestation are not prevailing practices, there is a lack of skilled or properly trained labour in the region.
78 This includes the lack of experienced forestry
contractors. Sub-step 3 b. Show that the identified barriers would not prevent the implementation of at least
one of the alternative land use scenarios (except the proposed project activity):
The identified barriers do not affect the baseline scenario, continuation of unproductive pastureland. The continuation of existing land use requires no investment capital or technological inputs. It is one of the main prevailing practices in the Pucallpa area. The majority of the landowners surrounding the project area practice low-input grazing on their lands, therefore there is no lack of labour experienced with this low technology grazing practice.
Step 4. Common practice analysis79
Reforestation via large-scale commercial forestry is not commonly practiced in the Pucallpa region. According to the 2005 ITTO’s report Status of Tropical Forests, “current realistic estimates suggest the total forestry plantation area [in Peru] to be between 200,000 and 300,000 hectares (CIEF pers. comm., December 2005). Most plantations are located in the Andean region, the main species there being Eucalyptus globulus. About 70% of all planted forest is privately or community owned, and 30% is owned publicly.”
80
According with INRENA,
81 for the period 2001-2006, only 196 hectares have been reforested in
Ucayali Region. This reforestation is not the result of large-scale commercial forestry practices. Therefore, there are no similar forestation activities in the Pucallpa region that can be compared.
Step 5: Impact of VCS registration
The proposed registration of the project area as a VCS project removed the investment and technological barriers.
The Campo Verde project had been looking for a financial partner for approximately 3 years before SFM became involved. As documented below, the project undertook several efforts to raise finance from a variety of sources:
• In September 2004, Bosques Amazónicos hired Control Union, a Netherlands-based company and a member of Control Union World Group, founded in 1956 and operating in 80 countries worldwide, supplying certification, evaluation, monitoring and control services to forest
77
Information for Resource Management System, University of Maryland, 2009. Web Fire Mapper: South America. http://maps.geog.umd.edu/firms/ 78 Programa de Estadisticas y Estudios Laborales, Ministerio de Trabajo y Promocion del Empleo del Peru, 2007. Encuesta de Hogares Especializada en Niveles de Empleo 2007. http://www.mintra.gob.pe/peel/publicaciones/informes/PEEL_Empleo_LIMA_METROPOLITANA_2007.pdf 79
VCS Additionality Project Test, Step 3: Common Practice (Section 5.8 VCS 2007.1)
80 Status of Tropical Forests 2005, International Tropical Timber Organization, p.267 81 Jorge Elgegren, La Deforestacion en el Peru, Paracas, October 2005 based on official statistics of INRENA and PROCLIM
VCS Project Description – Campo Verde
52
projects and financial management services. Control Union organised business meetings in Europe and the US with investors groups to introduce the business model and project. Reports and documents (Attached copy of executive summary, power point presentations about those meetings and the contract between Bosques Amazónicos and Control Union.)
• In the first quarter of 2005, Bosques Amazónicos developed marketing and promotional tools such as videos and brochures (in English and Spanish) with technical and financial information about the project
82.
• In 2005 and 2006, Bosques Amazónicos promoted meetings with potential investors such as Peruvian pension funds (AFP Horizonte) and insurance companies (Rimac Insurance Company). Meetings were also held with other companies, among them Pennyinvest and SEAF SAFI (private investors managing multilateral funds)
83
• In 2005 and 2006, Bosques Amazónicos held meetings with Inter-American Development Bank (IADB) and the National Office in Peru in charge of developing productive programs in Amazon Region for the substitution of coca crops
84..
However, the Campo Verde project was able to find an investor when the project was presented as a project that would create sellable carbon credits. Owing to the promise of carbon credit rights, SFM Ltd agreed to finance the project activity in April 2007 through the Joint Venture Company SFM-BAM. Under the terms of the Shareholders Agreement, SFM Ltd. acquired a 30% interest in SFM-BAM. Bosques Amazónicos contributed the land assets to the Joint Venture Company. At the same time, SFM Ltd. entered into an Assignment Agreement with SFM-BAM. The Assignment Agreement specified that SFM Ltd pre-purchase the carbon rights from the project area. The consideration paid by this pre-purchase of carbon rights provides the financing necessary for the project to undertake its operations. Thus, carbon finance has provided the funding mechanism for the “Campo Verde” project and thus has removed the investment barrier preventing project implementation.
3 Monitoring:
3.1 Title and reference of the VCS methodology (which includes the monitoring requirements)
applied to the project activity and explanation of methodology choices:
AR-AM 0003 ‘Afforestation and reforestation of degraded land through tree planting, assisted regeneration and control of animal grazing is applied. This methodology has been chosen because the project Is taking place on degraded pasturelands and no other project activities are taking place in the project area. The justification of this choice is given in section 2.2 of the VCS PD. 3.2 Monitoring, including estimation, modelling, measurement or calculation approaches:
The purpose of monitoring is to have all the information concerned to the project development, allowing the estimation of VERs at the end of an accreditation period. The monitoring activities include gathering information directly from the field and indirect sources and making the calculations and estimations required to know if the project is being developed according to the PDD and management plans and to determinate GHG removals and leakage.
82 Presented to third-party during validation 83 Presented to third-party during validation 84 Presented to third-party during validation
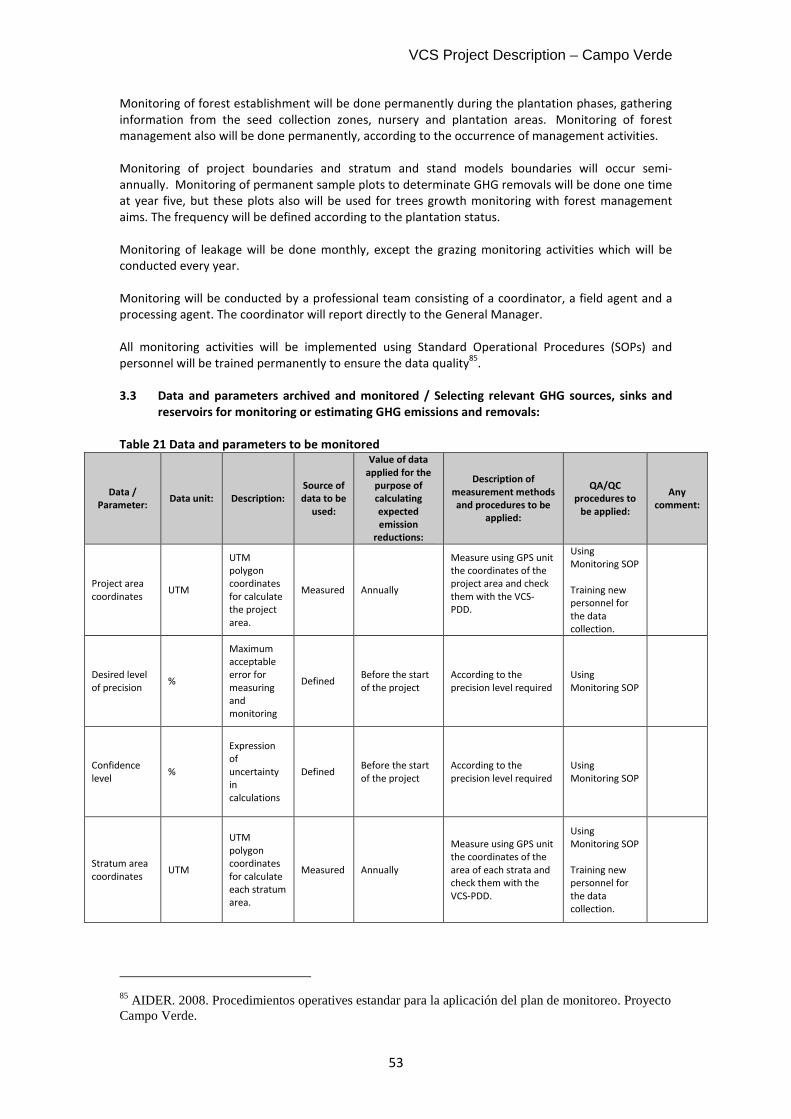
VCS Project Description – Campo Verde
53
Monitoring of forest establishment will be done permanently during the plantation phases, gathering information from the seed collection zones, nursery and plantation areas. Monitoring of forest management also will be done permanently, according to the occurrence of management activities. Monitoring of project boundaries and stratum and stand models boundaries will occur semi-annually. Monitoring of permanent sample plots to determinate GHG removals will be done one time at year five, but these plots also will be used for trees growth monitoring with forest management aims. The frequency will be defined according to the plantation status. Monitoring of leakage will be done monthly, except the grazing monitoring activities which will be conducted every year. Monitoring will be conducted by a professional team consisting of a coordinator, a field agent and a processing agent. The coordinator will report directly to the General Manager. All monitoring activities will be implemented using Standard Operational Procedures (SOPs) and personnel will be trained permanently to ensure the data quality
85.
3.3 Data and parameters archived and monitored / Selecting relevant GHG sources, sinks and
reservoirs for monitoring or estimating GHG emissions and removals:
Table 21 Data and parameters to be monitored
Data /
Parameter: Data unit: Description:
Source of
data to be
used:
Value of data
applied for the
purpose of
calculating
expected
emission
reductions:
Description of
measurement methods
and procedures to be
applied:
QA/QC
procedures to
be applied:
Any
comment:
Project area coordinates
UTM
UTM polygon coordinates for calculate the project area.
Measured Annually
Measure using GPS unit the coordinates of the project area and check them with the VCS- PDD.
Using Monitoring SOP Training new personnel for the data collection.
Desired level of precision
%
Maximum acceptable error for measuring and monitoring
Defined Before the start of the project
According to the precision level required
Using Monitoring SOP
Confidence level
%
Expression of uncertainty in calculations
Defined Before the start of the project
According to the precision level required
Using Monitoring SOP
Stratum area coordinates
UTM
UTM polygon coordinates for calculate each stratum area.
Measured Annually
Measure using GPS unit the coordinates of the area of each strata and check them with the VCS-PDD.
Using Monitoring SOP Training new personnel for the data collection.
85 AIDER. 2008. Procedimientos operatives estandar para la aplicación del plan de monitoreo. Proyecto Campo Verde.
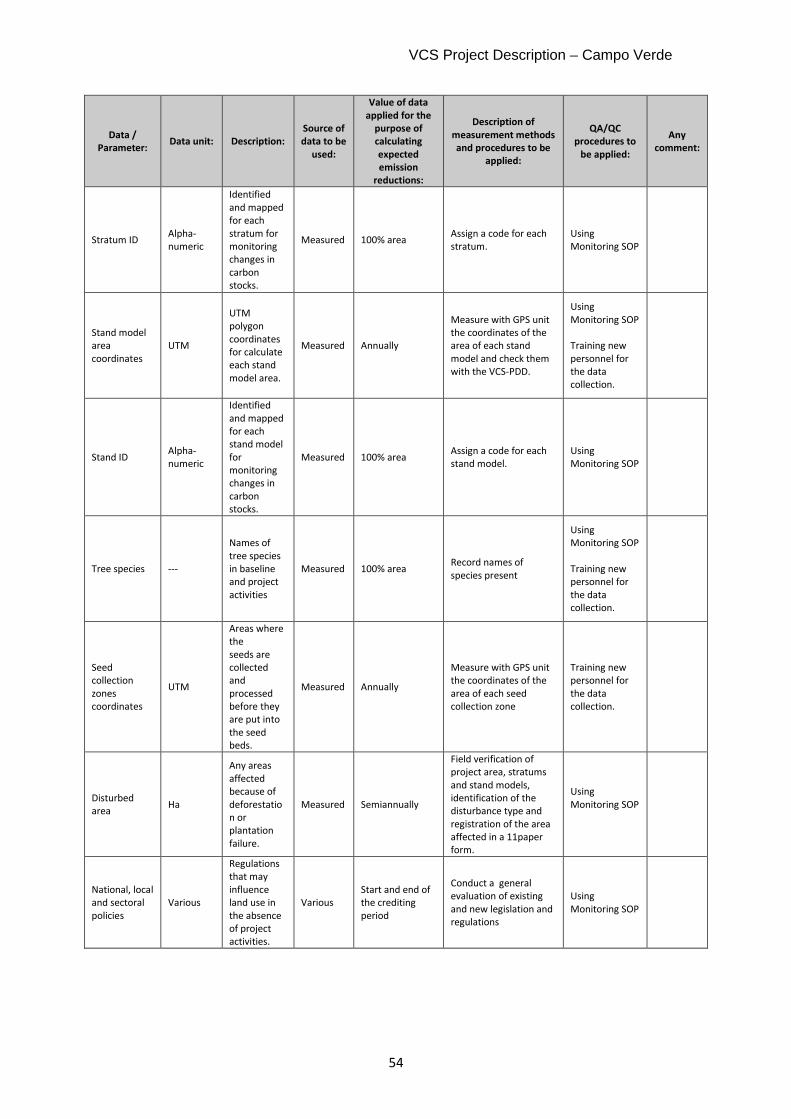
VCS Project Description – Campo Verde
54
Data /
Parameter: Data unit: Description:
Source of
data to be
used:
Value of data
applied for the
purpose of
calculating
expected
emission
reductions:
Description of
measurement methods
and procedures to be
applied:
QA/QC
procedures to
be applied:
Any
comment:
Stratum ID Alpha-numeric
Identified and mapped for each stratum for monitoring changes in carbon stocks.
Measured 100% area Assign a code for each stratum.
Using Monitoring SOP
Stand model area coordinates
UTM
UTM polygon coordinates for calculate each stand model area.
Measured Annually
Measure with GPS unit the coordinates of the area of each stand model and check them with the VCS-PDD.
Using Monitoring SOP Training new personnel for the data collection.
Stand ID Alpha-numeric
Identified and mapped for each stand model for monitoring changes in carbon stocks.
Measured 100% area Assign a code for each stand model.
Using Monitoring SOP
Tree species ---
Names of tree species in baseline and project activities
Measured 100% area Record names of species present
Using Monitoring SOP Training new personnel for the data collection.
Seed collection zones coordinates
UTM
Areas where the seeds are collected and processed before they are put into the seed beds.
Measured Annually
Measure with GPS unit the coordinates of the area of each seed collection zone
Training new personnel for the data collection.
Disturbed area
Ha
Any areas affected because of deforestation or plantation failure.
Measured Semiannually
Field verification of project area, stratums and stand models, identification of the disturbance type and registration of the area affected in a 11paper form.
Using Monitoring SOP
National, local and sectoral policies
Various
Regulations that may influence land use in the absence of project activities.
Various Start and end of the crediting period
Conduct a general evaluation of existing and new legislation and regulations
Using Monitoring SOP
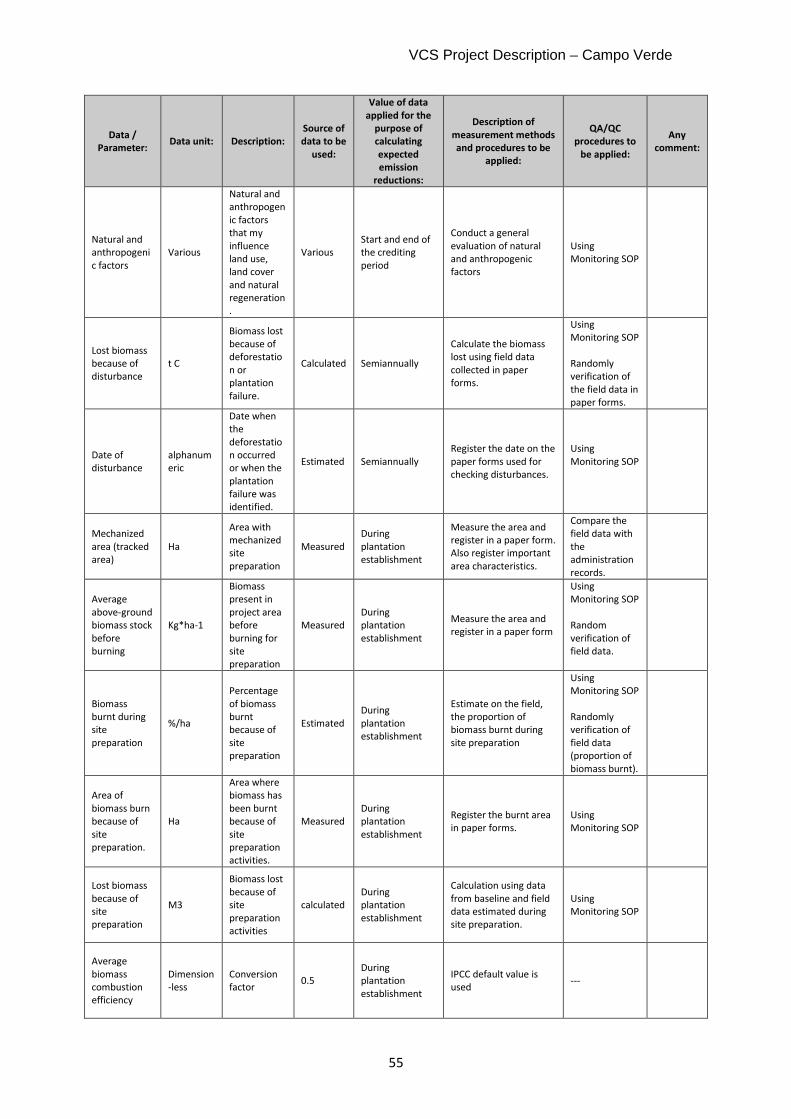
VCS Project Description – Campo Verde
55
Data /
Parameter: Data unit: Description:
Source of
data to be
used:
Value of data
applied for the
purpose of
calculating
expected
emission
reductions:
Description of
measurement methods
and procedures to be
applied:
QA/QC
procedures to
be applied:
Any
comment:
Natural and anthropogenic factors
Various
Natural and anthropogenic factors that my influence land use, land cover and natural regeneration.
Various Start and end of the crediting period
Conduct a general evaluation of natural and anthropogenic factors
Using Monitoring SOP
Lost biomass because of disturbance
t C
Biomass lost because of deforestation or plantation failure.
Calculated Semiannually
Calculate the biomass lost using field data collected in paper forms.
Using Monitoring SOP Randomly verification of the field data in paper forms.
Date of disturbance
alphanumeric
Date when the deforestation occurred or when the plantation failure was identified.
Estimated Semiannually Register the date on the paper forms used for checking disturbances.
Using Monitoring SOP
Mechanized area (tracked area)
Ha
Area with mechanized site preparation
Measured During plantation establishment
Measure the area and register in a paper form. Also register important area characteristics.
Compare the field data with the administration records.
Average above-ground biomass stock before burning
Kg*ha-1
Biomass present in project area before burning for site preparation
Measured During plantation establishment
Measure the area and register in a paper form
Using Monitoring SOP Random verification of field data.
Biomass burnt during site preparation
%/ha
Percentage of biomass burnt because of site preparation
Estimated During plantation establishment
Estimate on the field, the proportion of biomass burnt during site preparation
Using Monitoring SOP Randomly verification of field data (proportion of biomass burnt).
Area of biomass burn because of site preparation.
Ha
Area where biomass has been burnt because of site preparation activities.
Measured During plantation establishment
Register the burnt area in paper forms.
Using Monitoring SOP
Lost biomass because of site preparation
M3
Biomass lost because of site preparation activities
calculated During plantation establishment
Calculation using data from baseline and field data estimated during site preparation.
Using Monitoring SOP
Average biomass combustion efficiency
Dimension-less
Conversion factor
0.5 During plantation establishment
IPCC default value is used
---
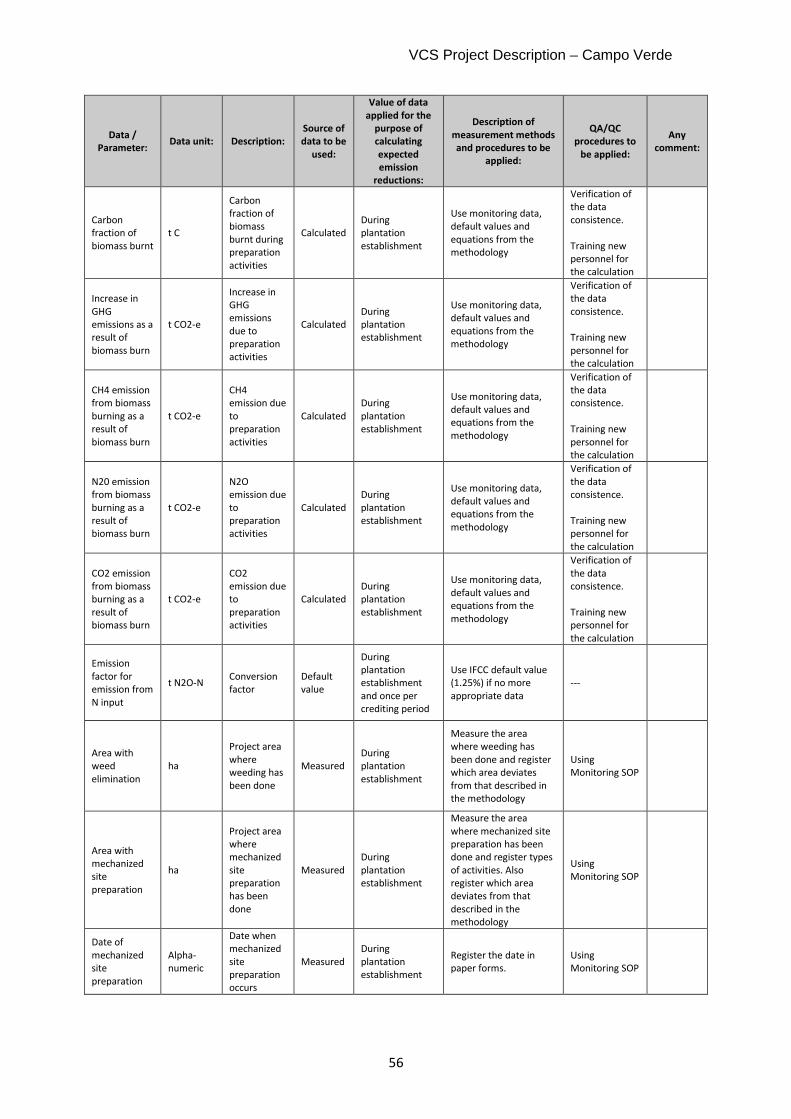
VCS Project Description – Campo Verde
56
Data /
Parameter: Data unit: Description:
Source of
data to be
used:
Value of data
applied for the
purpose of
calculating
expected
emission
reductions:
Description of
measurement methods
and procedures to be
applied:
QA/QC
procedures to
be applied:
Any
comment:
Carbon fraction of biomass burnt
t C
Carbon fraction of biomass burnt during preparation activities
Calculated During plantation establishment
Use monitoring data, default values and equations from the methodology
Verification of the data consistence. Training new personnel for the calculation
Increase in GHG emissions as a result of biomass burn
t CO2-e
Increase in GHG emissions due to preparation activities
Calculated During plantation establishment
Use monitoring data, default values and equations from the methodology
Verification of the data consistence. Training new personnel for the calculation
CH4 emission from biomass burning as a result of biomass burn
t CO2-e
CH4 emission due to preparation activities
Calculated During plantation establishment
Use monitoring data, default values and equations from the methodology
Verification of the data consistence. Training new personnel for the calculation
N20 emission from biomass burning as a result of biomass burn
t CO2-e
N2O emission due to preparation activities
Calculated During plantation establishment
Use monitoring data, default values and equations from the methodology
Verification of the data consistence. Training new personnel for the calculation
CO2 emission from biomass burning as a result of biomass burn
t CO2-e
CO2 emission due to preparation activities
Calculated During plantation establishment
Use monitoring data, default values and equations from the methodology
Verification of the data consistence. Training new personnel for the calculation
Emission factor for emission from N input
t N2O-N Conversion factor
Default value
During plantation establishment and once per crediting period
Use IFCC default value (1.25%) if no more appropriate data
---
Area with weed elimination
ha
Project area where weeding has been done
Measured During plantation establishment
Measure the area where weeding has been done and register which area deviates from that described in the methodology
Using Monitoring SOP
Area with mechanized site preparation
ha
Project area where mechanized site preparation has been done
Measured During plantation establishment
Measure the area where mechanized site preparation has been done and register types of activities. Also register which area deviates from that described in the methodology
Using Monitoring SOP
Date of mechanized site preparation
Alpha-numeric
Date when mechanized site preparation occurs
Measured During plantation establishment
Register the date in paper forms.
Using Monitoring SOP
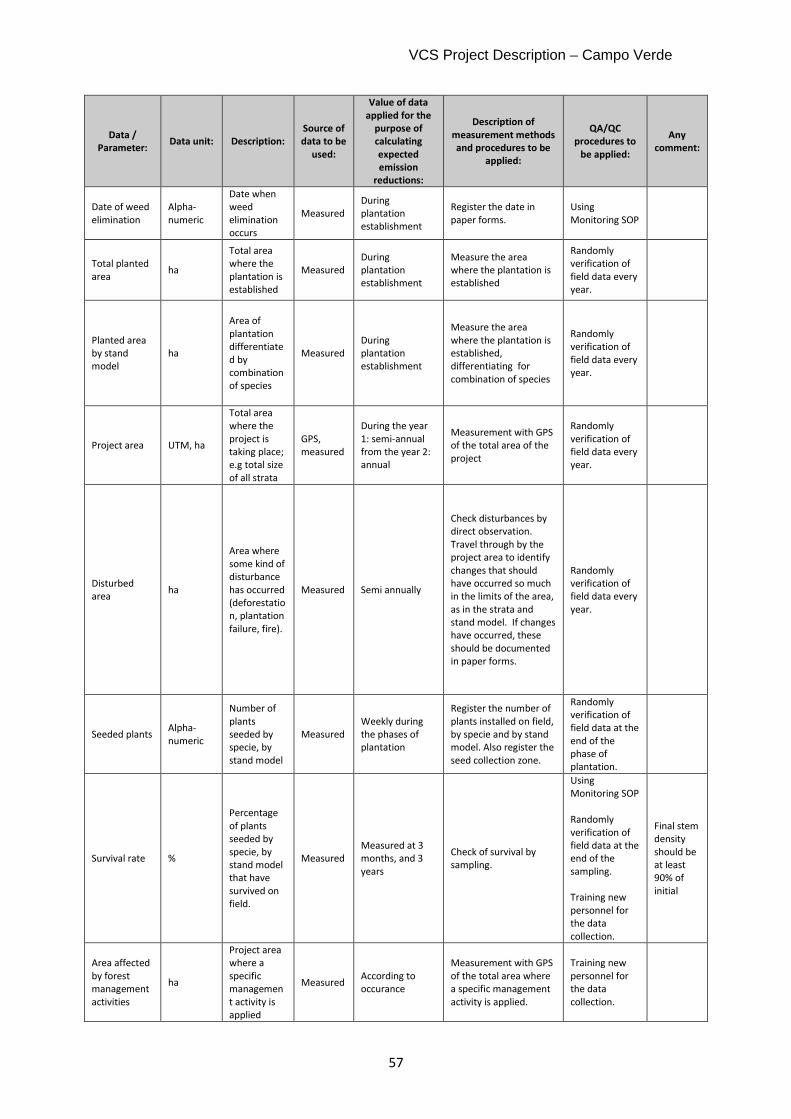
VCS Project Description – Campo Verde
57
Data /
Parameter: Data unit: Description:
Source of
data to be
used:
Value of data
applied for the
purpose of
calculating
expected
emission
reductions:
Description of
measurement methods
and procedures to be
applied:
QA/QC
procedures to
be applied:
Any
comment:
Date of weed elimination
Alpha-numeric
Date when weed elimination occurs
Measured During plantation establishment
Register the date in paper forms.
Using Monitoring SOP
Total planted area
ha
Total area where the plantation is established
Measured During plantation establishment
Measure the area where the plantation is established
Randomly verification of field data every year.
Planted area by stand model
ha
Area of plantation differentiated by combination of species
Measured During plantation establishment
Measure the area where the plantation is established, differentiating for combination of species
Randomly verification of field data every year.
Project area UTM, ha
Total area where the project is taking place; e.g total size of all strata
GPS, measured
During the year 1: semi-annual from the year 2: annual
Measurement with GPS of the total area of the project
Randomly verification of field data every year.
Disturbed area
ha
Area where some kind of disturbance has occurred (deforestation, plantation failure, fire).
Measured Semi annually
Check disturbances by direct observation. Travel through by the project area to identify changes that should have occurred so much in the limits of the area, as in the strata and stand model. If changes have occurred, these should be documented in paper forms.
Randomly verification of field data every year.
Seeded plants Alpha-numeric
Number of plants seeded by specie, by stand model
Measured Weekly during the phases of plantation
Register the number of plants installed on field, by specie and by stand model. Also register the seed collection zone.
Randomly verification of field data at the end of the phase of plantation.
Survival rate %
Percentage of plants seeded by specie, by stand model that have survived on field.
Measured Measured at 3 months, and 3 years
Check of survival by sampling.
Using Monitoring SOP Randomly verification of field data at the end of the sampling. Training new personnel for the data collection.
Final stem density should be at least 90% of initial
Area affected by forest management activities
ha
Project area where a specific management activity is applied
Measured According to occurance
Measurement with GPS of the total area where a specific management activity is applied.
Training new personnel for the data collection.
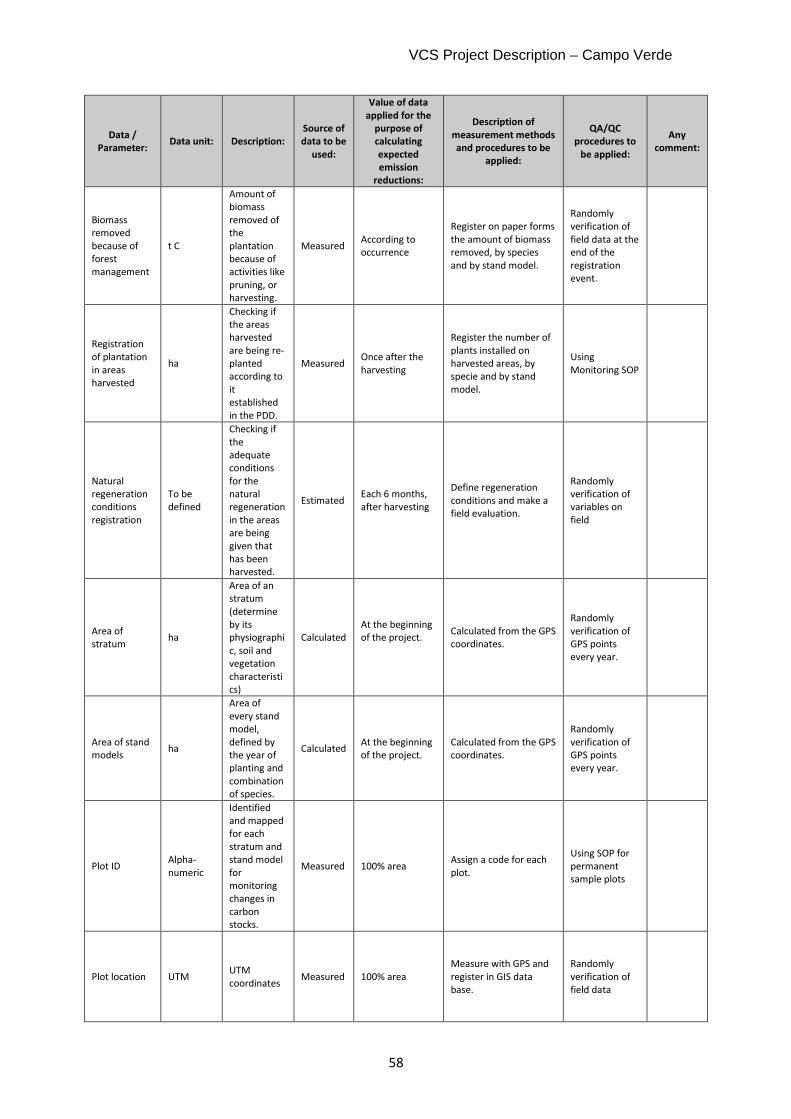
VCS Project Description – Campo Verde
58
Data /
Parameter: Data unit: Description:
Source of
data to be
used:
Value of data
applied for the
purpose of
calculating
expected
emission
reductions:
Description of
measurement methods
and procedures to be
applied:
QA/QC
procedures to
be applied:
Any
comment:
Biomass removed because of forest management
t C
Amount of biomass removed of the plantation because of activities like pruning, or harvesting.
Measured According to occurrence
Register on paper forms the amount of biomass removed, by species and by stand model.
Randomly verification of field data at the end of the registration event.
Registration of plantation in areas harvested
ha
Checking if the areas harvested are being re-planted according to it established in the PDD.
Measured Once after the harvesting
Register the number of plants installed on harvested areas, by specie and by stand model.
Using Monitoring SOP
Natural regeneration conditions registration
To be defined
Checking if the adequate conditions for the natural regeneration in the areas are being given that has been harvested.
Estimated Each 6 months, after harvesting
Define regeneration conditions and make a field evaluation.
Randomly verification of variables on field
Area of stratum
ha
Area of an stratum (determine by its physiographic, soil and vegetation characteristics)
Calculated At the beginning of the project.
Calculated from the GPS coordinates.
Randomly verification of GPS points every year.
Area of stand models
ha
Area of every stand model, defined by the year of planting and combination of species.
Calculated At the beginning of the project.
Calculated from the GPS coordinates.
Randomly verification of GPS points every year.
Plot ID Alpha-numeric
Identified and mapped for each stratum and stand model for monitoring changes in carbon stocks.
Measured 100% area Assign a code for each plot.
Using SOP for permanent sample plots
Plot location UTM UTM coordinates
Measured 100% area Measure with GPS and register in GIS data base.
Randomly verification of field data
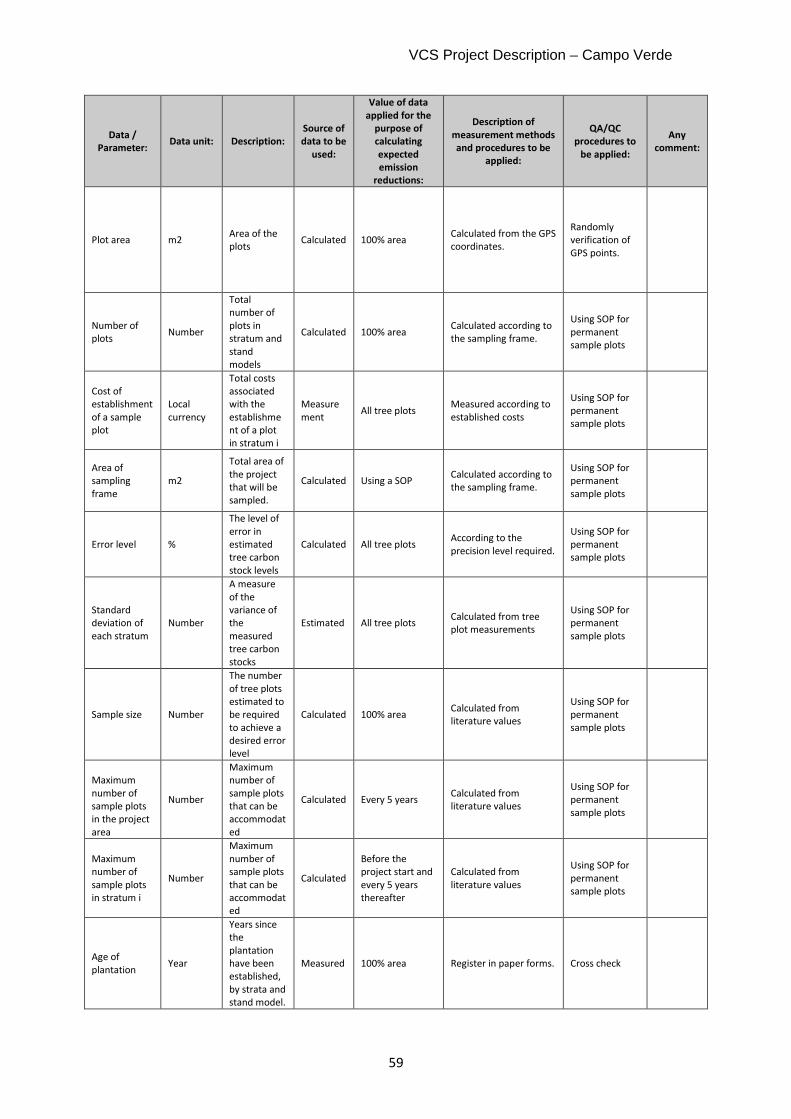
VCS Project Description – Campo Verde
59
Data /
Parameter: Data unit: Description:
Source of
data to be
used:
Value of data
applied for the
purpose of
calculating
expected
emission
reductions:
Description of
measurement methods
and procedures to be
applied:
QA/QC
procedures to
be applied:
Any
comment:
Plot area m2 Area of the plots
Calculated 100% area Calculated from the GPS coordinates.
Randomly verification of GPS points.
Number of plots
Number
Total number of plots in stratum and stand models
Calculated 100% area Calculated according to the sampling frame.
Using SOP for permanent sample plots
Cost of establishment of a sample plot
Local currency
Total costs associated with the establishment of a plot in stratum i
Measurement
All tree plots Measured according to established costs
Using SOP for permanent sample plots
Area of sampling frame
m2
Total area of the project that will be sampled.
Calculated Using a SOP Calculated according to the sampling frame.
Using SOP for permanent sample plots
Error level %
The level of error in estimated tree carbon stock levels
Calculated All tree plots According to the precision level required.
Using SOP for permanent sample plots
Standard deviation of each stratum
Number
A measure of the variance of the measured tree carbon stocks
Estimated All tree plots Calculated from tree plot measurements
Using SOP for permanent sample plots
Sample size Number
The number of tree plots estimated to be required to achieve a desired error level
Calculated 100% area Calculated from literature values
Using SOP for permanent sample plots
Maximum number of sample plots in the project area
Number
Maximum number of sample plots that can be accommodated
Calculated Every 5 years Calculated from literature values
Using SOP for permanent sample plots
Maximum number of sample plots in stratum i
Number
Maximum number of sample plots that can be accommodated
Calculated
Before the project start and every 5 years thereafter
Calculated from literature values
Using SOP for permanent sample plots
Age of plantation
Year
Years since the plantation have been established, by strata and stand model.
Measured 100% area Register in paper forms. Cross check
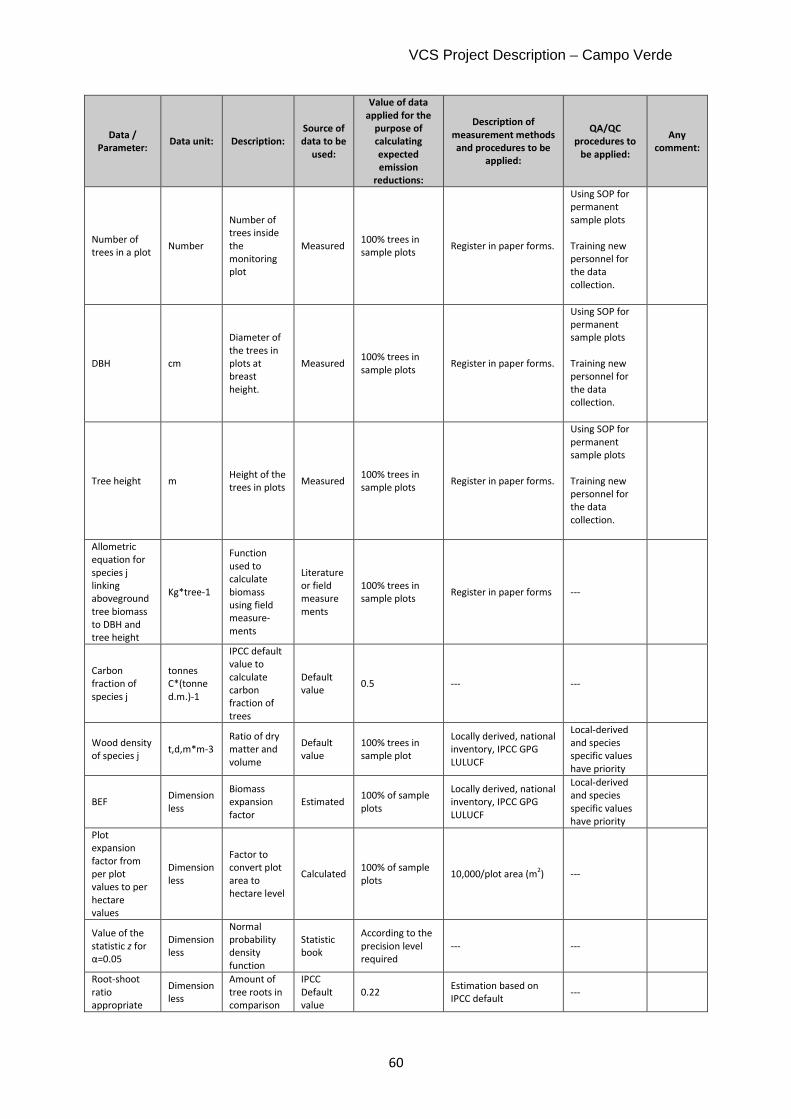
VCS Project Description – Campo Verde
60
Data /
Parameter: Data unit: Description:
Source of
data to be
used:
Value of data
applied for the
purpose of
calculating
expected
emission
reductions:
Description of
measurement methods
and procedures to be
applied:
QA/QC
procedures to
be applied:
Any
comment:
Number of trees in a plot
Number
Number of trees inside the monitoring plot
Measured 100% trees in sample plots
Register in paper forms.
Using SOP for permanent sample plots Training new personnel for the data collection.
DBH cm
Diameter of the trees in plots at breast height.
Measured 100% trees in sample plots
Register in paper forms.
Using SOP for permanent sample plots Training new personnel for the data collection.
Tree height m Height of the trees in plots
Measured 100% trees in sample plots
Register in paper forms.
Using SOP for permanent sample plots Training new personnel for the data collection.
Allometric equation for species j linking aboveground tree biomass to DBH and tree height
Kg*tree-1
Function used to calculate biomass using field measure-ments
Literature or field measurements
100% trees in sample plots
Register in paper forms ---
Carbon fraction of species j
tonnes C*(tonne d.m.)-1
IPCC default value to calculate carbon fraction of trees
Default value
0.5 --- ---
Wood density of species j
t,d,m*m-3 Ratio of dry matter and volume
Default value
100% trees in sample plot
Locally derived, national inventory, IPCC GPG LULUCF
Local-derived and species specific values have priority
BEF Dimensionless
Biomass expansion factor
Estimated 100% of sample plots
Locally derived, national inventory, IPCC GPG LULUCF
Local-derived and species specific values have priority
Plot expansion factor from per plot values to per hectare values
Dimensionless
Factor to convert plot area to hectare level
Calculated 100% of sample plots
10,000/plot area (m2) ---
Value of the statistic z for α=0.05
Dimensionless
Normal probability density function
Statistic book
According to the precision level required
--- ---
Root-shoot ratio appropriate
Dimensionless
Amount of tree roots in comparison
IPCC Default value
0.22 Estimation based on IPCC default
---
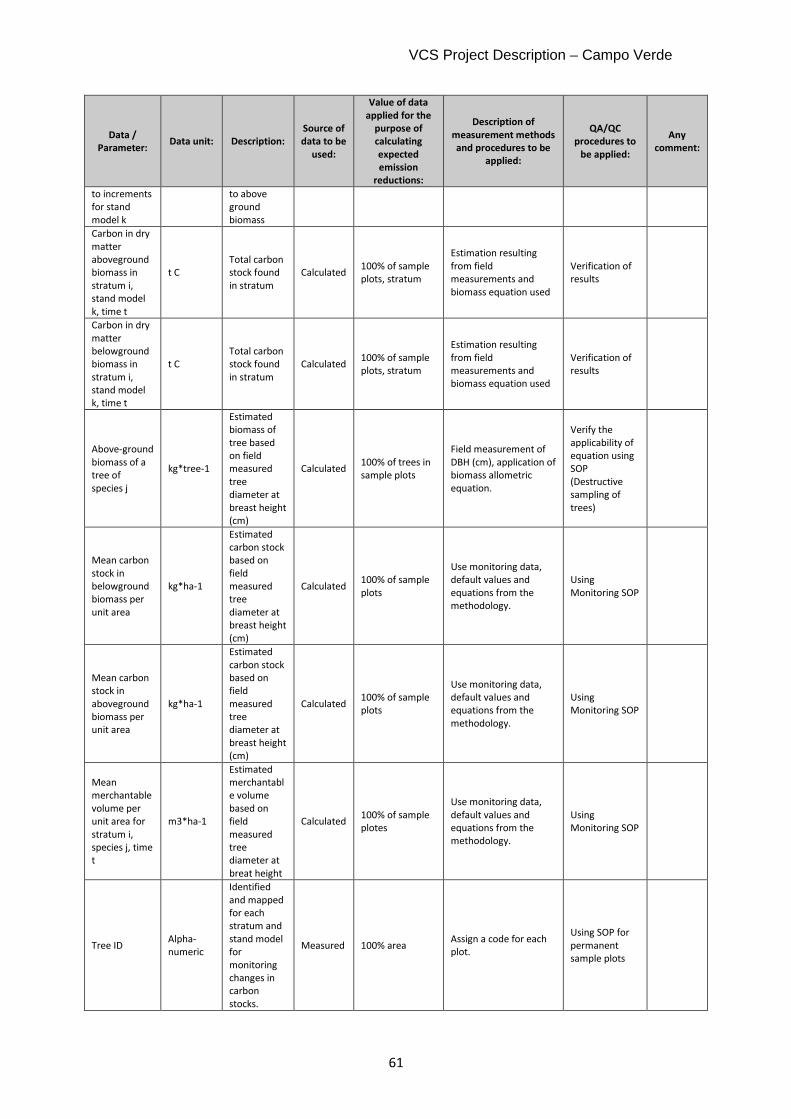
VCS Project Description – Campo Verde
61
Data /
Parameter: Data unit: Description:
Source of
data to be
used:
Value of data
applied for the
purpose of
calculating
expected
emission
reductions:
Description of
measurement methods
and procedures to be
applied:
QA/QC
procedures to
be applied:
Any
comment:
to increments for stand model k
to above ground biomass
Carbon in dry matter aboveground biomass in stratum i, stand model k, time t
t C Total carbon stock found in stratum
Calculated 100% of sample plots, stratum
Estimation resulting from field measurements and biomass equation used
Verification of results
Carbon in dry matter belowground biomass in stratum i, stand model k, time t
t C Total carbon stock found in stratum
Calculated 100% of sample plots, stratum
Estimation resulting from field measurements and biomass equation used
Verification of results
Above-ground biomass of a tree of species j
kg*tree-1
Estimated biomass of tree based on field measured tree diameter at breast height (cm)
Calculated 100% of trees in sample plots
Field measurement of DBH (cm), application of biomass allometric equation.
Verify the applicability of equation using SOP (Destructive sampling of trees)
Mean carbon stock in belowground biomass per unit area
kg*ha-1
Estimated carbon stock based on field measured tree diameter at breast height (cm)
Calculated 100% of sample plots
Use monitoring data, default values and equations from the methodology.
Using Monitoring SOP
Mean carbon stock in aboveground biomass per unit area
kg*ha-1
Estimated carbon stock based on field measured tree diameter at breast height (cm)
Calculated 100% of sample plots
Use monitoring data, default values and equations from the methodology.
Using Monitoring SOP
Mean merchantable volume per unit area for stratum i, species j, time t
m3*ha-1
Estimated merchantable volume based on field measured tree diameter at breat height
Calculated 100% of sample plotes
Use monitoring data, default values and equations from the methodology.
Using Monitoring SOP
Tree ID Alpha-numeric
Identified and mapped for each stratum and stand model for monitoring changes in carbon stocks.
Measured 100% area Assign a code for each plot.
Using SOP for permanent sample plots
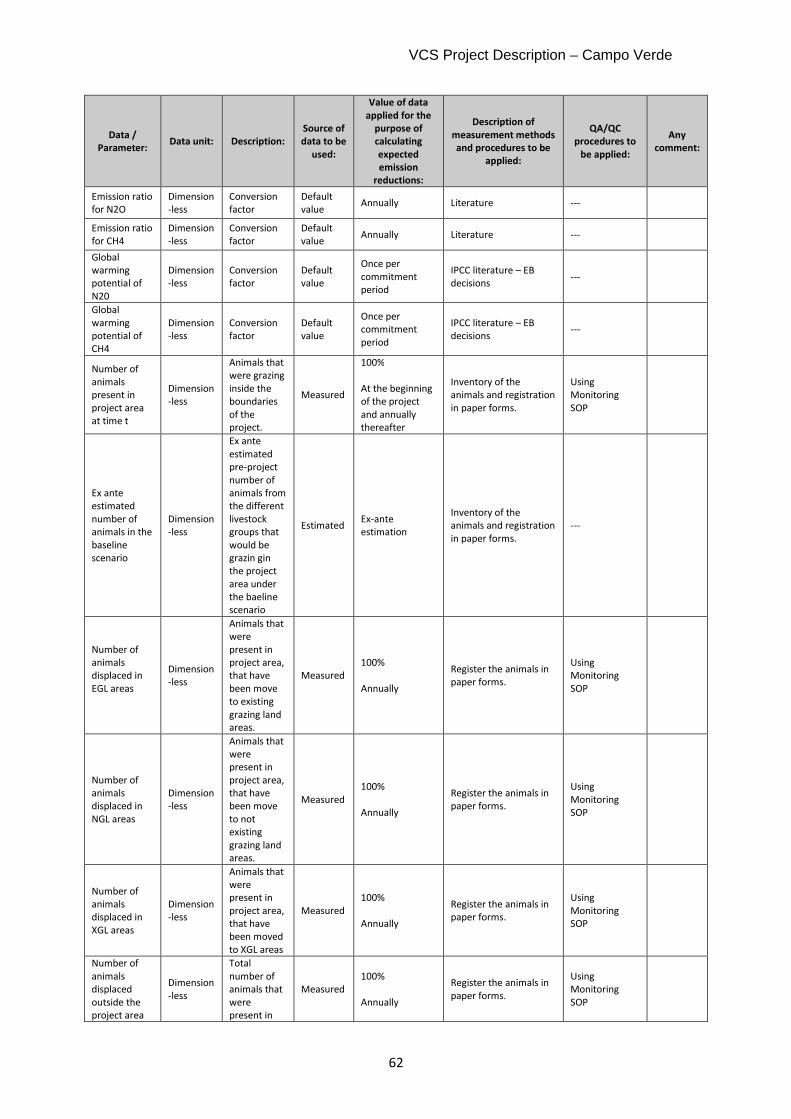
VCS Project Description – Campo Verde
62
Data /
Parameter: Data unit: Description:
Source of
data to be
used:
Value of data
applied for the
purpose of
calculating
expected
emission
reductions:
Description of
measurement methods
and procedures to be
applied:
QA/QC
procedures to
be applied:
Any
comment:
Emission ratio for N2O
Dimension-less
Conversion factor
Default value
Annually Literature ---
Emission ratio for CH4
Dimension-less
Conversion factor
Default value
Annually Literature ---
Global warming potential of N20
Dimension-less
Conversion factor
Default value
Once per commitment period
IPCC literature – EB decisions
---
Global warming potential of CH4
Dimension-less
Conversion factor
Default value
Once per commitment period
IPCC literature – EB decisions
---
Number of animals present in project area at time t
Dimension-less
Animals that were grazing inside the boundaries of the project.
Measured
100% At the beginning of the project and annually thereafter
Inventory of the animals and registration in paper forms.
Using Monitoring SOP
Ex ante estimated number of animals in the baseline scenario
Dimension-less
Ex ante estimated pre-project number of animals from the different livestock groups that would be grazin gin the project area under the baeline scenario
Estimated Ex-ante estimation
Inventory of the animals and registration in paper forms.
---
Number of animals displaced in EGL areas
Dimension-less
Animals that were present in project area, that have been move to existing grazing land areas.
Measured 100% Annually
Register the animals in paper forms.
Using Monitoring SOP
Number of animals displaced in NGL areas
Dimension-less
Animals that were present in project area, that have been move to not existing grazing land areas.
Measured 100% Annually
Register the animals in paper forms.
Using Monitoring SOP
Number of animals displaced in XGL areas
Dimension-less
Animals that were present in project area, that have been moved to XGL areas
Measured 100% Annually
Register the animals in paper forms.
Using Monitoring SOP
Number of animals displaced outside the project area
Dimension-less
Total number of animals that were present in
Measured 100% Annually
Register the animals in paper forms.
Using Monitoring SOP
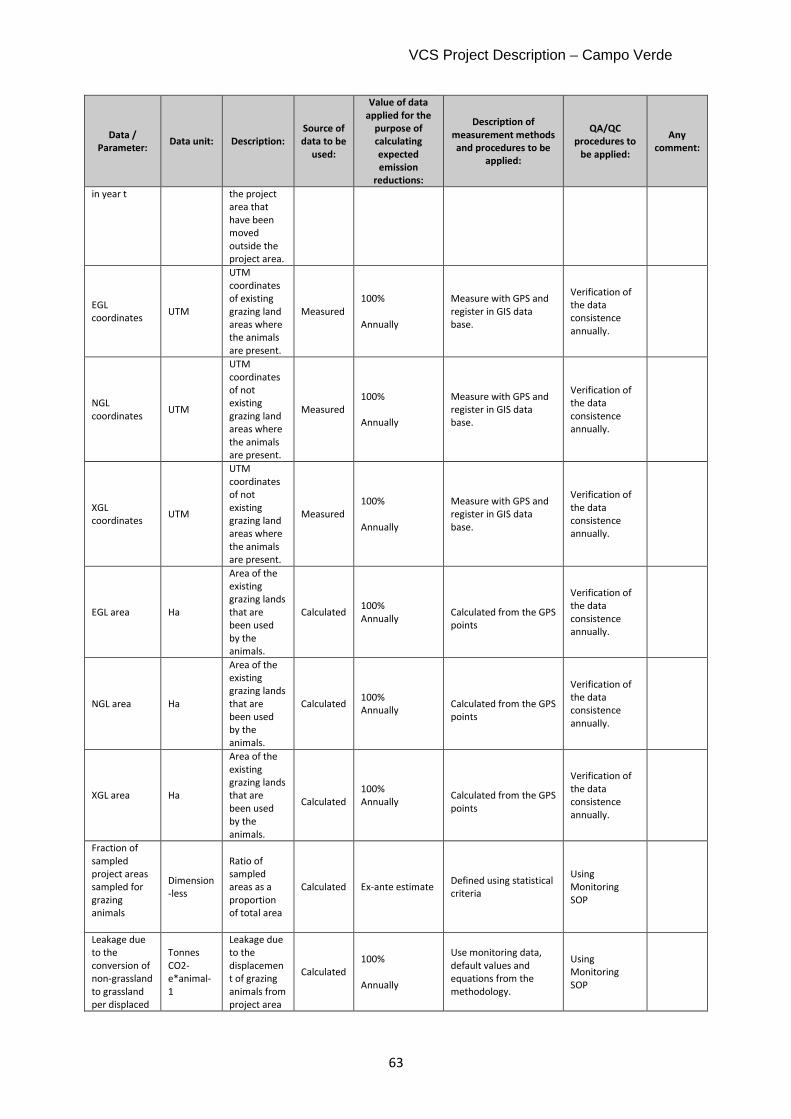
VCS Project Description – Campo Verde
63
Data /
Parameter: Data unit: Description:
Source of
data to be
used:
Value of data
applied for the
purpose of
calculating
expected
emission
reductions:
Description of
measurement methods
and procedures to be
applied:
QA/QC
procedures to
be applied:
Any
comment:
in year t the project area that have been moved outside the project area.
EGL coordinates
UTM
UTM coordinates of existing grazing land areas where the animals are present.
Measured 100% Annually
Measure with GPS and register in GIS data base.
Verification of the data consistence annually.
NGL coordinates
UTM
UTM coordinates of not existing grazing land areas where the animals are present.
Measured 100% Annually
Measure with GPS and register in GIS data base.
Verification of the data consistence annually.
XGL coordinates
UTM
UTM coordinates of not existing grazing land areas where the animals are present.
Measured 100% Annually
Measure with GPS and register in GIS data base.
Verification of the data consistence annually.
EGL area Ha
Area of the existing grazing lands that are been used by the animals.
Calculated 100% Annually
Calculated from the GPS points
Verification of the data consistence annually.
NGL area Ha
Area of the existing grazing lands that are been used by the animals.
Calculated 100% Annually
Calculated from the GPS points
Verification of the data consistence annually.
XGL area Ha
Area of the existing grazing lands that are been used by the animals.
Calculated
100% Annually
Calculated from the GPS points
Verification of the data consistence annually.
Fraction of sampled project areas sampled for grazing animals
Dimension-less
Ratio of sampled areas as a proportion of total area
Calculated Ex-ante estimate Defined using statistical criteria
Using Monitoring SOP
Leakage due to the conversion of non-grassland to grassland per displaced
Tonnes CO2-e*animal-1
Leakage due to the displacement of grazing animals from project area
Calculated 100% Annually
Use monitoring data, default values and equations from the methodology.
Using Monitoring SOP
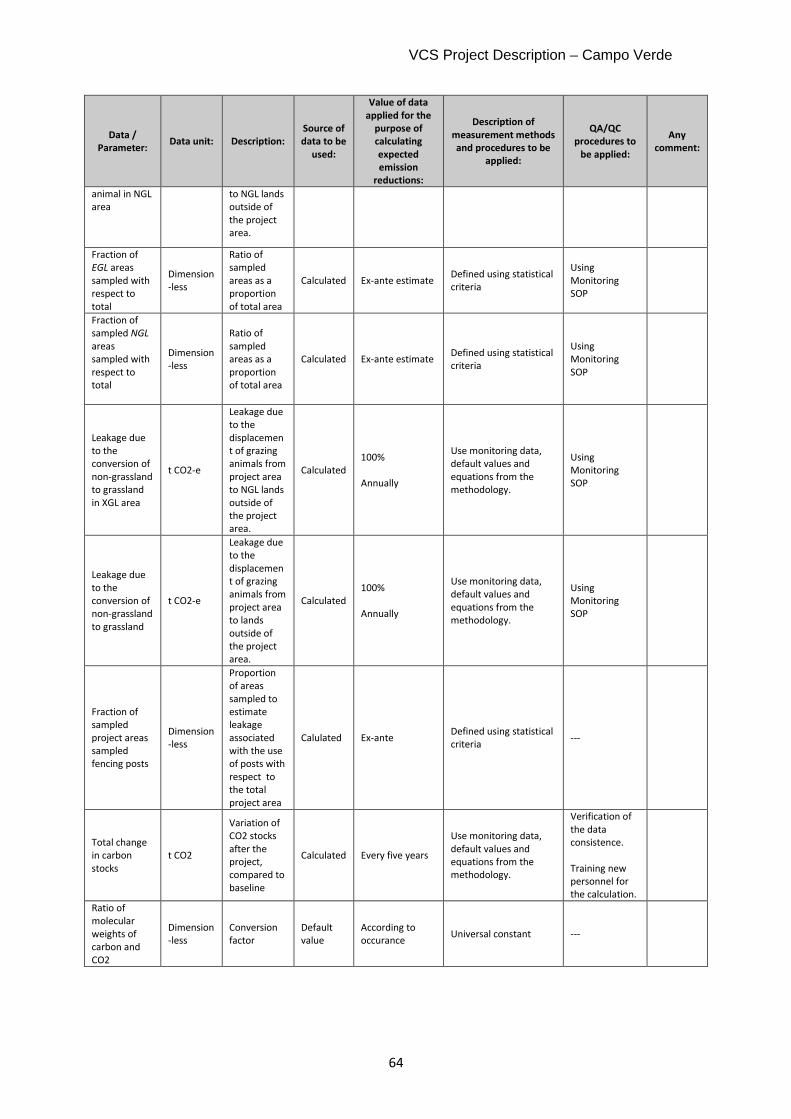
VCS Project Description – Campo Verde
64
Data /
Parameter: Data unit: Description:
Source of
data to be
used:
Value of data
applied for the
purpose of
calculating
expected
emission
reductions:
Description of
measurement methods
and procedures to be
applied:
QA/QC
procedures to
be applied:
Any
comment:
animal in NGL area
to NGL lands outside of the project area.
Fraction of EGL areas sampled with respect to total
Dimension-less
Ratio of sampled areas as a proportion of total area
Calculated Ex-ante estimate Defined using statistical criteria
Using Monitoring SOP
Fraction of sampled NGL
areas sampled with respect to total
Dimension-less
Ratio of sampled areas as a proportion of total area
Calculated Ex-ante estimate Defined using statistical criteria
Using Monitoring SOP
Leakage due to the conversion of non-grassland to grassland in XGL area
t CO2-e
Leakage due to the displacement of grazing animals from project area to NGL lands outside of the project area.
Calculated 100% Annually
Use monitoring data, default values and equations from the methodology.
Using Monitoring SOP
Leakage due to the conversion of non-grassland to grassland
t CO2-e
Leakage due to the displacement of grazing animals from project area to lands outside of the project area.
Calculated 100% Annually
Use monitoring data, default values and equations from the methodology.
Using Monitoring SOP
Fraction of sampled project areas sampled fencing posts
Dimension-less
Proportion of areas sampled to estimate leakage associated with the use of posts with respect to the total project area
Calulated Ex-ante Defined using statistical criteria
---
Total change in carbon stocks
t CO2
Variation of CO2 stocks after the project, compared to baseline
Calculated Every five years
Use monitoring data, default values and equations from the methodology.
Verification of the data consistence. Training new personnel for the calculation.
Ratio of molecular weights of carbon and CO2
Dimension-less
Conversion factor
Default value
According to occurance
Universal constant ---
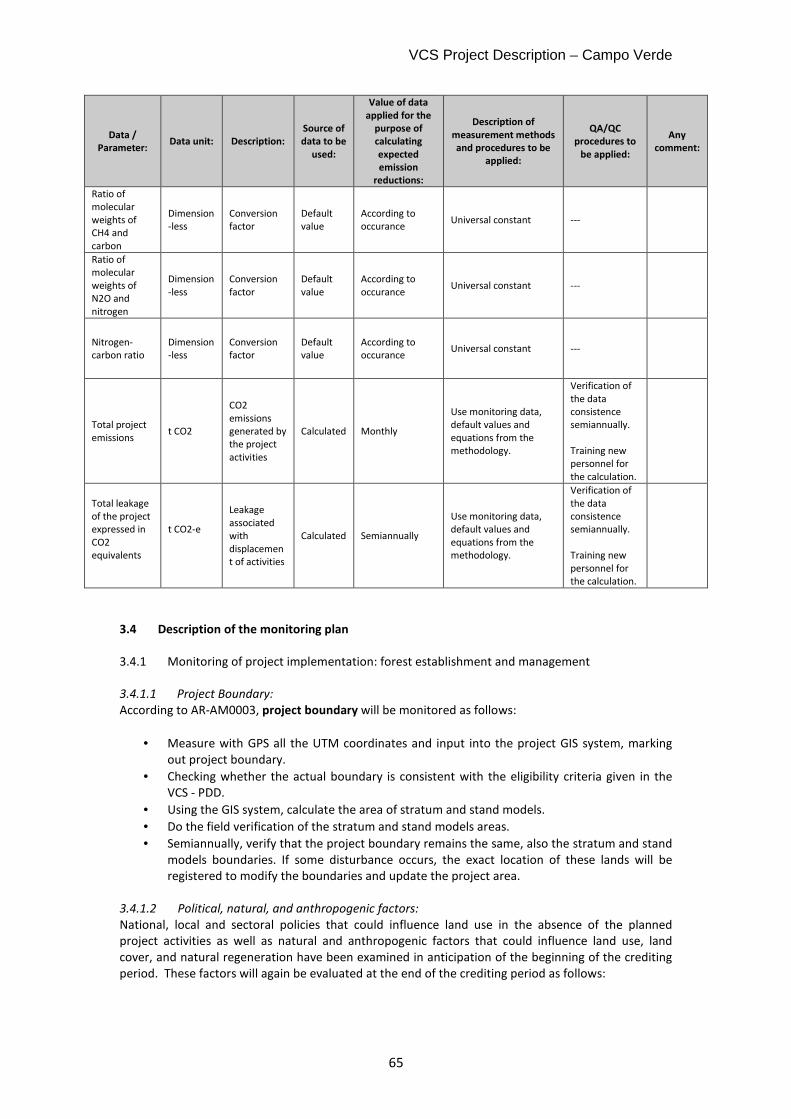
VCS Project Description – Campo Verde
65
Data /
Parameter: Data unit: Description:
Source of
data to be
used:
Value of data
applied for the
purpose of
calculating
expected
emission
reductions:
Description of
measurement methods
and procedures to be
applied:
QA/QC
procedures to
be applied:
Any
comment:
Ratio of molecular weights of CH4 and carbon
Dimension-less
Conversion factor
Default value
According to occurance
Universal constant ---
Ratio of molecular weights of N2O and nitrogen
Dimension-less
Conversion factor
Default value
According to occurance
Universal constant ---
Nitrogen-carbon ratio
Dimension-less
Conversion factor
Default value
According to occurance
Universal constant ---
Total project emissions
t CO2
CO2 emissions generated by the project activities
Calculated Monthly
Use monitoring data, default values and equations from the methodology.
Verification of the data consistence semiannually. Training new personnel for the calculation.
Total leakage of the project expressed in CO2 equivalents
t CO2-e
Leakage associated with displacement of activities
Calculated Semiannually
Use monitoring data, default values and equations from the methodology.
Verification of the data consistence semiannually. Training new personnel for the calculation.
3.4 Description of the monitoring plan
3.4.1 Monitoring of project implementation: forest establishment and management
3.4.1.1 Project Boundary:
According to AR-AM0003, project boundary will be monitored as follows:
• Measure with GPS all the UTM coordinates and input into the project GIS system, marking out project boundary.
• Checking whether the actual boundary is consistent with the eligibility criteria given in the VCS - PDD.
• Using the GIS system, calculate the area of stratum and stand models.
• Do the field verification of the stratum and stand models areas.
• Semiannually, verify that the project boundary remains the same, also the stratum and stand models boundaries. If some disturbance occurs, the exact location of these lands will be registered to modify the boundaries and update the project area.
3.4.1.2 Political, natural, and anthropogenic factors:
National, local and sectoral policies that could influence land use in the absence of the planned project activities as well as natural and anthropogenic factors that could influence land use, land cover, and natural regeneration have been examined in anticipation of the beginning of the crediting period. These factors will again be evaluated at the end of the crediting period as follows:
VCS Project Description – Campo Verde
66
• Review relevant national, local and sectoral regulations to identify any possible conflicts in project activities.
• Evaluate the level of risk of natural factors including fire, pest and disease attack, geological instability, and climate.
• Monitor relevant anthropogenic factors including human activity in project area and social instability
3.4.1.3 Forest Establishment:
Standard operating procedures of commonly accepted forest management will be implemented to ensure that planting practice and quality conforms to that described in VCS-PDD. The following monitoring activities shall be conducted in the first three years after planting:
• Register the type of activities of site and soil preparations and the areas involved. Confirm that are implemented based on the practices documented in VCS – PDD.
• Register the type of activities of weeding and the areas involved. Confirm that are implemented based on the practices documented in VCS – PDD.
• Register the seed collection zones and nursery production to determinate the precedence of the plants.
• Register the planting: date, area, tree species, number of plants and precedence by stand models.
• Survival checking: o The initial survival rate of planted trees shall be counted three months after the
planting, and re-planting shall be conducted if the survival rate is lower than 90 percent of the final planting density;
o Final checking three years after the planting; o The checking of the survival rate will be conducted using temporary sample plots.
• Check that species and planting for each stand model are in line with the VCS-PDD.
• Document and explain any deviation from the planned forest establishment. 3.4.1.4 Forest Management:
Commonly accepted forest management techniques will be used by the project and the following practices will be monitored:
• Weeding: date, area, stand model.
• Fertilizer application: date, area, number of plants, stand model.
• Pruning: date, location, number of trees pruned, stand model.
• Harvesting: date, location, area, tree species and number of trees.
• Fuel wood collection: date, location, stand model, tree species, estimation of biomass removed.
• Checking and confirming that harvested lands are re-planted, re-sowed as planned.
• Checking and ensuring that good conditions exist for natural regeneration if harvested lands are allowed to regenerate naturally.
• Register disturbances: date, location, and stand model, type of disturbance, area and number of trees involved.
• Fire control: date, location, stand model, type of activity done, area and number of trees involved.
3.4.2 Sampling design and stratification
The stratification strategy is presented in Section 10, Monitoring Plan. When found appropriate, the area will be divided into stratum based on planting year. In addition, post stratification will be also conducted after the first monitoring to address possible changes of project boundary and planting year in comparison to the project design. The post stratification will also address the change in carbon stocks if they are more or less variable than it is expected. Strata or substrata may be grouped into
VCS Project Description – Campo Verde
67
one stratum or substratum if they have similar carbon stock, carbon stock change and spatial variation. Otherwise, new strata may be defined. Stratification will be based on the following criteria:
• Identification of factors influencing the carbon stocks: major factors that will influence tree growth (erosion processes, soil type, physiographic characteristics, etc.).
• Site classification based on factors identified in a).
• Field visits on each piece of land to inspect existing vegetation, soil condition and erosion status.
• Interviews with local farmers on land use/cover history, important events that have impacted or area impacting the land use/cover.
• Sampling surveys on representative land use and land cover types including baseline biomass
• Field measurements. The methods described in approved methodology AR-AM0003 will be used to determine the sampling design. The methods are further detailed in the Monitoring Plan. 3.4.3 Monitoring baseline net GHG removals by sinks.
As per AR-AM0003 V04, monitoring of the baseline net GHG removals by sinks is not required.
3.4.4 Monitoring actual net GHG removals by sinks
The actual net greenhouse gas removals by sinks represent the sum of the verifiable changes in carbon stocks in the carbon pools within the project boundary, minus the increase in non-CO2 GHG emissions measured in CO2 equivalents by sources that are increased as a result of the implementation of an VCS-AR project activity, while avoiding double counting, within the project boundary, attributable to the VCS-AR project activity
4. Therefore according to Eq. 13 of AR-AM0003
V04,
CACTUAL = ΔCP,LB - GHGE
Where:
CACTUAL = actual net greenhouse gas removals by sinks; tons CO2-e
ΔCP,LB = sum of the changes in living biomass carbon stocks (above- and below-ground); tonnes CO2-e
GHGE = sum of the increases in GHG emissions by sources within the project boundary as a result of the implementation of an VCS-AR project activity; tons CO2-e
3.4.4.1 Measuring and estimating carbon stock changes over time
According to Eq. 15 of AR-AM0003 V04,
∑∑∑= = =
∆=∆*
1 1 1,,
t
t
m
i
K
kiktPLBP
P P
CC
Where:
ΔCP,LB = sum of the changes in living biomass carbon stocks in the project scenario (above- and below-ground); tonnes CO2-e
ΔCP,ikt = annual carbon stock change in living biomass for stand model k, in stratum i, at time t; tonnes CO2-e yr
-1
Note: As the same equation is used for baseline and actual removals in the following the index P is omitted (e. g. ΔCP,ikt = ΔCikt)
i = 1, 2, 3, … mP strata in the project scenario
VCS Project Description – Campo Verde
68
k = 1, 2, 3, … KP stand models in the project scenario
t = 1, 2, 3, … t* years elapsed since the start of the AR project activity For all stratum, “SOP Calculation of Tree Carbon Stock Changes with or without harvesting” will be utilized to calculate the changes in live carbon stock changes between monitoring events. 3.4.4.2 Monitoring GHG emissions by sources increased as result of project activity
According to Eq. 22 of AR-AM0003 V04,
nBiomassBurFuelBurnE EEGHG +=
Where:
GHGE = sum of the increases in GHG emissions by sources within the project boundary as a result of the implementation of an VCS-AR project activity; tonnes CO2-e
EFuelBurn = increase in GHG emission as a result of burning of fossil fuels within the project boundary; tonnes CO2-e
EBiomassBurn = increase in GHG emission as a result of biomass burning within the project boundary; tonnes CO2-e
Machinery will be used during site preparation and forest management activities within the project area during the life of the project. The emissions from the use of these vehicles will be monitored. Standard operational procedures for monitoring emissions resulting from the project are described in Section 10, Monitoring Plan.
3.4.4.3 Increase in GHG emissions as a result of decrease in non-tree carbon stock
According to AR-AM0003 V04, it is assumed that all non-tree vegetation existing on in the project area prior to project activities will disappear. It is assumed that this occurs at the start of the project, and therefore, non-tree carbon stocks are not measured during subsequent monitoring events. The carbon stock in this non-tree vegetation was measured prior to the start of project activities during baseline data collection. A full description of the sampling that took place can be found in the baseline report. The average non-tree carbon stock was determined and the emission resulting from this reduction in non-tree carbon stock estimated using Eq. 14 of AR-AM0003 V04
∑∑= =
−− ⋅⋅⋅=*
1 1, 12
44t
t
m
itreenonitreenonisbiomasslos
PS
CFBAE
Where:
Ebiomassloss = increase in GHG emissions as a result of decrease in non-tree
carbon stock, tonnes CO2-e
Ai = area of stratum i, ha
Bnon-tree,i = average biomass stock of non-tree vegetation on land to be planted before the start of a proposed ARR VCS project activity for stratum I, tonnes d.m.ha-1
CFnon-tree = the carbon fraction of dry biomass in non-tree vegetation, tonnes C (tonne d.m)-1
44/12 = fraction of molecular weights of CO2 and carbon, dimensionless
VCS Project Description – Campo Verde
69
i = 1,2,3 …mps strata in the project
t = 1,2,3,..t* years elapsed since the start of the ARR project activity
3.4.5 Monitoring leakage
The leakage represents the increase in GHG emissions by sources which occurs outside the boundary of an ARR VCS project activity which is measurable and attributable to the ARR VCS project activity. Methodology AR-AM0003 V04 covers two types of leakage in Eq 28 and Eq. 29 respectively:
fencingsplacementActivityDi LKLKLK +=
fuelwoodconversionsplacementActivityDi LKLKLK +=
However, there is no collection of firewood in the project area in the baseline. Therefore this can be set to zero:
LK fuel-wood = 0 Where:
LKActivityDisplacement = Leakage due to activity displacement; tonnes CO2-e
LKconversion = Leakage due to conversion of land to cropland and grassland (LKconv-crop +
LKconv-graz); tonnes CO2-e
LK fuel-wood = Leakage due to the displacement of fuel-wood collection; tonnes CO2-e
LKfencing = leakage due to increased use of wood posts for fencing up to year t*; tonnes CO2-e
Leakage through activity shifting and fence creation will be monitored as determined in the methodology. Full details of the monitoring plan including monitoring for leakage are given in Section 10: Monitoring Plan.
4 GHG Emission Reductions:
4.1 Explanation of methodological choice:
The project area contains degraded lands that are currently being grazed at a low level. No other pre-project activities are taking place in the project area. Project activities will lead to the displacement of grazing animals outside the project area. For the reasons explained, this project is fully applicable to methodology AR-AM0003.
4.2 Quantifying GHG emissions and/or removals for the baseline scenario:
Based on the database of the baseline report,86
it was found an average of 0.74 tons of CO2e per hectare
87 from shrubs. According to AR-AM0003, it is assumed that non-tree carbon stocks will not
increase over the life of the project. Frequent annual fires from neighbours’ plots commonly burn the project area. Additionally, some remaining trees were found in the area adding an initial CO2e stock of 3.87 tons per ha. Conservatively, we will assume that it will grow at a highly decreasing rate similar
86 AIDER, 2008. Determinacion de la Linea Base de Carbono en el Fundo Campo Verde; SFM, 2009. Baseline Biomass Measurements 87 The average tons of CO2 per hectare from shrubs is obtained by multiplying the CO2 content in the AGB of
shrubs (0.19) by the root-shoot ratio (3.8) following IPCC guidelines (http://www.ipcc-nggip.iges.or.jp/public/2006gl/pdf/4_Volume4/V4_06_Ch6_Grassland.pdf). The CO2 content in the AGB of shrubs is obtained by multiplying the carbon content (0.05) by 44/12.
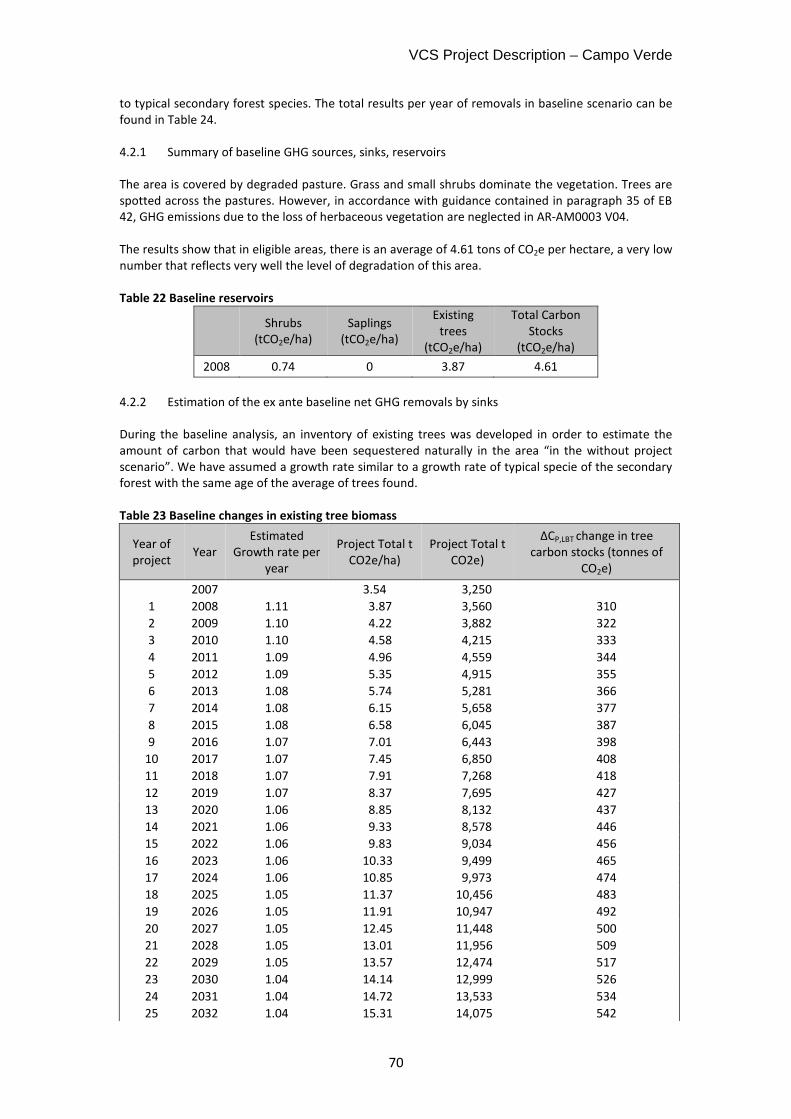
VCS Project Description – Campo Verde
70
to typical secondary forest species. The total results per year of removals in baseline scenario can be found in Table 24. 4.2.1 Summary of baseline GHG sources, sinks, reservoirs
The area is covered by degraded pasture. Grass and small shrubs dominate the vegetation. Trees are spotted across the pastures. However, in accordance with guidance contained in paragraph 35 of EB 42, GHG emissions due to the loss of herbaceous vegetation are neglected in AR-AM0003 V04. The results show that in eligible areas, there is an average of 4.61 tons of CO2e per hectare, a very low number that reflects very well the level of degradation of this area. Table 22 Baseline reservoirs
Shrubs
(tCO2e/ha) Saplings
(tCO2e/ha)
Existing trees
(tCO2e/ha)
Total Carbon Stocks
(tCO2e/ha)
2008 0.74 0 3.87 4.61
4.2.2 Estimation of the ex ante baseline net GHG removals by sinks
During the baseline analysis, an inventory of existing trees was developed in order to estimate the amount of carbon that would have been sequestered naturally in the area “in the without project scenario”. We have assumed a growth rate similar to a growth rate of typical specie of the secondary forest with the same age of the average of trees found. Table 23 Baseline changes in existing tree biomass
Year of project
Year Estimated
Growth rate per year
Project Total t CO2e/ha)
Project Total t CO2e)
∆CP,LBT change in tree carbon stocks (tonnes of
CO2e)
2007 3.54 3,250
1 2008 1.11 3.87 3,560 310
2 2009 1.10 4.22 3,882 322
3 2010 1.10 4.58 4,215 333
4 2011 1.09 4.96 4,559 344
5 2012 1.09 5.35 4,915 355
6 2013 1.08 5.74 5,281 366
7 2014 1.08 6.15 5,658 377
8 2015 1.08 6.58 6,045 387
9 2016 1.07 7.01 6,443 398
10 2017 1.07 7.45 6,850 408
11 2018 1.07 7.91 7,268 418
12 2019 1.07 8.37 7,695 427
13 2020 1.06 8.85 8,132 437
14 2021 1.06 9.33 8,578 446
15 2022 1.06 9.83 9,034 456
16 2023 1.06 10.33 9,499 465
17 2024 1.06 10.85 9,973 474
18 2025 1.05 11.37 10,456 483
19 2026 1.05 11.91 10,947 492
20 2027 1.05 12.45 11,448 500
21 2028 1.05 13.01 11,956 509
22 2029 1.05 13.57 12,474 517
23 2030 1.04 14.14 12,999 526
24 2031 1.04 14.72 13,533 534
25 2032 1.04 15.31 14,075 542
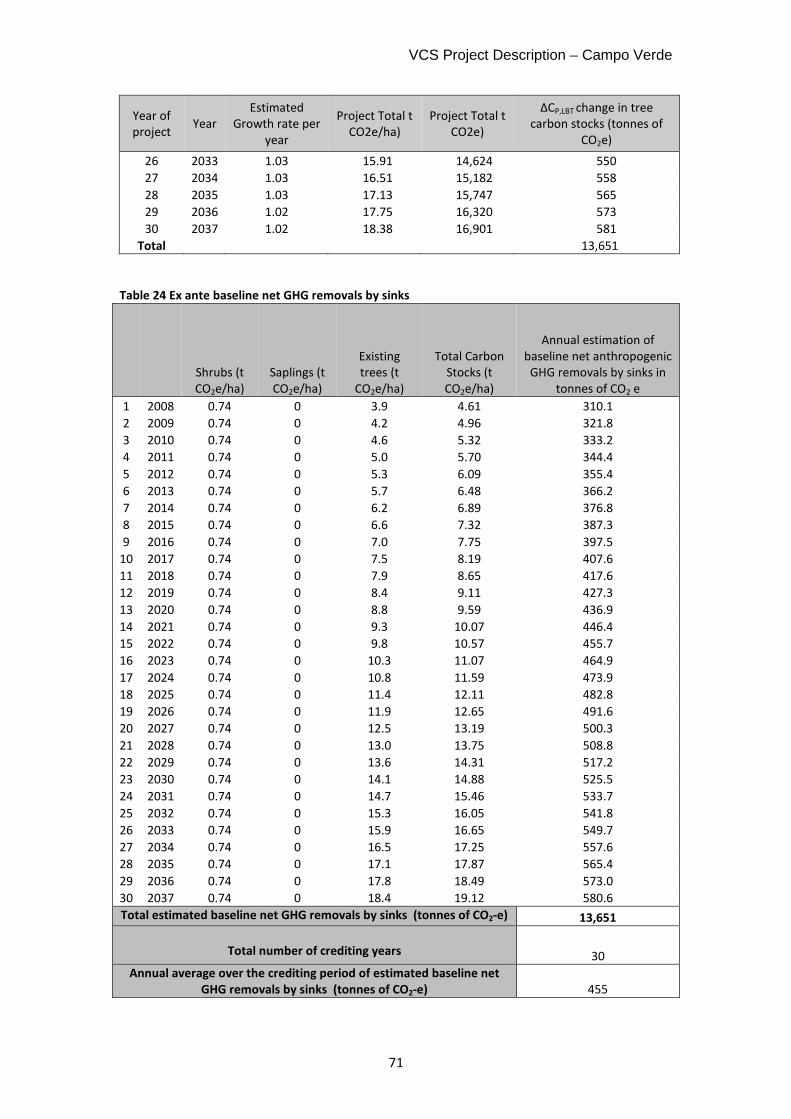
VCS Project Description – Campo Verde
71
Year of project
Year Estimated
Growth rate per year
Project Total t CO2e/ha)
Project Total t CO2e)
∆CP,LBT change in tree carbon stocks (tonnes of
CO2e)
26 2033 1.03 15.91 14,624 550
27 2034 1.03 16.51 15,182 558
28 2035 1.03 17.13 15,747 565
29 2036 1.02 17.75 16,320 573
30 2037 1.02 18.38 16,901 581
Total 13,651
Table 24 Ex ante baseline net GHG removals by sinks
Shrubs (t CO2e/ha)
Saplings (t CO2e/ha)
Existing trees (t
CO2e/ha)
Total Carbon Stocks (t CO2e/ha)
Annual estimation of baseline net anthropogenic GHG removals by sinks in
tonnes of CO2 e
1 2008 0.74 0 3.9 4.61 310.1
2 2009 0.74 0 4.2 4.96 321.8
3 2010 0.74 0 4.6 5.32 333.2
4 2011 0.74 0 5.0 5.70 344.4
5 2012 0.74 0 5.3 6.09 355.4
6 2013 0.74 0 5.7 6.48 366.2
7 2014 0.74 0 6.2 6.89 376.8
8 2015 0.74 0 6.6 7.32 387.3
9 2016 0.74 0 7.0 7.75 397.5
10 2017 0.74 0 7.5 8.19 407.6
11 2018 0.74 0 7.9 8.65 417.6
12 2019 0.74 0 8.4 9.11 427.3
13 2020 0.74 0 8.8 9.59 436.9
14 2021 0.74 0 9.3 10.07 446.4
15 2022 0.74 0 9.8 10.57 455.7
16 2023 0.74 0 10.3 11.07 464.9
17 2024 0.74 0 10.8 11.59 473.9
18 2025 0.74 0 11.4 12.11 482.8
19 2026 0.74 0 11.9 12.65 491.6
20 2027 0.74 0 12.5 13.19 500.3
21 2028 0.74 0 13.0 13.75 508.8
22 2029 0.74 0 13.6 14.31 517.2
23 2030 0.74 0 14.1 14.88 525.5
24 2031 0.74 0 14.7 15.46 533.7
25 2032 0.74 0 15.3 16.05 541.8
26 2033 0.74 0 15.9 16.65 549.7
27 2034 0.74 0 16.5 17.25 557.6
28 2035 0.74 0 17.1 17.87 565.4
29 2036 0.74 0 17.8 18.49 573.0
30 2037 0.74 0 18.4 19.12 580.6
Total estimated baseline net GHG removals by sinks (tonnes of CO2-e) 13,651
Total number of crediting years 30
Annual average over the crediting period of estimated baseline net
GHG removals by sinks (tonnes of CO2-e) 455
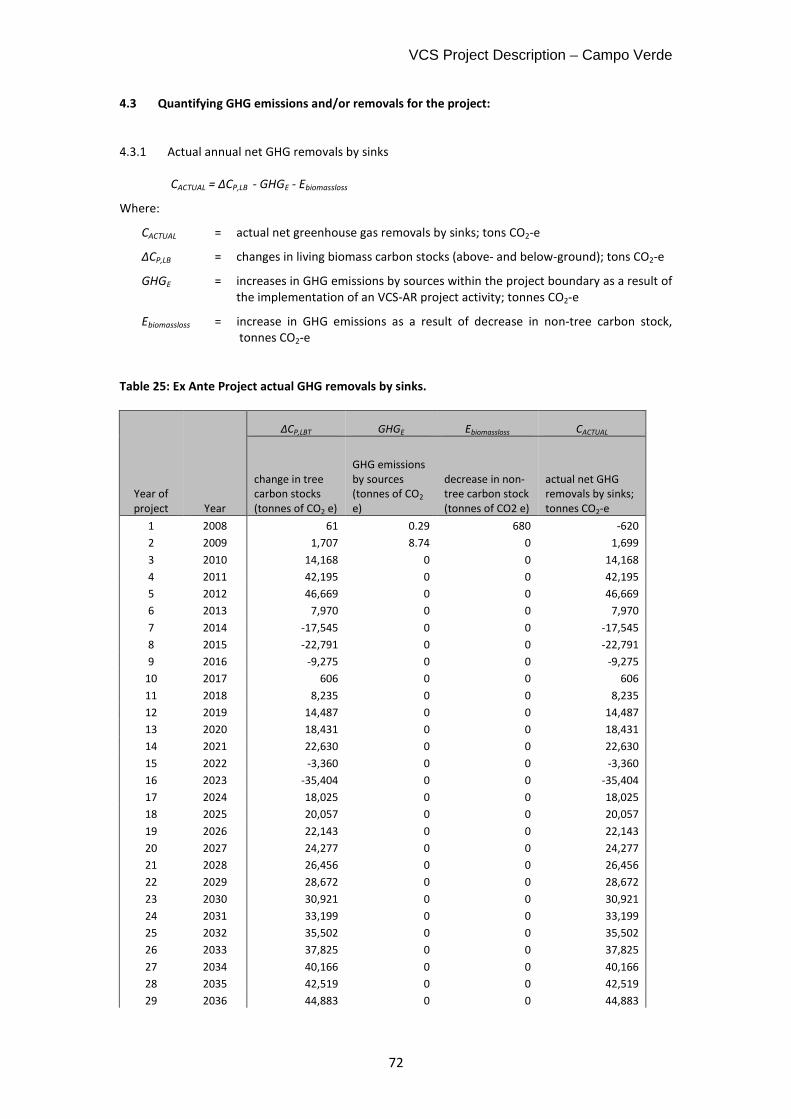
VCS Project Description – Campo Verde
72
4.3 Quantifying GHG emissions and/or removals for the project:
4.3.1 Actual annual net GHG removals by sinks
CACTUAL = ΔCP,LB - GHGE - Ebiomassloss
Where:
CACTUAL = actual net greenhouse gas removals by sinks; tons CO2-e
ΔCP,LB = changes in living biomass carbon stocks (above- and below-ground); tons CO2-e
GHGE = increases in GHG emissions by sources within the project boundary as a result of the implementation of an VCS-AR project activity; tonnes CO2-e
Ebiomassloss = increase in GHG emissions as a result of decrease in non-tree carbon stock, tonnes CO2-e
Table 25: Ex Ante Project actual GHG removals by sinks.
Year of project Year
ΔCP,LBT GHGE Ebiomassloss CACTUAL
change in tree carbon stocks (tonnes of CO2 e)
GHG emissions by sources (tonnes of CO2 e)
decrease in non-tree carbon stock (tonnes of CO2 e)
actual net GHG removals by sinks; tonnes CO2-e
1 2008 61 0.29 680 -620
2 2009 1,707 8.74 0 1,699
3 2010 14,168 0 0 14,168
4 2011 42,195 0 0 42,195
5 2012 46,669 0 0 46,669
6 2013 7,970 0 0 7,970
7 2014 -17,545 0 0 -17,545
8 2015 -22,791 0 0 -22,791
9 2016 -9,275 0 0 -9,275
10 2017 606 0 0 606
11 2018 8,235 0 0 8,235
12 2019 14,487 0 0 14,487
13 2020 18,431 0 0 18,431
14 2021 22,630 0 0 22,630
15 2022 -3,360 0 0 -3,360
16 2023 -35,404 0 0 -35,404
17 2024 18,025 0 0 18,025
18 2025 20,057 0 0 20,057
19 2026 22,143 0 0 22,143
20 2027 24,277 0 0 24,277
21 2028 26,456 0 0 26,456
22 2029 28,672 0 0 28,672
23 2030 30,921 0 0 30,921
24 2031 33,199 0 0 33,199
25 2032 35,502 0 0 35,502
26 2033 37,825 0 0 37,825
27 2034 40,166 0 0 40,166
28 2035 42,519 0 0 42,519
29 2036 44,883 0 0 44,883
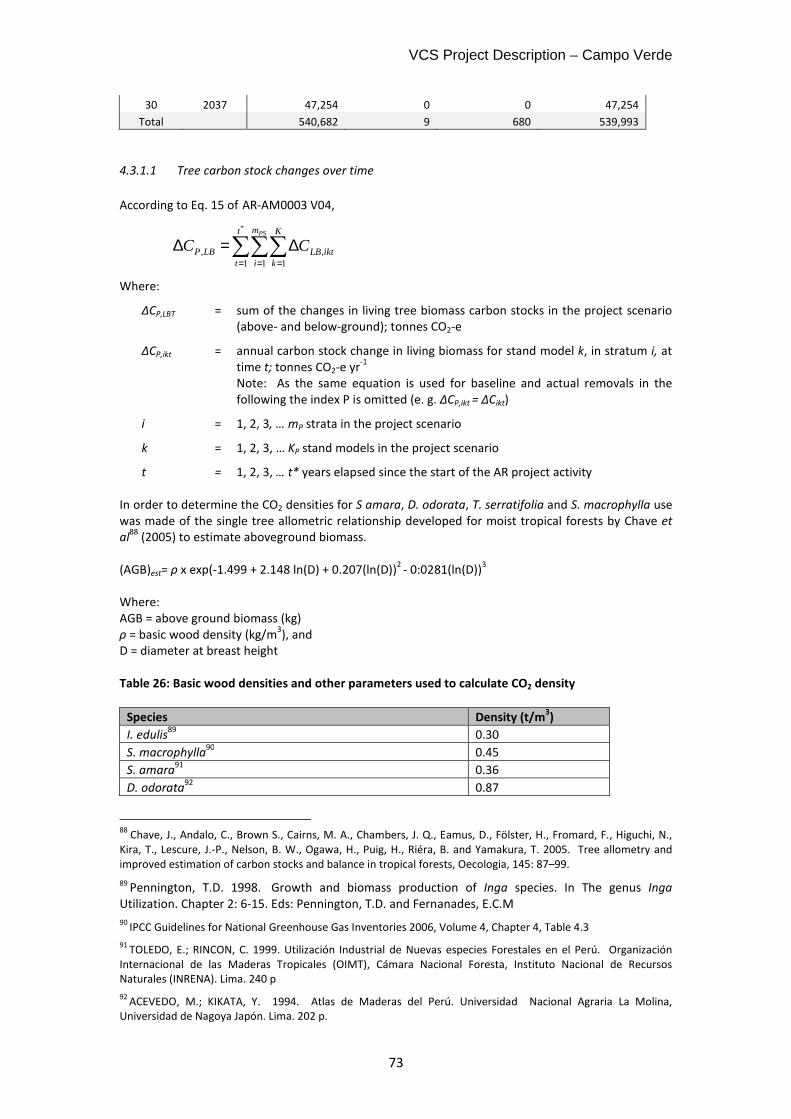
VCS Project Description – Campo Verde
73
30 2037 47,254 0 0 47,254
Total 540,682 9 680 539,993
4.3.1.1 Tree carbon stock changes over time
According to Eq. 15 of AR-AM0003 V04,
∑∑∑= = =
∆=∆*
1 1 1,,
t
t
m
i
K
kiktLBLBP
PS
CC
Where:
ΔCP,LBT = sum of the changes in living tree biomass carbon stocks in the project scenario (above- and below-ground); tonnes CO2-e
ΔCP,ikt = annual carbon stock change in living biomass for stand model k, in stratum i, at time t; tonnes CO2-e yr
-1
Note: As the same equation is used for baseline and actual removals in the following the index P is omitted (e. g. ΔCP,ikt = ΔCikt)
i = 1, 2, 3, … mP strata in the project scenario
k = 1, 2, 3, … KP stand models in the project scenario
t = 1, 2, 3, … t* years elapsed since the start of the AR project activity In order to determine the CO2 densities for S amara, D. odorata, T. serratifolia and S. macrophylla use was made of the single tree allometric relationship developed for moist tropical forests by Chave et
al88
(2005) to estimate aboveground biomass. (AGB)est= ρ x exp(-1.499 + 2.148 ln(D) + 0.207(ln(D))
2 - 0:0281(ln(D))
3
Where: AGB = above ground biomass (kg) ρ = basic wood density (kg/m
3), and
D = diameter at breast height Table 26: Basic wood densities and other parameters used to calculate CO2 density
Species Density (t/m3)
I. edulis89
0.30
S. macrophylla90
0.45
S. amara91
0.36
D. odorata92
0.87
88
Chave, J., Andalo, C., Brown S., Cairns, M. A., Chambers, J. Q., Eamus, D., Fölster, H., Fromard, F., Higuchi, N., Kira, T., Lescure, J.-P., Nelson, B. W., Ogawa, H., Puig, H., Riéra, B. and Yamakura, T. 2005. Tree allometry and improved estimation of carbon stocks and balance in tropical forests, Oecologia, 145: 87–99. 89 Pennington, T.D. 1998. Growth and biomass production of Inga species. In The genus Inga Utilization. Chapter 2: 6-15. Eds: Pennington, T.D. and Fernanades, E.C.M
90 IPCC Guidelines for National Greenhouse Gas Inventories 2006, Volume 4, Chapter 4, Table 4.3
91 TOLEDO, E.; RINCON, C. 1999. Utilización Industrial de Nuevas especies Forestales en el Perú. Organización
Internacional de las Maderas Tropicales (OIMT), Cámara Nacional Foresta, Instituto Nacional de Recursos Naturales (INRENA). Lima. 240 p
92 ACEVEDO, M.; KIKATA, Y. 1994. Atlas de Maderas del Perú. Universidad Nacional Agraria La Molina,
Universidad de Nagoya Japón. Lima. 202 p.
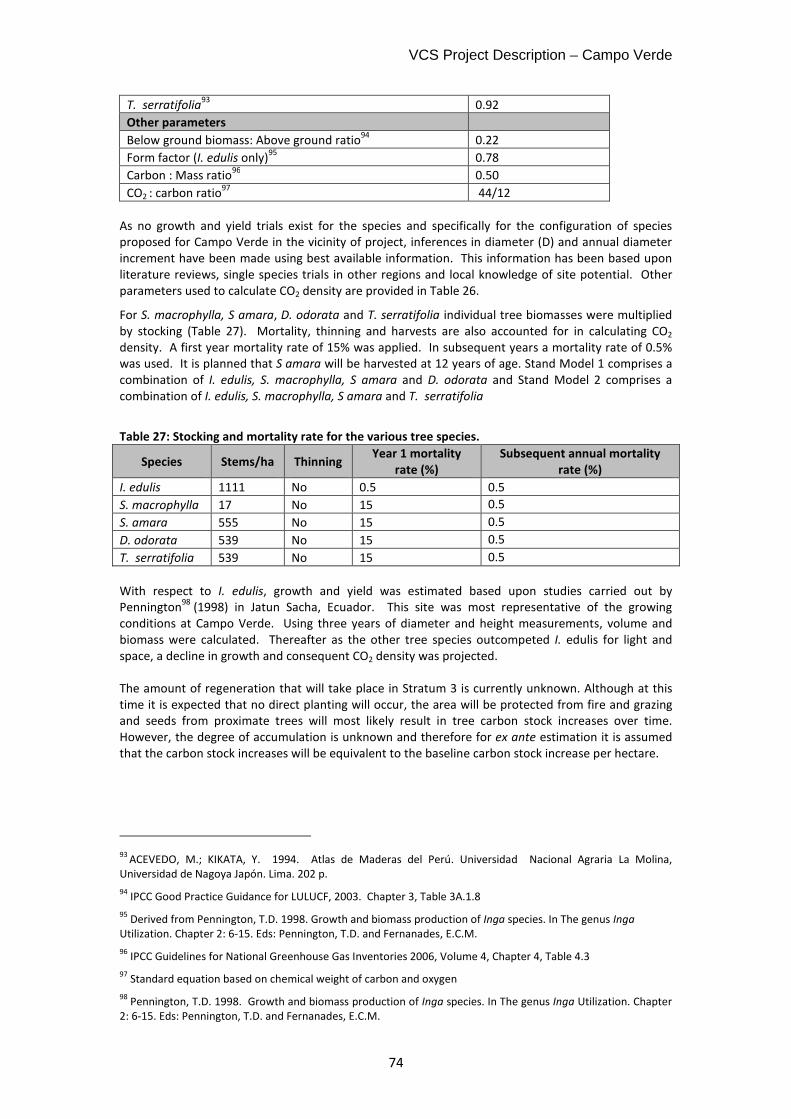
VCS Project Description – Campo Verde
74
T. serratifolia93
0.92
Other parameters
Below ground biomass: Above ground ratio94
0.22
Form factor (I. edulis only)95
0.78
Carbon : Mass ratio96
0.50
CO2 : carbon ratio97
44/12
As no growth and yield trials exist for the species and specifically for the configuration of species proposed for Campo Verde in the vicinity of project, inferences in diameter (D) and annual diameter increment have been made using best available information. This information has been based upon literature reviews, single species trials in other regions and local knowledge of site potential. Other parameters used to calculate CO2 density are provided in Table 26.
For S. macrophylla, S amara, D. odorata and T. serratifolia individual tree biomasses were multiplied by stocking (Table 27). Mortality, thinning and harvests are also accounted for in calculating CO2 density. A first year mortality rate of 15% was applied. In subsequent years a mortality rate of 0.5% was used. It is planned that S amara will be harvested at 12 years of age. Stand Model 1 comprises a combination of I. edulis, S. macrophylla, S amara and D. odorata and Stand Model 2 comprises a combination of I. edulis, S. macrophylla, S amara and T. serratifolia
Table 27: Stocking and mortality rate for the various tree species.
Species Stems/ha Thinning Year 1 mortality
rate (%)
Subsequent annual mortality
rate (%)
I. edulis 1111 No 0.5 0.5
S. macrophylla 17 No 15 0.5
S. amara 555 No 15 0.5
D. odorata 539 No 15 0.5
T. serratifolia 539 No 15 0.5
With respect to I. edulis, growth and yield was estimated based upon studies carried out by Pennington
98 (1998) in Jatun Sacha, Ecuador. This site was most representative of the growing
conditions at Campo Verde. Using three years of diameter and height measurements, volume and biomass were calculated. Thereafter as the other tree species outcompeted I. edulis for light and space, a decline in growth and consequent CO2 density was projected. The amount of regeneration that will take place in Stratum 3 is currently unknown. Although at this time it is expected that no direct planting will occur, the area will be protected from fire and grazing and seeds from proximate trees will most likely result in tree carbon stock increases over time. However, the degree of accumulation is unknown and therefore for ex ante estimation it is assumed that the carbon stock increases will be equivalent to the baseline carbon stock increase per hectare.
93
ACEVEDO, M.; KIKATA, Y. 1994. Atlas de Maderas del Perú. Universidad Nacional Agraria La Molina, Universidad de Nagoya Japón. Lima. 202 p.
94 IPCC Good Practice Guidance for LULUCF, 2003. Chapter 3, Table 3A.1.8
95 Derived from Pennington, T.D. 1998. Growth and biomass production of Inga species. In The genus Inga
Utilization. Chapter 2: 6-15. Eds: Pennington, T.D. and Fernanades, E.C.M.
96 IPCC Guidelines for National Greenhouse Gas Inventories 2006, Volume 4, Chapter 4, Table 4.3
97 Standard equation based on chemical weight of carbon and oxygen
98 Pennington, T.D. 1998. Growth and biomass production of Inga species. In The genus Inga Utilization. Chapter
2: 6-15. Eds: Pennington, T.D. and Fernanades, E.C.M.
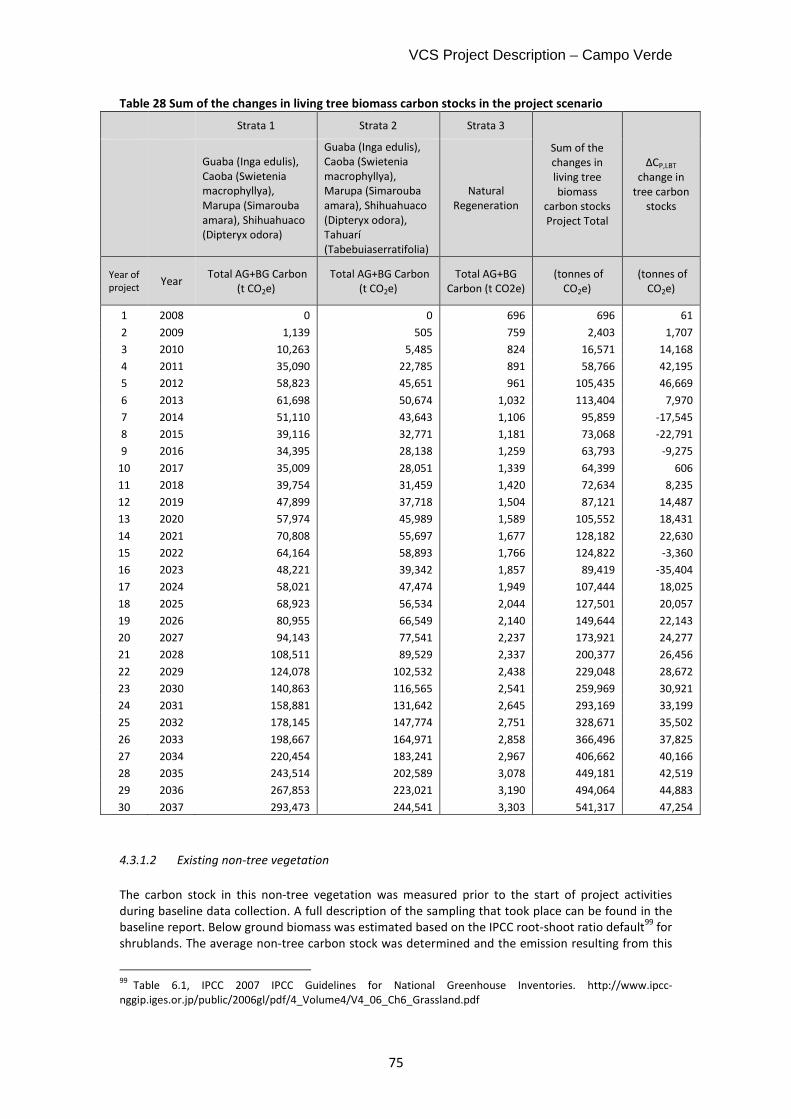
VCS Project Description – Campo Verde
75
Table 28 Sum of the changes in living tree biomass carbon stocks in the project scenario
Strata 1 Strata 2 Strata 3
Sum of the changes in living tree biomass
carbon stocks Project Total
ΔCP,LBT
change in tree carbon
stocks
Guaba (Inga edulis), Caoba (Swietenia macrophyllya), Marupa (Simarouba amara), Shihuahuaco (Dipteryx odora)
Guaba (Inga edulis), Caoba (Swietenia macrophyllya), Marupa (Simarouba amara), Shihuahuaco (Dipteryx odora), Tahuarí (Tabebuiaserratifolia)
Natural Regeneration
Year of project
Year Total AG+BG Carbon
(t CO2e) Total AG+BG Carbon
(t CO2e) Total AG+BG
Carbon (t CO2e) (tonnes of
CO2e) (tonnes of
CO2e)
1 2008 0 0 696 696 61
2 2009 1,139 505 759 2,403 1,707
3 2010 10,263 5,485 824 16,571 14,168
4 2011 35,090 22,785 891 58,766 42,195
5 2012 58,823 45,651 961 105,435 46,669
6 2013 61,698 50,674 1,032 113,404 7,970
7 2014 51,110 43,643 1,106 95,859 -17,545
8 2015 39,116 32,771 1,181 73,068 -22,791
9 2016 34,395 28,138 1,259 63,793 -9,275
10 2017 35,009 28,051 1,339 64,399 606
11 2018 39,754 31,459 1,420 72,634 8,235
12 2019 47,899 37,718 1,504 87,121 14,487
13 2020 57,974 45,989 1,589 105,552 18,431
14 2021 70,808 55,697 1,677 128,182 22,630
15 2022 64,164 58,893 1,766 124,822 -3,360
16 2023 48,221 39,342 1,857 89,419 -35,404
17 2024 58,021 47,474 1,949 107,444 18,025
18 2025 68,923 56,534 2,044 127,501 20,057
19 2026 80,955 66,549 2,140 149,644 22,143
20 2027 94,143 77,541 2,237 173,921 24,277
21 2028 108,511 89,529 2,337 200,377 26,456
22 2029 124,078 102,532 2,438 229,048 28,672
23 2030 140,863 116,565 2,541 259,969 30,921
24 2031 158,881 131,642 2,645 293,169 33,199
25 2032 178,145 147,774 2,751 328,671 35,502
26 2033 198,667 164,971 2,858 366,496 37,825
27 2034 220,454 183,241 2,967 406,662 40,166
28 2035 243,514 202,589 3,078 449,181 42,519
29 2036 267,853 223,021 3,190 494,064 44,883
30 2037 293,473 244,541 3,303 541,317 47,254
4.3.1.2 Existing non-tree vegetation
The carbon stock in this non-tree vegetation was measured prior to the start of project activities during baseline data collection. A full description of the sampling that took place can be found in the baseline report. Below ground biomass was estimated based on the IPCC root-shoot ratio default
99 for
shrublands. The average non-tree carbon stock was determined and the emission resulting from this
99
Table 6.1, IPCC 2007 IPCC Guidelines for National Greenhouse Inventories. http://www.ipcc-nggip.iges.or.jp/public/2006gl/pdf/4_Volume4/V4_06_Ch6_Grassland.pdf
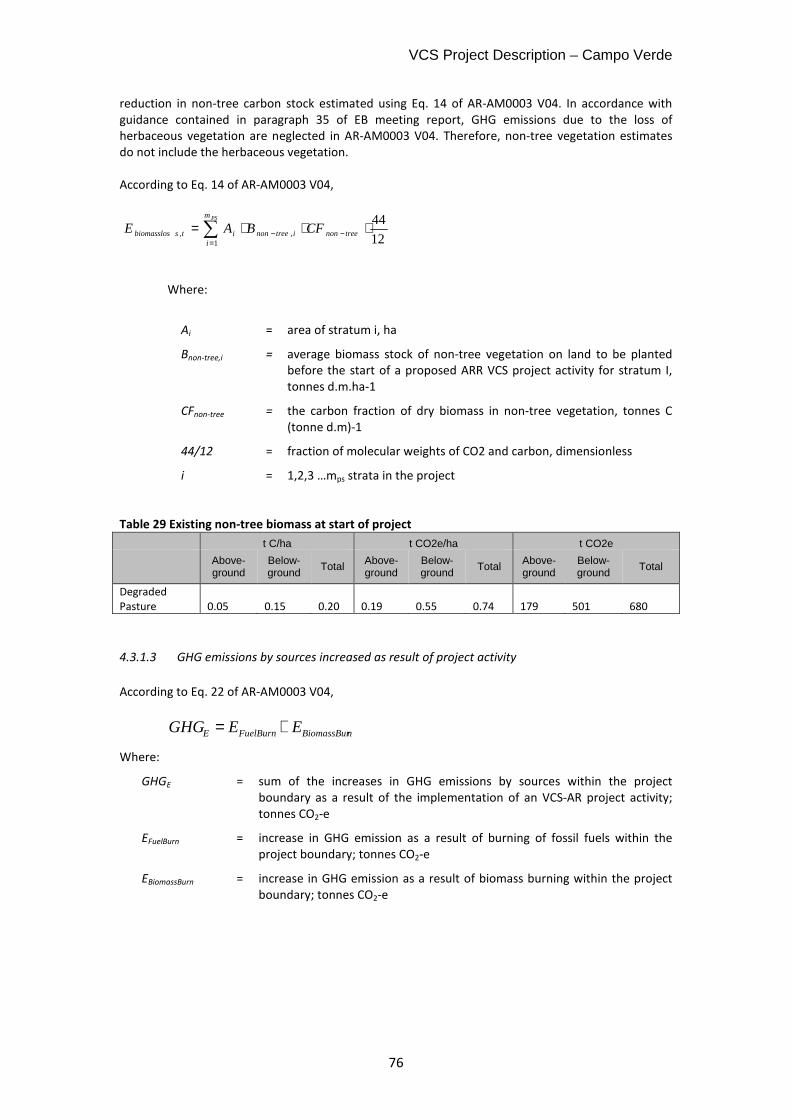
VCS Project Description – Campo Verde
76
reduction in non-tree carbon stock estimated using Eq. 14 of AR-AM0003 V04. In accordance with guidance contained in paragraph 35 of EB meeting report, GHG emissions due to the loss of herbaceous vegetation are neglected in AR-AM0003 V04. Therefore, non-tree vegetation estimates do not include the herbaceous vegetation. According to Eq. 14 of AR-AM0003 V04,
Where:
Ai = area of stratum i, ha
Bnon-tree,i = average biomass stock of non-tree vegetation on land to be planted before the start of a proposed ARR VCS project activity for stratum I, tonnes d.m.ha-1
CFnon-tree = the carbon fraction of dry biomass in non-tree vegetation, tonnes C (tonne d.m)-1
44/12 = fraction of molecular weights of CO2 and carbon, dimensionless
i = 1,2,3 …mps strata in the project Table 29 Existing non-tree biomass at start of project
t C/ha t CO2e/ha t CO2e
Above-ground
Below-ground
Total Above-ground
Below-ground
Total Above-ground
Below-ground
Total
Degraded Pasture 0.05 0.15 0.20 0.19 0.55 0.74 179 501 680
4.3.1.3 GHG emissions by sources increased as result of project activity
According to Eq. 22 of AR-AM0003 V04,
nBiomassBurFuelBurnE EEGHG +=
Where:
GHGE = sum of the increases in GHG emissions by sources within the project boundary as a result of the implementation of an VCS-AR project activity; tonnes CO2-e
EFuelBurn = increase in GHG emission as a result of burning of fossil fuels within the project boundary; tonnes CO2-e
EBiomassBurn = increase in GHG emission as a result of biomass burning within the project boundary; tonnes CO2-e
∑=
−− ⋅⋅⋅=PSm
itreenonitreenonitsbiomasslos CFBAE
1,, 12
44
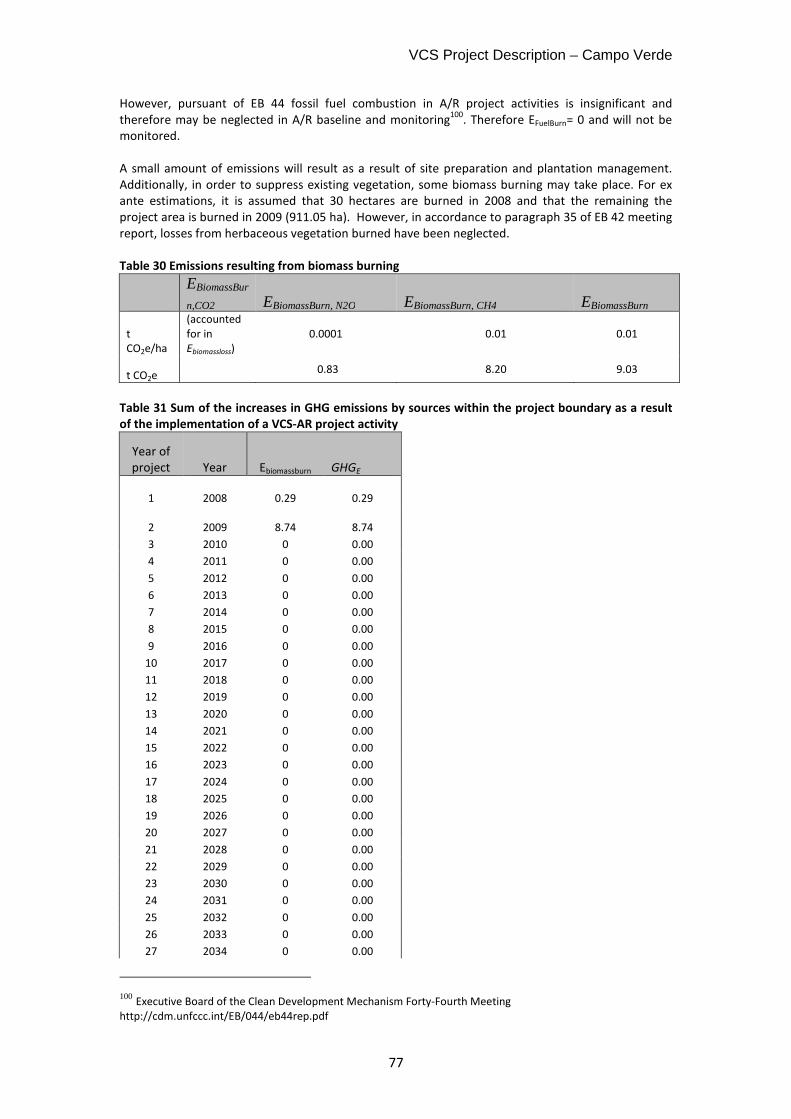
VCS Project Description – Campo Verde
77
However, pursuant of EB 44 fossil fuel combustion in A/R project activities is insignificant and therefore may be neglected in A/R baseline and monitoring
100. Therefore EFuelBurn= 0 and will not be
monitored. A small amount of emissions will result as a result of site preparation and plantation management. Additionally, in order to suppress existing vegetation, some biomass burning may take place. For ex ante estimations, it is assumed that 30 hectares are burned in 2008 and that the remaining the project area is burned in 2009 (911.05 ha). However, in accordance to paragraph 35 of EB 42 meeting report, losses from herbaceous vegetation burned have been neglected. Table 30 Emissions resulting from biomass burning
EBiomassBur
n,CO2 EBiomassBurn, N2O EBiomassBurn, CH4 EBiomassBurn
t CO2e/ha
(accounted for in Ebiomassloss)
0.0001 0.01 0.01
t CO2e 0.83 8.20 9.03
Table 31 Sum of the increases in GHG emissions by sources within the project boundary as a result
of the implementation of a VCS-AR project activity
Year of project Year Ebiomassburn GHGE
1 2008
0.29
0.29
2 2009
8.74
8.74
3 2010 0 0.00
4 2011 0 0.00
5 2012 0 0.00
6 2013 0 0.00
7 2014 0 0.00
8 2015 0 0.00
9 2016 0 0.00
10 2017 0 0.00
11 2018 0 0.00
12 2019 0 0.00
13 2020 0 0.00
14 2021 0 0.00
15 2022 0 0.00
16 2023 0 0.00
17 2024 0 0.00
18 2025 0 0.00
19 2026 0 0.00
20 2027 0 0.00
21 2028 0 0.00
22 2029 0 0.00
23 2030 0 0.00
24 2031 0 0.00
25 2032 0 0.00
26 2033 0 0.00
27 2034 0 0.00
100 Executive Board of the Clean Development Mechanism Forty-Fourth Meeting http://cdm.unfccc.int/EB/044/eb44rep.pdf
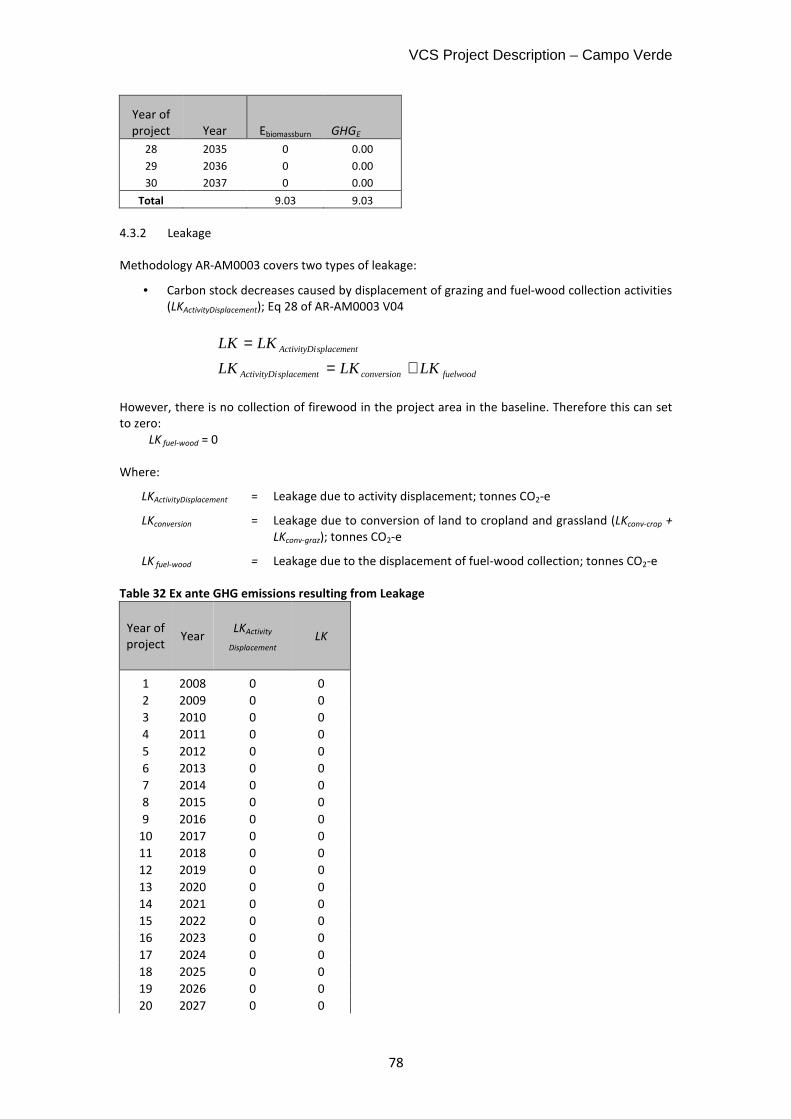
VCS Project Description – Campo Verde
78
Year of project Year Ebiomassburn GHGE
28 2035 0 0.00
29 2036 0 0.00
30 2037 0 0.00
Total 9.03 9.03
4.3.2 Leakage
Methodology AR-AM0003 covers two types of leakage:
• Carbon stock decreases caused by displacement of grazing and fuel-wood collection activities
(LKActivityDisplacement); Eq 28 of AR-AM0003 V04
splacementActivityDiLKLK =
fuelwoodconversionsplacementActivityDi LKLKLK += However, there is no collection of firewood in the project area in the baseline. Therefore this can set to zero:
LK fuel-wood = 0 Where:
LKActivityDisplacement = Leakage due to activity displacement; tonnes CO2-e
LKconversion = Leakage due to conversion of land to cropland and grassland (LKconv-crop +
LKconv-graz); tonnes CO2-e
LK fuel-wood = Leakage due to the displacement of fuel-wood collection; tonnes CO2-e Table 32 Ex ante GHG emissions resulting from Leakage
Year of project
Year LKActivity
Displacement LK
1 2008 0 0
2 2009 0 0
3 2010 0 0
4 2011 0 0
5 2012 0 0
6 2013 0 0
7 2014 0 0
8 2015 0 0
9 2016 0 0
10 2017 0 0
11 2018 0 0
12 2019 0 0
13 2020 0 0
14 2021 0 0
15 2022 0 0
16 2023 0 0
17 2024 0 0
18 2025 0 0
19 2026 0 0
20 2027 0 0
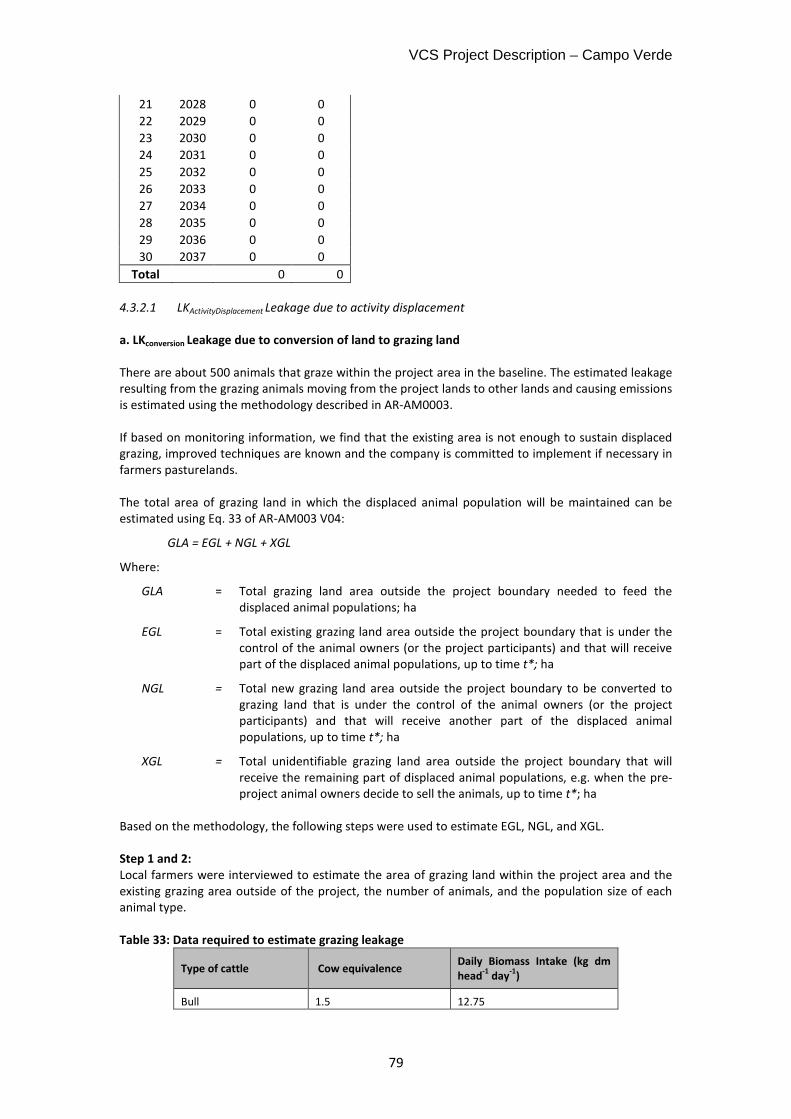
VCS Project Description – Campo Verde
79
21 2028 0 0
22 2029 0 0
23 2030 0 0
24 2031 0 0
25 2032 0 0
26 2033 0 0
27 2034 0 0
28 2035 0 0
29 2036 0 0
30 2037 0 0
Total 0 0
4.3.2.1 LKActivityDisplacement Leakage due to activity displacement
a. LKconversion Leakage due to conversion of land to grazing land
There are about 500 animals that graze within the project area in the baseline. The estimated leakage resulting from the grazing animals moving from the project lands to other lands and causing emissions is estimated using the methodology described in AR-AM0003. If based on monitoring information, we find that the existing area is not enough to sustain displaced grazing, improved techniques are known and the company is committed to implement if necessary in farmers pasturelands. The total area of grazing land in which the displaced animal population will be maintained can be estimated using Eq. 33 of AR-AM003 V04:
GLA = EGL + NGL + XGL
Where:
GLA = Total grazing land area outside the project boundary needed to feed the displaced animal populations; ha
EGL = Total existing grazing land area outside the project boundary that is under the control of the animal owners (or the project participants) and that will receive part of the displaced animal populations, up to time t*; ha
NGL = Total new grazing land area outside the project boundary to be converted to grazing land that is under the control of the animal owners (or the project participants) and that will receive another part of the displaced animal populations, up to time t*; ha
XGL = Total unidentifiable grazing land area outside the project boundary that will receive the remaining part of displaced animal populations, e.g. when the pre-project animal owners decide to sell the animals, up to time t*; ha
Based on the methodology, the following steps were used to estimate EGL, NGL, and XGL. Step 1 and 2:
Local farmers were interviewed to estimate the area of grazing land within the project area and the existing grazing area outside of the project, the number of animals, and the population size of each animal type. Table 33: Data required to estimate grazing leakage
Type of cattle Cow equivalence Daily Biomass Intake (kg dm
head-1
day-1
)
Bull 1.5 12.75
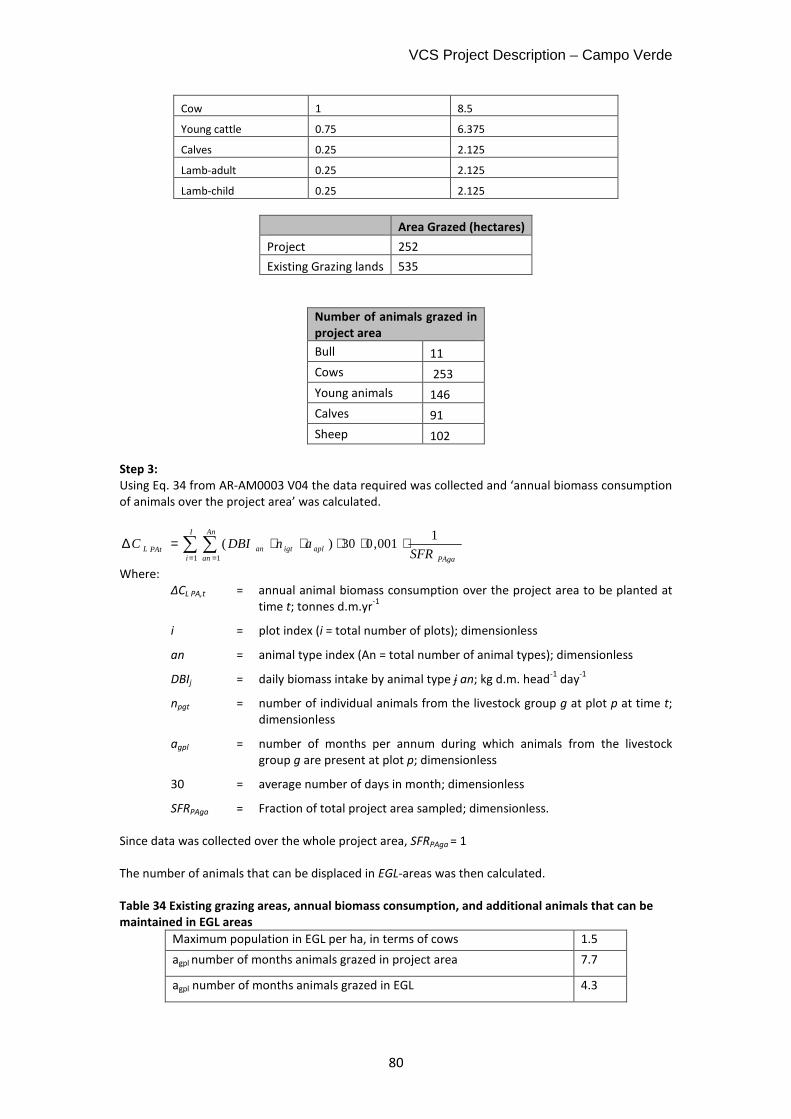
VCS Project Description – Campo Verde
80
Cow 1 8.5
Young cattle 0.75 6.375
Calves 0.25 2.125
Lamb-adult 0.25 2.125
Lamb-child 0.25 2.125
Area Grazed (hectares)
Project 252
Existing Grazing lands 535
Number of animals grazed in
project area
Bull 11
Cows 253
Young animals 146
Calves 91
Sheep 102
Step 3:
Using Eq. 34 from AR-AM0003 V04 the data required was collected and ‘annual biomass consumption of animals over the project area’ was calculated.
Where: ΔCL PA,t = annual animal biomass consumption over the project area to be planted at
time t; tonnes d.m.yr-1
i = plot index (i = total number of plots); dimensionless
an = animal type index (An = total number of animal types); dimensionless
DBIj = daily biomass intake by animal type j an; kg d.m. head-1
day-1
npgt = number of individual animals from the livestock group g at plot p at time t; dimensionless
agpl = number of months per annum during which animals from the livestock group g are present at plot p; dimensionless
30 = average number of days in month; dimensionless
SFRPAga = Fraction of total project area sampled; dimensionless. Since data was collected over the whole project area, SFRPAga = 1 The number of animals that can be displaced in EGL-areas was then calculated. Table 34 Existing grazing areas, annual biomass consumption, and additional animals that can be
maintained in EGL areas
Maximum population in EGL per ha, in terms of cows 1.5
agpl number of months animals grazed in project area 7.7
agpl number of months animals grazed in EGL 4.3
∑ ∑= =
⋅⋅⋅⋅⋅=∆I
i
An
an PAgaapligtanPAtL SFR
anDBIC1 1
1001,030)(
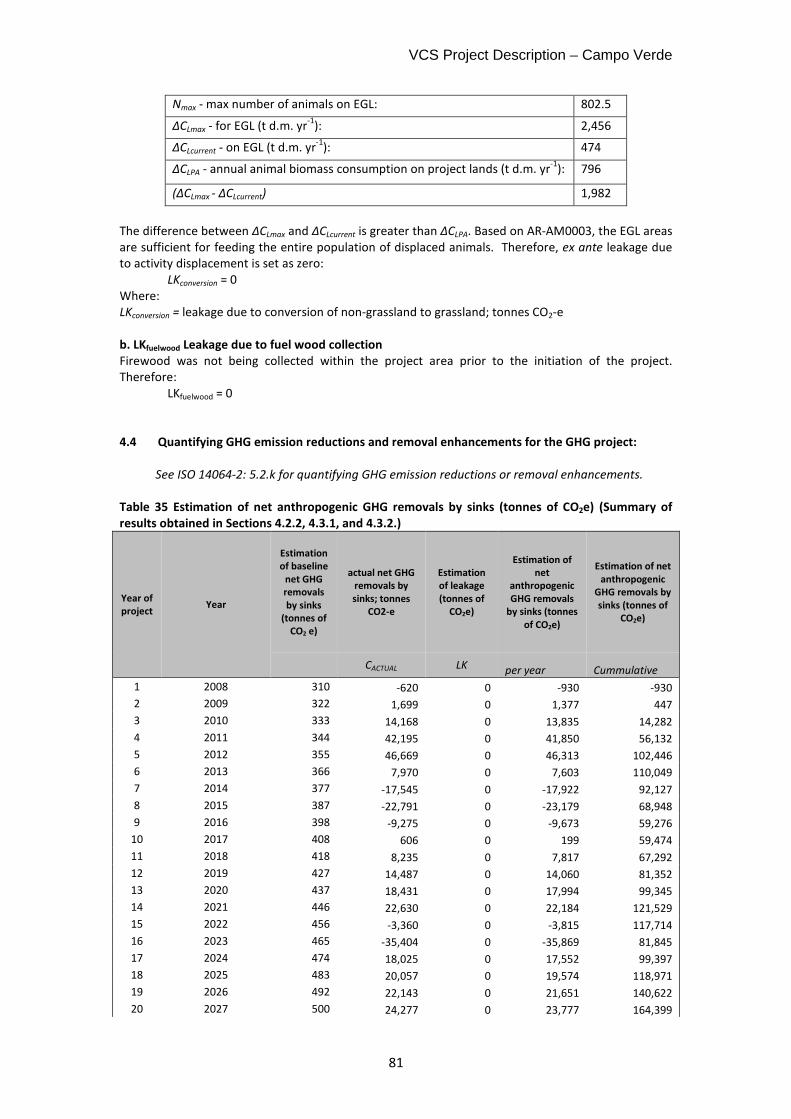
VCS Project Description – Campo Verde
81
Nmax - max number of animals on EGL: 802.5
∆CLmax - for EGL (t d.m. yr-1
): 2,456
∆CLcurrent - on EGL (t d.m. yr-1
): 474
∆CLPA - annual animal biomass consumption on project lands (t d.m. yr-1
): 796
(∆CLmax - ∆CLcurrent) 1,982
The difference between ∆CLmax and ∆CLcurrent is greater than ∆CLPA. Based on AR-AM0003, the EGL areas are sufficient for feeding the entire population of displaced animals. Therefore, ex ante leakage due to activity displacement is set as zero: LKconversion = 0 Where: LKconversion = leakage due to conversion of non-grassland to grassland; tonnes CO2-e b. LKfuelwood Leakage due to fuel wood collection
Firewood was not being collected within the project area prior to the initiation of the project. Therefore:
LKfuelwood = 0 4.4 Quantifying GHG emission reductions and removal enhancements for the GHG project:
See ISO 14064-2: 5.2.k for quantifying GHG emission reductions or removal enhancements.
Table 35 Estimation of net anthropogenic GHG removals by sinks (tonnes of CO2e) (Summary of
results obtained in Sections 4.2.2, 4.3.1, and 4.3.2.)
Year of
project Year
Estimation
of baseline
net GHG
removals
by sinks
(tonnes of
CO2 e)
actual net GHG
removals by
sinks; tonnes
CO2-e
Estimation
of leakage
(tonnes of
CO2e)
Estimation of
net
anthropogenic
GHG removals
by sinks (tonnes
of CO2e)
Estimation of net
anthropogenic
GHG removals by
sinks (tonnes of
CO2e)
CACTUAL LK per year Cummulative
1 2008 310 -620 0 -930 -930
2 2009 322 1,699 0 1,377 447
3 2010 333 14,168 0 13,835 14,282
4 2011 344 42,195 0 41,850 56,132
5 2012 355 46,669 0 46,313 102,446
6 2013 366 7,970 0 7,603 110,049
7 2014 377 -17,545 0 -17,922 92,127
8 2015 387 -22,791 0 -23,179 68,948
9 2016 398 -9,275 0 -9,673 59,276
10 2017 408 606 0 199 59,474
11 2018 418 8,235 0 7,817 67,292
12 2019 427 14,487 0 14,060 81,352
13 2020 437 18,431 0 17,994 99,345
14 2021 446 22,630 0 22,184 121,529
15 2022 456 -3,360 0 -3,815 117,714
16 2023 465 -35,404 0 -35,869 81,845
17 2024 474 18,025 0 17,552 99,397
18 2025 483 20,057 0 19,574 118,971
19 2026 492 22,143 0 21,651 140,622
20 2027 500 24,277 0 23,777 164,399
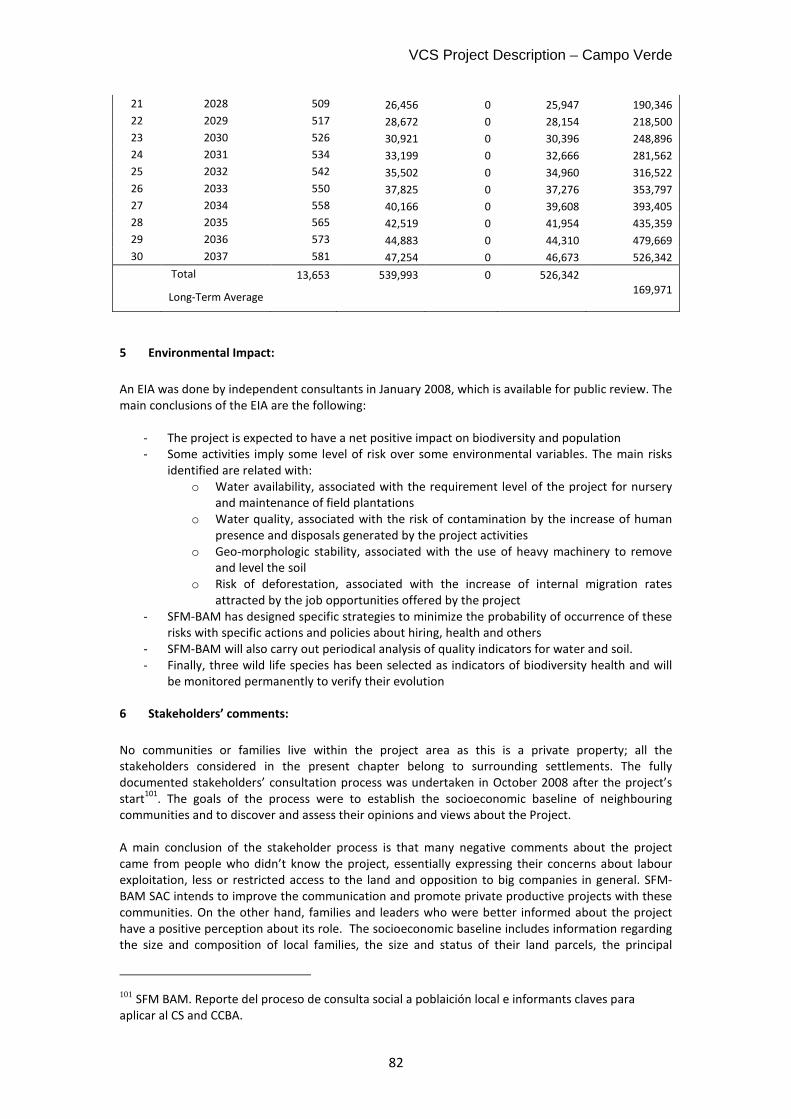
VCS Project Description – Campo Verde
82
21 2028 509 26,456 0 25,947 190,346
22 2029 517 28,672 0 28,154 218,500
23 2030 526 30,921 0 30,396 248,896
24 2031 534 33,199 0 32,666 281,562
25 2032 542 35,502 0 34,960 316,522
26 2033 550 37,825 0 37,276 353,797
27 2034 558 40,166 0 39,608 393,405
28 2035 565 42,519 0 41,954 435,359
29 2036 573 44,883 0 44,310 479,669
30 2037 581 47,254 0 46,673 526,342
Total 13,653 539,993 0 526,342
Long-Term Average
169,971
5 Environmental Impact:
An EIA was done by independent consultants in January 2008, which is available for public review. The main conclusions of the EIA are the following:
- The project is expected to have a net positive impact on biodiversity and population - Some activities imply some level of risk over some environmental variables. The main risks
identified are related with: o Water availability, associated with the requirement level of the project for nursery
and maintenance of field plantations o Water quality, associated with the risk of contamination by the increase of human
presence and disposals generated by the project activities o Geo-morphologic stability, associated with the use of heavy machinery to remove
and level the soil o Risk of deforestation, associated with the increase of internal migration rates
attracted by the job opportunities offered by the project - SFM-BAM has designed specific strategies to minimize the probability of occurrence of these
risks with specific actions and policies about hiring, health and others - SFM-BAM will also carry out periodical analysis of quality indicators for water and soil. - Finally, three wild life species has been selected as indicators of biodiversity health and will
be monitored permanently to verify their evolution
6 Stakeholders’ comments:
No communities or families live within the project area as this is a private property; all the stakeholders considered in the present chapter belong to surrounding settlements. The fully documented stakeholders’ consultation process was undertaken in October 2008 after the project’s start
101. The goals of the process were to establish the socioeconomic baseline of neighbouring
communities and to discover and assess their opinions and views about the Project. A main conclusion of the stakeholder process is that many negative comments about the project came from people who didn’t know the project, essentially expressing their concerns about labour exploitation, less or restricted access to the land and opposition to big companies in general. SFM-BAM SAC intends to improve the communication and promote private productive projects with these communities. On the other hand, families and leaders who were better informed about the project have a positive perception about its role. The socioeconomic baseline includes information regarding the size and composition of local families, the size and status of their land parcels, the principal
101 SFM BAM. Reporte del proceso de consulta social a poblaición local e informants claves para aplicar al CS and CCBA.
VCS Project Description – Campo Verde
83
productive activities developed on the parcels, and the income level of families from the sale of products and other activities. In regard to the communities’ perception of the Campo Verde Project, questions focused on the perceived impacts of the project on population and the environment, the relationship between the communities and authorities, and the expectations and concerns the communities have about the Project. The methodology utilised questionnaires and interviews. Questionnaires were given to 92 families from 13 different neighbouring settlements and interviews were focused on local authorities. 19 people were interviewed from 10 settlements. Questionnaires used closed specific questions while interviews were open, general questions. Below is a brief summary of conclusions and recommendations from this process:
• Local authorities The process uncovered a large difference in perception about the company and the Project between a) those authorities who know the company directly; b) those ones who know the company through third parties; and c) those who do not know the company at all. The first group has mostly a positive opinion about the Project and company and about the potential impacts, while the second group gave answers that reflect substantial concerns about the impacts of the Project. The concerns of this group were even greater than those who had no knowledge of the Project or company. The first group acknowledged that the company is providing employment to local families and simultaneously restoring and protecting the surrounding forests (and the existing fauna). This group considers the relationship between the company and neighbouring settlements (and the Government) to be good and, additionally, they believe the government should support this type of initiative. Meanwhile, a majority of the group that is aware of the project through third parties has a negative perception of the Project. They believe that the company is the primary beneficiary of the Project, not the workers or local families. They believe this is caused mainly by low salaries and by the presence of workers from outside the local area that occupy jobs that should go to local people. Others have the idea that at some level the company is appropriating lands in the area. This group is strongly opposed to any kind of governmental support because the company is a private entity. They believe the company does not have a positive relationship with local families but that it does with government (which is also perceived negatively). Even though it is most likely that opinions formed firsthand are the most reliable, the large difference of perception between the two groups is cause for concern. The company must undertake an effort to strengthen its communication about the Project benefits to the local communities by organising visits, workshops and other strategies in order to reverse the negative perception of uninformed authorities. It also must be recognised that in Peru, the rural population has an historic distrust of large private companies that is often exploited by local political leaders. An interesting discovery from the questionnaire resulted from questions about how authorities see their communities in the absence of the project. Most of them (independent of their perception about the company) agreed that the situation would follow the actual trend of deforestation, traditional agriculture and increasing poverty. This could help to develop a strategy to convince those in opposition to the Project about the benefits the Project will bring to the region.
• Individual families
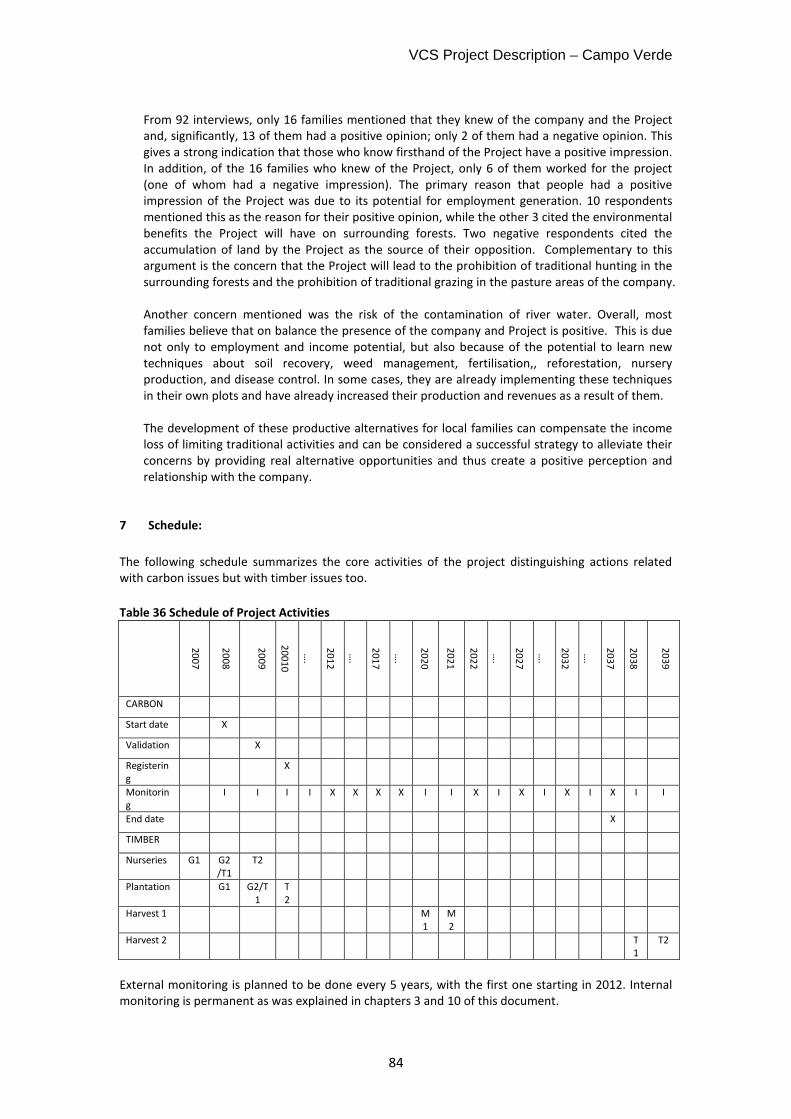
VCS Project Description – Campo Verde
84
From 92 interviews, only 16 families mentioned that they knew of the company and the Project and, significantly, 13 of them had a positive opinion; only 2 of them had a negative opinion. This gives a strong indication that those who know firsthand of the Project have a positive impression. In addition, of the 16 families who knew of the Project, only 6 of them worked for the project (one of whom had a negative impression). The primary reason that people had a positive impression of the Project was due to its potential for employment generation. 10 respondents mentioned this as the reason for their positive opinion, while the other 3 cited the environmental benefits the Project will have on surrounding forests. Two negative respondents cited the accumulation of land by the Project as the source of their opposition. Complementary to this argument is the concern that the Project will lead to the prohibition of traditional hunting in the surrounding forests and the prohibition of traditional grazing in the pasture areas of the company. Another concern mentioned was the risk of the contamination of river water. Overall, most families believe that on balance the presence of the company and Project is positive. This is due not only to employment and income potential, but also because of the potential to learn new techniques about soil recovery, weed management, fertilisation,, reforestation, nursery production, and disease control. In some cases, they are already implementing these techniques in their own plots and have already increased their production and revenues as a result of them. The development of these productive alternatives for local families can compensate the income loss of limiting traditional activities and can be considered a successful strategy to alleviate their concerns by providing real alternative opportunities and thus create a positive perception and relationship with the company.
7 Schedule:
The following schedule summarizes the core activities of the project distinguishing actions related with carbon issues but with timber issues too.
Table 36 Schedule of Project Activities
20
07
20
08
20
09
20
01
0
….
20
12
….
20
17
….
20
20
20
21
20
22
….
20
27
….
20
32
….
20
37
20
38
20
39
CARBON
Start date X
Validation X
Registering
X
Monitoring
I I I I X X X X I I X I X I X I X I I
End date X
TIMBER
Nurseries G1 G2/T1
T2
Plantation G1 G2/T1
T2
Harvest 1 M1
M2
Harvest 2 T1
T2
External monitoring is planned to be done every 5 years, with the first one starting in 2012. Internal monitoring is permanent as was explained in chapters 3 and 10 of this document.
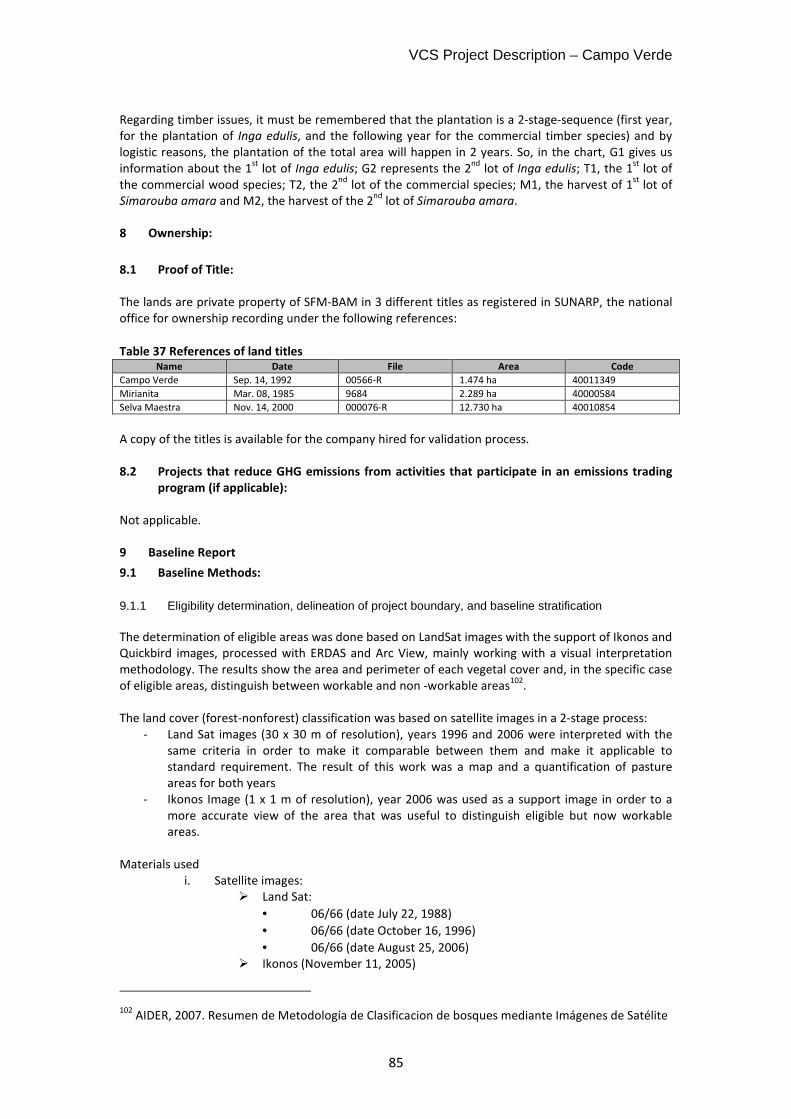
VCS Project Description – Campo Verde
85
Regarding timber issues, it must be remembered that the plantation is a 2-stage-sequence (first year, for the plantation of Inga edulis, and the following year for the commercial timber species) and by logistic reasons, the plantation of the total area will happen in 2 years. So, in the chart, G1 gives us information about the 1
st lot of Inga edulis; G2 represents the 2
nd lot of Inga edulis; T1, the 1
st lot of
the commercial wood species; T2, the 2nd
lot of the commercial species; M1, the harvest of 1st
lot of Simarouba amara and M2, the harvest of the 2
nd lot of Simarouba amara.
8 Ownership:
8.1 Proof of Title:
The lands are private property of SFM-BAM in 3 different titles as registered in SUNARP, the national office for ownership recording under the following references:
Table 37 References of land titles
Name Date File Area Code
Campo Verde Sep. 14, 1992 00566-R 1.474 ha 40011349
Mirianita Mar. 08, 1985 9684 2.289 ha 40000584
Selva Maestra Nov. 14, 2000 000076-R 12.730 ha 40010854
A copy of the titles is available for the company hired for validation process. 8.2 Projects that reduce GHG emissions from activities that participate in an emissions trading
program (if applicable):
Not applicable.
9 Baseline Report
9.1 Baseline Methods:
9.1.1 Eligibility determination, delineation of project boundary, and baseline stratification
The determination of eligible areas was done based on LandSat images with the support of Ikonos and Quickbird images, processed with ERDAS and Arc View, mainly working with a visual interpretation methodology. The results show the area and perimeter of each vegetal cover and, in the specific case of eligible areas, distinguish between workable and non -workable areas
102.
The land cover (forest-nonforest) classification was based on satellite images in a 2-stage process:
- Land Sat images (30 x 30 m of resolution), years 1996 and 2006 were interpreted with the same criteria in order to make it comparable between them and make it applicable to standard requirement. The result of this work was a map and a quantification of pasture areas for both years
- Ikonos Image (1 x 1 m of resolution), year 2006 was used as a support image in order to a more accurate view of the area that was useful to distinguish eligible but now workable areas.
Materials used
i. Satellite images: � Land Sat:
• 06/66 (date July 22, 1988)
• 06/66 (date October 16, 1996)
• 06/66 (date August 25, 2006) � Ikonos (November 11, 2005)
102
AIDER, 2007. Resumen de Metodología de Clasificacion de bosques mediante Imágenes de Satélite
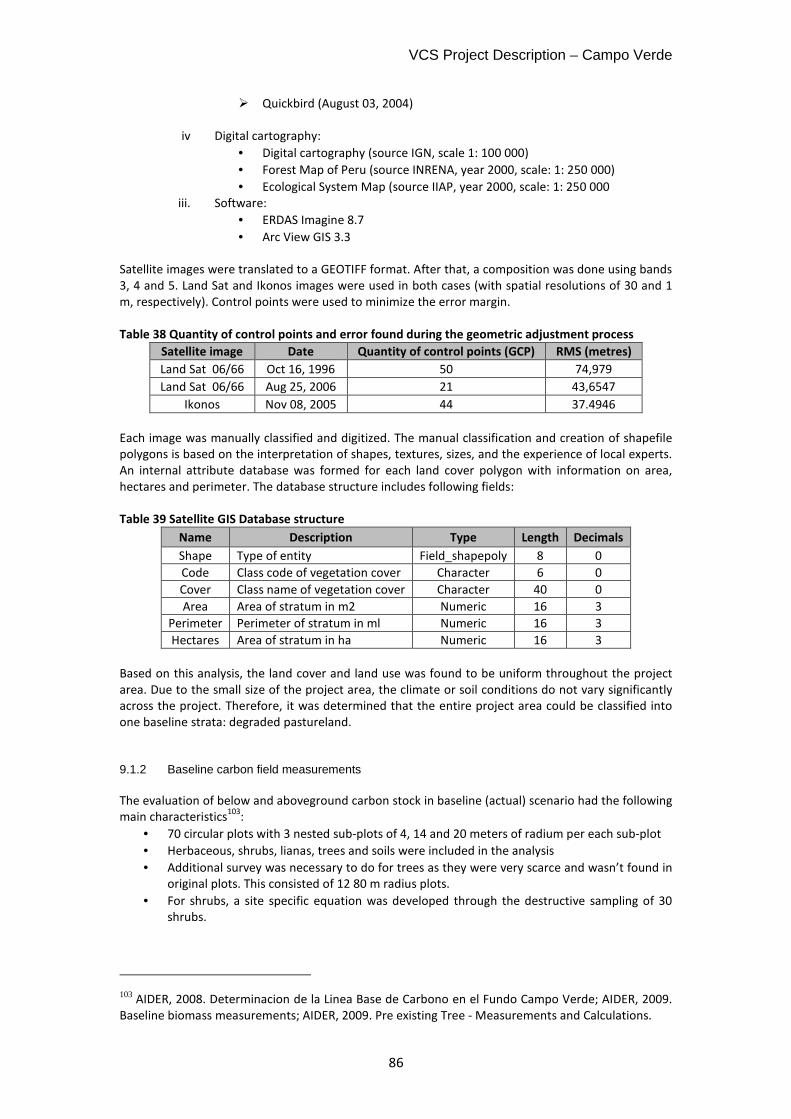
VCS Project Description – Campo Verde
86
� Quickbird (August 03, 2004)
iv Digital cartography:
• Digital cartography (source IGN, scale 1: 100 000)
• Forest Map of Peru (source INRENA, year 2000, scale: 1: 250 000)
• Ecological System Map (source IIAP, year 2000, scale: 1: 250 000 iii. Software:
• ERDAS Imagine 8.7
• Arc View GIS 3.3 Satellite images were translated to a GEOTIFF format. After that, a composition was done using bands 3, 4 and 5. Land Sat and Ikonos images were used in both cases (with spatial resolutions of 30 and 1 m, respectively). Control points were used to minimize the error margin.
Table 38 Quantity of control points and error found during the geometric adjustment process
Satellite image Date Quantity of control points (GCP) RMS (metres)
Land Sat 06/66 Oct 16, 1996 50 74,979
Land Sat 06/66 Aug 25, 2006 21 43,6547
Ikonos Nov 08, 2005 44 37.4946
Each image was manually classified and digitized. The manual classification and creation of shapefile polygons is based on the interpretation of shapes, textures, sizes, and the experience of local experts. An internal attribute database was formed for each land cover polygon with information on area, hectares and perimeter. The database structure includes following fields:
Table 39 Satellite GIS Database structure
Name Description Type Length Decimals
Shape Type of entity Field_shapepoly 8 0
Code Class code of vegetation cover Character 6 0
Cover Class name of vegetation cover Character 40 0
Area Area of stratum in m2 Numeric 16 3
Perimeter Perimeter of stratum in ml Numeric 16 3
Hectares Area of stratum in ha Numeric 16 3
Based on this analysis, the land cover and land use was found to be uniform throughout the project area. Due to the small size of the project area, the climate or soil conditions do not vary significantly across the project. Therefore, it was determined that the entire project area could be classified into one baseline strata: degraded pastureland. 9.1.2 Baseline carbon field measurements
The evaluation of below and aboveground carbon stock in baseline (actual) scenario had the following main characteristics
103:
• 70 circular plots with 3 nested sub-plots of 4, 14 and 20 meters of radium per each sub-plot
• Herbaceous, shrubs, lianas, trees and soils were included in the analysis
• Additional survey was necessary to do for trees as they were very scarce and wasn’t found in original plots. This consisted of 12 80 m radius plots.
• For shrubs, a site specific equation was developed through the destructive sampling of 30 shrubs.
103 AIDER, 2008. Determinacion de la Linea Base de Carbono en el Fundo Campo Verde; AIDER, 2009. Baseline biomass measurements; AIDER, 2009. Pre existing Tree - Measurements and Calculations.
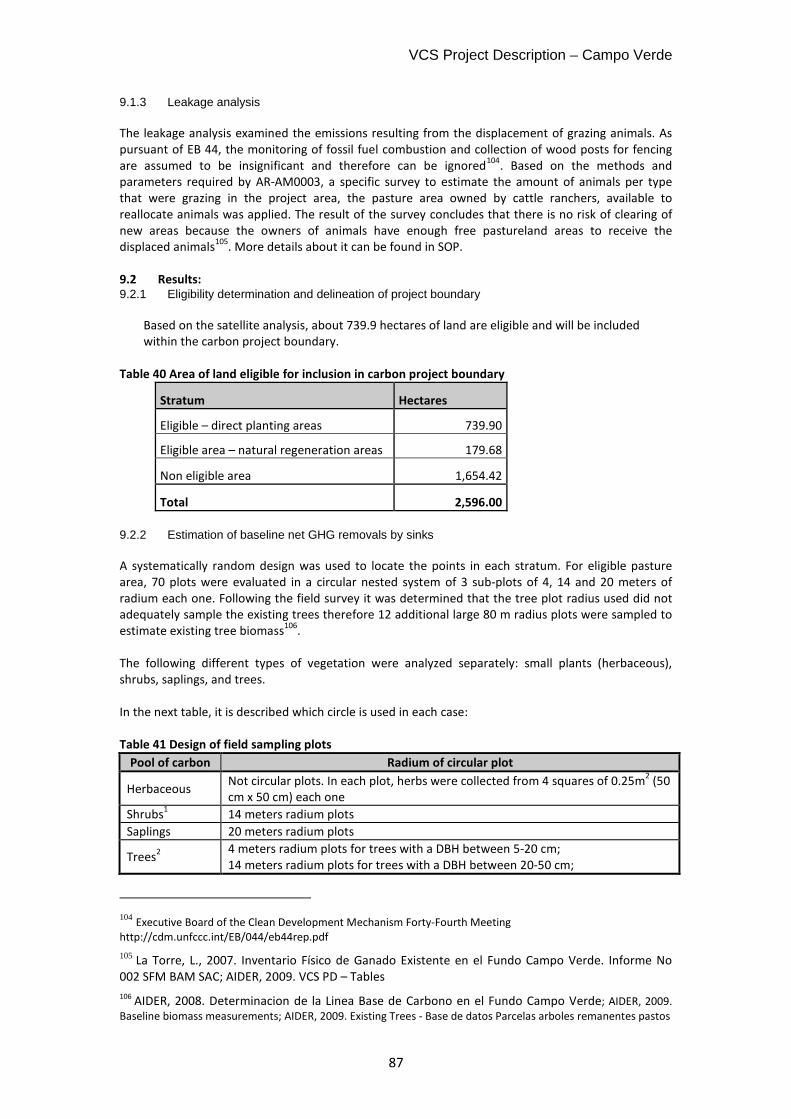
VCS Project Description – Campo Verde
87
9.1.3 Leakage analysis
The leakage analysis examined the emissions resulting from the displacement of grazing animals. As pursuant of EB 44, the monitoring of fossil fuel combustion and collection of wood posts for fencing are assumed to be insignificant and therefore can be ignored
104. Based on the methods and
parameters required by AR-AM0003, a specific survey to estimate the amount of animals per type that were grazing in the project area, the pasture area owned by cattle ranchers, available to reallocate animals was applied. The result of the survey concludes that there is no risk of clearing of new areas because the owners of animals have enough free pastureland areas to receive the displaced animals
105. More details about it can be found in SOP.
9.2 Results: 9.2.1 Eligibility determination and delineation of project boundary
Based on the satellite analysis, about 739.9 hectares of land are eligible and will be included within the carbon project boundary.
Table 40 Area of land eligible for inclusion in carbon project boundary
Stratum Hectares
Eligible – direct planting areas 739.90
Eligible area – natural regeneration areas 179.68
Non eligible area 1,654.42
Total 2,596.00
9.2.2 Estimation of baseline net GHG removals by sinks
A systematically random design was used to locate the points in each stratum. For eligible pasture area, 70 plots were evaluated in a circular nested system of 3 sub-plots of 4, 14 and 20 meters of radium each one. Following the field survey it was determined that the tree plot radius used did not adequately sample the existing trees therefore 12 additional large 80 m radius plots were sampled to estimate existing tree biomass
106.
The following different types of vegetation were analyzed separately: small plants (herbaceous), shrubs, saplings, and trees. In the next table, it is described which circle is used in each case: Table 41 Design of field sampling plots
Pool of carbon Radium of circular plot
Herbaceous Not circular plots. In each plot, herbs were collected from 4 squares of 0.25m
2 (50
cm x 50 cm) each one
Shrubs1 14 meters radium plots
Saplings 20 meters radium plots
Trees2
4 meters radium plots for trees with a DBH between 5-20 cm; 14 meters radium plots for trees with a DBH between 20-50 cm;
104 Executive Board of the Clean Development Mechanism Forty-Fourth Meeting http://cdm.unfccc.int/EB/044/eb44rep.pdf 105 La Torre, L., 2007. Inventario Físico de Ganado Existente en el Fundo Campo Verde. Informe No 002 SFM BAM SAC; AIDER, 2009. VCS PD – Tables 106
AIDER, 2008. Determinacion de la Linea Base de Carbono en el Fundo Campo Verde; AIDER, 2009. Baseline biomass measurements; AIDER, 2009. Existing Trees - Base de datos Parcelas arboles remanentes pastos
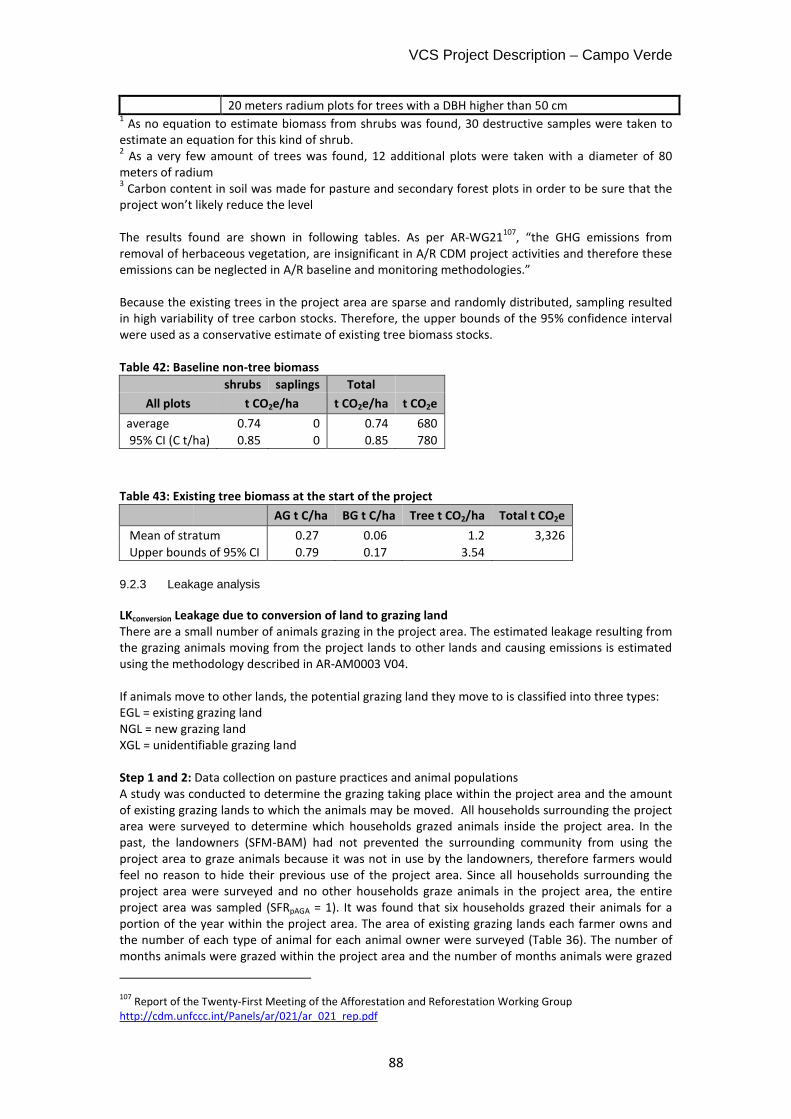
VCS Project Description – Campo Verde
88
20 meters radium plots for trees with a DBH higher than 50 cm 1 As no equation to estimate biomass from shrubs was found, 30 destructive samples were taken to
estimate an equation for this kind of shrub. 2 As a very few amount of trees was found, 12 additional plots were taken with a diameter of 80
meters of radium 3 Carbon content in soil was made for pasture and secondary forest plots in order to be sure that the
project won’t likely reduce the level The results found are shown in following tables. As per AR-WG21
107, “the GHG emissions from
removal of herbaceous vegetation, are insignificant in A/R CDM project activities and therefore these emissions can be neglected in A/R baseline and monitoring methodologies.” Because the existing trees in the project area are sparse and randomly distributed, sampling resulted in high variability of tree carbon stocks. Therefore, the upper bounds of the 95% confidence interval were used as a conservative estimate of existing tree biomass stocks. Table 42: Baseline non-tree biomass
shrubs saplings Total
All plots t CO2e/ha t CO2e/ha t CO2e
average 0.74 0 0.74 680
95% CI (C t/ha) 0.85 0 0.85 780
Table 43: Existing tree biomass at the start of the project
AG t C/ha BG t C/ha Tree t CO2/ha Total t CO2e
Mean of stratum 0.27 0.06 1.2 3,326
Upper bounds of 95% CI 0.79 0.17 3.54
9.2.3 Leakage analysis
LKconversion Leakage due to conversion of land to grazing land
There are a small number of animals grazing in the project area. The estimated leakage resulting from the grazing animals moving from the project lands to other lands and causing emissions is estimated using the methodology described in AR-AM0003 V04. If animals move to other lands, the potential grazing land they move to is classified into three types: EGL = existing grazing land NGL = new grazing land XGL = unidentifiable grazing land Step 1 and 2: Data collection on pasture practices and animal populations A study was conducted to determine the grazing taking place within the project area and the amount of existing grazing lands to which the animals may be moved. All households surrounding the project area were surveyed to determine which households grazed animals inside the project area. In the past, the landowners (SFM-BAM) had not prevented the surrounding community from using the project area to graze animals because it was not in use by the landowners, therefore farmers would feel no reason to hide their previous use of the project area. Since all households surrounding the project area were surveyed and no other households graze animals in the project area, the entire project area was sampled (SFRpAGA = 1). It was found that six households grazed their animals for a portion of the year within the project area. The area of existing grazing lands each farmer owns and the number of each type of animal for each animal owner were surveyed (Table 36). The number of months animals were grazed within the project area and the number of months animals were grazed
107
Report of the Twenty-First Meeting of the Afforestation and Reforestation Working Group http://cdm.unfccc.int/Panels/ar/021/ar_021_rep.pdf
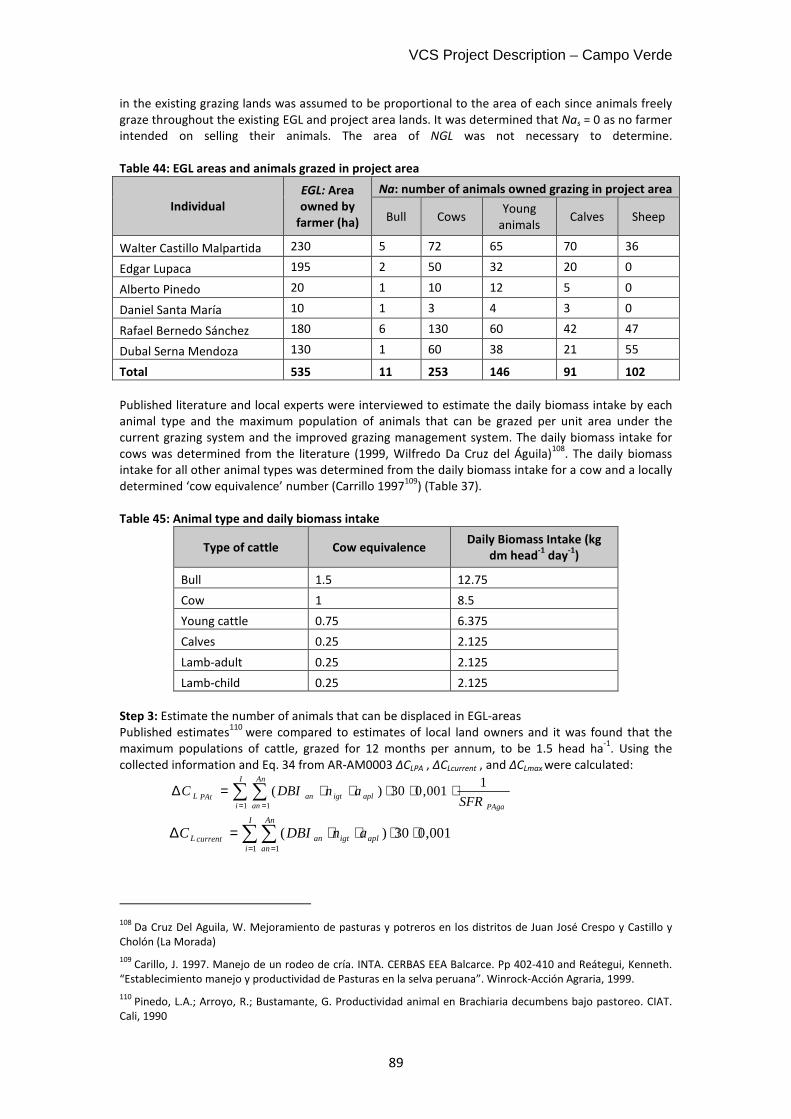
VCS Project Description – Campo Verde
89
in the existing grazing lands was assumed to be proportional to the area of each since animals freely graze throughout the existing EGL and project area lands. It was determined that Nas = 0 as no farmer intended on selling their animals. The area of NGL was not necessary to determine. Table 44: EGL areas and animals grazed in project area
Individual
EGL: Area
owned by
farmer (ha)
Na: number of animals owned grazing in project area
Bull Cows Young
animals Calves Sheep
Walter Castillo Malpartida 230 5 72 65 70 36
Edgar Lupaca 195 2 50 32 20 0
Alberto Pinedo 20 1 10 12 5 0
Daniel Santa María 10 1 3 4 3 0
Rafael Bernedo Sánchez 180 6 130 60 42 47
Dubal Serna Mendoza 130 1 60 38 21 55
Total 535 11 253 146 91 102
Published literature and local experts were interviewed to estimate the daily biomass intake by each animal type and the maximum population of animals that can be grazed per unit area under the current grazing system and the improved grazing management system. The daily biomass intake for cows was determined from the literature (1999, Wilfredo Da Cruz del Águila)
108. The daily biomass
intake for all other animal types was determined from the daily biomass intake for a cow and a locally determined ‘cow equivalence’ number (Carrillo 1997
109) (Table 37).
Table 45: Animal type and daily biomass intake
Type of cattle Cow equivalence Daily Biomass Intake (kg
dm head-1
day-1
)
Bull 1.5 12.75
Cow 1 8.5
Young cattle 0.75 6.375
Calves 0.25 2.125
Lamb-adult 0.25 2.125
Lamb-child 0.25 2.125
Step 3: Estimate the number of animals that can be displaced in EGL-areas Published estimates
110 were compared to estimates of local land owners and it was found that the
maximum populations of cattle, grazed for 12 months per annum, to be 1.5 head ha-1
. Using the collected information and Eq. 34 from AR-AM0003 ∆CLPA , ∆CLcurrent , and ΔCLmax were calculated:
108
Da Cruz Del Aguila, W. Mejoramiento de pasturas y potreros en los distritos de Juan José Crespo y Castillo y Cholón (La Morada) 109
Carillo, J. 1997. Manejo de un rodeo de cría. INTA. CERBAS EEA Balcarce. Pp 402-410 and Reátegui, Kenneth. “Establecimiento manejo y productividad de Pasturas en la selva peruana”. Winrock-Acción Agraria, 1999. 110
Pinedo, L.A.; Arroyo, R.; Bustamante, G. Productividad animal en Brachiaria decumbens bajo pastoreo. CIAT. Cali, 1990
∑ ∑= =
⋅⋅⋅⋅⋅=∆I
i
An
an PAgaapligtanPAtL SFR
anDBIC1 1
1001,030)(
∑∑= =
⋅⋅⋅⋅=∆I
i
An
anapligtancurrentL anDBIC
1 1
001,030)(
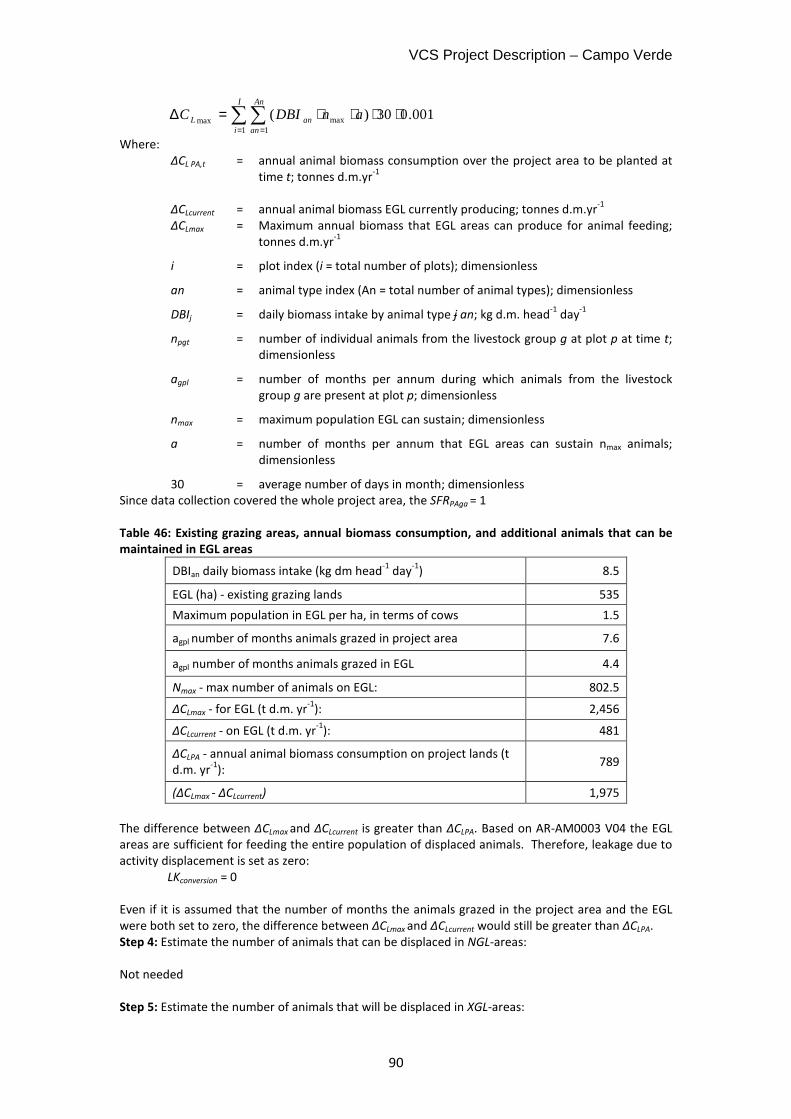
VCS Project Description – Campo Verde
90
Where: ΔCL PA,t = annual animal biomass consumption over the project area to be planted at
time t; tonnes d.m.yr-1
ΔCLcurrent = annual animal biomass EGL currently producing; tonnes d.m.yr-1
ΔCLmax = Maximum annual biomass that EGL areas can produce for animal feeding;
tonnes d.m.yr-1
i = plot index (i = total number of plots); dimensionless
an = animal type index (An = total number of animal types); dimensionless
DBIj = daily biomass intake by animal type j an; kg d.m. head-1
day-1
npgt = number of individual animals from the livestock group g at plot p at time t; dimensionless
agpl = number of months per annum during which animals from the livestock group g are present at plot p; dimensionless
nmax = maximum population EGL can sustain; dimensionless
a = number of months per annum that EGL areas can sustain nmax animals; dimensionless
30 = average number of days in month; dimensionless Since data collection covered the whole project area, the SFRPAga = 1
Table 46: Existing grazing areas, annual biomass consumption, and additional animals that can be
maintained in EGL areas
DBIan daily biomass intake (kg dm head-1
day-1
) 8.5
EGL (ha) - existing grazing lands 535
Maximum population in EGL per ha, in terms of cows 1.5
agpl number of months animals grazed in project area 7.6
agpl number of months animals grazed in EGL 4.4
Nmax - max number of animals on EGL: 802.5
∆CLmax - for EGL (t d.m. yr-1
): 2,456
∆CLcurrent - on EGL (t d.m. yr-1
): 481
∆CLPA - annual animal biomass consumption on project lands (t d.m. yr
-1):
789
(∆CLmax - ∆CLcurrent) 1,975
The difference between ∆CLmax and ∆CLcurrent is greater than ∆CLPA. Based on AR-AM0003 V04 the EGL areas are sufficient for feeding the entire population of displaced animals. Therefore, leakage due to activity displacement is set as zero: LKconversion = 0 Even if it is assumed that the number of months the animals grazed in the project area and the EGL were both set to zero, the difference between ∆CLmax and ∆CLcurrent would still be greater than ∆CLPA. Step 4: Estimate the number of animals that can be displaced in NGL-areas: Not needed
Step 5: Estimate the number of animals that will be displaced in XGL-areas:
∑∑= =
⋅⋅⋅⋅=∆I
i
An
ananL anDBIC
1 1maxmax 001.030)(
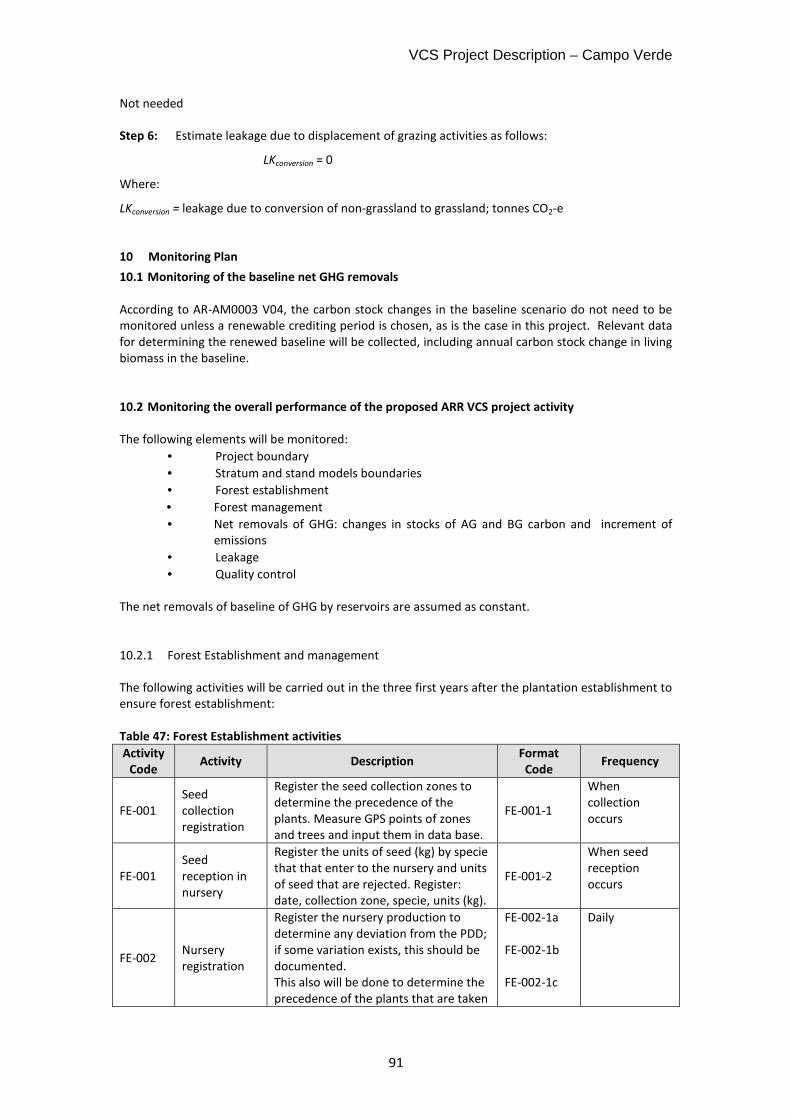
VCS Project Description – Campo Verde
91
Not needed
Step 6: Estimate leakage due to displacement of grazing activities as follows:
LKconversion = 0
Where:
LKconversion = leakage due to conversion of non-grassland to grassland; tonnes CO2-e
10 Monitoring Plan
10.1 Monitoring of the baseline net GHG removals
According to AR-AM0003 V04, the carbon stock changes in the baseline scenario do not need to be monitored unless a renewable crediting period is chosen, as is the case in this project. Relevant data for determining the renewed baseline will be collected, including annual carbon stock change in living biomass in the baseline.
10.2 Monitoring the overall performance of the proposed ARR VCS project activity
The following elements will be monitored:
• Project boundary
• Stratum and stand models boundaries
• Forest establishment
• Forest management
• Net removals of GHG: changes in stocks of AG and BG carbon and increment of emissions
• Leakage
• Quality control The net removals of baseline of GHG by reservoirs are assumed as constant.
10.2.1 Forest Establishment and management
The following activities will be carried out in the three first years after the plantation establishment to ensure forest establishment: Table 47: Forest Establishment activities
Activity
Code Activity Description
Format
Code Frequency
FE-001 Seed collection registration
Register the seed collection zones to determine the precedence of the plants. Measure GPS points of zones and trees and input them in data base.
FE-001-1
When collection occurs
FE-001 Seed reception in nursery
Register the units of seed (kg) by specie that that enter to the nursery and units of seed that are rejected. Register: date, collection zone, specie, units (kg).
FE-001-2
When seed reception occurs
FE-002 Nursery registration
Register the nursery production to determine any deviation from the PDD; if some variation exists, this should be documented. This also will be done to determine the precedence of the plants that are taken
FE-002-1a FE-002-1b FE-002-1c
Daily
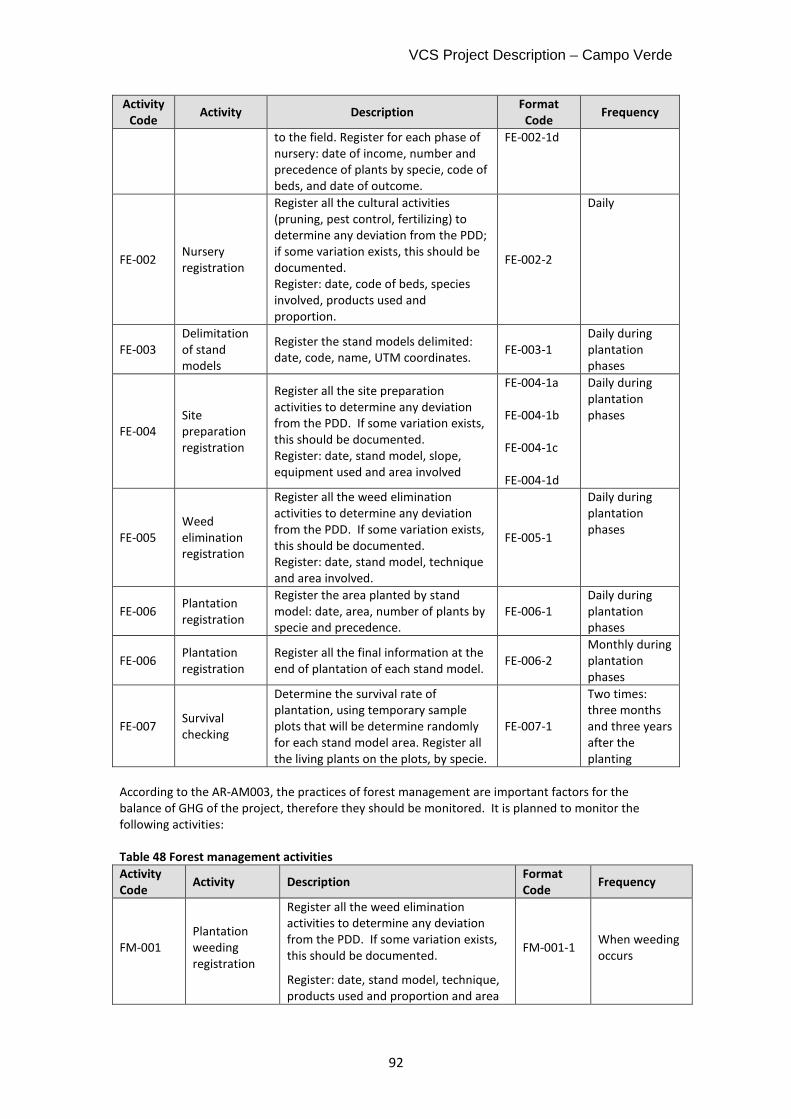
VCS Project Description – Campo Verde
92
Activity
Code Activity Description
Format
Code Frequency
to the field. Register for each phase of nursery: date of income, number and precedence of plants by specie, code of beds, and date of outcome.
FE-002-1d
FE-002 Nursery registration
Register all the cultural activities (pruning, pest control, fertilizing) to determine any deviation from the PDD; if some variation exists, this should be documented. Register: date, code of beds, species involved, products used and proportion.
FE-002-2
Daily
FE-003 Delimitation of stand models
Register the stand models delimited: date, code, name, UTM coordinates.
FE-003-1 Daily during plantation phases
FE-004 Site preparation registration
Register all the site preparation activities to determine any deviation from the PDD. If some variation exists, this should be documented. Register: date, stand model, slope, equipment used and area involved
FE-004-1a FE-004-1b FE-004-1c FE-004-1d
Daily during plantation phases
FE-005 Weed elimination registration
Register all the weed elimination activities to determine any deviation from the PDD. If some variation exists, this should be documented. Register: date, stand model, technique and area involved.
FE-005-1
Daily during plantation phases
FE-006 Plantation registration
Register the area planted by stand model: date, area, number of plants by specie and precedence.
FE-006-1 Daily during plantation phases
FE-006 Plantation registration
Register all the final information at the end of plantation of each stand model.
FE-006-2 Monthly during plantation phases
FE-007 Survival checking
Determine the survival rate of plantation, using temporary sample plots that will be determine randomly for each stand model area. Register all the living plants on the plots, by specie.
FE-007-1
Two times: three months and three years after the planting
According to the AR-AM003, the practices of forest management are important factors for the balance of GHG of the project, therefore they should be monitored. It is planned to monitor the following activities: Table 48 Forest management activities
Activity
Code Activity Description
Format
Code Frequency
FM-001 Plantation weeding registration
Register all the weed elimination activities to determine any deviation from the PDD. If some variation exists, this should be documented.
Register: date, stand model, technique, products used and proportion and area
FM-001-1 When weeding occurs
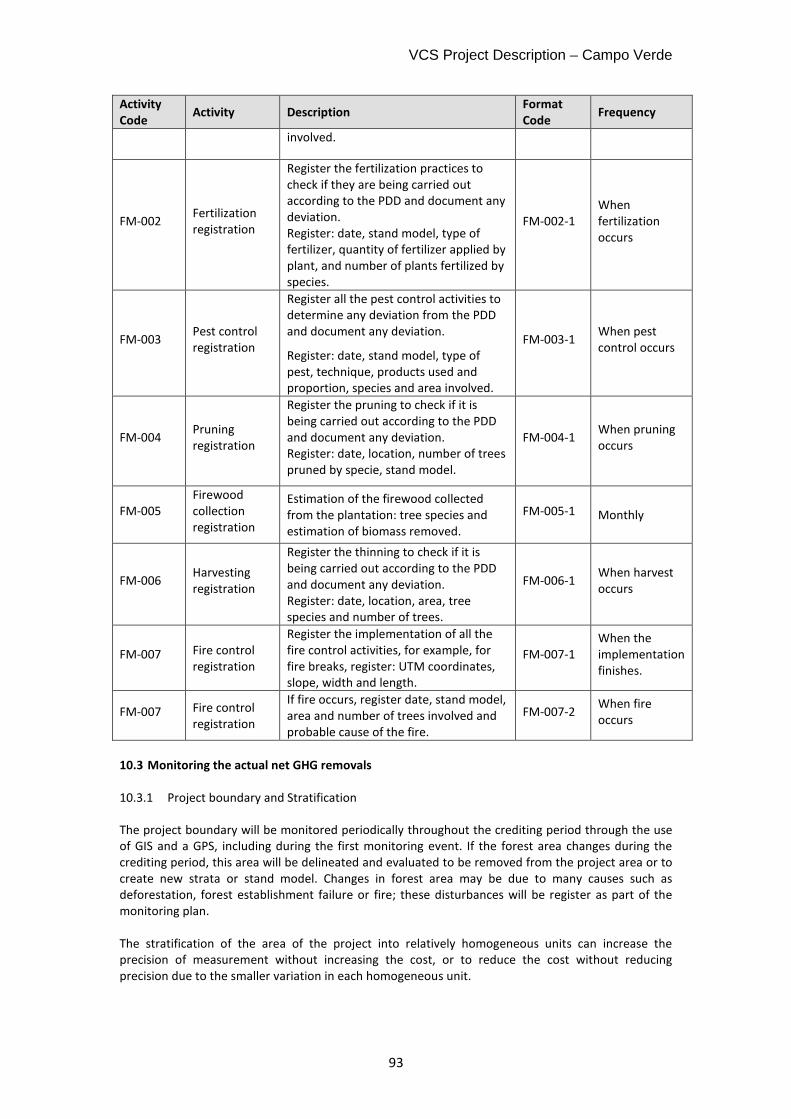
VCS Project Description – Campo Verde
93
Activity
Code Activity Description
Format
Code Frequency
involved.
FM-002 Fertilization registration
Register the fertilization practices to check if they are being carried out according to the PDD and document any deviation. Register: date, stand model, type of fertilizer, quantity of fertilizer applied by plant, and number of plants fertilized by species.
FM-002-1 When fertilization occurs
FM-003 Pest control registration
Register all the pest control activities to determine any deviation from the PDD and document any deviation.
Register: date, stand model, type of pest, technique, products used and proportion, species and area involved.
FM-003-1 When pest control occurs
FM-004 Pruning registration
Register the pruning to check if it is being carried out according to the PDD and document any deviation. Register: date, location, number of trees pruned by specie, stand model.
FM-004-1 When pruning occurs
FM-005 Firewood collection registration
Estimation of the firewood collected from the plantation: tree species and estimation of biomass removed.
FM-005-1 Monthly
FM-006 Harvesting registration
Register the thinning to check if it is being carried out according to the PDD and document any deviation. Register: date, location, area, tree species and number of trees.
FM-006-1 When harvest occurs
FM-007 Fire control registration
Register the implementation of all the fire control activities, for example, for fire breaks, register: UTM coordinates, slope, width and length.
FM-007-1 When the implementation finishes.
FM-007 Fire control registration
If fire occurs, register date, stand model, area and number of trees involved and probable cause of the fire.
FM-007-2 When fire occurs
10.3 Monitoring the actual net GHG removals
10.3.1 Project boundary and Stratification
The project boundary will be monitored periodically throughout the crediting period through the use of GIS and a GPS, including during the first monitoring event. If the forest area changes during the crediting period, this area will be delineated and evaluated to be removed from the project area or to create new strata or stand model. Changes in forest area may be due to many causes such as deforestation, forest establishment failure or fire; these disturbances will be register as part of the monitoring plan. The stratification of the area of the project into relatively homogeneous units can increase the precision of measurement without increasing the cost, or to reduce the cost without reducing precision due to the smaller variation in each homogeneous unit.
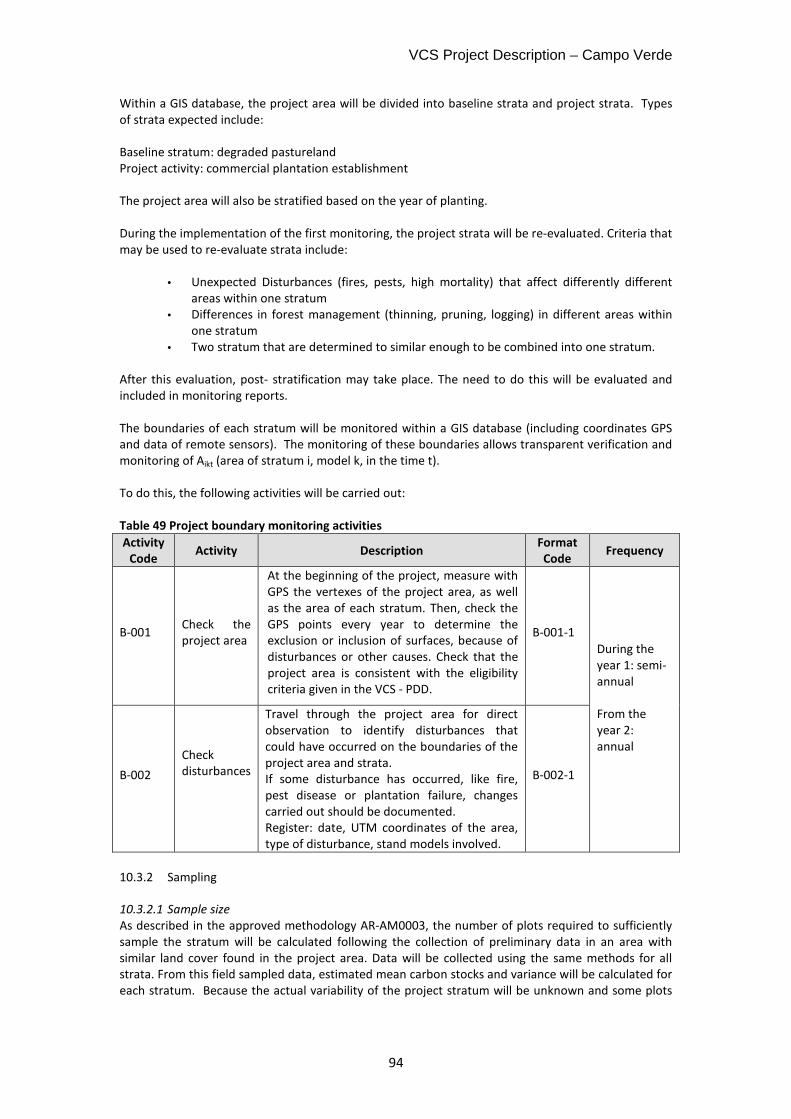
VCS Project Description – Campo Verde
94
Within a GIS database, the project area will be divided into baseline strata and project strata. Types of strata expected include: Baseline stratum: degraded pastureland Project activity: commercial plantation establishment The project area will also be stratified based on the year of planting. During the implementation of the first monitoring, the project strata will be re-evaluated. Criteria that may be used to re-evaluate strata include:
• Unexpected Disturbances (fires, pests, high mortality) that affect differently different areas within one stratum
• Differences in forest management (thinning, pruning, logging) in different areas within one stratum
• Two stratum that are determined to similar enough to be combined into one stratum.
After this evaluation, post- stratification may take place. The need to do this will be evaluated and included in monitoring reports. The boundaries of each stratum will be monitored within a GIS database (including coordinates GPS and data of remote sensors). The monitoring of these boundaries allows transparent verification and monitoring of Aikt (area of stratum i, model k, in the time t). To do this, the following activities will be carried out: Table 49 Project boundary monitoring activities
Activity
Code Activity Description
Format
Code Frequency
B-001 Check the project area
At the beginning of the project, measure with GPS the vertexes of the project area, as well as the area of each stratum. Then, check the GPS points every year to determine the exclusion or inclusion of surfaces, because of disturbances or other causes. Check that the project area is consistent with the eligibility criteria given in the VCS - PDD.
B-001-1
During the year 1: semi-annual From the year 2: annual
B-002
Check disturbances
Travel through the project area for direct observation to identify disturbances that could have occurred on the boundaries of the project area and strata. If some disturbance has occurred, like fire, pest disease or plantation failure, changes carried out should be documented. Register: date, UTM coordinates of the area, type of disturbance, stand models involved.
B-002-1
10.3.2 Sampling
10.3.2.1 Sample size
As described in the approved methodology AR-AM0003, the number of plots required to sufficiently sample the stratum will be calculated following the collection of preliminary data in an area with similar land cover found in the project area. Data will be collected using the same methods for all strata. From this field sampled data, estimated mean carbon stocks and variance will be calculated for each stratum. Because the actual variability of the project stratum will be unknown and some plots
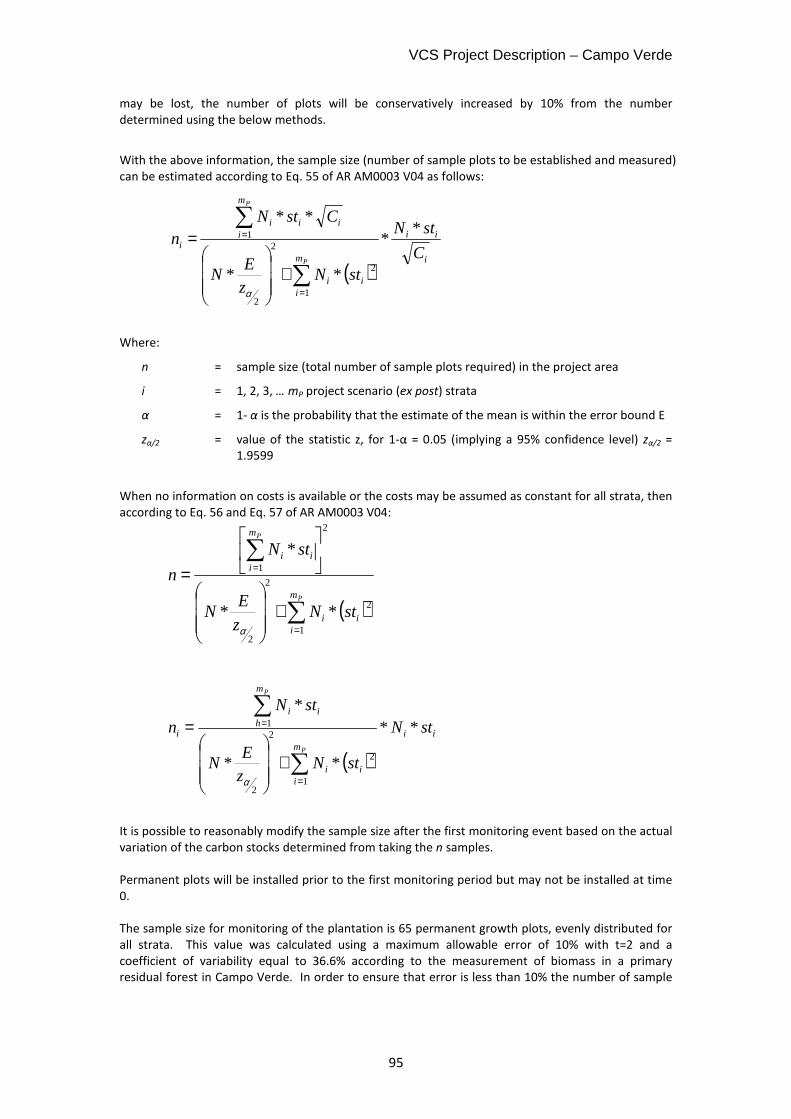
VCS Project Description – Campo Verde
95
may be lost, the number of plots will be conservatively increased by 10% from the number determined using the below methods.
With the above information, the sample size (number of sample plots to be established and measured) can be estimated according to Eq. 55 of AR AM0003 V04 as follows:
Where:
n = sample size (total number of sample plots required) in the project area
i = 1, 2, 3, … mP project scenario (ex post) strata
α = 1- α is the probability that the estimate of the mean is within the error bound E
zα/2 = value of the statistic z, for 1-α = 0.05 (implying a 95% confidence level) zα/2 = 1.9599
When no information on costs is available or the costs may be assumed as constant for all strata, then according to Eq. 56 and Eq. 57 of AR AM0003 V04:
It is possible to reasonably modify the sample size after the first monitoring event based on the actual variation of the carbon stocks determined from taking the n samples. Permanent plots will be installed prior to the first monitoring period but may not be installed at time 0. The sample size for monitoring of the plantation is 65 permanent growth plots, evenly distributed for all strata. This value was calculated using a maximum allowable error of 10% with t=2 and a coefficient of variability equal to 36.6% according to the measurement of biomass in a primary residual forest in Campo Verde. In order to ensure that error is less than 10% the number of sample
( )i
ii
m
iii
m
iiii
iC
stN
stNz
EN
CstNn
P
P
**
**
**
1
2
2
2
1
∑
∑
=
=
+
=
α
( )∑
∑
=
=
+
=P
P
m
iii
m
iii
stNz
EN
stN
n
1
2
2
2
2
1
**
*
α
( )ii
m
iii
m
hii
i stN
stNz
EN
stNn
P
P
**
**
*
1
2
2
2
1
∑
∑
=
=
+
=
α
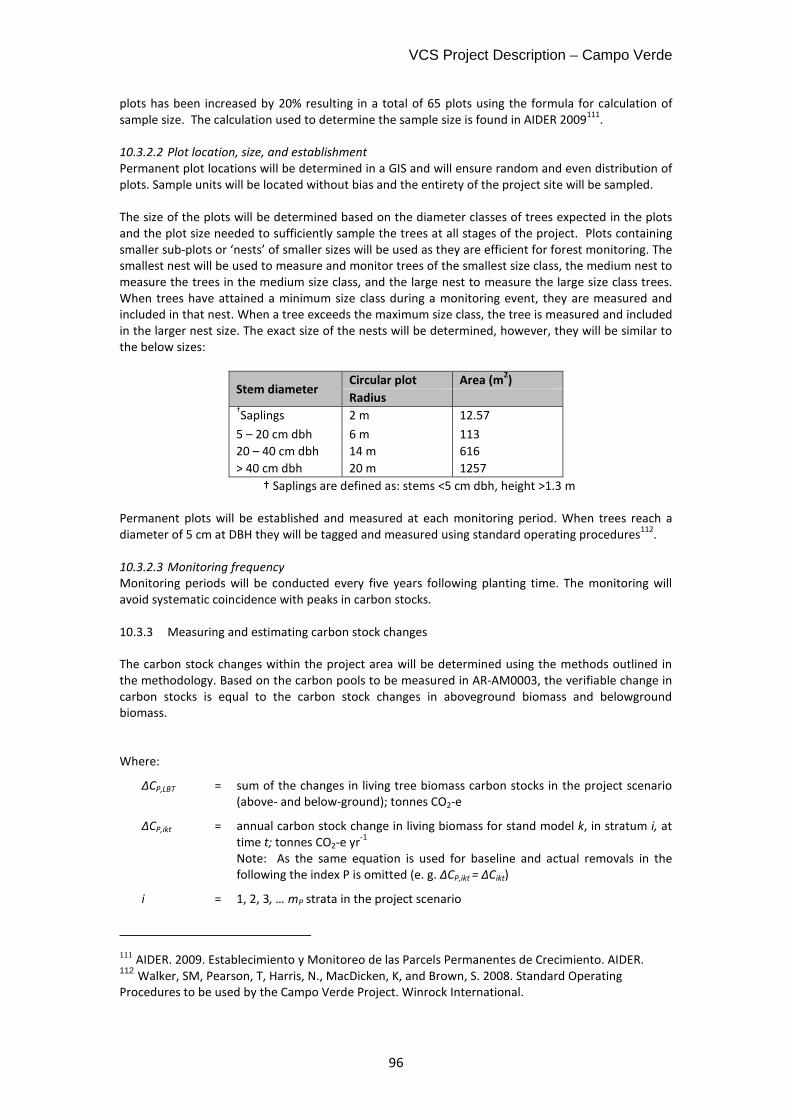
VCS Project Description – Campo Verde
96
plots has been increased by 20% resulting in a total of 65 plots using the formula for calculation of sample size. The calculation used to determine the sample size is found in AIDER 2009
111.
10.3.2.2 Plot location, size, and establishment
Permanent plot locations will be determined in a GIS and will ensure random and even distribution of plots. Sample units will be located without bias and the entirety of the project site will be sampled. The size of the plots will be determined based on the diameter classes of trees expected in the plots and the plot size needed to sufficiently sample the trees at all stages of the project. Plots containing smaller sub-plots or ‘nests’ of smaller sizes will be used as they are efficient for forest monitoring. The smallest nest will be used to measure and monitor trees of the smallest size class, the medium nest to measure the trees in the medium size class, and the large nest to measure the large size class trees. When trees have attained a minimum size class during a monitoring event, they are measured and included in that nest. When a tree exceeds the maximum size class, the tree is measured and included in the larger nest size. The exact size of the nests will be determined, however, they will be similar to the below sizes:
Stem diameter Circular plot Area (m
2)
Radius †Saplings 2 m 12.57
5 – 20 cm dbh 6 m 113
20 – 40 cm dbh 14 m 616
> 40 cm dbh 20 m 1257
† Saplings are defined as: stems <5 cm dbh, height >1.3 m
Permanent plots will be established and measured at each monitoring period. When trees reach a diameter of 5 cm at DBH they will be tagged and measured using standard operating procedures
112.
10.3.2.3 Monitoring frequency
Monitoring periods will be conducted every five years following planting time. The monitoring will avoid systematic coincidence with peaks in carbon stocks.
10.3.3 Measuring and estimating carbon stock changes
The carbon stock changes within the project area will be determined using the methods outlined in the methodology. Based on the carbon pools to be measured in AR-AM0003, the verifiable change in carbon stocks is equal to the carbon stock changes in aboveground biomass and belowground biomass.
Where:
ΔCP,LBT = sum of the changes in living tree biomass carbon stocks in the project scenario (above- and below-ground); tonnes CO2-e
ΔCP,ikt = annual carbon stock change in living biomass for stand model k, in stratum i, at time t; tonnes CO2-e yr
-1
Note: As the same equation is used for baseline and actual removals in the following the index P is omitted (e. g. ΔCP,ikt = ΔCikt)
i = 1, 2, 3, … mP strata in the project scenario
111 AIDER. 2009. Establecimiento y Monitoreo de las Parcels Permanentes de Crecimiento. AIDER. 112 Walker, SM, Pearson, T, Harris, N., MacDicken, K, and Brown, S. 2008. Standard Operating Procedures to be used by the Campo Verde Project. Winrock International.
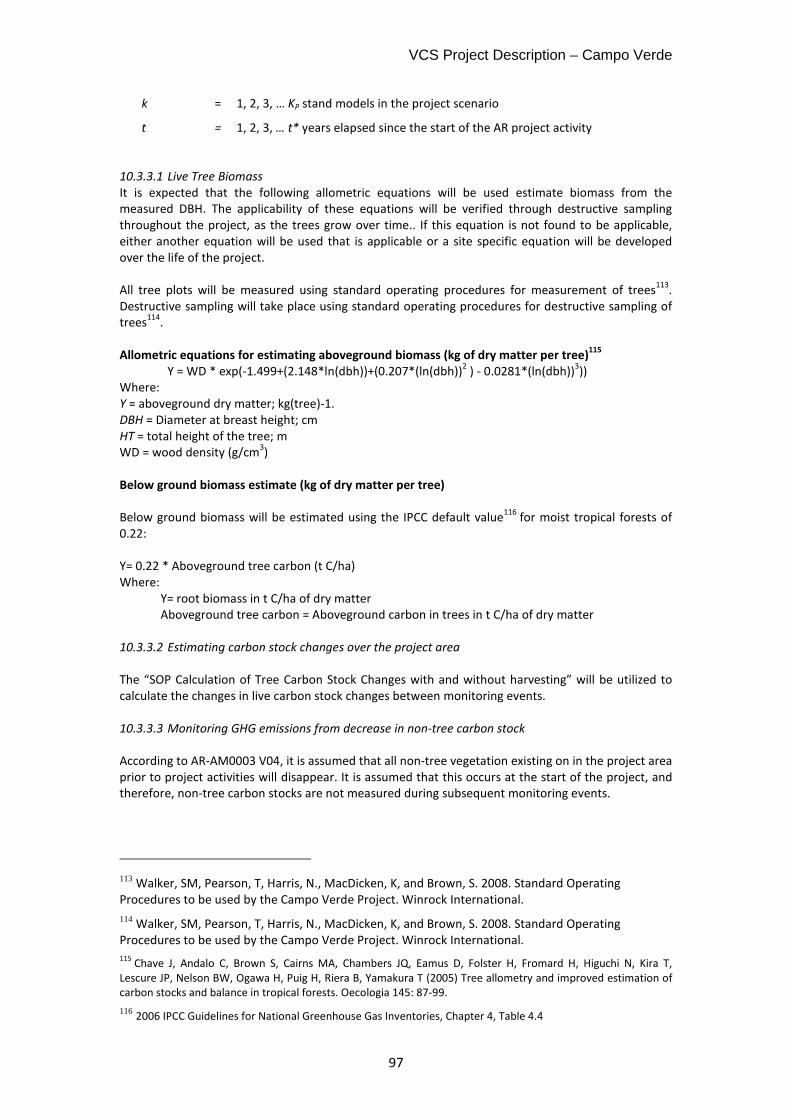
VCS Project Description – Campo Verde
97
k = 1, 2, 3, … KP stand models in the project scenario
t = 1, 2, 3, … t* years elapsed since the start of the AR project activity 10.3.3.1 Live Tree Biomass
It is expected that the following allometric equations will be used estimate biomass from the measured DBH. The applicability of these equations will be verified through destructive sampling throughout the project, as the trees grow over time.. If this equation is not found to be applicable, either another equation will be used that is applicable or a site specific equation will be developed over the life of the project. All tree plots will be measured using standard operating procedures for measurement of trees
113.
Destructive sampling will take place using standard operating procedures for destructive sampling of trees
114.
Allometric equations for estimating aboveground biomass (kg of dry matter per tree)115
Y = WD * exp(-1.499+(2.148*ln(dbh))+(0.207*(ln(dbh))2 ) - 0.0281*(ln(dbh))
3))
Where: Y = aboveground dry matter; kg(tree)-1. DBH = Diameter at breast height; cm HT = total height of the tree; m WD = wood density (g/cm
3)
Below ground biomass estimate (kg of dry matter per tree)
Below ground biomass will be estimated using the IPCC default value116
for moist tropical forests of 0.22: Y= 0.22 * Aboveground tree carbon (t C/ha) Where:
Y= root biomass in t C/ha of dry matter Aboveground tree carbon = Aboveground carbon in trees in t C/ha of dry matter
10.3.3.2 Estimating carbon stock changes over the project area
The “SOP Calculation of Tree Carbon Stock Changes with and without harvesting” will be utilized to calculate the changes in live carbon stock changes between monitoring events.
10.3.3.3 Monitoring GHG emissions from decrease in non-tree carbon stock
According to AR-AM0003 V04, it is assumed that all non-tree vegetation existing on in the project area prior to project activities will disappear. It is assumed that this occurs at the start of the project, and therefore, non-tree carbon stocks are not measured during subsequent monitoring events.
113 Walker, SM, Pearson, T, Harris, N., MacDicken, K, and Brown, S. 2008. Standard Operating Procedures to be used by the Campo Verde Project. Winrock International. 114 Walker, SM, Pearson, T, Harris, N., MacDicken, K, and Brown, S. 2008. Standard Operating Procedures to be used by the Campo Verde Project. Winrock International. 115
Chave J, Andalo C, Brown S, Cairns MA, Chambers JQ, Eamus D, Folster H, Fromard H, Higuchi N, Kira T, Lescure JP, Nelson BW, Ogawa H, Puig H, Riera B, Yamakura T (2005) Tree allometry and improved estimation of carbon stocks and balance in tropical forests. Oecologia 145: 87-99. 116 2006 IPCC Guidelines for National Greenhouse Gas Inventories, Chapter 4, Table 4.4
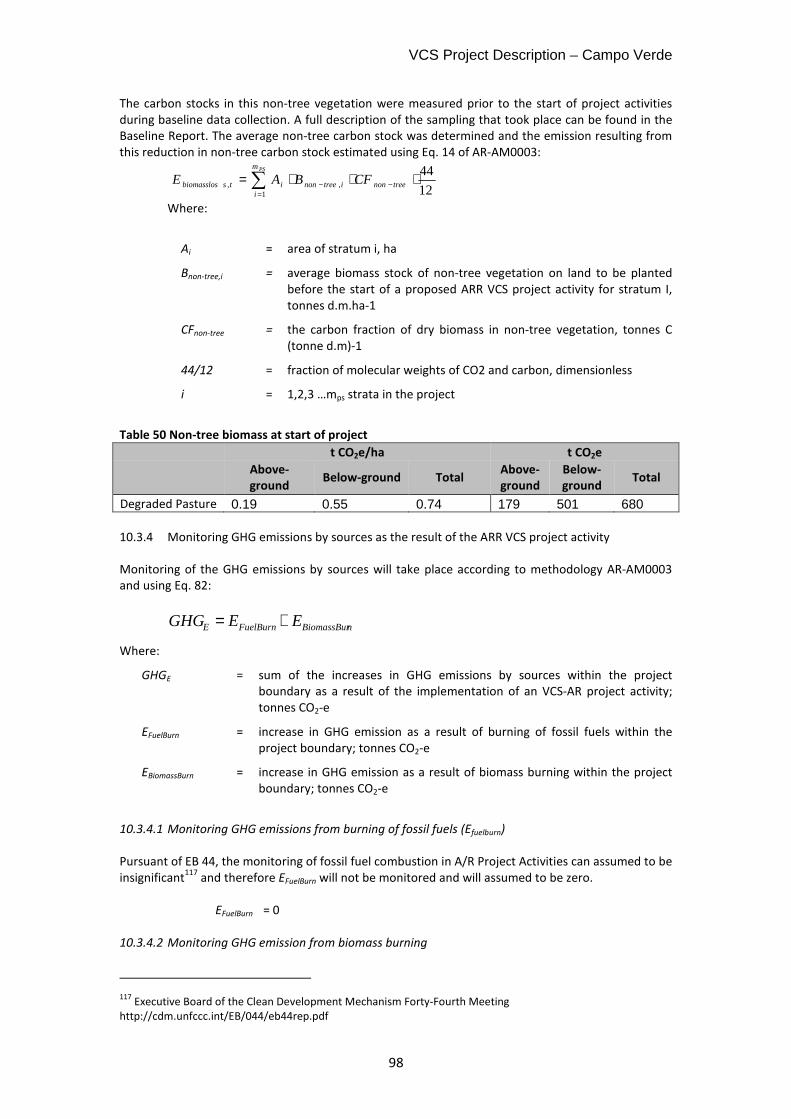
VCS Project Description – Campo Verde
98
The carbon stocks in this non-tree vegetation were measured prior to the start of project activities during baseline data collection. A full description of the sampling that took place can be found in the Baseline Report. The average non-tree carbon stock was determined and the emission resulting from this reduction in non-tree carbon stock estimated using Eq. 14 of AR-AM0003:
Where:
Ai = area of stratum i, ha
Bnon-tree,i = average biomass stock of non-tree vegetation on land to be planted before the start of a proposed ARR VCS project activity for stratum I, tonnes d.m.ha-1
CFnon-tree = the carbon fraction of dry biomass in non-tree vegetation, tonnes C (tonne d.m)-1
44/12 = fraction of molecular weights of CO2 and carbon, dimensionless
i = 1,2,3 …mps strata in the project
Table 50 Non-tree biomass at start of project
t CO2e/ha t CO2e
Above-
ground Below-ground Total
Above-
ground
Below-
ground Total
Degraded Pasture 0.19 0.55 0.74 179 501 680 10.3.4 Monitoring GHG emissions by sources as the result of the ARR VCS project activity
Monitoring of the GHG emissions by sources will take place according to methodology AR-AM0003 and using Eq. 82:
nBiomassBurFuelBurnE EEGHG +=
Where:
GHGE = sum of the increases in GHG emissions by sources within the project boundary as a result of the implementation of an VCS-AR project activity; tonnes CO2-e
EFuelBurn = increase in GHG emission as a result of burning of fossil fuels within the project boundary; tonnes CO2-e
EBiomassBurn = increase in GHG emission as a result of biomass burning within the project boundary; tonnes CO2-e
10.3.4.1 Monitoring GHG emissions from burning of fossil fuels (Efuelburn)
Pursuant of EB 44, the monitoring of fossil fuel combustion in A/R Project Activities can assumed to be insignificant
117 and therefore EFuelBurn will not be monitored and will assumed to be zero.
EFuelBurn = 0
10.3.4.2 Monitoring GHG emission from biomass burning
117
Executive Board of the Clean Development Mechanism Forty-Fourth Meeting http://cdm.unfccc.int/EB/044/eb44rep.pdf
∑=
−− ⋅⋅⋅=PSm
itreenonitreenonitsbiomasslos CFBAE
1,, 12
44
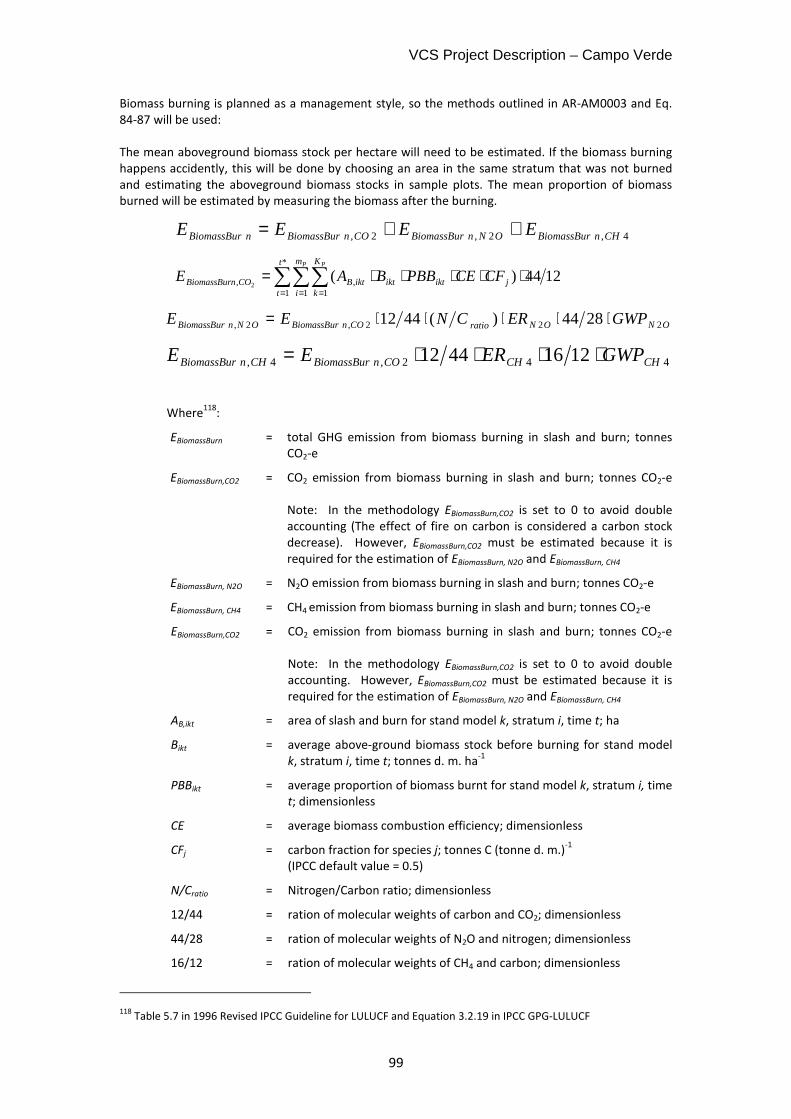
VCS Project Description – Campo Verde
99
Biomass burning is planned as a management style, so the methods outlined in AR-AM0003 and Eq. 84-87 will be used: The mean aboveground biomass stock per hectare will need to be estimated. If the biomass burning happens accidently, this will be done by choosing an area in the same stratum that was not burned and estimating the aboveground biomass stocks in sample plots. The mean proportion of biomass burned will be estimated by measuring the biomass after the burning.
Where118
:
EBiomassBurn = total GHG emission from biomass burning in slash and burn; tonnes CO2-e
EBiomassBurn,CO2 = CO2 emission from biomass burning in slash and burn; tonnes CO2-e Note: In the methodology EBiomassBurn,CO2 is set to 0 to avoid double accounting (The effect of fire on carbon is considered a carbon stock decrease). However, EBiomassBurn,CO2 must be estimated because it is required for the estimation of EBiomassBurn, N2O and EBiomassBurn, CH4
EBiomassBurn, N2O = N2O emission from biomass burning in slash and burn; tonnes CO2-e
EBiomassBurn, CH4 = CH4 emission from biomass burning in slash and burn; tonnes CO2-e
EBiomassBurn,CO2 = CO2 emission from biomass burning in slash and burn; tonnes CO2-e Note: In the methodology EBiomassBurn,CO2 is set to 0 to avoid double accounting. However, EBiomassBurn,CO2 must be estimated because it is required for the estimation of EBiomassBurn, N2O and EBiomassBurn, CH4
AB,ikt = area of slash and burn for stand model k, stratum i, time t; ha
Bikt = average above-ground biomass stock before burning for stand model k, stratum i, time t; tonnes d. m. ha
-1
PBBikt = average proportion of biomass burnt for stand model k, stratum i, time t; dimensionless
CE = average biomass combustion efficiency; dimensionless
CFj = carbon fraction for species j; tonnes C (tonne d. m.)-1
(IPCC default value = 0.5)
N/Cratio = Nitrogen/Carbon ratio; dimensionless
12/44 = ration of molecular weights of carbon and CO2; dimensionless
44/28 = ration of molecular weights of N2O and nitrogen; dimensionless
16/12 = ration of molecular weights of CH4 and carbon; dimensionless
118
Table 5.7 in 1996 Revised IPCC Guideline for LULUCF and Equation 3.2.19 in IPCC GPG-LULUCF
4,2,2, CHnBiomassBurONnBiomassBurCOnBiomassBurnBiomassBur EEEE ++=
∑∑∑= = =
⋅⋅⋅⋅⋅=*
1 1 1,, 1244)(
2
t
t
m
i
K
kjiktiktiktBCOnBiomassBur
P P
CFCEPBBBAE
ONONratioCOnBiomassBurONnBiomassBur GWPERCNEE 222,2, 2844)(4412 ⋅⋅⋅⋅⋅=
442,4, 12164412 CHCHCOnBiomassBurCHnBiomassBur GWPEREE ⋅⋅⋅⋅=
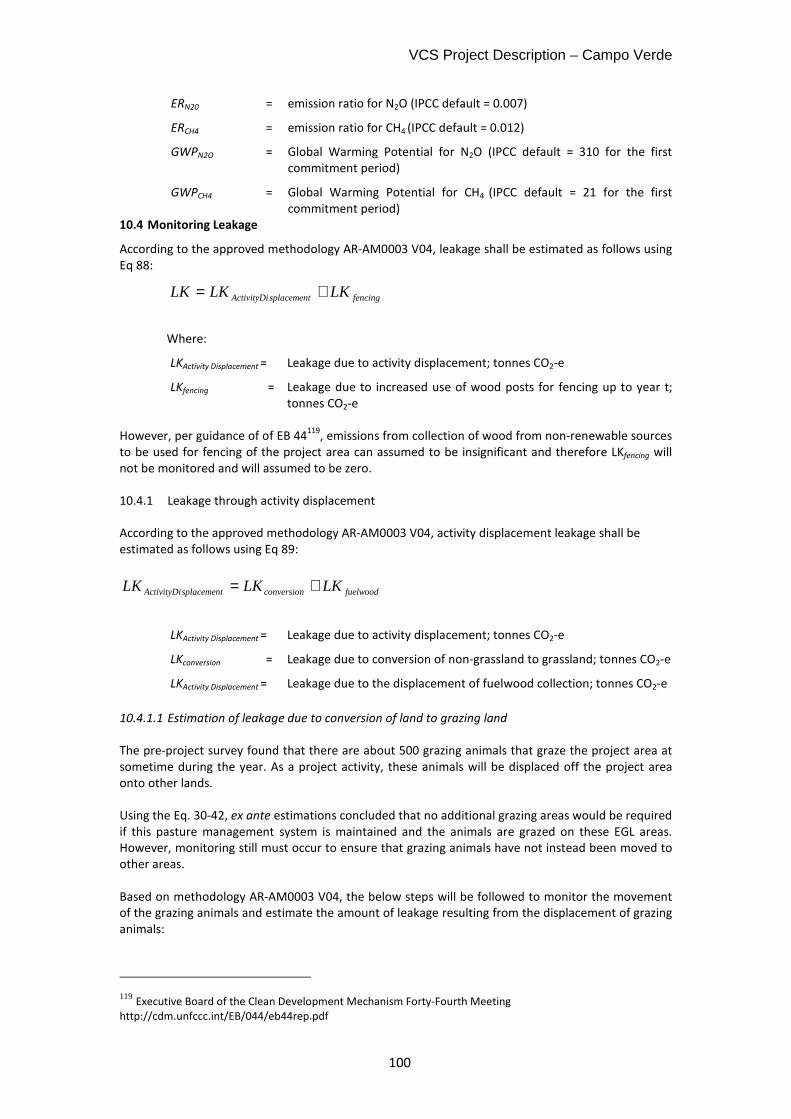
VCS Project Description – Campo Verde
100
ERN20 = emission ratio for N2O (IPCC default = 0.007)
ERCH4 = emission ratio for CH4 (IPCC default = 0.012)
GWPN2O = Global Warming Potential for N2O (IPCC default = 310 for the first commitment period)
GWPCH4 = Global Warming Potential for CH4 (IPCC default = 21 for the first commitment period)
10.4 Monitoring Leakage
According to the approved methodology AR-AM0003 V04, leakage shall be estimated as follows using Eq 88:
fencingsplacementActivityDi LKLKLK +=
Where:
LKActivity Displacement = Leakage due to activity displacement; tonnes CO2-e
LKfencing = Leakage due to increased use of wood posts for fencing up to year t; tonnes CO2-e
However, per guidance of of EB 44
119, emissions from collection of wood from non-renewable sources
to be used for fencing of the project area can assumed to be insignificant and therefore LKfencing will not be monitored and will assumed to be zero. 10.4.1 Leakage through activity displacement
According to the approved methodology AR-AM0003 V04, activity displacement leakage shall be estimated as follows using Eq 89:
fuelwoodconversionsplacementActivityDi LKLKLK +=
LKActivity Displacement = Leakage due to activity displacement; tonnes CO2-e
LKconversion = Leakage due to conversion of non-grassland to grassland; tonnes CO2-e
LKActivity Displacement = Leakage due to the displacement of fuelwood collection; tonnes CO2-e
10.4.1.1 Estimation of leakage due to conversion of land to grazing land
The pre-project survey found that there are about 500 grazing animals that graze the project area at sometime during the year. As a project activity, these animals will be displaced off the project area onto other lands. Using the Eq. 30-42, ex ante estimations concluded that no additional grazing areas would be required if this pasture management system is maintained and the animals are grazed on these EGL areas. However, monitoring still must occur to ensure that grazing animals have not instead been moved to other areas. Based on methodology AR-AM0003 V04, the below steps will be followed to monitor the movement of the grazing animals and estimate the amount of leakage resulting from the displacement of grazing animals:
119 Executive Board of the Clean Development Mechanism Forty-Fourth Meeting http://cdm.unfccc.int/EB/044/eb44rep.pdf
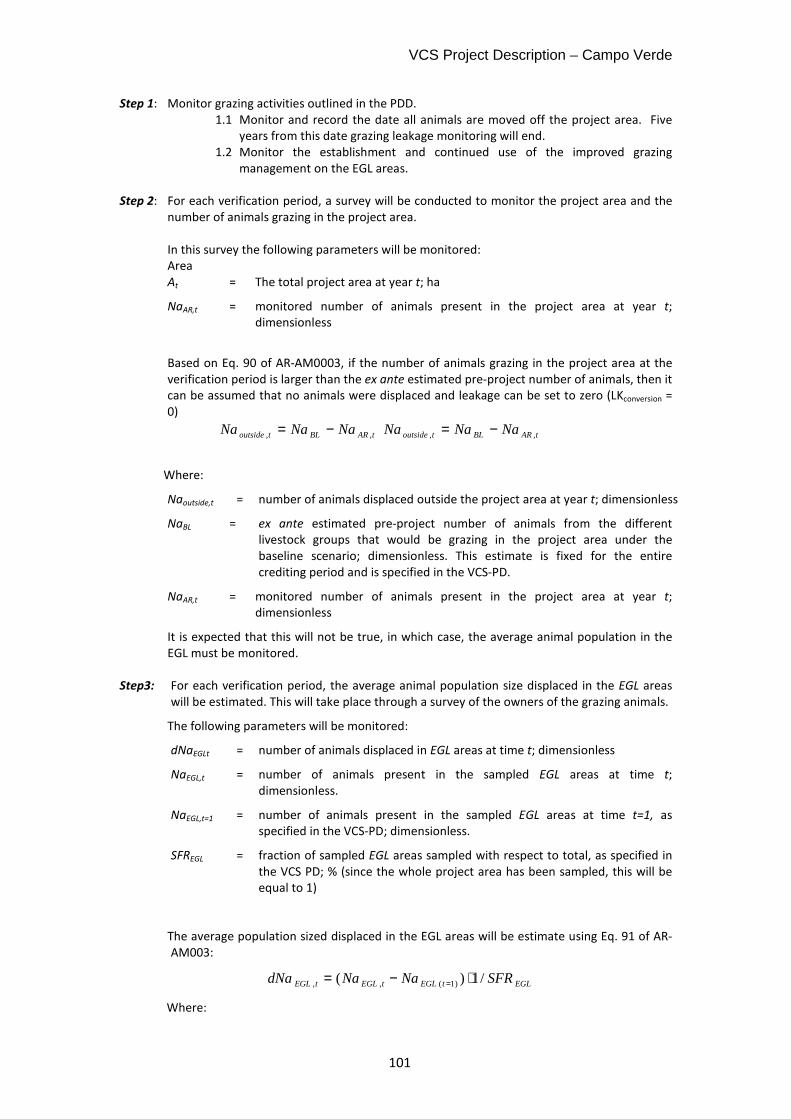
VCS Project Description – Campo Verde
101
Step 1: Monitor grazing activities outlined in the PDD. 1.1 Monitor and record the date all animals are moved off the project area. Five
years from this date grazing leakage monitoring will end. 1.2 Monitor the establishment and continued use of the improved grazing
management on the EGL areas.
Step 2: For each verification period, a survey will be conducted to monitor the project area and the number of animals grazing in the project area. In this survey the following parameters will be monitored: Area At = The total project area at year t; ha
NaAR,t = monitored number of animals present in the project area at year t; dimensionless
Based on Eq. 90 of AR-AM0003, if the number of animals grazing in the project area at the verification period is larger than the ex ante estimated pre-project number of animals, then it can be assumed that no animals were displaced and leakage can be set to zero (LKconversion = 0)
Where:
Naoutside,t = number of animals displaced outside the project area at year t; dimensionless
NaBL = ex ante estimated pre-project number of animals from the different livestock groups that would be grazing in the project area under the baseline scenario; dimensionless. This estimate is fixed for the entire crediting period and is specified in the VCS-PD.
NaAR,t = monitored number of animals present in the project area at year t; dimensionless
It is expected that this will not be true, in which case, the average animal population in the EGL must be monitored.
Step3: For each verification period, the average animal population size displaced in the EGL areas will be estimated. This will take place through a survey of the owners of the grazing animals.
The following parameters will be monitored:
dNaEGLt = number of animals displaced in EGL areas at time t; dimensionless
NaEGL,t = number of animals present in the sampled EGL areas at time t; dimensionless.
NaEGL,t=1 = number of animals present in the sampled EGL areas at time t=1, as specified in the VCS-PD; dimensionless.
SFREGL = fraction of sampled EGL areas sampled with respect to total, as specified in the VCS PD; % (since the whole project area has been sampled, this will be equal to 1)
The average population sized displaced in the EGL areas will be estimate using Eq. 91 of AR-AM003:
Where:
tARBLtoutside NaNaNa ,, −= tARBLtoutside NaNaNa ,, −=
EGLtEGLtEGLtEGL SFRNaNadNa /1)( )1(,, ⋅−= =
VCS Project Description – Campo Verde
102
dNaEGLt = number of animals displaced in EGL areas at time t; dimensionless
NaEGL,t = number of animals present in the sampled EGL areas at time t; dimensionless.
NaEGL,t=1 = number of animals present in the sampled EGL areas at time t=1, as specified in the VCS-PD; dimensionless.
SFREGL = fraction of sampled EGL areas sampled with respect to total, as specified in the VCS PD; % (since the whole project area has been sampled, this will be equal to 1)
If NaBL < (NaAR,t + dNaEGL,t) then, it can be assumed that the animal populations displaced due to the VCS-AR project activity have not occasioned leakage due to conversion of land to grazing land (LKconversion = 0) and no further monitoring step will be needed.
Because of the improved grazing management system being implemented in the EGL aras, it is expected that this will be true. If this is found to not be true, then the animal populations in NGL areas will need to be determined.
Step4: For each verification period, the average animal population size displaced to new grazing areas and unidentified grazing areas will be estimated.
A survey of these areas will be conducted and interviews with the animal owners conducted. The following parameters will be monitored in the survey:
dNaNGLt = number of animals displaced in NGL areas at time t; dimensionless
NaNGL,t = number of animals present in the sampled NGL areas at time t; dimensionless.
NaNGL,t=1 = number of animals present in the sampled NGL areas at time t=1, as specified in the VCS-PD; dimensionless.
SFRNGL = fraction of sampled NGL areas sampled with respect to total, as specified in the VCS-PD; % (since the whole project area has been sampled, this will be equal to 1)
dNaXGLt = number of animals displaced in XGL areas at time t; dimensionless
The average animal population size displaced to new grazing areas and unidentified grazing areas will then be estimated using Eq. 92 and 93 of AR-AM0003:
Where:
dNaNGLt = number of animals displaced in NGL areas at time t; dimensionless
NaNGL,t = number of animals present in the sampled NGL areas at time t; dimensionless.
NaNGL,t=1 = number of animals present in the sampled NGL areas at time t=1, as specified in the VCS-PD; dimensionless.
SFRNGL = fraction of sampled NGL areas sampled with respect to total, as specified in the VCS-PD; % (since the whole project area has been sampled, this will be equal to 1)
dNaXGLt = number of animals displaced in XGL areas at time t; dimensionless
NGLtNGLtNGLtNGL SFRNaNadNa /1)( 1,,, ⋅−= =
tNGLtEGLtARBLtXGL dNadNaNaNadNa ,,,, −−−=
VCS Project Description – Campo Verde
103
Step 5: The leakage due to displacement of grazing activities will then be estimated using Equ. 94-96 of AR-AM0003:
LKconversion = LKNGL + LKXGL
Where:
LKNGL = leakage due to conversion of non-grassland to grassland in NGL areas under the control of the animal owners; tonnes CO2-e
LKXGL = leakage due to conversion of non-grassland to grassland in unidentified XGL areas; tonnes CO2-e
LKNGL = leakage due to conversion of non-grassland to grassland in NGL areas; tonnes CO2-e
dNaNGLt = number of animals displaced in NGL areas at time t – as estimated in step 4; dimensionless
aLKNGL = average leakage due to conversion of non-grassland to grassland per displaced animal in NGL areas; tonnes CO2-e animal
-1
dNaXGLt = number of animals displaced in XGL areas at time t – as estimated in step 4; dimensionless
aLKXGL = average leakage due to conversion of non-grassland to grassland per displaced animal in XGL areas; tonnes CO2-e animal
-1
Because in the ex ante estimation, no leakage due to conversion was expected, the average leakage per animal due to conversion of NGL and XGL was not estimated and therefore must take place. Prior to the first verification period, this will be done based on the methods in AR-AM0003 V04.
The NGL areas will be stratified based on significant differences in carbon stocks. The mean carbon in the five carbon pools will be estimated for all NGL stratum and the for the XGL areas, the mean carbon stocks of mature forests will be estimated. It is expected that 2006 IPCC Guidelines for National Greenhouse Gas Inventories will be used to estimate the mean carbon stocks. Based on the methodology, the dead wood and litter pool in the mature forest will not need to be included as it is assumed to be minimal.
Through a survey of local practices of surrounding farmers or the literature, it will be determined what amount of the above-ground volume will be cut and sold as timber. If it is not possible to determine the amount of timber volume that will be removed, it will be assumed all the aboveground biomass will be burned. It is then assumed the remaining biomass will be burned. According to Eq. 39 of AR AM0003 V04,
Where:
NGLtNGLNGL aLKdNaLK ⋅= ,
XGLtXGLXGL aLKdNaLK ⋅= ,
( )∑=
−⋅+⋅=*
1,, )1(
t
tthturnNGLacBiomassBtacNGLtNGL WBECnglLK
NGLNGLNGL dNaLKaLK /=
VCS Project Description – Campo Verde
104
LKNGL = leakage due to conversion of non-grassland to grassland in NGL areas under the control of the animal owners; tonnes CO2-e
nglt = total area converted to grassland120
at time t; ha
CNGLac,t = mean carbon stock of the NGL area converted to grassland at time t; tonnes CO2-e
WBht = fraction of total above-ground biomass harvested as timber and as fuel-wood at time t (not burned); %
EacBiomassBurnNGL,t = total non-CO2 emissions from biomass burning in land converted to grazing land at time t (calculated from 100% of the above-ground biomass); tonnes CO2-e
aLKNGL = average leakage due to conversion of non-grassland to grassland per displaced animal in NGL areas; tonnes CO2-e animal
-1
LKNGL = leakage due to conversion of non-grassland to grassland in NGL areas under the control of the animal owners; tonnes CO2-e
dNaNGL = total number of animals to be displaced to NGL areas; dimensionless According to Eq. 41 and Eq 42 of AR AM0003 V04
Where:
LKXGL = leakage due to conversion of non-grassland to grassland in unidentified XGL areas; tonnes CO2-e
xglt = total unidentifiable area converted to grassland121
at time t; ha
CXGLac,t = mean carbon stock of the XGL area converted to grassland at time t; tonnes CO2-e
WBht = fraction of total above-ground biomass not-burned at time t (not burned); %
EacBiomassBurnXGL,t = total non-CO2 emissions from biomass burning in unidentifiable land converted to grazing land at time t (assuming 100% burning of above-ground biomass); tonnes CO2-e
aLKXGL = average leakage due to conversion of non-grassland to grassland per displaced animal in XGL areas; tonnes CO2-e animal
-1
LKXGL = leakage due to conversion of non-grassland to grassland in unidentified XGL areas; tonnes CO2-e
dNaXGL = total number of animals to be displaced to XGL areas; dimensionless
Non-CO2 emissions from biomass burning (EacBiomassBurnNGL,t) will be estimated using equation 24 in AR-AM0003.
120
It is possible that not all NGL areas will be converted to grazing land in the first project year; nglt shall be estimated as a proportion of the area annually afforested or reforested. The proportion shall be calculated as the ratio NGL relative to (EGL+NGL+XGL). 121
It is possible that not all XGL areas will be converted to grazing land in the first project year; nglt shall be estimated as a proportion of the area annually afforested or reforested. The proportion shall be calculated as the ratio XGL relative to (EGL+NGL+XGL).
( )∑=
−⋅+⋅=*
1,, )1(
t
thtturnXGLacBiomassBtXGLactXGL WBECxglLK
XGLXGLXGL dNaLKaLK /=
VCS Project Description – Campo Verde
105
10.4.1.2 Estimation of leakage due to displacement of fuel wood collection
Based on pre-project surveys, it was determined that no fuel wood collection took place inside the project area and therefore can be ignored.
10.5 Quality Assurance and Quality Control (QA/QC)
To ensure net anthropogenic GHG removals by sinks are to be measured and monitored precisely, credibly, verifiably, and transparently, a QA/QC procedure will be implemented and the use of these procedures monitored. Standard Operating Procedures have been established for all procedures such as: GIS analysis, field measurements, laboratory methods, data entry, data documentation, and data storage. Training courses will be held for all relevant personnel on all data collection and analysis procedures
122.
10.5.1 Verification of data:
10.5.1.1 Verification of GIS analysis
A minimum of 10% of sampling units will be randomly selected for re-measurement by an independent measurement team. Any errors found will be corrected and recorded. The level of errors recorded will be calculated using the below equation and reported:
10.5.1.2 Field data collection
To verify that plots have been installed and the measurements taken correctly: • A minimum of 10% of randomly selected plots will be re-measured by a supervisor with a
team not involved in the initial measurement sampling • A minimum of 10% of randomly selected plots will be re-measured by independent quality-
control team. • The re-measurement data will be compared with the original measurement data. Any errors
found will be corrected and recorded. The level of errors recorded will be calculated and reported using this equation:
10.5.1.3 Laboratory methodology
• A minimum of 10% of laboratory samples will be randomly selected for re-measurement by an independent, qualified measurement team.
• Any errors found will be corrected and recorded. The level of errors recorded will be calculated using the below equation and reported:
10.5.1.4 Data entry
To produce reliable carbon estimates the proper entry of data into the data analyses spreadsheets is required. All data sheets will include a ‘Data recorded by’ field. Communication between all personnel involved in measuring and analyzing data will be used to resolve any apparent anomalies before final analysis of the monitoring data can be completed. If there are any problems with the monitoring plot data that cannot be resolved, the plot will not be used in the analysis. Expert judgment and comparison with independent data will be used to ensure data results are inline with expectations. Additionally, field and laboratory data will be reviewed by an independent trained team further ensuring the data and analyze are realistic.
• A minimum of 10% of data entry records will be randomly selected for re-entry by a qualified team member and both sets of data compared with each other
• Incorporate checks in the programs used to analyze the data such as upper limits for dbh
122 AIDER. 2009. Procedimientos de aseguarmiento y control de calidad del monitoreo del Proyecto Campo Verde.
( )100x
2 Estimate
2 Estimate- 1 Estimate (%)t Error Measuremen =
( )100x
2 Estimate
2 Estimate- 1 Estimate (%)t Error Measuremen =
( )100x
2 Estimate
2 Estimate- 1 Estimate (%)t Error Measuremen =
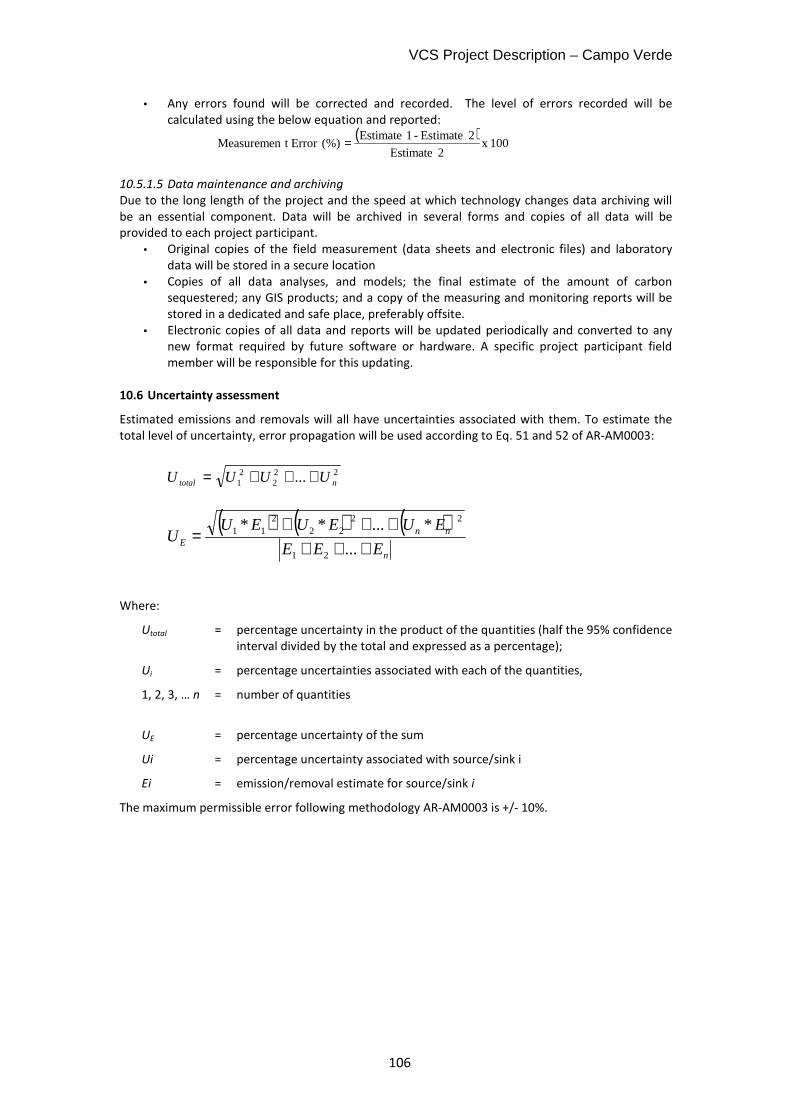
VCS Project Description – Campo Verde
106
• Any errors found will be corrected and recorded. The level of errors recorded will be calculated using the below equation and reported:
10.5.1.5 Data maintenance and archiving
Due to the long length of the project and the speed at which technology changes data archiving will be an essential component. Data will be archived in several forms and copies of all data will be provided to each project participant.
• Original copies of the field measurement (data sheets and electronic files) and laboratory data will be stored in a secure location
• Copies of all data analyses, and models; the final estimate of the amount of carbon sequestered; any GIS products; and a copy of the measuring and monitoring reports will be stored in a dedicated and safe place, preferably offsite.
• Electronic copies of all data and reports will be updated periodically and converted to any new format required by future software or hardware. A specific project participant field member will be responsible for this updating.
10.6 Uncertainty assessment
Estimated emissions and removals will all have uncertainties associated with them. To estimate the total level of uncertainty, error propagation will be used according to Eq. 51 and 52 of AR-AM0003:
Where:
Utotal = percentage uncertainty in the product of the quantities (half the 95% confidence interval divided by the total and expressed as a percentage);
Ui = percentage uncertainties associated with each of the quantities,
1, 2, 3, … n = number of quantities
UE = percentage uncertainty of the sum
Ui = percentage uncertainty associated with source/sink i
Ei = emission/removal estimate for source/sink i
The maximum permissible error following methodology AR-AM0003 is +/- 10%.
( )100x
2 Estimate
2 Estimate- 1 Estimate (%)t Error Measuremen =
222
21 ... ntotal UUUU +++=
) ) )(((n
nnE EEE
EUEUEUU
++++++
=...
*...**
21
2222
211